october 2014 - safer food, clearer choices | nsw food ... · facebook.com/nswfoodauthority...
TRANSCRIPT
facebook.com/nswfoodauthority twitter.com/nswfoodauthority www.foodauthority.nsw.gov.au
NSW/FA/FI212/1410
Soft serve & frozen yoghurt
October 2014
Soft serve and frozen yoghurt survey NSWFA/FI212/1410 2 of 26
Contents
Executive Summary ..................................................................................................... 3
Introduction .................................................................................................................. 4
Soft serve .................................................................................................................. 4
Frozen yoghurt .......................................................................................................... 4
Consumption data ..................................................................................................... 5
Previous studies ........................................................................................................ 5
Materials and Methods ................................................................................................. 7
Council participation .................................................................................................. 7
Pilot survey ................................................................................................................ 7
First round of sampling .............................................................................................. 7
Second round of sampling ......................................................................................... 7
Method for laboratory analysis .................................................................................. 7
Method for data analysis ........................................................................................... 8
Food handling questionnaire ..................................................................................... 9
Results ....................................................................................................................... 10
Microbiological results ............................................................................................. 10
Responses to food handling questionnaire ............................................................. 11
Follow-up actions .................................................................................................... 16
Discussion .................................................................................................................. 17
Conclusion ................................................................................................................. 18
Acknowledgement ...................................................................................................... 19
References ................................................................................................................. 20
Appendix 1. Selected surveys on the microbiological quality of soft serve in Australia and overseas ....................................................................................................... 22
Appendix 2. Food handling questionnaire for business that sell soft serve and/or frozen yoghurt ...................................................................................................... 24
Soft serve and frozen yoghurt survey NSWFA/FI212/1410 3 of 26
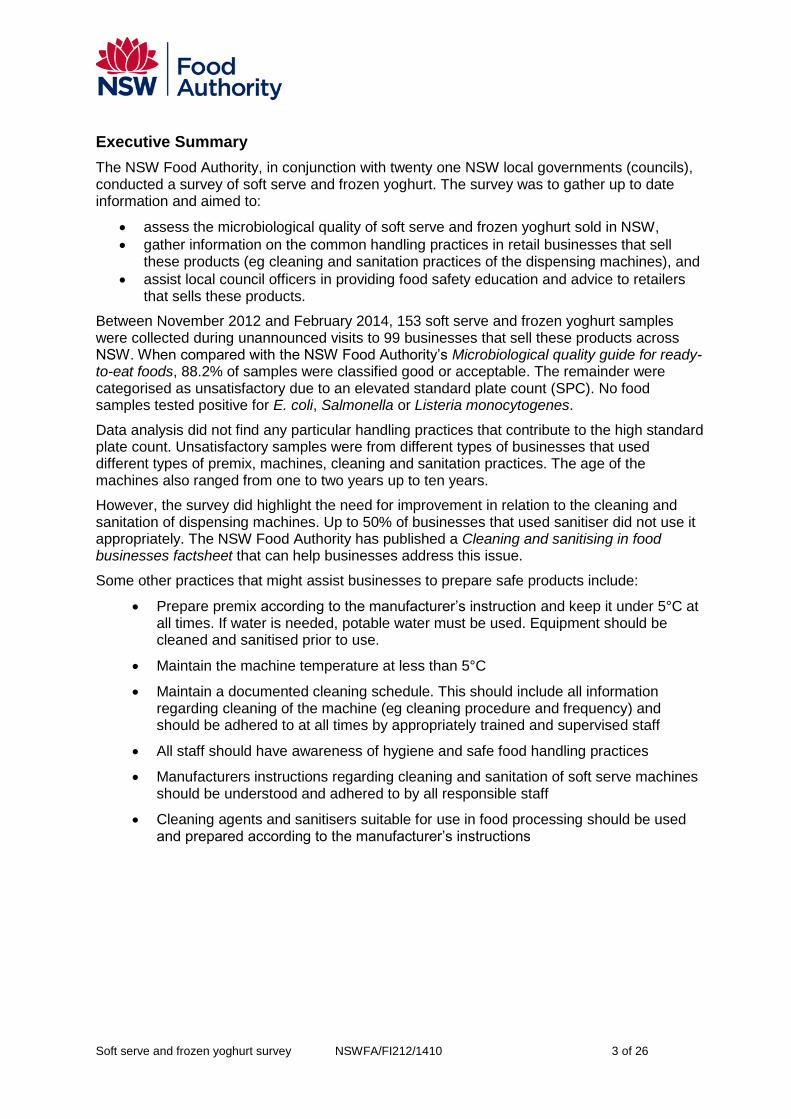
Executive Summary
The NSW Food Authority, in conjunction with twenty one NSW local governments (councils), conducted a survey of soft serve and frozen yoghurt. The survey was to gather up to date information and aimed to:
assess the microbiological quality of soft serve and frozen yoghurt sold in NSW,
gather information on the common handling practices in retail businesses that sell these products (eg cleaning and sanitation practices of the dispensing machines), and
assist local council officers in providing food safety education and advice to retailers that sells these products.
Between November 2012 and February 2014, 153 soft serve and frozen yoghurt samples were collected during unannounced visits to 99 businesses that sell these products across NSW. When compared with the NSW Food Authority’s Microbiological quality guide for ready-to-eat foods, 88.2% of samples were classified good or acceptable. The remainder were categorised as unsatisfactory due to an elevated standard plate count (SPC). No food samples tested positive for E. coli, Salmonella or Listeria monocytogenes.
Data analysis did not find any particular handling practices that contribute to the high standard plate count. Unsatisfactory samples were from different types of businesses that used different types of premix, machines, cleaning and sanitation practices. The age of the machines also ranged from one to two years up to ten years.
However, the survey did highlight the need for improvement in relation to the cleaning and sanitation of dispensing machines. Up to 50% of businesses that used sanitiser did not use it appropriately. The NSW Food Authority has published a Cleaning and sanitising in food businesses factsheet that can help businesses address this issue.
Some other practices that might assist businesses to prepare safe products include:
Prepare premix according to the manufacturer’s instruction and keep it under 5°C at all times. If water is needed, potable water must be used. Equipment should be cleaned and sanitised prior to use.
Maintain the machine temperature at less than 5°C
Maintain a documented cleaning schedule. This should include all information regarding cleaning of the machine (eg cleaning procedure and frequency) and should be adhered to at all times by appropriately trained and supervised staff
All staff should have awareness of hygiene and safe food handling practices
Manufacturers instructions regarding cleaning and sanitation of soft serve machines should be understood and adhered to by all responsible staff
Cleaning agents and sanitisers suitable for use in food processing should be used and prepared according to the manufacturer’s instructions
Soft serve and frozen yoghurt survey NSWFA/FI212/1410 4 of 26
Introduction
Soft serve
Soft serve is a congealed dairy product produced by freezing a heat-treated mixture of milk, cream, milk solids, sugars, stabilisers, emulsifiers and flavourings. Soft serve differs from hard ice cream in that the pre-mix is distributed in powdered or liquid form and the final product is formed at retail. Pre-mixed product is introduced to the storage chamber of the machine where it is kept at 3°C. When product is drawn from the draw valve, fresh mix combined with the targeted quantity of air is introduced to the freezing chamber either by gravity or pump. It is then churned and frozen quickly and stored until required (Arbuckle, 1986).
In NSW, under the NSW Food Regulation 2010, producers of dairy products, including manufacturers of ice cream and soft serve pre-mix are required to be licensed with the NSW Food Authority (the Food Authority). Retail businesses selling soft serve are inspected by local councils.
Frozen yoghurt
Frozen yoghurt is a type of frozen dessert, which consists of milk solids, sweetener, milk fat, yoghurt culture, stabilisers, flavourings, and colouring. Frozen yoghurt gets its unique flavour from strains of Lactobacillus bulgaricus and Streptococcus thermophilus, which makes up about 1% of the ingredients (Arbuckle, 1986; Marshall & Arbuckle, cited in Davidson et al., 2000). Frozen yoghurt can also be made in a soft serve machine in much the same way as soft serve (as mentioned above). Frozen yoghurt is also commonly used as an ingredient in smoothies and protein shakes.
Frozen yoghurt was first introduced in the 1970s. However, it was not until the 1980s that it gained popularity. Its popularity then suffered a decline in the late 1990s, but it has been making a comeback in the last decade, with a new generation of flavours, toppings and store settings. Consumer interest in frozen yoghurt stems from the perceived desirable nutritional properties attributed to the product such as a lower fat content compared to ice cream and the presence of probiotic bacteria which some consumers perceive to provide additional health benefits (Davidson et al., 2000). Table 1 highlights the difference in nutritional composition value between ice cream and frozen yoghurt.
Table 1. Nutritional composition of frozen dairy products per 100g
Products Energy (kJ) Total fat (g) Carbohydrate (g) Sugar (g)
Ice cream – vanilla1
806 10.5 20 14.2
Frozen yoghurt – plain2
400 – 600 0 – 2.5 20 – 26 20
1 From Dairy Australia (n.d. a) 2 From a number of frozen yoghurt companies’ nutrition information available on the web

Soft serve and frozen yoghurt survey NSWFA/FI212/1410 5 of 26
Consumption data
The Australian Health Survey3 (ABS, 2014) reported that frozen milk products were consumed by 15% of the people surveyed – 1.2% specifically mentioned frozen yoghurt or frozen dairy desserts other than ice cream. Taking into account a NSW population of 7.3 million in 2012 (ABS, 2012), it is estimated that about 88,000 people consumed these products per day. In this survey, the highest consumption of frozen milk products was reported for children aged 9 to 13 years old (26.7%), followed by children aged 4 to 8 years old (18.5%). In addition, 17% of persons 71 years old and over was reported to consume the products.
There is no available data on the volume of frozen yoghurt or soft serve consumed, however Dairy Australia (Dairy Australia, n.d. b) reported that Australia’s consumption of ice cream is relatively high by world standards - generally reported at 18 litres per head and third only to New Zealand and the United States.
Euromonitor (2014) also reported an 11.3% increase in volume of ice cream consumption in Australia from 2008 to 2013, and predicted a further 13% growth by 2018. Ice cream consumption is highly seasonal, with the majority sold in the warmer months of the year. Unfortunately, there does not appear to be published data regarding what proportion of this is soft serve.
Soft serve can be consumed either as is, or as an ingredient for thick shakes or milkshakes. It is commonly sold in retail places such as fast food outlets, independent retailers and mobile outlets/temporary events. There is no information on the number of places selling soft serve in NSW however, in September 2014 there were approximately 700 fast food retail outlets known to sell this product. IBIS World (2014) predicted that soft serve products will account for 17% of the industry revenue in 2014 – 15, valued to about $91 million (this value does not take into account revenue from major fast food chains).
Over the past few years, there has also been an increase in the number of specialty frozen yoghurt shops opened in NSW (IBIS World, 2014). Euromonitor (2014) reported a 13.4% increase in volume of frozen yoghurt consumption in Australia from 2008 to 2013, and predicted a further 11% growth by 2018. Similar trends are observed in the UK and USA (Euromonitor, 2013a and 2013b).
Previous studies
A total of nine surveys on the microbiological quality of soft serve or the dispensing machines have been reported in Australia and overseas from 1992 to 2008. L. monocytogenes was detected in two of the studies with prevalence of 0.8% and 0.9%. Furthermore, six of the studies found a high percentage of samples were microbiologically unsatisfactory due to high level of coliforms and/or standard plate count (Appendix 1).
In NSW, a total of 56 soft serve, ice cream/gelato, shakes and frozen yoghurt samples were tested by the NSW Health Food Branch from 1995 to 1999. Six samples (10.7%) were unsatisfactory due to high standard plate count, ranged from 160,000 to 2,500,000 cfu/ml. Eight samples were tested for L. monocytogenes and all tested negative (NSW Food Authority, internal database).
3 The survey was conducted in 2011 – 2013. It involved the collection of detailed physical activity
information using self-reported and pedometer collection methods, along with detailed information of
dietary intake and foods consumed from over 12,000 participants across Australia. Frozen milk
products included ice cream, thick shakes, frozen yoghurt, and other frozen dairy dessert.
Soft serve and frozen yoghurt survey NSWFA/FI212/1410 6 of 26
FSANZ’s Risk Profile of Dairy Products in Australia categorised ice cream as intermediate risk if stored frozen, but soft serve may allow growth of L. monocytogenes. This means that maintenance of temperature control through the supply chain is critical to ensure that they remain safe and suitable (FSANZ, 2006). When data from FDA/USDA (2003) was adapted to the Australian population, the estimated cases of listeriosis for vulnerable populations due to consumption of ice cream/frozen dairy products is less than 0.01 case per annum (NSW Food Authority, 2009b).
There is anecdotal evidence that recent improvements in the design of dispensing machines and the inclusion of self-pasteurising machines means that microbiological quality of these products may have improved. However, poorly cleaned and sanitised dispensing machines may compromise the microbiological quality of soft serve and pose a risk to consumers.
In 2010, an outbreak affecting six people (three adults and three children) was linked to Staphylococcus aureus and its enterotoxin in milkshakes and thick shakes made using soft serve from the same food outlet on a single day. An investigation carried out by Environmental Health Officers (EHOs) found that the soft serve dispensing machine had failed to undergo its automatic heat sterilisation process and there had been inadequate cleaning and disinfection of the internal parts of the machine after it was repaired. Staphylococcus aureus (102 to 103
cfu/g) and Staphylococcus enterotoxin were detected in soft serve samples taken from the machine. The organism was also detected in a mixing bucket that was used for preparing the premix before being added into the machine and this was considered to have been the likely source of the contamination (OzFoodNet Working Group, 2011).
To gather up to date information the Food Authority, in conjunction with NSW local councils has conducted a survey of soft serve and frozen yoghurt. The aims of the survey were to:
assess the microbiological quality of soft serve and frozen yoghurt sold in NSW,
gather information on the common handling practices in retail businesses that sell these products (eg cleaning and sanitation practices of the dispensing machines), and
assist the local council officers in providing food safety education and advice to retailers that sell these products.
Soft serve and frozen yoghurt survey NSWFA/FI212/1410 7 of 26
Materials and Methods
Council participation
In October 2012, invitations were sent to all local councils in NSW to take part in the survey. Participation from local councils involved collecting food samples as well as gathering information on the food handling practices at businesses selling soft serve and/or frozen yoghurt. In addition, the interested councils were asked to provide the number of businesses selling those products in their local government area (LGA).
Pilot survey
In November 2012, a pilot survey was carried out by officers from the Food Authority. Samples were collected from businesses located in LGAs that did not participate in the survey. The aim of the pilot survey was to gauge the types of premises that sell these products. A total of 28 samples were collected from fourteen businesses in five LGAs.
First round of sampling
A total of twenty local councils agreed to take part in the survey. All of the councils provided information on the number of businesses selling soft serve and/or frozen yoghurt in their LGA. A total of 314 shops were recorded and 76 shops were randomly sampled, representing approximately 25% of the total shops in those areas. Businesses surveyed included fast food chains, independent stores, mobile vendors and temporary event stalls. Sampling was done from January to June 2013.
Second round of sampling
Due to the limited number of mobile vendors or temporary event stalls surveyed in the first round, local councils were invited to participate in a second round of the sampling in December 2013, focusing on these types of businesses. Three local councils agreed to participate (two of them also took part in the first round of sampling). Sampling was conducted in January and February 2014 by the Food Authority and local council officers. A total of nine mobile vendors were surveyed.
As information was not available on volume of throughput for each business surveyed or the total number of businesses of this type in NSW, the survey provides only a snapshot of practices at the participating businesses rather than a statistical representation of the sector.
Method for laboratory analysis
From November 2012 to February 2014, 1534 soft serve and frozen yoghurt samples were collected during unannounced visits to 99 businesses that sell these products across NSW.
Samples were collected aseptically from the soft serve or frozen yoghurt machine nozzle and dispensed into sterile containers. One sample was collected per nozzle, which gave a minimum sample of one per business. The maximum number of samples collected from each business was four.
4 Total number of samples included those collected in the pilot survey.
Soft serve and frozen yoghurt survey NSWFA/FI212/1410 8 of 26
Samples were sent by courier or delivered in person to the Food Microbiology Laboratory of the NSW Forensic & Analytical Science Services (NSW FASS) at Lidcombe. The temperature of samples upon arrival was recorded. When samples arrived outside the temperature control (greater than 5°C), samples were not tested for standard plate count (SPC) because of the potential for numbers to be influenced by elevated temperatures. Frozen yoghurt samples were not tested for SPC since the test could not differentiate between the starter culture organisms added to these products and other bacteria.
All samples were analysed within 24 hours of receipt at the laboratory using the appropriate Australian Standard method as detailed in Table 2. Samples collected on the weekend or from regional areas were kept frozen until dispatch to ensure the microbiological integrity of the samples.
Table 2. Tests conducted and their corresponding Australian Standard
Tests AS method
Coagulase positive staphylococcus (CPS) enumeration
AS 1766.2.4
Listeria monocytogenes enumeration
AS 5013.24.2
Listeria monocytogenes detection AS 1766.16.1
Salmonella detection AS 1766.2.5
Standard plate count (SPC) AS 1766.2.1
Thermotolerant coliforms and E. coli enumeration
AS 1766.2.3
Method for data analysis
The microbiological results of soft serve and frozen yoghurt samples obtained from this survey were assessed against the NSW Food Authority’s Microbiological quality guide for ready-to-eat foods (NSW Food Authority, 2009) as specified in Table 3.
Table 3. Guideline levels for determining the microbiological quality of ready-to-eat foods (NSW Food Authority, 2009a)
Test
Microbiological result (cfu/g)
Good Acceptable Unsatisfactory Potentially hazardous
Standard Plate Count (SPC)
(Category A5)
<104 <105 ≥105 N/A
Enterobacteriaceae6 <102 102 to <104 ≥104 N/A
5 Category A applies to ready-to-eat foods in which all components are fully cooked for immediate sale
or consumption.

Soft serve and frozen yoghurt survey NSWFA/FI212/1410 9 of 26
E. coli <3 3 to 102 >102 N/A
Coagulase positive staphylococci
<102 102 to <103 103 to <104 ≥104
Salmonella Not detected in 25g
Detected in 25g
Listeria monocytogenes
(Food Group 27)
Not detected in 25g
Detected but <100
≥102
All results were entered into a Microsoft™ Excel 2010 spread sheet. Where enumeration was conducted, microbiological counts were transformed into log cfu/g. Viable count methods are often considered to have an accuracy of approximately ± 0.5 log cycles therefore generally differences of less than 0.5 log were not considered biologically significant (Jarvis, 1989).
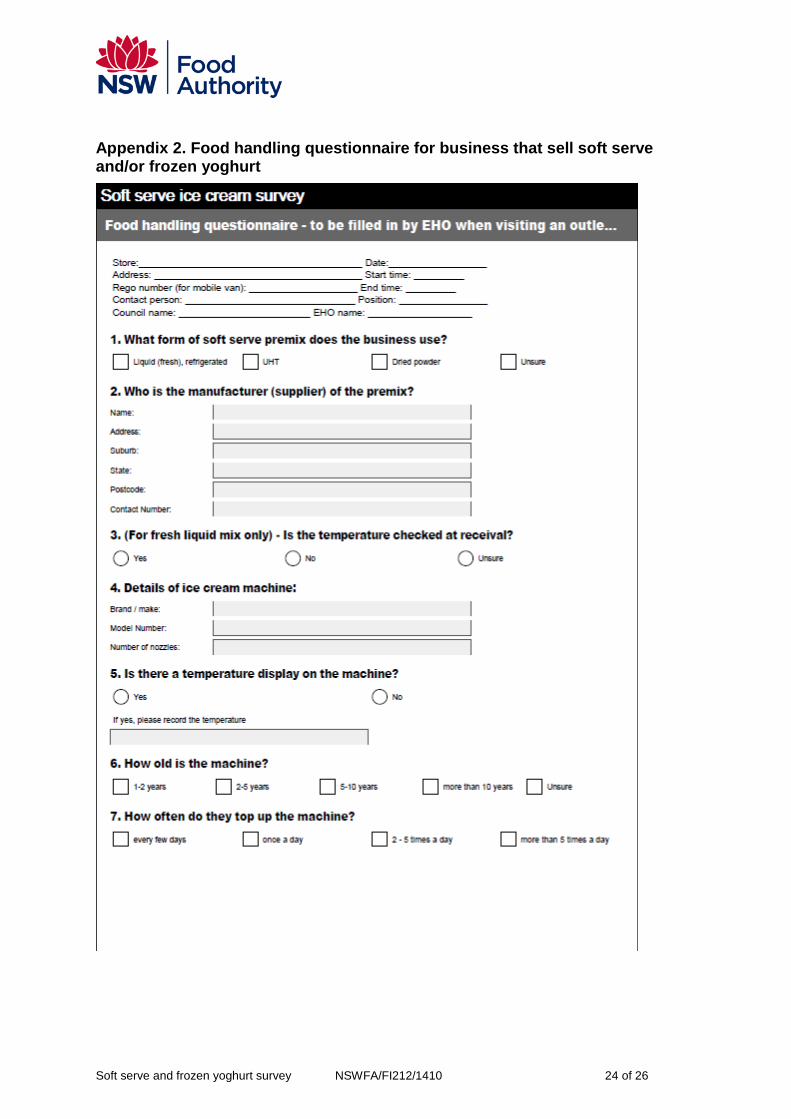
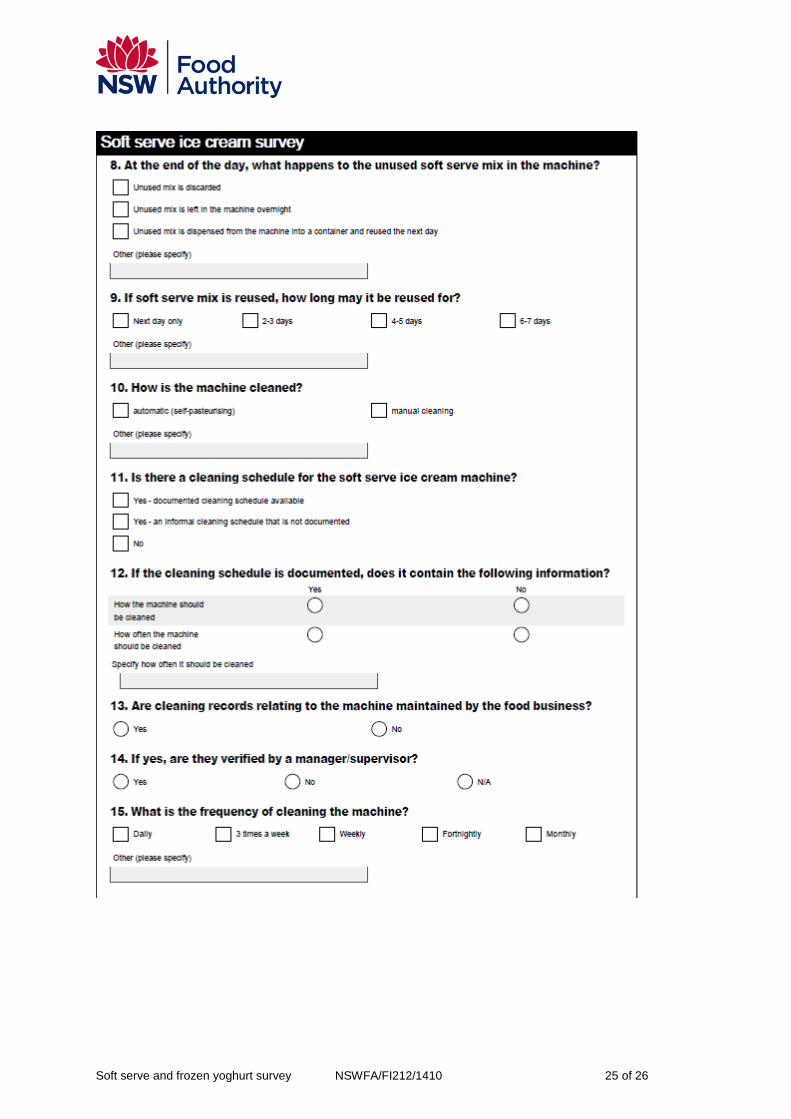
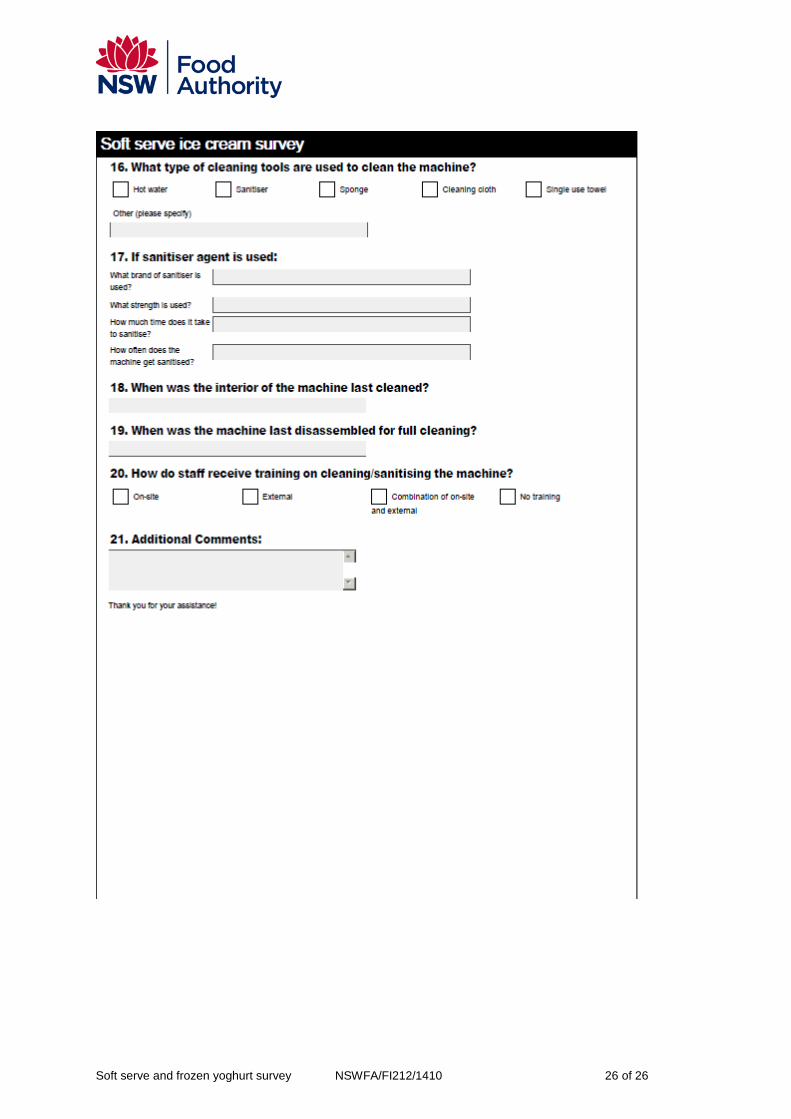
Food handling questionnaire
At the time of sampling, a questionnaire was also undertaken to assess food handling practices at businesses that sell these products (see Appendix 2 – Food handling questionnaire for businesses selling soft serve or frozen yoghurt).
A completed questionnaire was received from 98 businesses8. The questionnaire collected information on type of premix, type of machine, and cleaning and sanitation practices of the machine.
The survey responses were collated and a summary of results was generated by SurveyMonkey™. Statistical analysis on the responses was conducted using Microsoft™ Office Excel 2010.
6 In the absence of a guideline for thermotolerant coliform results, these were compared with the
guideline for Enterobacteriaceae as both groups of bacteria are similar (the bacteria detected by the
coliform test are members of several genera within the family Enterobacteriaceae). 7 Food Group 2 applies to ready-to-eat food that will not support the growth of L. monocytogenes and
has been stored prepared for greater than one day (eg the premix). 8 Food handling data was not collected from two of the businesses where sampling occurred. On the
other hand, one business provided their food handling information, but no sample was collected since
the machine was not operational at the time of the survey.

Soft serve and frozen yoghurt survey NSWFA/FI212/1410 10 of 26
Results
Microbiological results
A summary of the microbiological results for all samples is shown in Table 4. When compared with the NSW Food Authority’s Microbiological quality guide for ready-to-eat foods, 88.2% of samples were classified good or acceptable. No sample tested positive for E. coli, Salmonella or L. monocytogenes.
A total of eighteen samples were categorised as unsatisfactory due to an elevated SPC. The unsatisfactory samples came from fifteen businesses around NSW - two fast food chains, six independent stores, and seven mobile vendors/temporary event stalls.
Table 4. Assessment of results using the microbiological criteria for ready-to-eat foods (NSW Food Authority, 2009a)
Food category No. of samples
Microbiological quality (%)
Good Acceptable Unsatisfactory Potentially hazardous
Frozen yoghurt 42 42 (100%) - - -
Soft serve9 111 80 (72%) 13 (12%) 18 (16%) -
Frequency distribution for SPC for soft serve samples9 is presented in Figure 1. The graph shows that
the majority of samples had a low SPC or a SPC under the limit of detection (<3 log cfu/g)10
.
Figure 1. Frequency distribution for standard plate count in soft serve samples
9 Only 78 samples were tested for SPC. 10 Samples with SPC ≥10
5 were categorised as unsatisfactory.
50%
12% 15%
13% 10%
0%
20%
40%
60%
80%
100%
<3 3 4 5 >6
pro
po
rtio
n o
f sa
mp
les
log cfu/g
Soft serve and frozen yoghurt survey NSWFA/FI212/1410 11 of 26
Responses to food handling questionnaire
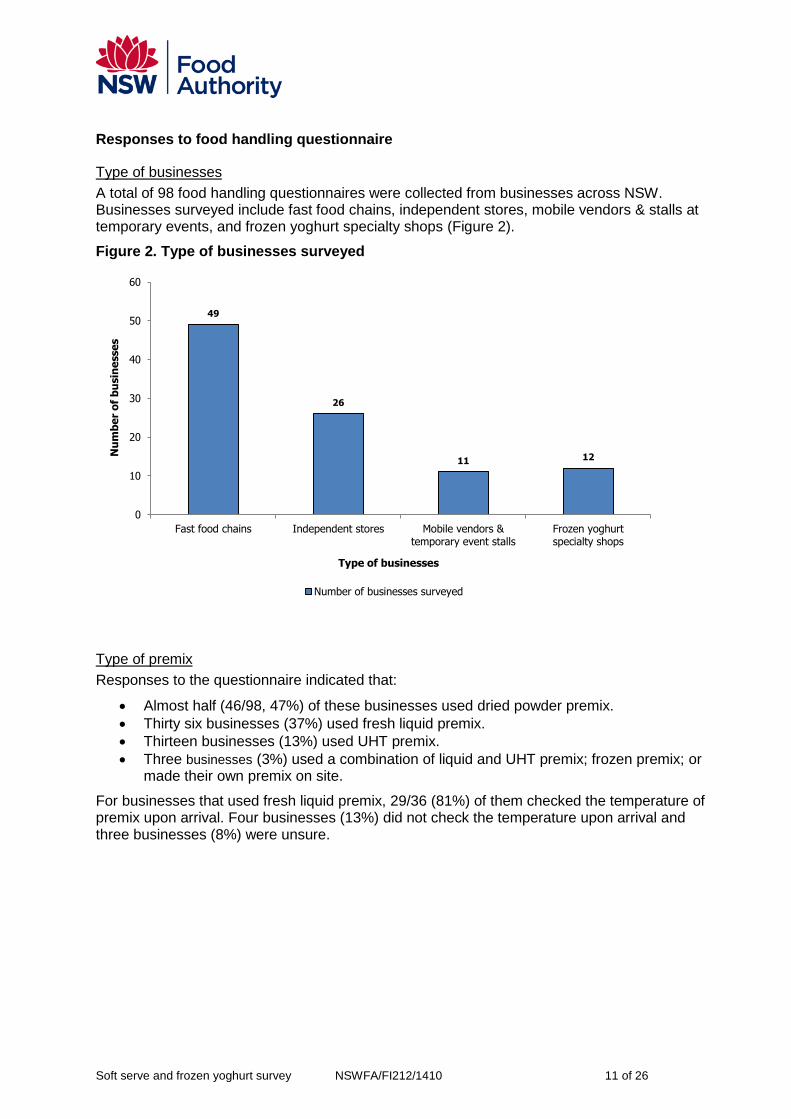
Type of businesses
A total of 98 food handling questionnaires were collected from businesses across NSW. Businesses surveyed include fast food chains, independent stores, mobile vendors & stalls at temporary events, and frozen yoghurt specialty shops (Figure 2).
Figure 2. Type of businesses surveyed
Type of premix
Responses to the questionnaire indicated that:
Almost half (46/98, 47%) of these businesses used dried powder premix.
Thirty six businesses (37%) used fresh liquid premix.
Thirteen businesses (13%) used UHT premix.
Three businesses (3%) used a combination of liquid and UHT premix; frozen premix; or made their own premix on site.
For businesses that used fresh liquid premix, 29/36 (81%) of them checked the temperature of premix upon arrival. Four businesses (13%) did not check the temperature upon arrival and three businesses (8%) were unsure.
49
26
11 12
0
10
20
30
40
50
60
Fast food chains Independent stores Mobile vendors &temporary event stalls
Frozen yoghurtspecialty shops
Nu
mb
er
of
bu
sin
esse
s
Type of businesses
Number of businesses surveyed

Soft serve and frozen yoghurt survey NSWFA/FI212/1410 12 of 26
Soft serve machine
During the survey, the temperature of 70 machines at 54 businesses was recorded. Most of them (68/70, 97%) were at 5°C or lower (Figure 3). The other two machines were at 5.8°C and 12°C. Those businesses were asked to get the machines checked, and they were under temperature control (below 5°C) at the re-inspection.
Figure 3. Temperature displayed on the machine
In addition, businesses were also asked about the age of their machines. One-third of the businesses (32/98, 33%) had machines that were only one to two years old (Figure 4).
Figure 4. Age of machines surveyed
3
1
8
27
20
5 4
2
0
5
10
15
20
25
30
less than 0°C between 0and 1°C
between 1and 2°C
between 2and 3°C
between 3and 4°C
between 4and 5°C
at 5°C more than5°C
Nu
mb
er
of
ma
ch
ine
Temperature at display
32
21
16
11
18
0
5
10
15
20
25
30
35
1-2 years 2-5 years 5-10 years more than 10 years unsure
Nu
mb
er
of
ma
ch
ine
s
Age of the machines

Soft serve and frozen yoghurt survey NSWFA/FI212/1410 13 of 26
Handling practices with soft serve premix
The businesses were asked about how often they top up the premix11:
The majority of respondents (45/88, 52%) topped up two to five times a day.
Twenty-four businesses (27%) topped up once a day.
Ten businesses (11%) topped up more than five times a day.
Nine businesses (10%) topped up every few days.
The questionnaire also revealed that the majority of businesses (77/97, 80%) left unused premix in the machine overnight. Fifteen businesses (15%) discarded unused premix at the end of the trading day. Only five businesses (5%) dispensed unused premix into a container, stored in refrigerator and reused the next day.
Cleaning and sanitation practices of the machine
In terms of cleaning practices:
The majority (70/98, 71%) cleaned their machines manually.
Thirteen businesses (13%) used self-pasteurising machines.
Fifteen businesses (16%) used self-pasteurising machines that clean automatically at the end of trading days, but still do manual cleaning fortnightly.
Half of the businesses surveyed (47/97, 48%) had documented cleaning procedures which specified how the machine should be cleaned and the frequency of the cleaning. Of these 47 businesses, 38 (81%) of them maintained cleaning records relating to their machines and were verified by the manager or supervisor. A further five businesses (5%) did not have documented cleaning procedures, but they maintained cleaning records.
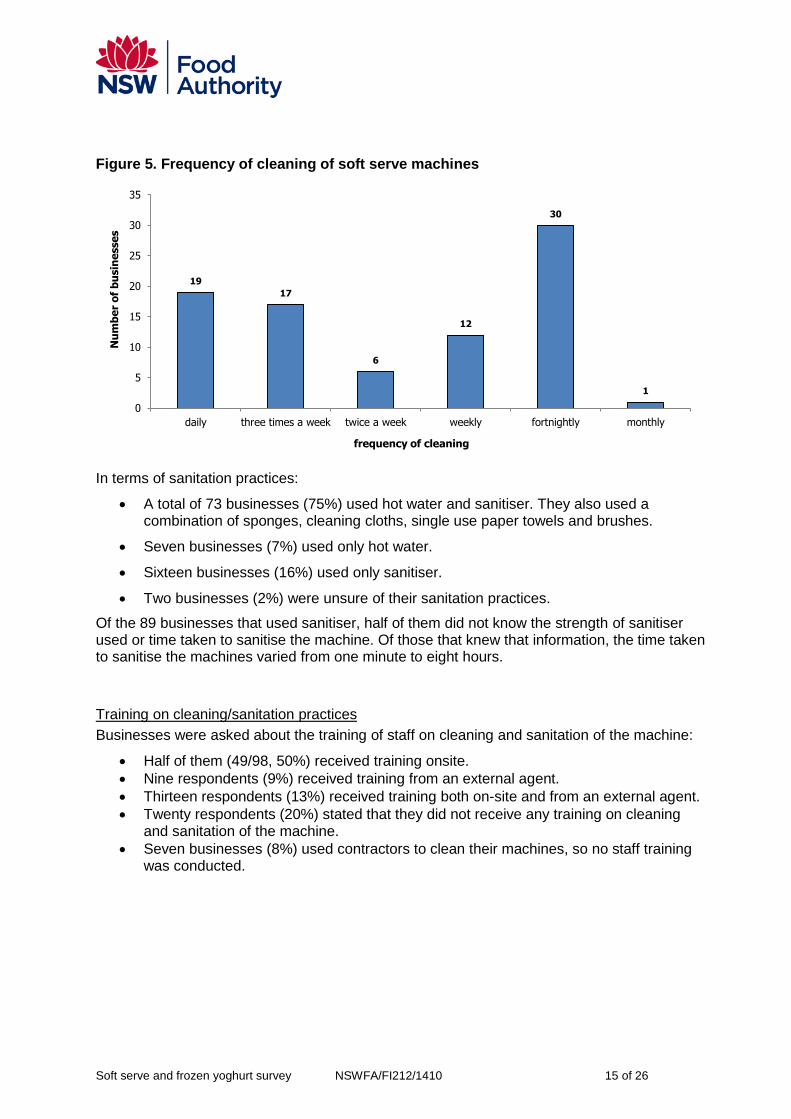
The frequency of machine cleaning varied between businesses, from daily to monthly. The majority of respondents (30/98, 31%) stated that their machines were cleaned fortnightly (
11 Only 88 businesses responded to this question

Soft serve and frozen yoghurt survey NSWFA/FI212/1410 14 of 26
Figure 5). In addition, eleven businesses cleaned their machines using a combination of daily cleaning followed by machines being disassembled for thorough cleaning fortnightly, which was normally done by contractors. Two mobile businesses stated that their machines were cleaned at the end of each day they were operating.
Soft serve and frozen yoghurt survey NSWFA/FI212/1410 15 of 26
Figure 5. Frequency of cleaning of soft serve machines
In terms of sanitation practices:
A total of 73 businesses (75%) used hot water and sanitiser. They also used a combination of sponges, cleaning cloths, single use paper towels and brushes.
Seven businesses (7%) used only hot water.
Sixteen businesses (16%) used only sanitiser.
Two businesses (2%) were unsure of their sanitation practices.
Of the 89 businesses that used sanitiser, half of them did not know the strength of sanitiser used or time taken to sanitise the machine. Of those that knew that information, the time taken to sanitise the machines varied from one minute to eight hours.
Training on cleaning/sanitation practices
Businesses were asked about the training of staff on cleaning and sanitation of the machine:
Half of them (49/98, 50%) received training onsite.
Nine respondents (9%) received training from an external agent.
Thirteen respondents (13%) received training both on-site and from an external agent.
Twenty respondents (20%) stated that they did not receive any training on cleaning and sanitation of the machine.
Seven businesses (8%) used contractors to clean their machines, so no staff training was conducted.
19
17
6
12
30
1
0
5
10
15
20
25
30
35
daily three times a week twice a week weekly fortnightly monthly
Nu
mb
er
of
bu
sin
esse
s
frequency of cleaning
Soft serve and frozen yoghurt survey NSWFA/FI212/1410 16 of 26
Follow-up actions
When samples were found to be unsatisfactory, in accordance with the risk management strategy agreed prior to the commencement of the survey, additional samples were collected from the business. Follow-up samples taken from each business included: three samples of soft serve taken directly from the dispensing nozzle, and three samples of pre-mix from the holding tank of the machine. Follow-up samples were collected from nine of the fifteen businesses with unsatisfactory samples obtained during the survey. Follow-up actions on the majority of mobile vendors were not possible due to the seasonal and nomadic nature of the businesses.
If samples collected during the follow-up visit were found to be good or acceptable, no further action was taken. If the follow-up samples returned an unsatisfactory result, the business was inspected by an EHO and/or a Food Authority officer to determine whether food handling controls and hygiene practices were adequate. A total of four businesses needed to be inspected during the course of the survey. The common issues found across these businesses were the absence of cleaning procedures and inappropriate use of sanitiser. Businesses were provided with advice on proper food handling practices and cleaning procedures and were given a month to rectify the issue, after which more samples were collected. Samples collected after inspections were satisfactory for three businesses. The other business still had unsatisfactory results due to high level of SPC. The EHO continued to work with this business until the issue was resolved.
Soft serve and frozen yoghurt survey NSWFA/FI212/1410 17 of 26
Discussion
The results from the microbiological testing illustrated that soft serve and frozen yoghurt sold in NSW was of a good or acceptable microbiological standard, with 88.2% of tested samples being categorised as such. In addition, E. coli, Salmonella and L. monocytogenes were not detected in any of the samples.
The unsatisfactory soft serve samples had an elevated SPC ranging from log 5.1 cfu/g to log 7.6 cfu/g. The percentage of samples with elevated SPC in this survey was less than that observed in the various UK and Irish studies, which found between 35% and 51% of samples were unsatisfactory12 due to high SPC (FSAI, 2001; FSAI, 2008; Little & de Louvois, 1997).
Data analysis did not find any particular handling practices that contributed to the high SPC. Different types of businesses had unsatisfactory samples. They used different types of premix, machines, cleaning and sanitation practices. The age of the machines that produced unsatisfactory results ranged from one to two years up to ten years.
Previous studies suggested that high SPC in soft serve may indicate that there has been a breakdown in hygienic practices at some point between manufacture and sale (FSAI, 2001; Little & de Louvois, 1997).
Little and de Louvois (1997) stated that inadequate temperature control of pasteurised and opened containers of prepared premix would allow any bacteria present to increase to high levels. The Irish study (FSAI, 2001) found that as the temperature reading on the machine temperature monitor increased, so did the SPC. The relationship between machine temperature and high SPC was not observed in this study. Six of the fifteen businesses with unsatisfactory samples had temperature display on their machines and they were all at 5°C or below.
Another Irish study found that the type of machine had a significant effect on the SPC levels in the soft serve (FSAI, 2008). Better results were obtained from self-pasteurising machines. However, in our study, the influence of type of machine and SPC results were not found to be significant. Two of eight (25%) samples collected from self-pasteurising machines were unsatisfactory, whereas fourteen of 50 (28%) samples collected from manually cleaned machines were unsatisfactory. The rest of the businesses used a combination of self-pasteurising machines and manual cleaning.
A few studies indicated that a lack of awareness of cleanliness and sanitation procedures by staff and food handlers and/or difficulty in cleaning and sanitising the dispensing machines may contribute to high SPC (FSAI, 2001; SA Health, 2009). This area may be the contributing factor to unsatisfactory samples in this study. Only two of the businesses with unsatisfactory samples had a documented cleaning schedule and cleaning records. Both of them used manual cleaning. One business cleaned the machine twice a week and the other was once a week. In addition, thirteen of the fourteen businesses stated that they used sanitiser, but most of them were not sure about the strength of sanitiser used. The time taken to sanitise their machines also ranged from one minute to three hours. An increased level of staff training and knowledge transfer, particularly in relation to food safety, food handling and soft serve machine maintenance and cleaning would improve the situation (FSAI, 2001; FSAI, 2008).
12 In the UK and Irish studies, samples with SPC greater than 105 cfu/g were considered unsatisfactory.
The same limit was used in the NSWFA’s guidelines.

Soft serve and frozen yoghurt survey NSWFA/FI212/1410 18 of 26
Conclusion
The microbiological testing illustrated that soft serve and frozen yoghurt sold in NSW at the time of the survey was, in general, of a good or acceptable microbiological standard. 88% of samples tested were categorised as good or acceptable and E. coli, Salmonella and L. monocytogenes was not detected in any of the samples.
However, the survey did highlight the need for improvement in relation to cleaning and sanitation of soft serve dispensing machines. Up to 50% of businesses that used a sanitiser did not use it appropriately. The NSW Food Authority has published a Cleaning and sanitising in food businesses factsheet that can help businesses selling these products address the issue.
Other practices that might help businesses ensure that their products are safe for consumption include:
Prepare premix according to the manufacturer’s instruction and keep it under 5°C at all times. If water is needed, potable water must be used. Equipment should be cleaned and sanitised prior to use
Maintain the machine temperature at less than 5°C
Maintain a documented cleaning schedule. This should include all information regarding cleaning of the machine (eg cleaning procedure and cleaning frequency) and should be adhered to at all times by appropriately trained and supervised staff
All staff should have awareness of hygiene and safe food handling practices
Manufacturers instructions regarding cleaning and sanitation of soft serve machines should be understood and adhered to by all responsible staff
Cleaning agents and sanitisers suitable for food processing environment should be used and prepared appropriately according to the manufacturer’s instructions
Soft serve and frozen yoghurt survey NSWFA/FI212/1410 19 of 26
Acknowledgement
The NSW Food Authority acknowledges the assistance of EHOs from the following councils who participated in this survey:
Albury City Council
Armidale Dumaresq Council
Auburn City Council
Ballina Shire Council
Bathurst Regional Council
Blacktown City Council
Campbelltown City Council
Coffs Harbour City Council
Council of the City of Sydney
Fairfield City Council
Great Lakes Council
Greater Taree City Council
Kogarah City Council
Holroyd City Council
Newcastle City Council
North Sydney Council
Randwick City Council
Singleton Council
Snowy River Shire Council
Strathfield Municipal Council
Sutherland Shire Council
Wagga Wagga City Council
Warringah Council
Wollongong City Council

Soft serve and frozen yoghurt survey NSWFA/FI212/1410 20 of 26
References
Australian Bureau of Statistics (ABS). (2012). 3101.0 - Australian demographic statistics, Jun 2012. Retrieved 16 October 2014 from http://www.abs.gov.au/AUSSTATS/[email protected]/allprimarymainfeatures/33970B13F1DF7F56CA257B3B00117AA2?opendocument
Australian Bureau of Statistics (ABS). (2014). 4364.0.55.007 – Australian Health Survey: Nutrition first results – food and nutrients, 2011-12.
Arbuckle, W. S. (1986). Ice Cream. Van Nostrand Reinhold. New York
IBIS World. (2014). IBISWorld Industry Report OD4024 – Ice cream stores in Australia.
Dairy Australia. (n.d.a). Ice cream - nutritional information. Retrieved 12 November 2013 from http://www.dairyaustralia.com.au/Dairy-food-and-recipes/Dairy-Products/Ice-Cream.aspx
Dairy Australia. (n.d.b). Fresh products. Retrieved 17 September 2014 from http://www.dairyaustralia.com.au/Markets-and-statistics/Production-and-sales/Fresh-Products.aspx
Davidson, R.H., Duncan, S.E., Hackney, C.R., Eigel, W.N. & Boling, J.W. (2000). Probiotic culture survival and implications in fermented frozen yogurt characteristics. Journal of Dairy Science, 83, 666 – 673
Euromonitor International. (2014). Ice cream in Australia.
Euromonitor International. (2013a). Ice cream in the United Kingdom.
Euromonitor International. (2013b). Ice cream in the US.
FSAI. (2001). 3rd Quarter national survey 2001 (NS3) Soft ice cream. Retrieved 23 January 2012 from http://www.fsai.ie/uploadedFiles/Monitoring_and_Enforcement/Monitoring/Surveillance/3rdQuarter.pdf.
FSAI. (2008). 2nd National Microbiological Survey 2008 (08NS2) Microbiological quality of whipped and scoop ice-cream. Retrieved 23 January 2012 from http://www.fsai.ie/uploadedFiles/Monitoring_and_Enforcement/Monitoring/Surveillance/ice_cream_whipped_scoop.pdf.
FSAI. (2011). Safe handling and serving of soft ice-cream. Retrieved 23 January 2012 from http://www.fsai.ie/WorkArea/DownloadAsset.aspx?id=10945.
FSANZ [Food Standards Australia New Zealand] (2006). A Risk Profile of Dairy products in Australia. Food Standards Australia New Zealand Report.
Health Department of Western Australia. (1992). Microbiological quality of soft serve and ice cream in Western Australia. Perth: Health Department of Western Australia
Jarvis, B. (1989). Statistical Aspects of the Microbiological Analysis of Foods. Elsevier, Amsterdam.

Soft serve and frozen yoghurt survey NSWFA/FI212/1410 21 of 26
Krogstad, J. M. (2006, 8/10/2006). Businesses fail soft serve inspections. Waterloo-Cedar Falls Courier, Iowa Knight Ridder Tribune. Retrieved 4 June 2013 from http://www.extension.iastate.edu/foodsafety/news/fsnews.cfm?newsid=14016
Little, C., & de Louvois, J. (1997). Microbiological examination of baked egg custard tarts, soft ice-creams and cold mixes LACOTS/PHLS Co-ordinated food liaison group surveys. PHLS Environmental Surveillance Unit, London.
Little, C. L., & De Louvois, J. (1999). The microbiological quality of soft ice-cream from fixed premises and mobile vendors. International Journal of Environmental Health Research, 9(3), 223-232.
NSW Food Authority. (2009a). Microbiological quality guide for ready-to-eat foods. Retrieved 7 November 2013 from http://www.foodauthority.nsw.gov.au/_Documents/science/microbiological_quality_guide_for_RTE_food.pdf
NSW Food Authority. (2009b). Food safety risk assessment of NSW Food Safety Scheme. Retrieved 16 October 2014 from http://www.foodauthority.nsw.gov.au/_Documents/science/Food_Safety_Scheme_Risk_Assessment.pdf
OzFoodNet Working Group. (2011). OzFoodNet quarterly report, 1 October to 31 December 2010. Communicable Disease Intelligence, 35(1), 29-37.
Powell, D. (2008). Is free soft-serve ice cream for pregnant women a good idea? Retrieved from http://barfblog.foodsafety.ksu.edu/barfblog/tag/soft-serve-ice-cream
SA Health. (2009). Food Act Report Year ending 30 June 2008. Appendix 3 Food safety survey report. Survey of soft serve ice cream. Retrieved 5 June 2012 from http://www.health.sa.gov.au/pehs/Food/Food-Act-Report-07-08.pdf.

Soft serve and frozen yoghurt survey NSWFA/FI212/1410 22 of 26
Appendix 1. Selected surveys on the microbiological quality of soft serve in Australia and overseas
Year
Country Samples tested
No of samples
Findings Reference
2008
Australia (SA)
Soft serve 20 premises
(5 samples from each)
- 5/20 fail Standard plate count
(SPC ≥ 104 cfu/g)
- 5/20 fail coliforms (≥ 10 cfu/g)
- No samples found to contain E. coli, Salmonella or Listeria
SA Health (2009)
2008
Ireland Soft ice cream (Whipped and scoop)
Scoop ice cream
Uncategorised (information not provided)
643
86
125
- 223/643 (35%) of samples unsatisfactory for aerobic colony count (≥105 cfu/g) and/or Enterobacteriaceae (≥ 104 cfu/g)
- 18/86 (21%) of samples unsatisfactory for aerobic colony count and/or Enterobacteriaceae
- 49/125 (39%) of samples unsatisfactory for aerobic colony count and/or Enterobacteriaceae
FSAI (2008)
2006
USA,
Iowa
Soft serve dispensing machines
30 - 14/30 (47%) exceeded state standards for coliforms
- 7/30 (23%) exceeded state standards for standard plate count
Krogstad (2006)
2003
USA,
Wisconsin
Soft serve dispensing machines
22 - 15/22 “dangerous levels of coliforms and other bacteria”
Cited in (Powell, 2008)
2001
Ireland Soft ice cream
552 - 51.1% of samples unsatisfactory for Aerobic colony count (ACC ≥ 105 cfu/g)
- 6.5% unsatisfactory for Enterobacteriaceae (≥ 104 cfu/g)
FSAI (2001)
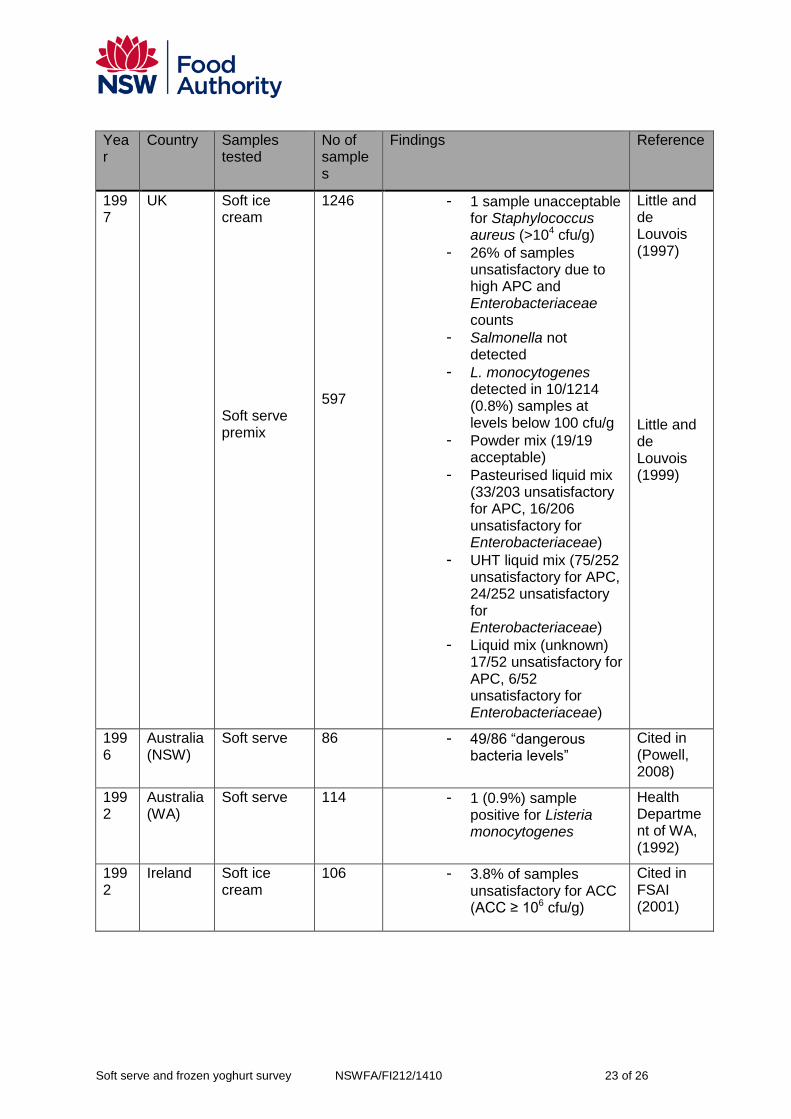
Soft serve and frozen yoghurt survey NSWFA/FI212/1410 23 of 26
Year
Country Samples tested
No of samples
Findings Reference
1997
UK Soft ice cream
Soft serve premix
1246
597
- 1 sample unacceptable for Staphylococcus aureus (>104 cfu/g)
- 26% of samples unsatisfactory due to high APC and Enterobacteriaceae counts
- Salmonella not detected
- L. monocytogenes detected in 10/1214 (0.8%) samples at levels below 100 cfu/g
- Powder mix (19/19 acceptable)
- Pasteurised liquid mix (33/203 unsatisfactory for APC, 16/206 unsatisfactory for Enterobacteriaceae)
- UHT liquid mix (75/252 unsatisfactory for APC, 24/252 unsatisfactory for Enterobacteriaceae)
- Liquid mix (unknown) 17/52 unsatisfactory for APC, 6/52 unsatisfactory for Enterobacteriaceae)
Little and de Louvois (1997)
Little and de Louvois (1999)
1996
Australia (NSW)
Soft serve 86 - 49/86 “dangerous bacteria levels”
Cited in (Powell, 2008)
1992
Australia (WA)
Soft serve 114 - 1 (0.9%) sample positive for Listeria monocytogenes
Health Department of WA, (1992)
1992
Ireland Soft ice cream
106 - 3.8% of samples unsatisfactory for ACC (ACC ≥ 106 cfu/g)
Cited in FSAI (2001)
Soft serve and frozen yoghurt survey NSWFA/FI212/1410 24 of 26
Appendix 2. Food handling questionnaire for business that sell soft serve and/or frozen yoghurt
Soft serve and frozen yoghurt survey NSWFA/FI212/1410 25 of 26
Soft serve and frozen yoghurt survey NSWFA/FI212/1410 26 of 26

NSW Food Authority 6 Avenue of the AmericasNewington NSW 2127PO Box 6682 Silverwater NSW 1811Phone 1300 552 406Fax 02 9647 0026www.foodauthority.nsw.gov.au