oct angiography of the choriocapillaris in central serous ... · original research oct angiography...
TRANSCRIPT
ORIGINAL RESEARCH
OCT Angiography of the Choriocapillaris in CentralSerous Chorioretinopathy: A Quantitative SubgroupAnalysis
Bertan Cakir . Michael Reich . Stefan Lang . Anima Buhler .
Christoph Ehlken . Bastian Grundel . Milena Stech . Sabine Reichl .
Andreas Stahl . Daniel Bohringer . Hansjurgen Agostini .
Clemens Lange
Received: October 1, 2018 / Published online: January 7, 2019� The Author(s) 2019
ABSTRACT
Introduction: To quantify optical coherencetomography angiography (OCTA) signal chan-ges at the level of the choriocapillaris (CC) inpatients with different stages of central serouschorioretinopathy (CSC) and to explore anycorrelation between subretinal fluid (SRF) andretinal pigment epithelium (RPE) alterationsand the OCTA CC signal.Methods: One hundred one CSC eyes and 42healthy control eyes were included in this ret-rospective study. CSC patients were allocatedinto four groups: acute, non-resolving, chronicatrophic and inactive CSC. CC OCTA images(AngioPlex�, Zeiss) were automatically quanti-fied using an image-processing algorithm. Spa-tial correlation analysis of OCTA signals wasperformed by overlapping macular edema
heatmaps and fundus autofluorescence imageswith corresponding OCTA images.Results: Active CSC subgroups demonstratedsignificantly more increased and decreased flowpixels in the CC compared with controls(p\ 0.0001). No significant OCTA changes wereseen within the active CSC groups or betweenthe inactive and healthy subgroup. Spatial cor-relation analysis revealed a decreased OCTAsignal in the SRF area and an increased signaloutside the SRF area in acute CSC. Areas of RPEatrophy co-localized with areas of increasedchoriocapillaris OCTA signal, while areas withRPE alterations exhibited a normal signal com-pared with unaffected RPE.Conclusion: The decreased OCTA signal in thearea of SRF in acute CSC could be evidence oflocalized CC hypoperfusion or due to shadow-ing artifacts. The missing CC OCTA changes inaltered RPE adjacent to atrophy argues againstCC injury. Studies with higher resolution andoptimized image acquisition are warranted tofurther validate our findings.
Keywords: Central serous chorioretinopathy;Choriocapillaris; OCT angiography
INTRODUCTION
Central serous chorioretinopathy (CSC) ranksafter age-dependent macular degeneration, dia-betic retinopathy, and retinal vein occlusion as
Enhanced digital features To view enhanced digitalfeatures for this article go to https://doi.org/10.6084/m9.figshare.7467146.
Electronic supplementary material The onlineversion of this article (https://doi.org/10.1007/s40123-018-0159-1) contains supplementary material, which isavailable to authorized users.
B. Cakir � M. Reich � S. Lang � A. Buhler � C. Ehlken� B. Grundel � M. Stech � S. Reichl � A. Stahl �D. Bohringer � H. Agostini � C. Lange (&)Eye Center, Medical Center, Faculty of Medicine,University of Freiburg, Freiburg, Germanye-mail: [email protected]
Ophthalmol Ther (2019) 8:75–86
https://doi.org/10.1007/s40123-018-0159-1
one of the most common vision-threateningretinopathies, with an annual incidence of1:10,000 [1, 2]. CSC is characterized by localizedsubretinal fluid (SRF) at the posterior pole thattypically resolves spontaneously within a fewmonths [3]. In chronic cases, however, SRF canpersist, damaging the photoreceptors and reti-nal pigment epithelium (RPE) and resulting inirreversible vision loss. Based on the onset ofsymptoms and the retinal and RPE changes thatresult, CSC can be subgrouped into severalforms: an acute form with self-resolving SRF, anon-resolving form with SRF persisting longerthan 4 months, a chronic atrophic formrevealing widespread RPE atrophy with orwithout fluid, and an inactive form without SRF[4].
The pathogenesis of CSC is still poorlyunderstood; however, most existing investiga-tions suggest that the primary pathology occurswithin the choroid and RPE-choriocapillaris(CC) complex. Animal and clinical studiesdemonstrate that overstimulation of the min-eralocorticoid pathway in choroidal vesselsleads to choroidal vasodilatation, RPE disrup-tion, and fluid leakage under the retina [5, 6].The typical diagnostic clinical workup of CSCconsists of a basic slit-lamp examination, opti-cal coherence tomography (SD-OCT), fundusautofluorescence (FAF), fluorescence angiogra-phy (FAG) and indocyanine green angiography(ICG). However, none of these methods providea detailed, high-resolution image of the CC toenable insight into the currently proposedpathomechanism.
OCT angiography (OCTA) is a new non-in-vasive imaging technique which uses themotion contrast of moving blood componentsinstead of intravenous dye to create images ofthe retinal and choroidal vasculature. Com-pared with dye-based angiography, OCTA isunable to detect plasma movements and vas-cular leakage. The advantages of OCTA includeits non-invasiveness, short examination time,and capability to generate high-resolution vol-umetric angiography scans of the retina andchoroid [7–13].
Since its introduction, several studies haveused OCTA to investigate the CC in smallcohorts of patients with CSC and reported
changes in the form of decreased and/orincreased flow [8, 12, 14–17]. None of thesestudies, however, have provided quantitativedata or investigated the CC signal in differentdisease stages. Furthermore, none have exam-ined the interdependence between SRF and RPEchanges and the OCTA signal in patients withCSC. Thus, in this retrospective study, wesought to quantify OCTA signal changes at thelevel of the CC in patients presenting with dif-ferent stages of CSC and to explore any corre-lation between SRF and RPE alterations and theOCTA signal.
METHODS
Subjects
The charts of all CSC patients who underwentOCT angiography as part of their standardimaging protocol between December 2015 andApril 2017 during their visit at the Eye Center ofthe University of Freiburg were reviewed retro-spectively. Patients with concomitant macu-lopathies such as age-related maculardegeneration, diabetic retinopathy, or otherretinopathies were excluded from this study.Patient characteristics such as gender, date ofbirth, pre-existing conditions, initial diagnosis,previous treatment, duration of symptoms, andOCT findings such as intraretinal fluid,intraretinal deposits, and pigment epitheliumdeviation were documented. In addition to thebasic ophthalmic examination, a fundus aut-ofluorescence image (FAF) was taken of allpatients. Secondary choroidal neovasculariza-tion was excluded in chronic CSC cases withadditional FAG and ICG. Based on Daruich andcolleagues’ classification scheme [4], patientswere classified according to their pigmentepithelium status and the duration of theirsymptoms into in one of the four followinggroups: (1) acute CSC with SRF lasting \4 months; (2) non-resolving CSC with SRF per-sisting [ 4 months; (3) chronic atrophic CSCwith extensive pigment epithelium atrophywith or without SRF, and (4) inactive CSCwithout SRF but presenting signs of a previousCSC episode (Table 1). Age-matched healthy
76 Ophthalmol Ther (2019) 8:75–86
control subjects with visual acuity [ 0.8 wereincluded as controls. All procedures performedin studies involving human participants were inaccordance with the Freiburg University Hospi-tal institutional review board and with the 1964Helsinki Declaration and its later amendmentsor comparable ethical standards. Informedconsent was obtained from all individual par-ticipants included in the study.
Imaging and Image Analysis
OCTA images were obtained with a commer-cially available OCTA system (Zeiss Angio-PlexTM�). This device has an A-scan rate of68,000 A-scans per second and uses the OpticalMicroangiography (OMAG�) algorithm fordecorrelation signal detection. An advantageover other current OCTA algorithms is that itrelies on both amplitude and phase in theOCTA signals to extract the blood flow infor-mation. A real-time image stabilizer (Fas-tTracTM) ensures minimization of movementartifacts. Furthermore, a built-in software wasused to eliminate positive artifacts created fromthe superficial vascular layers. Each patientreceived a 6 9 6 mm
2
volume scan. For OCTAvisualization of the CC layer, a 30-lm parallelslab between 30 and 60 lm below the inner RPEwas manually selected for each patient. In casesof pigment epithelium detachments (PED), theslab did not follow the PED.
Abnormal CC decorrelation signals werequantified using a self-designed image process-ing algorithm programmed in R language(www.r-project.org) as described previously
[17]. Briefly, images were processed via a Gaus-sian blur and morphologic hdome operator,and each image’s average gray-scale value wasmeasured. Pixels with increased or decreasedgray-scale value were detected and color-codedin red or green, respectively. The threshold forthe color coding was calculated for each OCTAimage by using the averaged grayscale value ofall pixels (brightness of pixel) plus or minus aconstant and pre-defined threshold value. Thepre-defined threshold value was visually deter-mined using numerous exemplary OCT-A ima-ges as previously described [17]. Beforequantifying the pixel counts, shadowing arti-facts of the inner retinal vessels were manuallyremoved from each image. The counts of redand green pixel were used for statisticalanalyses.
To analyze the spatial correlation betweenSRF and the OCTA CC signal in patients withacute CSC, the color-coded CC images werealigned with the corresponding heat map imagecontaining macular thickness informationobtained from the Zeiss AngioplexTM�. Thearea with macular thickness [ 450 lm wasdefined as the region of interest to ensure spa-tial correlation analysis only in areas with sig-nificant SRF. This area was then automaticallyoutlined by the program. Red and green pixelcounts within and outside the area were recor-ded and used for statistical analyses. Similarly,areas revealing RPE changes in patients withchronic atrophic CSC were determined on FAFimages and aligned with corresponding CC flowimages using the superficial vascular plexus forboth modalities as landmarks. Two areas
Table 1 CSC classification according to Daruich et al. [4]
CSC stage SRF SRF duration ofcurrent episode
RPE status
Acute ? \4 month Normal RPE or RPE alterations without atrophy
Non-resolving ? [4 month Normal RPE or RPE alterations without atrophy
Atrophic ? or - NA Widespread RPE atrophy with or without gravitational tracks
Inactive – NA Signs of previous CSC episode with RPE alterations without
atrophy
Ophthalmol Ther (2019) 8:75–86 77
showing RPE changes were manually outlined:(1) areas with obvious dark-appearing RPEatrophy; (2) areas with increased FAF signalsurrounding the RPE atrophy. Pixel counts ofthe automated color-coded images within andoutside the regions were used for statisticalanalysis.
Statistical Methods
Statistical analysis was performed using Graph-Pad Prism 6 (GraphPad Software, Inc., La Jolla,CA, USA). Distribution of our data set was ana-lyzed by applying the D’Agostino-Pearson’somnibus and Kolmogorov-Smirnov normalitytest. We opted for the Mann-Whitney U test forcomparison between two groups since the datawere not normally distributed. Statistical anal-ysis for multiple groups was performed usingthe non-parametric ANOVA/Bonferroni multi-ple comparison test. Data were considered sig-nificant at p\ 0.05.
RESULTS
Patient Characteristics
A total of 101 eyes from 78 CSC patients and 42eyes from 34 controls were included in thisstudy. Average age of the CSC population was51 years (range 30–80) compared with 49 years(range 24–79) in the control group. For sub-group analyses, CSC patients were allocatedinto the aforementioned four groups. Onlypatients with indisputable characteristics wereallocated in the subgroups. Patients whosesymptoms were of uncertain duration wereexcluded from the subgroup analysis. Thirty-seven eyes were classified as acute CSC, 37 asnon-resolving CSC, 11 as atrophic CSC, and 16as inactive CSC. For a detailed characterizationof all patients, see Table 2.
OCTA Analysis of the Choriocapillaris
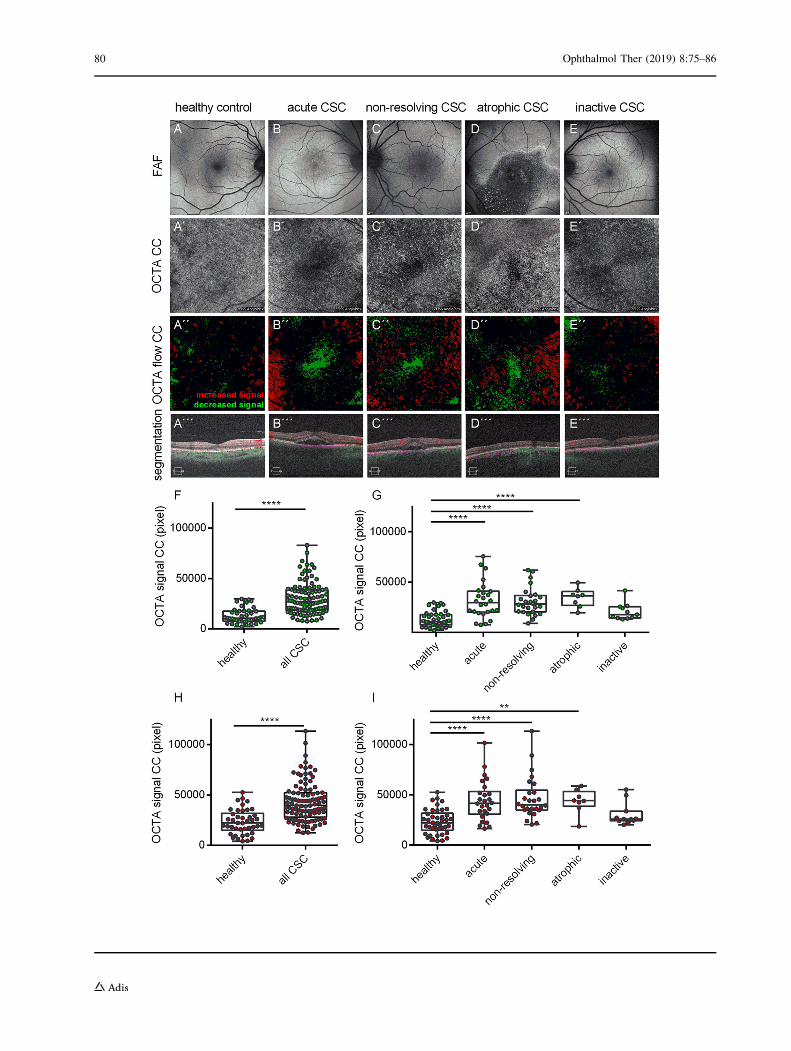
Patients with CSC demonstrated both areas withincreased and decreased OCTA signal at the levelof the CC. The number of pixels with increased
OCTA signal was significantly higher in patientswith CSC (mean 43,238 ± SD 19,568) than incontrol subjects (23,348 ± 12,226; p\0.0001).Similarly, the number of pixels with decreasedOCTA signal was more pronounced in CSC(30,243 ± 15,793) than in control patients(12,970 ± 7454; p\0.0001). Subgroup analysisrevealed increased and decreased OCTA signal atthe level of the CC in acute, non-resolving, andatrophic CSC patients compared with the inac-tive form of CSC and healthy controls. Thenumber of pixels with increased OCTA signalwas similar in patients with acute CSC (44,214 ±
20,020), non-resolving CSC (46,903 ± 21,136),and chronic atrophic CSC (43,641 ± 12,234) andhigher compared with patients with inactiveCSC (30,566 ± 11,403) and healthy controls(23,348 ± 12,226, ANOVA p\0.0001). Thenumber of pixels with decreased OCTA signalwas comparable in patients with acute CSC(31,991 ± 18,020), non-resolving CSC (30,564 ±
13,758), and chronic atrophic CSC (34,578 ±
9352) and significantly higher than in healthycontrols (12,970 ± 7454; ANOVA p\0.0001;Fig. 1).
Spatial Correlation Between SubretinalFluid and Flow Signal in Patientswith Acute CSC
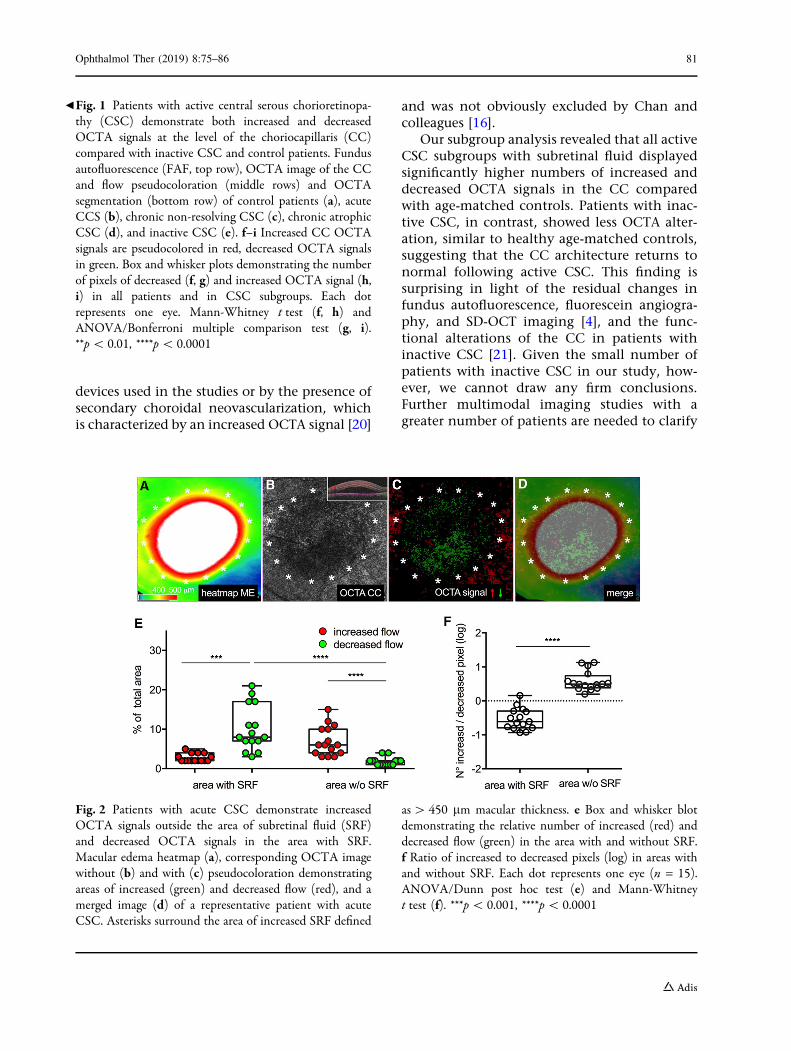
To explore the spatial correlation between SRFand OCTA signal, we included a total of 15patients who had classic acute CSC defined bynormal to minor RPE changes, a dome-shapedaccumulation of central subretinal fluid, andsymptoms lasting \ 4 months. Patients withacute CSC demonstrated an inhomogeneousand weaker OCTA signal in the SRF area and astronger OCTA signal outside the SRF area(Fig. 2a–d). Within the SRF area, the percentageof pixels with decreased OCTA signal was sig-nificantly higher than that of pixels withincreased OCTA signal (10.2% ± 5.7 vs.2.7% ± 1.0; p\0.001). In the surrounding areawithout SRF, we detected the opposite, namelya significantly higher percentage of pixels withincreased OCTA signal compared withdecreased signal (7% ± 3.7 vs. 1.8% ± 1.0;p\0.0001; Fig. 2e). The mean ratio of increased
78 Ophthalmol Ther (2019) 8:75–86
to decreased OCTA signal was - 0.5 ± 0.3 inthe area with SRF and 0.6 ± 0.3 outside the areaof SRF (p\ 0.0001). Taken together, these dataindicate that increased OCTA signals dominatethe area without SRF, while decreased OCTAsignals are predominantly found in the areawith SRF in patients with acute CSC (Fig. 2f).
Spatial Correlation Between RPE Atrophyand Flow Signal in Patients with AtrophicCSC
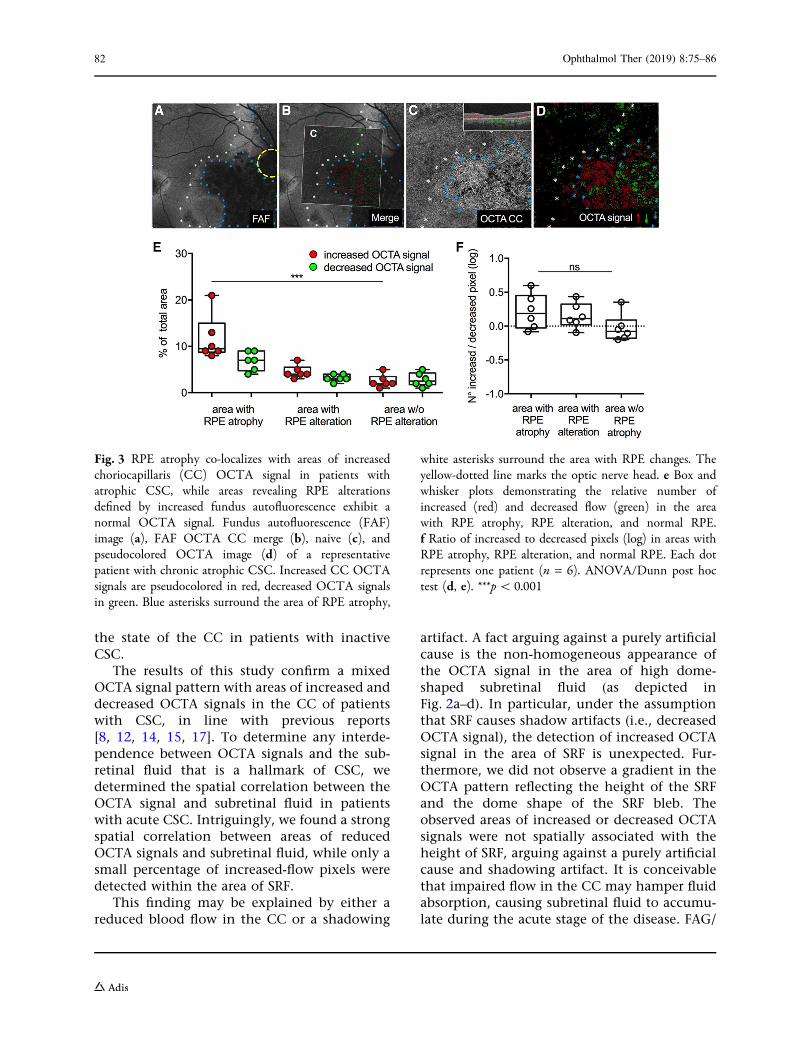
To determine the interdependence between RPEatrophy and the OCTA signal in the CC, weincluded a total of six patients with chronicatrophic CSC defined by widespread RPE andphotoreceptor atrophy without subretinal fluid.We found that areas of RPE atrophy co-localizedwith areas of increased CC OCTA signal, whileareas revealing RPE alterations defined byhigher autofluorescence exhibited a normalOCTA signal compared with unaffected RPE inthe same eye (Fig. 3a–d). Within the area of RPEatrophy, the percentage of pixels sending anincreased OCTA signal was significantly higherthan that of the unaffected RPE area in thecorresponding eye (11.7% ± 4.9% vs.2.5 ± 1.4%; p\0.001). We found no significantdifference in the number of pixels withdecreased OCTA signal among areas of RPEatrophy, RPE alteration, and unaffected RPE(Fig. 3e). The mean ratio of increased todecreased OCTA signals was 0.21 ± 0.26 in thearea of RPE atrophy, 0.15 ± 0.19 in the area ofRPE alteration, and - 0.03 ± 0.2 in the area ofnormal RPE, which underlines our finding thatRPE atrophy is associated with increased OCTAsignal in the CC in patients with chronicatrophic CSC (Fig. 3f).
DISCUSSION
OCT angiography (OCTA) is a promising, non-invasive imaging technique that enables high-resolution and quantitative characterization ofthe retinal and choroidal vasculature. Recentstudies have demonstrated the value of OCTAimaging of the CC in patients with CSC, whichare characterized by areas of choroidal hyper-and hypoperfusion [8, 12, 14, 15, 17]. None ofthose small cohort studies, however, quantita-tively assessed the CC OCTA signal in patientswith CSC or compared OCTA signals in differ-ent subgroups of patients with CSC. Further-more, none of those investigations sought toidentify any association between the OCTA CCsignal and subretinal fluid and RPE atrophy,respectively, which are hallmarks of acute andchronic atrophic CSC. The aim of this to-datelargest cohort study was therefore to provide adetailed overview of OCTA signal changes at thelevel of the CC in patients presenting with dif-ferent stages of CSC and to investigate apotential correlation between SRF and RPEalterations and the OCTA signal.
Our study demonstrates that normal eyesexhibit a relatively consistent CC vascular net-work as described before [18, 19]. Patients withCSC, however, exhibit areas of increased anddecreased OCTA signals at the level of the CC.This mixed signal pattern in our population is inline with previous OCTA choriocapillaris studiesdescribing areas of reduced and enhanced CCflow in patients with CSC [8, 12, 14, 15, 17].Only one study reported a different patterncharacterized by a predominantly increasedOCTA signal in the CC that corresponded withleakage in fluorescein angiography [16]. Thisdiscrepancy may be attributed to different OCTA
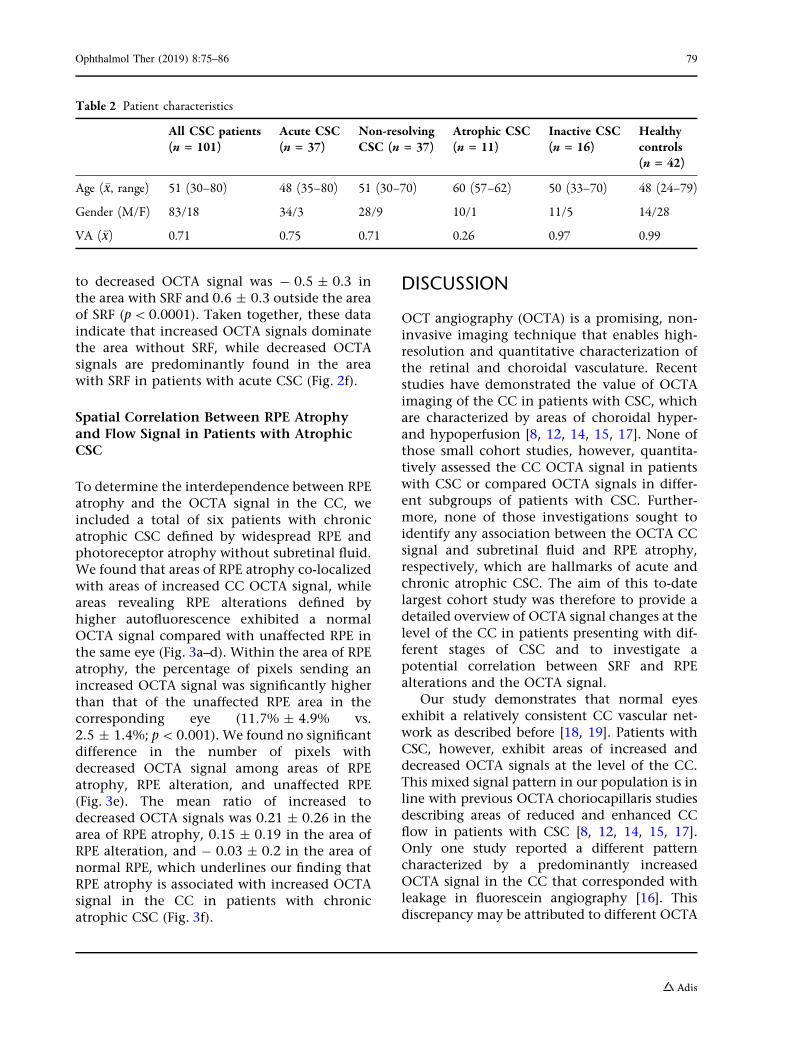
Table 2 Patient characteristics
All CSC patients(n = 101)
Acute CSC(n = 37)
Non-resolvingCSC (n = 37)
Atrophic CSC(n = 11)
Inactive CSC(n = 16)
Healthycontrols(n = 42)
Age (�x, range) 51 (30–80) 48 (35–80) 51 (30–70) 60 (57–62) 50 (33–70) 48 (24–79)
Gender (M/F) 83/18 34/3 28/9 10/1 11/5 14/28
VA (�x) 0.71 0.75 0.71 0.26 0.97 0.99
Ophthalmol Ther (2019) 8:75–86 79
80 Ophthalmol Ther (2019) 8:75–86
devices used in the studies or by the presence ofsecondary choroidal neovascularization, whichis characterized by an increased OCTA signal [20]
and was not obviously excluded by Chan andcolleagues [16].
Our subgroup analysis revealed that all activeCSC subgroups with subretinal fluid displayedsignificantly higher numbers of increased anddecreased OCTA signals in the CC comparedwith age-matched controls. Patients with inac-tive CSC, in contrast, showed less OCTA alter-ation, similar to healthy age-matched controls,suggesting that the CC architecture returns tonormal following active CSC. This finding issurprising in light of the residual changes infundus autofluorescence, fluorescein angiogra-phy, and SD-OCT imaging [4], and the func-tional alterations of the CC in patients withinactive CSC [21]. Given the small number ofpatients with inactive CSC in our study, how-ever, we cannot draw any firm conclusions.Further multimodal imaging studies with agreater number of patients are needed to clarify
bFig. 1 Patients with active central serous chorioretinopa-thy (CSC) demonstrate both increased and decreasedOCTA signals at the level of the choriocapillaris (CC)compared with inactive CSC and control patients. Fundusautofluorescence (FAF, top row), OCTA image of the CCand flow pseudocoloration (middle rows) and OCTAsegmentation (bottom row) of control patients (a), acuteCCS (b), chronic non-resolving CSC (c), chronic atrophicCSC (d), and inactive CSC (e). f–i Increased CC OCTAsignals are pseudocolored in red, decreased OCTA signalsin green. Box and whisker plots demonstrating the numberof pixels of decreased (f, g) and increased OCTA signal (h,i) in all patients and in CSC subgroups. Each dotrepresents one eye. Mann-Whitney t test (f, h) andANOVA/Bonferroni multiple comparison test (g, i).**p\ 0.01, ****p\ 0.0001
Fig. 2 Patients with acute CSC demonstrate increasedOCTA signals outside the area of subretinal fluid (SRF)and decreased OCTA signals in the area with SRF.Macular edema heatmap (a), corresponding OCTA imagewithout (b) and with (c) pseudocoloration demonstratingareas of increased (green) and decreased flow (red), and amerged image (d) of a representative patient with acuteCSC. Asterisks surround the area of increased SRF defined
as[ 450 lm macular thickness. e Box and whisker blotdemonstrating the relative number of increased (red) anddecreased flow (green) in the area with and without SRF.f Ratio of increased to decreased pixels (log) in areas withand without SRF. Each dot represents one eye (n = 15).ANOVA/Dunn post hoc test (e) and Mann-Whitneyt test (f). ***p\ 0.001, ****p\ 0.0001
Ophthalmol Ther (2019) 8:75–86 81
the state of the CC in patients with inactiveCSC.
The results of this study confirm a mixedOCTA signal pattern with areas of increased anddecreased OCTA signals in the CC of patientswith CSC, in line with previous reports[8, 12, 14, 15, 17]. To determine any interde-pendence between OCTA signals and the sub-retinal fluid that is a hallmark of CSC, wedetermined the spatial correlation between theOCTA signal and subretinal fluid in patientswith acute CSC. Intriguingly, we found a strongspatial correlation between areas of reducedOCTA signals and subretinal fluid, while only asmall percentage of increased-flow pixels weredetected within the area of SRF.
This finding may be explained by either areduced blood flow in the CC or a shadowing
artifact. A fact arguing against a purely artificialcause is the non-homogeneous appearance ofthe OCTA signal in the area of high dome-shaped subretinal fluid (as depicted inFig. 2a–d). In particular, under the assumptionthat SRF causes shadow artifacts (i.e., decreasedOCTA signal), the detection of increased OCTAsignal in the area of SRF is unexpected. Fur-thermore, we did not observe a gradient in theOCTA pattern reflecting the height of the SRFand the dome shape of the SRF bleb. Theobserved areas of increased or decreased OCTAsignals were not spatially associated with theheight of SRF, arguing against a purely artificialcause and shadowing artifact. It is conceivablethat impaired flow in the CC may hamper fluidabsorption, causing subretinal fluid to accumu-late during the acute stage of the disease. FAG/
Fig. 3 RPE atrophy co-localizes with areas of increasedchoriocapillaris (CC) OCTA signal in patients withatrophic CSC, while areas revealing RPE alterationsdefined by increased fundus autofluorescence exhibit anormal OCTA signal. Fundus autofluorescence (FAF)image (a), FAF OCTA CC merge (b), naive (c), andpseudocolored OCTA image (d) of a representativepatient with chronic atrophic CSC. Increased CC OCTAsignals are pseudocolored in red, decreased OCTA signalsin green. Blue asterisks surround the area of RPE atrophy,
white asterisks surround the area with RPE changes. Theyellow-dotted line marks the optic nerve head. e Box andwhisker plots demonstrating the relative number ofincreased (red) and decreased flow (green) in the areawith RPE atrophy, RPE alteration, and normal RPE.f Ratio of increased to decreased pixels (log) in areas withRPE atrophy, RPE alteration, and normal RPE. Each dotrepresents one patient (n = 6). ANOVA/Dunn post hoctest (d, e). ***p\ 0.001
82 Ophthalmol Ther (2019) 8:75–86
ICG- and Doppler flowmetry-based studiesdemonstrating reduced choroidal blood flowcompared with the unaffected eye in CSCpatients support this hypothesis [22, 23]. How-ever, even though our and previous data indi-cate a hypoperfusion of the CC as a primarydisease pathology, we must be cautious in theinterpretation of decreased OCTA signal[12, 24]. Decreased OCTA could be caused byshadowing artifacts related to subretinal fluid,pigment epithelial detachment, elongation, orirregularities of the photoreceptor outer seg-ment—all factors that cannot be ruled out withconfidence and need to be addressed in futurestudies.
Finally, our study assessed the spatial corre-lation between the OCTA signal in the CC andareas of RPE atrophy in patients with chronicatrophic CSC. We found that patients withchronic atrophic CSC reveal profound CCOCTA signal abnormalities in the area of RPEatrophy, but no significant differences in theadjacent hyperfluorescent area. In geographicatrophy of age-related macular degeneration(AMD), discussions have focused on whetherRPE atrophy leads to CC atrophy or vice versa[25–27]. CC OCTA studies of geographic atro-phy patients revealed severely decreased CCflow in areas of RPE atrophy [18, 28, 29]. In linewith these findings are results of a histologicstudy of human samples from McLeod et al.that demonstrated a 50% loss of CC density inregions of complete RPE atrophy and postulatedlinear CC reduction related to RPE loss inregions of geographic atrophy [25]. However,no complete CC atrophy in the area of RPEatrophy was detected in this study. The assess-ment of CC atrophy is due to the dynamic rangeof detectable blood flow by OCTA limited in ourstudy [18]. The predominant increased OCTsignal in the area of RPE atrophy in our analysisis not in line with the histologic data byMcLeod et al. and previous OCTA geographicatrophy studies. This could be explained byinward displacement of the high-flow deeperchoroid layer in the CC slab through thinningand/or atrophy of the CC. Interestingly, weobserved a normal CC OCTA signal in the areaof increased fundus autofluorescence adjacentto the RPE atrophy, which is characterized by
accumulation of lipofuscin fluorophores anddiscussed as a sign of RPE malfunction leadingto RPE atrophy [30, 31]. The missing OCTAsignal changes in this area in our analysis favorthe RPE over the CC as the primary site ofinjury. In contrast to our findings, Pellegriniet al. revealed persisting lobules with reducedflow at the margin of the RPE atrophy in Star-gardt patients [29]. The use of the lower reso-lution 6 9 6 volume scan and mean grayscalevalue-dependent quantification algorithm ofeach individual image in our study may havefailed to detect subtle changes within this area.
Our study’s limitations include its retro-spective study design, the relatively smallnumber of patients in different subgroups, andthe possibility that artifacts were a contributingcause to choriocapillary flow changes. Shadow-ing artifacts by SRF, PED, and photoreceptorouter segment irregularities could have con-tributed to the predominately decreased flowsignal in acute and non-resolving CSC patients.Furthermore, the predominant increased flowsignal in chronic atrophic CSC patients couldhave been explained by structural changes suchas loss of the optical dense RPE and transloca-tion of the high-flow deeper choroid layer in theCC slab. Another limitation of our study is theuse of the averaged pixel intensity of eachimage to determine increased and decreasedflow changes within the same image, whichmay have caused some over- and underestima-tion of flow changes in unaffected areas.Prospective longitudinal studies with optimizedimage acquisition techniques less prone toartifact are therefore necessary to further vali-date our findings.
CONCLUSION
In summary, the present study reports on thelargest cohort, OCTA-based CC assessment todate and is the first to quantify CC flow changesin different subgroups of CSC. Patients withactive CSC presented significantly increasedand decreased flow pixel intensities in the CCcompared to patients with inactive CSC andage-matched healthy controls. Surprisingly, nochanges were found within the active CSC
Ophthalmol Ther (2019) 8:75–86 83
groups. The decreased flow in the SRF area inacute CCS patients could be evidence of areduced blood flow in the CC in an active stateor due to shadowing artifacts. The lack of CCchanges in RPE areas revealing increased aut-ofluorescence adjacent to RPE atrophy arguesagainst primary CC injury. An analysis relyingon higher resolution images specificallydesigned to investigate changes in the marginof the RPE atrophy is warranted to assess thisquestion more accurately.
ACKNOWLEDGEMENTS
Funding. No funding or sponsorship wasreceived for this study or publication of thisarticle. The article processing charges werefunded by the authors.
Authorship. All named authors meet theInternational Committee of Medical JournalEditors (ICMJE) criteria for authorship for thisarticle, take responsibility for the integrity ofthe work as a whole, and have given theirapproval for this version to be published.
Author Contributions. Concept and design:BC, CL; data acquisition: BC, CL, MR, SL, AB,CE, BG, MS, SR, AS; data analysis/interpretation:BC, CL, MR, DB; drafting manuscript: BC, CL;critical revision of manuscript: MR, SL, AB, CE,BG, MS, SR, AS, HA; supervision: CL, HA. Allauthors read and approved the finalmanuscript.
Disclosures. Bertan Cakir, Michael Reich,Stefan Lang, Anima Buhler, Christoph Ehlken,Bastian Grundel, Milena Stech, Sabine Reichl,Andreas Stahl, Daniel Bohringer, HansjurgenAgostini, and Clemens Lange have nothing todisclose.
Compliance with Ethics Guidelines. Allprocedures performed in studies involvinghuman participants were in accordance withthe Freiburg University Hospital review boardand with the 1964 Helsinki Declaration and itslater amendments or comparable ethical
standards. Informed consent was obtained fromall individual participants included in thestudy.
Data Availability. All data generated oranalyzed during this study are included in thispublished article/as supplementary informationfiles.
Open Access. This article is distributedunder the terms of the Creative CommonsAttribution-NonCommercial 4.0 InternationalLicense (http://creativecommons.org/licenses/by-nc/4.0/), which permits any non-commercial use, distribution, and reproductionin any medium, provided you give appropriatecredit to the original author(s) and the source,provide a link to the Creative Commons license,and indicate if changes were made.
REFERENCES
1. Wang M, Munch IC, Hasler PW, Prunte C, LarsenM. Central serous chorioretinopathy. Acta Oph-thalmol (Copenh). 2008;86:126–45.
2. Kitzmann AS, Pulido JS, Diehl NN, Hodge DO,Burke JP. The incidence of central serous chori-oretinopathy in Olmsted county, Minnesota,1980–2002. Ophthalmology. 2008;115:169–73.
3. Daruich A, Matet A, Behar-Cohen F. Central serouschorioretinopathy. Dev Ophthalmol.2017;58:27–38.
4. Daruich A, Matet A, Dirani A, Bousquet E, Zhao M,Farman N, et al. Central serous chorioretinopathy:recent findings and new physiopathology hypoth-esis. Prog Retin Eye Res. 2015;48:82–118.
5. Bousquet E, Beydoun T, Zhao M, Hassan L, Offret O,Behar-Cohen F. Mineralocorticoid receptor antag-onism in the treatment of chronic central serouschorioretinopathy: a pilot study. Retina Phila Pa.2013;33:2096–102.
6. Zhao M, Celerier I, Bousquet E, Jeanny J-C, Jonet L,Savoldelli M, et al. Mineralocorticoid receptor isinvolved in rat and human ocular chorioretinopa-thy. J Clin Invest. 2012;122:2672–9.
7. Alten F, Heiduschka P, Clemens CR, Eter N.Exploring choriocapillaris under reticular pseudo-drusen using OCT-angiography. Graefes Arch Clin
84 Ophthalmol Ther (2019) 8:75–86
Exp Ophthalmol Albrecht Von Graefes Arch KlinExp Ophthalmol. 2016;254:2165–73.
8. Teussink MM, Breukink MB, van Grinsven MJJP,Hoyng CB, Klevering BJ, Boon CJF, et al. OCTangiography compared to fluorescein and indo-cyanine green angiography in chronic central ser-ous chorioretinopathy. Invest Ophthalmol Vis Sci.2015;56:5229–37.
9. Quaranta-El Maftouhi M, El Maftouhi A, Eandi CM.Chronic central serous chorioretinopathy imagedby optical coherence tomographic angiography.Am J Ophthalmol. 2015;160(581–587):e1.
10. Dansingani KK, Balaratnasingam C, Klufas MA,Sarraf D, Freund KB. Optical coherence tomographyangiography of shallow irregular pigment epithelialdetachments in pachychoroid spectrum disease.Am J Ophthalmol. 2015;160(1243–1254):e2.
11. Bonini Filho MA, de Carlo TE, Ferrara D, Adhi M,Baumal CR, Witkin AJ, et al. Association of chor-oidal neovascularization and central serous chori-oretinopathy with optical coherence tomographyangiography. JAMA Ophthalmol.2015;133:899–906.
12. Costanzo E, Cohen SY, Miere A, Querques G,Capuano V, Semoun O, et al. Optical coherencetomography angiography in central serous chori-oretinopathy. J Ophthalmol. 2015;2015:134783.
13. de Carlo TE, Rosenblatt A, Goldstein M, Baumal CR,Loewenstein A, Duker JS. Vascularization of irreg-ular retinal pigment epithelial detachments inchronic central serous chorioretinopathy evaluatedwith OCT angiography. Ophthalmic Surg LasersImaging Retina. 2016;47:128–33.
14. Shinojima A, Kawamura A, Mori R, Fujita K, YuzawaM. Findings of optical coherence tomographicangiography at the choriocapillaris level in centralserous chorioretinopathy. Ophthalmol J Int Oph-talmol Int J Ophthalmol Z Fur Augenheilkd.2016;236:108–13.
15. Feucht N, Maier M, Lohmann CP, Reznicek L. OCTangiography findings in acute central serouschorioretinopathy. Ophthalmic Surg Lasers Imag-ing Retina. 2016;47:322–7.
16. Chan SY, Wang Q, Wei WB, Jonas JB. Opticalcoherence tomographic angiography in centralserous chorioretinopathy. Retina Phila Pa.2016;36:2051–8.
17. Cakir B, Reich M, Lang SJ, Buhler A, Stahl A, Boh-ringer D, et al. Possibilities and limitations of OCT-angiography in patients with central serous chori-oretinopathy. Klin Monatsbl Augenheilkd.2017;234:1161–8.
18. Choi W, Mohler KJ, Potsaid B, Lu CD, Liu JJ,Jayaraman V, et al. Choriocapillaris and choroidalmicrovasculature imaging with ultrahigh speedOCT angiography. PLoS One. 2013;8:e81499.
19. Braaf B, Vienola KV, Sheehy CK, Yang Q, VermeerKA, Tiruveedhula P, et al. Real-time eye motioncorrection in phase-resolved OCT angiography withtracking SLO. Biomed Opt Express. 2013;4:51–65.
20. Bousquet E, Bonnin S, Mrejen S, Krivosic V,Tadayoni R, Gaudric A. Optical coherence tomog-raphy angiography of flat irregular pigmentepithelium detachment in chronic central serouschorioretinopathy. Retina. 2018;38(3):629–638
21. Tittl M, Maar N, Polska E, Weigert G, Stur M, Sch-metterer L. Choroidal hemodynamic changes dur-ing isometric exercise in patients with inactivecentral serous chorioretinopathy. Invest Ophthal-mol Vis Sci. 2005;46:4717–21.
22. Kitaya N, Nagaoka T, Hikichi T, Sugawara R, FukuiK, Ishiko S, et al. Features of abnormal choroidalcirculation in central serous chorioretinopathy. Br JOphthalmol. 2003;87:709–12.
23. Scheider A, Nasemann JE, Lund OE. Fluorescein andindocyanine green angiographies of central serouschoroidopathy by scanning laser ophthalmoscopy.Am J Ophthalmol. 1993;115:50–6.
24. Spaide RF, Fujimoto JG, Waheed NK. Image artifactsin optical coherence tomography angiography.Retina Phila Pa. 2015;35:2163–80.
25. McLeod DS, Grebe R, Bhutto I, Merges C, Baba T,Lutty GA. Relationship between RPE and chorio-capillaris in age-related macular degeneration.Invest Ophthalmol Vis Sci. 2009;50:4982–91.
26. Saint-Geniez M, Kurihara T, Sekiyama E, Maldon-ado AE, D’Amore PA. An essential role for RPE-derived soluble VEGF in the maintenance of thechoriocapillaris. Proc Natl Acad Sci USA.2009;106:18751–6.
27. Schlingemann RO. Role of growth factors and thewound healing response in age-related maculardegeneration. Graefes Arch Clin Exp OphthalmolAlbrecht Von Graefes Arch Klin Exp Ophthalmol.2004;242:91–101.
28. Kvanta A, Casselholm de Salles M, Amren U, Bar-tuma H. Optical coherence tomography angiogra-phy of the foveal microvasculature in geographicatrophy. Retina Phila Pa. 2017;37:936–42.
29. Pellegrini M, Acquistapace A, Oldani M, CeredaMG, Giani A, Cozzi M, et al. Dark atrophy: anoptical coherence tomography angiography study.Ophthalmology. 2016;123:1879–86.
Ophthalmol Ther (2019) 8:75–86 85

30. Sparrow JR, Kim SR, Cuervo AM, Bandhyopad-hyayand U. A2E, a pigment of RPE lipofuscin, isgenerated from the precursor, A2PE by a lysosomalenzyme activity. Adv Exp Med Biol.2008;613:393–8.
31. McLeod DS, Taomoto M, Otsuji T, Green WR,Sunness JS, Lutty GA. Quantifying changes in RPEand choroidal vasculature in eyes with age-relatedmacular degeneration. Invest Ophthalmol Vis Sci.2002;43:1986–93.
86 Ophthalmol Ther (2019) 8:75–86