oceanic dispersion simulations of 137cs released from the fukushima daiichi nuclear power plant
TRANSCRIPT

ELEMENTS, VOL. 8, PP. 207–212 JUNE 2012207
1811-5209/12/0008-0207$2.50 DOI: 10.2113/gselements.8.3.207
Oceanic Dispersion Simulations of 137Cs Released from the Fukushima Daiichi Nuclear Power Plant
INTRODUCTIONA devastating earthquake and huge tsunami struck the Tohoku area, Japan, on March 11, 2011, causing major damage to the cooling systems of reactors in the Fukushima Daiichi nuclear power plant, operated by Tokyo Electric Power Company (TEPCO). In order to cool the reactor cores and the spent fuel in storage pools, large amounts of seawater and freshwater were used. A signifi cant part of this radioactivity-contaminated water was discharged into the Pacifi c Ocean close to the power plant. In addition, several hydrogen explosions between March 12 and 15 resulted in the release of signifi cant radioactivity into the atmosphere, some of which was deposited onto the sea surface over a wide area of the Pacifi c Ocean. Careful moni-toring combined with modeling of the dispersion of the radioactivity provide critical information (1) on the processes responsible for dispersion of the radionuclides, (2) for simulation and prediction of the spread of radioac-tivity in the seawater, and (3) for the evaluation of the impact on the health of marine ecosystems and humans.
Since the accident at the Fukushima plant, several groups have been conducting numerical dispersion simulations of radionuclides discharged into the ocean, each group having different objectives. Some of the results from the simula-tions have been used to determine locations of monitoring observations off the east coast of Japan. This article reviews the present status of such simulations, without considering
atmospheric deposition, and describes common aspects and discrepancies among the simu-lated results. The article also points out potential problems and provides guidance for future studies. This is the fi rst attempt to conduct an intercomparison of models for the oceanic dispersion of 137Cs from the Fukushima plant.
DISPERSION SIMULATION MODELSNumerical simulations of the dispersion of radionuclides in the ocean basically consist of two
parts: an ocean circulation model and a radionuclide dispersion model. The ocean circulation model provides evolving circulation patterns for the dispersion model, while the dispersion model calculates the movement and spread of radionuclides in the ocean. In this article, we compare results from fi ve groups: the Central Research Institute of Electric Power Industry (CRIEPI), the Japan Atomic Energy Agency (JAEA), the Japan Coastal Ocean Predictability Experiment (JCOPE) group at the Japan Agency for Marine-Earth Science and Technology (JAMSTEC), the Simulation Réaliste de l’Océan Côtier (Sirocco) group from the Observatoire Midi-Pyrénées, Centre National de la Recherche Scientifi que and Toulouse University, and the National Oceanographic and Atmospheric Administration (NOAA) group.
Each group utilized a different set of models (TABLE 1). All of the models have their fi nest regional domain resolution focused on the area close to the nuclear plant, with various grid spacings in both the horizontal and vertical directions. Lateral boundary conditions of the circulation models are typically obtained from larger domain ocean circulation models, with relatively coarse resolutions, into which observed data, such as temperature, salinity, and sea-surface height, are assimilated to provide realistic upper-ocean conditions. With these assimilation schemes, mesoscale eddies and meandering of ocean currents, which are crucial
Five models have been used to estimate the oceanic dispersion of 137Cs from the Fukushima Daiichi nuclear power plant during March and April 2011, following the accident on March 11, 2011. The total discharged
activity of 137Cs is estimated to be 2 to 15 petabequerels. A weak southward current along the Fukushima coast was responsible for the initial transport direction, while mesoscale eddy-like structures and surface-current systems contributed to dispersion in areas beyond the continental shelf. Most of the discrepancies among the models in April are caused by differences in how the mesoscale current structures off the Ibaraki coast are represented.
KEYWORDS: oceanic dispersion simulation, radionuclides, 137Cs, Fukushima Daiichi nuclear power plant, regional ocean simulation, mesoscale eddy
Yukio Masumoto1, Yasumasa Miyazawa1, Daisuke Tsumune2, Takaki Tsubono2, Takuya Kobayashi3, Hideyuki Kawamura3, Claude Estournel4, Patrick Marsaleix4, Lyon Lanerolle5, 6, Avichal Mehra7, and Zulema D. Garraffo8
1 Research Institute for Global Change Japan Agency for Marine-Earth Science and Technology Yokohama, Kanagawa 236-0001, Japan
2 Environmental Science Research Laboratory, Central Research Institute of Electric Power Industry, 1646 Abiko Abiko-shi, Chiba-ken 270-1194, Japan
3 Japan Atomic Energy Agency, 2-4 Shirane Shirakata, Tokai-mura, Naka-gun Ibaraki 319-1195, Japan
4 CNRS, Toulouse University, Laboratoire d’Aérologie, 14 Avenue Edouard Belin F-31400 Toulouse, France
5 Earth Resources Technology, Inc. Laurel, Maryland 20707, USA
6 National Oceanic and Atmospheric Administration Silver Spring, Maryland 20910, USA
7 National Centers for Environmental Prediction/National Weather Service/National Oceanic and Atmospheric Administration Camp Springs, Maryland 20746, USA
8 I.M. Systems Group, Inc. Camp Springs, Maryland 20746, USA
Corresponding author: Yukio Masumoto ([email protected])

ELEMENTS JUNE 2012208
for the radionuclide dispersion in the open ocean, are adequately represented. Tidal currents are also included in several models in order to reproduce realistic spatial–temporal current variations near the coastal regions.
Although most of the groups are conducting dispersion calculations for several radionuclides, such as 131I, 134Cs, and 137Cs, we focus only on 137Cs in this article, since it has a signifi cantly long half-life of ~30 years and is observed in a wide area of the northwestern Pacifi c Ocean. All fi ve groups are now considering both direct discharge and atmospheric deposition in their calculations, but we discuss here only the results without atmospheric deposition.
SOURCE ESTIMATIONThe temporal evolution and amount of radioactivity released to the ocean and atmosphere from the plant are key pieces of information for dispersion simulations. In general, the source conditions are not readily available for this kind of accident, leaving a large uncertainty in the simulated results. One of the main purposes of the oceanic dispersion simulations is, therefore, to estimate the source information, using inversion techniques, as accurately as possible. So far, several estimates of the amount of 137Cs discharged into the ocean have been reported, which are summarized in TABLE 2 and FIGURE 1. Note that the values come not only from peer-reviewed scientifi c papers but also from unreviewed articles.
TEPCO reported that the estimated total amount of 137Cs discharged directly into the ocean through a crack in the concrete wall near the reactor of Unit 2 during April 1–6 was 0.94 petabecquerels (PBq), which is equivalent to about 25 kilocuries (kCi) (TEPCO 2011a). In FIGURE 1, this amount is indicated by a gray bar, assuming that the discharge occurred constantly for fi ve days from April 1. On a few other occasions, TEPCO reported discharges of contami-nated water into the ocean, but those were two to fi ve orders of magnitude smaller in terms of radioactivity than the amount released during April 1–6.
Kawamura et al. (2011) estimated the amount of 137Cs discharged into the ocean (red line in FIG. 1) using radio-activity data measured near the power plant by TEPCO (2011b) (black line in FIG. 1); they assumed that the contaminated water of the observed concentration occu-pied an area of 1.5 km2 in front of the plant and was 1 m
deep. After adjustment to the values reported by TEPCO for the period of April 1–6, a value of 4 PBq was obtained. The time series of the source information thus estimated (red line in FIG. 1) shows two peaks of release at the end of March and the beginning of April, with a magnitude of about 0.4 PBq day-1. After April 7, the discharge diminished exponentially to about 0.001 PBq day-1 at the end of April.
On the other hand, Tsumune et al. (2011) estimated a source function of 137Cs by multiplying by a factor to adjust their model results, with a unit release of the radionuclide, to the observed values, giving a total of 3.5 PBq of 137Cs discharged directly into the ocean (FIG. 1, blue line). They provided a simple scenario for the time evolution of the radionuclide discharge, in which they assumed that the time fl uctuation of the observed radioactivity is associated with dispersion processes after entering the ocean. Indeed, Tsumune et al. (2011) are successful in reproducing a detailed time evolution similar to that observed at several locations along the coast south of the plant, including 137Cs maxima observed on March 30 and April 6 near the plant.
FIGURE 1 Time series of source information for 137Cs. The black line with solid circles is the time series of 137Cs radio-
activity in the open ocean near the Fukushima plant (right scale, in becquerels per liter). The values were obtained by averaging the radioactivity observed by TEPCO at the northern and southern drainage points of the plant. The red and blue lines are the time series of 137Cs released into the ocean as estimated by Kawamura et al. (2011) and Tsumune et al. (2011), respectively (left scale, in petabecquerels per day). The gray bar indicates the 137Cs discharge estimated by TEPCO, assuming a constant discharge between April 1 and 5 (left scale). 1 petabecquerel (PBq) = 1015 Bq
TABLE 1 MODEL SPECIFICATIONS
Model name
Base model
Resolutiona Nesting (parent model) Winds Data
assimilation Tides Integration period Reference
Circulation Dispersion
JAEA Kyoto U./ JMSFb
SEA-GEARNc 1/72° × 1/54° 2-step, (1/24° × 1/18° near Japan, 1/8° × 1/6° North Pacifi c, Kyoto U./JMSFb)
NCEP reanalysis 2d and JMA- MSMe
4D-VAR No March 11–April 30
Kawamura et al. (2011)
CRIEPI ROMSf Passive tracer 1 km 1-step, (1/12° HYCOMg) NuWFASh Included in HYCOM
Yes March 1–May 31
Tsumune et al. (2011)
JCOPET JCOPEi Passive tracer 1/36° 2-step, (1/12° Northwest Pacifi c, 1/4° North Pacifi c, JCOPE2i)
NCEP analysis and JMA-MSM
3D-VAR in JCOPE2
Yes March 21– May 6
Sirocco Siroccoj Passive tracer 600 m 1-step, (NCOMk) ECMWF forecastl Included in NCOM
Yes March 11–to present
Toulouse University (2011)
NOAA ROMSf Passive tracer 1 km 1-step, (NCOMk)) US Navy’s COAMPSm
(via NCOM)
Included in NCOM
Yes March 10– June 27
a The fi nest grid spacing is indicated, if grid system is variable in space. b Kyoto University and Japan Marine Science Foundation (Ishikawa et al. 2009). c Kobayashi et al. (2007). d Kanamitsu et al. (2002). e Japan Meteorological Agency – Meso-Scale Model. f Regional Ocean Modeling System (Shchepetkin and McWilliams 2005). g Hybrid Coordinate Ocean Model (http://hycom.org/). h Numerical Weather Forecasting and Analysis System (Hashimoto et al. 2010). i Japan Coastal Ocean Prediction Experiment (Miyazawa et al. 2009). j http://sirocco.omp.obs-mip.fr/outils/Symphonie/Produits/Japan/SymphoniePreviJapanDescript.htm/. k The U.S. Navy Operational Global Ocean Model (Barron et al. 2004). l European Centre for Medium-Range Weather Forecasts (http://www.ecmwf.int/). m Coupled Ocean/Atmosphere Mesoscale Prediction System (http://www.nrlmry.navy.mil/coamps-web/web/home)

ELEMENTS JUNE 2012209
Several other estimates, including those by the Sirocco, NOAA, and JCOPE groups, were basically obtained from numerical models using the TEPCO data. The values obtained by Sirocco and NOAA, about 3 to 4 PBq of 137Cs discharged directly into the ocean, are similar to those derived by Kawamura et al. (2011) and Tsumune et al. (2011). The second report from the Institut de Radioprotection et de Sûreté Nucléaire (IRSN) on the impact of radioactivity released from the plant on the marine environment (IRSN 2011a) estimated the amount of radioactivity discharged until April 11 to be 2.3 PBq, which is somewhat smaller than other estimates. Another IRSN report shows a signifi cantly large value of 27 PBq of 137Cs (IRSN 2011b), which seems to have been derived by simple interpolation of sparsely observed data and assuming constant radioactivity within a relatively thick surface mixed-layer in March. A relatively large estimate of 14.8 PBq from JCOPE is mainly due to relatively coarse horizontal resolution with a simple boundary condition, in which the simulated 137Cs concentration at the sea surface in front of the plant is forced to adjust toward the observed value.
Most of the above estimates rely on radioactivity measure-ments by TEPCO near the nuclear plant. Errors in the TEPCO data, if any, can propagate into these estimates directly. Another factor affecting the value of estimated source information is the vertical distribution of radionu-clides, especially in the oceanic surface layer. The surface mixed-layer defi ned by temperature or water density can be relatively thick in March due to winter cooling at the sea surface and subsequent vertical convective motion. We do not know at this stage, however, whether or not the radionuclides are also evenly distributed vertically within the surface mixed-layer. In this regard, the values in TABLE 2 should be considered to have large uncertainties.
DISPERSION SIMULATIONSWith the above-mentioned source information for simu-lating the dispersion of radionuclides in the ocean, time series of the three-dimensional distribution of 137Cs were obtained from each model. In this section, we compare these results, focusing on the surface distribution of 137Cs in the coastal and continental shelf regions during the fi rst two months after the accident. We present 10-day averaged surface horizontal-velocity fi elds and 137Cs distributions for two periods, from March 22 to 31 (FIG. 2) and from April 21 to 30 (FIG. 3). These periods correspond, respec-tively, to a time of southward dispersion along the Fukushima coast and to a time of gradual dispersion toward the margin of the continental shelf. Monitoring of the radionuclides was conducted by the Ministry of Education, Culture, Sports, Science and Technology (MEXT) and
TEPCO during March and April, 2011 (MEXT 2011; TEPCO 2011b), and comparisons of the simulated results with the observations are also made for the two periods.
March 22–31A lack of observational data prevents us from providing a detailed description of the 137Cs distribution at the end of March. The monitoring observations, however, indicate high concentrations of 137Cs along the coast, near the nuclear plant (FIG. 2G). The data along a line 30 km offshore from the coast also show 137Cs contamination, with a magnitude of about 10 to 15 Bq L-1. These observed values are signifi cantly higher than those observed in Japanese coastal waters before the accident, a typical value of which is about 0.003 Bq L-1 (Kasamatsu and Inatomi 1998).
In general, the surface current fi elds in all the models show a strong eastward or northeastward fl ow—the Kuroshio current—along the coast of Japan south of Inubo Peninsula. The current separates from the coastal area off Inubo Peninsula. The models also show a broad southward fl ow, with a speed of 0.2 to 0.5 m s-1, in the region east of 141.5° E and north of the Kuroshio current (FIG. 2A-E). All models demonstrate a weak southward fl ow, with a speed of 0.1 m s-1 or less, along the coast in front of the Fukushima plant. This southward current along the coast is responsible for the southward distribution of 137Cs at the end of March. The southward fl ow along the coast can be traced back up to 38° N in all the models, while the speed of the fl ow varies among the models and, in the JCOPET model, is partially associated with a cyclonic circulation off the coast of Fukushima. The local fl ow pattern in this region is suscep-tible to wind forcing, which shows higher temporal vari-ability associated with synoptic weather disturbances.
All the models fail to simulate the relatively high concen-tration of 137Cs along a line 30 km offshore. Since the results shown here are the dispersions of 137Cs released directly from the plant, it is reasonable to expect that this offshore contamination at the end of March was due to deposition from the atmosphere. This is consistent with the conclusion of Tsumune et al. (2011), who showed the importance of deposition from the atmosphere by checking the 131I/137Cs activity rati o.
Another important surface current pattern is eddy-like structures off the coast of Ibaraki in the region between 36.7° N and the Kuroshio current; in this region, the differ-ences among the models are rather large. A clear example is an anticyclonic circulation centered at 36.4° N, 141° E in the CRIEPI result. A similar eddy structure can also be seen in other model results, but it is relatively weak and shifted slightly to the east in the JCOPET model, and it appears as a part of a strong dipole eddy structure in the
TABLE 2 ESTIMATED AMOUNT OF 137CS DISCHARGED DIRECTLY INTO THE OCEAN
Institution Period 137Csa Method Reference
TEPCO April 1~April 6 0.94 Based on observed data Media release
IRSN Up to April 11 2.3 Based on observed data IRSN (2011a)
IRSN March 25~July 18 27 Simulated results with observed boundary conditions IRSN (2011b)
JAEA March 21~April 30 3.58 Based on observed data Kawamura et al. (2011)
CRIEPI March 26~May 31 3.54 Unit release experiment with adjustment to observed values
Tsumune et al. (2001)
JCOPE March 21~May 6 14.8 Based on observed data
NOAA March 10~June 27 3.6 Based on observed data (data from Kawamura et al. 2011)
Sirocco March 20~June30 4.2 Inverse model based on observed data
a In petabecquerels (1 PBq = 1015 Bq)

ELEMENTS JUNE 2012210
JAEA model. The Sirocco and NOAA models show relatively broad southward fl ow off Ibaraki. Satellite images of the sea-surface temperature distribution indicate a weak, warm-core, eddy-like feature off the coast of Ibaraki at the end of March and in early April (not shown). The 137Cs concentration had not reached the region of these eddies by the end of March.
An ensemble mean of the fi ve model results, giving equal weight in the averaging (FIG. 2F), captures most of the above-mentioned velocity and 137Cs distributions. It is rather diffi cult, however, to show that the ensemble mean fi eld is better at representing the observed distribution, since the observational data are so sparse and limited to a region close to the plant.
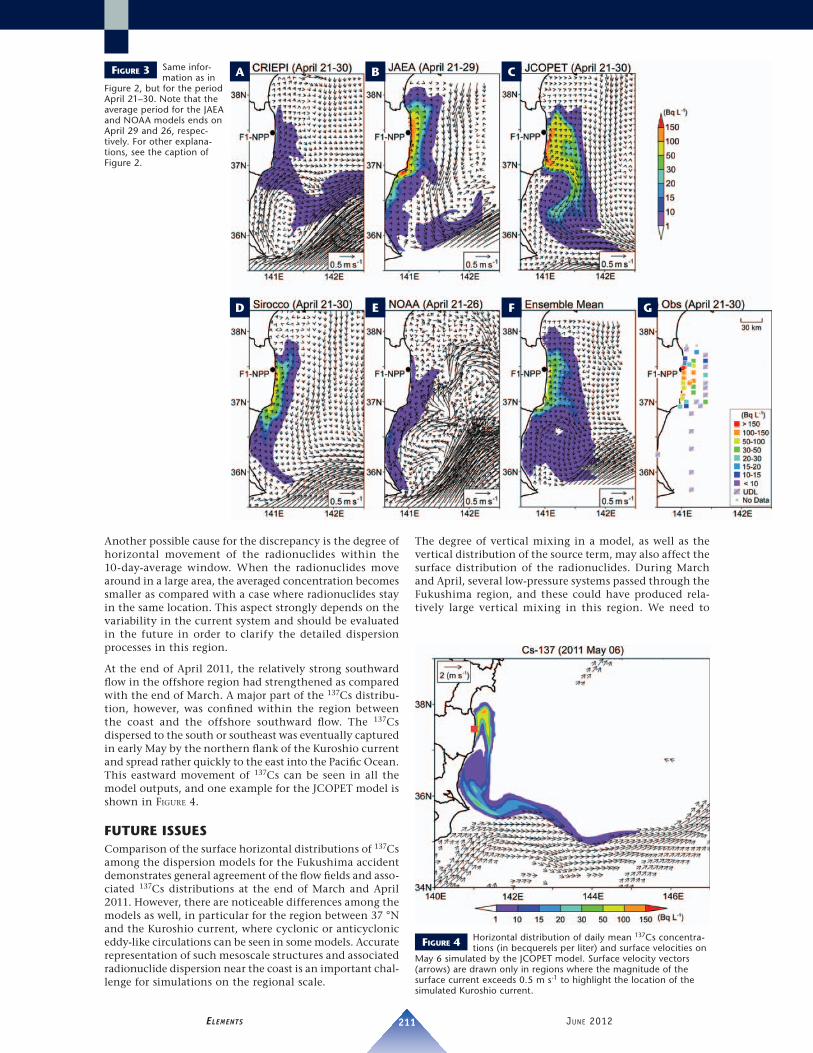
April 21–30The high 137Cs concentration had spread offshore by the end of April, while the radioactivity along the line 30 km offshore diminished slightly to a value of around 10 Bq L-1 or less, except for two locations, where values of more than 20 Bq L-1 were detected (FIG. 3G). New monitoring stations were installed in the region off Ibaraki, but the observed values were all under the detection level of about 10 Bq L-1 for this time period.
All the models show southward or southeastward disper-sion of the 137Cs in the latter part of April (FIG. 3A–E). The offshore dispersion seems to be associated with a near-shore, northeastward surface fl ow broadly distributed near the power plant in all models. The southward or south-eastward movements of 137Cs in the offshore region south of 37° N, however, show large differences among the models. While the anticyclonic circulation brings the 137Cs distribution southeastward in the CRIEPI and JCOPET
models, the JAEA, Sirocco, and NOAA results show south-ward dispersion along the coast associated with a weak southward fl ow near the coast. The NOAA results indicate strong eddy features beyond the coastal region, but the radionuclide distribution was not affected by the eddies at the end of April. The differences among the models suggest that the surface circulations in the region between 37° N and the Kuroshio current are susceptible to mesoscale eddy activity and to variability of the Kuroshio, and the modeled Kuroshio current is in turn strongly affected by data- assimilation processes in the larger domain models. In addition, the radionuclide distribution is affected by velocity fi elds not only during April 21–30 but also before that period. Again, the ensemble mean fi elds capture reasonably well the main features of the 137Cs distribution and the velocity characteristics off Fukushima and Ibaraki (FIG. 3F).
In addition to the mesoscale eddy activity, the magnitude of horizontal and vertical mixing processes in the ocean may strongly infl uence the 137Cs distribution. For example, the CRIEPI and NOAA results show relatively weak values of less than 10 Bq L-1 in most of the region affected by radionuclide contamination as compared with other model results. One possible reason for this discrepancy could be differences in the magnitude of the vertical diffusivity; in general, the larger the vertical diffusivity, the weaker the surface concentration of the 137Cs. However, it is not straightforward to deduce this effect in a simple compar-ison among the models in FIGURES 2 AND 3, since each model uses different schemes for advection and diffusion as well as different diffusion coeffi cients.
FIGURE 2 Horizontal distribution of 137Cs and horizontal
current velocity at the sea surface (0–1 m below the sea surface for (A) CRIEPI model, (B) JAEA model, (C) JCOPET model, (D) Sirocco model, and (E) NOAA model. (F) Ensemble mean weighting the fi ve models, averaged over 10 days from March 22 to 31. Note that the averaged period for the CRIEPI model is from March 26 to 31, since their discharge scenario started on March 26. (G) Observed horizontal distribution of 137Cs averaged over the same 10-day period. Current speeds are given by the lengths of the arrows (see scale). Radioactivity concentrations are given in becquerels per liter (Bq L-1). UDL = below detection limit; F1-NPP = Fukushima Daiichi nuclear power plant
A B C
D E F G
ELEMENTS JUNE 2012211
Another possible cause for the discrepancy is the degree of horizontal movement of the radionuclides within the 10-day-average window. When the radionuclides move around in a large area, the averaged concentration becomes smaller as compared with a case where radionuclides stay in the same location. This aspect strongly depends on the variability in the current system and should be evaluated in the future in order to clarify the detailed dispersion processes in this region.
At the end of April 2011, the relatively strong southward fl ow in the offshore region had strengthened as compared with the end of March. A major part of the 137Cs distribu-tion, however, was confi ned within the region between the coast and the offshore southward fl ow. The 137Cs dispersed to the south or southeast was eventually captured in early May by the northern fl ank of the Kuroshio current and spread rather quickly to the east into the Pacifi c Ocean. This eastward movement of 137Cs can be seen in all the model outputs, and one example for the JCOPET model is shown in FIGURE 4.
FUTURE ISSUESComparison of the surface horizontal distributions of 137Cs among the dispersion models for the Fukushima accident demonstrates general agreement of the fl ow fi elds and asso-ciated 137Cs distributions at the end of March and April 2011. However, there are noticeable differences among the models as well, in particular for the region between 37 °N and the Kuroshio current, where cyclonic or anticyclonic eddy-like circulations can be seen in some models. Accurate representation of such mesoscale structures and associated radionuclide dispersion near the coast is an important chal-lenge for simulations on the regional scale.
The degree of vertical mixing in a model, as well as the vertical distribution of the source term, may also affect the surface distribution of the radionuclides. During March and April, several low-pressure systems passed through the Fukushima region, and these could have produced rela-tively large vertical mixing in this region. We need to
FIGURE 3 Same infor-mation as in
Figure 2, but for the period April 21–30. Note that the average period for the JAEA and NOAA models ends on April 29 and 26, respec-tively. For other explana-tions, see the caption of Figure 2.
FIGURE 4 Horizontal distribution of daily mean 137Cs concentra-tions (in becquerels per liter) and surface velocities on
May 6 simulated by the JCOPET model. Surface velocity vectors (arrows) are drawn only in regions where the magnitude of the surface current exceeds 0.5 m s-1 to highlight the location of the simulated Kuroshio current.
A B C
D E F G

ELEMENTS JUNE 2012212
complete systematic sensitivity analyses and more detailed model intercomparisons in order to resolve these issues.
In this article, we have focused only on the dispersion of the 137Cs discharged directly from the Fukushima plant into the ocean. However, 137Cs was also deposited as atmo-spheric fallout on the sea surface over a wide region. Investigations of the relative importance of these two sources and the distribution of total 137Cs concentration in the ocean are now being undertaken by several groups. Kawamura et al. (2011), for example, have discussed the noticeable impact of atmospheric deposition of 131I over a large area of the northwestern Pacifi c. NOAA’s simulations in a larger area of the northwestern Pacifi c, including a component of atmospheric deposition of 137Cs, also agree with this assessment. Tsumune et al. (2011) pointed out that the contribution by direct release to the observed 137Cs concentrations near the Fukushima coast in the latter part of March and in April was larger than that resulting from atmospheric deposition. Further intercomparison studies on the impact of atmospheric deposition are necessary. Other possible contributors to the contaminated water, such as rivers and groundwater, should also be taken into account.
Another important point for accurate dispersion calcula-tions is to consider ocean processes that scavenge radionu-clides, including adsorption onto particulates and absorption due to biological processes. At present, only a few groups are trying to integrate these processes into their models. The incorporation of better-performing models of scavenging mechanisms into dispersion simulations in the ocean will be essential.
CONCLUDING REMARKSWe have reviewed the present status of oceanic dispersion simulations of radionuclides discharged from the Fukushima nuclear plant. There are large differences in the
models and model settings among the research groups, leading to different results for ocean currents near Fukushima and, hence, for the distributions of radionu-clides such as 137Cs. At the moment, we cannot say that one model is better than another. Rather, we need to be able to explain the discrepancies and reduce the overall uncertainty of the dispersion simulations. The International Atomic Energy Agency is now coordinating a more detailed model intercomparison in order to facilitate this research. Insights into oceanic dispersion gained through such inter-national efforts will facilitate implementation of more predictive models.
According to the TEPCO data obtained near the Fukushima plant, 137Cs radioactivity at the end of April 2012 was of the order of 1 Bq L-1. Results from recent observations and numerical models indicate that the distribution of 137Cs has expanded and shifted to the east into a large portion of the North Pacifi c Ocean, while the radioactivity in most of the area is of the order of, or below, 0.01 Bq L-1. In order to describe what happened and is happening in terms of the dispersion of radionuclides from the Fukushima plant, research-based, accurate observations and analyses in a wide area of the North Pacifi c Ocean for more than a few decades are needed; as well, detailed comparisons and a synthesis of the simulated results and observations are strongly required.
ACKNOWLEDGMENTSYM and YM thank Drs. Sergey M. Varlamov, Ruochao Zhang, Toshimasa Doi, and Toru Miyama for their support of JCOPE simulations. LL is deeply grateful for support from Dr. John Cortinas, Dr. Frank Bub, Mr. Robert Daniels, Mr. Richard Patchen, and Ms. Hong Lin for NOAA disper-sion simulations.
REFERENCESBarron CN, Kara AB, Hurlburt HE, Rowley
C, Smedstad LF (2004) Sea surface height predictions from the Global Navy Coastal Ocean Model (NCOM) during 1998–2001. Journal of Atmospheric and Oceanic Technology 21: 1876-1894
Hashimoto A, Hirakuchi H, Toyoda Y, Nakaya K (2010) Prediction of regional climate change over Japan due to global warming (Part 1) – Evaluation of Numerical Weather Forecasting and Analysis System (NuWFAS) applied to a long-term climate simulation. CRIEPI report N10044, 22 pp (in Japanese)
IRSN (2011a) Impact on marine environ-ment of radioactive releases resulting from the Fukushima-Daiichi nuclear accident. Institut de Radioprotection et de Sûreté Nucléaire, 9 pp, www.irsn.fr/EN/news/Pages/201103_seism-in-japan.aspx
IRSN (2011b) Update: Impact on the marine environment of radioactive releases following the nuclear accident at Fukushima Daiichi. Institut de Radioprotection et de Sûreté Nucléaire, May 13, 2011, 16 pp, www.irsn.fr/EN/news/Pages/201103_seism-in-japan.aspx
Ishikawa Y, Awaji T, Toyoda T, In T, Nishina K, Nakayama T, Shima S, Masuda S (2009) High-resolution synthetic monitoring by a 4-dimen-sional variational data assimilation system in the northwestern North
Pacifi c. Journal of Marine Systems 78: 237-248
Kanamitsu M, Ebisuzaki W, Woollen J, Yang S-K, Hnilo JJ, Fiorino M, Potter GL (2002) NCEP–DEO AMIP-II Reanalysis (R-2). Bulletin of the American Meteorological Society 83: 1631-1643
Kasamatsu F, Inatomi Y (1998) The effec-tive environmental half-life of 90Sr and 137Cs in coastal seawaters of Japan. Journal of Geophysical Research 103: 1209-1217
Kawamura H, Kobayashi T, Furuno A, In T, Ishikawa Y, Nakayama T, Shima S, Awaji T (2011) Preliminary numerical experiments on oceanic dispersion of 131I and 137Cs discharged into the ocean because of the Fukushima Daiichi Nuclear Power Plant disaster. Journal of Nuclear Science and Technology 48: 1349-1356
Kobayashi T, Otosaka S, Togawa O, Hayashi K (2007) Development of a non-conservative radionuclides disper-sion model in the ocean and its applica-tion to surface cesium-137 dispersion in the Irish Sea. Journal of Nuclear Science and Technology 44: 238-247
MEXT (2011) Monitoring information of environmental radioactivity level. http://radioactivity.mext.go.jp/en/monitoring_around_FukushimaNPP_sea/
Miyazawa Y, Zhang R, Guo X, Tamura H, Ambe D, Lee J-S, Okuno A, Yoshinari H, Setou T, Komatsu K (2009) Water mass
variability in the western North Pacifi c detected in a 15-year eddy resolving ocean reanalysis. Journal of Oceanography 65: 737-756
Shchepetkin AF, McWilliams JC (2005) The regional ocean modeling system (ROMS): a split-explicit, free-surface, topography-following-coordinate oceanic model. Ocean Modelling 9: 347-404
TEPCO (2011a) Fukushima Daiichi Nuclear Power Station Unit 2: Countermeasures to stop the outfl ow of contaminated water and the water amount fl owed out into the sea. Tokyo Electric Power Company, press release April 21, 2011, www.tepco.co.jp/en/press/corp-com/release/11042103-e.html
TEPCO (2011b) Detection of radioactive materials from seawater near Fukushima Daiichi Nuclear Power Station, www.tepco.co.jp/en/nu/fukushima-np/f1/index2-e.html
Toulouse University (2011) http://sirocco.omp.obs-mip.fr/outils/Symphonie/Produits/Japan/SymphoniePreviJapan.htm
Tsumune D, Tsubono T, Aoyama M, Hirose K (2011) Distribution of oceanic 137Cs from the Fukushima Dai-ichi Nuclear Power Plant simulated numeri-cally by a regional ocean model. Journal of Environmental Radioactivity (in press)