occupational shortages in - policy matters ohio · 2017-04-03 · policy matters ohio occupational...
TRANSCRIPT

OOOCCCCCCUUUPPPAAATTTIIIOOONNNAAALLL
SSSHHHOOORRRTTTAAAGGGEEESSS IIINNN HHHEEEAAALLLTTTHHH CCCAAARRREEE AAANNNDDD
MMMAAANNNUUUFFFAAACCCTTTUUURRRIIINNNGGG
A Report From
Policy Matters Ohio
Jon Honeck, Ph.D.
July, 2008

Author Jon Honeck is a Senior Researcher in the Columbus office of Policy Matters Ohio. He writes about taxation, workforce development, international trade, and economic development policy. He has testified numerous times about tax and budget policies in the Ohio legislature, and is participating in workforce advisory groups and the Ohio Workforce Coalition to improve training and employment outcomes for Ohio's adult workforce. Before coming to Policy Matters, he researched and drafted employment and economic development legislation for the Ohio Legislative Service Commission. Jon has a Ph.D. in political science from the University of Wisconsin-Madison and a B.A. from Miami University. Acknowledgements We are grateful for the support of the KnowledgeWorks Foundation of Cincinnati, Ohio, for the initial phase of this research that analyzed Occupational Employment Statistics data. The opinions or conclusions expressed in the report are those of Policy Matters Ohio and do not necessarily reflect the views of the KnowledgeWorks Foundation. Mike Newell, an intern from Ohio State University, played a invaluable role in analyzing data on apprenticeships. As always, I am grateful for the careful editing and advice of Amy Hanauer, our Executive Director, and Zach Schiller, our Research Director. Any errors or omissions in the report are the sole responsibility of the author. Policy Matters Ohio, the publisher of this study, is a non-profit, nonpartisan statewide research institute dedicated to bridging the gap between research and policy in Ohio. Policy Matters seeks to broaden the debate about economic policy in Ohio by providing quantitative and qualitative analysis of important issues facing working people in the state. Other areas of inquiry for Policy Matters have included unemployment compensation, wages, education, housing, energy, tax and budget policy, and economic development. All reports are available at www.policymattersohio.org.

Policy Matters Ohio Occupational Shortages
Executive Summary
Despite a weak labor market, many Ohio employers contend that they have difficulty finding qualified workers in key occupations. This report evaluates the evidence for occupational shortages in health care and manufacturing in Ohio and analyzes their likely causes. The report also reviews state and national studies of occupational shortages and concludes that resolving workforce development challenges is rarely just a straightforward matter of increasing training program capacity. While employer concerns about skill deficits (particularly among entry-level workers) must be taken seriously, occupational shortages are inseparable from employer practices that influence workforce recruitment, retention, and employees’ attitudes toward skill development. The “nursing crisis” is an example of the complexity of these issues. The state must focus its efforts on employers that are actively addressing job quality issues and help them develop a comprehensive, long-term human resource strategy that provides meaningful career opportunities for workers. The identification of occupational shortages can be difficult, particularly in manufacturing, where overall employment levels have been declining for nearly a decade. No single indicator is determinative, so the study looks for two primary guides over the 2004 to 2007 period: growth in the number of jobs in an occupation and strong wage gains. We supplement this information with training completion and licensing data for some occupations, analysis of employment trends in specific sectors, and the results of other workforce reports, including studies from Illinois and Indiana, two Midwestern states that have established industry sector training strategies. The secondary literature makes it clear that (1) the causes of many of the problems we face in Ohio are well known and potential solutions are available, even if they are difficult; and (2) we have to approach the issue of occupational shortages with the broadest possible understanding of the labor market forces at work. We found the strongest evidence for occupational shortages in the health care sector. Employment in health care has grown rapidly. The study identified ten health care occupations that experienced job growth of over 400 positions statewide with increases in the occupational real median wage between 2004 and 2007. These occupations were: • Cardiovascular technologists and technicians • Dental hygienists • Medical and clinical laboratory technologists • Occupational health and safety specialists • Pharmacists • Pharmacy technicians • Physical therapists • Radiologic technologists and technicians • Registered Nurses • Surgical technologists. In a worrisome trend, some of the health care occupations that experienced the strongest growth also had declining real median wages. These jobs tended to be healthcare support positions that required little or no classroom training. This trend was exemplified by the home health aide

Occupational Shortages Policy Matters Ohio
occupation, which grew by 56 percent in just three years by adding 17,100 jobs. The real median wage in this occupation fell by 5.6 percent. The immediate public policy challenge for these low-skilled, low-paid positions is to address job quality issues in order to improve recruitment, retention, and employees’ motivation level to learn new skills. The long-term challenge is to develop a credentialing system to support upward mobility, as acknowledged by a 2004 report from the Ohio Health Care Advisory Council. Even higher-skilled positions in health care have problems with job quality as evidenced by many studies of the “nursing crisis.” The shortage of registered nurses has two sides: constraints on training program capacity, and retention of employed nurses. The constraints on training capacity are generally due to a combination of factors: faculty shortages, limited clinical sites, and high program costs. On the retention side, high turnover and vacancy rates at hospitals due to long hours and stressful working conditions can lead to burnout and premature exit from the profession. It is clear that employers have to work on both issues in order to fully address the nursing crisis. In manufacturing, we analyzed shop floor production jobs, installation and repair positions, and engineering and technical occupations. We did not find clear evidence of shortages except in a few machinery repair and engineering occupations. Twenty production occupations grew by at least 500 positions statewide, but only two small occupations, bindery workers and metal-refining furnace operators, experienced real wage gains. Median wage data were less useful in analyzing production jobs, however, because wage levels were undoubtedly influenced by retirements and buyouts among experienced, well-paid employees and the outright closure of large, unionized facilities. In the context of many national, state, and local reports that find employers have difficulty filling skilled production jobs, the best evidence for production occupation shortages in Ohio lies in a dramatic decline in participation in apprenticeships and public sector training programs. For example, the number of machinists grew by over 2,000 between 2004 and 2007. Nonetheless, the number of individuals enrolled in machinist apprenticeship programs fell by over half between 2002 and 2008, from 478 to 242. The number of students completing machining programs at career and technical centers and joint vocational schools fell from 136 to 47 between 2002 and 2006. Enrollment in tool and die apprenticeships fell by nearly two-thirds. Welding and machine tool setter programs also experienced significant declines in apprenticeship enrollment. One of the major challenges for the Ohio Skills Bank program will be to understand the alternative training methods that are being used by employers, such as on-line classes or on-the-job training, and whether these methods are effective substitutes for traditional approaches. Private training institutions play an important role in welding, for example. Three installation and repair occupations showed wage gains and employment growth associated with skills shortages. The occupation most closely related to manufacturing, industrial machinery mechanic, grew by over 2,500 positions. Despite strong growth, apprenticeship enrollment in this occupation declined by over two-thirds between 2002 and 2008. Occupations that involve the repair of controls and valves, and the electrical repair of commercial and industrial equipment also grew.

Policy Matters Ohio Occupational Shortages
Some engineering occupations also experienced strong employment growth. The aerospace sector is one of the few manufacturing industries that had employment growth in recent years after bottoming out in 2003. Other bright spots in manufacturing are biomedical equipment production and pharmaceuticals. These sectors, along with medical research, may be responsible for a portion of the increased number of chemists, medical scientists, and regulatory compliance specialists in the state. Jobs in the separating and filtering machine operator occupation, a biotechnology-related production job, grew rapidly. Both national and state-level studies of workforce development in manufacturing make it clear that the sector has multiple problems with recruitment, training, and retention. It would be surprising if the Ohio Skills Bank consortia did not find some of these problems in Ohio. The sector has two “image” problems that it must overcome to improve recruitment. First, production jobs are viewed, most often incorrectly, as dirty and dull. Second, years of employment declines and large layoffs have taken a toll on public confidence in the long-term viability of the sector, making individuals look elsewhere for careers. Clearly, there is a tremendous amount of work to be done in realigning the educational and training system with the needs of manufacturing. In particular, we need more research on how to reemploy laid-off manufacturing workers so they can utilize their existing skills.
Occupational Shortages Policy Matters Ohio
Introduction
Workforce development is taking a more prominent role in Ohio’s economic development policy under the Strickland Administration. This summer, state government will implement a new program called the “Ohio Skills Bank” to integrate training and education programs with employers’ needs in specific economic sectors. The goals are to create win-win scenarios in which individuals receive relevant training in occupations that are in demand and to align training programs to meet changing employer needs. The Skills Bank will use a “career pathways” methodology that asks employers and training institutions to map the skills and competencies that allow individuals to move up within a set of related occupations. This approach is most well-developed in the health care sector, where state licensing rules and well-developed national standards create clear requirements for climbing a career ladder. Ohio is a latecomer to sector skills strategies. The Governor’s Workforce Policy Board and the KnowledgeWorks Foundation provided seed funding for five career pathways pilot sites in health care and one in manufacturing, but these were local experiments. Ohio has not had an integrated sector skills strategy until now. Most of Ohio’s neighboring states have existing sector skills programs.1 States around the country are experimenting with such strategies to increase the competitiveness of key industries and create better career opportunities for individual workers. Ohio is devoting comparatively few additional resources to this effort because of the state’s dire fiscal situation, although the project is still in the planning stages. Using WIA discretionary funds, the Ohio Board of Regents (OBOR) is providing approximately $60,000 to each of the state’s twelve economic development regions in the spring and summer of 2008.2 OBOR is planning a second round of funding that will begin in September and will provide $80,000 per region through June 2009. Other states have put significant resources into these efforts. Illinois devoted $18 million to support the Critical Skills Shortages Initiative.3 Indiana designated $23 million for its Strategic Skills Initiative begun in 2005. Michigan started with $2 million in public and philanthropic resources.4 Pennsylvania allocated $20 million for nine economic sectors -- $5 million for planning and $15 million for incumbent worker training.5
1 Illinois announced its Critical Skills Shortages Initiative in October 2003 (planning grants started in 2004), Indiana’s Sector Skills Initiative began in 2005, Michigan Regional Skills Alliances in 2004, and Pennsylvania 2005. 2 Information provided by Tom Fellrath, Director, Ohio Skills Bank, Ohio Board of Regents, telephone interview on 7-1-08. 3 Illinois Department of Commerce and Economic Opportunity press release, “Gov. Blagojevich Highlights Largest Three-Month Consecutive Job Gain in Seven Years,” May 18, 2006. Available at http://www.commerce.state.il.us/dceo/Print/default.htm?uid=%7B34B9F464-21EF-452D-95EC-A937597B6CE6%7D. 4 Oldmixon, Sarah. “State Sector Strategies: Regional Solutions to Worker and Employer Needs.” National Governor’s Association Center for Best Practices, National Economic Development Law Center, Corporation for a Skilled Workforce. (November 2006) 5 Id., p. 8.
1 www.policymattersohio.org

Policy Matters Ohio Occupational Shortages
Underlying the push to implement sector skills strategies are employers’ assertions that the country faces a “skills shortage,” i.e., a lack of qualified workers even in industries like manufacturing with shrinking employment levels. For example, a report from the National Association of Manufacturers found that most employers reported at least moderate problems filling positions.6 In the health care sector, employers’ complaints of shortages in nursing and other skilled positions have been well publicized, and academics and industry experts have devoted a great deal of time to defining and explaining shortages. Some observers contend that employers’ complaints are not just a response to isolated shortages or cyclical trends that will be resolved through the individual efforts of training institutions, but instead reflect a general failure of the American labor market to match skilled labor with changing employer demands. A recent report commissioned by The Workforce Alliance makes the case that there will be a growing skills gap even for moderately-skilled jobs that require a two-year advanced degree or other post-secondary education.7 The findings are based on evidence of strong wage gains and projected expansion in many middle-tier occupations that require some postsecondary education but less than a four-year degree. It is important to note, however, that research has cast doubt on the notion of an economy-wide mismatch of general cognitive skills and education levels with employment demand, and on the corollary that economy-wide wage gains would necessarily result from general increases in education levels. A review of academic literature on education and work published by the Economic Policy Institute noted that U.S. education levels increased dramatically in the 1960s and 1970s just as real wages began to stagnate.8 “Wages may be more responsive to institutional reforms that more directly affect compensation or economic activity – measures such as maintaining the value of the minimum wage, union protections, and strong macroeconomic growth – than to changes in education or skill levels,” the review concluded.9 In order to become useful, the concept of skills shortages has to be applied within a specific context – an occupation, an industry sector, a place, or a demographic group. For example, a microeconomic study of the low-wage labor market in the San Francisco area noted that basic skills deficits existed among low-wage workers and that these deficits made it difficult for some employers to recruit even in periods of high unemployment.10 Almost all “low-skilled” jobs in fact required English, math, problem-solving, and communication skills. The study also noted that institutional factors were almost as important as skills in determining wage levels.11
6 National Association of Manufacturers. 2005 Skills Gap Report: A Survey of the American Manufacturing Workforce. Washington, DC. (2005) 7 Holzer, Harry, and Lerman, Robert. America’s Forgotten Middle Skill Jobs: Education and Training Requirements in the Next Decade and Beyond. (November 2007). Washington, D.C.: The Workforce Alliance Available at www.workforcealliance.org, pp. 4-5. 8 Michael J. Handel, Worker Skills and Job Requirements: Is There a Mismatch? Washington, D.C.: Economic Policy Institute, 2005, p. 78. 9 Id. 10 Maxwell, Nan L. The Working Life: The Labor Market for Workers in Low-Skill Jobs. Kalamazoo, MI Upjohn Institute for Employment Research, 2006. 11 Id., p. 69.
www.policymattersohio.org 2
Occupational Shortages Policy Matters Ohio
The issue of occupational skills shortages in Ohio has to be addressed with similar caution and awareness of nuances. At first glance, the overall picture of labor market conditions in Ohio is of weak demand. The number of non-agricultural payroll jobs in Ohio remains 228,000 below its peak in June 2000.12 Within this overall picture of stagnation, however, is a dynamic rearrangement of the economy. Manufacturing employment is in long-term decline, having lost approximately 275,000 jobs since its most recent peak in the late 1990s, while health care and other service occupations have grown significantly. These shifts have powerful impacts on patterns of occupational growth. It was not just production (shop floor) occupations that were impacted by deindustrialization. An analysis by the Akron Beacon Journal showed that the number of Ohio jobs in management occupations declined by 27 percent between 2000 and 2007.13 The number of production jobs fell by 19 percent.14 Government employment projections through 2014 show production occupations as declining or stagnant, with most job openings due to replacement demand. Nursing and other health care occupations are projected to grow dramatically.15 Labor market adjustment is not automatic. Workers’ choices of occupational fields and decisions about training are influenced by many factors, and separating the role of skills shortages from other labor market forces is not always straightforward. There are many reasons that employers may have trouble recruiting and retaining workers. Most notably, working conditions, compensation, and fringe benefits (e.g., health care and retirement) play key roles in influencing workers’ perceptions about individual employers and which occupations have the best career options. Employment stability and opportunities for growth are also important. For example, as explained below, there is strong evidence that one element of the manufacturing sector’s recruitment problems is a perception of long-term instability and decline. In health care, stressful working conditions for nurses and other health care professions can lead to high turnover rates and many individuals leaving the profession. Employers themselves sponsor a substantial amount of training, although it is skewed toward professional and management positions.16 Nonetheless employers can derive significant benefits from training their low-wage employees if such programs are designed carefully with strong links between employees’ achievements and their advancement in the workplace. Employers’ ability to reward their workers’ training efforts influences their level of enthusiasm and determination in learning new skills.
12 On a seasonally adjusted basis using Current Employment Statistics survey data for total nonfarm payroll employment for June 2000 and preliminary estimates for April 2008. 13 Knox, David. “Bosses join the unemployment line: Analysis finds management positions cut more than any other job group,” and accompanying table, “Ohio occupation trends: How jobs counts have changed since 2000 and annual earnings in 2007.” Akron Beacon Journal. May 25, 2008. Accessed 5-27-08. Available at http://www.ohio.com/news/top_stories/19244304.html?page=all&c=y 14 Id. 15 Ohio Department of Job and Family Services. “2014 Ohio Job Outlook,” Available at http://lmi.state.oh.us/proj/OhioJobOutlook.htm 16 Ahlstrand, Amanda L., Bassi, Laurie J., and McMurrer, Daniel P. Workplace Education for Low-Wage Workers. Kalamazoo, MI: W.E. Upjohn Institute for Employment Research, 2003, p. 2.
3 www.policymattersohio.org

Policy Matters Ohio Occupational Shortages
Unfortunately, when the goal is long-term education, working adults can encounter many obstacles that will impede or hinder degree attainment. The typical scenario for a low-income adult is to take one or two classes at a time, usually at night or on the weekends, while balancing school with family responsibilities. Under these circumstances of part-time enrollment, the time it takes to complete a degree or certificate becomes stretched out over years, and multiple challenges take their toll on degree completion rates. Nationally, only one-third of students at community colleges attain a degree or certificate within five years.17 For these reasons, there is growing push for “stackable certificates” that help adult learners break an educational pathway in manageable steps. Best practice models combine remediation in basic academic skills with occupational (technical) training and the opportunity to receive academic credits.18 Employer engagement can help change these odds if it is combined with flexibility and creativity on the part of training institutions and other organizations that provide support and guidance for adults. Employers’ efforts to provide paid work-release for classes, hold classes at the worksite, reimburse employees’ tuition costs, and reward employees’ efforts to develop skills can make a large difference. Unfortunately, employers may not always see the gains from supporting training or aligning their internal requirements. With so much complexity, this paper advocates taking the widest possible perspective on the issue of addressing occupational skills shortages. Workforce development is not simply a responsibility of the individual employee, it is a shared responsibility among employers, training institutions, and other organizations that have an interest in helping workers succeed. The literature on workforce development recognizes the growing importance of a wide variety of “workforce intermediaries,” usually non-profit organizations with ties to a specific community or group, especially in dealing with groups that have significant barriers to employment. These organizations act as bridges between employers and job-seekers by recruiting individuals, providing guidance and support through a training process, connecting them to social services, and then working with employers to place them in appropriate jobs. Some intermediaries continue to stay in touch with their trainees after placement.
Identifying Occupational Shortages
The original goal of this research project as supported by the KnowledgeWorks Foundation was to use publicly available labor market information and other surveys to identify statewide occupational shortages in Ohio’s health care and manufacturing sectors. In its second part of our research, we synthesized this information with the experiences of sector skills strategies in Illinois and Indiana.19 These states required local partnerships to use similar methodologies to investigate their local labor markets. In particular, both states required local areas to produce “root causes” reports for key industries that took a hard look at where shortages exist and why. 17 Horn, L. and Berger, R. College Persistence on the Rise? Changes in 5-Year Degree Completion and Postsecondary Persistence Rates between 1994 and 2000. (NCES 2005-156). National Center for Education Statistics, Table 5-A, p. 20. 18 Community Research Partners, Ohio Stackable Certificates: Models for Success. Report prepared for the Prepared for Columbus State Community College Business and Industry Division With funding from the Ohio Board of Regents (Feb. 2008) Available at www.communityresearchpartners.org 19 Regions in Illinois and Indiana had to submit on shortage occupations, their root causes, and their solutions to the state.
www.policymattersohio.org 4

Occupational Shortages Policy Matters Ohio
Both states produced summaries of what local areas found. These reports showed remarkably similar themes in the occupational shortages they identified in health care and manufacturing and their root causes. We do not use the term “occupational skills shortage” because its usage in workforce development policy has become too general and imprecise. On the one hand, the term is used to describe a situation in which the technical training and educational backgrounds of new hires or incumbent workers are inadequate to meet certain skill requirements of their positions, even if they have been placed in a field directly related to their training. On the other hand, it is also used to describe increased employer demand for particular occupations. This report is about the latter situation. In other words, an occupational shortage reflects an imbalance between supply and demand in the labor market for a particular set of technical skills. In general, we would expect that occupations experiencing a shortage would display some of the following characteristics:
Rising real wages, as demand for labor exceeds supply; An increase in the number of individuals working in the occupation; Growth in key economic sectors that employ members of the occupation.
These are general indicators that have to be applied cautiously to any particular situation. Growing employment in an occupation does not necessarily indicate an occupational shortage, particularly when it is accompanied by stagnant or declining wages in the long-term. For example, as discussed below, this trend occurred in certain low-paid, low-skill health care support positions (e.g., home health aides). In these situations, employers should be able to address many of their own training needs in-house. Conversely, the median wage in an occupation may decline simply because of the rapid entry of many new hires, even if the occupation is very much in-demand and even if longer-term employees are getting pay increases. Shortages can occur in occupations that are not growing if there is a mismatch between the number of new entrants in the occupation and the number of people leaving the occupation through retirement. This may be the case with certain manufacturing jobs. Nonetheless, we would expect to find most occupational shortages among jobs that are growing in absolute numbers. The interpretation of wage data also can be difficult. This report uses real, inflation-adjusted wages for the 2004 to 2007 period. Inflation accelerated in recent years, making it more difficult for wages to keep pace. Real wages for many of the occupations discussed in this report actually declined, as did the overall median wage for the state.20 The key issue is the relative rate of change among occupations. Our most important data source is an annual federal occupational survey called the Occupational Employment Statistics survey, or OES. The OES is the best available information source for national and state-level occupational employment estimates. It also contains information about
20 The economy-wide Ohio median wage as derived from the BLS Occupational Employment Statistics survey rose in nominal terms from $13.83 in 2004 to $14.85 in 2007, a gain of $1.02, or 7.4 percent; but inflation increased by 10 percent (CPI-U-RS).
5 www.policymattersohio.org

Policy Matters Ohio Occupational Shortages
wage distribution. As with any survey, the sample estimate is accompanied by a certain degree of imprecision and this has to be kept in mind when constructing a time series.21 It takes considerable time to compile the results. The most recent survey date was May 2007, so the data are already a year old. The survey results for a specific year are pooled with previous surveys to produce more reliable estimates, but this practice makes the survey less able to detect sudden changes. Small movements in employment or wages should be interpreted with caution, particularly when they pertain to occupations that have few members. We also reference reports from health care and manufacturing task forces of the Governor’s Workforce Policy Advisory Board. We used recent local surveys of employers’ recruiting experiences in Cleveland, Columbus, and Dayton. These reports are summarized in the Appendix. Local workforce surveys provided insights into employers’ perceptions about which jobs were hard to fill by estimating job vacancy and employee turnover rates. This data can provide a fuller picture of labor market trends. The U.S. Department of Labor, Bureau of Labor Statistics is working with states to develop a more robust data system to study occupational supply and demand. The Georgia Career Information Center at Georgia State University, under contract with the Department of Labor, is merging OES data and state-level educational data from the National Center for Educational Statistics (NCES). Higher education institutions that apply for or receive federal financial assistance programs are required to report the number of degrees or certificates granted in each field.22 In occupations in which degrees or certificates are prerequisites for employment, this information can be used to develop a rough indicator of labor supply, at least in entry-level positions. Other BLS estimates provide an estimate of the number of job openings in an occupation. The information for Ohio and other states is available at the Occupational Supply and Demand System website, www.occsupplydemand.org. The Ohio Department of Job and Family Services, Labor Market Information Bureau has made use of the OES and other information in analyzing occupational shortages in Ohio’s local labor markets. These analyses will guide the implementation of the Ohio Skills Bank process. This report makes use of the department’s statewide analysis of health care occupations and an analysis of high-demand occupations in the Dayton region. There are significant limits to our ability to understand labor flows in and out of an occupation or area using standard labor market tools. Some of these limits are acknowledged on the Occupational System Supply and Demand website.23 The “Human Resource Accounting” model counts people who complete training programs and compares these results with occupational projections from employer surveys. This model is best used for identifying labor
21 The occupational employment survey produces employment and wage data for 450 occupations. The U.S. Department of Labor cautions against constructing a time series with the survey data for a number of reasons, particularly because of changes in occupational and industry classification systems. In the analysis that follows, we have limited the use of the survey for a comparison of recent periods to avoid these definitional changes. 22 National Center for Education Statistics. Integrated Postsecondary Education Data System Web-Based Collection System. (U.S. Department of Education). http:surveys.nces.gov/ipeds/ 23 OSDS Planning Models. Occupational Supply and Demand System website. http://www.occsupplydemand.org/OSD_PlanningModels.htm.
www.policymattersohio.org 6

Occupational Shortages Policy Matters Ohio
surpluses in occupations that require certificates or degrees.24 Even among such occupations, its usefulness is limited by the geographic mobility of degree completers. Also, proprietary schooand other private institutions that do not receive federal funding are not required to report to thNCES database. These institutions play an important role in many middle-skill occupations, such as wel
ls e
ding.
Shortages in Health Care Occupations
The health care industry is growing nationally and in Ohio. The number of Ohio jobs in the health care field increased by 10.9 percent between 2001 and 2006. Over 600,000 Ohioans now work in health care.25 As of 2006, more than one-third of health care workers (36.7 percent) were employed in hospitals, and slightly more than one-fourth (26.6 percent) were employed in nursing or residential care facilities. A June 2004 report of the Ohio Health Care Advisory Council to the Governor’s Workforce Policy Board identified shortages in the following health care occupations: • nursing • direct care providers (nursing home and home care aides) • pharmacists • speech and language pathologists • medical assistants • audiologists • occupational therapy aides • pharmacy technicians • medical records administrators • social service assistants • physician assistants • radiology technicians • substance abuse counselors • physical therapy assistants.26 The council’s report did not provide an explanation of the methodology used to identify shortages, but its members were drawn from a wide cross-section of health care experts from state associations and state agencies, and the council received input from many different organizations. As shown below, many of these same health care occupations grew from 2004 to 2007, with nurses, radiology techs, pharmacists, and pharmacy technicians showing strong indicators of an occupational shortage. Table 1 shows the 20 health care occupations that have added the greatest number of jobs in Ohio from 2004 to 2007, based on information from U.S. Department of Labor Occupational
24 Id. 25 Annual average civilian employment in Ohio’s health care sector rose from 543,900 in 2001 to 603,300 in 2006. BLS. Current Employment Statistics. Calculation by the author. 26 Ohio Health Care Advisory Council. Progress Report to the Governor’s Workforce Policy Board on The Health Care Workforce Shortage in Ohio (June 2004). See p. 18.
7 www.policymattersohio.org

Policy Matters Ohio Occupational Shortages
Employment Statistics (OES) surveys of employers. Because the list is screened for growth in absolute terms, it does not include occupations with few members that showed rapid growth. Sixteen of the occupations in Table 1 fall into the “Health Care Practitioners and Technical Occupations” category, denoted by Standard Occupational Classification (SOC) Code with the first two digits of 29. These occupations generally require a postsecondary credential. Four of the occupations are considered “Health Care Support Occupations,” denoted by a SOC code beginning with 31.
Table 1 Ohio health care occupations with the largest absolute increases in employment,
2004 – 2007 S.O.C. Code OCCUPATIONAL TITLE Employment
Change, 2004 - 2007 Employment Level, 2007
31-1011 Home health aides 17,400 56.2% 48,350 29-1111 Registered nurses 10,010 9.5% 114,920 31-9099 Healthcare support workers, all other 2,220 31.2% 9,340
29-2061 Licensed practical and licensed vocational nurses 2,180 5.9% 38,880
29-2052 Pharmacy technicians 2,100 20.3% 12,450 31-9092 Medical assistants 1,590 9.2% 18,860
31-1012 Nursing aides, orderlies, and attendants 1,520 2.1% 75,330
29-1051 Pharmacists 1,470 15.0% 11,260 29-1123 Physical therapists 1,470 28.4% 6,650 29-1062 Family and general practitioners 1,210 30.2% 5,220
29-9099 Healthcare practitioners and technical workers, all other 1,160 227.5% 1,670
29-2055 Surgical technologists 1,040 40.0% 3,640
29-2056 Veterinary technologists and technicians 1,000 64.9% 2,540
29-2034 Radiologic technologists and technicians 980 11.0% 9,920
29-2021 Dental hygienists 870 14.6% 6,840
29-2099 Health technologists and technicians, all other 690 17.0% 4,760
29-1061 Anesthesiologists 560 57.7% 1,530
29-2011 Medical and clinical laboratory technologists 550 9.1% 6,580
29-2031 Cardiovascular technologists and technicians 480 30.4% 2,060
29-9011 Occupational health and safety specialists 430 25.6% 2,110
Source: Policy Matters Ohio analysis of BLS OES survey. Home health aide, an occupation that requires only short-term, on-the-job training experienced the greatest numerical increase, 17,400.27 Nationally, this occupation expanded by 40 percent in
27 A 90 percent confidence interval for the home health aide employment estimate is 50,497 to 46,203.
www.policymattersohio.org 8
Occupational Shortages Policy Matters Ohio
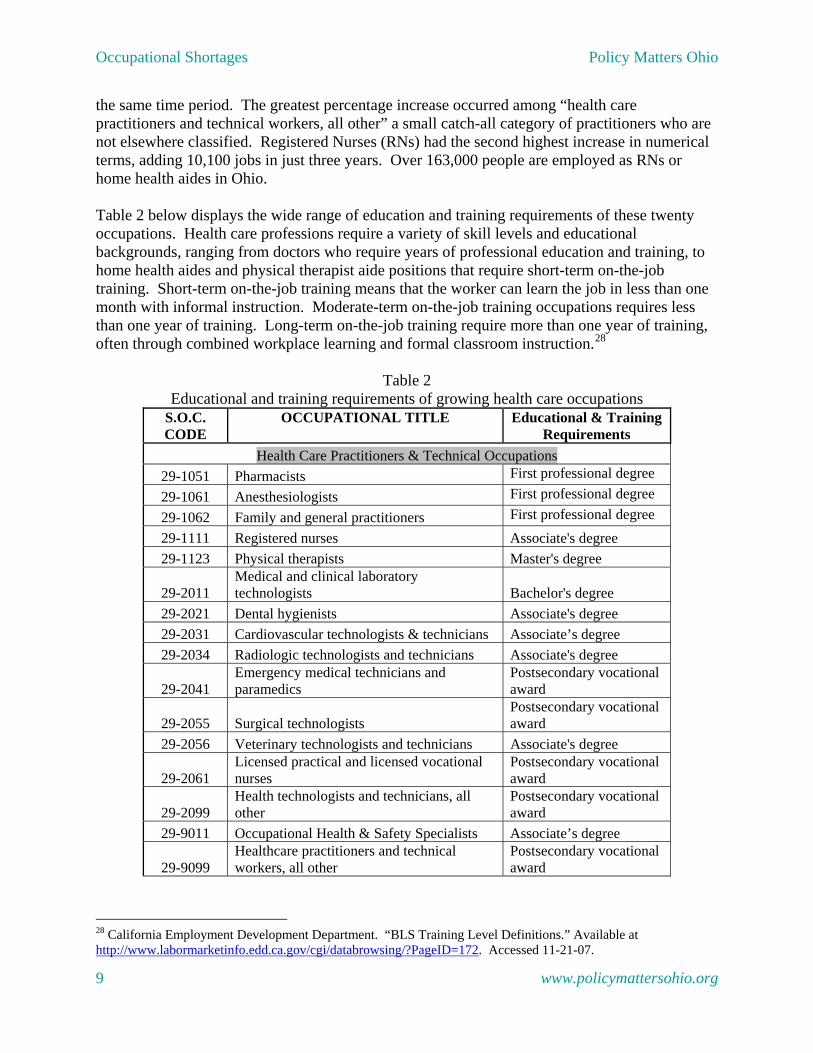
the same time period. The greatest percentage increase occurred among “health care practitioners and technical workers, all other” a small catch-all category of practitioners who are not elsewhere classified. Registered Nurses (RNs) had the second highest increase in numerical terms, adding 10,100 jobs in just three years. Over 163,000 people are employed as RNs or home health aides in Ohio. Table 2 below displays the wide range of education and training requirements of these twenty occupations. Health care professions require a variety of skill levels and educational backgrounds, ranging from doctors who require years of professional education and training, to home health aides and physical therapist aide positions that require short-term on-the-job training. Short-term on-the-job training means that the worker can learn the job in less than one month with informal instruction. Moderate-term on-the-job training occupations requires less than one year of training. Long-term on-the-job training require more than one year of training, often through combined workplace learning and formal classroom instruction.28
Table 2 Educational and training requirements of growing health care occupations
S.O.C. CODE
OCCUPATIONAL TITLE Educational & Training Requirements
Health Care Practitioners & Technical Occupations 29-1051 Pharmacists First professional degree 29-1061 Anesthesiologists First professional degree 29-1062 Family and general practitioners First professional degree 29-1111 Registered nurses Associate's degree 29-1123 Physical therapists Master's degree
29-2011 Medical and clinical laboratory technologists Bachelor's degree
29-2021 Dental hygienists Associate's degree 29-2031 Cardiovascular technologists & technicians Associate’s degree 29-2034 Radiologic technologists and technicians Associate's degree
29-2041 Emergency medical technicians and paramedics
Postsecondary vocational award
29-2055 Surgical technologists Postsecondary vocational award
29-2056 Veterinary technologists and technicians Associate's degree
29-2061 Licensed practical and licensed vocational nurses
Postsecondary vocational award
29-2099 Health technologists and technicians, all other
Postsecondary vocational award
29-9011 Occupational Health & Safety Specialists Associate’s degree
29-9099 Healthcare practitioners and technical workers, all other
Postsecondary vocational award
28 California Employment Development Department. “BLS Training Level Definitions.” Available at http://www.labormarketinfo.edd.ca.gov/cgi/databrowsing/?PageID=172. Accessed 11-21-07.
9 www.policymattersohio.org

Policy Matters Ohio Occupational Shortages
Health Care Support Occupations (Table 2 cont.)
31-1011 Home health aides Short-term on-the-job training
31-1012 Nursing aides, orderlies, and attendants Postsecondary vocational award
31-9092 Medical assistants Moderate-term on-the-job training
31-9099 Healthcare support workers, all other Short-term on-the-job training
Source: ODJFS. More so than in most industries, health care occupations are strictly regulated by the state through various boards or the Ohio Department of Health. Applicants for many technical positions must have degrees, undertake supervised learning, and pass examinations for licensure. For example, applicants for a registered nurse license must graduate from an approved two or four-year postsecondary program and pass the national licensing exam. Approved programs must include clinical placement. A clearer picture emerges when we consider changes in real median hourly wages in Ohio health care occupations over the 2004 to 2007 period. The real median wage change for all Ohio health care practitioners and technical occupations was an increase of 2.5 percent. In contrast, Ohio health care support occupations actually experienced a decline of 3.7 percent. Table 3 shows how the real median hourly wage changed among the growing Ohio health care occupations identified above. Family physicians and anesthesiologists are not shown because the OES survey does not calculate a median wage for these occupations. Both occupations are extremely well paid.29 Five occupations show strong real median wage growth rates of 4.9 percent or more over the period. All five of these occupations require postsecondary education and training. The large 23.2 percent increase for occupational health and safety specialists has to be treated with some caution because of the small number of jobs in this occupation, but it shows strong evidence of employer demand for these skills. These five occupations display the traditional evidence of a labor shortage: strong wage increases combined with job growth. Another group comprising five occupations showed slower wage growth, ranging from dental hygienists (3.7 percent) to medical and clinical lab technicians (0.4 percent). This group includes dental hygienists, pharmacy technicians, RNs, surgical technologists, and medical and clinical laboratory technologists. Eight occupations experienced declining real median wages. In a worrisome trend, home health aides, the occupation that gained the most jobs over the period, had the second-worst wage decline (5.6 percent). Three other health care support occupations – nursing aides, health care support (all other), and medical assistants – joined home health aides in this category. Health care support (all other) had the third-highest job growth of all of the occupations shown in Table
29 Family doctors had a mean hourly wage of $77.33 in 2007. Anesthesiologists’ mean wage was $85.75 in 2004, but was not calculated for 2007.
www.policymattersohio.org 10

Occupational Shortages Policy Matters Ohio
3. LPNs also fell into this category, perhaps indicating that earlier shortages may have been erased. Training data for LPNs and medical assistants indicate that these the number of program graduates far exceeds the number of available jobs.30 In the case of LPN, the annual oversupply is on the order of 300 percent according to an ODJFS analysis.31 Interestingly, the number of RN program completers was only slightly below the projected number of job openings.
Table 3 Changes in real median wages for growing Ohio health care occupations, 2004-2007
S.O.C. Code OCCUPATIONAL TITLE
Change in Real Median
Wage, 2004-2007
Median Wage, 2007
29-9011 Occupational health and safety specialists 23.2% $29.95 29-1123 Physical therapists 9.4% $34.41 29-1051 Pharmacists 6.9% $47.20
29-2031 Cardiovascular technologists and technicians 6.7% $22.33
29-2034 Radiologic technologists and techs. 4.9% $22.67 29-2021 Dental hygienists 3.7% $29.59 29-2052 Pharmacy technicians 3.3% $11.67 29-1111 Registered nurses 2.3% $26.92 29-2055 Surgical technologists 1.4% $17.50
29-2011 Medical and clinical laboratory technologists 0.4% $23.69
29-2061 Licensed practical and licensed vocational nurses -1.0% $18.42
29-2056 Veterinary technologists and technicians -1.2% $13.67 31-9099 Healthcare support workers, all other -1.4% $12.58 31-9092 Medical assistants -1.4% $12.22 31-1012 Nursing aides, orderlies, and attendants -2.0% $11.03
29-9099 Healthcare practitioners and technical workers, all other -4.1% $17.80
31-1011 Home health aides -5.6% $9.39
29-2099 Health technologists and technicians, all other -5.7% $16.53
Source: Policy Matters Ohio analysis of BLS Occupational Employment Statistics. 2007 dollars.
30 Ohio Department of Job and Family Services. Ohio Health Care Employment: Labor Market Trends and Challenges. (2008), Fig. 12, “Demand/Training Supply Comparisons in Key Health Care Occupations,” p. 17. Available at http://lmi.state.oh.us/research/Healthcare.pdf 31 Id., p. 14.
11 www.policymattersohio.org

Policy Matters Ohio Occupational Shortages
Causes of the Nursing Crisis and other Health Care Shortages
The crisis in health care occupations has been studied in-depth nationally and at the state level. Ohio can benefit from these efforts to define root causes of shortages and develop solutions. The gist of these studies is that resolving training bottlenecks is only one part of the solution to health care occupational shortages. Shortages must be dealt with in the context of issues of upward mobility, compensation, working conditions, the public image of an occupation, and even the quality of life in certain communities. In other words, long-term training needs are inseparable from a human resource strategy that handles recruitment and retention issues. For rural areas in particular, the general quality of life and access to cultural and entertainment amenities also play a role. Training bottlenecks are more of an issue in nursing and other high-skilled occupations, while compensation, image, and prospects for advancement are critical for home health aides and other lower-paid positions. Local partnerships in Indiana and Illinois identified occupational shortages in health care that show strong similarities with shortage occupations in Ohio. RNs, radiology technicians, and pharmacists also appear to be in shortage in Ohio. Occupational therapists and occupational therapy assistants each showed growth of about 350 jobs in Ohio from 2004 to 2007. The most widespread shortages in these two other states were in nursing. All Illinois regions, and most Indiana regions, reported a shortage of RNs and LPNs. Other shared shortages were for respiratory therapists and radiology technicians (Table 4).
Table 4. Shortages in Health Care Occupations in Illinois and Indiana
Occupation Illinois (10 regions)
Indiana (11 regions)
RN All 10 9 LPN All 10 6
Radiology More than one 2 (technician) Respiratory Therapist Most 4
Occupational Therapist Most None Pharmacist More than one None
Medical Laboratory Tech More than one None Medical Records Tech More than one None
Source: Indiana Workforce Development Department.32 Illinois Workforce Investment Board.33 The “root causes” reports from Illinois and Indiana identified similar factors that hindered employers’ ability to fill positions in nursing and other health care occupations. The factors identified were consistent with national studies of nursing. In 2006, the Health Care Task Force of the Illinois Workforce Investment Board analyzed regional skills shortages reports and
32 Indiana Workforce Development. Strategic Skills Initiative: Summary Report. Occupational & Skills Shortages. (January 2006). “Indexed Occupational Shortages and Wages” table, p. 2. 33 Illinois Workforce Investment Board. Health Care Task Force: Findings and Recommendations. (December 2006). Appendix B. Targeted Healthcare Occupations with Shortages in CSSI Regions, p. 14.
www.policymattersohio.org 12

Occupational Shortages Policy Matters Ohio
summarized causes for the shortages for RNs, LPNs, and therapists. The Task Force identified four factors causing RN shortages: difficulties in retention, recruitment of new entrants and recapturing non-practicing nurses, program enrollment and completion problems, and difficulties developing a qualified pool of applicants.34 (For more information see Appendix 2.) The Task Force identified low pay, poor image, and low job satisfaction as additional problems causing shortages of LPNs and therapists in Illinois.35 These major themes were echoed in Indiana. Nine regions reported waiting lists for nursing or other health care training due to a shortage of faculty, scheduling constraints, or a lack of clinical sites.36 Five regions reported that working conditions detracted from retention. Six regions reported that outmigration for better pay and benefits contributed to shortages. Two regions also reported that potential applicants lacked good information about health care careers. It is likely that occupational shortages in Ohio’s health care sector will have the same general causes. Nationally, the nursing crisis is driven by both demand side and supply side factors. On the demand side, the aging of the baby boom generation will increase the need for nurses and other health care professionals. At the same time, stressful working conditions in hospitals lead some nurses to choose to work in non-hospital settings or to leave the profession altogether, creating more open positions.37 On the supply side, nursing education facilities have a shortage of faculty and space for clinical training, and sometimes have to turn applicants away. Approximately 3,700 qualified applicants could not take nursing courses in Ohio during the fall of 2005 due to a lack of available classes.38 An ODJFS analysis of the number of individuals completing RN programs and the estimated number of job openings during the 2005-2006 academic year found that these two numbers were very close.39 Given the wage gains for RNs, however, this may indicate that hospitals and other facilities hired most new graduates who wanted to work in health care and could have hired more if they had had the chance. A research report sponsored by the U.S. Department of Health and Human Services estimated that the total number of RNs nationally may rise until 2016, but the ratio of RNs to total population will begin to decline several years before that.40 The report found that Ohio’s ratio of RNs per 100,000 population is higher than the national average of 848. In fact, Ohio is one of 15
34 Id., Figure C1, pp. 15-16. 35 Id., Figures C2 and C4, p. 17. 36 Author’s analysis of Indiana Workforce Development, Strategic Skills Initiative: Summary Report. 37 A national report by the Service Employees International Union (SEIU) Nurses Alliance concluded that the hospitals’ routine practices of understaffing and mandatory overtime increased the likelihood of medical errors and drove many nurses to leave hospital employment. The Shortage of Care. SEIU Nurse Alliance http://www.seiu.org/docUploads/careshortage_report.pdf 38 Ohio Hospital Association. “Ohio Workforce Fact Sheet.” Available at http://www.ohanet.org/media/fact_sheets/workforce.pdf 39 ODJFS, Ohio Health Care Employment, Fig. 12, p. 17. 40 Paul Wing, et al. Toward a Method for Identifying Facilities and Communities with Shortages of Nurses. Summary Report. Center for Health Workforce Studies, School of Public Health, SUNY-Albany, under contract with the Division of Shortage Designation, Health Resources and Services Administration, U.S. Department of Health and Human Services. February 2007, page 9.
13 www.policymattersohio.org

Policy Matters Ohio Occupational Shortages
states to have more than 1,000 RNs per 100,000 people.41 This does not necessarily mean that Ohio’s shortage is less severe. In part, the higher ratio may reflect increased demand for health care services. Ohio’s rates of smoking and obesity are higher than national averages.42 The HHS report used a sophisticated methodology to develop a model to predict nursing shortages at the county level across the nation. The prediction was that 26 Ohio counties experienced a shortage in 2004.43 All counties predicted to be in shortage were rural or exurban. It will be interesting to see whether primary research through the Ohio Skills Bank validates this model’s predictions. If so, then it reinforces the findings of the Illinois and Indiana experiences that outmigration and weak attraction pose difficult challenges for rural areas. The Ohio Hospital Association (OHA) cites a federal government study showing that Ohio will reach a shortfall of almost 32,000 registered nurses by 2020, creating a 29 percent shortage of labor supply vs. projected demand.44 According to OHA information, Ohio hospitals employed 62,000 RNs in 2006, about 5,500 more than in the year 2000.45 Problems with the recruitment, training, and retention of the health care workforce have been the subject of attention in Ohio for many years. The Ohio Health Care Workforce Advisory Council’s June 2004 report focused on shortages in nursing and “direct care” positions (e.g., home health aides, state-tested nursing assistants, and personal care assistants). The council found that the same factors that affected nursing nationally also impacted Ohio, although it placed less emphasis on working conditions in nursing. Some of these factors were: increasingly diverse career options for women, a “negative perception of nursing by younger generations,” and a lack of ethnic and gender diversity in the nursing workforce.46 The report concluded that “Ohio’s capacity to educate new nurses is seriously challenged,” noting that most Ohio RN programs had waiting lists.47 The report cited a familiar litany of issues ranging from faculty shortages and a lack of clinical space to the high operating costs of nursing programs and decreases in state funding.48 The Council acknowledged a far different set of issues confronting workers in low-skill direct care positions. Recruitment and retention were difficult because direct care positions were characterized by low pay and few benefits (including health insurance for workers outside of
41 Id., “Figure 3. RNs per 100,000 Population in the U.S., 2004.” page 12. 42 26.6 percent of Ohio’s adult population smokes. The national average is 23 percent. Twenty-three percent of Ohio’s population has a body-mass index of 30 or more, versus 22.1 percent for the nation. Centers for Disease Control and Prevention. Behavioral Risk Factor Surveillance System Survey Data. Atlanta, GA. US Department of Health and Human Services, CDC. 2002. 43 Wing et al., op. cit., Excerpt from Full Report provided to Policy Matters Ohio by SUNY-Albany, p. 63. The model predicted that Morrow County would have an RN shortage greater than 50 percent. Adams, Brown, Guernsey, Holmes, and Huron were predicted to have shortages between 25 and 50 percent. Eighteen counties were predicted to have shortages between 10 and 25 percent, and seven counties between zero and 10 percent. 44 Ohio Hospital Association. “Health Care Shortage Frequently Asked Questions.” www.ohanet.org/workforce/FAQ.asp 45 Ohio Hospital Association. “Ohio Workforce Fact Sheet.” Available at http://www.ohanet.org/media/fact_sheets/workforce.pdf 46 Ohio Health Care Workforce Advisory Council, p. 12. 47 Id., p. 14. 48 Id.
www.policymattersohio.org 14
Occupational Shortages Policy Matters Ohio
hospitals), little upward mobility, and “physically and emotionally demanding work.”49 The council recommended that the Governor’s Workforce Policy Board “...promote advocacy that focuses on securing direct care workers a wage that can sustain their families without over-reliance on public subsidies, as well as provide access to health care coverage.”50 The report recommended developing a statewide credentialing system for these workers that would be part of a broader health care career pathway. Although the council placed less emphasis on retention issues for nursing, these issues are clearly present. A more recent (2007) report on nursing shortages from the Center for Health Affairs, a consortium of northeast Ohio hospitals, identifies insufficient educational program capacity and job dissatisfaction as major problems affecting nursing.51 The report cited long hours, injuries, and a lack of professional respect as factors contributing to job dissatisfaction.52 Given these issues, some nurses may be tempted to move into positions that do not involve direct care to patients. The national nursing survey by the Health Resources and Services Administration (HRSA) of the U.S. Department of Health and Human Services indicates that about 15 percent of Ohio’s trained nurses were not employed in nursing.53 Of those employed in nursing, two-thirds worked full time.54 The survey estimated that Ohio had nearly 94,000 full time equivalent (FTE) nursing positions.55
49 Id., p. 15. 50 Id., p. 12. 51 The Center for Health Affairs. Issue Brief. Seeking a Remedy: Growing Need for Nurses Requires a Collaborative Approach. (November 2007), p. 4. Available at www.chanet.org. 52 Id. 53 The Registered Nurse Population: Findings from the March 2004 Sample of Registered Nurses. U.S. Department of Health and Human Services, Health Resources and Services Administration. June 2006. Appendix A, Table 51. “Registered Nurse Population in each State and geographic area by activity status: March 2004,” page A-53. The survey estimates that there were 112,806 RNs employed in nursing in Ohio, and another 20,258 not in nursing positions. The BLS occupational employment survey for 2004 estimated the number of RNs at about 105,000 for that year. 54 Id., Appendix A, Table 52. “Supply of registered nurses in each State and geographic area according to whether employed in nursing on a full-time or part-time basis: March 2004,” p. A-54. 55 Id.
15 www.policymattersohio.org

Policy Matters Ohio Occupational Shortages
Health Care Workforce Retention in Ohio
The Ohio Hospital Association (OHA) surveys its member institutions annually about their workforces. The full results of these surveys are not available to the public, but the OHA has released certain information about shortage occupations, which is presented in Table 5. “Turnover rate” refers to the share of existing positions that must be filled each year. “Vacancy rate” refers to the share of total jobs within the occupation that remain open. Three occupations – Radiology Technologist, Respiratory Therapist, and Medical Technologist – had higher vacancy rates in 2006 than RNs. The vacancy rate for these three occupations is significantly higher than the four to five percent vacancy rate for health care practitioner occupations found in the Greater Dayton and Cuyahoga County local workforce surveys (see Appendices A and B). Respiratory Therapist (SOC 29-1126) had the highest turnover rate in 2006. This occupation is not listed as a growth occupation in our analysis of OES data because its level of employment did not change between 2004 and 2007. Government labor market projections show that supply and demand for the occupation are in balance and that the occupation will have average long-term growth.56 Real median hourly wages for this occupation increased by 3.8 percent between 2004 and 2007, indicating a moderate level of demand for these skills. High turnover may be due to working conditions in hospitals, but further research is needed. The 13 percent general turnover rate, shown as “Occupation-wide” in the table, indicates that about one in every eight hospital workers must be replaced every year. All four of the occupations listed saw their turnover rates grow between 2003 and 2006, indicating that some of the labor shortages could be addressed with better retention.
56 Occupational Supply and Demand website, www.occsupplydemand.org, Respiratory Therapy unit of analysis 147A-08. The official projection of demand is 278 openings each year, including growth and replacement. Data from the 2005-2006 academic year indicate that 274 individuals completed degrees in respiratory therapy.
www.policymattersohio.org 16

Occupational Shortages Policy Matters Ohio
Table 5. Critical Shortage Occupations in Ohio Hospitals:
Turnover and Vacancy Rates
Position TURNOVER RATE VACANCY RATE
2003 2004 2005 2006 2003 2004 2005 2006 Registered Nurse 11.7% 10.9% 13.1% 13.5% 4.7% 4.8% 5.7% 5.1%
Radiology Technologist 10.8% 9.1% 12.9% 12.6% 12% 8.7% 9.8% 8.8%
Respiratory Therapist 12.5% 12.9% 14.3% 16.4% 9.1% 10.3% 10.1% 9.4%
Medical Lab Technologist 8.5% 7.7% 12.5% 12.8% 6.2% 6.3% 7.2% 8.6%
Organization-wide 13.3% 13.0% 13.4% 13.5% N/A N/A N/A N/A
Source: Ohio Hospital Association.57 Data from the Ohio Board of Nursing indicate that the number of RNs in Ohio increased by 16,451, or 11.6 percent, between 2002 and 2007 (Table 6). It should be kept in mind that some licensees are not directly involved in patient care. The number of RNs fell slightly between 2005 and 2006, and then rose significantly in the most recent year. The number of Licensed Practical Nurses (LPNs) increased by 7,205 between 2002 and 2006 to an ending level of 48,931, with a slight dip between 2002 and 2003 and again between 2006 and 2007.
Table 6. Individuals with Active Nursing Licenses in Ohio, 2002- 2007
License Category 2002 2003 2004 2005 2006 2007
RNs 141,844 147,166 146,623 151,136 149,212 158,295 LPNs 41,726 40,877 42,092 44,790 48,931 48,241
Source: Ohio Board of Nursing58 The numbers in Table 6 indicate the “stock” of nurses at the end of each fiscal year, but not the “flow” of licensees in and out of the profession. The Board of Nursing is currently conducting a workforce survey that will attempt to reach the entire population of nurses in Ohio. There are many programs around the state dedicated to addressing shortages in nursing and other health care occupations. Industry associations have a number of local and statewide initiatives, such as “Nurse Promotion Task Force” to improve the profession’s image and increase awareness of nursing among high school guidance counselors. The Northeast Ohio Nursing
57 OHA. “Health Care Shortage Frequently Asked Questions.” (Table) Available at http://www.ohanet.org/workforce/FAQ.asp 58 Ohio Board of Nursing. Annual Reports. Fiscal years 2003 to 2007. Number of licensees are as of June 30 of each year. The 2004 Annual Report (p. 16) indicates that the FY 2003 figure “may have been a miscalculation.” Available at www.nursing.ohio.org.
17 www.policymattersohio.org

Policy Matters Ohio Occupational Shortages
initiative has developed a “shadowing” program to bring students into a health care workplace to see professionals in a work setting.59 Some hospitals have developed tuition reimbursement programs for nurses or others who want to become nurses and have developed more flexible scheduling.60 Twenty Ohio hospitals have earned recognition as “Magnet Hospitals” according to criteria developed by the American Nurses Credentialing Center to create a more collaborative workplace.61 The five pilot career pathways sites funded by the KnowledgeWorks Foundation now have three years of operation and will be able to mentor other programs in how to construct pathways. Three other sites recently received U.S. Department of Labor grants for health care workforce training.62 In short, the major problems that contribute to health care workforce shortages have been identified and there are many initiatives underway to address them. With the right resources and incentives, the immediate bottlenecks in training program capacity may prove to be the easiest problems to solve, although finding clinical sites may be more difficult than raising faculty salary levels. The long-term challenges will be changing employer practices to address recruitment and retention issues, and building career pathways that actually reach all the way down the skill ladder. Although it is apparent that some employers are changing internal practices, some critics contend that the only way to stabilize the health care workforce is through greater state regulation (e.g., nurse staffing ratios) and unionization.63 A recently-passed Ohio law requires hospitals to establish joint management-nursing committees and to create a nurse staffing plan that takes the committee’s recommendations into account.64 On the training side, large employers may have the resources for tuition reimbursement and other supports for training, but small organizations may not, and will rely on the public sector to assist with training costs, including supportive services such as child care, counseling, and transportation.
59 The Center for Health Affairs, op. cit., p. 9. Available at www.chanet.org. 60 Id., p. 11. 61 www.nursecredentialing.org. 62 The Cleveland/Cuyahoga One-Stop Career Center, James A Rhodes State College (Lima), and Stark State College of Technology (North Canton). www.doleta.gov/whatsnew/new.releases/List_of_grantees.pdf, Accessed 3-18-07. 63 Gordon, Suzanne. Nursing Against the Odds: How Health Care Cost Cutting, Media Stereotypes, and Medical Hubris Undermine Nurses and Patient Care. Ithaca, NY: Cornell University Press, 2005. 64 H.B. 346, 127th General Assembly. See also “Nurses Union Calls for Mandatory Staffing Ratios,” Gongwer News Service Ohio Report, June Vol. 77, Rept 117, Art. 3, June 17, 2007.
www.policymattersohio.org 18

Occupational Shortages Policy Matters Ohio
Shortages in Manufacturing Occupations Total employment in Ohio’s manufacturing sector has been in decline since the late 1990s. The steepest employment declines occurred between 2000 and 2003 (Figure 1). Nearly 228,000 jobs were lost between 2000 and 2006. Data for 2007 and 2008 indicate that job losses are continuing. Total employment in manufacturing has fallen to approximately 759,000.65
Figure 1. Average Annual Employment in the Ohio Manufacturing Sector, 2000 - 2007
________________________________________________________________________
750,000
800,000
850,000
900,000
950,000
1,000,000
1,050,000
2000 2001 2002 2003 2004 2005 2006 2007
Num
ber
of E
mpl
oyee
ssss
______________________________________________________________________________________ Source: BLS. Quarterly Census of Employment and Wages. In theory, there should be few occupational shortages in traditional manufacturing occupations in the context of continuing employment declines. Ideally, most new and replacement positions could be filled by experienced workers who are displaced from declining or closing companies. This does not seem to be happening, however. Many displaced manufacturing workers have trouble finding any employment at all. A national survey found that 20 percent of workers laid 65 This estimate is from the Bureau of Labor Statistics, Current Employment Statistics Survey, May 2008 (not seasonally adjusted).
19 www.policymattersohio.org

Policy Matters Ohio Occupational Shortages
off from manufacturing were no longer in the labor force, and another 15 percent were unemployed.66 Surveys of manufacturing employers find consistent and widespread complaints about labor shortages. A well-publicized National Association of Manufacturers (NAM) survey in 2005 reported that 81 percent of respondents faced a “…moderate to severe shortage of qualified workers…” and that these shortages existed across the country among all sizes of firms.67 Shortages ran the gamut from technical occupations, such as engineering, to shop floor workers. The vast majority of firms surveyed (90 percent) reported that they had a “moderate” to “severe” shortage of skilled production employees, 65 percent had moderate to severe shortages of scientists and engineers, and 39 percent had trouble finding unskilled production employees.68 A 2005 survey of Ohio manufacturers by the Governor’s Workforce Policy Board also found significant recruitment problems.69 The survey categorized the training and education requirements of typical manufacturing jobs into five “job levels” and then asked employers how many jobs they expected to fill and the main challenges they faced. The job levels from the survey are shown in Table 7. The training and education levels are consistent with government labor market information sources. Short-term on-the-job training means that the worker can learn the job in less than one month with informal instruction. Moderate-term on-the-job training occupations require less than one year of training. Long-term on-the-job training requires more than one year of training, often through combined workplace learning and formal classroom instruction.70
66 U.S. Department of Labor News Release, Displaced Worker supplement to the Current Population Survey. Table 4. “Displaced workers by industry and class of worker of lost job and employment status in January 2006.” August 17, 2006. Available at www.bls.gov/cps. 67 National Association of Manufacturers. 2005 Skills Gap Report: A Survey of the American Manufacturing Workforce. Washington, DC. (2005). 68 Id., p. 4. 69 Ohio Manufacturers’ Association; Governor’s Workforce Policy Board – Ohio Manufacturing Workforce Advisory Council; Ohio Department of Development; Vosler Group LLC. The Advance Ohio: Manufacturing Workforce Survey Project. (June 2005). 70 California Employment Development Department. “BLS Training Level Definitions.” Available at http://www.labormarketinfo.edd.ca.gov/cgi/databrowsing/?PageID=172. Accessed 11-21-07.
www.policymattersohio.org 20

Occupational Shortages Policy Matters Ohio
Table 7 Workforce Policy Board Manufacturing Workforce Survey Project:
Educational and Training Levels for Manufacturing Employees Job
Level Training/Education
Required Examples of Positions
1 Short-term On-the-Job Assemblers, Production Workers, Machine Feeders & Offbearers
2 Moderate-Term On-the-Job Machine Setters, Assemblers, Welders 3 Long-Term On-the-Job CNC Machine Operators, Machinists,
Millwrights 4 Vocational/Post-secondary Electricians, Mechanical Technicians, IT
Technicians 5 Advanced Education
and/or Related Work Experience
Engineers, Purchasing Agents, Customer Service Agents, Sales Reps, HR Personnel
Source: Governor’s Workforce Policy Board. Manufacturing Workforce Survey (2005). The survey found that over half of the projected hiring between 2005 and 2008 would be in Level 1 positions (Table 8).71 Interestingly, employers believed that Level 1 positions would be the most difficult to fill despite having the lowest skill requirements, and Level 5 the least difficult to fill despite having the highest skill levels. Level 3 positions were the second-most difficult to fill, but the number of projected openings was far less than Level 1. Employers’ judgments about why positions were hard to fill were driven by factors other than technical skills in three of the five training levels.72 Technical skills were most important in hiring for positions at Levels 3 and 4, which require long-term on-the-job training or vocational/post-secondary credentials.
Table 8 Workforce Policy Board Manufacturing Workforce Survey Project:
Projected Openings, Difficult to Fill Openings, and Hiring Barriers, 2005 - 2008
Job Level
Projected # of
Openings
Percent Openings
Difficult to Fill Most Critical Hiring Barrier
1 27,957 69% Work Ethic (Interpersonal skills, Initiative, Dependability)
2 6,870 55% Experience 3 3,882 63% Technical Skills 4 1,499 44% Technical Skills 5 5,321 34% Experience
Source: Governor’s Workforce Policy Board. Manufacturing Workforce Survey (2005).
71 Ohio Manufacturers’ Association, pp. 9 – 10. 72 Id.
21 www.policymattersohio.org

Policy Matters Ohio Occupational Shortages
NAM’s response to entry-level recruitment problems is the “Dream It! Do It” campaign to raise awareness of manufacturing careers among school-age youth and younger workers.73 Another campaign goal is to create closer linkages between manufacturers’ needs and the programs offered by educational and training institutions. Cleveland is one of the pilot sites for the campaign. It remains a puzzle as to why manufacturers would find it difficult to fill technical positions that require experienced workers amidst so many layoffs, even assuming that many older workers choose early retirement. Workforce surveys in Dayton and Cleveland found very low general job vacancy rates in manufacturing (see Appendix). A satisfactory answer to this question requires more research and is beyond the scope of this paper. It is possible, however, to lay out some hypotheses to explain why labor markets are not clearing as they should. Labor markets are shaped by expectations and activities of both employers and workers. It is generally accepted that dislocated manufacturing workers are older on average than other dislocated workers and have a more difficult time matching their previous levels of pay. Thus, these workers are more likely to drop out of the labor force or search for employment outside of manufacturing than in previous eras. There are various interrelated hypotheses that need more research:
• Pre-layoff wage levels for older dislocated workers reflect a significant firm-specific
seniority component that new employers are not willing to match. In other words, employers may perceive that a worker’s productivity level does not merit matching a worker’s pre-layoff wage. This situation decreases the incentive for experienced workers to return to manufacturing.
• Some experienced manufacturing workers have been laid off repeatedly in recent years and no longer want to work in manufacturing. Instead, they seek employment in what they perceive to be as more stable service sector industries. This perception of manufacturing as an unstable field is shared by entry level workers, creating the need for the DreamIt! DoIt! campaign.
• Employers are pressured by globalization and unable or unwilling to raise their wages and benefits to attract experienced mid-career employees. In this context, the preferred alternative is to emphasize entry-level recruitment of inexperienced and less productive workers and to use public sector training resources for training.
• Relatedly, entry-level manufacturing jobs no longer bring the significant wage and benefit premiums over the service sector that they did decades ago. Consequently manufacturing employers are not able to recruit the most talented candidates.
• Dislocated workers’ skills do not match the requirements of certain occupations that are growing (e.g., clean room operations in biotechnology). Public sector training programs reach only a handful of dislocated manufacturing workers, many older workers are reluctant to enter classroom training, and employer-funded training does not fill the gap.
• Some employers are unwilling to hire former union employees, in part because they fear that they will convince other employees to create a union shop, but also because they believe that these workers will introduce a more adversarial pattern of labor relations in general.
73 Campaign information is available at http://www.dreamit-doit.com/content/campaign/aboutus.aspx
www.policymattersohio.org 22

Occupational Shortages Policy Matters Ohio
• Age discrimination continues to exist even if its prevalence and effects are hard to quantify. The high cost of health insurance for older workers may contribute to this problem.
Production Worker Shortages in Other States
The results of regional skills shortages studies in Illinois and Indiana provide partial insights into what is going in the sector. Just as in health care, the issues are more complex than just a lack of training capacity. The Illinois Workforce Board Manufacturing Task Force conceded that “CSSI consortia in all regions of Illinois found that the poor image of manufacturing is one of the major root causes of skills shortages in manufacturing in Illinois.”74 The Illinois Task Force also concluded that problems inside and outside the industry were greater than just image, however. Career guidance and awareness of manufacturing in primary and secondary education were lacking in public schools, and the industry had to foster continuous learning and better credentialing systems to improve the basic skills of incumbent workers.75 The report painted a picture of an industry that was ill-equipped to meet changing skills requirements even as it experienced shortages in certain key occupations such as (1) engineering technicians, (2) machinery maintenance, (3) machinists, welders, assemblers, fabricators, and (4) supervisors and managers. Manufacturing’s image problems, particularly its instability and concerns about its long-term future, were also frequently cited by regional consortia in Indiana, but again, the issues went deeper than image.76 Jobs in manufacturing no longer commanded higher wages than other occupations, particularly in rural areas, leading to workers choosing other occupations or leaving the region. Problems within companies also played a role. One region found that traditional firm practices were partly responsible for shortages:
Lower productivity as a result of failure to invest in 21st Century practices results in a workforce characterized by modest or lower level skills, and thus, lower wages. The result is fewer people wanting to enter or stay in the occupations.77
Even as employers were concerned about a lack of basic skills and work ethic in new employees, some companies lacked human resource planning capability, did little training either in-house or with external training institutions, and did not provide career paths for employees. The occupational shortages identified in Indiana’s regions were very similar to those found in Illinois (Table 9). 74 Illinois Workforce Investment Board. “Manufacturing Task Force Report: Findings and Recommendations.” (December 2006) Illinois Department of Commerce, p. 7. Available at www.commerce.state.il.us/NR. 75 Id., p. 1-2. 76 Illinois Workforce Development Department. Strategic Skills Initiative: Summary Report. Occupational and Skills Shortages (January 2006). Research and Analysis Division. 77 Indiana Department of Workforce Development, Research and Analysis Division. Strategic Skills Initiative Summary Report: Occupational & Skills Shortages (January 2006), “Root Causes Report Summary for Economic Growth Region 2, p. 3.
23 www.policymattersohio.org

Policy Matters Ohio Occupational Shortages
Table 9. Manufacturing Skills Shortages in Indiana’s Eleven Workforce Regions, 2005
Occupation
Number of Regions
with Shortage Welders, Cutters, Solderers, and Brazers 4 Machinists 4 Supervisory Production and Operating Workers 5 Maintenance & Repair Workers; General 4 Computer-controlled Machine Tool Operators 5 Industrial Maintenance Technicians 4 Maintenance Workers: Machinery 4 Team Assemblers 8 Inspectors, Testers, Sorters, Samplers 3
Source: Author’s analysis of Indiana Occupational & Skills Shortages Report. The level of disconnection between manufacturing employers and training institutions seems to be far greater in manufacturing than health care. The disconnect is not surprising given that educational requirements are driven in part by stringent state licensing requirements and consistent national credentials in health occupations. There have been concerted efforts to develop national skills standards in manufacturing, but they have to be implemented in a voluntary environment. Even a well-established incumbent worker training program such as the Wisconsin Regional Training Partnership in Milwaukee has had difficulty in getting companies to agree on common skill standards and credentials above the entry level.78 The CSSI effort was preceded by an in-depth analysis of the training needs of the Chicago manufacturing sector funded by the U.S. Department of Labor and carried out by the Chicago Federation of Labor and the Center for Labor and Community Research. Even in Chicago, with its strong manufacturing roots, the report found “...a lack of connection between key system players to insure positive career outcomes for workers and employers.”79 The report tried to answer the question of why employers had trouble filling positions while many Chicago residents could not seem to find jobs. The report summarized the disconnection in this way:
Except in the case of customized firm-specific training, employers tend not to be involved with providers of training, especially high schools and community colleges. Unions also are rarely adequately involved. Students therefore have less chance of landing a job, not to mention job shadowing and internship opportunities. This lack of connectedness also makes it difficult for the educational institutions to know what to usefully teach. There are internal disconnects as well. Technical skills programs in community colleges do not recruit adequately from their own basic skills and ESL programs. This disconnect means that unskilled (and often low-income) youth and adult populations from local communities don’t have sufficient access to career opportunities.
78 See the discussion in Chapter 6 of Joan Fitzgerald, Moving Up in the New Economy: Career Ladders for U.S. Workers. Ithaca; NY: Cornell University Press (2006). 79 Chicago Federation of Labor and the Center for Labor and Community Research, Creating a Manufacturing Career Path System in Cook County. (December 2001), p. 132. Available at http://www.clcr.org/publications/pdf/final%20MWDP%20report030802.pdf
www.policymattersohio.org 24

Occupational Shortages Policy Matters Ohio
Chicago high schools do not take adequate advantage of articulated community college courses. Community colleges and community-based organizations aren’t linked to provide case management and retention services to community residents who are in the process of overcoming employment barriers. [emphasis in original]80
In this context, “poaching” of skilled labor is common, as employers steal workers from each other rather than train. Firms also automate in order to compensate for the lack of skills in the workforce.81 A 2004 report commissioned by Metropolitan Workforce Boards of Chicago as part of the state’s skills shortages initiative found the same kinds of disconnections among and within institutions and companies that made it difficult for the system to respond to changing skill requirements.82 It would be surprising if Ohio’s regional alliances established through the Skills Bank did not find many of the same kinds of disconnections. To address skills shortages, the Illinois Manufacturing Task Force called for “comprehensive regional pipelines” that would create and align three tiers of programs: (1) “Bridge” programs, i.e., programs to provide basic math, literacy, and soft skills; (2) “Foundation” programs that teach introductory, manufacturing-specific skills; and, (3) “Specialized training” programs for specific occupations. These programs would link to K-12 career and technical education. To correct manufacturing’s image problem, the Task Force also called for regional manufacturing consortia comprised of employers, unions, educational institutions, and workforce development organizations to promote careers in manufacturing. In Indiana, statewide solutions also combined efforts to boost the sector’s image with activities to induce more training, improve the quality of training, and reach out to underemployed workers.83 The state created an RFP process for regional workforce boards to apply for grants to achieve these objectives.
Manufacturing Occupation Shortages in Ohio There is no reason to think that Ohio is immune from trends identified in other states. Rick Sloan, Communications Director for the International Association of Machinists and Aerospace Workers, confirmed that there has been a national trend of large companies shutting down their apprenticeship programs in machining and other skilled occupations, while many high schools no longer offer vocational programs in these fields.84 In his view, the pipeline for new workers is also squeezed by several other trends: (1) the relocation of manufacturing facilities to suburban or rural locations, away from concentrations of skilled workers in urban areas, and (2) an aging workforce at existing facilities (many IAM bargaining units have an average age over 55). 80 Id.. 81 Id., p. 59. 82 Corporation for a Skilled Workforce. Root Causes for Critical Skills Shortages in Manufacturing. The Workforce Boards of Metropolitan Chicago (July 2004). Available at http://www.workforceboardsmetrochicago.org/upload/MFG_Root_Causes_Final_Report.pdf 83 Indiana Department of Workforce Development. Tomorrow’s Manufacturing Workforce: Acting Locally to Compete Globally. Advanced Manufacturing: Skill Training & Image and Awareness Campaign. (n.d.) Available at http://www.in.gov/dwd/files/TMW_final.pdf 84 Telephone interview with the author, 11-29-07. Mr. Sloan is with the IAMAW headquarters, Upper Marlboro, MD.
25 www.policymattersohio.org

Policy Matters Ohio Occupational Shortages
Public training institutions, such as career and technical centers and joint vocational schools, are graduating fewer machinists. The number of machinists graduating from public institutions declined from 136 in the 2001-2002 academic year to 47 in 2005-2006.85 Registered apprenticeship is another method of imparting technical skills and work experience. Registered programs must conform to U.S. Department of Labor standards and report program data to the Ohio Apprenticeship Council. Recent data show a decline in the number of registered apprentices in key manufacturing occupations such as machine tool setters and operators, industrial machinery mechanics, machinists, tool and die makers, and welders. Table 10 below includes both union and non-union apprenticeship programs.86
Table 10.
Number of Registered Ohio Apprentices in Key Manufacturing-related Occupations, 2002 and 2008
Enrolled
Apprentices Occupation (SOC code) 2002 2008 Combination machine tool setters and set-up operators, metal and plastic (51-4081) 92 3
Industrial machinery mechanics (49-9041) 540 270 Lathe and turning machine tool setters, operators, and tenders, metal and plastic (51-4034) 16 15
Machinists (51-4041) 478 242 Tool and die makers (51-4111) 1311 470 Welders and cutters (51-4121) 101 64
Source: Ohio Apprenticeship Council The extent to which private training institutions and employers’ in-house training programs are filling the gaps created by the decline in public programs and registered apprenticeships is an important question that should be explored through the Skills Bank and other workforce programs’ outreach to employers. There is no doubt that private training programs play an important role in certain occupations, such as welding. Both the Lincoln Institute of Welding (Cleveland) and the Hobart Institute of Welding Technology (Troy) train hundreds of individuals each year in welding technology.87 Some programs may be struggling. For instance, the Akron Machining Institute, a private training center sponsored by the National Tooling and Machining Institute, closed in July 2007
85 Occupational Supply Demand System website, www.occsupplydemand.org. Metal/Plastic Machine Work supply indicators. Program of study and training: 48.0501. Machine Tool Technology/Machinist. 86 Ohio Apprenticeship Council data provided to Policy Matters Ohio. The data show the number of registered apprentices in all programs within the specified occupation May or June of each year, except for 2008, which uses January. 87 Information provided by the State Board of Career Colleges and Schools. For example, the Lincoln Institute of Welding in Cleveland trained 624 individuals in advanced arc welding in 2005. The Hobart Institute of Welding Technology (Troy) had 134 people who completed a combination structural and pipe welding course in academic year 2005-2006
www.policymattersohio.org 26

Occupational Shortages Policy Matters Ohio
after more than 30 years in existence.88 One of the employees of the former Institute started a training center at a local machining business, however, using donated equipment. This training center is affiliated with the Cleveland Industrial Training Center, which is also housed in a machining business.89 Despite the overall employment declines in manufacturing, the U.S. Department of Labor occupational employment surveys found that certain production-related occupations within manufacturing grew in Ohio between 2004 and 2007. Table 11 shows production occupations that grew by at least 500 jobs. The increases must be interpreted cautiously because of the lack of sensitivity of the survey.90 Two heterogeneous “catch-all” occupations, assemblers and fabricators (all other), and metal and plastics workers (all other), showed the greatest numerical increases. All of these occupations require short or medium-term on-the-job training, except for machinists and water and liquid waste treatment plant operator, which require long-term on-the-job training. The growth in separating and filtering machine operators is probably related to growth in the pharmaceutical and medicine manufacturing sector (see below). Nationally, the pharmaceutical industry is the second-leading source of employment for filtering machine operators, accounting for nearly 13 percent of the jobs in this occupation.91 Beverage manufacturing is the leading employer for this occupation nationally, but this industry’s total employment increased only slightly in Ohio.
88 Paula Schleis, “Machinists back in school: Jobs remain plentiful, so area company opens CNC Training Center” Akron Beacon Journal. Oct. 30, 2007. Available at http://www.ohio.com/business/10881481.html?page=all&c=y 89 Id. 90 The OES is not a random survey because it over-represents large establishments. If standard confidence intervals are applied, however, the employment changes for the first five occupations listed in the table are significant at the 90 percent level, as are the changes for printing machine operators, separating and filtering machine operators, and metal-refining furnace operators. 91 Policy Matters Ohio analysis of BLS OES, May 2006.
27 www.policymattersohio.org

Policy Matters Ohio Occupational Shortages
Table 11.
Ohio production occupations with the largest increases in employment, 2004-2007
S.O.C. CODE
OCCUPATIONAL TITLE
Employment Change 2004-2007
Employment Level 2007
51-2099 Assemblers & fabricators, all other 14,040 91.2% 29,440 51-4199 Metal & plastics workers, all other 5,340 115.1% 9,980 51-4021 Extruding & drawing machine operators 3,290 56.6% 9,100 51-4122 Welding & soldering machine operators 2,820 89.5% 5,970
51-9041 Extruding, forming, and pressing machine operators 2,110 43.3% 6,980
51-4041 Machinists 2,080 7.6% 29,610 51-5023 Printing machine operators 2,040 28.4% 9,230 51-9198 Helpers – production workers 1,490 5.1% 30,450 51-2038 Engine and other machine assemblers 1,180 41.4% 4,030
51-4011 Computer-controlled machine tool operators 1,100 10.5% 11,620
51-9121 Coating, painting, and spraying machine operators 1,010 15.2% 7,650
51-9012 Separating and filtering machine operators 940 68.6% 2,310
51-9111 Packaging and filling machine operators 900 4.7% 20,090
51-8031 Water and liquid waste treatment system operators 720 14.5% 5,680
51-4051 Metal-refining furnace operators 570 33.1% 2,290 51-5011 Bindery workers 540 30.2% 2,330
Source: BLS. Occupational Employment Survey. May 2004 and May 2007. Whether these gains will continue is an open question. The official state labor market projection for the 2006-2008 period shows a downward trend for these occupations and most others in manufacturing. There is still considerable replacement demand from retirements and job changes, however.92 The manufacturing sector’s difficult situation is evident from Table 12, which shows changes in real median wages for the leading growth occupations. Inflation accelerated in the 2004 – 2007 period. Wages had to grow by 10 percent over three years in order to keep pace.93 Only bindery workers, who set up and operate machines to bind books and other printed materials, experienced an increase in median inflation-adjusted wages. Metal-refining furnace operators kept pace with inflation. Both of these occupations are small. All other occupations experienced a decrease. These results are consistent with an across-the-board decline in real median wages for all production occupations of 6.3 percent.
92 ODJFS. “Ohio Short-Term Employment Forecast. 3rd Quarter 2006 to 3rd Quarter 2008.” September 2007. 93 Author’s calculation based on the CPI-U-RS from May 2004 to May 2007.
www.policymattersohio.org 28

Occupational Shortages Policy Matters Ohio
It is clear that employment growth did not reverse wage declines in traditional production occupations. The large declines for metal and plastics workers and engine assemblers may be due in part to buyouts and early retirements of senior union employees at large automobile assembly plants and suppliers. In other fields, the entry of large numbers of new hires with lower relative wages may cause wages to fall even if the occupation is in demand.
Table 12. Changes in real median wages for growing Ohio production occupations, 2004-2007
S.O.C. CODE OCCUPATIONAL TITLE
Change in Real Median Hourly
Wage, 2004 - 2007
Median Hourly Wage, 2007 ($)
51-2099 Assemblers & fabricators, all other -6.1% 16.64 51-4199 Metal & plastics workers, all other (decline)* 15.12 51-4021 Extruding & drawing machine operators -7.3% 13.65 51-4122 Welding & soldering machine operators -7.9% 14.88
51-9041 Extruding, forming, and pressing machine operators -15.2% 13.17
51-4041 Machinists -7.3% 16.39 51-5023 Printing machine operators -7.5% 15.08 51-9198 Helpers – production workers -5.8% 10.92 51-2038 Engine and other machine assemblers -27.1% 17.40 51-4011 Computer-controlled machine tool operators -6.0% 15.89
51-9121 Coating, painting, and spraying machine operators -4.8%
14.07
51-9012 Separating and filtering machine operators -7.9% 17.65 51-9111 Packaging and filling machine operators -4.9% 12.61
51-8031 Water and liquid waste treatment system operators -5.6% 18.94
51-4051 Metal-refining furnace operators 0.1% 17.59 51-5011 Bindery workers 11.6% 14.10
Source: Policy Matters Ohio analysis of BLS OES survey. * See footnote94 Some repair and installation occupations are also very important to manufacturing. Table 13 shows the number of industrial machinery mechanics grew by over 2,000. Unlike the production occupations shown above, the real median hourly wage for the occupation grew by 2.2 percent. This occupation was also singled out by manufacturing sector skills initiatives in Indiana and Illinois as being in high demand. Two smaller occupations, control and valve installers and repairers, except mechanical door (SOC 49-9012), and electrical repairers of commercial and industrial equipment (SOC-2094), also showed real wage and employment growth.
94 Metal and plastics workers, all other (SOC 51-4199) is a catch-all category for occupations not elsewhere classified. Its change in real median hourly wage was unrealistically large so we do not report it.
29 www.policymattersohio.org

Policy Matters Ohio Occupational Shortages
Table 13. Employment growth in the industrial machinery mechanic occupation in Ohio,
2004 – 2007
S.O.C. CODE OCCUPATIONAL TITLE
Employment Change
2004-2007
Employment Level 2007
49-9041 Industrial machinery mechanics 2,550 26.2% 12,280 Source: Policy Matters Ohio analysis of BLS OES survey. Some engineering occupations also showed employment increases in the 2004 to 2007 period. The number of industrial engineers grew by 730 (Table 14). Smaller occupations such as environmental engineers, aerospace engineers and aerospace technicians, and chemical engineers also had employment increases. They are not shown in the table because the survey is less reliable in dealing with smaller occupations.
Table 14. Employment growth in the industrial engineering occupation in Ohio, 2004-2007
S.O.C. CODE OCCUPATIONAL TITLE
Employment Change
2004-2007
Employment Level 2007
17-2112 Industrial engineers 730 6.2% 12,470 Source: Policy Matters Ohio analysis of BLS OES survey. The increase in environmental engineer technicians may stem from a number of sources, including companies that are trying to comply with environmental regulations or improve their energy efficiency. A small “green energy” industry is starting to grow in Ohio as well. Ohio’s industrial profile fits well with making turbines for wind energy, and Toledo is becoming a center for the production of solar panels. Steven Weathers, President of the Toledo Regional Growth Partnership, was quoted at the end of 2007 in the Toledo Blade stating that the solar industry employed 6,000 people in the Toledo area.95 There is substantial additional potential in renewable energy production-related occupations in Ohio, particularly if smart policy steps are taken to promote such growth. The state recently passed a renewable energy portfolio standard, which mandates that 12.5 percent of energy consumed in the state be from wind, solar, biomass or geothermal sources by the year 2025. Such a standard is widely perceived as essential to generating more renewable energy production positions in the state. Ohio has the potential to become a leader in manufacturing wind turbines because the components are very similar to products already made here for the auto and aerospace industries. The state and various business and environmental groups are working to organize a supply chain in renewable energy production. Table 15 shows changes in the real median wage of these engineering occupations. The two aerospace occupations had divergent outcomes. The real median wage of aerospace engineers fell, while that of aerospace technicians rose. The median wages of industrial engineer and
95 Gary T. Pakulski, “Area a world leader in promising method of panel production,” Toledo Blade, Nov. 18, 2007. Available at http:www.toledoblade.com
www.policymattersohio.org 30

Occupational Shortages Policy Matters Ohio
environmental engineers nearly kept pace with inflation, while that of chemical engineers chemical engineers outpaced it.
Table 15. Changes in real median wages for selected Ohio engineering-related growth occupations
S.O.C. CODE OCCUPATIONAL TITLE
Change in Real Median Hourly
Wage, 2004 – 2007
Median Hourly Wage,
2007
17-2011 Aerospace engineers -3.04% $41.62 17-2112 Industrial engineers -0.3% $33.02 17-2041 Chemical engineers 2.42% $37.74 17-2081 Environmental engineers -0.5% $35.45
17-3021 Aerospace engineering and operations technicians 3.38% $23.39
Source: Policy Matters Ohio analysis of BLS OES Survey, May 2004 and May 2007. The rapid growth in aerospace-related occupations corresponds to a turnaround in overall employment in the sector. As show in Figure 2, the Ohio aerospace products and parts sector has added 1,650 jobs since its low point in 2003, even if it has not yet regained its former employment level.
31 www.policymattersohio.org

Policy Matters Ohio Occupational Shortages
Figure 2 Employment in Ohio’s aerospace products and parts sector
________________________________________________________________________
12500
13000
13500
14000
14500
15000
15500
16000
16500
17000
17500
2001 2002 2003 2004 2005 2006YEAR
Num
ber o
f Em
ploy
ees
Aerospace products and parts ________________________________________________________________________
Source: BLS. Quarterly Census of Employment and Wages. NAICS 3364. Biomedical fields have also shown some growth. The biomedical industry is difficult to define, but can include all of the following: • Agricultural feedstock and chemicals • Drugs and Pharmaceuticals • Medical Devices and Equipment • Research hospitals and clinical research institutions • Research, testing, and medical laboratories96 BioOhio, which is the Department of Development-funded Edison Center for the industry, counted 775 bioscience entities in 2006.97 A report by Bioenterprise, a Northeast Ohio trade association, found that 625 Ohio companies had registered with the U.S. Food and Drug
96 Tacon, Bill. “Bioscience in Ohio: An Economic Driver.” “Bioscience subsectors,” slide 7. Powerpoint Presentation to PLTW Conference, October 22, 2007. Available at www.bioohio.com 97 Id., slide 13.
www.policymattersohio.org 32

Occupational Shortages Policy Matters Ohio
Administration to produce medical devices.98 The extent to which the Ohio manufacturing sector in general is serving the biomedical industry is not fully known. Standard government classification systems record information about product types, not the ultimate market that is served. For example, companies that make valves for biomedical devices are classified in a separate industry. Table 16 below lists some growth occupations that have a presence in the biomedical industry. Again, the OES survey is less precise in dealing with small occupations and probably exaggerates their rate of growth. The direction of change is most important. Some of the growth, but not all, may be attributable to the biomedical sector. The largest occupation, compliance officers, include many different kinds of technical specialists working to ensure production or process compliance with government or industry standards. This is a critical role in the biomedical industry, which must comply with Federal Food and Drug Administration regulations. A recent BioOhio survey of biomedical companies found that regulatory compliance is the most needed field for external training.99 The growth in the number of medical scientists is probably related to the growing research capabilities of large institutions such as the Cleveland Clinic and the Ohio State University medical school.
Table 16 Ohio biomedical-related growth occupations, 2004-2007
S.O.C. CODE OCCUPATIONAL TITLE
Employment Change
2004-2006
Employment Level 2006
13-1041 Compliance officers, except agriculture, construction, health and safety, and transportation 1,650 31.9% 6,820
19-1042 Medical scientists, except epidemiologists 790 30.5% 1,540 19-4011 Chemists 430 12.8% 3,800
Source: BLS. Occupational Employment Survey. May 2004 and May 2007. The real median occupational wage for medical scientists and chemists fell slightly from 2004 to 2007. For compliance officers, it fell by 4.5 percent. Sectoral employment data allow us to track the pharmaceutical manufacturing industry and the medical equipment industry. These two sectors performed better than most Ohio industries (Figure 3). The pharmaceutical sector, shown as the bottom line in the graph, is one of the few industrial sectors in Ohio to show employment growth since 2001, having gained 951 positions over five years. The largest company in the field is Ben Venue Laboratories in Bedford (Cuyahoga County), which employs over 1,000 people.100 Employment in the industry is likely to expand as new facilities are built in Ohio, such as Amylin Pharmaceuticals’ expansion in West
98 Bioenterprise press release, “Ohio Ranks #2 in Midwest for Medical Device Establishments,” 99 BioOhio. “2007 Ohio Bioscience Industry Workforce Survey.” Available at http://www.coiled-coil.org/workforce/ 100 Information from a 2006 state of Ohio news release on incentive grants, http://www.odod.state.oh.us/newsroom/2006pr/releases/1681.asp
33 www.policymattersohio.org

Policy Matters Ohio Occupational Shortages
Chester (Butler County).101 Employment in the biomedical device industry has held relatively steady since 2001.
Figure 3 Employment in Ohio’s medical equipment and pharmaceutical sectors
________________________________________________________________________
0
2,000
4,000
6,000
8,000
10,000
12,000
14,000
2001 2002 2003 2004 2005 2006
YEAR
Num
ber
of E
mpl
oyee
s
Medical Equipment Pharmaceuticals ________________________________________________________________________
Source: BLS. Quarterly Census of Employment and Wages. NAICS 3254 and 3391. It is important to note that job growth in pharmaceuticals, solar panels, and the aerospace industry are still the exception to the overall trend in manufacturing and a small proportion of Ohio’s 760,000 manufacturing workforce.
Conclusion: Toward a Workforce Policy Agenda Workforce development strategy is undergoing rapid change in Ohio. Programs and staff are being reassigned, and state government is embarking on an initiative called the Ohio Skills Bank to realign Ohio’s education and training programs with employers’ needs. The state is making these changes in light of persistent employer complaints about worker shortages in key occupations, even though Ohio’s overall job growth has been negligible in recent years. Too often, criticisms of Ohio’s workforce are taken at face value, leading to a narrow framing of the issue as a problem with the responsiveness of educational programs. In reality, a successful
101 The facility employs 130 individuals now, but may grow to over 500 in coming years if the company’s diabetes drugs are approved by the FDA. “Westchester Plant dedicated.” The Cincinnati Enquirer. Nov 5, 2007. Available at http://news.cincinnati.com/apps/pbcs.dll/article?AID=2007311050036
www.policymattersohio.org 34

Occupational Shortages Policy Matters Ohio
workforce development policy for Ohio has to be much broader than expanding the capacity of training programs. Policymakers have acknowledged this point in theory by announcing that the Ohio Skills Bank program will use a career ladder methodology, but putting the concept into practice will be difficult. Although it is common in workforce development policy circles to hear the term “skills shortages,” this phrase is not always helpful in defining the nature of the problem or its causes. It is critical that the nature of the occupational shortages be carefully defined at the outset of a sector workforce strategy, or the strategies employed will fail to address the root causes. Gathering input from workers and job applicants along with employer perceptions would help in this regard. Some jobs are hard to fill because there aren’t enough applicants with the right technical skills. In other cases applicants have a good background in technical skills but lack experience. We also have to be careful to define what we mean by “skills.” The skills that employees lack may not be occupation-specific technical skills. For example, when the Governor’s Workforce Policy Board surveyed Ohio manufacturers about which kinds of positions were hardest to fill, the answer was low-skilled, entry-level jobs, primarily because of “soft” skills and work ethic issues. In some situations, skills may not be the issue at all. Poor job quality or low compensation levels may shrink the pool of applicants. For some rural areas, the lack of educational and cultural amenities creates an additional barrier to recruitment. When employers’ focus shifts to filling intermediate-skill positions that require long-term training, one of the key challenges will be to encourage employers to design effective incentives for employees to participate in such training. This should lead to a discussion about employee turnover issues and the retention of staff. Developing a methodology to help employers understand the true costs of turnover would be helpful in this regard. Ohio has much to learn from other states’ experiences in addressing occupational shortages. Reports on the root causes of occupational shortages in Illinois and Indiana found a tenuous relationship among employers, workers, and public secondary and post-secondary training institutions, especially in manufacturing. From the employer’s standpoint, high schools are not teaching basic skills, both hard and “soft,” that help new employees succeed on the job in an era of increasing skill requirements. Guidance counselors do not understand the opportunities available for manufacturing careers or choose to direct students to other fields. Secondary and post-secondary institutions are de-emphasizing manufacturing-related courses. From the standpoint of employees already in the sector, manufacturing lacks career ladders and efforts to implement national credentialing systems are in the beginning stages. Some employers may not see a need for training or may lack the managerial capacity to plan and implement a successful long-term training policy. In Ohio, there has been a marked decrease in participation in manufacturing training programs and apprenticeships in the last few years. The closure of so many large facilities in recent years undoubtedly contributed to the decline in apprenticeships and created a negative perception of career prospects in the industry. Further research is needed into local labor markets and specific
35 www.policymattersohio.org

Policy Matters Ohio Occupational Shortages
educational institutions, but it is highly likely that the same set of circumstances that affected recruitment and training in other states also occurred in Ohio. The state needs a concerted effort to understand what training methods are now being used as substitutes for apprenticeships and public institutions, and what can be done to reinvigorate these traditional training paths. Reports in Illinois and Indiana identified shortages in some of the same manufacturing occupations that this study identified as growing in Ohio: machinists, welders, machinery maintenance, and assemblers. These reports from other states also make it clear that manufacturing is losing much of its traditional wage premium vis-à-vis other sectors, with predictable consequences. Jobs at the bottom of the manufacturing skill ladder are subject to the same issues as low-paid health care jobs: low morale, high turnover, and all too often, poor career prospects. Limited information from local workforce surveys in Cleveland and Dayton suggest that employee turnover rates in manufacturing remain lower than they are in health care, but the closure of larger facilities that tend to have a very stable workforce may lead to some convergence. Our study showed that real median wages are declining in most Ohio production occupations. Even though this outcome may be influenced by early retirements and buyouts of older workers, a continuation of this trend in the long-term will be devastating for the prospects of building career ladders in manufacturing (not to mention the standard of living of the workers themselves!). In health care, the prospect for building career ladders is much better because state licensing regulations create a well-defined set of requirements. The Ohio Skills Bank is focusing on this sector first. As discussed in this report, the general outlines of the nursing crisis are well known in Ohio and nationally. Wage data indicate that there is an occupational shortage of registered nurses in Ohio, but not for LPNs. Training capacity is a major issue for RNs, but job quality and retention are also at the center of the public policy agenda, as seen by the recent passage of a bill to establish hospital committees to recommend nurse to patient staffing ratios. Better staffing ratios might improve RN turnover rates. High turnover rates also affect other skilled hospital positions. For workers in health care support positions, such as home health aides and nurse assistants, real median wages have fallen even as the number of jobs has grown. The predicament of these workers is the same as that of many low-skilled people in Ohio’s economy who are caught in the shift to non-union, service sector jobs. It will be a major challenge for the Ohio Skills Bank to bring these individuals into a career ladder system, particularly if they work for long-term care facilities or other employers who do not have many positions higher up the skill ladder. For the thousands of health care support workers, the immediate public policy challenge is to build better institutional supports to increase their compensation levels and improve working conditions. Public funding through Medicare and Medicaid plays a major role in financing service delivery. Decisions about how to use these funds should be made with the needs of the workforce in mind.
www.policymattersohio.org 36

Occupational Shortages Policy Matters Ohio
Appendix 1
Local Workforce Surveys
Three local workforce surveys in major Ohio metropolitan areas provide a glimpse into employers’ perceptions of hard to fill positions in Cuyahoga County, Central Ohio, and Greater Dayton.102 The Cuyahoga County survey was performed in the third quarter of 2005, the Greater Dayton survey in December 2006, and the Central Ohio survey in April 2006. The surveys provide a wealth of information about local labor markets, but they are not strictly comparable because they occurred at different times, used different methodologies, and had somewhat different purposes. The Central Ohio survey, for example, asked questions about employer training that are not found in the other surveys. Nonetheless, they can provide partial information about occupational skills shortages across the state. Two of the surveys calculated vacancy rates in broad occupational categories and found that health care had some of the highest rates. In Cuyahoga County, the estimated vacancy rate was 4.9 percent for health care and social assistance, based on 5,147 vacancies and an employment level of 106,119 in 2004.103 This was the third-highest vacancy rate of any occupational category. The vacancy rate for health care practitioner and technical occupations in the Greater Dayton area was 3.83 percent; for health care support occupations, 4.37 percent.104 These two broad occupational categories had two of the four highest vacancy rates in Greater Dayton. The rate for food preparation and serving occupations was the highest at over six percent. Health care practitioners were tied with Architectural and Engineering occupations at 3.83 percent. The Central Ohio survey did not calculate vacancy rates, but asked employers which occupations that would be most difficult to fill.105 Employers provided the following production job titles: • Occupational/Physical Therapists • Client Manager • Emergency Medical Technician/Paramedic • Faculty • Lab Tech • Nurses 102 ODFJS. “Job Vacancy Survey. Pilot for Cuyahoga County. Third Quarter 2005. Available at www.lmi.state.oh.us; Community Research Partners. “Central Ohio Workforce Training Needs: Central Ohio Workforce Investment Corporation 2005 Employer Survey.” April 2006. Available at http://communityresearchpartners.org/uploads/publications//cowic_web.pdf. Wright State University and University of Dayton. “Job Vacancy Survey Report for the Greater Montgomery County Labor Market.” December, 2006. Available at http://www.thejobcenter.org/pdf/jvsreport.pdf. 103 Cuyahoga County Job Vacancy Estimates: Third Quarter 2005. Figure 8. “Summary by Major Industry.” p. 10. 104 Wright State University and University of Dayton, Table 6: “Major Occupational Categories,” p. 15. 105 Community Research Partners (2006). Appendix H. Job Titles for Positions with Most Hiring and Difficult to Fill Positions, Health Care Practitioners and Technical Staff, p. 205.
37 www.policymattersohio.org
Policy Matters Ohio Occupational Shortages
• Pharmacists • Radiographs/Radiology • Respiratory Therapists • Veterinary Tech. Healthcare Support • Home Health Aide • Nurses • Veterinary Asst. In Central Ohio, “Few people apply” and “wage you can offer” were the leading reasons employers put forward to explain why health care practitioners and technical staff positions were difficult to fill. Employers cited the former for 42 percent of the positions and the latter for 36 percent of positions.106 The Cuyahoga County and Greater Dayton surveys asked employers which positions were hard to fill and their average length of recruiting time. The studies used common categorizations of “constantly recruiting,” recruiting 30 – 59 days, and recruiting over 60 days. This approach provides an objective benchmark to identify which jobs are actually hard to fill. Table 6 displays recruiting information from the two surveys that pertain to a specific occupation in health care.107 The Greater Dayton survey identified just three health care occupations that were difficult to fill: RNs, LPNs, and nurse aides. The Cuyahoga County survey identified eight occupations.
106 Community Research Partners (2006). Appendix D. Table 5. Health Care Practitioners and Technical Staff Occupations. “Reasons Positions are Difficult to Fill,” p. 155. Respondents could choose more than one response. 107 Wright State University and University of Dayton, Table 9. “Montgomery County Job Vacancy Estimates for Hard to fill Jobs,” p. 26; ODJFS 2005., Figure 6. “Cuyahoga County Job Vacancy Estimates. Hard to fill Jobs,” p. 7.
www.policymattersohio.org 38

Occupational Shortages Policy Matters Ohio
Table 1
Length of Recruiting Time for Hard to fill Health Care Jobs: Cuyahoga County and Greater Dayton
Occupation Time Required to Fill Vacancies
Registered Nurse Constantly Recruiting (C) and (D)
LPNs 30- 59 days (D) Constantly Recruiting (C)
Nurse Aides Constantly Recruiting (C) and (D)
Home Health Aides Constantly Recruiting (C)
Physical Therapists Constantly Recruiting (C)
Physical Therapist Assistants Constantly Recruiting (C)
Medical and Clinical Lab Techs Over 60 days (C)
Medical Secretaries 30 – 59 days (C)
Source: Wright State Univ. & University of Dayton (2006). ODJFS (2005) Note: C = Cuyahoga, D = Dayton.
Local Workforce Surveys: Results for Manufacturing
Two of the surveys calculated vacancy rates in manufacturing. Vacancy rates are defined as the number of unfilled jobs as a percentage of total potential jobs (both filled and unfilled positions). In Cuyahoga County, the estimated vacancy rate for all occupations in manufacturing (production, management, and technical) was 1.2 percent, based on 1,098 vacancies and an employment level of 88,897 in 2004.108 The vacancy rate for production occupations in the Greater Dayton area also was 2.05 percent.109 These vacancy rates were well below the rates for health care occupations.
108 Cuyahoga County Job Vacancy Estimates: Third Quarter 2005. Fig. 8 “Summary by Major Industry.” p. 10. 109 Wright State University and University of Dayton, Table 6: “Major Occupational Categories,” p. 15.
39 www.policymattersohio.org

Policy Matters Ohio Occupational Shortages
The Central Ohio survey did not calculate vacancy rates, but asked employers which occupations that would be most difficult to fill.110 Employers provided the following production job titles, some of which were not specific enough to identify a specific occupation: • Chemical Operators • Cleaner • Electrician • Associate Receiving Department • Painter/Operator • Process Tech • Production • Temporary Workers • Welder “Job-specific skills” and “required work experience” were far and away the leading reasons employers put forward to explain why these positions were difficult to fill. Employers cited the former for 53 percent of the positions and the latter for 47 percent of positions.111 The Cuyahoga County and Greater Dayton surveys asked employers which positions were hard to fill and their average recruiting time. The studies, as with the health care studies described above, used common categorizations of “constantly recruiting,” recruiting 30 – 59 days, and recruiting over 60 days. This approach provides an objective benchmark to identify which jobs are actually hard to fill. Table 14 displays recruiting information from the two surveys that pertain to a specific occupation in manufacturing.
110 Community Research Partners (2006). Appendix H. Table 3 “Manufacturing Sector: Occupational Categories for Projected Positions with Most Hiring and Difficult-to-fill Positions,” p. 112. 111 Community Research Partners (2006). Appendix D. Table 5. “Manufacturing Sector: Reasons Positions are Difficult to Fill,” p. 113. Respondents could choose more than one response.
www.policymattersohio.org 40

Occupational Shortages Policy Matters Ohio
Table 2
Length of Recruiting Time for Hard to fill Manufacturing Jobs: Cuyahoga County and Greater Dayton
Occupation Time Required to Fill Vacancies
Engineers, All Other Over 60 Days (D)
Engineering Managers
30-59 Days (C) Over 60 Days (D)
Industrial Engineers Over 60 Days (C)
Machinists Over 60 days (D)
Mold Makers Over 60 Days (C)
Sales Representatives, Wholesale and Manufacturing 30-59 Days (C) and (D)
Team Assemblers Constantly Recruiting (C)
Laborers and Freight, Stock, and Materials Movers, Hand Recruiting 30-59 Days (D)
Source: Wright State Univ. & University of Dayton (2006). ODJFS (2005); Note: C = Cuyahoga, D = Dayton
41 www.policymattersohio.org

Policy Matters Ohio Occupational Shortages
www.policymattersohio.org 42
Appendix 2
Summary of the findings of the Illinois Health Care Task Force: Causes of the RN shortage in Illinois112
1. Retention of Nurses in practice. Some of the factors affecting retention included stressful work environments, inflexible work schedules, a lack of support services (e.g., child care and transportation), inadequate career advancement opportunities, a large cohort of impending retirements, and better pay and amenities in border states. 2. Recruitment/Placement and Recapturing Licensed Nurses Not in Practice. Recruitment problems were especially acute in rural areas that lacked amenities and did not offer competitive salaries, leading nurses to migrate elsewhere in the state. Young nurses who wanted to start families wanted flexible hours. Some nurses chose employment agencies rather than permanent employment because of better pay and more flexible scheduling. Nurses who did not have recent clinical experience lacked opportunities for refresher courses. 3. Nursing Program enrollment and completion. Programs lacked capacity because of insufficient revenue from tuition and reimbursement, faculty shortages, and lack of clinical opportunities, especially in rural areas. Faculty shortages were due to factors such as lower pay in academic settings, lack of interest, and stringent credentialing requirements. Nursing programs also had problems with attrition and licensure exam passage rates due to inadequate student supports and financial aid, inadequate ESL assistance, and academic deficiencies. 4. Developing a Pool of Qualified Applicants. Students and guidance counselors did not understand or were not aware of all healthcare career opportunities. Students who were interested in health care lacked adequate preparation to enter nursing programs. There was a lack of outreach and career pathways to both existing and new workers.
112 Author’s summary of Illinois Workforce Investment Board, Health Care Task Force: Findings and Recommendations. (December 2006), Appendix C, pp. 15-16.

Policy Matters Ohio is a non-profit, non-partisan research institute dedicated to researching an economy that works for all in Ohio. Policy Matters seeks to broaden debate about economic policy by providing research on issues that matter to Ohio’s working people and their families. Areas of inquiry for Policy Matters include work, wages, and benefits; education; economic development; energy policy; and tax policy. Generous funding comes from the Joyce, Gund, Cleveland and Sisters of Charity Foundations and the Economic Policy Institute. To those who want a more fair and prosperous economy… Policy Matters.
3631 Perkins Avenue, Suite 4C - East • Cleveland, Ohio 44114 • 216/361-9801
Columbus: 1372 Grandview Ave, Suite 242 • Columbus, Ohio 43212 • 614/486-4601
http://www.policymattersohio.org/
© 2007 Policy Matters Ohio. Permission to reproduce this report is granted provided that credit is given to Policy Matters Ohio. All rights reserved.