obtaining essential performance with the pentacam … · obtaining essential performance with the...
TRANSCRIPT
16
Highlights of Ophthalmology • Vol. 38, Nº 5
Obtaining Essential Performance with thePentacam System for Corneal Surgery
L. Felipe Vejarano, MD, Fundacion Oftalmologica Vejarano, Popayan, Cauca, Colombia. Department of Ophthalmology, Universidad del Cauca, Popayan, Cauca, Colombia.
Refractive Map
The following graphical map provides us with the most important information about the structure of the cornea. It has been specially designed for refractive sur-geons. You can count with four different graphics to analyze the cornea, but to obtain the maximum effi-ciency and detect any corneal pathology it is important to turn each map more sensitive. Sagittal: Use the absolute scale, American style, 61 colors and diopters. Elevation: Program the BFS floating manual to 9 mm, relative scale fine in 5 microns, American Style and 61 colors. Pachymetry: Use Oculus thick relative scale in steps of 20 microns, 61 colors and a 9mm diameter. This is important to evaluate the thinnest point decen-tration or asymmetry comparing nasal and temporal distance. Now that each graphic is more sensitive, it is very important to make a precise interpretation of them.
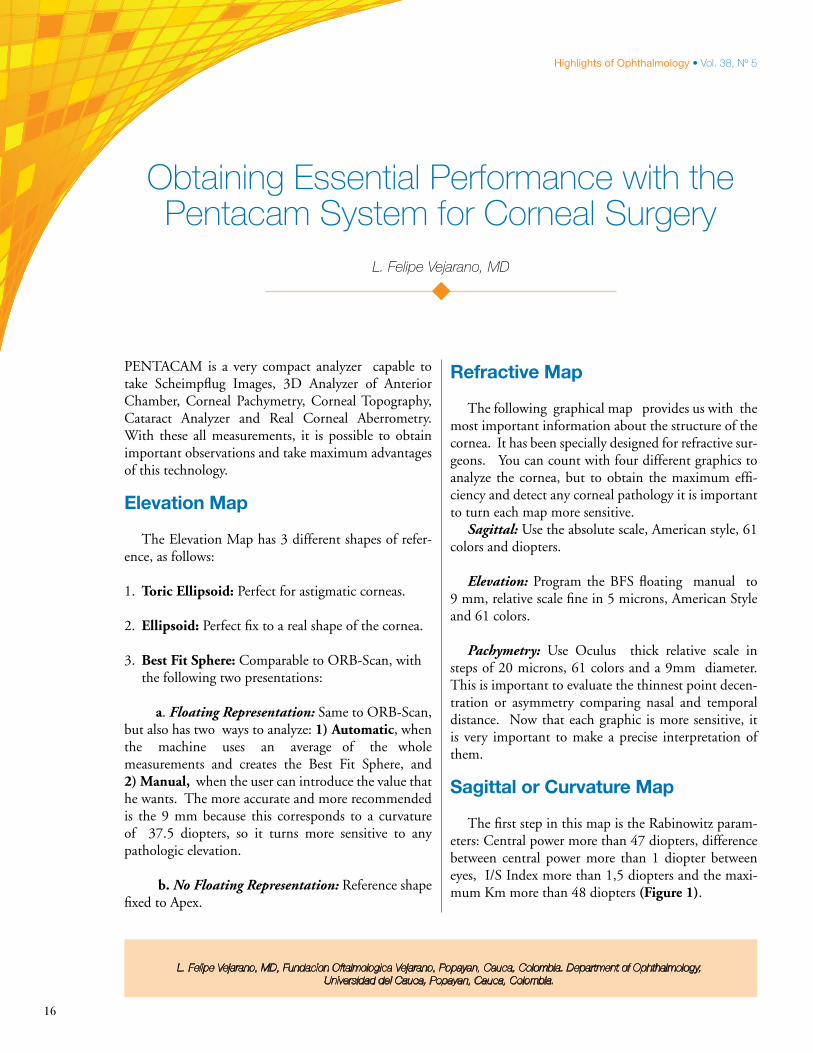
Sagittal or Curvature Map
The first step in this map is the Rabinowitz param-eters: Central power more than 47 diopters, difference between central power more than 1 diopter between eyes, I/S Index more than 1,5 diopters and the maxi-mum Km more than 48 diopters (Figure 1).
L. Felipe Vejarano, MD
PENTACAM is a very compact analyzer capable to take Scheimpflug Images, 3D Analyzer of Anterior Chamber, Corneal Pachymetry, Corneal Topography, Cataract Analyzer and Real Corneal Aberrometry. With these all measurements, it is possible to obtain important observations and take maximum advantages of this technology.
Elevation Map
The Elevation Map has 3 different shapes of refer-ence, as follows:
1. Toric Ellipsoid: Perfect for astigmatic corneas.
2. Ellipsoid: Perfect fix to a real shape of the cornea.
3. Best Fit Sphere: Comparable to ORB-Scan, with the following two presentations:
a. Floating Representation: Same to ORB-Scan, but also has two ways to analyze: 1) Automatic, when the machine uses an average of the whole measurements and creates the Best Fit Sphere, and 2) Manual, when the user can introduce the value that he wants. The more accurate and more recommended is the 9 mm because this corresponds to a curvature of 37.5 diopters, so it turns more sensitive to any pathologic elevation.
b. No Floating Representation: Reference shape fixed to Apex.
17
www.jphmedical.com
Figure 1: Refractive Map. Interpretation of Curvature Map.
Elevation Map
In these maps most of the surgeons use the data of the apex but this is not the most precise point, so when you analyze these graphics always use the thinnest point, which is more sensitive.
Anterior Elevation < 12 microns = normal 12 to 15 microns = suspect >15 microns = KKPosterior Elevation 5 microns more than the anterior elevation
After you examine each eye, you have to compare between the apex and the thinnest point in the same eye and between eyes. The difference between all these measurements should not be more than 5 to 8 microns.
Pachymetric Map
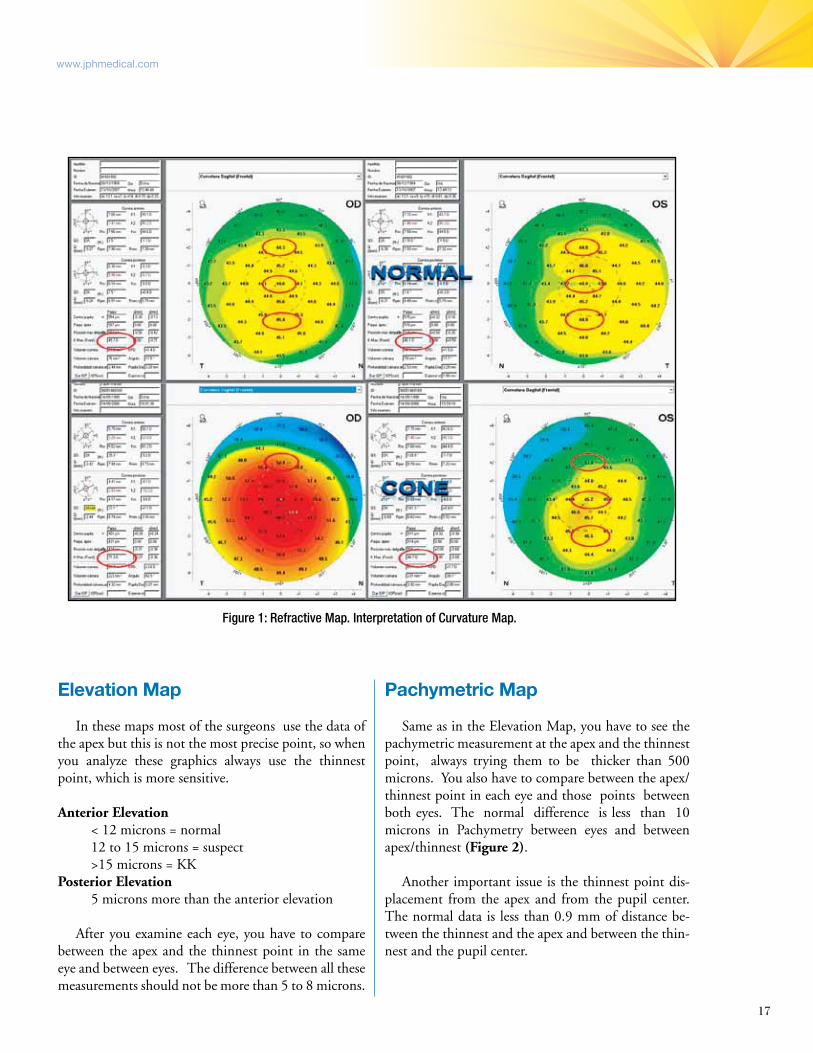
Same as in the Elevation Map, you have to see the pachymetric measurement at the apex and the thinnest point, always trying them to be thicker than 500 microns. You also have to compare between the apex/thinnest point in each eye and those points between both eyes. The normal difference is less than 10 microns in Pachymetry between eyes and between apex/thinnest (Figure 2).
Another important issue is the thinnest point dis-placement from the apex and from the pupil center. The normal data is less than 0.9 mm of distance be-tween the thinnest and the apex and between the thin-nest and the pupil center.
18
Highlights of Ophthalmology • Vol. 38, Nº 5
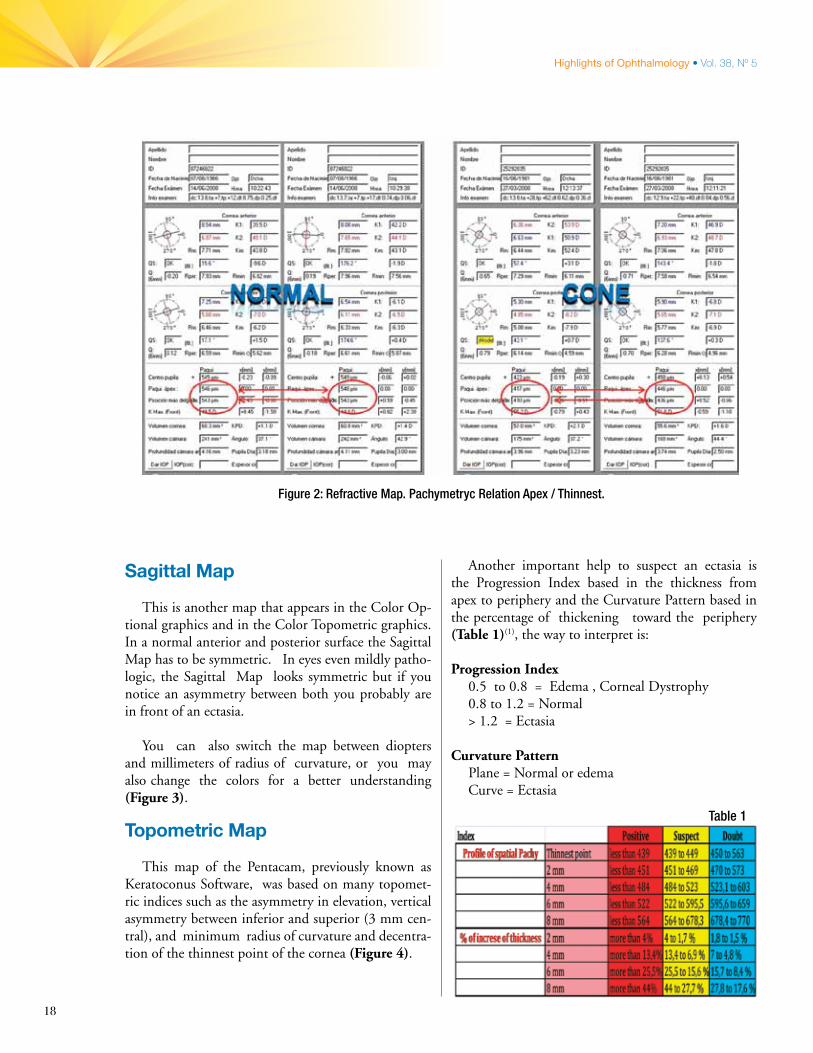
Sagittal Map
This is another map that appears in the Color Op-tional graphics and in the Color Topometric graphics. In a normal anterior and posterior surface the Sagittal Map has to be symmetric. In eyes even mildly patho-logic, the Sagittal Map looks symmetric but if you notice an asymmetry between both you probably are in front of an ectasia. You can also switch the map between diopters and millimeters of radius of curvature, or you may also change the colors for a better understanding (Figure 3).
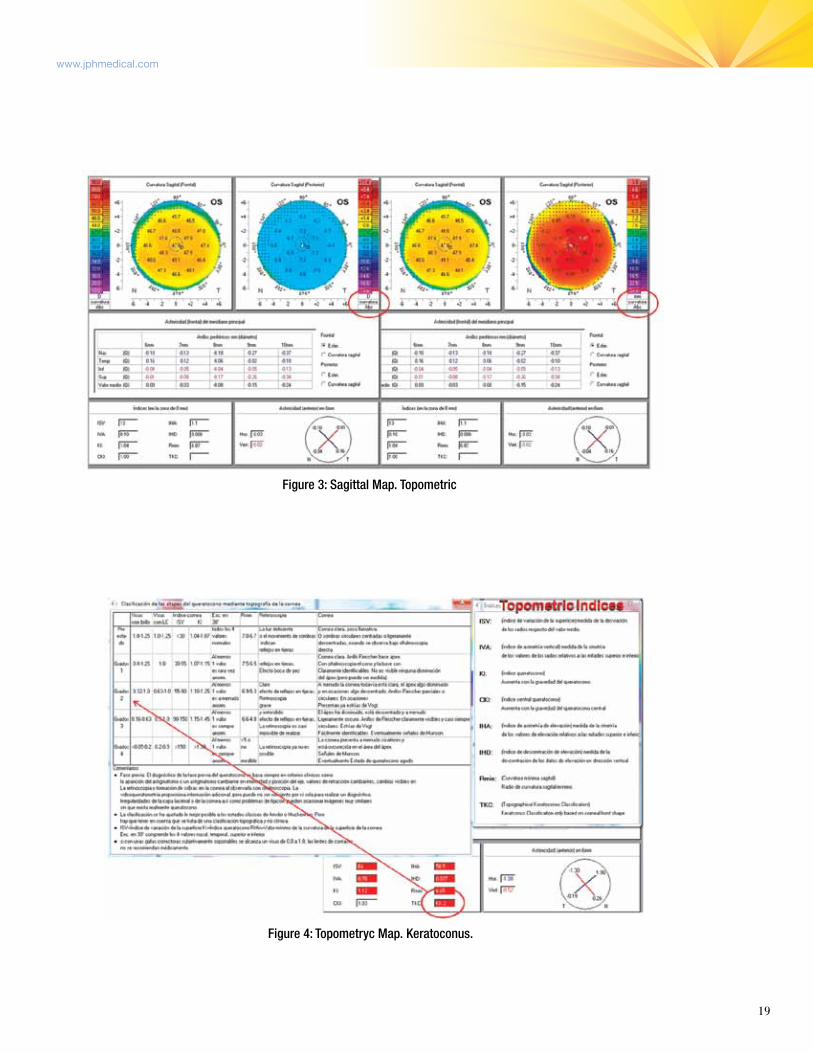
Topometric Map
This map of the Pentacam, previously known as Keratoconus Software, was based on many topomet-ric indices such as the asymmetry in elevation, vertical asymmetry between inferior and superior (3 mm cen-tral), and minimum radius of curvature and decentra-tion of the thinnest point of the cornea (Figure 4).
Another important help to suspect an ectasia is the Progression Index based in the thickness from apex to periphery and the Curvature Pattern based in the percentage of thickening toward the periphery (Table 1)(1), the way to interpret is:
Progression Index 0.5 to 0.8 = Edema , Corneal Dystrophy 0.8 to 1.2 = Normal > 1.2 = Ectasia
Curvature Pattern Plane = Normal or edema Curve = Ectasia
Table 1
Figure 2: Refractive Map. Pachymetryc Relation Apex / Thinnest.
19
www.jphmedical.com
Figure 3: Sagittal Map. Topometric
Figure 4: Topometryc Map. Keratoconus.
20
Highlights of Ophthalmology • Vol. 38, Nº 5
Belin/Ambrosio Map
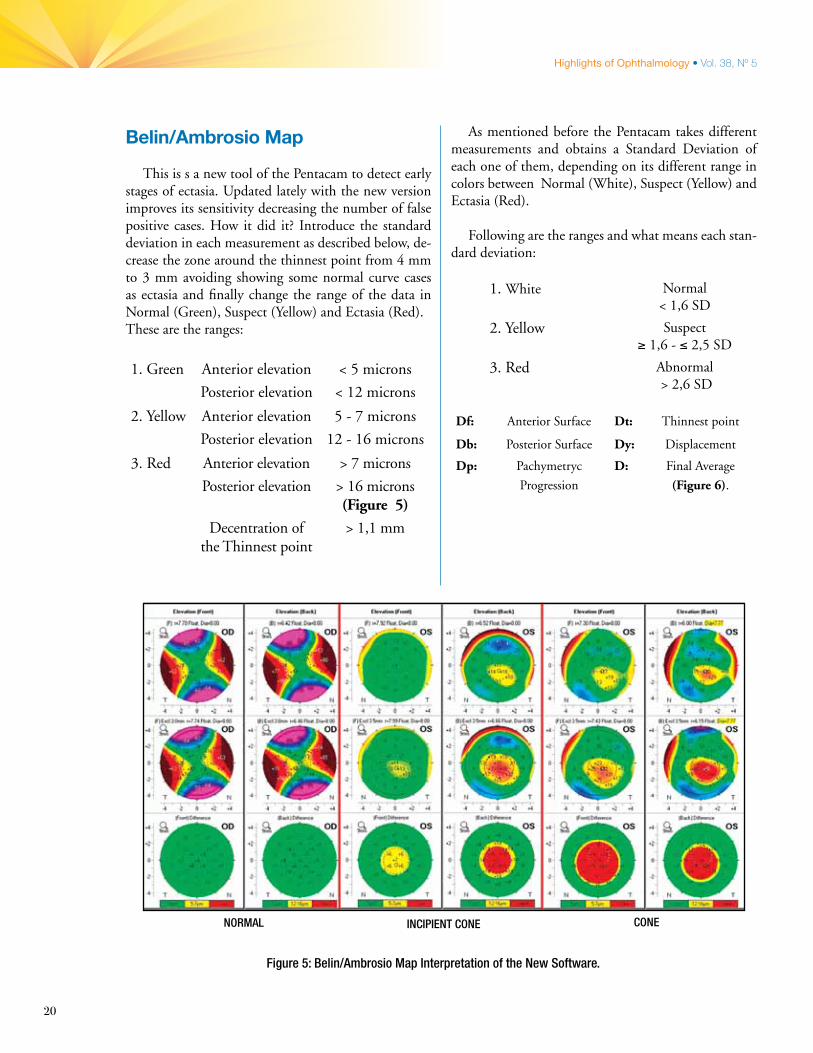
This is s a new tool of the Pentacam to detect early stages of ectasia. Updated lately with the new version improves its sensitivity decreasing the number of false positive cases. How it did it? Introduce the standard deviation in each measurement as described below, de-crease the zone around the thinnest point from 4 mm to 3 mm avoiding showing some normal curve cases as ectasia and finally change the range of the data in Normal (Green), Suspect (Yellow) and Ectasia (Red).These are the ranges:
Figure 5: Belin/Ambrosio Map Interpretation of the New Software.
NORMAL INCIPIENT CONE CONE
1. Green Anterior elevation < 5 microns
Posterior elevation < 12 microns
2. Yellow Anterior elevation 5 - 7 microns
Posterior elevation 12 - 16 microns
3. Red Anterior elevation > 7 microns
Posterior elevation > 16 microns (Figure 5)
Decentration of the Thinnest point
> 1,1 mm
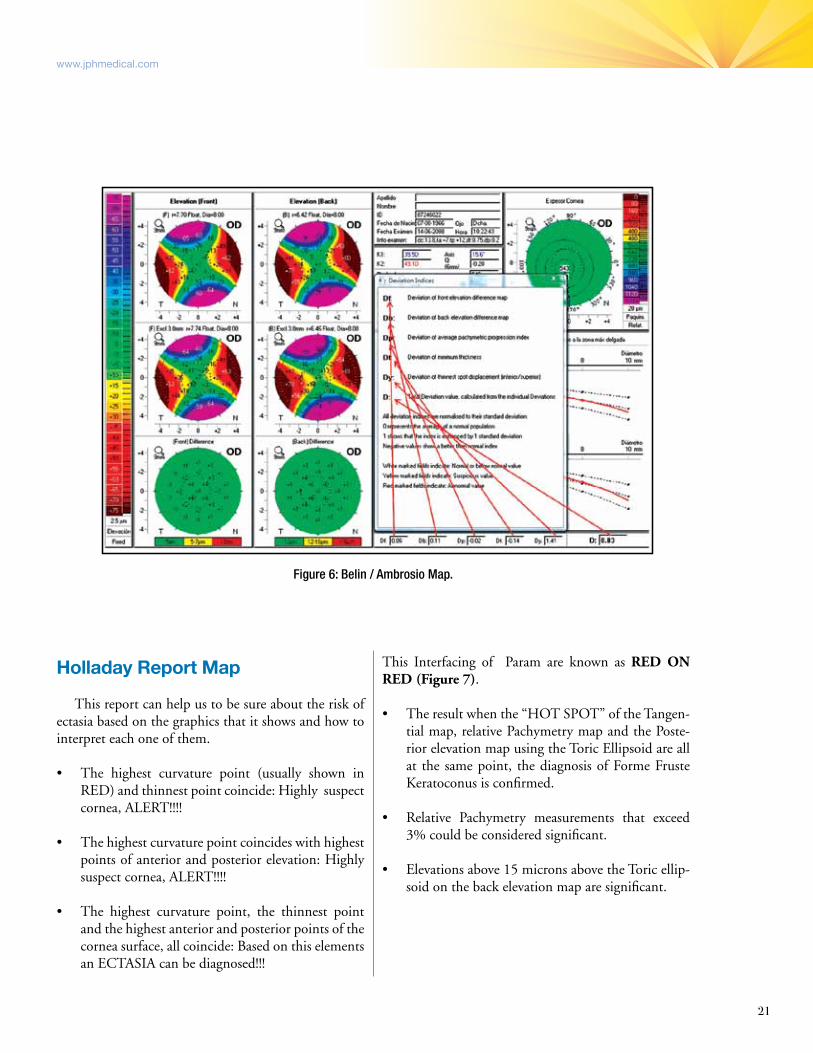
1. White Normal< 1,6 SD
2. Yellow Suspect≥ 1,6 - ≤ 2,5 SD
3. Red Abnormal > 2,6 SD
Df: Anterior Surface Dt: Thinnest point
Db: Posterior Surface Dy: Displacement
Dp: Pachymetryc
Progression
D: Final Average
(Figure 6).
As mentioned before the Pentacam takes different measurements and obtains a Standard Deviation of each one of them, depending on its different range in colors between Normal (White), Suspect (Yellow) and Ectasia (Red).
Following are the ranges and what means each stan-dard deviation:
21
www.jphmedical.com
Holladay Report Map
This report can help us to be sure about the risk of ectasia based on the graphics that it shows and how to interpret each one of them.
• The highest curvature point (usually shown in RED) and thinnest point coincide: Highly suspect cornea, ALERT!!!!
• The highest curvature point coincides with highest points of anterior and posterior elevation: Highly suspect cornea, ALERT!!!!
• The highest curvature point, the thinnest point and the highest anterior and posterior points of the cornea surface, all coincide: Based on this elements an ECTASIA can be diagnosed!!!
Figure 6: Belin / Ambrosio Map.
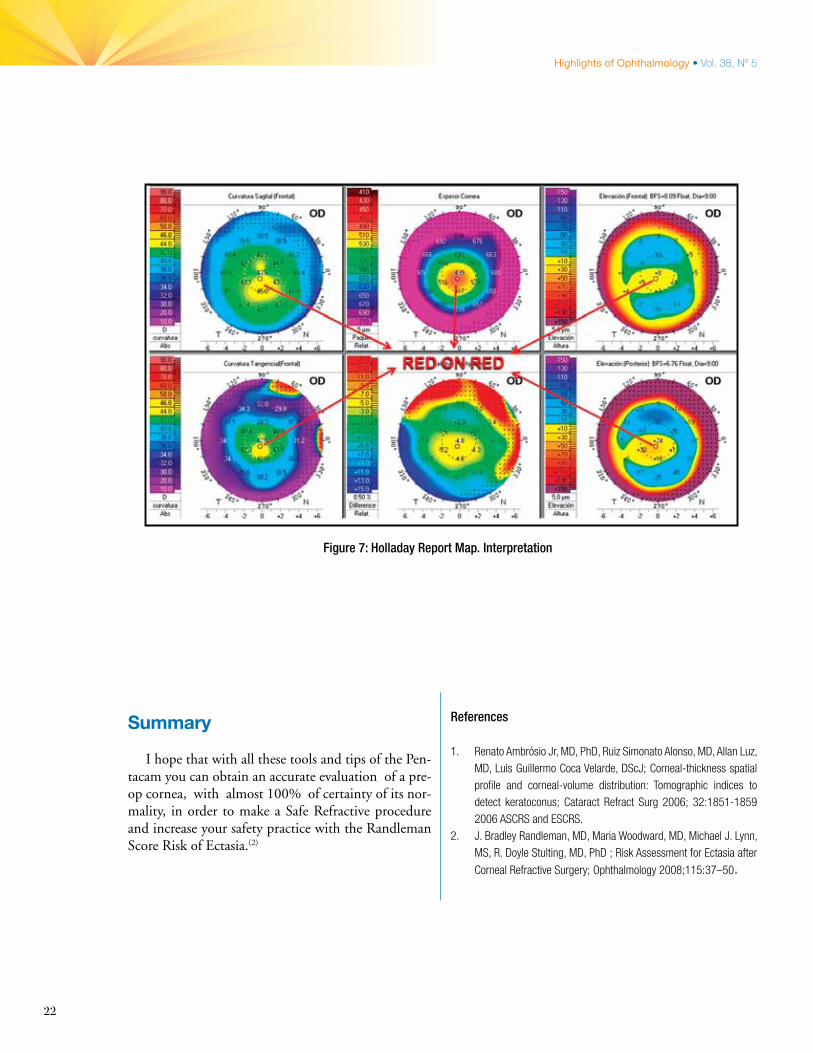
This Interfacing of Param are known as RED ON RED (Figure 7).
• The result when the “HOT SPOT” of the Tangen-tial map, relative Pachymetry map and the Poste-rior elevation map using the Toric Ellipsoid are all at the same point, the diagnosis of Forme Fruste Keratoconus is confirmed.
• Relative Pachymetry measurements that exceed 3% could be considered significant.
• Elevations above 15 microns above the Toric ellip-soid on the back elevation map are significant.
22
Highlights of Ophthalmology • Vol. 38, Nº 5
Figure 7: Holladay Report Map. Interpretation
Summary
I hope that with all these tools and tips of the Pen-tacam you can obtain an accurate evaluation of a pre-op cornea, with almost 100% of certainty of its nor-mality, in order to make a Safe Refractive procedure and increase your safety practice with the Randleman Score Risk of Ectasia.(2)
References
1. RenatoAmbrósioJr,MD,PhD,RuizSimonatoAlonso,MD,AllanLuz,MD,LuisGuillermoCocaVelarde,DScJ;Corneal-thicknessspatialprofile and corneal-volume distribution: Tomographic indices todetect keratoconus; Cataract Refract Surg 2006; 32:1851-18592006ASCRSandESCRS.
2. J.BradleyRandleman,MD,MariaWoodward,MD,MichaelJ.Lynn,MS,R.DoyleStulting,MD,PhD;RiskAssessmentforEctasiaafter
CornealRefractiveSurgery;Ophthalmology2008;115:37–50.