observation of jets in high transverse energy events at the cern proton antiproton collider
TRANSCRIPT

Volume 123B, number 1,2 PHYSICS LETTERS 24 March 1983
OBSERVATION OF JETS IN HIGH TRANSVERSE ENERGY EVENTS
AT THE CERN PROTON ANTIPROTON COLLIDER
UA1 Collaboration, CERN, Geneva, Switzerland
G. ARNISON J, A. ASTBURY J, B. AUBERT b, C. BACCI i, R. BERNABEI i, A. Bt~ZAGUET d R. BOCK d, T.J.V. BOWCOCK f, M. CALVETT1 d T. CARROLL d, p. CATZ b S. CENTRO d F. CERADINI i, S. CITTOLIN d, C. COCHET k, j. COLAS b, M. CORDEN c, D. DALLMAN l, S. D'ANGELO 1, M. DeBEER k, M. DELLA NEGRA b, M. DEMOULIN d, D. DENEGRI k, D. DiBITONTO d, L. DOBRZYNSKI g, J.D. DOWELL c, M. EDWARDS c, K. EGGERT a, E. EISENHANDLER f, N. ELMS c, p. ERHARD a, H. FAISSNER a, G. FONTAINE g, R. FREY h, R. FRUHWIRTH 1, j. GARVEY c, S. GEER g, C. GHESQUII~RE g, P. GHEZ d, K.-L. GIBONI a, W.R. GIBSON f, Y. GIRAUD-HI~RAUD g, A. GIVERNAUD 1, A. GONIDEC b, G. GRAYER J, P. GUTIERREZ h T. HANSL-KOZANECKA a, W.J. HAYNES J, L.O. HERTZBERGER 1 C. I'IODGES b D. HOFFMANN a, H. HOFFMANN d, D.J. HOLTHUIZEN a, R.J. HOMER c, A. HONMA f, W. JANK d, P.I.P. KALMUS f, V. KARIMAKI e, R. KEELER f, 1. KENYON c, A. KERNAN h, R. KINNUNEN e, H. KOWALSKI d, W. KOZANECKI h, D. KRYN g, F. LACAVA d j..p. LAUGIER k j.p. LEES b H. LEHMANN a, R. LEUCHS a, A. LI~VI~QUE k, D. LINGLIN b, E. LOCCI k j . . j . MALOSSE k T. MARKIEWICZ d, G. MAURIN d, T. McMAHON c, j..p. MEND1BURU g, M.-N. MINARD b, M. MORICCA i, F. MULLER d, A.K. NANDI J, L. NAUMANN d, A. NORTON d A. ORKIN-LECOURTOIS g, L. PAOLUZI i, G. PIANO MORTARI d M. PIMIA e, A. PLACCI d E. RADERMACHER a, j. RANSDELL h, H. REITHLER a, j..p. REVOL d j. RICH k M. RIJSSENBEEK d, C. ROBERTS J, C. RUBBIA d, B. SADOULET d G. SAJOT g, G. SALVI f, G. SALVINI i, j . SASS k j. SAUDRAIX k A. SAVOY-NAVARRO k, D. SCHINZEL d W. SCOTT j T.P. SHAH J, M. SPIRO k, j . STRAUSS 1, K. SUMOROK c, F. SZONCSO 1, G. THOMPSON f, J. TIMMER d, E. TSCHESLOG a, j. TUOMINIEMI e, j._p. VIALLE d, j . VRANA g, V. VUILLEMIN d, H.D. WAHL l, p. WATKINS c, j. WILSON c, M. YVERT b and E. ZURFLUH d Aachen a-Annecy (LAPP) b-Birmingham c-CERN d-Helsinki e-Queen Mary College, London f-Paris [Coll~ge de France) g-Riverside h Rome i-Rutherford Appleton Laboratory J-Saelay (CEN) k_ Vienna 1 Collaboration
Received 23 December 1982
With a segmented total absorption calorimeter of large acceptance, we have measured the total transverse energy spec- trum for p~ collisions at s 1/2 = 540 GeV up to 2,E T = 130 GeV in the pseudo-rapidity range Irtl < 1.5. Using two different algorithms, we have looked for localized depositions of transverse energy (jets). For NE T > 40 GeV, the fraction of events with two jets increases with NET; this event structure is dominant for 2E T > 100 GeV. We measure the inclusive jet cross section up to ET(jet) = 60 GeV and the two-jet mass distribution up to 120 GeV/c 2. The measured cross sections are com- patible with the predictions of hard scattering models based on QCD.
1. Introduct ion. We have recently reported a mea- surement of the transverse momentum spectrum of
1 NIKHEF, Amsterdam, The Netherlands.
charged particles up to 10 GeV [1 ] and of correla- tions (in rapidity and azimuthal angle) between charged particles of high transverse momentum t2] produced in pro ton-ant ipro ton collisions at s 1/ =
0 031-9163/83/0000-0000/$ 03.00 © 1983 North-Holland 115

Volume 123B, number 1,2 PHYSICS LETTERS 24 March 1983
540 GeV [3]. Those results strongly suggest produc- tion of two jets in opposite azimuthal hemispheres, as expected from a picture of hard scattering and frag- mentation of partons [4]. That analysis [2] and simi- lar studies at the ISR [5,6] have exploited the fact that a particle with high PT "tags" events containing a jet. Selection of such events however allows only the study of a limited class of jet events.
Calorimetric measurements enable one to search for jets in a less biased way by looking for local energy concentrations above the soft background [7,81.
In this letter we report on the observation of about 200 jets with transverse energy above 20 GeV, as detected by a total absorption calorimeter in the pseudorapidity range In l < 1.5.
2. Apparatus. The UA 1 experiment has been extensively described elsewhere [9], so only those components of the detector relevant to the investiga- tion reported here will be described (see fig. 1).
The central detector was used to validate the beam-beam nature and the geometry of an event (vertex, impact point on calorimeters, etc.). It con- sists of a cylindrical drift chamber volume (5.8 m long, 2.3 m in diameter) surrounding the interaction region, in a magnetic dipole field of about 0.56 T.
The central electromagnetic calorimeter is placed inside the magnet. It consists of two semi-cylindrical half-shells, one on either side of the beam axis, with an inner radius of 1.36 m. In each half-shell there are 24 modules, each formed from alternate layers of lead (1.2 mm) and scintillator (1.5 mm). They extend over approximately 180 ° and measure 4 m around the half circumference and 22.5 cm in the beam direction. They are 26.6 radiation lengths (RL) deep and are read out in four segments in depth (3.3/6.6/10.1/6.6 RL respectively). The light produced in each segment is seen by wavelength shifter plates on each side of the counter, which in turn are connected via light guides to 4 photomultipliers (PMs), located outside the magnet (2 PMs at the top and 2 PMs at the bot- tom, see fig. lb). A comparison of the pulse heights of the top and bottom PMs in each segment gives a measurement of the azimuthal angle 4) for localized energy depositions. The range in pseudorapidity cov- ered by a cell varies with 0, from At /~ 0.08 at 0 = 25 ° to At/-~ 0.16 at 0 = 90 °.
UA I Central ca lor imet ry
e : 25 ° I 8 : 155 ° "O=J5 ~ ] //T,~ 15
a) Horizontal cut
~ ] E rn Calorimeters y
~ HaOron
o% b ) Cross cut
Fig. 1. The UA1 central calorimeters. (a) Horizontal cut (along the beam axis); (b) cross cut (perpendicular to the beam direction). Hatched areas represent the calorimeter cells used for this analysis. The location of the magnet coil (20 cm of a luminium) is indicated.
Particles which traverse the electromagnetic (EM) calorimeters encounter the hadron calorimeter built from scintillator plates inserted into the laminated yoke of the magnet; there are 16 iron plates each 5 cm thick, and 16 scintillator plates each 1 cm thick. The calorimeter is segmented into 232 stacks, each with an acceptance of approximately equal size, At/ 0.3, Aq~ -~. 15 °.
3. Energy response and calibration. All types of UA 1 calorimeter configurations have been extensively studied in test beams and their responses as a function of angle of incidence, energy and nature of the inci- dent particle have been determined [10]. It is found that hadrons deposit a significant fraction of their energy in the EM calorimeter. Due to nuclear effects, the response to hadrons of the combined EM and hadron calorimeter is smaller than its response to EM showers of the same energy. The ratio between the two is ~0.9 for energies above 20 GeV, drops to 0.84
116

Volume 123B, number 1,2 PHYSICS LETTERS 24 March 1983
at 5 GeV and decreases further below 5 GeV. For p < 0.5 GeV/c the calorimeter response reflects essen- tially the kinetic energy of the particles. These obser- vations are in good agreement with extensive Monte Carlo calculations on shower development [11 ]. These facts introduce for individual events an uncer- tainty in the energy deduced from measurements in our calorimeters, since the relative electromagnetic and hadronic composition of an event was not deter- mined. However, an average correction factor is applied. The transverse energy is calculated using the expression
~ E T =¢Xem S E em sin 0 i + ~ E had sin Oi,
where E[m is the energy of an electron that would give the observed response in the EM cell at 0 i, E/had is the energy of a hadron giving that response in the hadronic cell at the polar angle Oi, and O~em is the aver- age correction for difference of response. We use ¢Xem = 1.13 which corresponds to an equal mixture of n+, 7r- and 7r 0 at high momenta (~>10 GeV/c). At lower momenta, the correction would be expected to be somewhat larger. A significant r~ 0 production would tend to reduce O~em.
A detailed correction efficiency map of each ele- ment o f the EM calorimeter has been determined and is checked before and after every running period by fine scanning with a collimated 3' beam from a 4 Ci 6°Co source. The response of EM calorimeters to the source was compared with their response to electrons in a test beam. Using this comparison, the energy scale for the EM calorimeters in the collider experiment was determined by irradiation with the source. The overall reproducibility of this calibration method was found to be better than -+2%.
For the hadron calorimeter this calibration method could not be applied because of insufficient penetra- tion of the 3'-rays. In this case, the absolute energy scale has been determined to within +6% from the ob- served responses of test modules to hadrons of known energy measured relative to muons of 5 GeV/c. Cos- mic-ray muons were used as an energy reference for the assembled calorimeter and 106Ru ~3-sources were placed in reproducible positions on every scintillator at the time of setting up. The absolute calibration is adjusted by re-insertion of these/3-sources and by mea- surement of the calorimeter response to cosmic-ray muons over a restricted set of the calorimeter cells.
The energy resolution for EM showers has been found to be o(E) ~ 0.16E 1/2, and the resolution in azimuth for a localized energy deposition was found to be o(¢) ~ 0.3/E 1/2 with E in GeV, ¢ in tad. For hadrons incident on the EM and hadronic calorimeter o(E) ~ 0.8E 1/2.
The photomultiplier gains for all calorimeters are monitored as a function of time by laser calibration systems using fibre optics [13], in turn calibrated by precision photodiodes [14] or reference sources. This method has shown reproducibility within (1-2)% over periods in excess of a year [14,15].
4. Data collection and reduction. The data were taken during an early run of the SPS proton-ant ipro- ton collider in December 1981. As previously de- scribed [1,2], two pairs ofhodoscopes subtending polar angles 0.7 ° < 0 < 3.2 ° and 5 ° < 0 < 25 ° were used in coincidence to define a p~ collision (minimum bias trigger). In addition a total transverse energy trig- ger [16] required a minimum transverse energy depo- sition in the calorimeters covering the region Ir/I < 3. The thresholds used were 20, 30 and 40 GeV. Table 1 gives a summary of the data taken under the various trigger conditions.
Timing information from the trigger hodoscopes was used off-line to reduce the amount of beam-gas interactions to a negligible level (<2%) as in our previ- ous work [1,2]. These trigger counters were also used as a collision rate monitor; we estimate our total inte- grated luminosity corrected for dead-time losses to be 22/lb 1, assuming a total inelastic cross section of 40 mb.
For the analysis presented here, only the pseudo-
Table 1 Summary of data taken under various trigger conditions: The first column gives the trigger threshold, i.e. the minimum value of 2'ET, where 2;' refers to the region IrTI < 3; columns 2 and 3 give the numbers of events before and after off-line beam-beam selection.
Trigger Number of Number of events threshold triggers after beam-beam
selection
20 118440 114659 30 64777 45560 40 17376 11940
117

Volume 123B, number 1,2 PHYSICS LETTERS 24 March 1983
i0 -27
> Id 28
~E 10-29
- - 10.5o
Ld IU ~
103Z
10 33
tO
0 8
z 06
%o4
LL 02
0)
r i ~ ] --
ENERGY DISTRIBUTION J [04~
IC 3
102
I o
a
r • 1
J
20 40 6o 8o IOO 12c,
ZE T (SeV)
Fig. 2. (a) Total transverse energy distribution do/dNET, where the sum is extended over the region I~1 < 1.5; (b) frac- tion of two-jet events selected by the "window" algorithm as a function of the total transverse energy in the region I r/I < 1.5. The curve is the result of the LPS Monte Carlo calcula- tion mentioned in section 5.
rapidity region Ir?l < 1.5 was considered. There are 6051 events with NET > 40 GeV, 279 with NET > 60 GeV and 5 events with NE T > 100 GeV.
Fig. 2a shows the total transverse energy distribu- tion do/dEET, where £ E is taken over the region Ir?l < 1.5 *~. In order to get an unbiased spectrum for NET < 40 GeV, a sample of minimum bias data was used to obtain that part of the distribution. These data were also used to check the performance of the trigger and the absolute normalisation of the data taken with the high E T trigger. The loss of events with 2;E T < 40 GeV due to the trigger which imposes a condit ion on E'ET (see table 1) is <8%.
5. Search forjets. In order to find jets in our high
* ~ Unless explicitly stated otherwise the symbol NE T refers in the following to the total transverse energy in the pseu- do-rapidity region Lrl[ < 1.5, whereas ZtET applies to 171 < 3.0.
EET event sample, we have to give an operational definition of a " je t" in terms of energy deposition in the calorimeter cells. A certain arbitrariness is involved, which will affect any quantitative statements made about the jets. In order to estimate the magnitude of the resulting uncertainties, we have used two algo- rithms, the "window" and the "cluster" algorithm:
(a) The main virtue of the window algorithm is its simplicity; in each half-shell of the central calorimeter (see fig. la) , any group of 8 adjacent electromagnetic cells together with the hadronic ones matching them in the projection defines a "window" (AT/~ 1). In each half-shell, the window with the largest deposition of transverse energy is selected. If this transverse energy exceeds two-thirds of the total transverse energy deposited in that half-shell, the window is said to contain a " je t" . This yields a simple definition of "0-jet" , "1-jet" and "2-jet" events.
The transverse energy of a jet is defined as: ET(jet) = NET(windows) - 2~ET(background), where the background subtraction is done for every event assuming that the transverse energy density (per unit of r/) of the soft background within the window is the same as its average outside the window.
(b) The cluster algorithm searches for energy clus- ters in (r/, ~) space. An energy vector is associated with each calorimeter cell. In the case of a hadronic cell this vector points from the collision vertex to the centre of the cell. In the case of an electromagnetic cell, the vector points to the energy centroid deter- mined from the 4 pulse height measurements in each segment. At first only cells with E T > 2.5 GeV are considered. They are grouped into clusters if the dis- tance between them in (rl, 40 space, d = (Ar/2+A~b2) 1/2 (with q~ in rad), is smaller than 1. Vectors with ET < 2.5 GeV are then associated with the closest cluster if they make an angle relative to the cluster axis smaller than 45 o and their transverse energy relative to the cluster axis is smaller than 1 GeV. (The cluster axis is defined as the direction of the vector obtained by summing the energy vectors of all cells that have been assigned to the cluster.)
6. Observation of jet events. The easiest way of demonstrating the existence of jets in our data is with the window algorithm. Fig. 2b shows the fraction of two-jet events as a function of the total transverse energy NE T. As NE T increases to 40 GeV, the fraction
118
Volume 123B, number 1,2 PHYSICS LETTERS 24 March 1983
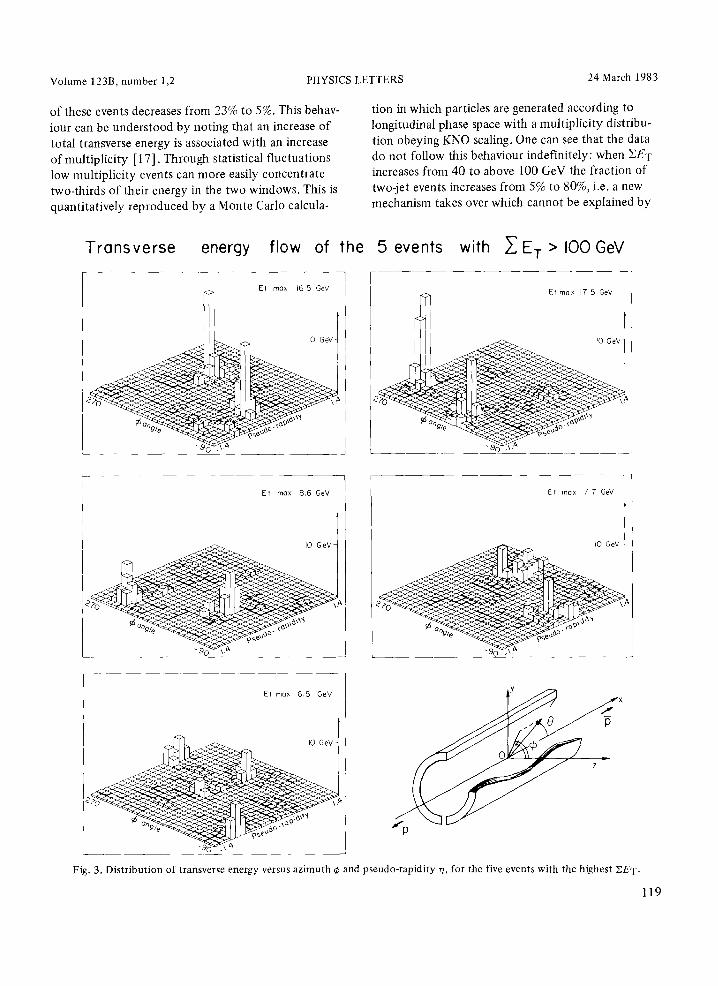
of these events decreases from 23% to 5%. This behav- iour can be understood by noting that an increase of total transverse energy is associated with an increase of mult ipl ici ty [ 17 ]. Through statistical fluctuations low mult ipl ici ty events can more easily concentrate two-thirds of their energy in the two windows. This is quantitatively reproduced by a Monte Carlo calcula-
tion in which particles are generated according to longitudinal phase space with a mult ipl ici ty distribu- tion obeying KNO scaling. One can see that the data do not follow this behaviour indefinitely: when NET increases from 40 to above 100 GeV the fraction of two-jet events increases from 5% to 80%, i.e. a new mechanism takes over which cannot be explained by
Transverse energy flow of the 5 events with ~: E T > I00 GeV
Et max 16,5 GeV Etmax 17,5 GeV
. fO GeV ,l
Et max 8,6 GeV
I0 GeV t
Et max 7.7 GeV
I0 GeV
Et max 6,5 GeV Y f x
Fig. 3. Distribution of transverse energy versus azimuth 4~ and pseudo-rapidity ~, for the five events with the highest ZE T.
119

Volume 123B, number 1,2 PHYSICS LETTERS 24 March 1983
longitudinal phase space. The transverse energy distri- bution of the five events with NET > 100 GeV is shown in fig. 3. Four of them are clear two-jet events, the fifth has a multi-jet structure with three or four jets. In the two-jet events, both jets have approxi- mately the same transverse energy. Clearly when SET becomes large enough, we see the onset of a striking event topology, in which the transverse energy is con- centrated into several clusters; that is, jet production becomes the dominant process. In order to study an arbitrary number of clusters in a less biased way, we make use of the cluster algorithm. In the sample of 279 events with EE T > 60 GeV, the average multi- plicity of clusters with ET > 15 GeV is 0.73, and there are 97 events with at least two clusters o fE T > 15 GeV. Fig. 4 shows the distribution of the differ- ence A~ of azimuthal angle between any two clusters having E T > 15 GeV. The distribution is strongly peaked near Aq~ = 180 °, that is, when two large E T clusters are found, they tend to be coplanar with the beams. We interpret these clusters as jets originating from hard scattering processes.
The 60 events containing at least one jet with E T >
4 0 , I
m
Q)
"6
E
z
50
20
I0
E T ( J E T ) > I 5 GeV
0 0 ° 180 °
rf 9o °
( +dET I - +JET 2 )
Fig. 4. Azimuthal angle difference between two clusters with E T > 15 GeV.
25 GeV found by either algorithm have been scanned on a high-resolution graphic display. Based on exami- nation of the tracks in the central detector, one event was identified as being due to a beam-gas interaction and rejected, while the remaining 59 events revealed a vertex in the collision region. There is a clear correla- tion between the clustering of tracks in the central detector and the flow of energy as seen in calorime- ters. Comparison of the jets found by the two meth- ods shows that 90% of the jets found by the window algorithm are also found by the cluster algorithm. However in the case of three-jet events or large fluctu- ation of the uncorrelated particle background, the window algorithm tends to miss jets; on the other hand the cluster algorithm may pick up some spurious cells.
7. Cross section for jet production. The E T distri- bution of the jets obtained by the method described above has been corrected for effects due to detector acceptance and experimental procedure by using a Monte Carlo jet simulation. Jets were generated according to a naive parton model without QCD cor- rections, in which the systems of hard scattered par- tons and spectators fragment independently, accord- ing to longitudinal phase space with a PT distribution (PT is the transverse momentum with respect to the jet axis) given by exp (-ap2), a = (6 GeV/c) -2, and with fragment multiplicities derived from data for e+e - -+ hadrons. All particles are tracked through the magnetic field and the showers in the calorimeters are simulated [18]. These "events" are then processed by the same analysis chain as the data, including the jet- finding algorithms. Comparison of the resulting jet E T spectrum with the generated one yields a correc- tion factor for each ET bin. The global correction fac- tor for do/dE T is 1.1, essentially independent o f E T. The main contributions to the correction are due to (a) geometrical losses at the edge of the rapidity range and in the narrow dead zones between the two halves of the calorimeter, (b) the smearing of the E T spectrum due to the error in the energy measurement (resolu- tion) and (c) the smearing and shifting of the ET spec- trum because of uncertainties due to the jet finding algorithm. Since our Monte Carlo simulation does not fully reproduce the event topology, this last correc- tion is subject to a larger uncertainty than the previ- ous two.
The inclusive cross section for jet production (do/dE T drl)In=0 obtained after these corrections is
120
Volume 123B, number 1,2 PHYSICS LETTERS 24 March 1983
- - ~j ' I ° z ! A 1
I f ~ p i p - J E T +X
= 5 4 0 GeV
I c , - I 'r / I < 1,5
q i .
0 g--
~ 10 -~
10-6 g ~ ~ ' ~ / - o n00. o o . h
• cluster algorithm ~. i /
10 -~ ~ 0 I0 20 50 4 0 50 60
ET ( J E T ) , ( g e V )
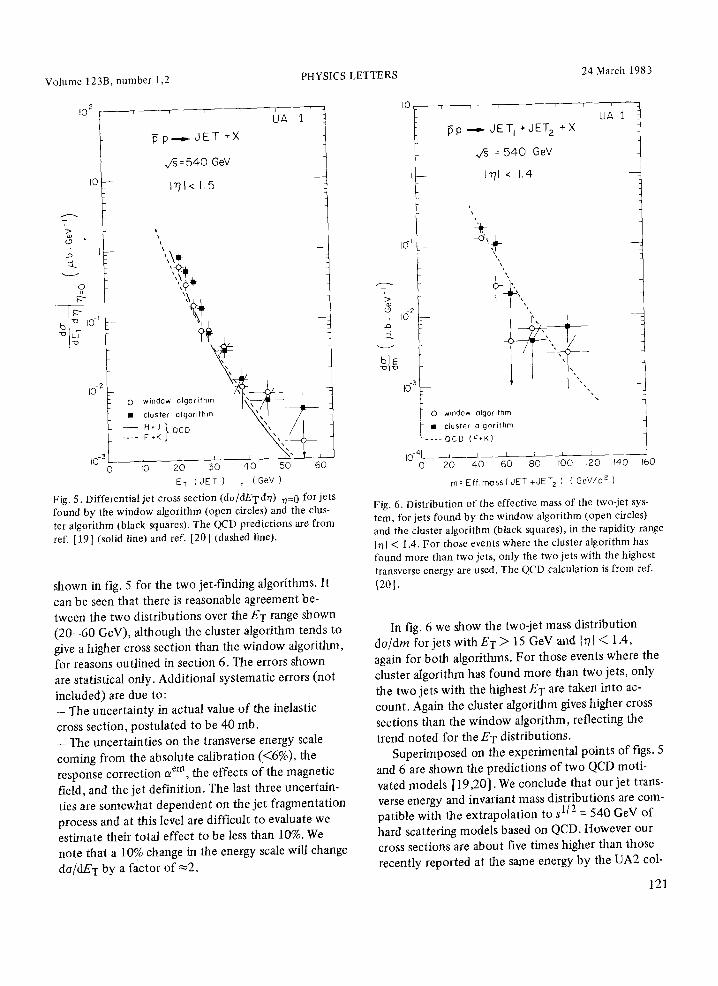
Fig. 5. Differential jet cross section (dc~/dETdr/) I r l= 0 for jets found by the window algorithm (open circles) and the clus- ter algorithm (black squares)• The QCD predictions are from ref. [19] (solid line) and ref. [20] (dashed line)•
shown in fig. 5 for the two jet-finding algorithms. It can be seen that there is reasonable agreement be- tween the two distributions over the E T range shown ( 2 0 - 6 0 GeV), although the cluster algorithm tends to give a higher cross section than the window algorithm, for reasons outlined in section 6. The errors shown are statistical only. Addit ional systematic errors (not
included) are due to: - The uncertainty in actual value of the inelastic cross section, postulated to be 40 mb. - The uncertainties on the transverse energy scale coming from the absolute calibration (<6%), the response correction c~ era, the effects of the magnetic field, and the jet definition. The last three uncertain- ties are somewhat dependent on the je t fragmentation process and at this level are difficult to evaluate we estimate their total effect to be less than 10%. We note that a 10% change in the energy scale will change
do/dE T by a factor of ~2 .
'>
::L
b E
I0,
L
IC) -
Id 2 __
id 3
i i - - [
PP ~ J E T I +JET2 + X
= 5 4 0 GeV
I"ql < 1.4
i f
UA i
I C 0 window olgorithm • cluster olgorithm
. . . . QCD (F+K)
10-4L , 410 6~0 8~0 ~ ~ ~_ 0 20 I00 120 140 160
rn=Eft, moss(JET I÷JET 2 ) ( GeV/c2 )
Fig. 6. Distribution of the effective mass of the two-jet sys- tem, for jets found by the window algorithm (open circles) and the cluster algorithm (black squares), in the rapidity range 171 < 1.4. For those events where the cluster algorithm has found more than two jets, only the two jets with the highest transverse energy are used, The QCD calculation is from ref. [201.
In fig. 6 we show the two-jet mass distribution
do/dm for jets with ET > 15 GeV and Ir/I < 1.4, again for both algorithms. For those events where the cluster algorithm has found more than two jets, only the two jets with the highest E T are taken into ac- count. Again the cluster algorithm gives higher cross sections than the window algorithm, reflecting the
trend noted for the ET distributions. Superimposed on the experimental points of figs. 5
and 6 are shown the predictions of two QCD moti- vated models [ 19,20]. We conclude that our jet trans- verse energy and invariant mass distributions are com- patible with the extrapolat ion to s I[2 = 540 GeV of hard scattering models based on QCD. However our cross sections are about five times higher than those recently reported at the same energy by the UA2 col-
121

Volume 123B, number 1,2 PHYSICS LETTERS 24 March 1983
laborat ion [8] using also a calor imetr ic technique.
Systemat ic uncer ta int ies and je t def ini t ions are simi-
lar to b o t h exper iments : they do not seem suff icient
in explaining the discrepancy.
8. Conclusions. We have observed dominance of
je t p roduc t ion in events wi th E E T > 100 GeV in the
range I~1 < 1.5. We have measured the transverse
energy dis t r ibut ion o f jets in the ET( je t ) range f rom
20 to 60 GeV and the two-jet effect ive mass distribu-
t ion in the mass range f rom 40 to 120 GeV. Both are
found to be compat ib le wi th predic t ions of QCD mot i -
vated models .
We grateful ly acknowledge the help o f the techni-
cal s taff o f the Ins t i tu t ions col laborat ing in UA 1. We
are thankful to the C E R N staff who have suppor ted
our exper iment and ex tend these thanks to the follow-
ing funding agencies in our h o m e countr ies:
Fonds zur F6rderung der Wissenschaftl ichen For-
schung, Austria.
Val t ion luonnont ie tee l l inen to imikunta , Finland.
Inst i tut Nat ional de Physique Nucl6aire et de Phy-
sique des Particules and Inst i tut de Recherche Fonda-
menta le (CEA), France.
Bundesminis ter ium for Forschung und Technologie ,
Germany .
Is t i tuto Nazionale di Fisica Nucleare , I taly.
Science and Engineering Research Counci l , Uni ted
Kingdom.
Depa r tmen t of Energy, USA.
Thanks are also due to the fol lowing people who
have worked wi th the col labora t ion in the prepara t ion
and data col lect ion on the runs described here: F.
Cataneo, D. Cline, A.-M. Cnops, J.-P. Fournier , G.
Jora t , G. Petrucci , P. Queru, G. Stefanini , M. Steuer ,
Ch. Tao, H. Verweij and R. Wilson.
[1] UA1 Collab., G. Arnison et al., Phys. Lett. 118B (1982) 167.
[2] UA1 CoUab., G. Arnison et al., Phys. Lett. l I8B (1982) 173.
[3] The Staff of the CERN pp Project, Phys. Lett. 107B (1981) 306.
[4] S.M. Berman, J.D. Bjorken and J.B. Kogut, Phys. Rev. D4 (1971) 3388.
[5 ] M.G. Albrow et al., Nucl. Phys. B160 (1979) 1 ; A.L.S. Angelis et al., Phys. Scr. 19 (1979) 116.4; A.G. Clark et al., Nucl. Phys. B160 (1979) 397; D. Drijard et al., Nucl. Phys. B166 (1980) 233.
122
[6] K. Hansen and P. Hoyer, eds., Jets in high energy colli- sions, Phys. Scr. 19 (1979); P. Darriulat, Ann. Rev. Nucl. Part. Sci. 30 (1980) 159; G. Wolf, Jet production and fragmentation, XXI Intern. Conf. on High energy physics (Paris, 1982).
[71 C. Bromberg et al., Phys. Rev. Lett. 38 (1977) 1447; M. Corcoran et al., Phys. Rev. D21 (1980) 641; C. De Matzo et al., Phys. Lett. l12B (1982) 173; The Axial Field Spectrometer Collab., T. Akesson et al., Phys. Lett. l18B (1982) 185,193.
[8] UA2 Collab., M. Banner et al., Phys. Lett. 118B (1982) 203.
[9] UAI proposal, A 4n solid angle detector for the SPS used as a proton-antiproton collider at a centre of mass energy of 540 GeV, CERN/SPSC 78-06; M. Barranco Luque et al., Nucl. Instrum. Methods 176 (1980) 175; M. Calvetti et al., Nucl. lnstrum. Methods 176 (1980) 255; K. Eggert et al., Nucl. Instrum. Methods 176 (1980) 217,233; A. Astbury, Phys. Scr. 23 (1981) 397; M. Calvetti, The UA1 central detector, talk Intern. Conf. on Instrumentation for colliding beam physics (SLAC, Stanford, February 1982); S. Cittolin, The UA1 data acquisition system, talk Intern. Conf. on Instrumentation for colliding beam physics (SLAC, Stanford, February 1982).
[10] M.J. Corden et al., Phys. Scr. 25 (1982) 11; C. Cochet et al., Response of the UA1 central calori- meters to charged hadrons from collider data and test measurements at the SPS West Hall, UA1 Technical Note TN 82-40.
[11 ] T. Gabriel and R. Wilson, Preliminary Monte Carlo cal- culation of the response of the gondola counters of UA1 to e, rr +- , p", UA1 Technical Note TN 82-23.
[12] M. Banner et al., Phys. Lett. l15B (1982) 59. [13] J. Rich and M. Spko, Use of the laser system to follow
the gain of electromagnetic calorimeters, UA 1 Techni- cal Note TN 81-03.
[ 14 ] J. Strauss, A photocell monitor for the S aclay laser, UA1 Technical Note TN 82/06.
[15 ] C. Cochet et al., Results from West Hall tests on the calibration of the gondolas with the cobalt source and electron beams, UA1 Technical Note TN 82-28; C. Cochet et al., About the accuracy of the cobalt cali- bration of the gondolas and the gain drift control with the laser system, UAI Technical Note TN 82-29.
[16] Birmingham, QMC, RAL Collab., presented by G. Grayer, The UA 1 trigger processor; in: Proc. Topical Conf. on the Application of microprocessors to high energy physics experiments, CERN yellow report 81-07, p. 64.
[ 17] UA 1 C ollab., G. Arnison et al., Transverse energy distri- butions in the central calorimeters, CERN-EP/82-122.
[18] M. Della Negra, Phys. Scr. 25 (1982) 468; R. B6ck et al., Nucl. Instrum. Methods 186 (1981) 533.
[19] R. Horgan and M. Jacob, Nucl. Phys. B179 (1981) 441. [20] W. Furmanski and H. Kowalski, private communication.