observation of elevated fungal tracers due to biomass burning in the sichuan basin at chengdu city,...
TRANSCRIPT
Science of the Total Environment 431 (2012) 68–77
Contents lists available at SciVerse ScienceDirect
Science of the Total Environment
j ourna l homepage: www.e lsev ie r .com/ locate /sc i totenv
Observation of elevated fungal tracers due to biomass burning in the Sichuan Basin atChengdu City, China
Yihong Yang a, Chuen-yu Chan a,⁎, Jun Tao a,b, Mang Lin a, Guenter Engling c,⁎⁎,Zhisheng Zhang a, Ting Zhang a, Lin Su a
a School of Environmental Science and Engineering, Sun Yat-sen University, Guangzhou, 510275, Chinab South China Institute of Environmental Sciences, Guangzhou 510655, Chinac Department of Biomedical Engineering and Environmental Sciences, National Tsing Hua University, Hsinchu 30013, Taiwan
⁎ Correspondence to: C. Chan, School of EnvironmentaYat-sen University, No.135 XingangWest Road, GuangzhTel./fax: +86 20 84110692.⁎⁎ Corresponding author.
E-mail addresses: [email protected] (C. Chan),(G. Engling).
0048-9697/$ – see front matter © 2012 Elsevier B.V. Alldoi:10.1016/j.scitotenv.2012.05.033
a b s t r a c t
a r t i c l e i n f oArticle history:Received 22 December 2011Received in revised form 31 March 2012Accepted 10 May 2012Available online 3 June 2012
Keywords:ArabitolMannitolBiomass combustionFine particlesMegacity
Fungal material (i.e., spores and fragments) is an important component of atmospheric aerosols. In order to ex-amine the variability of fungal abundance in fine particles (PM2.5) during a biomass burning season, an intensivemeasurement campaign was conducted in the Sichuan Basin at Chengdu, a megacity in southwest China, inspring 2009. The aerosol samples were analyzed for carbonaceous species, including molecular tracers for bio-mass burning and fungalmaterial, andwater soluble ions. The results were interpretedwith the help of principlecomponent analysis, fire countmaps, and theWRFmodel. Elevated concentrations of arabitol andmannitolwerefound with average concentrations of 21.5±16.6 ng m−3 and 43.9±19.3 ng m−3, respectively, which wereunexpectedly higher than those measured in fine particles in any other study reported previously. Even higherconcentrations were observed in cases with simultaneous enhancements in the biomass burning tracerslevoglucosan and K+. In the case of influence by pollution plumes from biomass burning regions, the fungaltracer concentrations reached maximum values of 79.6 ng m−3 and 121.8 ng m−3, coinciding with peak levelsof levoglucosan and K+. Statistically significant correlations were found between the simultaneously observedfungal tracers (arabitol and mannitol) and biomass burning tracers (levoglucosan and K+), suggesting thatthese species were emitted by co-located sources, and hence the elevated fungal tracers were likely associatedwith biomass burning activities.
© 2012 Elsevier B.V. All rights reserved.
1. Introduction
Primary biological aerosols (PBAs), which include pollen, fungalspores, bacteria, viruses, and fragments of animals and plants, areubiquitous particles emitted directly from the biosphere to the atmo-sphere (Artaxo and Hansson, 1995; Jaenicke et al., 2007). Severalstudies have shown that PBAs could play important roles in atmo-spheric chemistry and physics, the biosphere and climate (Andreaeand Crutzen, 1997; Ariya and Amyot, 2004; Deguillaume et al.,2008; Després et al., 2012; Georgakopoulos et al., 2009; Mohleret al., 2007; Morris et al., 2011). PBAs can act as cloud condensationnuclei and ice nuclei, thereby influencing precipitation and the energybudget of the Earth (Bauer et al., 2003; Bowers et al., 2009; Christneret al., 2008a; Matthias-Maser et al., 2000; Prenni et al., 2009; Vali,
l Science and Engineering, Sunou, Guangdong 510275, China.
rights reserved.
1996). They also influence the spread of biological organisms (Hamiltonand Lenton, 1998), and play an important role in the long-range transportof trace elements and pathogens into and away from specific biomes(Mahowald et al., 2005; Rong, 2000). PBAs have been widely discusseddue to their potential toxicity, allergies, and medical implications, sincethey are associated with allergic respiratory symptoms, decreased lungfunctions, including allergic asthmatics, asthma exacerbation, andasthma-related death (Dales et al., 2000, 2003, 2004; Rutherford et al.,2000; Targonski et al., 1995).
The composition and abundance of PBAs are expected to dependon vegetation characteristics, seasonal and meteorological conditions,geographical location, and human activities (Bowers et al., 2010;Froehlich-Nowoisky et al., 2012; Lacey, 1975, 1981). However, theabundance and origin of PBAs are still poorly understood and quanti-fied (Després et al., 2012; Elbert et al., 2007; Sesartic and Dallafior,2011; Xu et al., 2011). In fact, PBAs can account for a large proportionof aerosol particle mass in ambient air and their abundance varies ona large scale (Bauer et al., 2008b; Elbert et al., 2007; Jaenicke, 2005;Wiedinmyer et al., 2009; Winiwarter et al., 2009; Womiloju et al.,2003; Zhang et al., 2010). Hence, more observations are needed tobetter quantify the contribution of PBAs to aerosols on continentaland global scales.
69Y. Yang et al. / Science of the Total Environment 431 (2012) 68–77
Fungal material (i.e., spores and fragments) constitutes an impor-tant part of PBAs (Elbert et al., 2007). It is derived from soil, vegeta-tion, water surfaces, and human activities (Bauer et al., 2002b;Burch and Levetin, 2002; Burge, 2002) and is able to survive evenharsh environmental conditions (such as deserts, hot biomass burn-ing plumes, hailstones, glacial melt water, and deep sea sediments,etc.) (Boreson et al., 2004; Connell et al., 2008; Ma et al., 2000;Mandrioli et al., 1973; Mims and Mims, 2004; Novozhilova andPopova, 1969). It has been demonstrated that together with fungalspores, fragments may be released from moldy surfaces as well(Górny et al., 2002). Furthermore, size-fractionated aerosol data re-veal that arabitol and mannitol are mainly associated with the coarsesize mode and depending on the ambient conditions, such as relativehumidity, may show a tail into the fine size mode, suggesting an en-hanced release of fungal fragments from the biota (e.g., Kourtchevet al., 2009; Claeys et al., 2010). Generally, elevated abundances offungal material are often found in regions with high biological activ-ity, such as rainforests and pastures (Elbert et al., 2007; Grahamet al., 2003; Zhang et al., 2010), although recently, high diversitiesof bacteria and fungi were also observed in urban aerosol (Brodieet al., 2007; Froehlich-Nowoisky et al., 2009).
Because fine particles (with aerodynamic diameters b2.5 μm, PM2.5)can penetrate deeply into human lungs, the measurement of fungalmaterial with aerodynamic diameters less than 2.5 μm would be rela-tively more important in populous urban areas. In fact, although theaerodynamic diameters of fungal spores typically range from 2 to10 μm (Bai et al., 2002; Boekhout, 1991; Burge, 2002; Ingold, 2001;Lin and Li, 1996; Zhang et al., 2010), the diversity of airborne fungidetected in the fine particle fraction is comparable with that in thecoarse fraction. In particular, more human pathogens and allergens(e.g., Candida tropicalis and wallemia spp.) were found in fine particlesthan in coarse particles as revealed by recent DNA analysis studies(Froehlich-Nowoisky et al., 2009; Kaushik and Balasubramanian, 2012).Hence, these facts and new insights highlight the importance of investi-gating the fungal abundance in fine particles in highly populated urbanareas.
In urban areas, biomass burning was proposed as a potentialsource of fungal spores (Griffin et al., 2001; Mims and Mims, 2004).In addition, Mims and Mims (2004) found by traditional incubationand microscopic methods that many viable fungal spores were presentin the smoke from forestfires. The researchers proposed thatmajorfires(which can produce smoke plumes greater than 3 km) could be muchmore effective in launching spores into the troposphere than surfacewind storms, while small burns of diseased plants as well as cookingand heating with diseased firewood might disperse pathogenic sporeson a smaller scale.
The polyols arabitol and mannitol may constitute an importantfraction of the dry weight of fungi (Carlile and Watkinson, 1994),as they are common energy reserve materials in fungi (Lewis andSmith, 1967). Both compounds have been mostly associated withfungal material in aerosols, and were recently proposed as moleculartracers for fungi (Bauer et al., 2008a, 2008b; Claeys et al., 2010; Elbertet al., 2007; Heald and Spracklen, 2009; Zhang et al., 2010). In a recentstudy, Zhang et al. (2010) found high springtime levels of mannitoland arabitol in the coarse fraction of the ambient aerosol in subtropicalsouth China, and suggested that wet emission (the active dischargeof fungal spores, which is accompanied by the emission of aqueousdroplets)may be themajor emissionmechanismbased on good correla-tion between tracer levels and relative humidity. Burshtein et al. (2011),on the other hand, suggested that mannitol and arabitol might not bespecific biomarkers for fungi, as theywere poorly correlatedwith ergos-terol (another fungal tracer) in summer and winter, aside from the factthat these sugar alcohols frequently occur in some plants and algae.Further, the good correlation between arabitol/mannitol and ergosterolobserved in spring and autumnmight be attributed to high levels of veg-etation during spring blossoms and plant decomposition in autumn.
Lang-Yona et al. (2012) compared ergosterol concentrations withDNA-based analyses of airborne fungal spores in the PM10 aerosol frac-tion, and found poor correlations between them throughout the entireyear. They suggested that ergosterol degradation may have contributedto the observed differences and that DNA-based analysesmay be prefer-able for the quantification of fungal spores compared to biomarkermolecules. Considering potential degradation of ergosterol, the resultsof Burshtein et al. (2011) might in that case not be sufficient to provethat arabitol and mannitol cannot be unique tracers of fungal material.
Although mannitol and arabitol have been found in some plantsand algae, they are more likely associated with fungal material ratherthan plant debris in this study, because burning processes would leadto the thermal degradation of plants (Lobert and Warnatz, 1993).Sugar alcohols (such as arabitol/mannitol) in plants may easily beremoved and degrade during the burning process. In fact, it is lesslikely for these sugar alcohols to be released in their unaltered formfrom vegetation (e.g., leaves) and incorporated into fine aerosol par-ticles. Berg et al. (1982) also found that simple sugars were degradedvery early and at a high rate during decomposition, which supportsthat vegetation may be a relatively less important source of thesesugar alcohols. Meanwhile, sugar alcohols in fungal spores wouldbe protected by the spore walls (Smits et al., 2001), which might“preserve” them during the burning process. Furthermore, Lianget al. (unpublished data of our group from another recent study)found high correlation between the flow cytometry results of ambientfungal spores and the concentrations of arabitol (R2=0.72) in aerosolsamples collected daily over a period of 1 year in an urban area(Beijing). The sampling site (Chengdu) in this study is far away(over 1000 km) from the nearest sea (North Bay of China), and there-fore algae may not be a potential source of these tracers either.Therefore, we speculate that arabitol and mannitol could be suitablemolecular tracers for fungal material in this study.
In this paper, we report and discuss the elevated levels of fungalmolecular tracers (arabitol and mannitol) observed in an intensivemeasurement campaign conducted during the spring biomass burn-ing season (April and May 2009) at Chengdu, the capital of Sichuanprovince, which has a population of over 10 million. The SichuanBasin is one of the main rice and rapeseed producing areas in China(Lin et al., 2005). Thus, the air quality of the basin is strongly affectedby biomass smoke derived from rape and wheat straw burning, whichmake Chengdu City an ideal site for investigating the impacts ofbiomass burning on fungal abundance in the urban atmosphere. Thepossible linkage between biomass burning and enhancement infungal spores will be discussed through interpretation of the relation-ships between the fungal tracers and biomass burning tracers, includ-ing levoglucosan and potassium ion.
2. Experimental details
2.1. Site description and field sampling
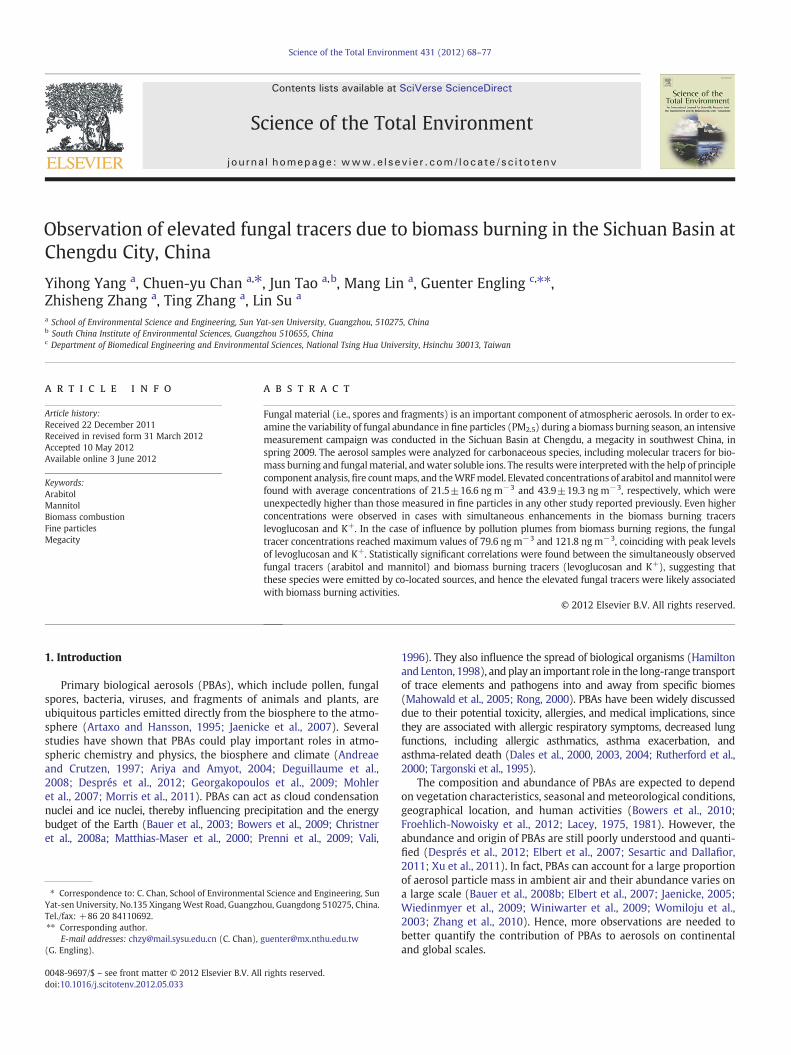
Fig. 1 shows the geographical location of Chengdu (30.39 °N,104.00 °E) in the Sichuan Basin. Surrounded by high mountains (withelevations of 1000–3000 m above sea level), the basin is situated onthe eastern edge of the Tibetan Plateau and has an average altitude of500 m above sea level. With a mild climate that permits diversifiedagriculture, the basin is one of China'smain rice and rapeseedproducingareas. Consequently, crop straw burning is a common agricultural prac-tice in suburban and rural areas during the harvest seasons (April -May).
The sampling site was situated on the rooftop of a building at theInstitute Plateau Meteorology (~15 m above ground level), locatedin the downtown area of Chengdu. There are no industrial emissionsources within a 5 km2 range of the site, and only residential emis-sions (home cooking and transportation) in the surrounding area.The air at this site could, therefore, be considered more or less
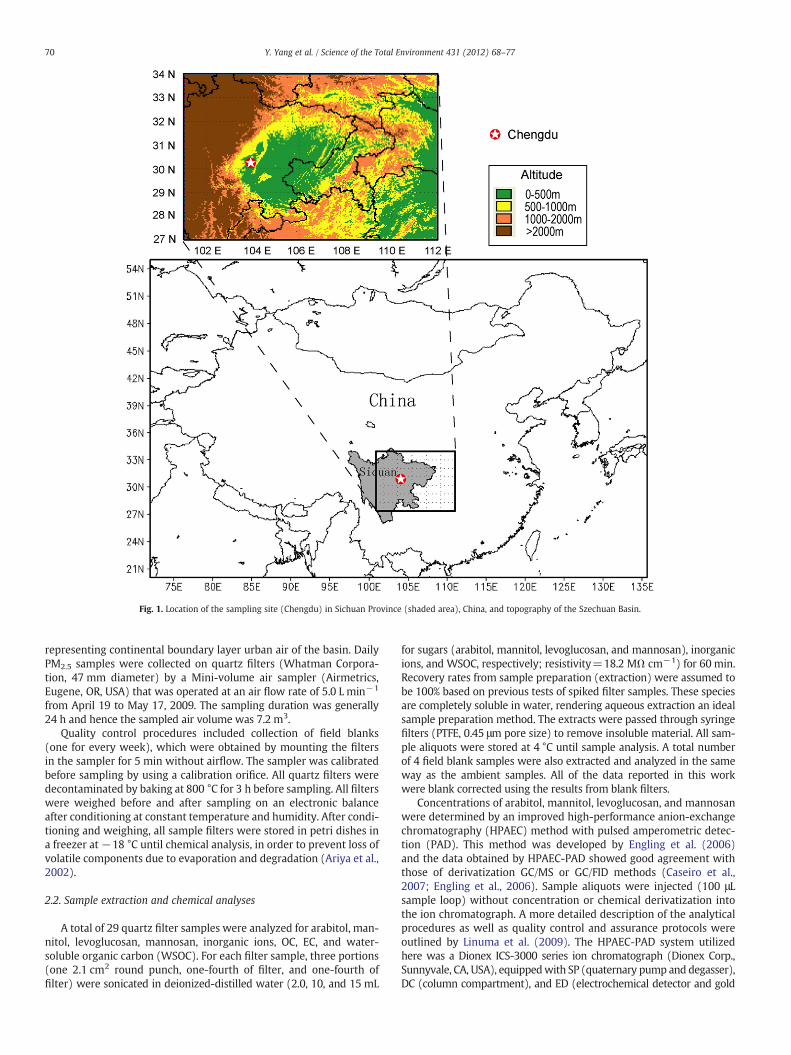
Fig. 1. Location of the sampling site (Chengdu) in Sichuan Province (shaded area), China, and topography of the Szechuan Basin.
70 Y. Yang et al. / Science of the Total Environment 431 (2012) 68–77
representing continental boundary layer urban air of the basin. DailyPM2.5 samples were collected on quartz filters (Whatman Corpora-tion, 47 mm diameter) by a Mini-volume air sampler (Airmetrics,Eugene, OR, USA) that was operated at an air flow rate of 5.0 L min−1
from April 19 to May 17, 2009. The sampling duration was generally24 h and hence the sampled air volume was 7.2 m3.
Quality control procedures included collection of field blanks(one for every week), which were obtained by mounting the filtersin the sampler for 5 min without airflow. The sampler was calibratedbefore sampling by using a calibration orifice. All quartz filters weredecontaminated by baking at 800 °C for 3 h before sampling. All filterswere weighed before and after sampling on an electronic balanceafter conditioning at constant temperature and humidity. After condi-tioning and weighing, all sample filters were stored in petri dishes ina freezer at−18 °C until chemical analysis, in order to prevent loss ofvolatile components due to evaporation and degradation (Ariya et al.,2002).
2.2. Sample extraction and chemical analyses
A total of 29 quartz filter samples were analyzed for arabitol, man-nitol, levoglucosan, mannosan, inorganic ions, OC, EC, and water-soluble organic carbon (WSOC). For each filter sample, three portions(one 2.1 cm2 round punch, one-fourth of filter, and one-fourth offilter) were sonicated in deionized-distilled water (2.0, 10, and 15 mL
for sugars (arabitol, mannitol, levoglucosan, and mannosan), inorganicions, and WSOC, respectively; resistivity=18.2 MΩ cm−1) for 60 min.Recovery rates from sample preparation (extraction) were assumed tobe 100% based on previous tests of spiked filter samples. These speciesare completely soluble in water, rendering aqueous extraction an idealsample preparation method. The extracts were passed through syringefilters (PTFE, 0.45 μm pore size) to remove insoluble material. All sam-ple aliquots were stored at 4 °C until sample analysis. A total numberof 4 field blank samples were also extracted and analyzed in the sameway as the ambient samples. All of the data reported in this workwere blank corrected using the results from blank filters.
Concentrations of arabitol, mannitol, levoglucosan, and mannosanwere determined by an improved high-performance anion-exchangechromatography (HPAEC) method with pulsed amperometric detec-tion (PAD). This method was developed by Engling et al. (2006)and the data obtained by HPAEC-PAD showed good agreement withthose of derivatization GC/MS or GC/FID methods (Caseiro et al.,2007; Engling et al., 2006). Sample aliquots were injected (100 μLsample loop) without concentration or chemical derivatization intothe ion chromatograph. A more detailed description of the analyticalprocedures as well as quality control and assurance protocols wereoutlined by Linuma et al. (2009). The HPAEC-PAD system utilizedhere was a Dionex ICS-3000 series ion chromatograph (Dionex Corp.,Sunnyvale, CA, USA), equippedwith SP (quaternary pump and degasser),DC (column compartment), and ED (electrochemical detector and gold
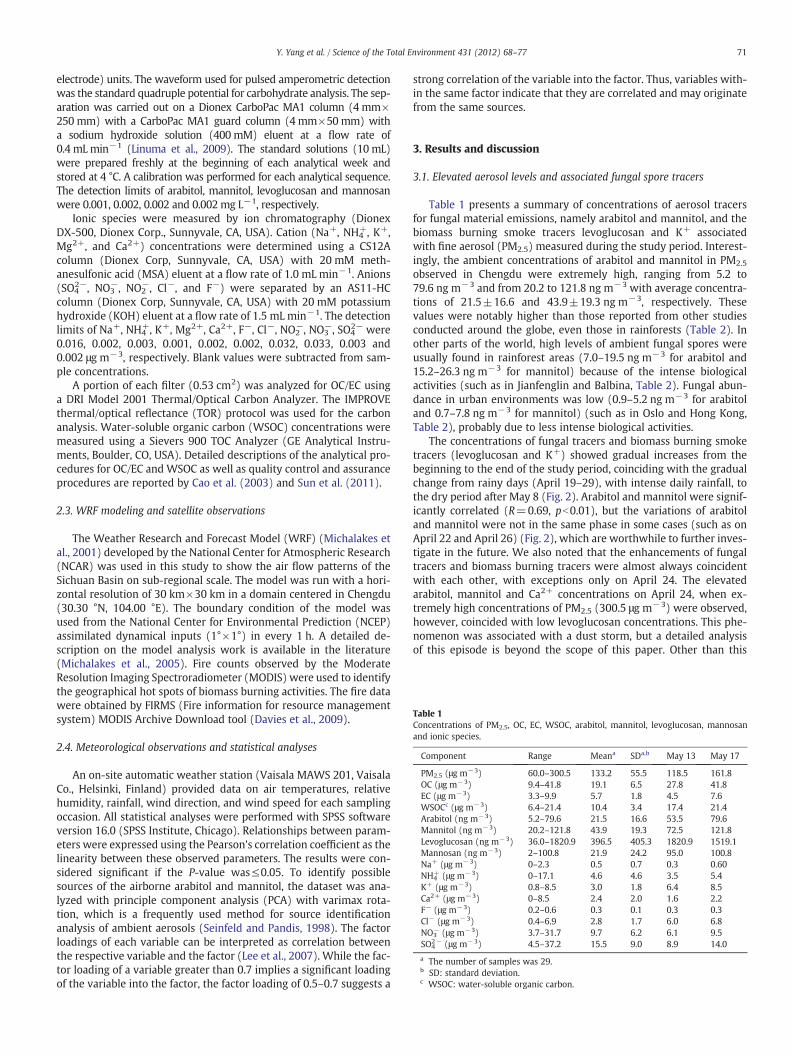
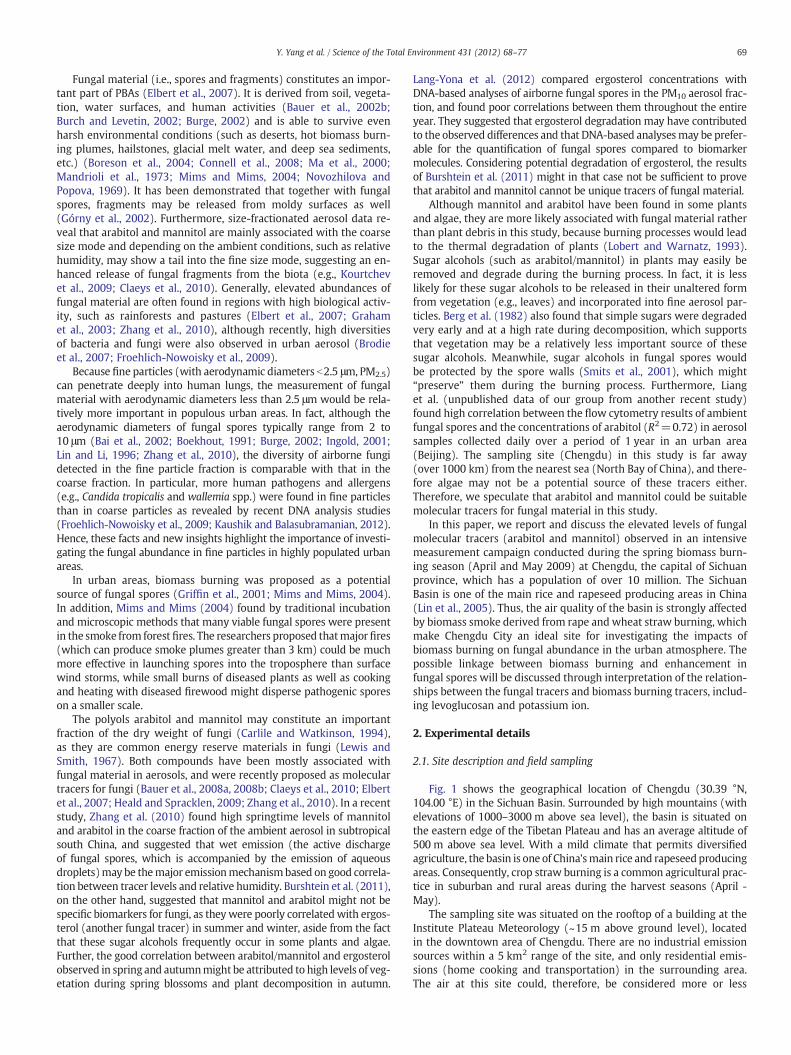
Table 1Concentrations of PM2.5, OC, EC, WSOC, arabitol, mannitol, levoglucosan, mannosanand ionic species.
Component Range Meana SDa,b May 13 May 17
PM2.5 (μg m−3) 60.0–300.5 133.2 55.5 118.5 161.8OC (μg m−3) 9.4–41.8 19.1 6.5 27.8 41.8EC (μg m−3) 3.3–9.9 5.7 1.8 4.5 7.6WSOCc (μg m−3) 6.4–21.4 10.4 3.4 17.4 21.4Arabitol (ng m−3) 5.2–79.6 21.5 16.6 53.5 79.6Mannitol (ng m−3) 20.2–121.8 43.9 19.3 72.5 121.8Levoglucosan (ng m−3) 36.0–1820.9 396.5 405.3 1820.9 1519.1Mannosan (ng m−3) 2–100.8 21.9 24.2 95.0 100.8Na+ (μg m−3) 0–2.3 0.5 0.7 0.3 0.60NH4
+ (μg m−3) 0–17.1 4.6 4.6 3.5 5.4K+ (μg m−3) 0.8–8.5 3.0 1.8 6.4 8.5Ca2+ (μg m−3) 0–8.5 2.4 2.0 1.6 2.2F− (μg m−3) 0.2–0.6 0.3 0.1 0.3 0.3Cl− (μg m−3) 0.4–6.9 2.8 1.7 6.0 6.8NO3
− (μg m−3) 3.7–31.7 9.7 6.2 6.1 9.5SO4
2− (μg m−3) 4.5–37.2 15.5 9.0 8.9 14.0
a The number of samples was 29.b SD: standard deviation.c WSOC: water-soluble organic carbon.
71Y. Yang et al. / Science of the Total Environment 431 (2012) 68–77
electrode) units. The waveform used for pulsed amperometric detectionwas the standard quadruple potential for carbohydrate analysis. The sep-aration was carried out on a Dionex CarboPac MA1 column (4 mm×250 mm) with a CarboPac MA1 guard column (4 mm×50mm) witha sodium hydroxide solution (400 mM) eluent at a flow rate of0.4 mLmin−1 (Linuma et al., 2009). The standard solutions (10 mL)were prepared freshly at the beginning of each analytical week andstored at 4 °C. A calibration was performed for each analytical sequence.The detection limits of arabitol, mannitol, levoglucosan and mannosanwere 0.001, 0.002, 0.002 and 0.002 mg L−1, respectively.
Ionic species were measured by ion chromatography (DionexDX-500, Dionex Corp., Sunnyvale, CA, USA). Cation (Na+, NH4
+, K+,Mg2+, and Ca2+) concentrations were determined using a CS12Acolumn (Dionex Corp, Sunnyvale, CA, USA) with 20 mM meth-anesulfonic acid (MSA) eluent at a flow rate of 1.0 mL min−1. Anions(SO4
2−, NO3−, NO2
−, Cl−, and F−) were separated by an AS11-HCcolumn (Dionex Corp, Sunnyvale, CA, USA) with 20 mM potassiumhydroxide (KOH) eluent at a flow rate of 1.5 mL min−1. The detectionlimits of Na+, NH4
+, K+, Mg2+, Ca2+, F−, Cl−, NO2−, NO3
−, SO42− were
0.016, 0.002, 0.003, 0.001, 0.002, 0.002, 0.032, 0.033, 0.003 and0.002 μg m−3, respectively. Blank values were subtracted from sam-ple concentrations.
A portion of each filter (0.53 cm2) was analyzed for OC/EC usinga DRI Model 2001 Thermal/Optical Carbon Analyzer. The IMPROVEthermal/optical reflectance (TOR) protocol was used for the carbonanalysis. Water-soluble organic carbon (WSOC) concentrations weremeasured using a Sievers 900 TOC Analyzer (GE Analytical Instru-ments, Boulder, CO, USA). Detailed descriptions of the analytical pro-cedures for OC/EC and WSOC as well as quality control and assuranceprocedures are reported by Cao et al. (2003) and Sun et al. (2011).
2.3. WRF modeling and satellite observations
The Weather Research and Forecast Model (WRF) (Michalakes etal., 2001) developed by the National Center for Atmospheric Research(NCAR) was used in this study to show the air flow patterns of theSichuan Basin on sub-regional scale. The model was run with a hori-zontal resolution of 30 km×30 km in a domain centered in Chengdu(30.30 °N, 104.00 °E). The boundary condition of the model wasused from the National Center for Environmental Prediction (NCEP)assimilated dynamical inputs (1°×1°) in every 1 h. A detailed de-scription on the model analysis work is available in the literature(Michalakes et al., 2005). Fire counts observed by the ModerateResolution Imaging Spectroradiometer (MODIS) were used to identifythe geographical hot spots of biomass burning activities. The fire datawere obtained by FIRMS (Fire information for resource managementsystem) MODIS Archive Download tool (Davies et al., 2009).
2.4. Meteorological observations and statistical analyses
An on-site automatic weather station (Vaisala MAWS 201, VaisalaCo., Helsinki, Finland) provided data on air temperatures, relativehumidity, rainfall, wind direction, and wind speed for each samplingoccasion. All statistical analyses were performed with SPSS softwareversion 16.0 (SPSS Institute, Chicago). Relationships between param-eters were expressed using the Pearson's correlation coefficient as thelinearity between these observed parameters. The results were con-sidered significant if the P-value was≤0.05. To identify possiblesources of the airborne arabitol and mannitol, the dataset was ana-lyzed with principle component analysis (PCA) with varimax rota-tion, which is a frequently used method for source identificationanalysis of ambient aerosols (Seinfeld and Pandis, 1998). The factorloadings of each variable can be interpreted as correlation betweenthe respective variable and the factor (Lee et al., 2007). While the fac-tor loading of a variable greater than 0.7 implies a significant loadingof the variable into the factor, the factor loading of 0.5–0.7 suggests a
strong correlation of the variable into the factor. Thus, variables with-in the same factor indicate that they are correlated and may originatefrom the same sources.
3. Results and discussion
3.1. Elevated aerosol levels and associated fungal spore tracers
Table 1 presents a summary of concentrations of aerosol tracersfor fungal material emissions, namely arabitol and mannitol, and thebiomass burning smoke tracers levoglucosan and K+ associatedwith fine aerosol (PM2.5) measured during the study period. Interest-ingly, the ambient concentrations of arabitol and mannitol in PM2.5
observed in Chengdu were extremely high, ranging from 5.2 to79.6 ng m−3 and from 20.2 to 121.8 ng m−3 with average concentra-tions of 21.5±16.6 and 43.9±19.3 ng m−3, respectively. Thesevalues were notably higher than those reported from other studiesconducted around the globe, even those in rainforests (Table 2). Inother parts of the world, high levels of ambient fungal spores wereusually found in rainforest areas (7.0–19.5 ng m−3 for arabitol and15.2–26.3 ng m−3 for mannitol) because of the intense biologicalactivities (such as in Jianfenglin and Balbina, Table 2). Fungal abun-dance in urban environments was low (0.9–5.2 ng m−3 for arabitoland 0.7–7.8 ng m−3 for mannitol) (such as in Oslo and Hong Kong,Table 2), probably due to less intense biological activities.
The concentrations of fungal tracers and biomass burning smoketracers (levoglucosan and K+) showed gradual increases from thebeginning to the end of the study period, coinciding with the gradualchange from rainy days (April 19–29), with intense daily rainfall, tothe dry period after May 8 (Fig. 2). Arabitol and mannitol were signif-icantly correlated (R=0.69, pb0.01), but the variations of arabitoland mannitol were not in the same phase in some cases (such as onApril 22 and April 26) (Fig. 2), which are worthwhile to further inves-tigate in the future. We also noted that the enhancements of fungaltracers and biomass burning tracers were almost always coincidentwith each other, with exceptions only on April 24. The elevatedarabitol, mannitol and Ca2+ concentrations on April 24, when ex-tremely high concentrations of PM2.5 (300.5 μg m−3) were observed,however, coincided with low levoglucosan concentrations. This phe-nomenon was associated with a dust storm, but a detailed analysisof this episode is beyond the scope of this paper. Other than this
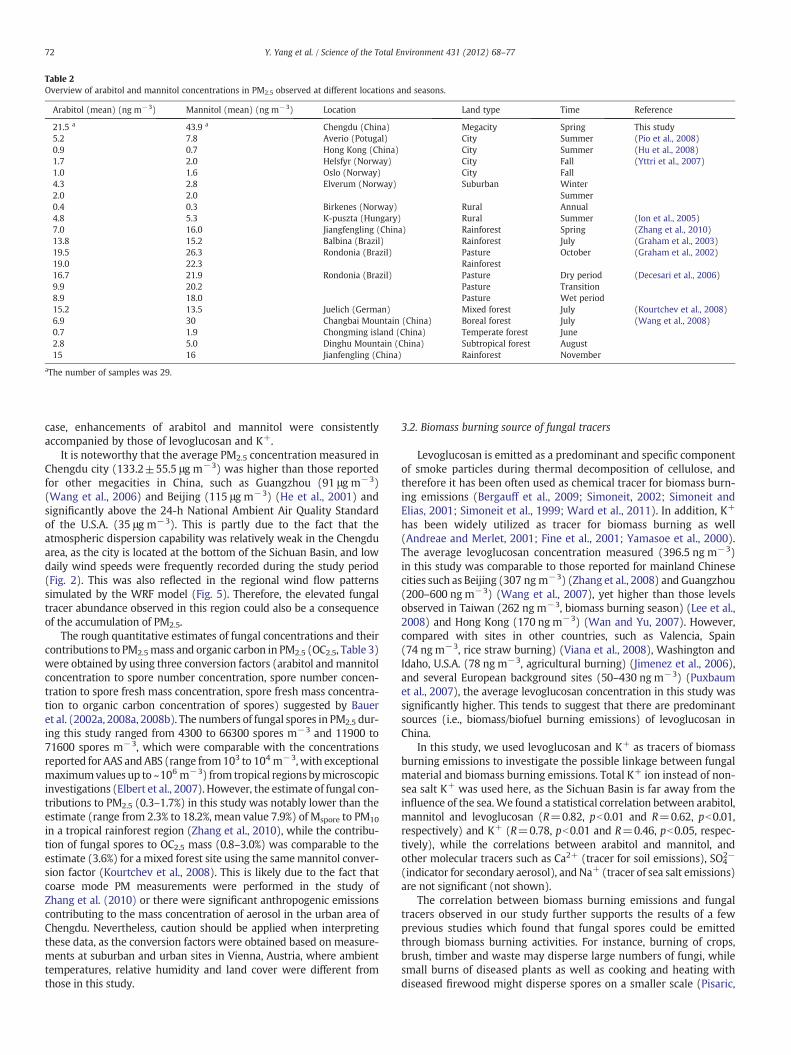
Table 2Overview of arabitol and mannitol concentrations in PM2.5 observed at different locations and seasons.
Arabitol (mean) (ng m−3) Mannitol (mean) (ng m−3) Location Land type Time Reference
21.5 a 43.9 a Chengdu (China) Megacity Spring This study5.2 7.8 Averio (Potugal) City Summer (Pio et al., 2008)0.9 0.7 Hong Kong (China) City Summer (Hu et al., 2008)1.7 2.0 Helsfyr (Norway) City Fall (Yttri et al., 2007)1.0 1.6 Oslo (Norway) City Fall4.3 2.8 Elverum (Norway) Suburban Winter2.0 2.0 Summer0.4 0.3 Birkenes (Norway) Rural Annual4.8 5.3 K-puszta (Hungary) Rural Summer (Ion et al., 2005)7.0 16.0 Jiangfengling (China) Rainforest Spring (Zhang et al., 2010)13.8 15.2 Balbina (Brazil) Rainforest July (Graham et al., 2003)19.5 26.3 Rondonia (Brazil) Pasture October (Graham et al., 2002)19.0 22.3 Rainforest16.7 21.9 Rondonia (Brazil) Pasture Dry period (Decesari et al., 2006)9.9 20.2 Pasture Transition8.9 18.0 Pasture Wet period15.2 13.5 Juelich (German) Mixed forest July (Kourtchev et al., 2008)6.9 30 Changbai Mountain (China) Boreal forest July (Wang et al., 2008)0.7 1.9 Chongming island (China) Temperate forest June2.8 5.0 Dinghu Mountain (China) Subtropical forest August15 16 Jianfengling (China) Rainforest November
aThe number of samples was 29.
72 Y. Yang et al. / Science of the Total Environment 431 (2012) 68–77
case, enhancements of arabitol and mannitol were consistentlyaccompanied by those of levoglucosan and K+.
It is noteworthy that the average PM2.5 concentration measured inChengdu city (133.2±55.5 μg m−3) was higher than those reportedfor other megacities in China, such as Guangzhou (91 μg m−3)(Wang et al., 2006) and Beijing (115 μg m−3) (He et al., 2001) andsignificantly above the 24-h National Ambient Air Quality Standardof the U.S.A. (35 μg m−3). This is partly due to the fact that theatmospheric dispersion capability was relatively weak in the Chengduarea, as the city is located at the bottom of the Sichuan Basin, and lowdaily wind speeds were frequently recorded during the study period(Fig. 2). This was also reflected in the regional wind flow patternssimulated by the WRF model (Fig. 5). Therefore, the elevated fungaltracer abundance observed in this region could also be a consequenceof the accumulation of PM2.5.
The rough quantitative estimates of fungal concentrations and theircontributions to PM2.5mass and organic carbon in PM2.5 (OC2.5, Table 3)were obtained by using three conversion factors (arabitol andmannitolconcentration to spore number concentration, spore number concen-tration to spore fresh mass concentration, spore fresh mass concentra-tion to organic carbon concentration of spores) suggested by Baueret al. (2002a, 2008a, 2008b). The numbers of fungal spores in PM2.5 dur-ing this study ranged from 4300 to 66300 spores m−3 and 11900 to71600 spores m−3, which were comparable with the concentrationsreported for AAS andABS (range from103 to 104 m−3, with exceptionalmaximumvalues up to ~106 m−3) from tropical regions bymicroscopicinvestigations (Elbert et al., 2007). However, the estimate of fungal con-tributions to PM2.5 (0.3–1.7%) in this study was notably lower than theestimate (range from 2.3% to 18.2%, mean value 7.9%) of Mspore to PM10
in a tropical rainforest region (Zhang et al., 2010), while the contribu-tion of fungal spores to OC2.5 mass (0.8–3.0%) was comparable to theestimate (3.6%) for a mixed forest site using the samemannitol conver-sion factor (Kourtchev et al., 2008). This is likely due to the fact thatcoarse mode PM measurements were performed in the study ofZhang et al. (2010) or there were significant anthropogenic emissionscontributing to the mass concentration of aerosol in the urban area ofChengdu. Nevertheless, caution should be applied when interpretingthese data, as the conversion factors were obtained based on measure-ments at suburban and urban sites in Vienna, Austria, where ambienttemperatures, relative humidity and land cover were different fromthose in this study.
3.2. Biomass burning source of fungal tracers
Levoglucosan is emitted as a predominant and specific componentof smoke particles during thermal decomposition of cellulose, andtherefore it has been often used as chemical tracer for biomass burn-ing emissions (Bergauff et al., 2009; Simoneit, 2002; Simoneit andElias, 2001; Simoneit et al., 1999; Ward et al., 2011). In addition, K+
has been widely utilized as tracer for biomass burning as well(Andreae and Merlet, 2001; Fine et al., 2001; Yamasoe et al., 2000).The average levoglucosan concentration measured (396.5 ng m−3)in this study was comparable to those reported for mainland Chinesecities such as Beijing (307 ngm−3) (Zhang et al., 2008) and Guangzhou(200–600 ng m−3) (Wang et al., 2007), yet higher than those levelsobserved in Taiwan (262 ng m−3, biomass burning season) (Lee et al.,2008) and Hong Kong (170 ng m−3) (Wan and Yu, 2007). However,compared with sites in other countries, such as Valencia, Spain(74 ngm−3, rice straw burning) (Viana et al., 2008), Washington andIdaho, U.S.A. (78 ng m−3, agricultural burning) (Jimenez et al., 2006),and several European background sites (50–430 ng m−3) (Puxbaumet al., 2007), the average levoglucosan concentration in this study wassignificantly higher. This tends to suggest that there are predominantsources (i.e., biomass/biofuel burning emissions) of levoglucosan inChina.
In this study, we used levoglucosan and K+ as tracers of biomassburning emissions to investigate the possible linkage between fungalmaterial and biomass burning emissions. Total K+ ion instead of non-sea salt K+ was used here, as the Sichuan Basin is far away from theinfluence of the sea.We found a statistical correlation between arabitol,mannitol and levoglucosan (R=0.82, pb0.01 and R=0.62, pb0.01,respectively) and K+ (R=0.78, pb0.01 and R=0.46, pb0.05, respec-tively), while the correlations between arabitol and mannitol, andother molecular tracers such as Ca2+ (tracer for soil emissions), SO4
2−
(indicator for secondary aerosol), and Na+ (tracer of sea salt emissions)are not significant (not shown).
The correlation between biomass burning emissions and fungaltracers observed in our study further supports the results of a fewprevious studies which found that fungal spores could be emittedthrough biomass burning activities. For instance, burning of crops,brush, timber and waste may disperse large numbers of fungi, whilesmall burns of diseased plants as well as cooking and heating withdiseased firewood might disperse spores on a smaller scale (Pisaric,
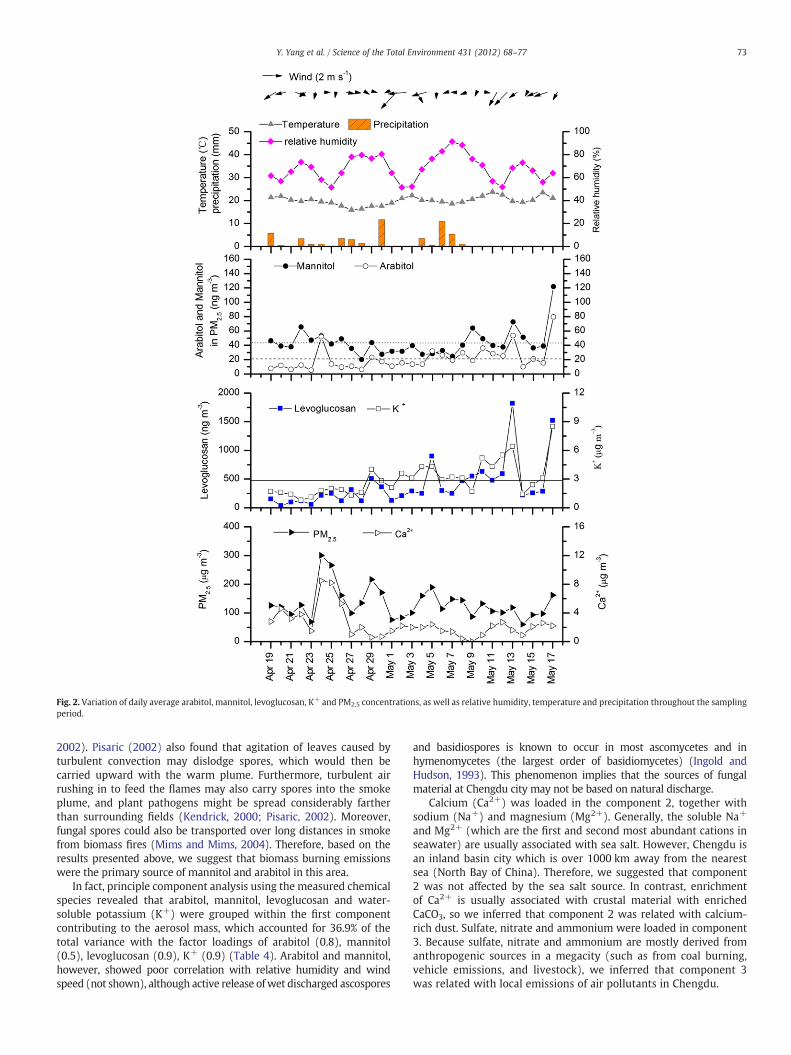
Fig. 2. Variation of daily average arabitol, mannitol, levoglucosan, K+ and PM2.5 concentrations, as well as relative humidity, temperature and precipitation throughout the samplingperiod.
73Y. Yang et al. / Science of the Total Environment 431 (2012) 68–77
2002). Pisaric (2002) also found that agitation of leaves caused byturbulent convection may dislodge spores, which would then becarried upward with the warm plume. Furthermore, turbulent airrushing in to feed the flames may also carry spores into the smokeplume, and plant pathogens might be spread considerably fartherthan surrounding fields (Kendrick, 2000; Pisaric, 2002). Moreover,fungal spores could also be transported over long distances in smokefrom biomass fires (Mims and Mims, 2004). Therefore, based on theresults presented above, we suggest that biomass burning emissionswere the primary source of mannitol and arabitol in this area.
In fact, principle component analysis using the measured chemicalspecies revealed that arabitol, mannitol, levoglucosan and water-soluble potassium (K+) were grouped within the first componentcontributing to the aerosol mass, which accounted for 36.9% of thetotal variance with the factor loadings of arabitol (0.8), mannitol(0.5), levoglucosan (0.9), K+ (0.9) (Table 4). Arabitol and mannitol,however, showed poor correlation with relative humidity and windspeed (not shown), although active release ofwet discharged ascospores
and basidiospores is known to occur in most ascomycetes and inhymenomycetes (the largest order of basidiomycetes) (Ingold andHudson, 1993). This phenomenon implies that the sources of fungalmaterial at Chengdu city may not be based on natural discharge.
Calcium (Ca2+) was loaded in the component 2, together withsodium (Na+) and magnesium (Mg2+). Generally, the soluble Na+
and Mg2+ (which are the first and second most abundant cations inseawater) are usually associated with sea salt. However, Chengdu isan inland basin city which is over 1000 km away from the nearestsea (North Bay of China). Therefore, we suggested that component2 was not affected by the sea salt source. In contrast, enrichmentof Ca2+ is usually associated with crustal material with enrichedCaCO3, so we inferred that component 2 was related with calcium-rich dust. Sulfate, nitrate and ammonium were loaded in component3. Because sulfate, nitrate and ammonium are mostly derived fromanthropogenic sources in a megacity (such as from coal burning,vehicle emissions, and livestock), we inferred that component 3was related with local emissions of air pollutants in Chengdu.
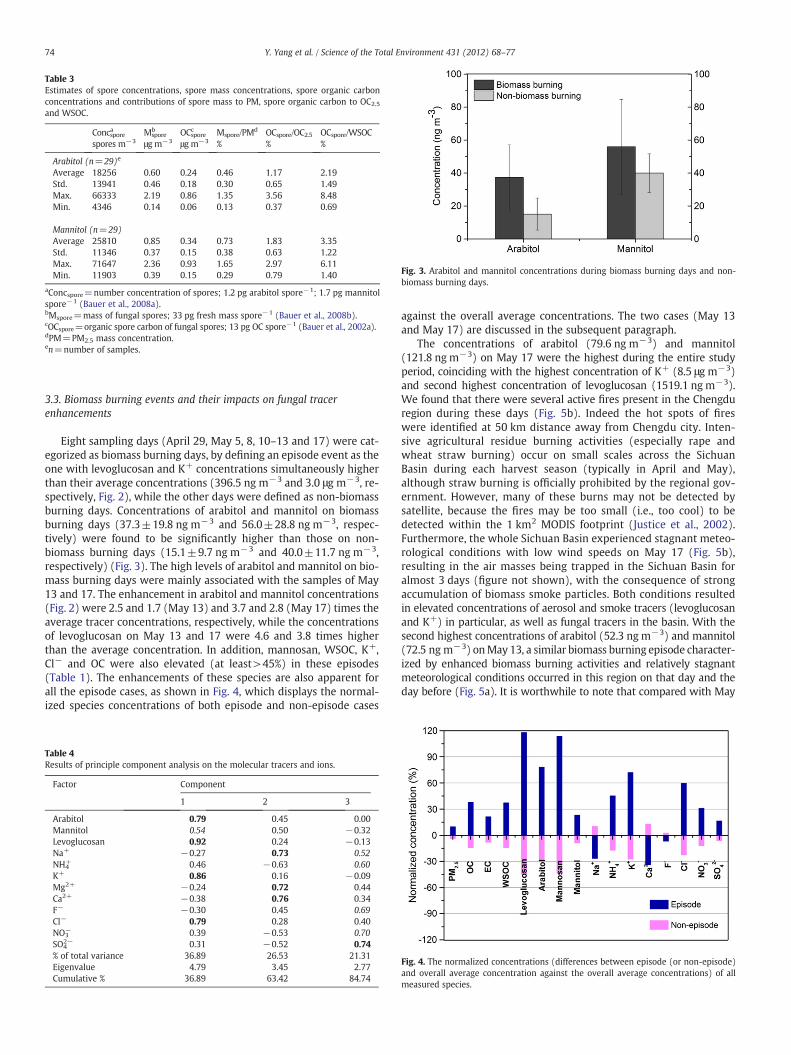
Fig. 3. Arabitol and mannitol concentrations during biomass burning days and non-biomass burning days.
Table 3Estimates of spore concentrations, spore mass concentrations, spore organic carbonconcentrations and contributions of spore mass to PM, spore organic carbon to OC2.5
and WSOC.
Concsporea
spores m−3Mspore
b
μgm−3OCsporec
μg m−3Mspore/PMd
%OCspore/OC2.5%
OCspore/WSOC%
Arabitol (n=29)e
Average 18256 0.60 0.24 0.46 1.17 2.19Std. 13941 0.46 0.18 0.30 0.65 1.49Max. 66333 2.19 0.86 1.35 3.56 8.48Min. 4346 0.14 0.06 0.13 0.37 0.69
Mannitol (n=29)Average 25810 0.85 0.34 0.73 1.83 3.35Std. 11346 0.37 0.15 0.38 0.63 1.22Max. 71647 2.36 0.93 1.65 2.97 6.11Min. 11903 0.39 0.15 0.29 0.79 1.40
aConcspore=number concentration of spores; 1.2 pg arabitol spore−1; 1.7 pg mannitolspore−1 (Bauer et al., 2008a).bMspore=mass of fungal spores; 33 pg fresh mass spore−1 (Bauer et al., 2008b).cOCspore=organic spore carbon of fungal spores; 13 pg OC spore−1 (Bauer et al., 2002a).dPM=PM2.5 mass concentration.en=number of samples.
74 Y. Yang et al. / Science of the Total Environment 431 (2012) 68–77
3.3. Biomass burning events and their impacts on fungal tracerenhancements
Eight sampling days (April 29, May 5, 8, 10–13 and 17) were cat-egorized as biomass burning days, by defining an episode event as theone with levoglucosan and K+ concentrations simultaneously higherthan their average concentrations (396.5 ng m−3 and 3.0 μg m−3, re-spectively, Fig. 2), while the other days were defined as non-biomassburning days. Concentrations of arabitol and mannitol on biomassburning days (37.3±19.8 ng m−3 and 56.0±28.8 ng m−3, respec-tively) were found to be significantly higher than those on non-biomass burning days (15.1±9.7 ng m−3 and 40.0±11.7 ng m−3,respectively) (Fig. 3). The high levels of arabitol and mannitol on bio-mass burning days were mainly associated with the samples of May13 and 17. The enhancement in arabitol and mannitol concentrations(Fig. 2) were 2.5 and 1.7 (May 13) and 3.7 and 2.8 (May 17) times theaverage tracer concentrations, respectively, while the concentrationsof levoglucosan on May 13 and 17 were 4.6 and 3.8 times higherthan the average concentration. In addition, mannosan, WSOC, K+,Cl− and OC were also elevated (at least>45%) in these episodes(Table 1). The enhancements of these species are also apparent forall the episode cases, as shown in Fig. 4, which displays the normal-ized species concentrations of both episode and non-episode cases
Table 4Results of principle component analysis on the molecular tracers and ions.
Factor Component
1 2 3
Arabitol 0.79 0.45 0.00Mannitol 0.54 0.50 −0.32Levoglucosan 0.92 0.24 −0.13Na+ −0.27 0.73 0.52NH4
+ 0.46 −0.63 0.60K+ 0.86 0.16 −0.09Mg2+ −0.24 0.72 0.44Ca2+ −0.38 0.76 0.34F− −0.30 0.45 0.69Cl− 0.79 0.28 0.40NO3
− 0.39 −0.53 0.70SO4
2− 0.31 −0.52 0.74% of total variance 36.89 26.53 21.31Eigenvalue 4.79 3.45 2.77Cumulative % 36.89 63.42 84.74
against the overall average concentrations. The two cases (May 13and May 17) are discussed in the subsequent paragraph.
The concentrations of arabitol (79.6 ng m−3) and mannitol(121.8 ng m−3) on May 17 were the highest during the entire studyperiod, coinciding with the highest concentration of K+ (8.5 μg m−3)and second highest concentration of levoglucosan (1519.1 ng m−3).We found that there were several active fires present in the Chengduregion during these days (Fig. 5b). Indeed the hot spots of fireswere identified at 50 km distance away from Chengdu city. Inten-sive agricultural residue burning activities (especially rape andwheat straw burning) occur on small scales across the SichuanBasin during each harvest season (typically in April and May),although straw burning is officially prohibited by the regional gov-ernment. However, many of these burns may not be detected bysatellite, because the fires may be too small (i.e., too cool) to bedetected within the 1 km2 MODIS footprint (Justice et al., 2002).Furthermore, the whole Sichuan Basin experienced stagnant meteo-rological conditions with low wind speeds on May 17 (Fig. 5b),resulting in the air masses being trapped in the Sichuan Basin foralmost 3 days (figure not shown), with the consequence of strongaccumulation of biomass smoke particles. Both conditions resultedin elevated concentrations of aerosol and smoke tracers (levoglucosanand K+) in particular, as well as fungal tracers in the basin. With thesecond highest concentrations of arabitol (52.3 ng m−3) and mannitol(72.5 ng m−3) onMay 13, a similar biomass burning episode character-ized by enhanced biomass burning activities and relatively stagnantmeteorological conditions occurred in this region on that day and theday before (Fig. 5a). It is worthwhile to note that compared with May
Fig. 4. The normalized concentrations (differences between episode (or non-episode)and overall average concentration against the overall average concentrations) of allmeasured species.
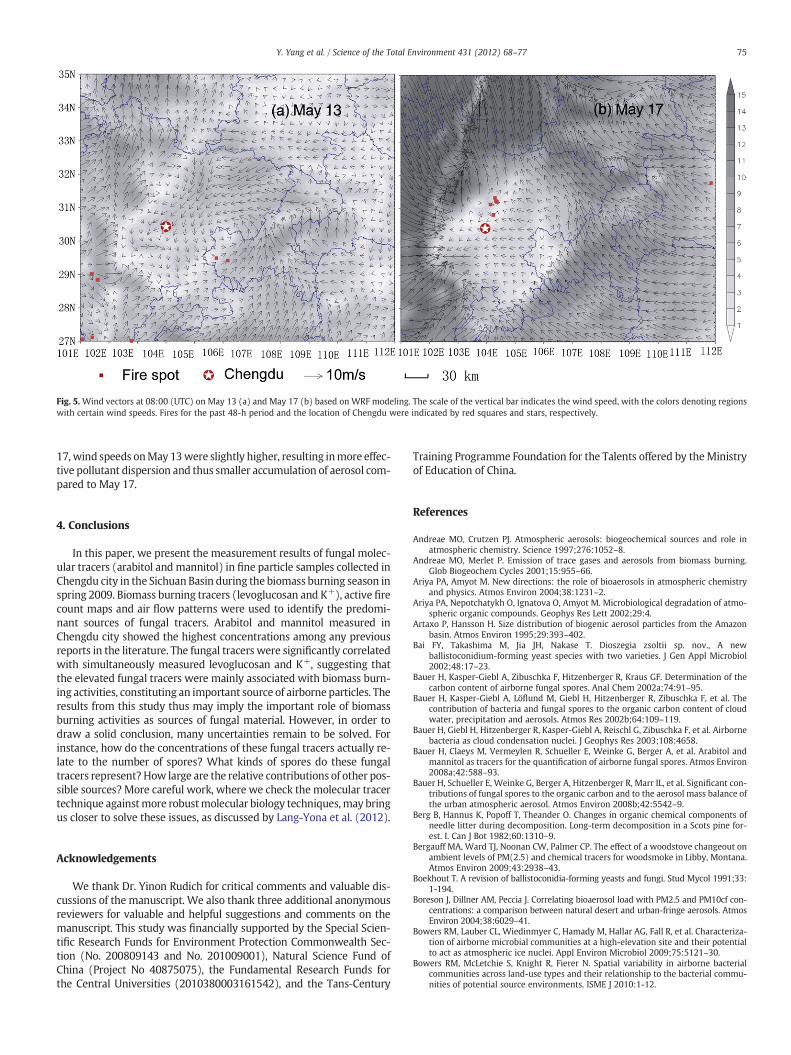
Fig. 5. Wind vectors at 08:00 (UTC) on May 13 (a) and May 17 (b) based on WRF modeling. The scale of the vertical bar indicates the wind speed, with the colors denoting regionswith certain wind speeds. Fires for the past 48-h period and the location of Chengdu were indicated by red squares and stars, respectively.
75Y. Yang et al. / Science of the Total Environment 431 (2012) 68–77
17, wind speeds onMay 13were slightly higher, resulting inmore effec-tive pollutant dispersion and thus smaller accumulation of aerosol com-pared to May 17.
4. Conclusions
In this paper, we present the measurement results of fungal molec-ular tracers (arabitol and mannitol) in fine particle samples collected inChengdu city in the Sichuan Basin during the biomass burning season inspring 2009. Biomass burning tracers (levoglucosan and K+), active firecount maps and air flow patterns were used to identify the predomi-nant sources of fungal tracers. Arabitol and mannitol measured inChengdu city showed the highest concentrations among any previousreports in the literature. The fungal tracers were significantly correlatedwith simultaneously measured levoglucosan and K+, suggesting thatthe elevated fungal tracers were mainly associated with biomass burn-ing activities, constituting an important source of airborne particles. Theresults from this study thus may imply the important role of biomassburning activities as sources of fungal material. However, in order todraw a solid conclusion, many uncertainties remain to be solved. Forinstance, how do the concentrations of these fungal tracers actually re-late to the number of spores? What kinds of spores do these fungaltracers represent?How large are the relative contributions of other pos-sible sources?More careful work, where we check the molecular tracertechnique againstmore robustmolecular biology techniques,may bringus closer to solve these issues, as discussed by Lang-Yona et al. (2012).
Acknowledgements
We thank Dr. Yinon Rudich for critical comments and valuable dis-cussions of the manuscript. We also thank three additional anonymousreviewers for valuable and helpful suggestions and comments on themanuscript. This study was financially supported by the Special Scien-tific Research Funds for Environment Protection Commonwealth Sec-tion (No. 200809143 and No. 201009001), Natural Science Fund ofChina (Project No 40875075), the Fundamental Research Funds forthe Central Universities (2010380003161542), and the Tans‐Century
Training Programme Foundation for the Talents offered by theMinistryof Education of China.
References
Andreae MO, Crutzen PJ. Atmospheric aerosols: biogeochemical sources and role inatmospheric chemistry. Science 1997;276:1052–8.
Andreae MO, Merlet P. Emission of trace gases and aerosols from biomass burning.Glob Biogeochem Cycles 2001;15:955–66.
Ariya PA, Amyot M. New directions: the role of bioaerosols in atmospheric chemistryand physics. Atmos Environ 2004;38:1231–2.
Ariya PA, Nepotchatykh O, Ignatova O, Amyot M. Microbiological degradation of atmo-spheric organic compounds. Geophys Res Lett 2002;29:4.
Artaxo P, Hansson H. Size distribution of biogenic aerosol particles from the Amazonbasin. Atmos Environ 1995;29:393–402.
Bai FY, Takashima M, Jia JH, Nakase T. Dioszegia zsoltii sp. nov., A newballistoconidium-forming yeast species with two varieties. J Gen Appl Microbiol2002;48:17–23.
Bauer H, Kasper-Giebl A, Zibuschka F, Hitzenberger R, Kraus GF. Determination of thecarbon content of airborne fungal spores. Anal Chem 2002a;74:91–95.
Bauer H, Kasper-Giebl A, Löflund M, Giebl H, Hitzenberger R, Zibuschka F, et al. Thecontribution of bacteria and fungal spores to the organic carbon content of cloudwater, precipitation and aerosols. Atmos Res 2002b;64:109–119.
Bauer H, Giebl H, Hitzenberger R, Kasper-Giebl A, Reischl G, Zibuschka F, et al. Airbornebacteria as cloud condensation nuclei. J Geophys Res 2003;108:4658.
Bauer H, Claeys M, Vermeylen R, Schueller E, Weinke G, Berger A, et al. Arabitol andmannitol as tracers for the quantification of airborne fungal spores. Atmos Environ2008a;42:588–93.
Bauer H, Schueller E, Weinke G, Berger A, Hitzenberger R, Marr IL, et al. Significant con-tributions of fungal spores to the organic carbon and to the aerosol mass balance ofthe urban atmospheric aerosol. Atmos Environ 2008b;42:5542–9.
Berg B, Hannus K, Popoff T, Theander O. Changes in organic chemical components ofneedle litter during decomposition. Long-term decomposition in a Scots pine for-est. I. Can J Bot 1982;60:1310–9.
Bergauff MA, Ward TJ, Noonan CW, Palmer CP. The effect of a woodstove changeout onambient levels of PM(2.5) and chemical tracers for woodsmoke in Libby, Montana.Atmos Environ 2009;43:2938–43.
Boekhout T. A revision of ballistoconidia-forming yeasts and fungi. Stud Mycol 1991;33:1-194.
Boreson J, Dillner AM, Peccia J. Correlating bioaerosol load with PM2.5 and PM10cf con-centrations: a comparison between natural desert and urban-fringe aerosols. AtmosEnviron 2004;38:6029–41.
Bowers RM, Lauber CL, Wiedinmyer C, Hamady M, Hallar AG, Fall R, et al. Characteriza-tion of airborne microbial communities at a high-elevation site and their potentialto act as atmospheric ice nuclei. Appl Environ Microbiol 2009;75:5121–30.
Bowers RM, McLetchie S, Knight R, Fierer N. Spatial variability in airborne bacterialcommunities across land-use types and their relationship to the bacterial commu-nities of potential source environments. ISME J 2010:1-12.
76 Y. Yang et al. / Science of the Total Environment 431 (2012) 68–77
Brodie E, DeSantis T, Parker J, Zubietta I, Piceno Y, Andersen G. Urban aerosols harbordiverse and dynamic bacterial populations. Proc Natl Acad Sci U S A 2007;104:299–304.
Burch M, Levetin E. Effects of meteorological conditions on spore plumes. Int J Biomet-eorol 2002;46:107–17.
Burge HA. An update on pollen and fungal spore aerobiology. J Allergy Clin Immunol2002;110:544–52.
Burshtein N, Yona NL, Rudich Y. Ergosterol, arabitol and mannitol as tracers for biogen-ic aerosols in the Eastern Mediterranean. Atmos Chem Phys 2011;11:829–39.
Cao J, Lee S, Ho K, Zhang X, Zou S, Fung K, et al. Characteristics of carbonaceous aerosolin Pearl River Delta Region, China during 2001 winter period. Atmos Environ2003;37:1451–60.
Carlile M, Watkinson S. The fungi. London: Academic press; 1994.Caseiro A,Marr IL, ClaeysM, Kasper-Giebl A, PuxbaumH, Pio CA. Determination of saccha-
rides in atmospheric aerosol using anion-exchange high-performance liquid chroma-tography and pulsed-amperometric detection. J Chromatogr A 2007;1171:37–45.
Christner BC, Cai R, Morris CE, McCarter KS, Foreman CM, Skidmore ML, et al. Geo-graphic, seasonal, and precipitation chemistry influence on the abundance andactivity of biological ice nucleators in rain and snow. Proc Natl Acad Sci U S A2008a;105:18854–9.
Claeys M, Kourtchev I, Pashynska V, Vas G, Vermeylen R, Wang W, et al. Polar organicmarker compounds in atmospheric aerosols during the LBA-SMOCC 2002 biomassburning experiment in Rondônia, Brazil: sources and source processes, time series,diel variations and size distributions. Atmos Chem Phys 2010;10:9319.
Connell L, Redman R, Craig S, Scorzetti G, Iszard M, Rodriguez R. Diversity of soil yeastsisolated from South Victoria Land, Antarctica. Microb Ecol 2008;56:448–59.
Dales RE, Cakmak S, Burnett RT, Judek S, Coates F, Brook JR. Influence of ambient fungalspores on emergency visits for asthma to a regional children's hospital. Am J RespirCrit Care 2000;162:2087.
Dales RE, Cakmak S, Judek S, Dann T, Coates F, Brook JR, et al. The role of fungal sporesin thunderstorm asthma. Chest 2003;123:745.
Dales RE, Cakmak S, Judek S, Dann T, Coates F, Brook JR, et al. Influence of outdooraeroallergens on hospitalization for asthma in Canada. J Allergy Clin Immunol2004;113:303–6.
Davies DK, Ilavajhala S, Wong MM, Justice CO. Fire information for resource manage-ment system: archiving and distributing MODIS active fire data. IEEE Trans GeosciRemote 2009;47:72–9.
Decesari S, Fuzzi S, Facchini MC, Mircea M, Emblico L, Cavalli F, et al. Characterization ofthe organic composition of aerosols from Rondonia, Brazil, during the LBA-SMOCC2002 experiment and its representation through model compounds. Atmos ChemPhys 2006;6:375–402.
Deguillaume L, Leriche M, Amato P, Ariya PA, Delort AM, Poschl U, et al. Microbiologyand atmospheric processes: chemical interactions of primary biological aerosols.Biogeosciences 2008;5:1073–84.
Després VR, Huffman JA, Burrows SM, Hoose C, Safatov AS, Buryak G, et al. Primarybiological aerosol particles in the atmosphere: a review. Tellus B 2012;64.
Elbert W, Taylor PE, Andreae MO, Poschl U. Contribution of fungi to primary biogenicaerosols in the atmosphere: wet and dry discharged spores, carbohydrates, andinorganic ions. Atmos Chem Phys 2007;7:4569–88.
Engling G, Carrico CM, Kreldenweis SM, Collett JL, Day DE, Malm WC, et al. Determina-tion of levoglucosan in biomass combustion aerosol by high-performance anion-exchange chromatography with pulsed amperometric detection. Atmos Environ2006;40:S299–311.
Fine PM, Cass GR, Simoneit BRT. Chemical characterization of fine particle emissionsfrom fireplace combustion of woods grown in the northeastern United States.Environ Sci Technol 2001;35:2665–75.
Froehlich-Nowoisky J, Pickersgill DA, Despres VR, Poeschl U. High diversity of fungi inair particulate matter. Proc Natl Acad Sci U S A 2009;106:12814–9.
Froehlich-Nowoisky J, Burrows SM, Xie Z, Engling G, Solomon PA, Fraser MP, et al. Bioge-ography in the air: fungal diversity over land and oceans. Biogeosciences 2012;9:1125–36.
Georgakopoulos DG, Despres V, Frohlich-Nowoisky J, Psenner R, Ariya PA, Posfai M,et al. Microbiology and atmospheric processes: biological, physical and chemicalcharacterization of aerosol particles. Biogeosciences 2009;6:721–37.
Górny RL, Reponen T, Willeke K, Schmechel D, Robine E, Boissier M, et al. Fungalfragments as indoor air biocontaminants. Appl Environ Microbiol 2002;68:3522–31.
Graham B, Mayol-Bracero OL, Guyon P, Roberts GC, Decesari S, Facchini MC, et al.Water-soluble organic compounds in biomass burning aerosols over Amazonia -1. Characterization by NMR and GC-MS. J Geophys Res 2002;107.
Graham B, Guyon P, Maenhaut W, Taylor PE, Ebert M, Matthias-Maser S, et al. Compo-sition and diurnal variability of the natural Amazonian aerosol. J Geophys Res2003;108:17.
Griffin D, Garrison V, Herman J, Shinn E. African desert dust in the Caribbean atmo-sphere: microbiology and public health. Aerobiologia 2001;17:203–13.
Hamilton WD, Lenton TM. Spora and Gaia: how microbes fly with their clouds. EtholEcol Evol 1998;10:1-16.
He K, Yang F, Ma Y, Zhang Q, Yao X, Chan CK, et al. The characteristics of PM2. 5 inBeijing, China. Atmos Environ 2001;35:4959–70.
Heald CL, Spracklen DV. Atmospheric budget of primary biological aerosol particlesfrom fungal spores. Geophys Res Lett 2009;36:L09806.
Hu D, Bian Q, Li WYT, Lau AKH, Yu J. Contributions of isoprene, monoterpenes, β-caryophyllene, and toluene to secondary organic aerosols in Hong Kong duringthe summer of 2006. J Geophys Res 2008;113:D22206.
Linuma Y, Engling G, Puxbaum H, Herrmann H. A highly resolved anion-exchangechromatographic method for determination of saccharidic tracers for biomass
combustion and primary bio-particles in atmospheric aerosol. Atmos Environ2009;43:1367–71.
Ingold CT. Range in size and form of basidiospores and ascospores. Mycologist 2001;15:165–6.
Ingold T, Hudson HJ. The biology of fungi. London: Chapman and Hall Ltd; 1993.Ion A, Vermeylen R, Kourtchev I, Cafmeyer J, Chi X, Gelencser A, et al. Polar organic com-
pounds in rural PM2. 5 aerosols from K-puszta, Hungary, during a 2003 summerfield campaign: sources and diel variations. Atmos Chem Phys 2005;5:1805–14.
Jaenicke R. Abundance of cellular material and proteins in the atmosphere. Science2005;308:73.
Jaenicke R, Matthias-Maser S, Gruber S. Omnipresence of biological material in theatmosphere. Environ Chem 2007;4:217–20.
Jimenez J, Wu CF, Claiborn C, Gould T, Simpson CD, Larson T, et al. Agricultural burningsmoke in easternWashington–part I: atmospheric characterization. Atmos Environ2006;40:639–50.
Justice CO, Giglio L, Korontzi S, Owens J, Morisette J, Roy D, et al. The MODIS fire prod-ucts. Remote Sens Environ 2002;83:244–62.
Kaushik R, Balasubramanian R. Assessment of bacterial pathogens in fresh rainwaterand airborne particulate matter using Real-Time PCR. Atmos Environ 2012;46:131–9.
Kendrick B. The fifth kingdom. Sydney, BC, Canada: Mycologue Publications; 2000.Kourtchev I, Warnke J, Maenhaut W, Hoffmann T, Claeys M. Polar organic marker com-
pounds in PM2. 5 aerosol from a mixed forest site in western Germany. Chemo-sphere 2008;73:1308–14.
Kourtchev I, Copolovici L, Claeys M, Maenhaut W. Characterization of atmosphericaerosols at a forested site in Central Europe. Environ Sci Technol 2009;43:4665–71.
Lacey J. Airborne spores in pastures. Trans Br Mycol Soc 1975;64:265–81.Lacey J. The aerobiology of conidial fungi, Vol. 1. New York: Academic Press; 1981.Lang-Yona N, Dannemiller K, Yamamoto N, Burshtein N, Peccia J, Yarden O, et al. Annu-
al distribution of allergenic fungal spores in atmospheric particulate matter in theEastern Mediterranean; a comparative study between ergosterol and quantitativePCR analysis. Atmos Chem Phys 2012;12:2681–90.
Lee AKY, Lau APS, Cheng JYW, Fang M, Chan CK. Source identification analysis for theairborne bacteria and fungi using a biomarker approach. Atmos Environ 2007;41:2831–43.
Lee JJ, Engling G, Candice Lung SC, Lee KY. Particle size characteristics of levoglucosanin ambient aerosols from rice straw burning. Atmos Environ 2008;42:8300–8.
Lewis D, Smith D. Sugar alcohols (polyols) in fungi and green plants. I. Distribution,physiology and metabolism. New Phytol 1967;66:143–84.
LinWH, Li CS. Size characteristics of fungus allergens in the subtropical climate. Aerosol SciTechnol 1996;25:93-100.
Lin ED, Xiong W, Ju H, Xu YL, Li Y, Bai LP, et al. Climate change impacts on crop yield andquality with CO2 fertilization in China. Philos Trans R Soc B 2005;360:2149–54.
Lobert J, Warnatz J. Emissions from the combustion process in vegetation. Fire in theEnvironment: The Ecological, Climatic, and Atmospheric Chemical Importance ofVegetation Fires 1993:15–37.
Ma LJ, Rogers SO, Catranis CM, Starmer WT. Detection and characterization of ancientfungi entrapped in glacial ice. Mycologia 2000;92:286–95.
Mahowald NM, Artaxo P, Baker AR, Jickells TD, Okin GS, Randerson JT, et al. Impacts ofbiomass burning emissions and land use change on Amazonian atmospheric phos-phorus cycling and deposition. Glob Biogeochem Cycles 2005;19.
Mandrioli P, Puppi G, Bagni N, Prodi F. Distribution of microorganisms in hailstones.Nature 1973;246:416–7.
Matthias-Maser S, Bogs B, Jaenicke R. The size distribution of primary biological aerosolparticles in cloud water on the mountain Kleiner Feldberg/Taunus(FRG). AtmosRes 2000;54:1-13.
Michalakes J, Chen S, Dudhia J, Hart L, Klemp J, Middlecoff J, et al. Development of anext generation regional weather research and forecast model., 1. World Scientific;2001. p. 269–76.
Michalakes J, Dudhia J, Gill D, Henderson T, Klemp J, Skamarock W, et al. The weatherresearch and forecast model: software architecture and performance. In: GeorgeM, editor. Proceedings of the Eleventh ECMWF Workshop on the Use of High Per-formance. World Scientific, Zwieflhofer Walter; 2005. p. 156–68.
Mims SA, Mims FM. Fungal spores are transported long distances in smoke from bio-mass fires. Atmos Environ 2004;38:651–5.
Mohler O, DeMott PJ, Vali G, Levin Z. Microbiology and atmospheric processes: the roleof biological particles in cloud physics. Biogeosciences 2007;4:1059–71.
Morris CE, Sands DC, Bardin M, Jaenicke R, Vogel B, Leyronas C, et al. Microbiology andatmospheric processes: research challenges concerning the impact of airbornemicro-organisms on the atmosphere and climate. Biogeosciences 2011;8:17–25.
Novozhilova M, Popova L. Yeasts in marine environments. Antonie Van Leeuwenhoek1969;35:D23–4.
Pio C, Legrand M, Alves C, Oliveira T, Afonso J, Caseiro A, et al. Chemical composition ofatmospheric aerosols during the 2003 summer intense forest fire period. AtmosEnviron 2008;42:7530–43.
Pisaric MFJ. Long-distance transport of terrestrial plant material by convection resultingfrom forest fires. J Paleolimnol 2002;28:349–54.
Prenni AJ, Petters MD, Kreidenweis SM, Heald CL, Martin ST, Artaxo P, et al. Relativeroles of biogenic emissions and Saharan dust as ice nuclei in the Amazon basin.Nat Geosci 2009;2:401–4.
Puxbaum H, Caseiro A, Sánchez-Ochoa A, Kasper-Giebl A, Claeys M, Gelencsér A, et al.Levoglucosan levels at background sites in Europe for assessing the impact of bio-mass combustion on the European aerosol background. J Geophys Res 2007;112:D23S05.
Rong I. Karnal bunt of wheat detected in South Africa. Plant Prot News 2000:15–7.
77Y. Yang et al. / Science of the Total Environment 431 (2012) 68–77
Rutherford S, Simpson R, Williams G, Mitchell C, McCall B. Relationships between envi-ronmental factors and lung function of asthmatic subjects in South East Queens-land, Australia. J Occup Environ Med 2000;42:882.
Seinfeld JH, Pandis SN. From air pollution to climate change. Atmospheric Chemistryand Physics. New York: John Wiley & Sons; 1998. p. 1326.
Sesartic A, Dallafior T. Global fungal spore emissions, review and synthesis of literaturedata. Biogeosciences 2011;8:1181–92.
Simoneit BRT. Biomass burning—a review of organic tracers for smoke from incompletecombustion. Appl Geochem 2002;17:129–62.
Simoneit BRT, Elias VO. Detecting organic tracers from biomass burning in the atmo-sphere. Mar Pollut Bull 2001;42:805–10.
Simoneit BRT, Schauer JJ, Nolte C, Oros DR, Elias VO, Fraser M, et al. Levoglucosan, atracer for cellulose in biomass burning and atmospheric particles. Atmos Environ1999;33:173–82.
Smits GJ, van den Ende H, Klis FM. Differential regulation of cell wall biogenesis duringgrowth and development in yeast. Microbiol-Uk 2001;147:781–94.
Sun Y, Zhang Q, Zheng M, Ding X, Edgerton ES, Wang X. Characterization and sourceapportionment of water-soluble organic matter in atmospheric fine particles(PM2.5) with high-resolution aerosol mass spectrometry and GC–MS. Environ SciTechnol 2011;45:4854–61.
Targonski PV, Persky VW, Ramekrishnan V. Effect of environmental molds on risk ofdeath from asthma during the pollen season. J Allergy Clin Immunol 1995;95:955–61.
Vali G. Ice nucleation—a review. Nucl Atmos Aerosols 1996:271–9.Viana M, López J, Querol X, Alastuey A, García-Gacio D, Blanco-Heras G, et al. Tracers
and impact of open burning of rice straw residues on PM in Eastern Spain. AtmosEnviron 2008;42:1941–57.
Wan ECH, Yu JZ. Analysis of sugars and sugar polyols in atmospheric aerosols by chlo-ride attachment in liquid chromatography/negative ion electrospray mass spec-trometry. Environ Sci Technol 2007;41:2459–66.
Wang X, Bi X, Sheng G, Fu J. Chemical composition and sources of PM10 and PM2. 5aerosols in Guangzhou, China. Environ Monit Assess 2006;119:425–39.
Wang Q, Shao M, Liu Y, William K, Paul G, Li X, et al. Impact of biomass burning onurban air quality estimated by organic tracers: Guangzhou and Beijing as cases.Atmos Environ 2007;41:8380–90.
Wang W, Wu M, Li L, Zhang T, Liu X, Feng J, et al. Polar organic tracers in PM2. 5 aero-sols from forests in eastern China. Atmos Chem Phys 2008;8:7507–18.
Ward T, Boulafentis J, Simpson J, Hester C, Moliga T, Warden K, et al. Lessons learnedfrom a woodstove changeout on the Nez Perce Reservation. Sci Total Environ2011;409:664–70.
Wiedinmyer C, Bowers RM, Fierer N, Horanyi E, Hannigan M, Hallar AG, et al. The con-tribution of biological particles to observed particulate organic carbon at a remotehigh altitude site. Atmos Environ 2009;43:4278–82.
Winiwarter W, Bauer H, Caseiro A, Puxbaum H. Quantifying emissions of primary bio-logical aerosol particle mass in Europe. Atmos Environ 2009;43:1403–9.
Womiloju TO, Miller JD, Mayer PM, Brook JR. Methods to determine the biological com-position of particulate matter collected from outdoor air. Atmos Environ 2003;37:4335–44.
Xu ZQ, Wu Y, Shen FX, Chen Q, Tan MM, Yao MS. Bioaerosol science, technology, andengineering: past, present, and future. Aerosol Sci Technol 2011;45:1337–49.
Yamasoe MA, Artaxo P, Miguel AH, Allen AG. Chemical composition of aerosol particlesfrom direct emissions of vegetation fires in the Amazon Basin: water-soluble spe-cies and trace elements. Atmos Environ 2000;34:1641–53.
Yttri K, Dye C, Kiss G. Ambient aerosol concentrations of sugars and sugar-alcohols atfour different sites in Norway. Atmos Chem Phy Discuss 2007;7:5769–803.
Zhang T, Claeys M, Cachier H, Dong S, Wang W, Maenhaut W, et al. Identification andestimation of the biomass burning contribution to Beijing aerosol usinglevoglucosan as a molecular marker. Atmos Environ 2008;42:7013–21.
Zhang T, Engling G, Chan CY, Zhang YN, Zhang ZS, Lin M, et al. Contribution of fungalspores to particulate matter in a tropical rainforest. Environ Res Lett 2010;5:024010.