obiee 200 - fiscal & administrative training · a. logging in and out of obiee ... version #1.0...
TRANSCRIPT

OBIEE 200Training Guide
(Go-Live Edition)
Version #1.0
NOTESTABLE OF CONTENTS
1) Training Goal and Objectives
2) Introduction & Overview
A. Logging In and Out of OBIEE
B. Viewing Account Settings
3) Navigate the Home Page and Global Header
A. Overview of Home Page
B. Overview of Global Header
C. What is a Dashboard and “Canned” Reports
4) Creating an Analysis
A. Create a New Analysis
B. Setting Column Properties
C. Editing the Table View
D. Saving Analysis
E. Adding a Filter to the Analysis
F. Saving Filters
Creating an Analysis - Exercise One
G. Adding a Graph to an Analysis
H. Adding a Pivot Table to an Analysis (Manual Only)
Adding a Graph to an Analysis- Exercise Two
5) Working with Dashboards
A. Creating a New Dashboard
B. Working with Dashboards
6) Using an Agent
Adding your Analysis to a Dashboard – Exercise Three
7) Glossary
2Version #1.0 OBIEE 200
NOTESTraining Goal and Objectives
A. Training Goal
This is an Instructor Led hands-on course, designed for people
who need to learn how to navigate through OBIEE using the
Home Page and Global Header, dashboards, as well as create
employee-based analysis (reports) for Payroll and HR.
B. Objectives
Upon completion of this training, participants will be able to:
1. Navigate the Home Page and Global Header;
2. Understand the Basic Navigation in OBIEE;
3. Understand how Dashboards work;
4. Create New Analysis;
5. As well as understand how to work with Agents.
3OBIEE 200
1)
Version #1.0
NOTES
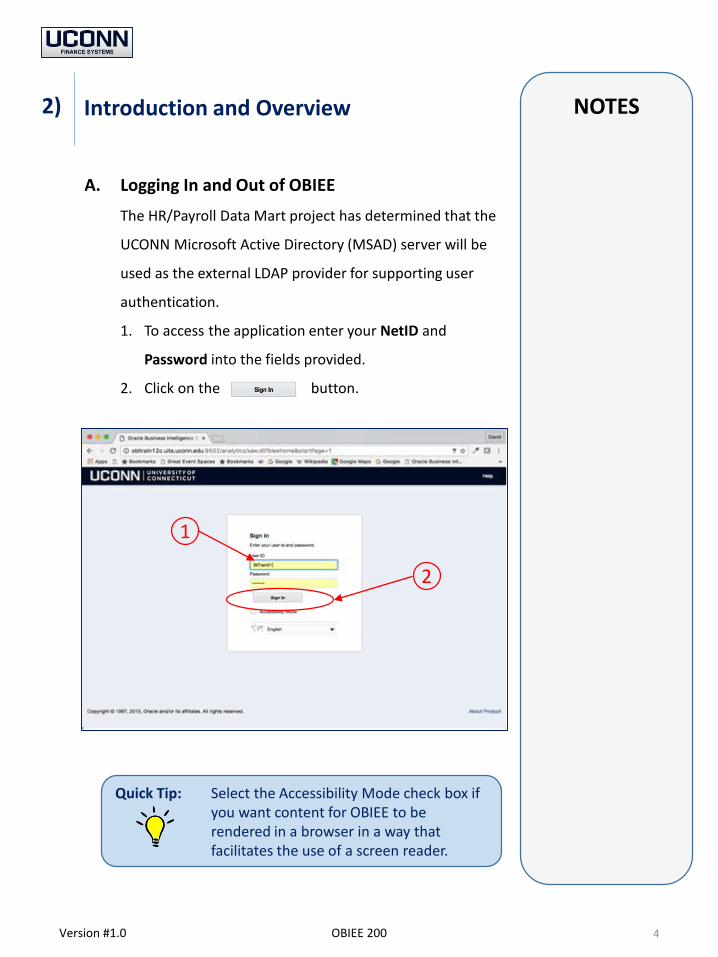
A. Logging In and Out of OBIEE
The HR/Payroll Data Mart project has determined that the
UCONN Microsoft Active Directory (MSAD) server will be
used as the external LDAP provider for supporting user
authentication.
1. To access the application enter your NetID and
Password into the fields provided.
2. Click on the button.
Introduction and Overview
4Version #1.0 OBIEE 200
2)
Quick Tip: Select the Accessibility Mode check box if you want content for OBIEE to be rendered in a browser in a way that facilitates the use of a screen reader.
2
1
NOTES
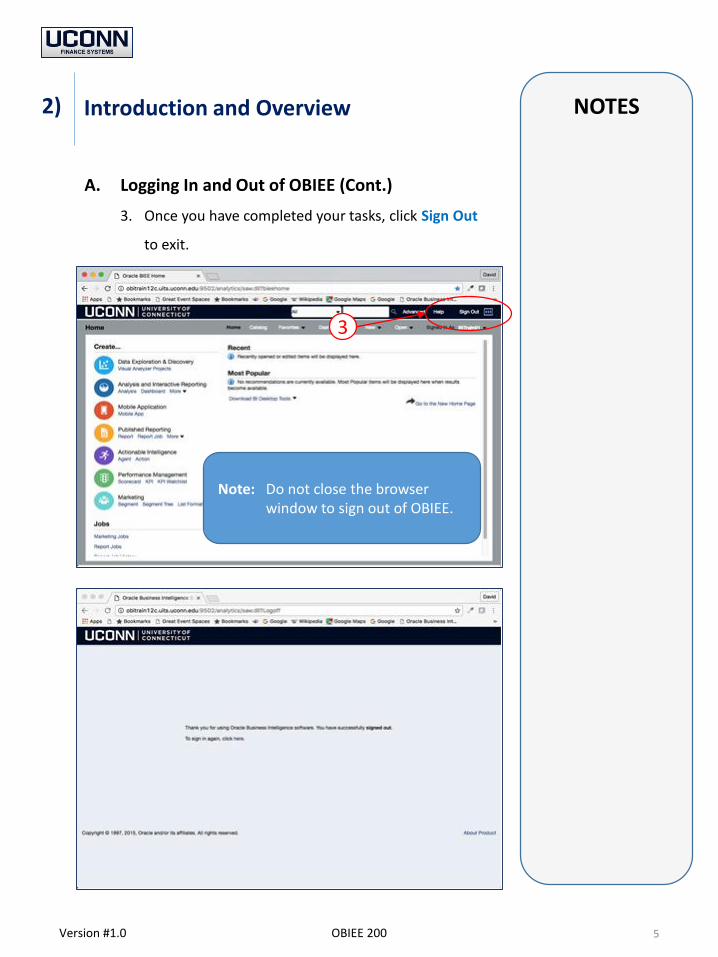
A. Logging In and Out of OBIEE (Cont.)
3. Once you have completed your tasks, click Sign Out
to exit.
Introduction and Overview
5Version #1.0 OBIEE 200
2)
Note: Do not close the browser window to sign out of OBIEE.
3
NOTES
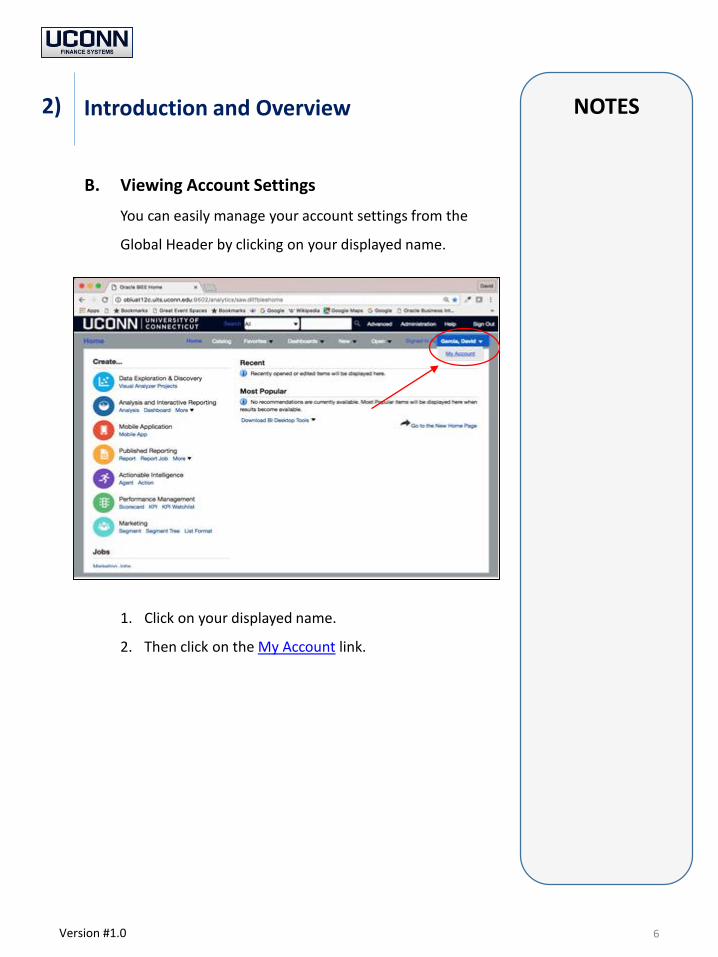
B. Viewing Account Settings
You can easily manage your account settings from the
Global Header by clicking on your displayed name.
1. Click on your displayed name.
2. Then click on the My Account link.
6Version #1.0
Introduction and Overview2)
NOTES
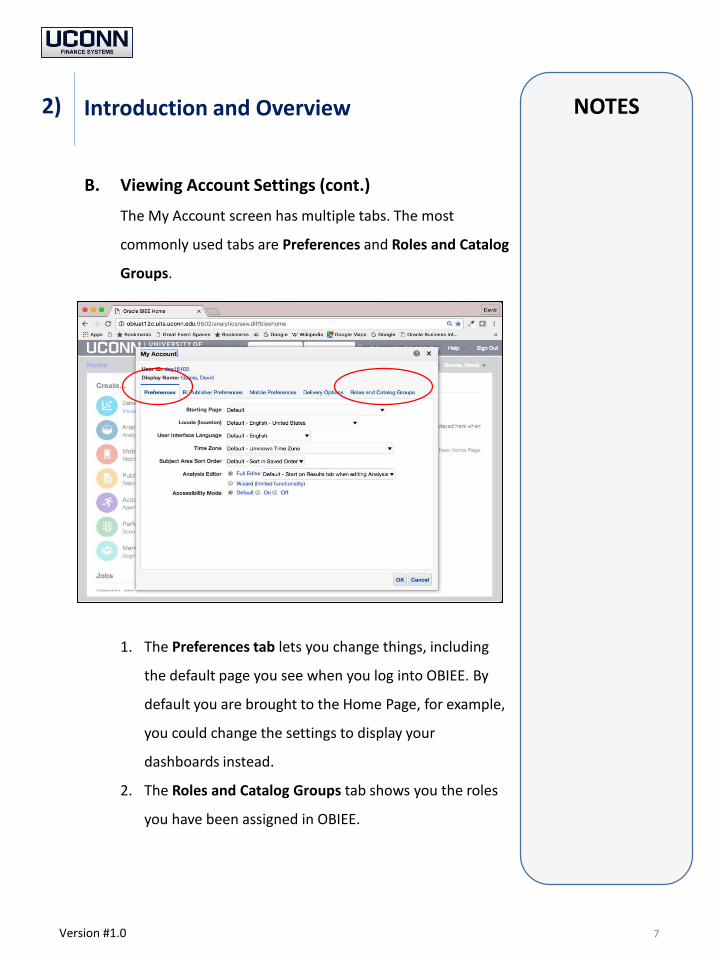
B. Viewing Account Settings (cont.)
The My Account screen has multiple tabs. The most
commonly used tabs are Preferences and Roles and Catalog
Groups.
1. The Preferences tab lets you change things, including
the default page you see when you log into OBIEE. By
default you are brought to the Home Page, for example,
you could change the settings to display your
dashboards instead.
2. The Roles and Catalog Groups tab shows you the roles
you have been assigned in OBIEE.
Introduction and Overview
7Version #1.0
2)
NOTES
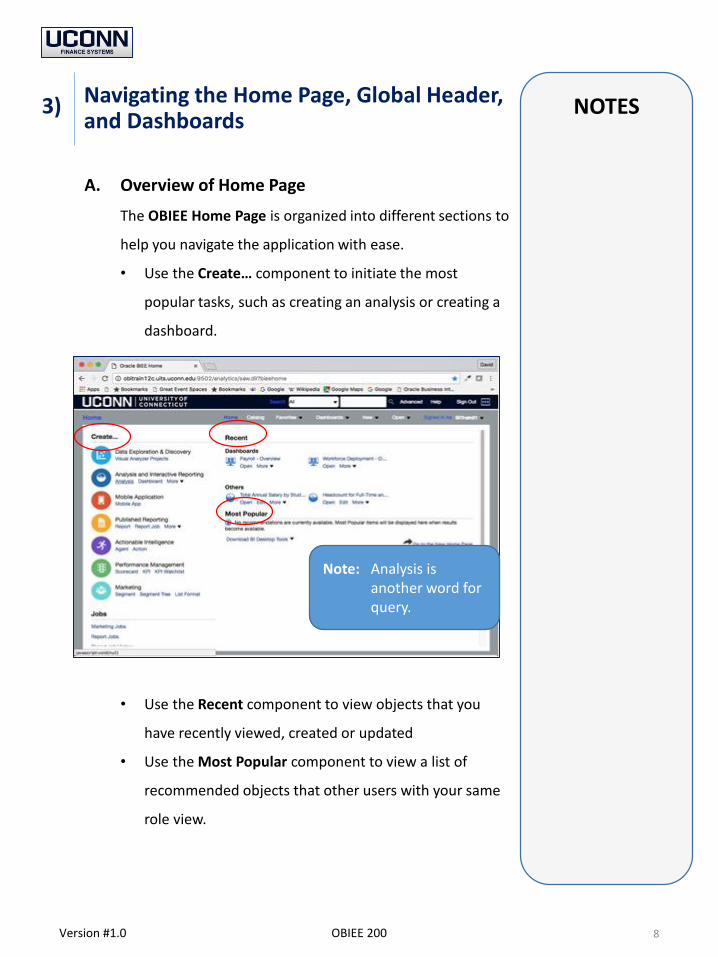
A. Overview of Home Page
The OBIEE Home Page is organized into different sections to
help you navigate the application with ease.
• Use the Create… component to initiate the most
popular tasks, such as creating an analysis or creating a
dashboard.
• Use the Recent component to view objects that you
have recently viewed, created or updated
• Use the Most Popular component to view a list of
recommended objects that other users with your same
role view.
Navigating the Home Page, Global Header, and Dashboards
8Version #1.0 OBIEE 200
3)
Note: Analysis is another word for query.
NOTES
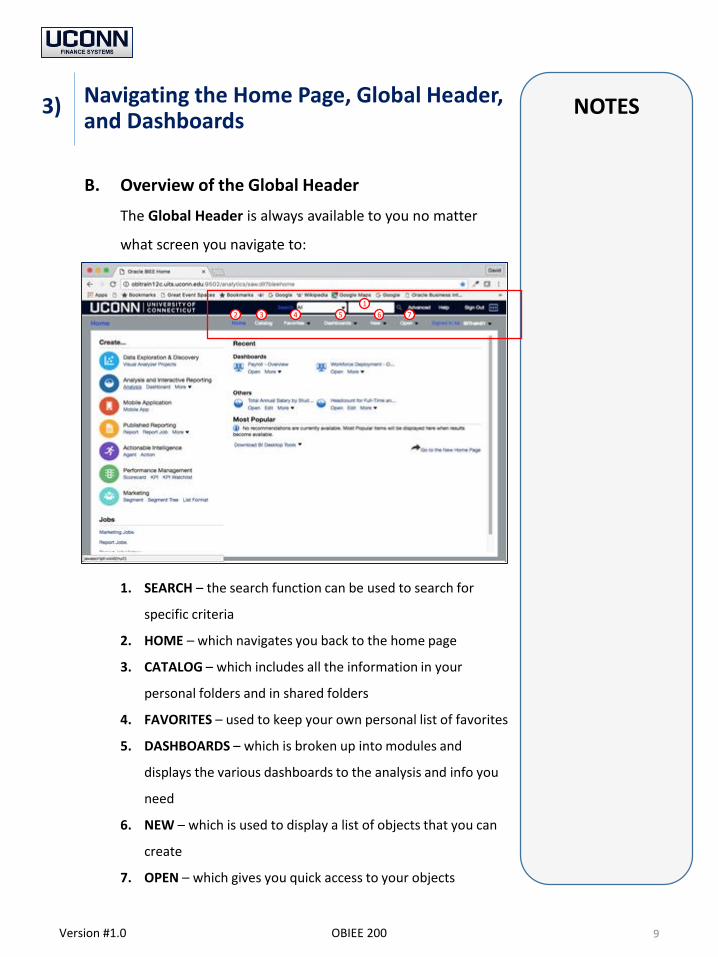
B. Overview of the Global Header
The Global Header is always available to you no matter
what screen you navigate to:
1. SEARCH – the search function can be used to search for
specific criteria
2. HOME – which navigates you back to the home page
3. CATALOG – which includes all the information in your
personal folders and in shared folders
4. FAVORITES – used to keep your own personal list of favorites
5. DASHBOARDS – which is broken up into modules and
displays the various dashboards to the analysis and info you
need
6. NEW – which is used to display a list of objects that you can
create
7. OPEN – which gives you quick access to your objects
Navigating the Home Page, Global Header, and Dashboards
9Version #1.0 OBIEE 200
3)
1
2 3 4 5 6 7
NOTES
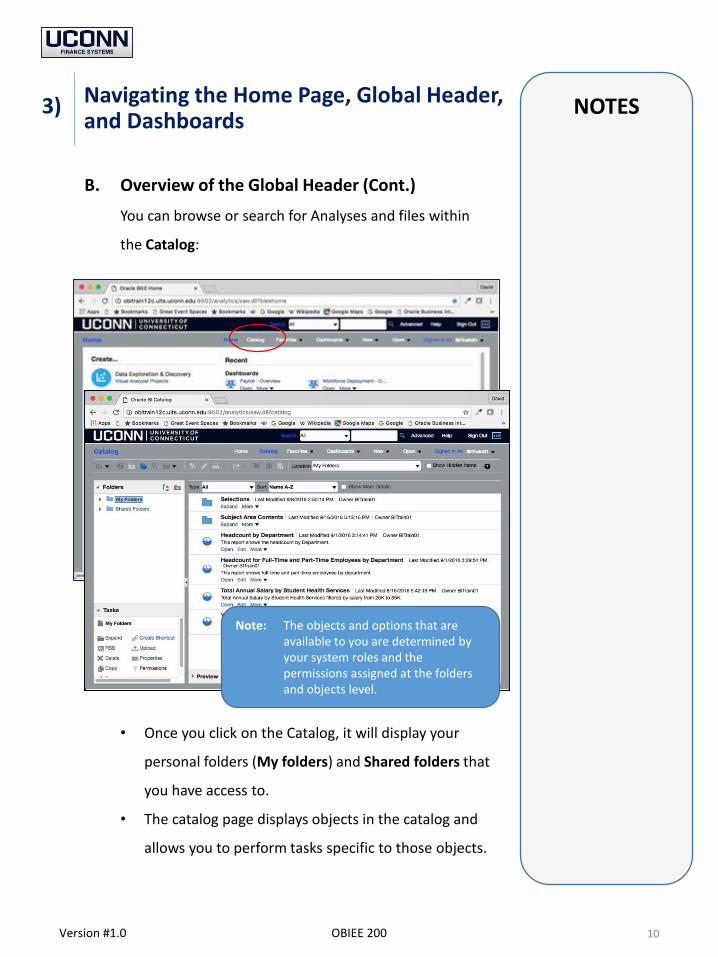
B. Overview of the Global Header (Cont.)
You can browse or search for Analyses and files within
the Catalog:
• Once you click on the Catalog, it will display your
personal folders (My folders) and Shared folders that
you have access to.
• The catalog page displays objects in the catalog and
allows you to perform tasks specific to those objects.
Navigating the Home Page, Global Header, and Dashboards
10Version #1.0 OBIEE 200
3)
Note: The objects and options that are available to you are determined by your system roles and the permissions assigned at the folders and objects level.
NOTES
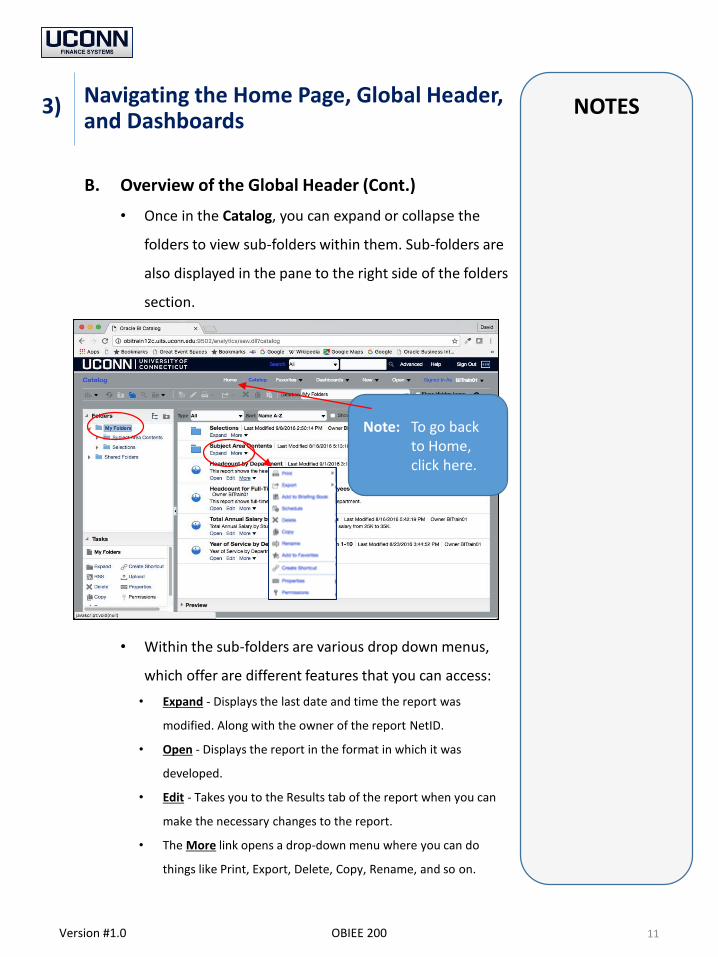
B. Overview of the Global Header (Cont.)
• Once in the Catalog, you can expand or collapse the
folders to view sub-folders within them. Sub-folders are
also displayed in the pane to the right side of the folders
section.
• Within the sub-folders are various drop down menus,
which offer are different features that you can access:
• Expand - Displays the last date and time the report was
modified. Along with the owner of the report NetID.
• Open - Displays the report in the format in which it was
developed.
• Edit - Takes you to the Results tab of the report when you can
make the necessary changes to the report.
• The More link opens a drop-down menu where you can do
things like Print, Export, Delete, Copy, Rename, and so on.
Navigating the Home Page, Global Header, and Dashboards
11Version #1.0 OBIEE 200
3)
Note: To go back to Home, click here.
NOTES
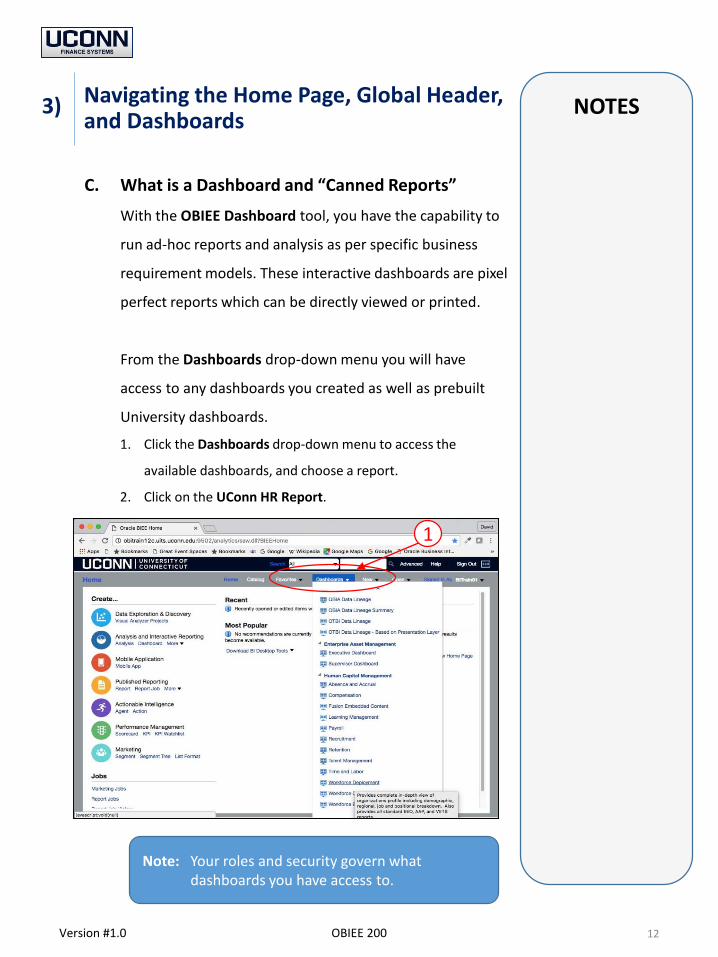
C. What is a Dashboard and “Canned Reports”
With the OBIEE Dashboard tool, you have the capability to
run ad-hoc reports and analysis as per specific business
requirement models. These interactive dashboards are pixel
perfect reports which can be directly viewed or printed.
From the Dashboards drop-down menu you will have
access to any dashboards you created as well as prebuilt
University dashboards.
1. Click the Dashboards drop-down menu to access the
available dashboards, and choose a report.
2. Click on the UConn HR Report.
Navigating the Home Page, Global Header, and Dashboards
12Version #1.0 OBIEE 200
3)
Note: Your roles and security govern what dashboards you have access to.
1
NOTES
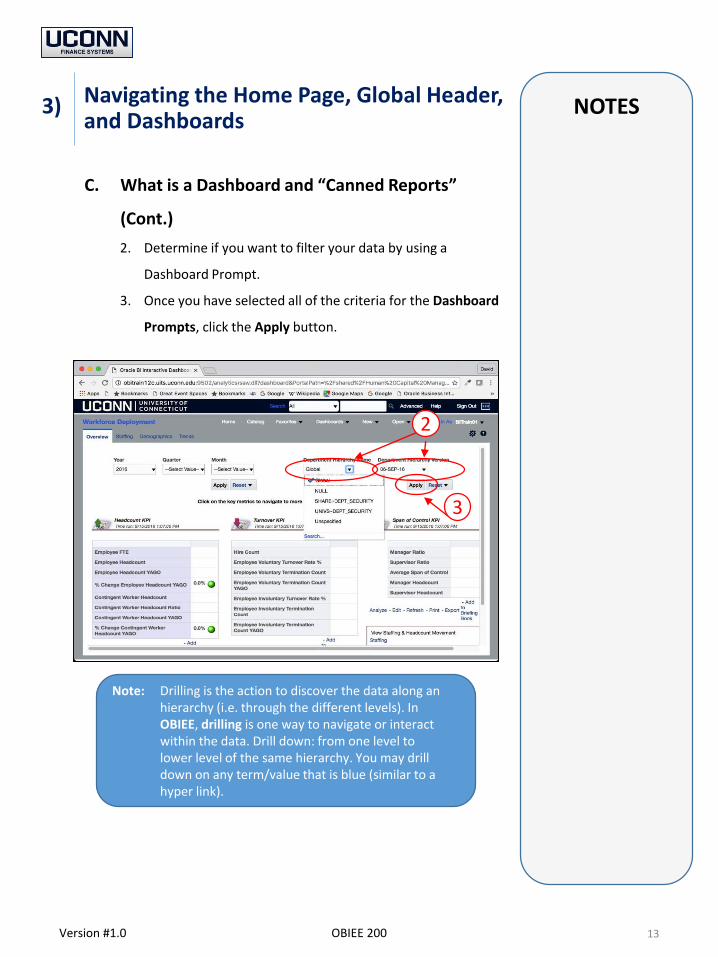
C. What is a Dashboard and “Canned Reports”
(Cont.)
2. Determine if you want to filter your data by using a
Dashboard Prompt.
3. Once you have selected all of the criteria for the Dashboard
Prompts, click the Apply button.
Navigating the Home Page, Global Header, and Dashboards
13Version #1.0 OBIEE 200
3)
2
3
Note: Drilling is the action to discover the data along an hierarchy (i.e. through the different levels). In OBIEE, drilling is one way to navigate or interact within the data. Drill down: from one level to lower level of the same hierarchy. You may drill down on any term/value that is blue (similar to a hyper link).
NOTES
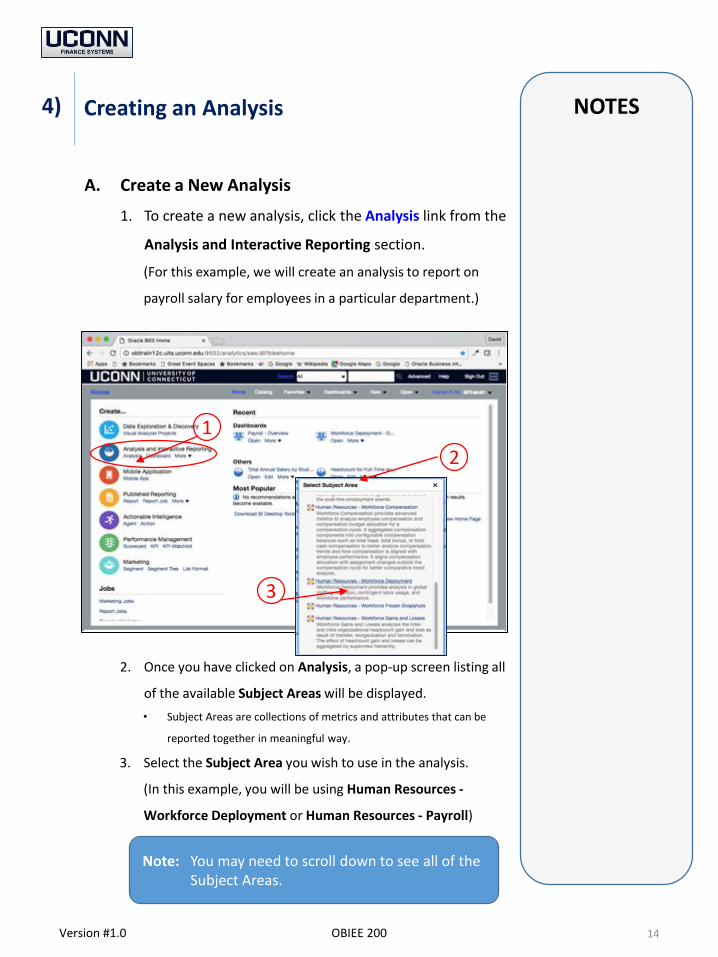
A. Create a New Analysis
1. To create a new analysis, click the Analysis link from the
Analysis and Interactive Reporting section.
(For this example, we will create an analysis to report on
payroll salary for employees in a particular department.)
2. Once you have clicked on Analysis, a pop-up screen listing all
of the available Subject Areas will be displayed.
• Subject Areas are collections of metrics and attributes that can be
reported together in meaningful way.
3. Select the Subject Area you wish to use in the analysis.
(In this example, you will be using Human Resources -
Workforce Deployment or Human Resources - Payroll)
Creating an Analysis
14Version #1.0 OBIEE 200
4)
Note: You may need to scroll down to see all of the Subject Areas.
1
2
3
NOTES
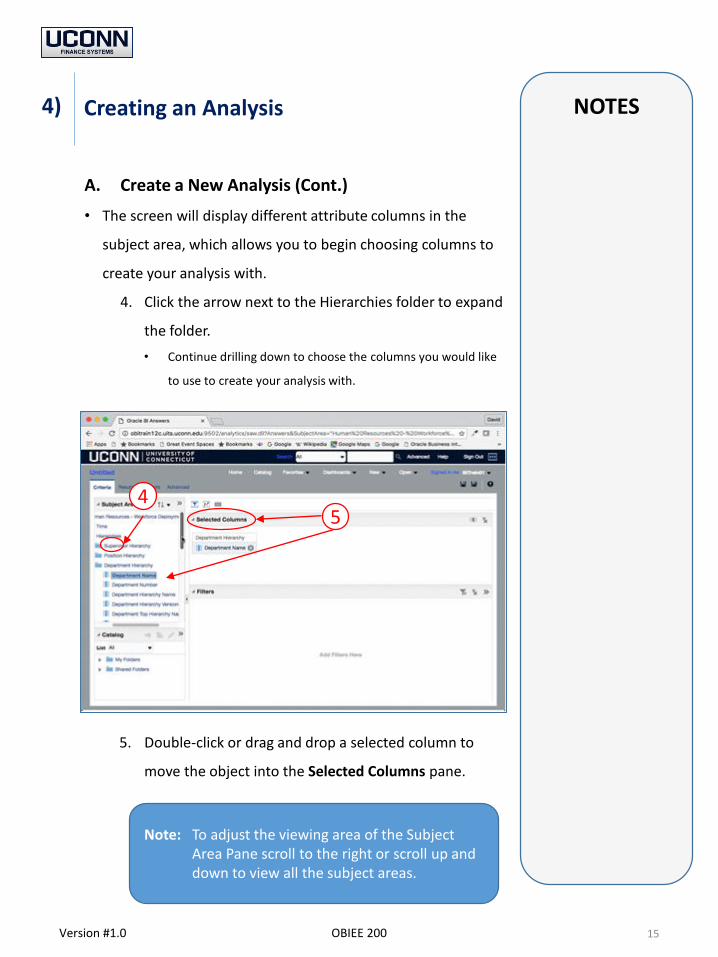
A. Create a New Analysis (Cont.)
• The screen will display different attribute columns in the
subject area, which allows you to begin choosing columns to
create your analysis with.
4. Click the arrow next to the Hierarchies folder to expand
the folder.
• Continue drilling down to choose the columns you would like
to use to create your analysis with.
5. Double-click or drag and drop a selected column to
move the object into the Selected Columns pane.
Creating an Analysis
15Version #1.0 OBIEE 200
4)
4
Note: To adjust the viewing area of the Subject Area Pane scroll to the right or scroll up and down to view all the subject areas.
5
NOTES
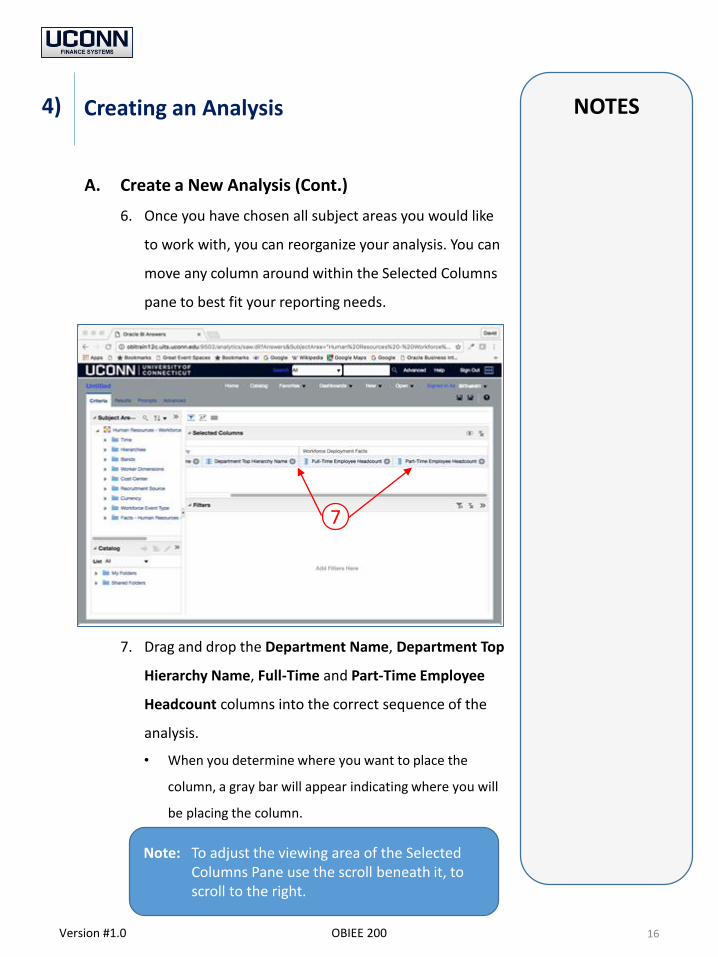
A. Create a New Analysis (Cont.)
6. Once you have chosen all subject areas you would like
to work with, you can reorganize your analysis. You can
move any column around within the Selected Columns
pane to best fit your reporting needs.
7. Drag and drop the Department Name, Department Top
Hierarchy Name, Full-Time and Part-Time Employee
Headcount columns into the correct sequence of the
analysis.
• When you determine where you want to place the
column, a gray bar will appear indicating where you will
be placing the column.
Creating an Analysis
16Version #1.0 OBIEE 200
4)
Note: To adjust the viewing area of the Selected Columns Pane use the scroll beneath it, to scroll to the right.
7
NOTES
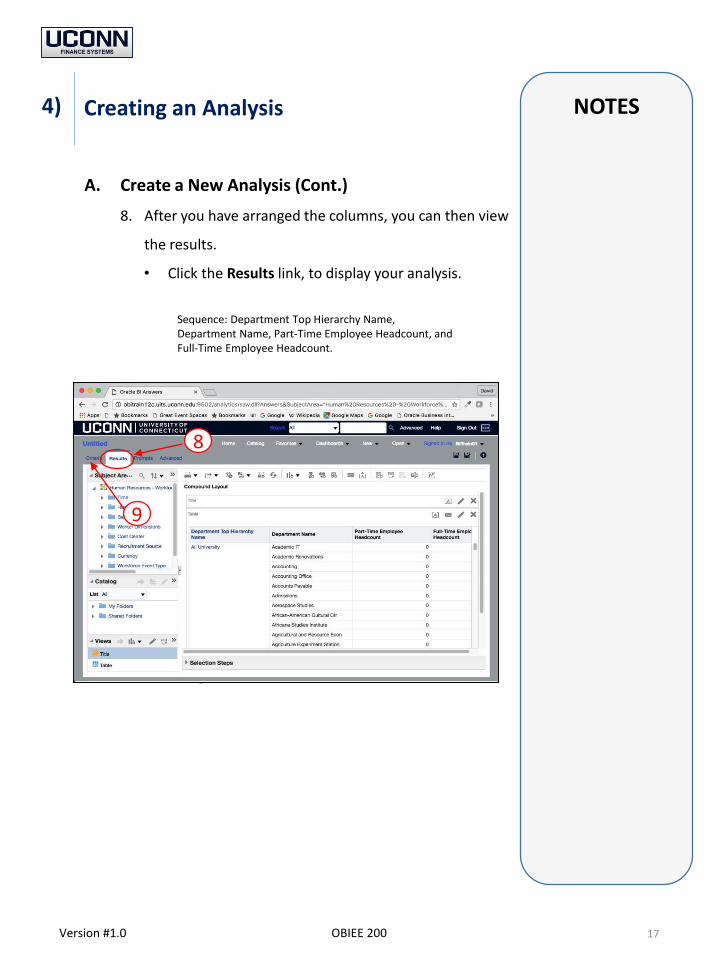
A. Create a New Analysis (Cont.)
8. After you have arranged the columns, you can then view
the results.
• Click the Results link, to display your analysis.
9. At anytime you can add, delete, or edit columns by
returning to the Criteria tab.
Creating an Analysis
17Version #1.0 OBIEE 200
4)
8
9
Sequence: Department Top Hierarchy Name, Department Name, Part-Time Employee Headcount, and Full-Time Employee Headcount.
NOTES
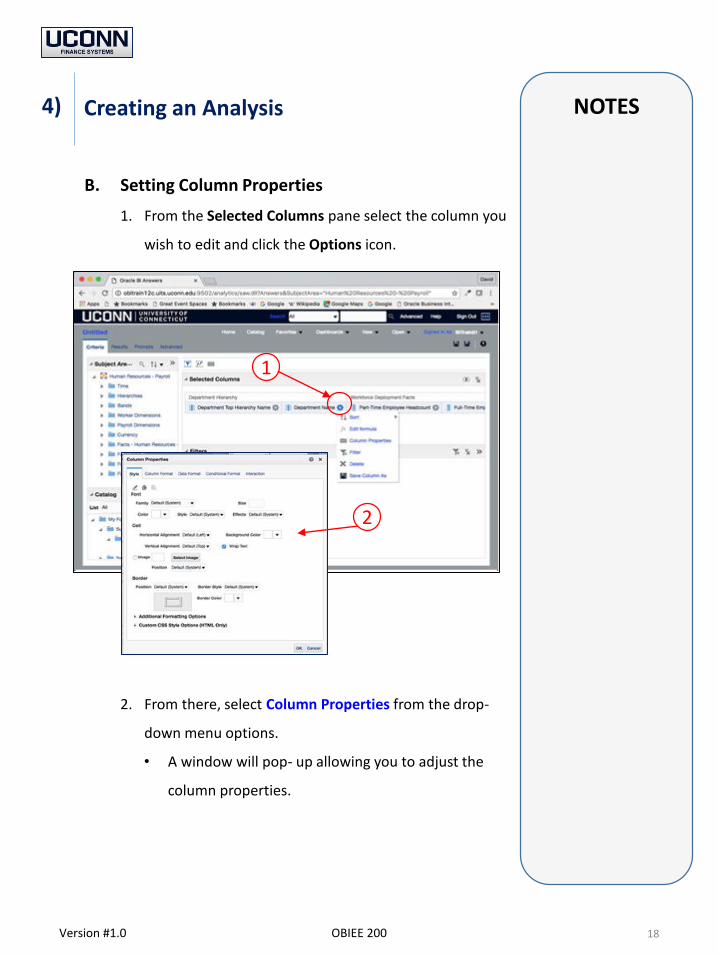
B. Setting Column Properties
1. From the Selected Columns pane select the column you
wish to edit and click the Options icon.
2. From there, select Column Properties from the drop-
down menu options.
• A window will pop- up allowing you to adjust the
column properties.
Creating an Analysis
18Version #1.0 OBIEE 200
4)
1
2
NOTES
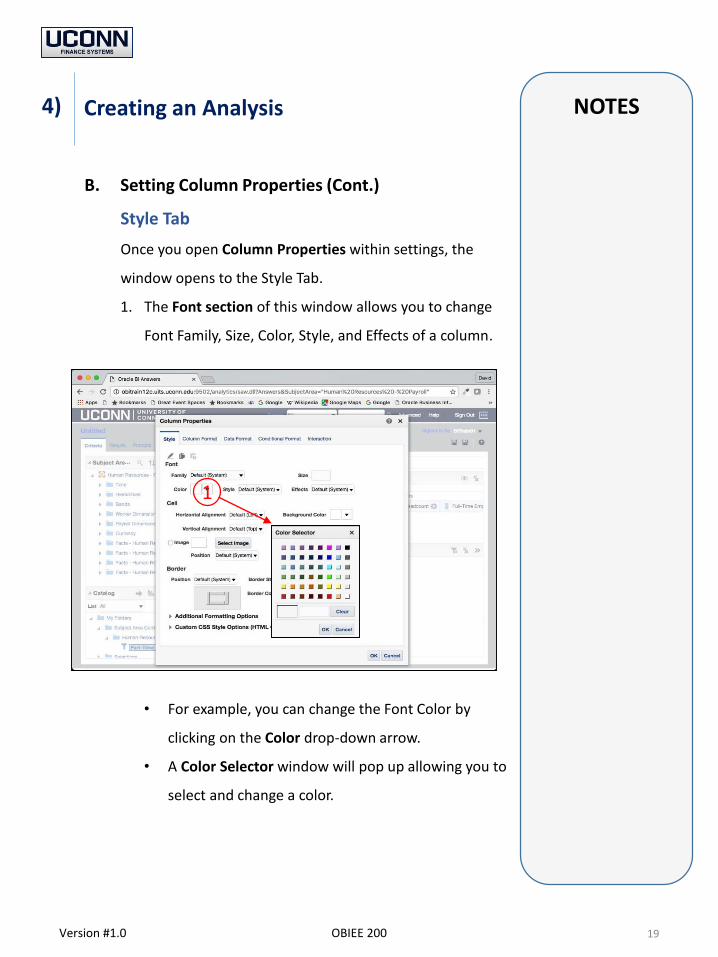
B. Setting Column Properties (Cont.)
Style Tab
Once you open Column Properties within settings, the
window opens to the Style Tab.
1. The Font section of this window allows you to change
Font Family, Size, Color, Style, and Effects of a column.
• For example, you can change the Font Color by
clicking on the Color drop-down arrow.
• A Color Selector window will pop up allowing you to
select and change a color.
Creating an Analysis
19Version #1.0 OBIEE 200
4)
1
NOTES
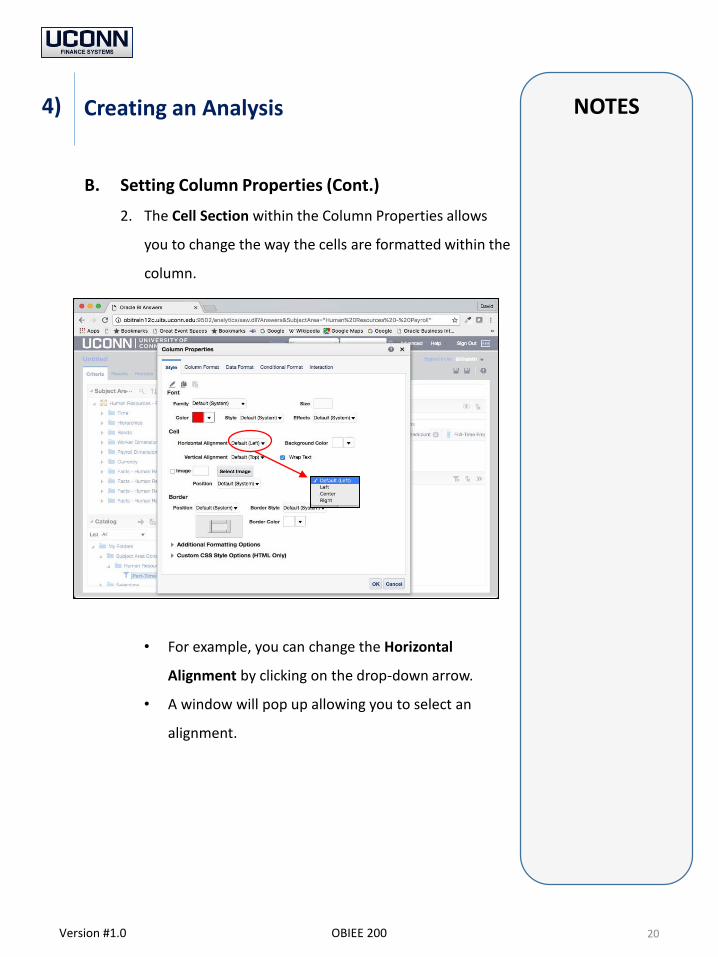
B. Setting Column Properties (Cont.)
2. The Cell Section within the Column Properties allows
you to change the way the cells are formatted within the
column.
• For example, you can change the Horizontal
Alignment by clicking on the drop-down arrow.
• A window will pop up allowing you to select an
alignment.
Creating an Analysis
20Version #1.0 OBIEE 200
4)
NOTES
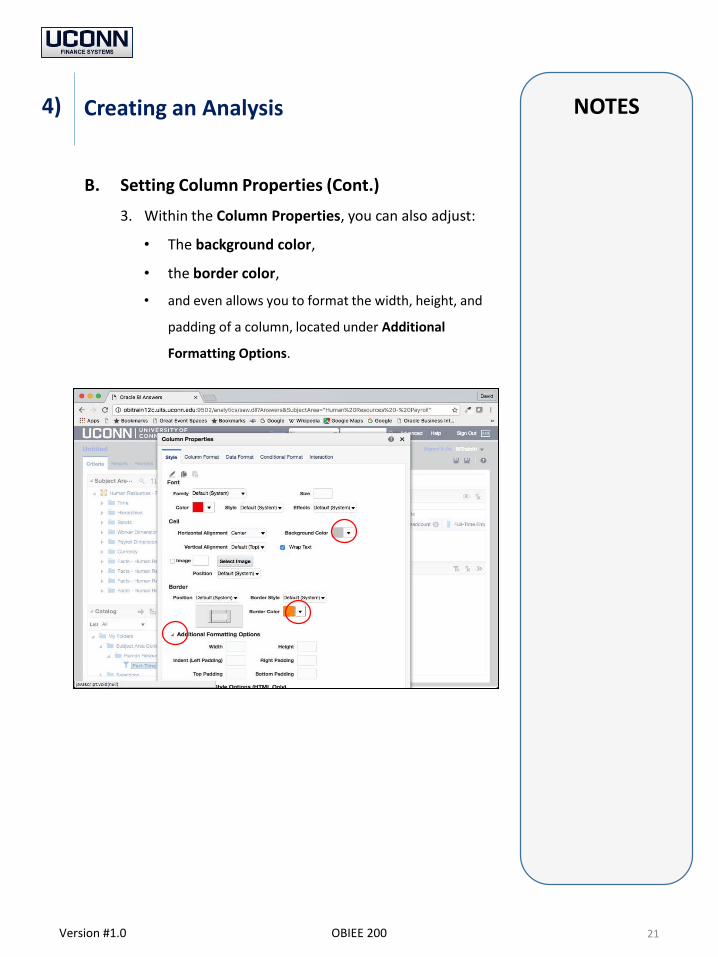
B. Setting Column Properties (Cont.)
3. Within the Column Properties, you can also adjust:
• The background color,
• the border color,
• and even allows you to format the width, height, and
padding of a column, located under Additional
Formatting Options.
Creating an Analysis
21Version #1.0 OBIEE 200
4)
NOTES
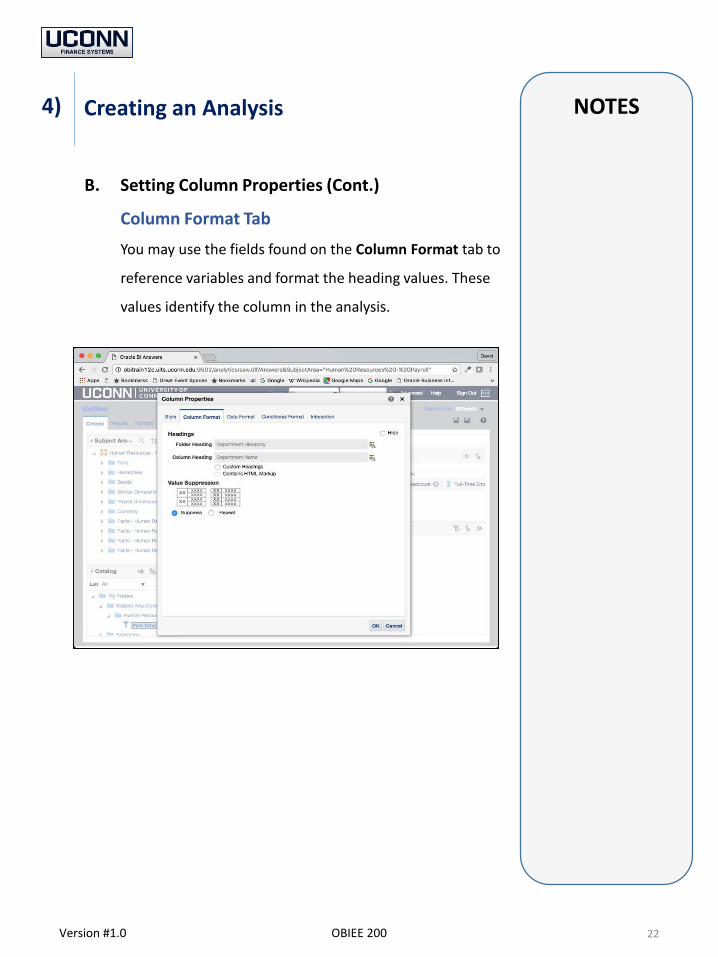
B. Setting Column Properties (Cont.)
Column Format Tab
You may use the fields found on the Column Format tab to
reference variables and format the heading values. These
values identify the column in the analysis.
Creating an Analysis
22Version #1.0 OBIEE 200
4)
NOTES
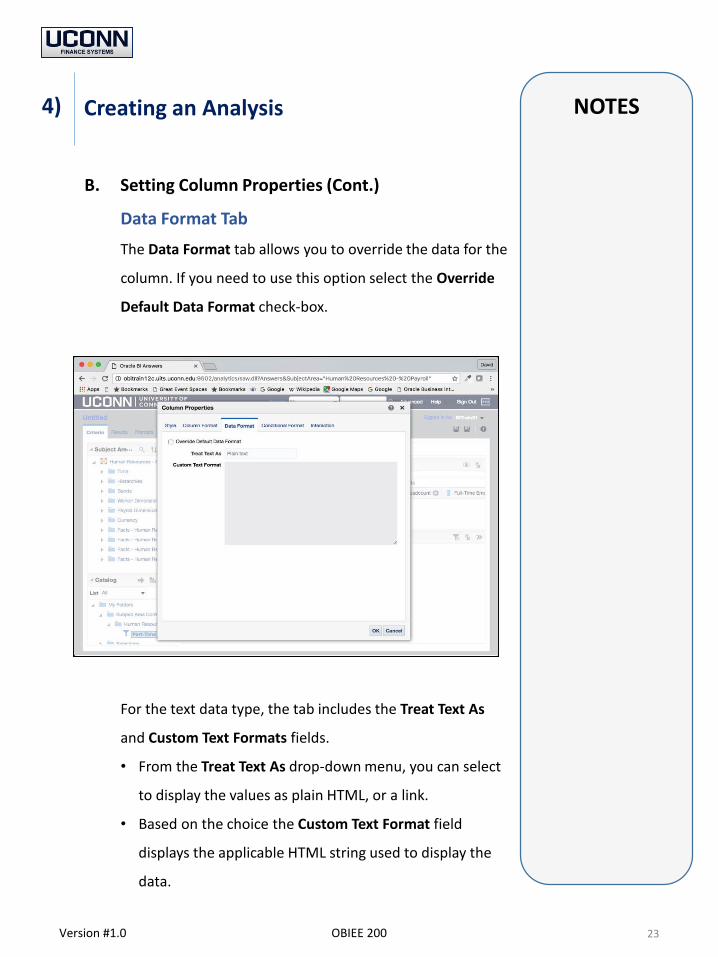
B. Setting Column Properties (Cont.)
Data Format Tab
The Data Format tab allows you to override the data for the
column. If you need to use this option select the Override
Default Data Format check-box.
For the text data type, the tab includes the Treat Text As
and Custom Text Formats fields.
• From the Treat Text As drop-down menu, you can select
to display the values as plain HTML, or a link.
• Based on the choice the Custom Text Format field
displays the applicable HTML string used to display the
data.
Creating an Analysis
23Version #1.0 OBIEE 200
4)
NOTES
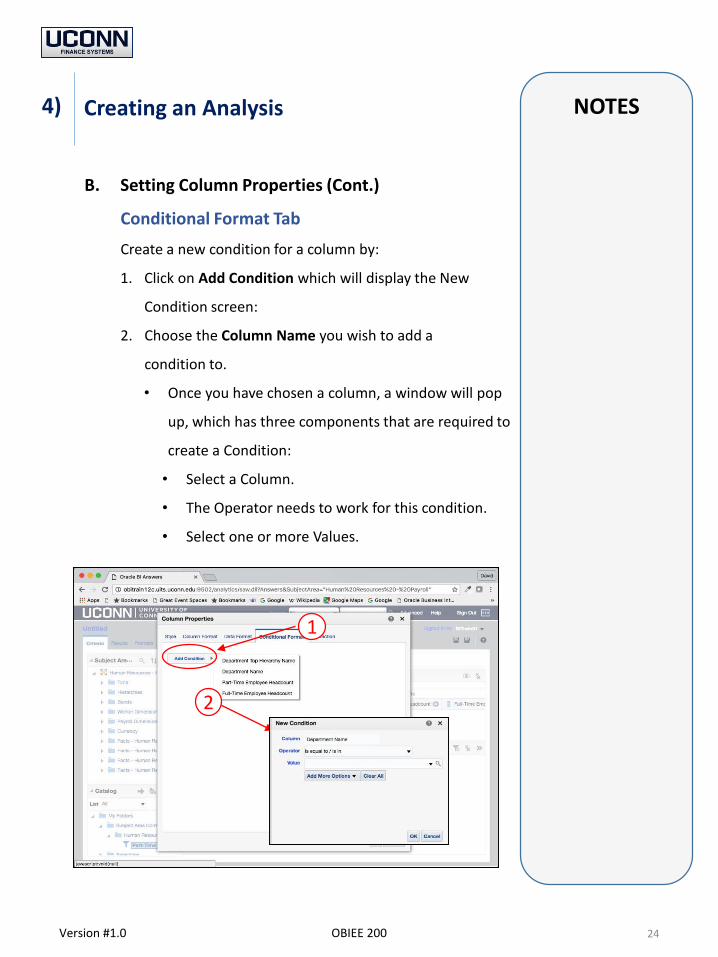
B. Setting Column Properties (Cont.)
Conditional Format Tab
Create a new condition for a column by:
1. Click on Add Condition which will display the New
Condition screen:
2. Choose the Column Name you wish to add a
condition to.
• Once you have chosen a column, a window will pop
up, which has three components that are required to
create a Condition:
• Select a Column.
• The Operator needs to work for this condition.
• Select one or more Values.
Creating an Analysis
24Version #1.0 OBIEE 200
4)
1
2
NOTES
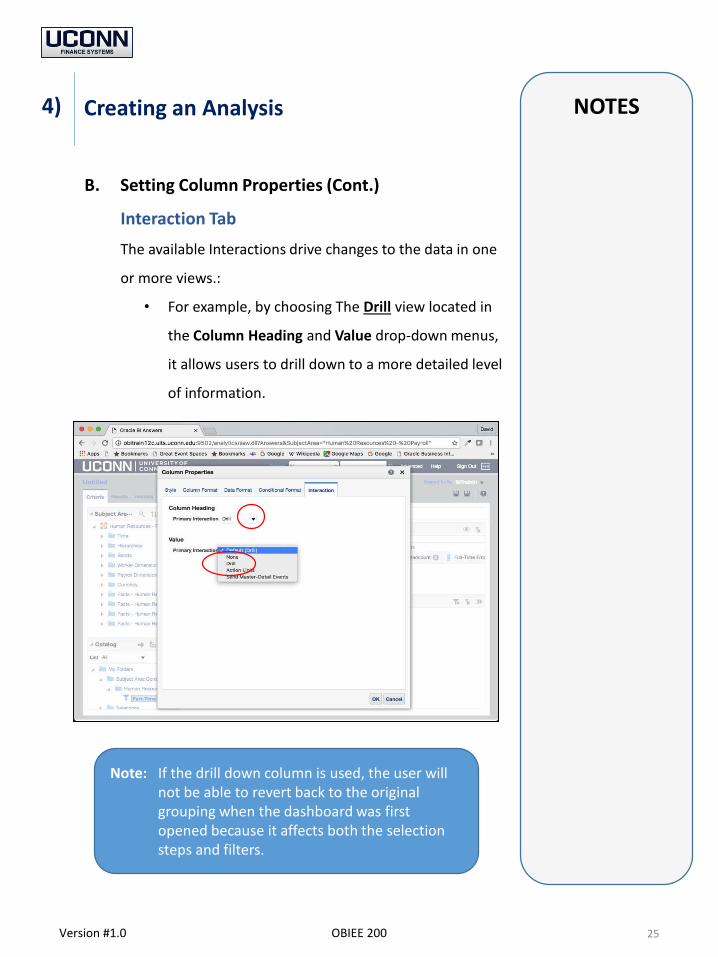
B. Setting Column Properties (Cont.)
Interaction Tab
The available Interactions drive changes to the data in one
or more views.:
• For example, by choosing The Drill view located in
the Column Heading and Value drop-down menus,
it allows users to drill down to a more detailed level
of information.
Creating an Analysis
25Version #1.0 OBIEE 200
4)
Note: If the drill down column is used, the user will not be able to revert back to the original grouping when the dashboard was first opened because it affects both the selection steps and filters.
NOTES
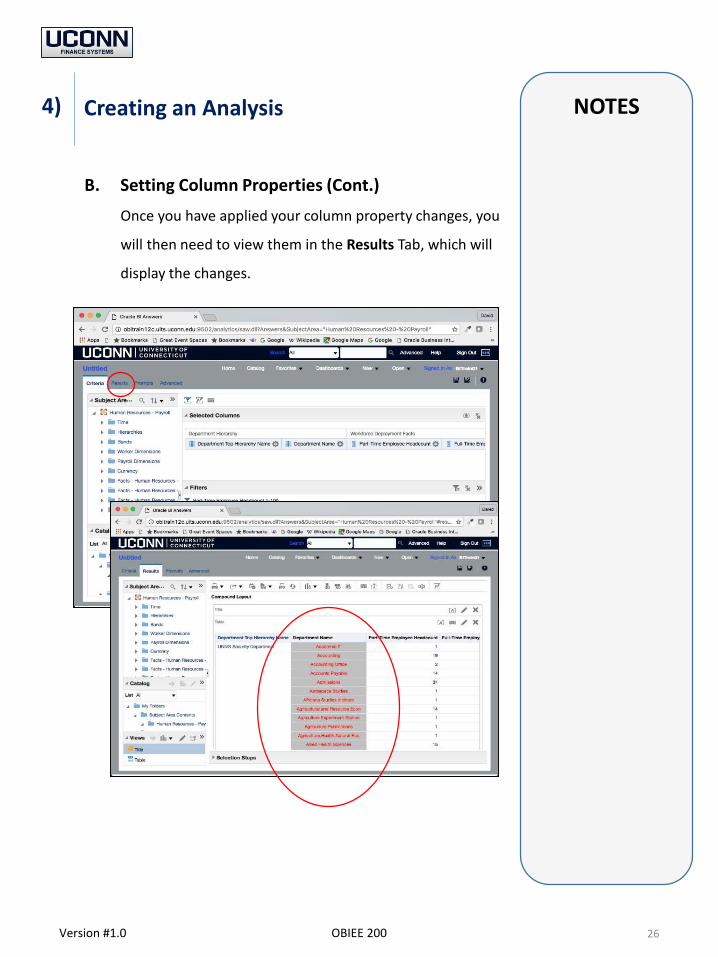
B. Setting Column Properties (Cont.)
Once you have applied your column property changes, you
will then need to view them in the Results Tab, which will
display the changes.
Creating an Analysis
26Version #1.0 OBIEE 200
4)
NOTES
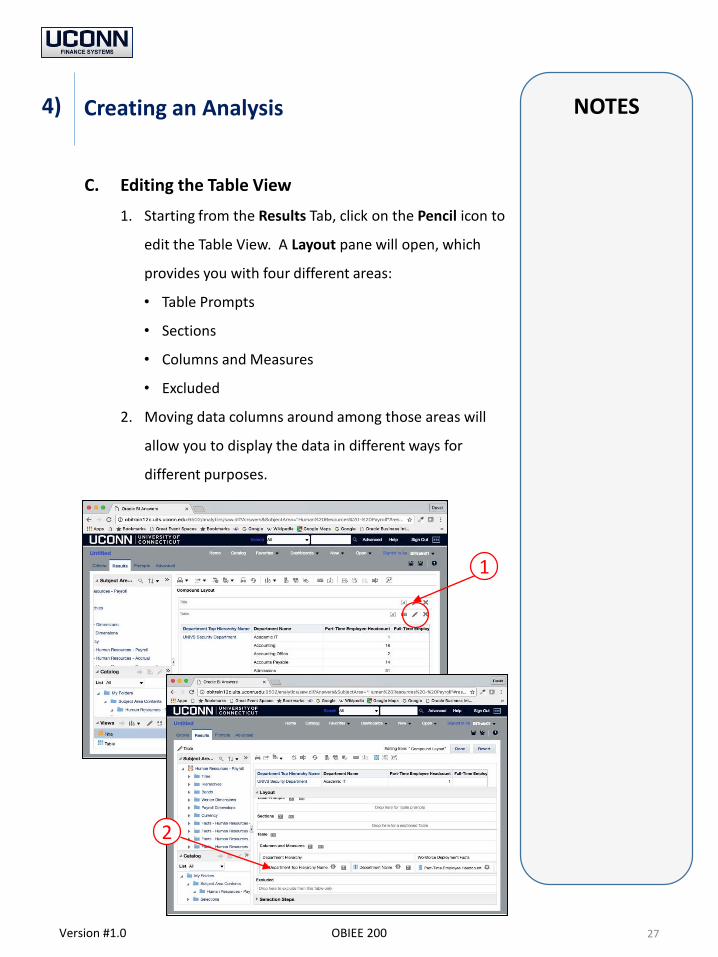
C. Editing the Table View
1. Starting from the Results Tab, click on the Pencil icon to
edit the Table View. A Layout pane will open, which
provides you with four different areas:
• Table Prompts
• Sections
• Columns and Measures
• Excluded
2. Moving data columns around among those areas will
allow you to display the data in different ways for
different purposes.
Creating an Analysis
27Version #1.0 OBIEE 200
4)
1
2
NOTES
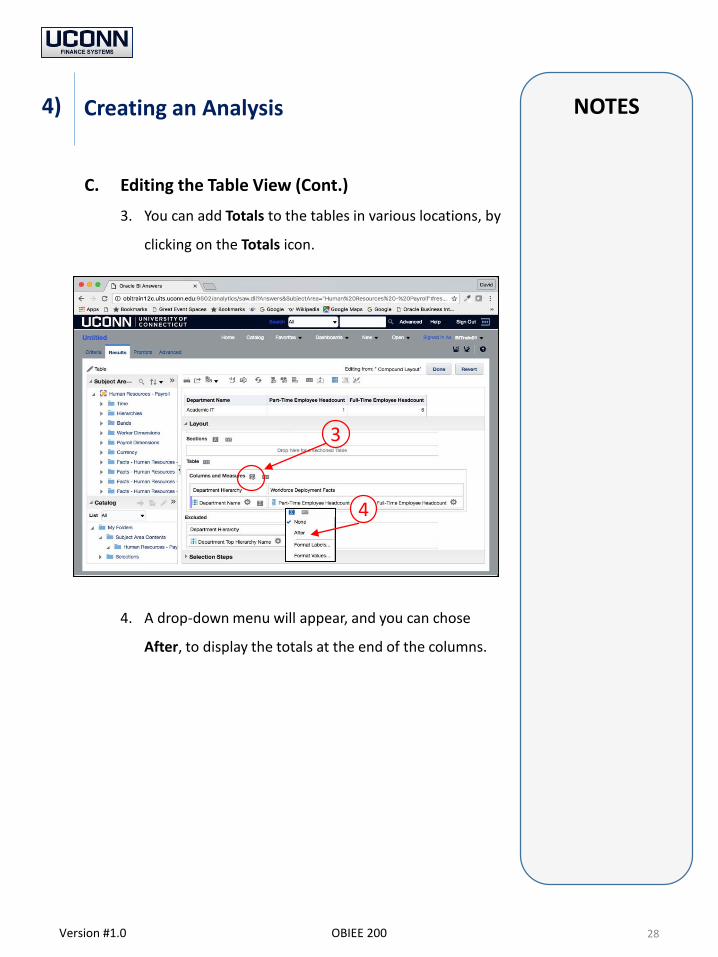
C. Editing the Table View (Cont.)
3. You can add Totals to the tables in various locations, by
clicking on the Totals icon.
4. A drop-down menu will appear, and you can chose
After, to display the totals at the end of the columns.
Creating an Analysis
28Version #1.0 OBIEE 200
4)
3
4
NOTES
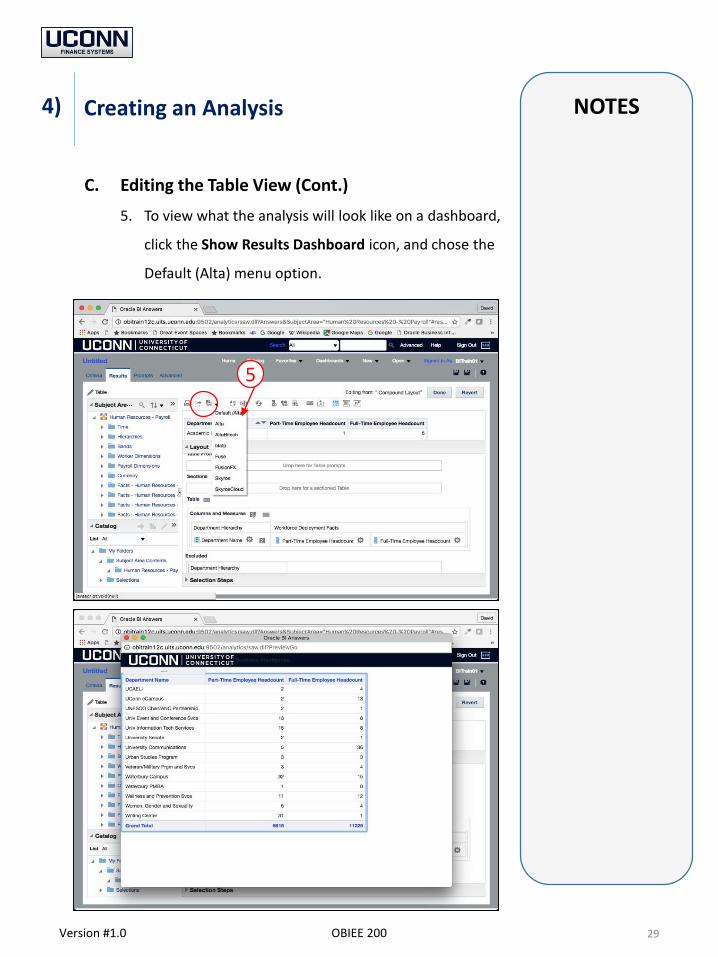
C. Editing the Table View (Cont.)
5. To view what the analysis will look like on a dashboard,
click the Show Results Dashboard icon, and chose the
Default (Alta) menu option.
Creating an Analysis
29Version #1.0 OBIEE 200
4)
5
NOTES
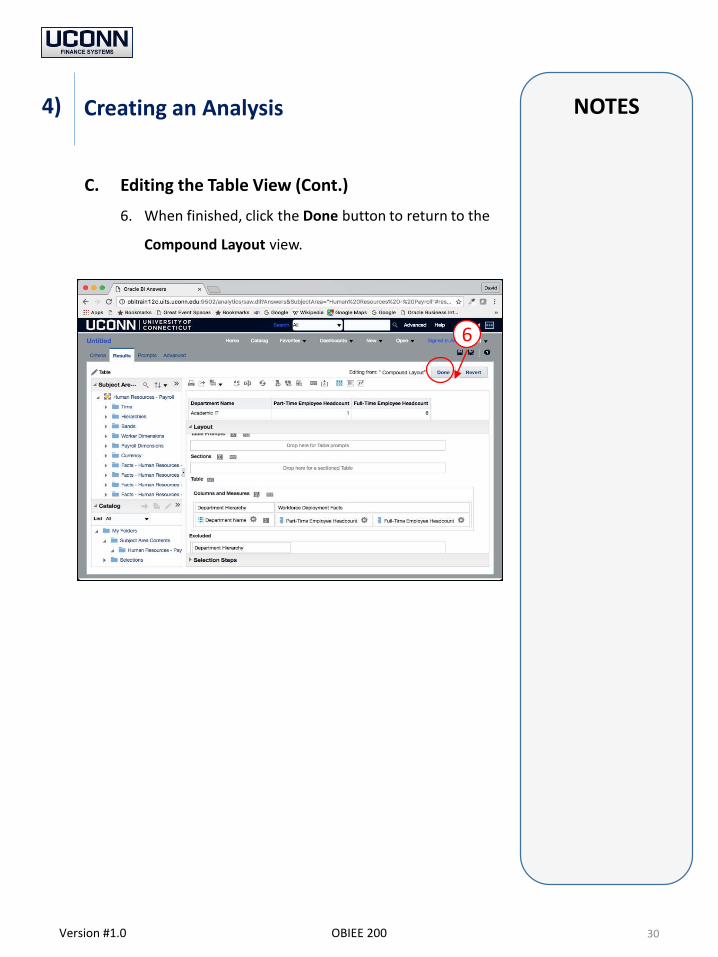
C. Editing the Table View (Cont.)
6. When finished, click the Done button to return to the
Compound Layout view.
Creating an Analysis
30Version #1.0 OBIEE 200
4)
6
NOTES
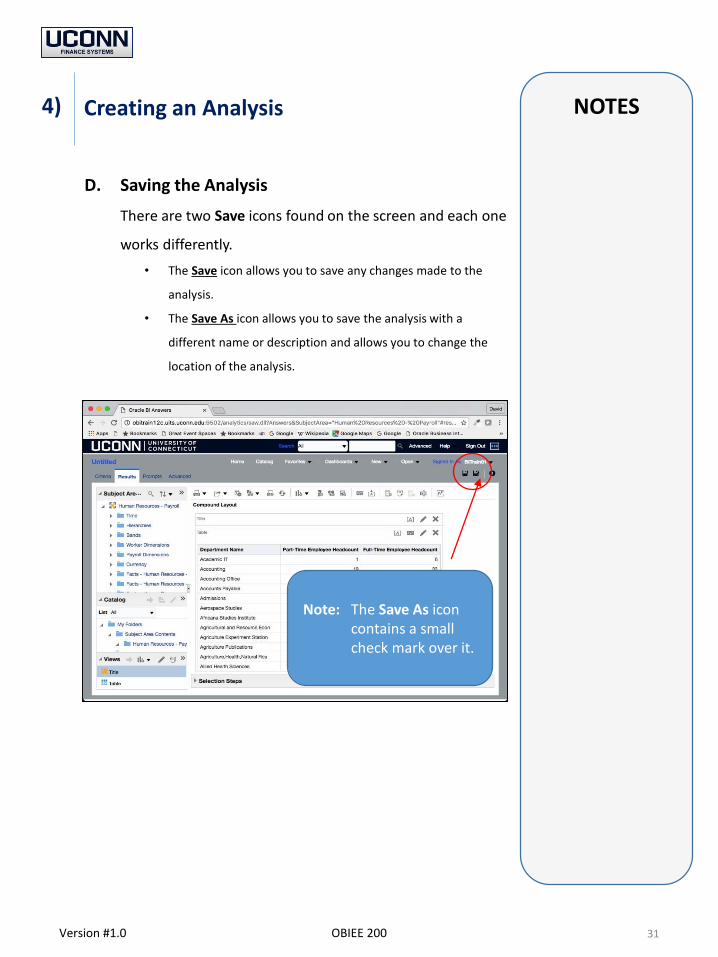
D. Saving the Analysis
There are two Save icons found on the screen and each one
works differently.
• The Save icon allows you to save any changes made to the
analysis.
• The Save As icon allows you to save the analysis with a
different name or description and allows you to change the
location of the analysis.
Creating an Analysis
31Version #1.0 OBIEE 200
4)
Note: The Save As icon contains a small check mark over it.
NOTES
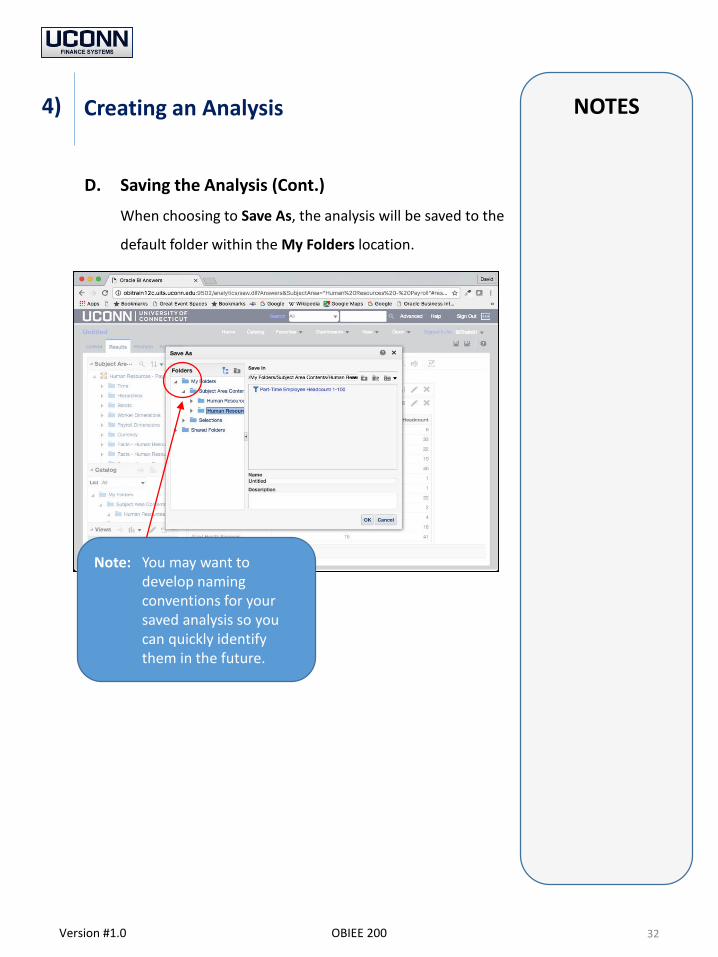
D. Saving the Analysis (Cont.)
When choosing to Save As, the analysis will be saved to the
default folder within the My Folders location.
Creating an Analysis
32Version #1.0 OBIEE 200
4)
Note: You may want to develop naming conventions for your saved analysis so you can quickly identify them in the future.
NOTES
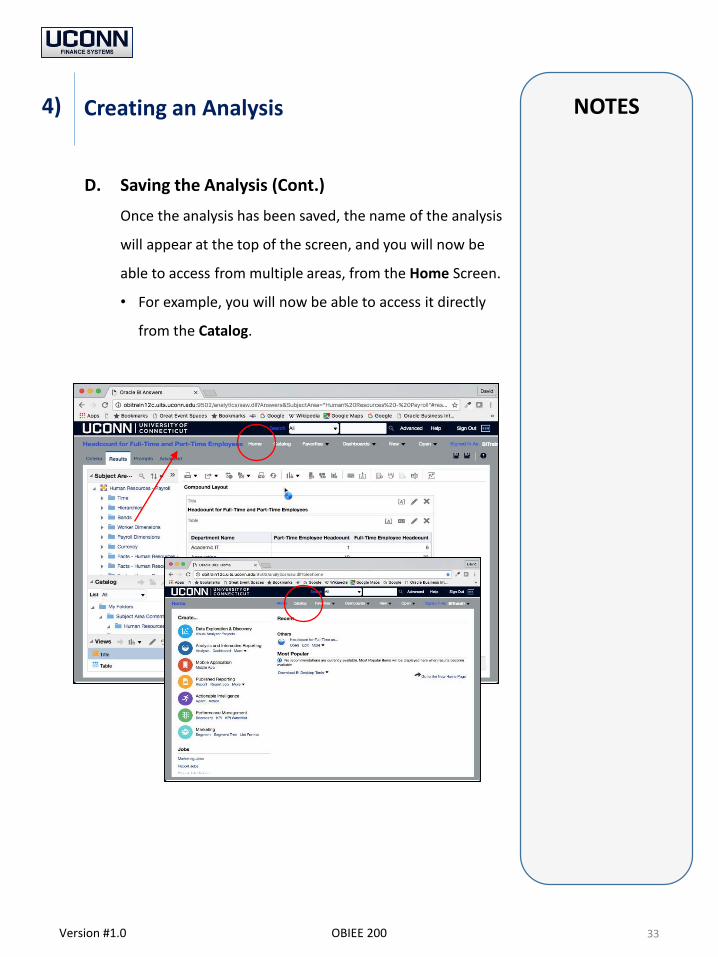
D. Saving the Analysis (Cont.)
Once the analysis has been saved, the name of the analysis
will appear at the top of the screen, and you will now be
able to access from multiple areas, from the Home Screen.
• For example, you will now be able to access it directly
from the Catalog.
Creating an Analysis
33Version #1.0 OBIEE 200
4)

NOTES
D. Saving the Analysis (Cont.)
From the Catalog, you can click on the More drop-down
menu, which provide you with different functionality. The
most commonly used functions are Print, Copy, Delete, Add
to Favorites, and Properties.
• By choosing to add it to Favorites, you can then access
your analysis directly from Favorites on the Home Screen.
Creating an Analysis
34Version #1.0 OBIEE 200
4)
NOTES
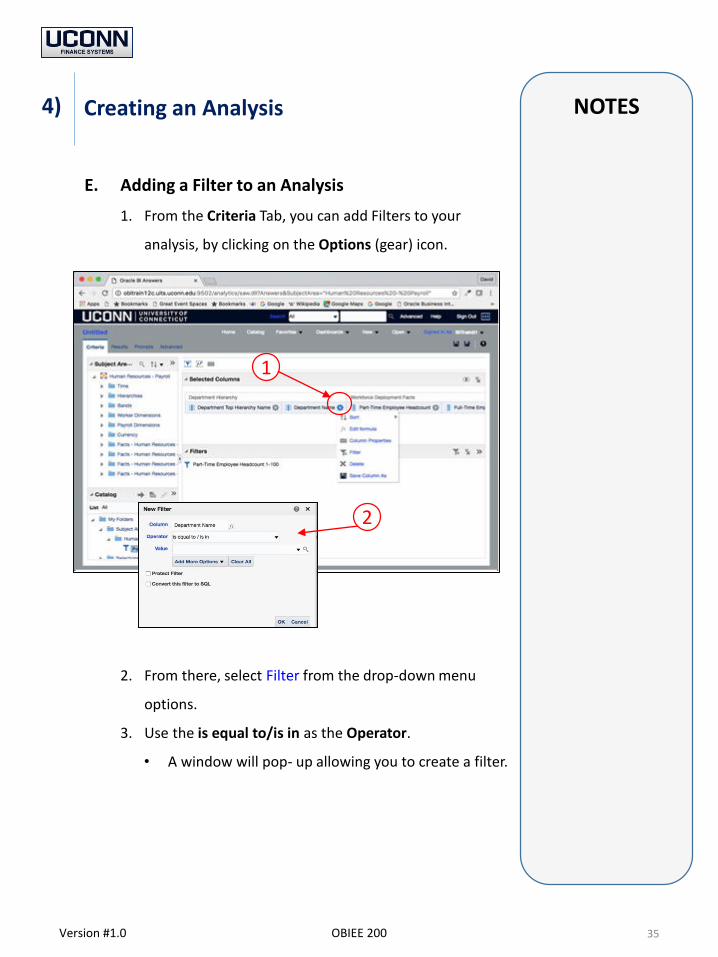
E. Adding a Filter to an Analysis
1. From the Criteria Tab, you can add Filters to your
analysis, by clicking on the Options (gear) icon.
2. From there, select Filter from the drop-down menu
options.
3. Use the is equal to/is in as the Operator.
• A window will pop- up allowing you to create a filter.
Creating an Analysis
35Version #1.0 OBIEE 200
4)
1
2

NOTES
E. Adding a Filter to an Analysis (Cont.)
4. There are three components that are required to create
a filter:
• You need to select a Column,
• The Operator needs to work for the filter, and
• You need to select one or more Values.
5. You may select a value from the displayed menu options
using the drop-down arrow, or you may search for a
specific value, by clicking on the magnifying glass.
Creating an Analysis
36Version #1.0 OBIEE 200
4)
4
5
Note: Searching for a value is the fastest method for locating the specific value(s).
NOTES
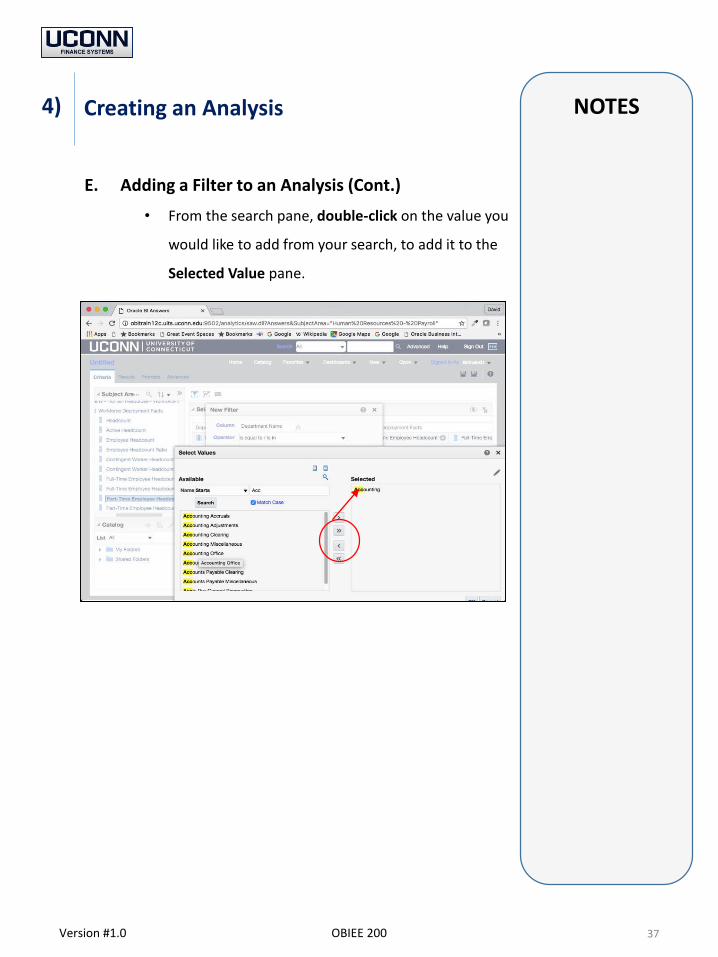
E. Adding a Filter to an Analysis (Cont.)
• From the search pane, double-click on the value you
would like to add from your search, to add it to the
Selected Value pane.
Creating an Analysis
37Version #1.0 OBIEE 200
4)
NOTES
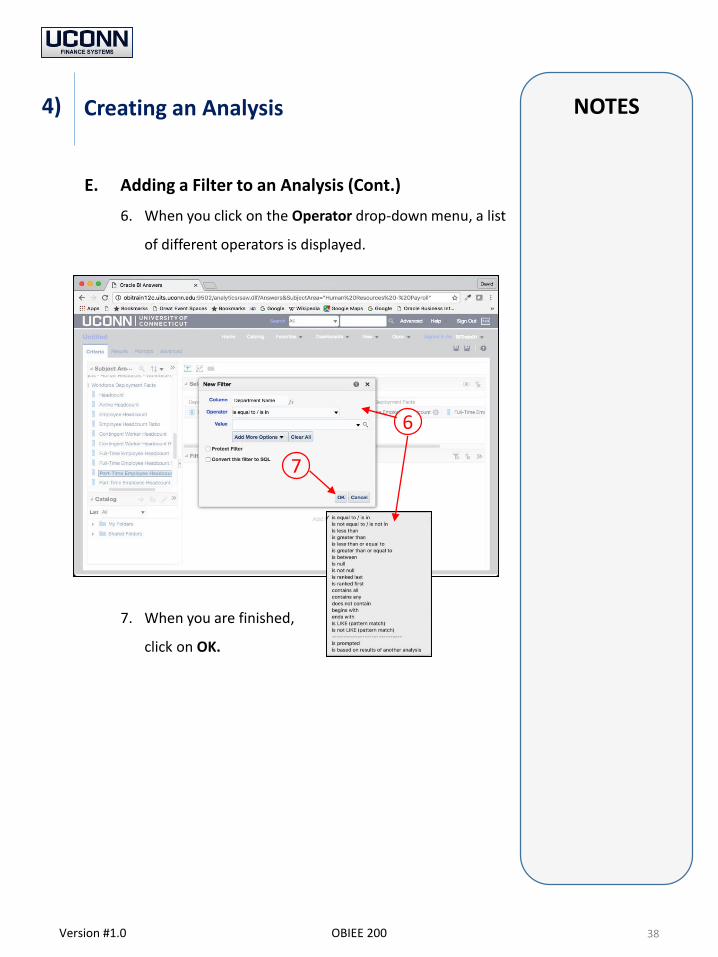
E. Adding a Filter to an Analysis (Cont.)
6. When you click on the Operator drop-down menu, a list
of different operators is displayed.
7. When you are finished,
click on OK.
Creating an Analysis
38Version #1.0 OBIEE 200
4)
6
7
NOTES
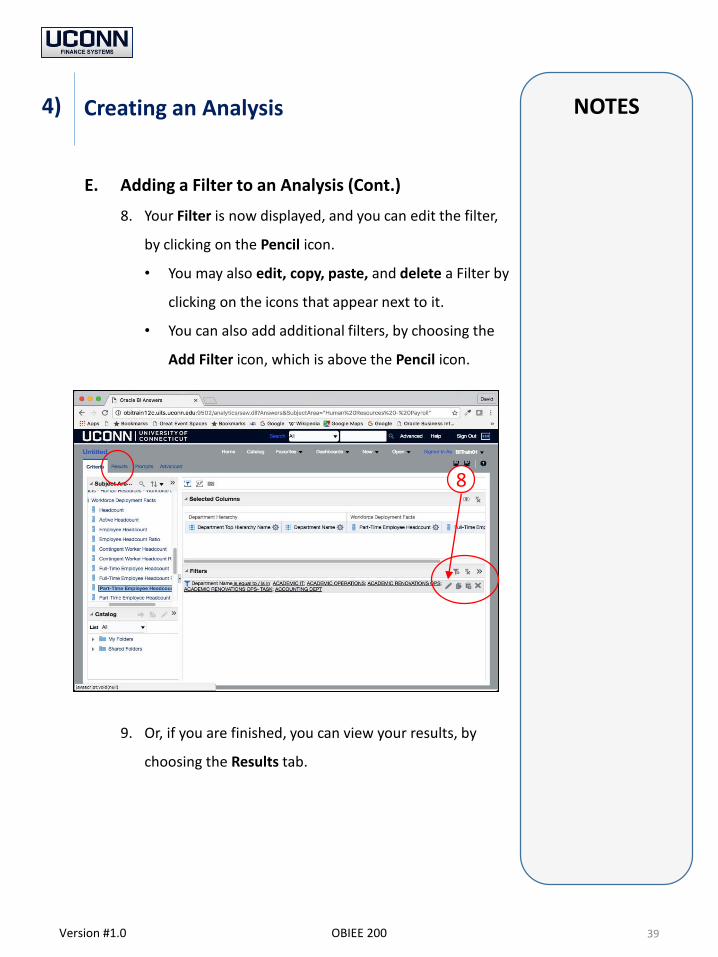
E. Adding a Filter to an Analysis (Cont.)
8. Your Filter is now displayed, and you can edit the filter,
by clicking on the Pencil icon.
• You may also edit, copy, paste, and delete a Filter by
clicking on the icons that appear next to it.
• You can also add additional filters, by choosing the
Add Filter icon, which is above the Pencil icon.
9. Or, if you are finished, you can view your results, by
choosing the Results tab.
Creating an Analysis
39Version #1.0 OBIEE 200
4)
8
NOTES
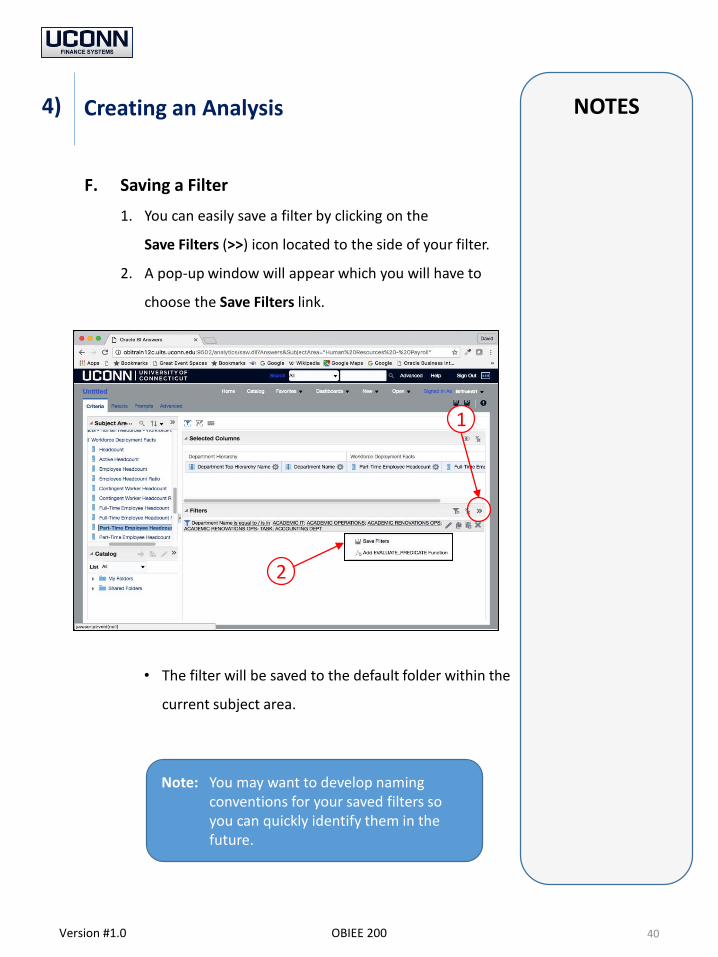
F. Saving a Filter
1. You can easily save a filter by clicking on the
Save Filters (>>) icon located to the side of your filter.
2. A pop-up window will appear which you will have to
choose the Save Filters link.
• The filter will be saved to the default folder within the
current subject area.
Creating an Analysis
40Version #1.0 OBIEE 200
4)
1
2
Note: You may want to develop naming conventions for your saved filters so you can quickly identify them in the future.
NOTES
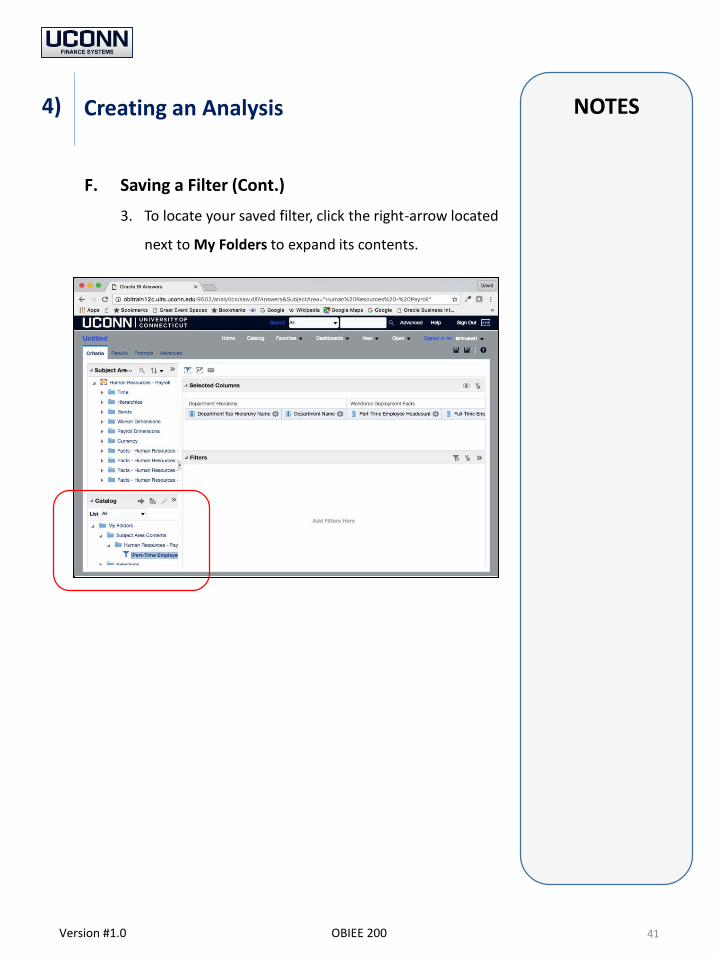
F. Saving a Filter (Cont.)
3. To locate your saved filter, click the right-arrow located
next to My Folders to expand its contents.
Creating an Analysis
41Version #1.0 OBIEE 200
4)
NOTESCreating an Analysis - Exercise One
42OBIEE 200
4)
Version #1.0
Step #
Process
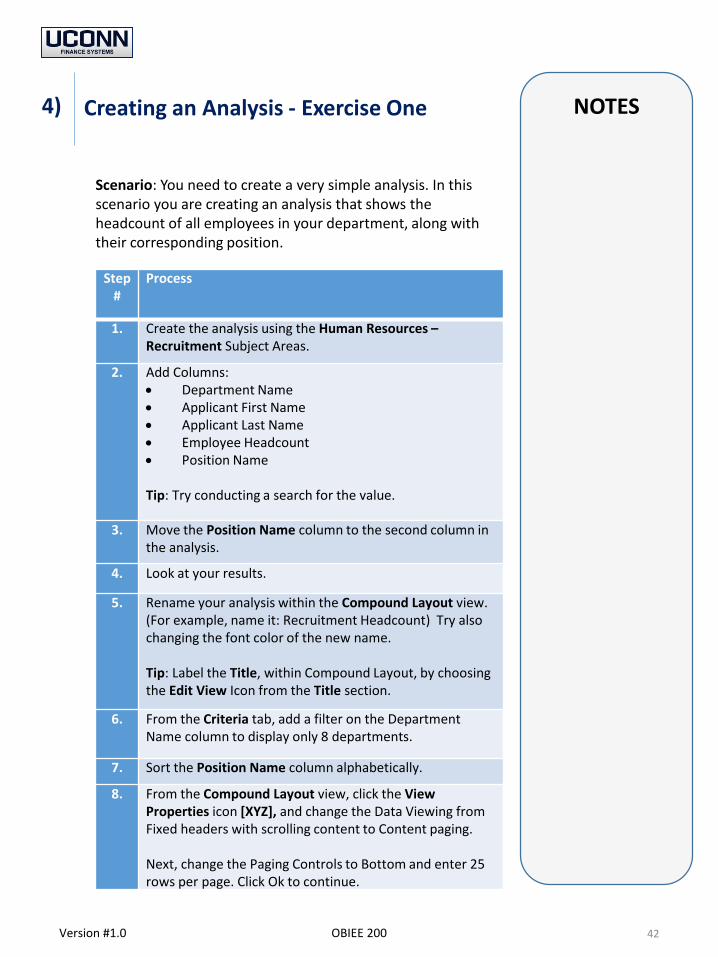
1. Create the analysis using the Human Resources –Recruitment Subject Areas.
2. Add Columns: Department Name Applicant First Name Applicant Last Name Employee Headcount Position Name
Tip: Try conducting a search for the value.
3. Move the Position Name column to the second column in the analysis.
4. Look at your results.
5. Rename your analysis within the Compound Layout view. (For example, name it: Recruitment Headcount) Try also changing the font color of the new name.
Tip: Label the Title, within Compound Layout, by choosing the Edit View Icon from the Title section.
6. From the Criteria tab, add a filter on the Department Name column to display only 8 departments.
7. Sort the Position Name column alphabetically.
8. From the Compound Layout view, click the View Properties icon [XYZ], and change the Data Viewing from Fixed headers with scrolling content to Content paging.
Next, change the Paging Controls to Bottom and enter 25 rows per page. Click Ok to continue.
Scenario: You need to create a very simple analysis. In this scenario you are creating an analysis that shows the headcount of all employees in your department, along with their corresponding position.
NOTESCreating an Analysis - Exercise One (continuation)
43OBIEE 200
4)
Version #1.0
Step #
Process
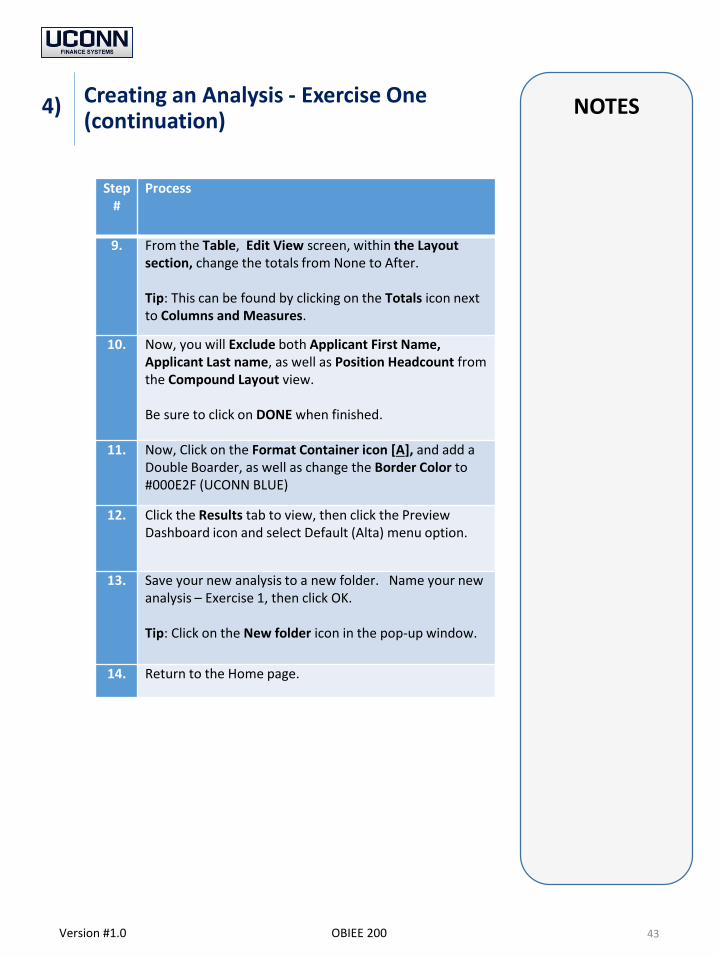
9. From the Table, Edit View screen, within the Layout section, change the totals from None to After.
Tip: This can be found by clicking on the Totals icon next to Columns and Measures.
10. Now, you will Exclude both Applicant First Name, Applicant Last name, as well as Position Headcount from the Compound Layout view.
Be sure to click on DONE when finished.
11. Now, Click on the Format Container icon [A], and add a Double Boarder, as well as change the Border Color to #000E2F (UCONN BLUE)
12. Click the Results tab to view, then click the Preview Dashboard icon and select Default (Alta) menu option.
13. Save your new analysis to a new folder. Name your new analysis – Exercise 1, then click OK.
Tip: Click on the New folder icon in the pop-up window.
14. Return to the Home page.
NOTES
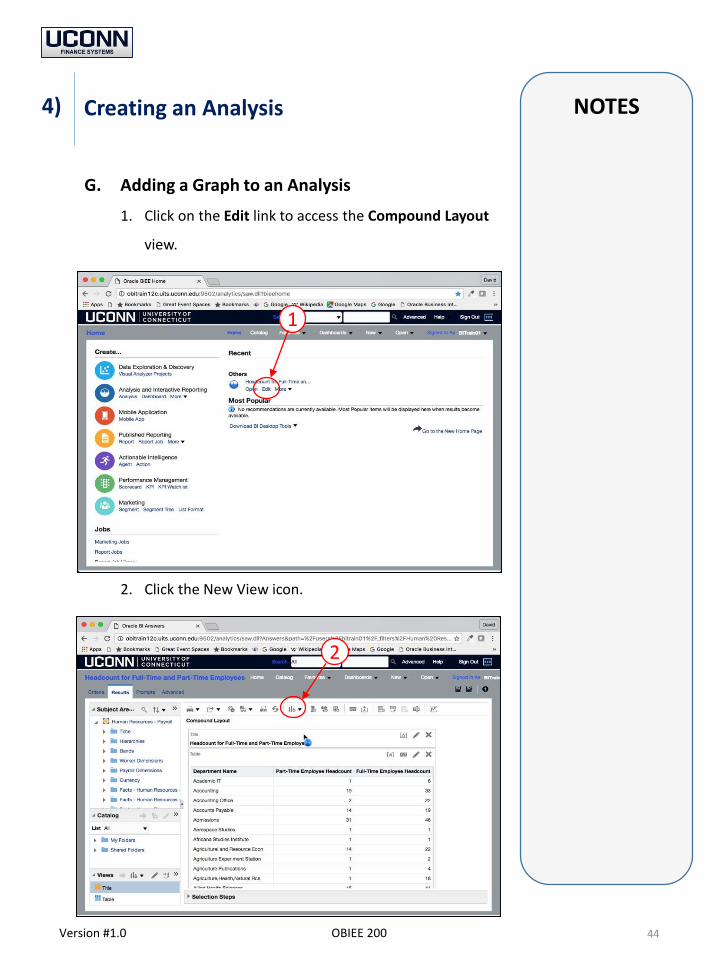
G. Adding a Graph to an Analysis
1. Click on the Edit link to access the Compound Layout
view.
2. Click the New View icon.
Creating an Analysis
44Version #1.0 OBIEE 200
4)
1
2
NOTES
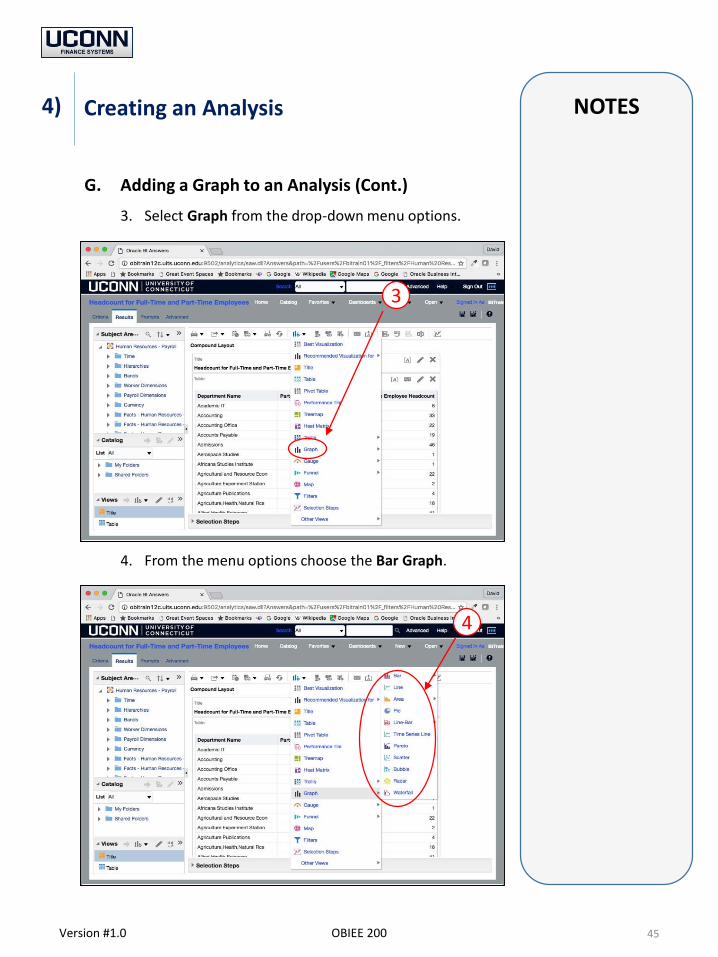
G. Adding a Graph to an Analysis (Cont.)
3. Select Graph from the drop-down menu options.
4. From the menu options choose the Bar Graph.
Creating an Analysis
45Version #1.0 OBIEE 200
4)
3
4
NOTES
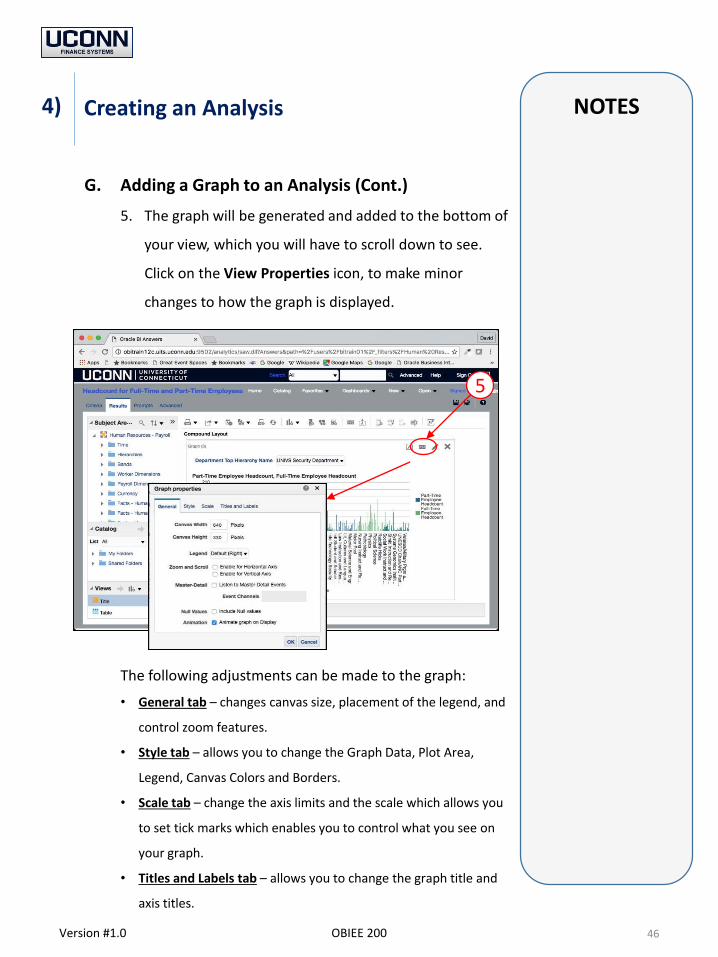
G. Adding a Graph to an Analysis (Cont.)
5. The graph will be generated and added to the bottom of
your view, which you will have to scroll down to see.
Click on the View Properties icon, to make minor
changes to how the graph is displayed.
The following adjustments can be made to the graph:
• General tab – changes canvas size, placement of the legend, and
control zoom features.
• Style tab – allows you to change the Graph Data, Plot Area,
Legend, Canvas Colors and Borders.
• Scale tab – change the axis limits and the scale which allows you
to set tick marks which enables you to control what you see on
your graph.
• Titles and Labels tab – allows you to change the graph title and
axis titles.
Creating an Analysis
46Version #1.0 OBIEE 200
4)
5
NOTES
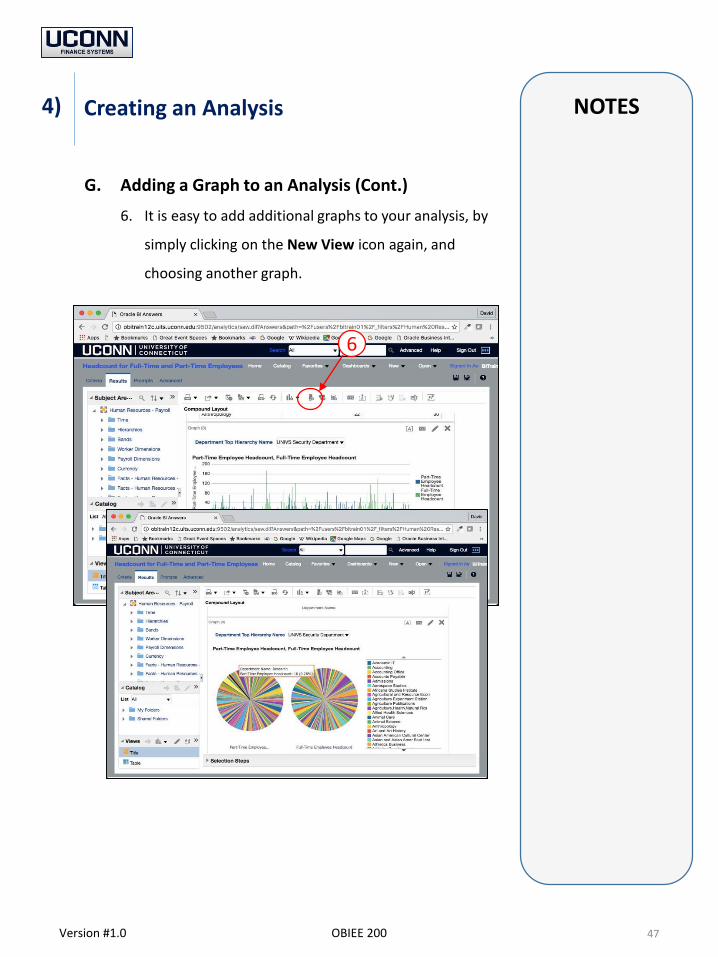
G. Adding a Graph to an Analysis (Cont.)
6. It is easy to add additional graphs to your analysis, by
simply clicking on the New View icon again, and
choosing another graph.
Creating an Analysis
47Version #1.0 OBIEE 200
4)
6
NOTES
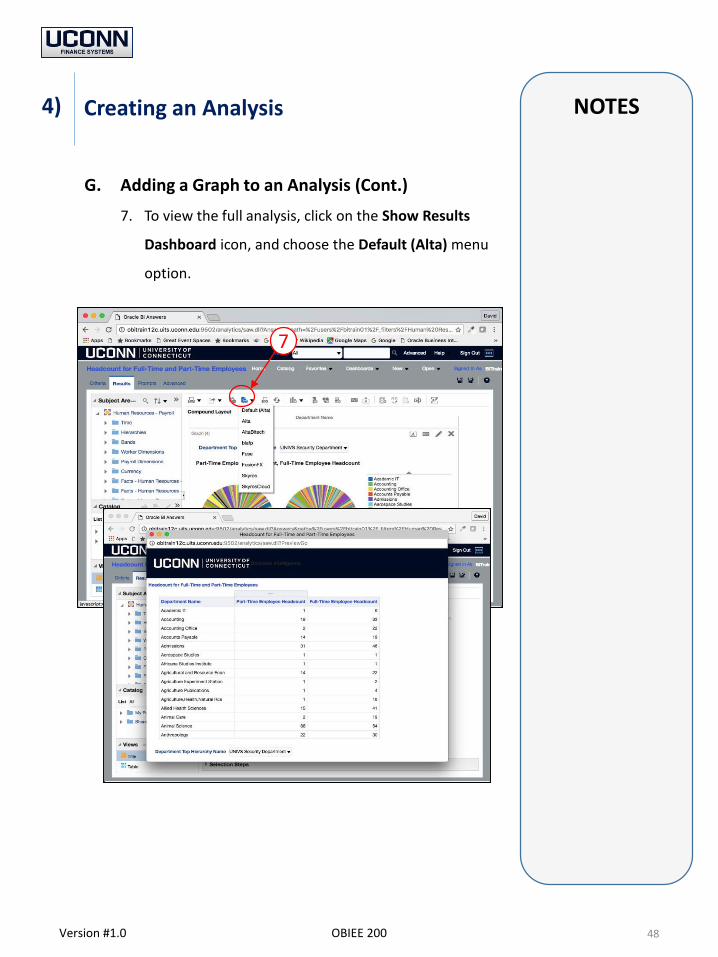
G. Adding a Graph to an Analysis (Cont.)
7. To view the full analysis, click on the Show Results
Dashboard icon, and choose the Default (Alta) menu
option.
Creating an Analysis
48Version #1.0 OBIEE 200
4)
7
NOTES
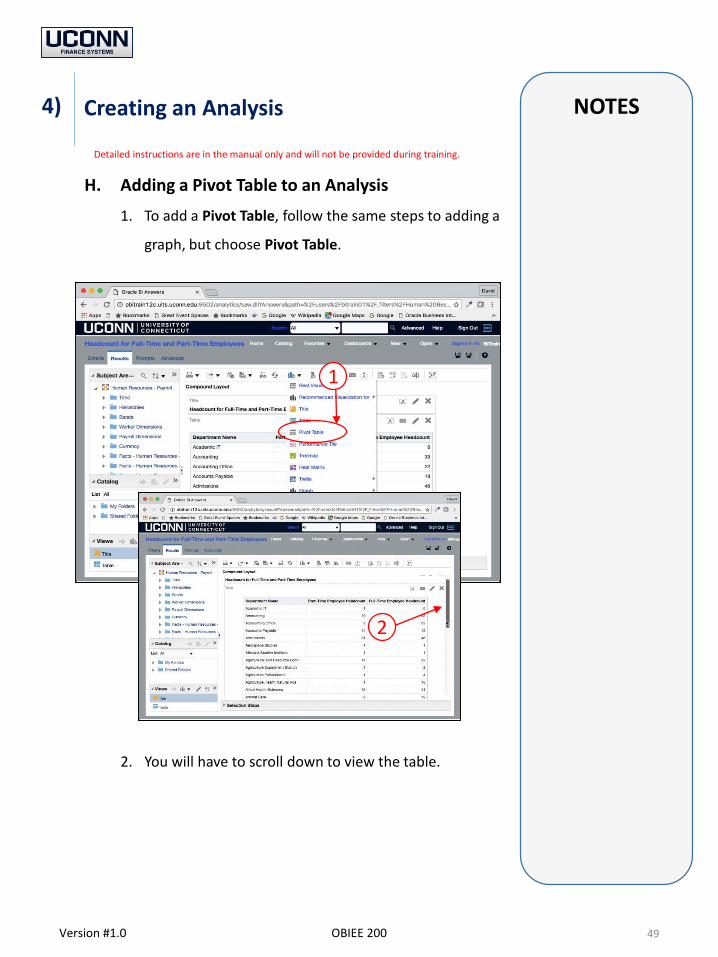
H. Adding a Pivot Table to an Analysis
1. To add a Pivot Table, follow the same steps to adding a
graph, but choose Pivot Table.
2. You will have to scroll down to view the table.
Creating an Analysis
49Version #1.0 OBIEE 200
4)
1
2
Detailed instructions are in the manual only and will not be provided during training.
NOTES
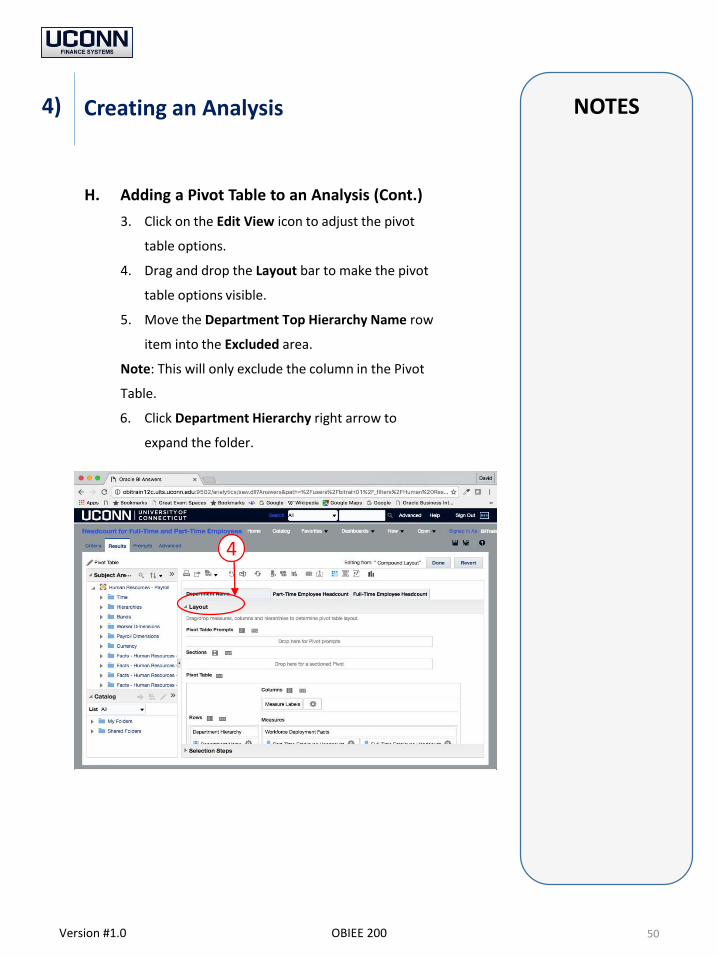
H. Adding a Pivot Table to an Analysis (Cont.)
3. Click on the Edit View icon to adjust the pivot
table options.
4. Drag and drop the Layout bar to make the pivot
table options visible.
5. Move the Department Top Hierarchy Name row
item into the Excluded area.
Note: This will only exclude the column in the Pivot
Table.
6. Click Department Hierarchy right arrow to
expand the folder.
Creating an Analysis
50Version #1.0 OBIEE 200
4)
4
NOTES
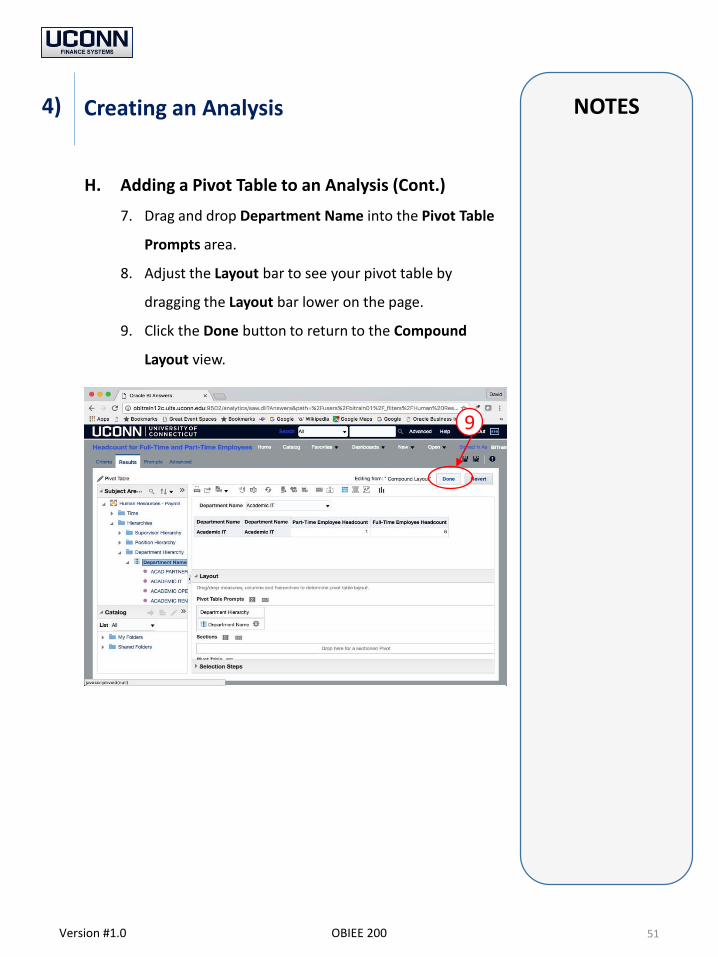
H. Adding a Pivot Table to an Analysis (Cont.)
7. Drag and drop Department Name into the Pivot Table
Prompts area.
8. Adjust the Layout bar to see your pivot table by
dragging the Layout bar lower on the page.
9. Click the Done button to return to the Compound
Layout view.
Creating an Analysis
51Version #1.0 OBIEE 200
4)
9
NOTES
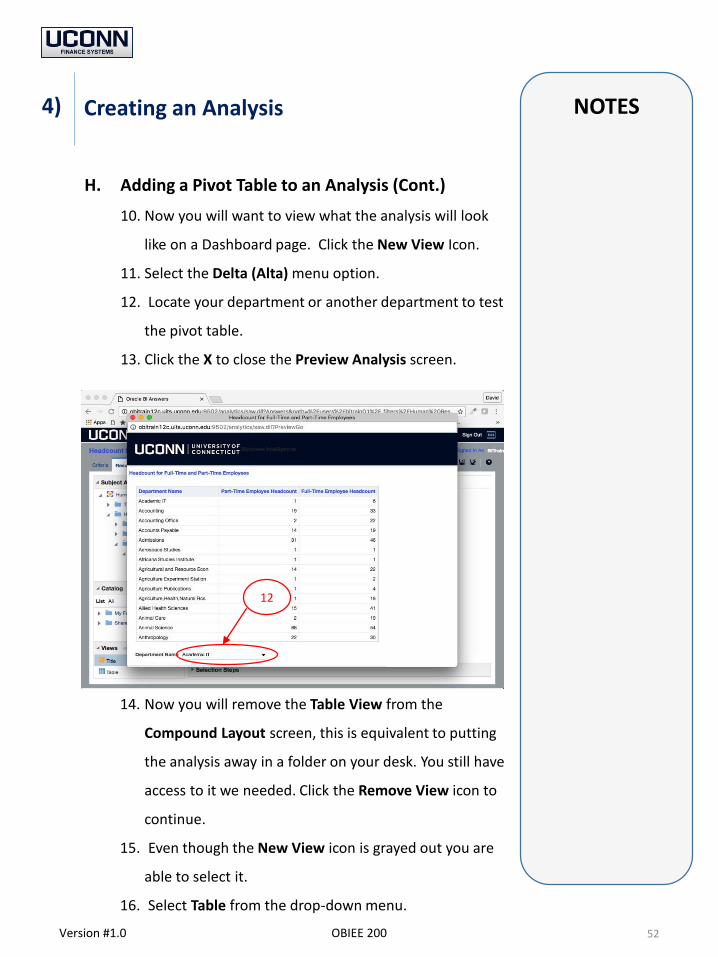
H. Adding a Pivot Table to an Analysis (Cont.)
10. Now you will want to view what the analysis will look
like on a Dashboard page. Click the New View Icon.
11. Select the Delta (Alta) menu option.
12. Locate your department or another department to test
the pivot table.
13. Click the X to close the Preview Analysis screen.
14. Now you will remove the Table View from the
Compound Layout screen, this is equivalent to putting
the analysis away in a folder on your desk. You still have
access to it we needed. Click the Remove View icon to
continue.
15. Even though the New View icon is grayed out you are
able to select it.
16. Select Table from the drop-down menu.
Creating an Analysis
52Version #1.0 OBIEE 200
4)
12
NOTES
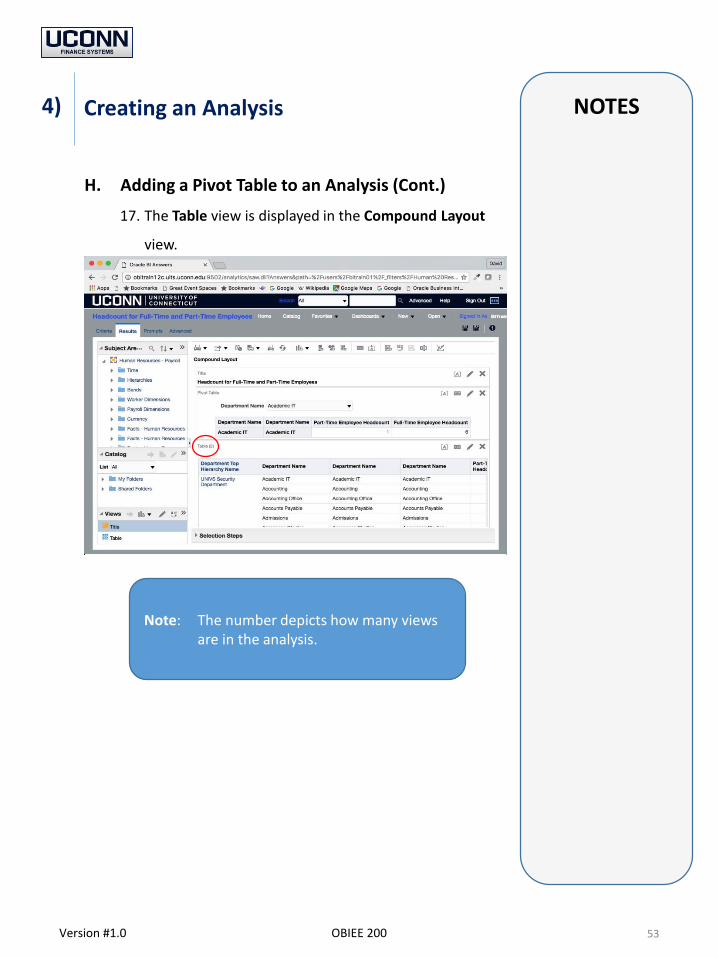
H. Adding a Pivot Table to an Analysis (Cont.)
17. The Table view is displayed in the Compound Layout
view.
Creating an Analysis
53Version #1.0 OBIEE 200
4)
Note: The number depicts how many views are in the analysis.
NOTESAdding a Graph to an Analysis – Exercise Two
54OBIEE 200
4)
Version #1.0
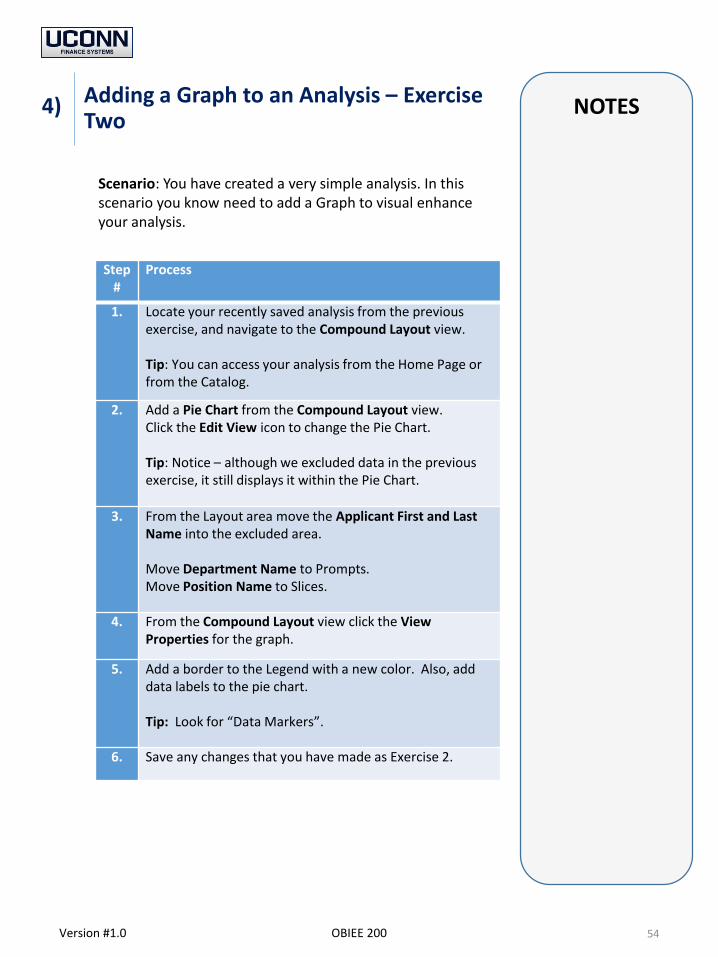
Scenario: You have created a very simple analysis. In this scenario you know need to add a Graph to visual enhance your analysis.
Step #
Process
1. Locate your recently saved analysis from the previous exercise, and navigate to the Compound Layout view.
Tip: You can access your analysis from the Home Page or from the Catalog.
2. Add a Pie Chart from the Compound Layout view. Click the Edit View icon to change the Pie Chart.
Tip: Notice – although we excluded data in the previous exercise, it still displays it within the Pie Chart.
3. From the Layout area move the Applicant First and Last Name into the excluded area.
Move Department Name to Prompts.Move Position Name to Slices.
4. From the Compound Layout view click the View Properties for the graph.
5. Add a border to the Legend with a new color. Also, add data labels to the pie chart.
Tip: Look for “Data Markers”.
6. Save any changes that you have made as Exercise 2.
NOTES
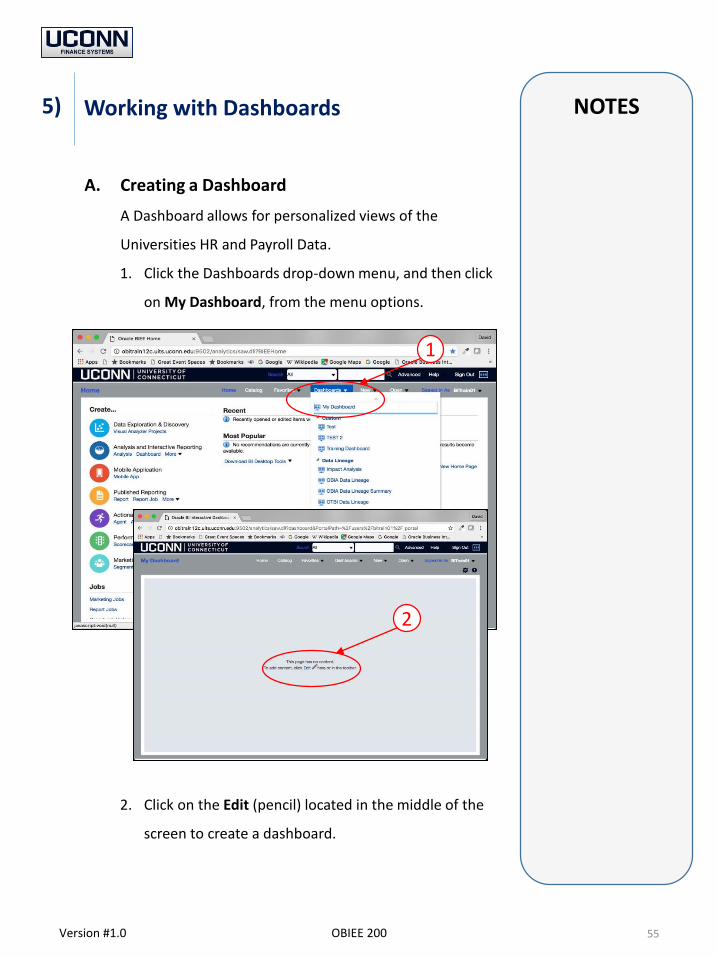
A. Creating a Dashboard
A Dashboard allows for personalized views of the
Universities HR and Payroll Data.
1. Click the Dashboards drop-down menu, and then click
on My Dashboard, from the menu options.
2. Click on the Edit (pencil) located in the middle of the
screen to create a dashboard.
Working with Dashboards
55Version #1.0 OBIEE 200
5)
1
2

NOTES
A. Creating a Dashboard (Cont.)
3. Click the My Folder’s right-arrow to expand the content
within the folder.
4. Now, drag and drop your saved reports into the blue
Content Area.
Working with Dashboards
56Version #1.0 OBIEE 200
5)
4
3
NOTES
A. Creating a Dashboard (Cont.)
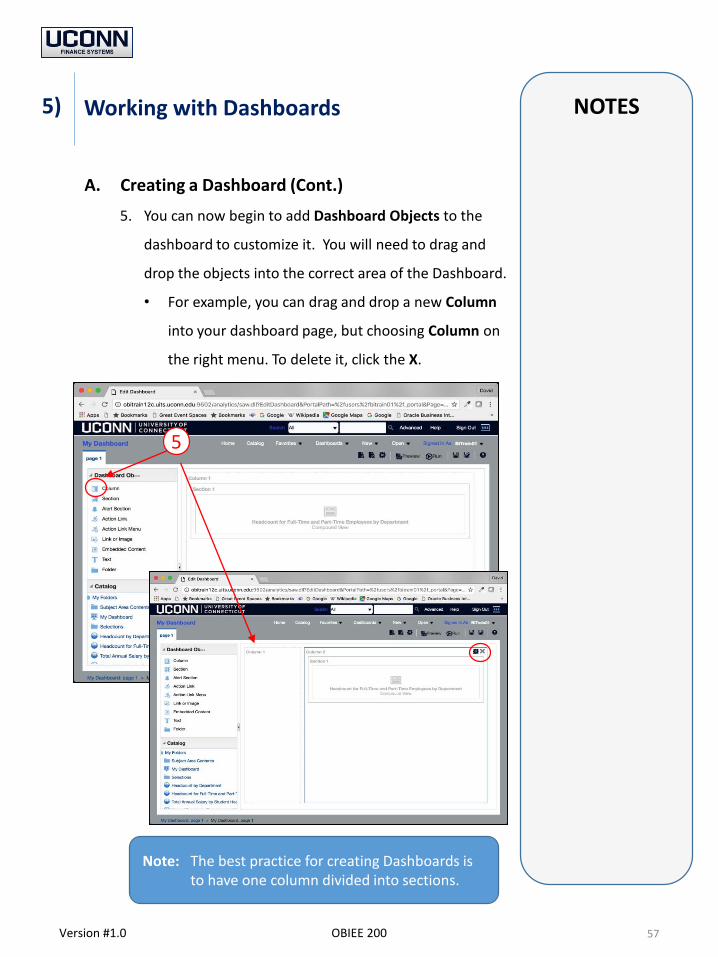
5. You can now begin to add Dashboard Objects to the
dashboard to customize it. You will need to drag and
drop the objects into the correct area of the Dashboard.
• For example, you can drag and drop a new Column
into your dashboard page, but choosing Column on
the right menu. To delete it, click the X.
Working with Dashboards
57Version #1.0 OBIEE 200
5)
5
Note: The best practice for creating Dashboards is to have one column divided into sections.

NOTES
A. Creating a Dashboard (Cont.)
• You can also drag and drop the Section object into
your Dashboard Page.
• From here, you can now add additional analysis from
your My Folder.
Working with Dashboards
58Version #1.0 OBIEE 200
5)
5
Note: OBIEE will automatically number the Sections and Columns as you add them into the dashboard.
NOTES
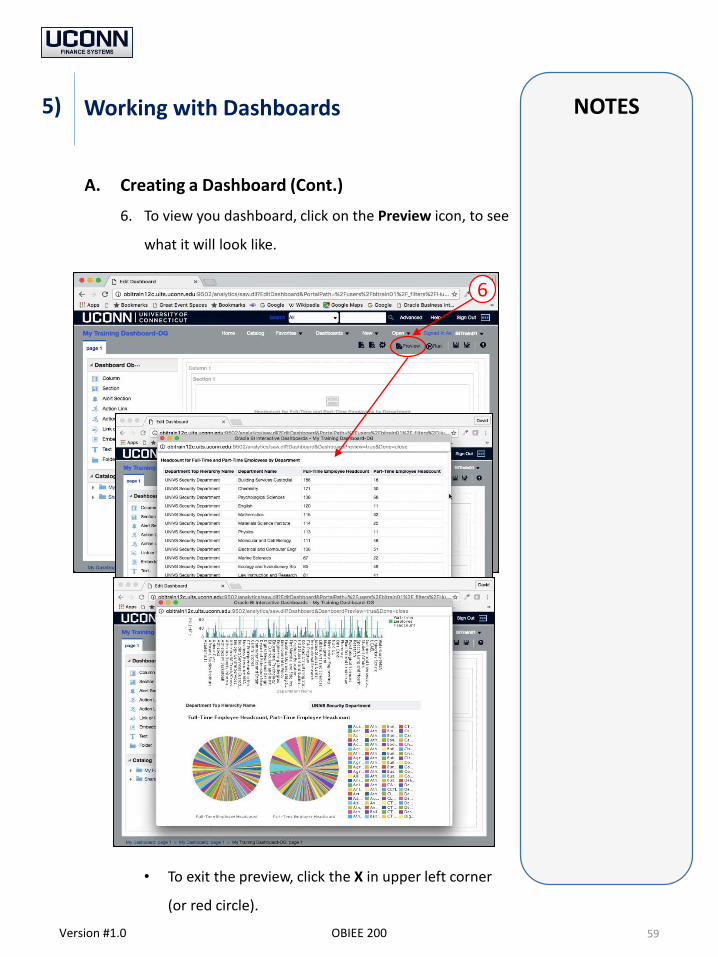
A. Creating a Dashboard (Cont.)
6. To view you dashboard, click on the Preview icon, to see
what it will look like.
• To exit the preview, click the X in upper left corner
(or red circle).
Working with Dashboards
59Version #1.0 OBIEE 200
5)
6
NOTES
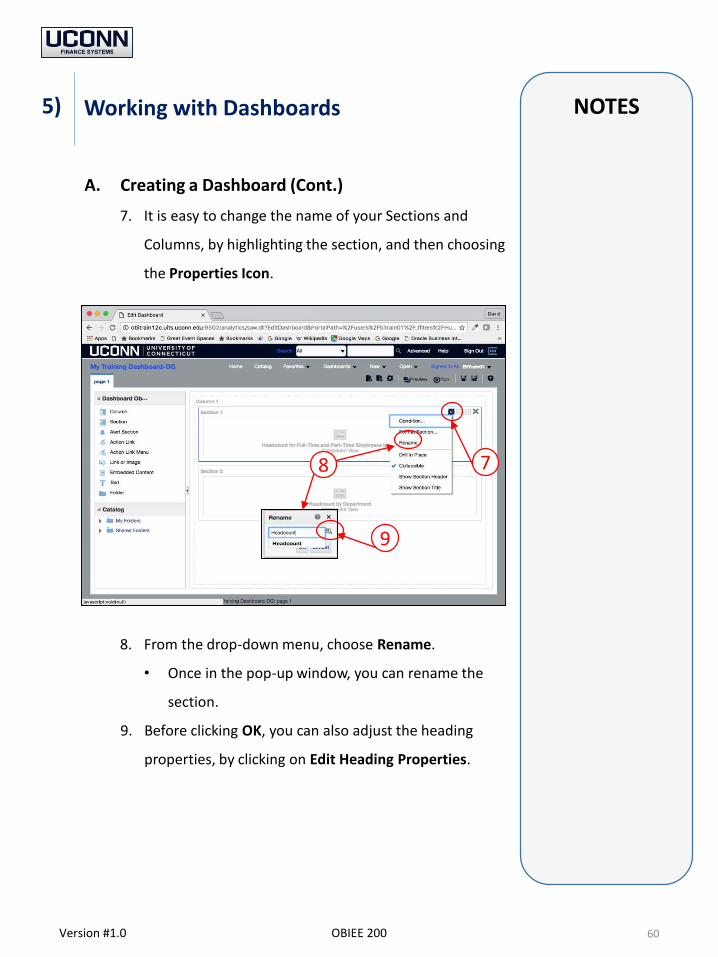
A. Creating a Dashboard (Cont.)
7. It is easy to change the name of your Sections and
Columns, by highlighting the section, and then choosing
the Properties Icon.
8. From the drop-down menu, choose Rename.
• Once in the pop-up window, you can rename the
section.
9. Before clicking OK, you can also adjust the heading
properties, by clicking on Edit Heading Properties.
Working with Dashboards
60Version #1.0 OBIEE 200
5)
78
9
NOTES
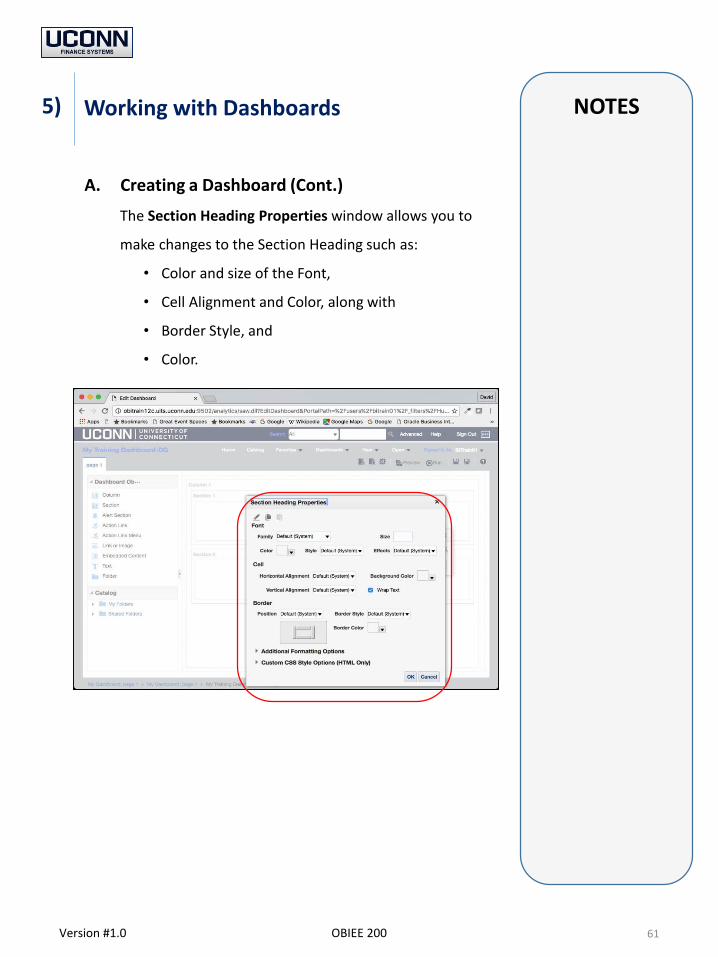
A. Creating a Dashboard (Cont.)
The Section Heading Properties window allows you to
make changes to the Section Heading such as:
• Color and size of the Font,
• Cell Alignment and Color, along with
• Border Style, and
• Color.
Working with Dashboards
61Version #1.0 OBIEE 200
5)
NOTES
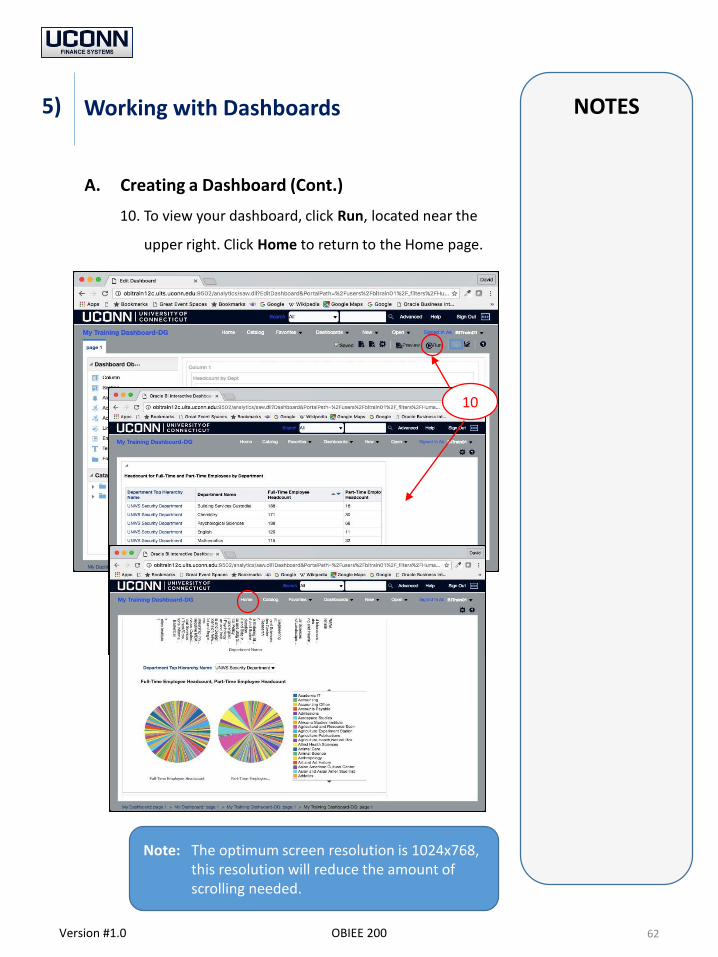
A. Creating a Dashboard (Cont.)
10. To view your dashboard, click Run, located near the
upper right. Click Home to return to the Home page.
Working with Dashboards
62Version #1.0 OBIEE 200
5)
10
Note: The optimum screen resolution is 1024x768, this resolution will reduce the amount of scrolling needed.
NOTES
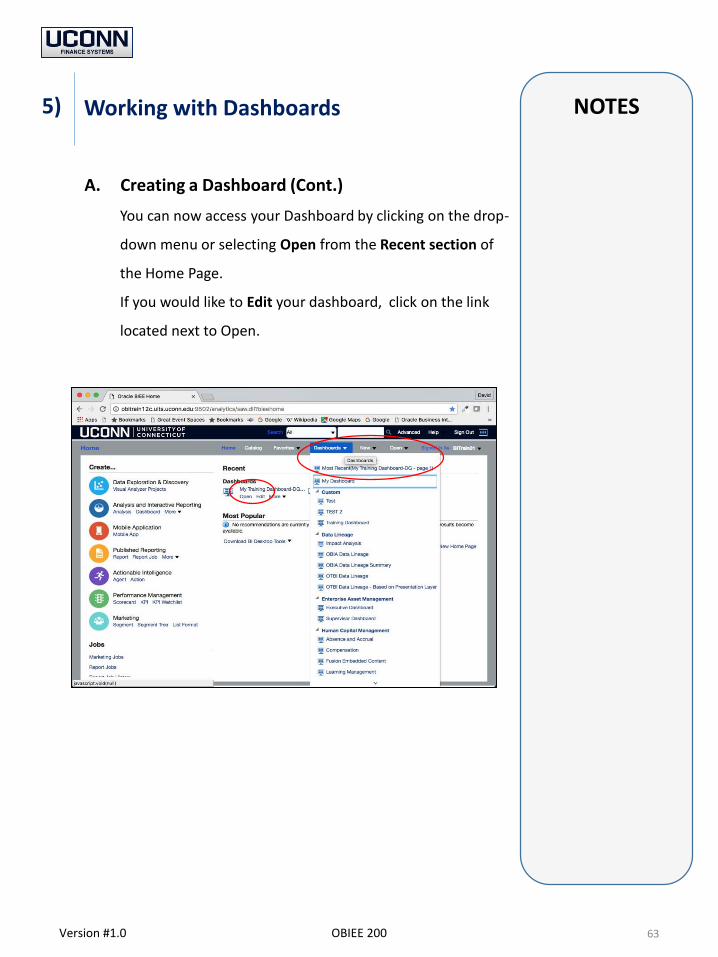
A. Creating a Dashboard (Cont.)
You can now access your Dashboard by clicking on the drop-
down menu or selecting Open from the Recent section of
the Home Page.
If you would like to Edit your dashboard, click on the link
located next to Open.
Working with Dashboards
63Version #1.0 OBIEE 200
5)
NOTES
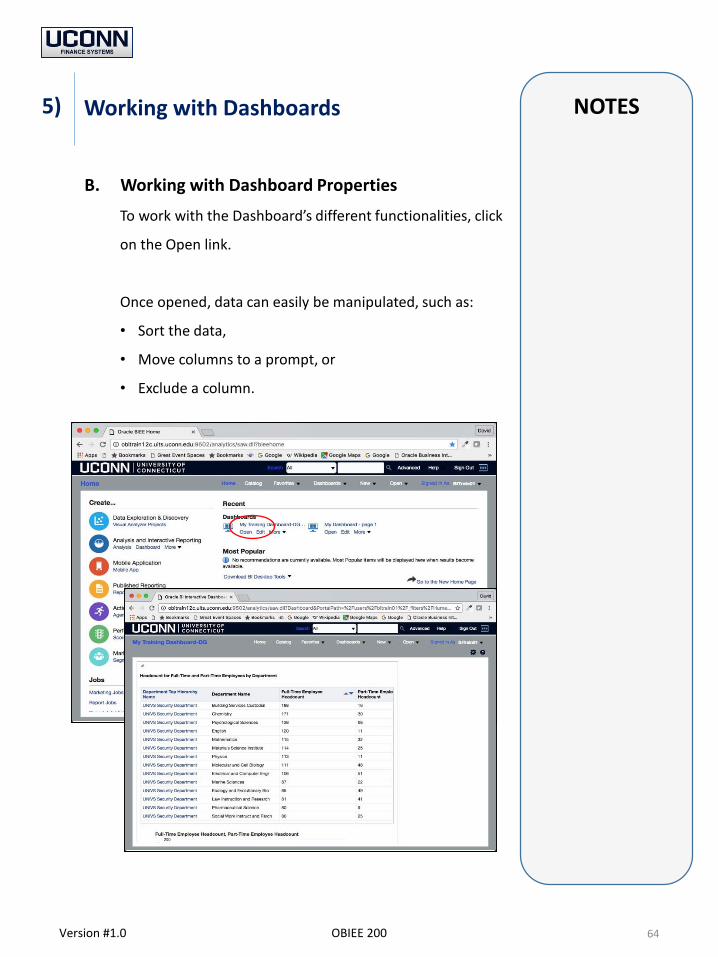
B. Working with Dashboard Properties
To work with the Dashboard’s different functionalities, click
on the Open link.
Once opened, data can easily be manipulated, such as:
• Sort the data,
• Move columns to a prompt, or
• Exclude a column.
Working with Dashboards
64Version #1.0 OBIEE 200
5)
NOTES
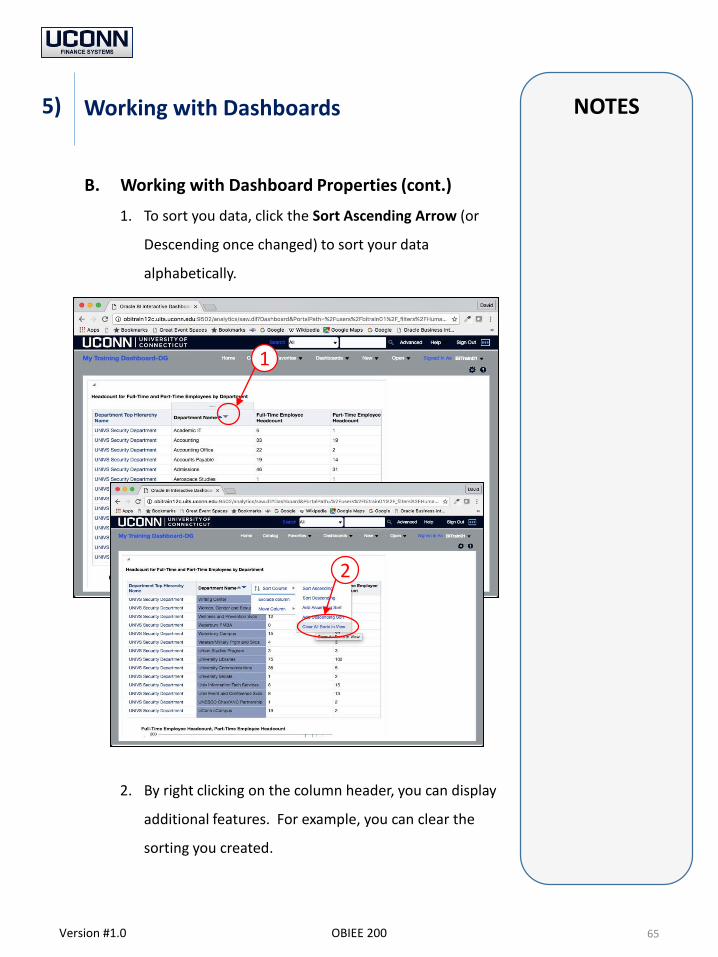
B. Working with Dashboard Properties (cont.)
1. To sort you data, click the Sort Ascending Arrow (or
Descending once changed) to sort your data
alphabetically.
2. By right clicking on the column header, you can display
additional features. For example, you can clear the
sorting you created.
Working with Dashboards
65Version #1.0 OBIEE 200
5)
1
2
NOTES
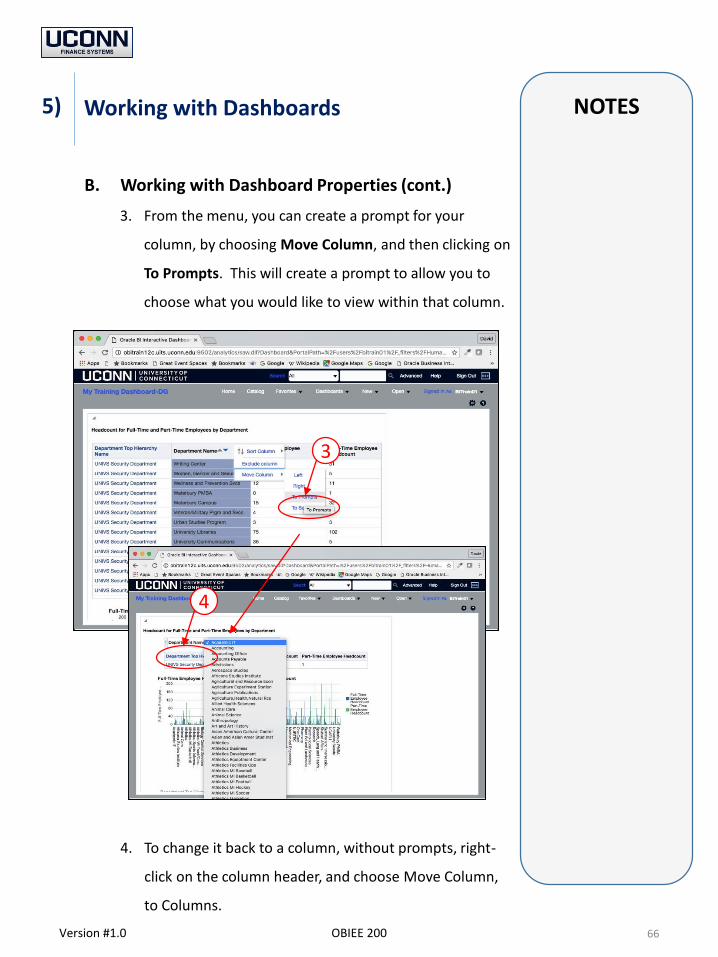
B. Working with Dashboard Properties (cont.)
3. From the menu, you can create a prompt for your
column, by choosing Move Column, and then clicking on
To Prompts. This will create a prompt to allow you to
choose what you would like to view within that column.
4. To change it back to a column, without prompts, right-
click on the column header, and choose Move Column,
to Columns.
Working with Dashboards
66Version #1.0 OBIEE 200
5)
3
4
NOTES
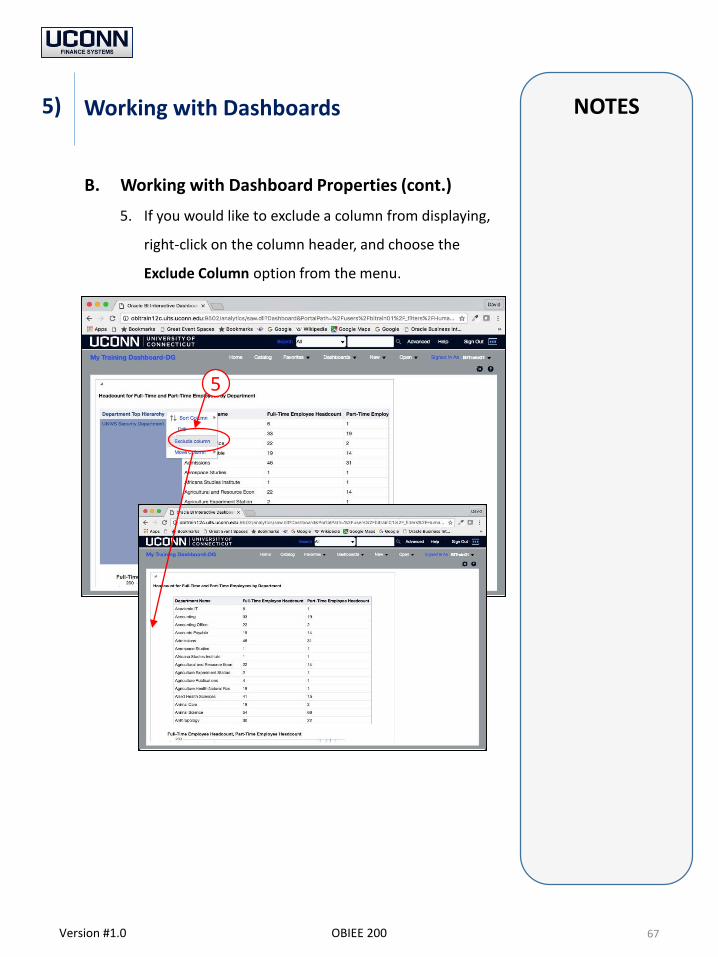
B. Working with Dashboard Properties (cont.)
5. If you would like to exclude a column from displaying,
right-click on the column header, and choose the
Exclude Column option from the menu.
Working with Dashboards
67Version #1.0 OBIEE 200
5)
5
NOTES
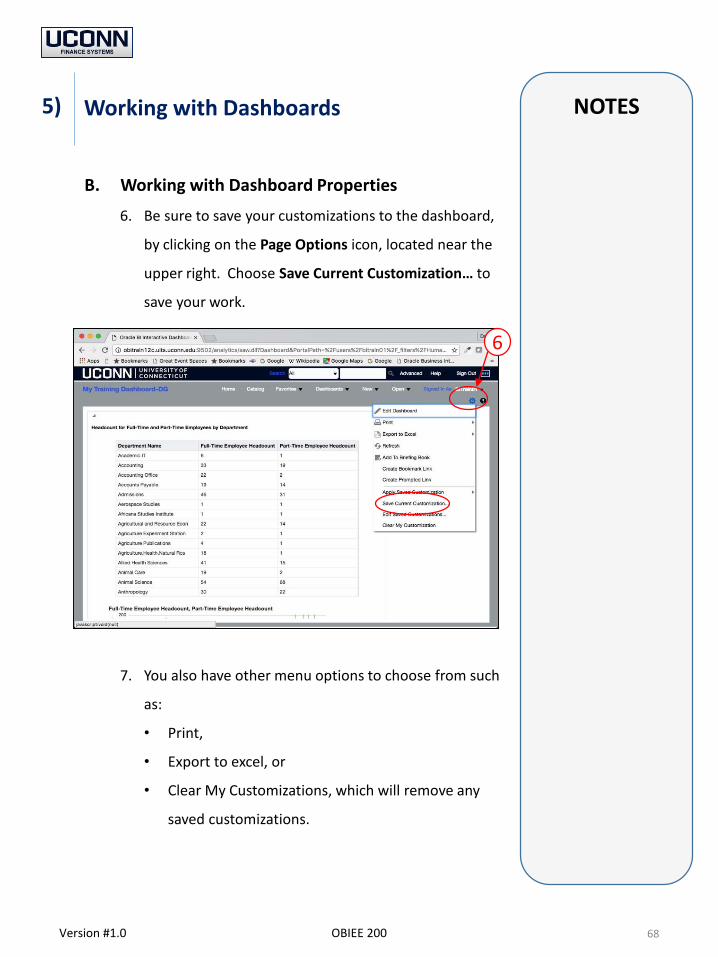
B. Working with Dashboard Properties
6. Be sure to save your customizations to the dashboard,
by clicking on the Page Options icon, located near the
upper right. Choose Save Current Customization… to
save your work.
7. You also have other menu options to choose from such
as:
• Print,
• Export to excel, or
• Clear My Customizations, which will remove any
saved customizations.
Working with Dashboards
68Version #1.0 OBIEE 200
5)
6
NOTES
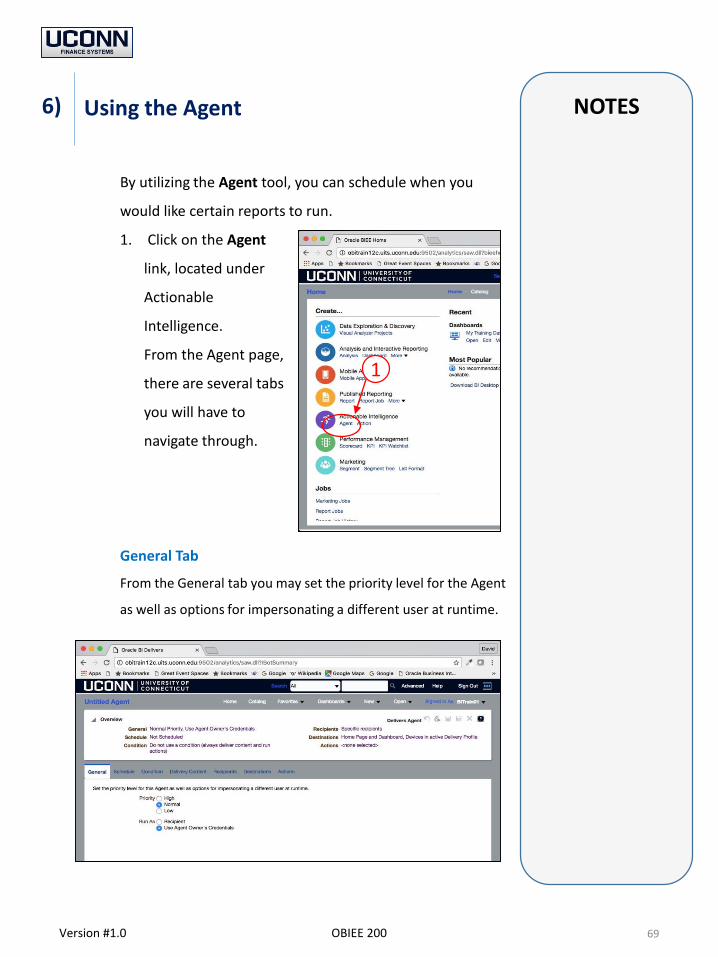
By utilizing the Agent tool, you can schedule when you
would like certain reports to run.
1. Click on the Agent
link, located under
Actionable
Intelligence.
From the Agent page,
there are several tabs
you will have to
navigate through.
General Tab
From the General tab you may set the priority level for the Agent
as well as options for impersonating a different user at runtime.
Using the Agent
69Version #1.0 OBIEE 200
6)
1
NOTES
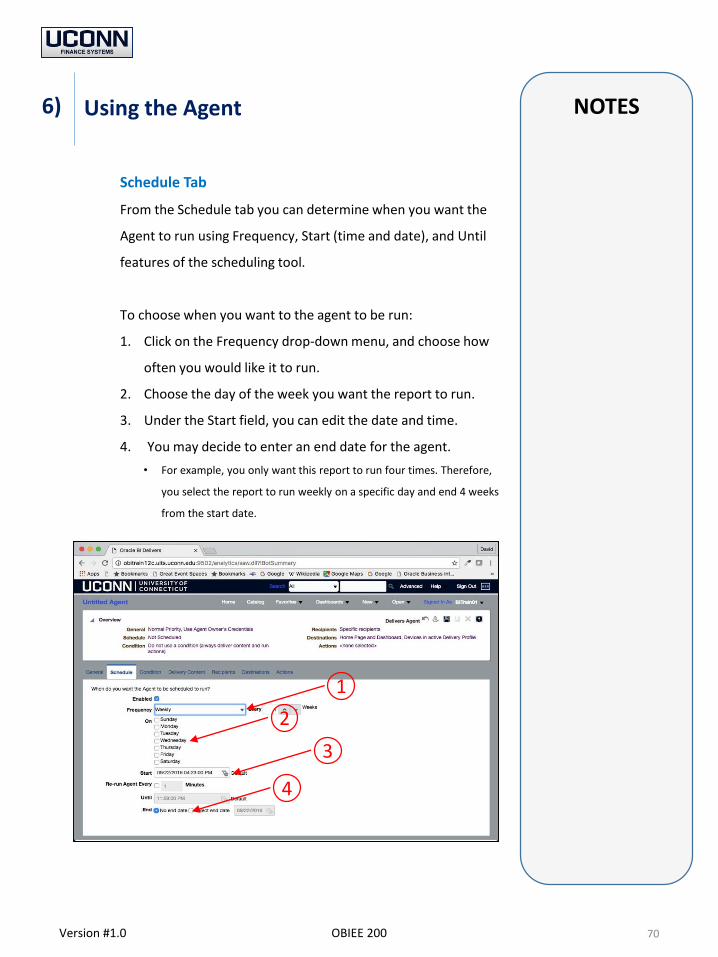
Schedule Tab
From the Schedule tab you can determine when you want the
Agent to run using Frequency, Start (time and date), and Until
features of the scheduling tool.
To choose when you want to the agent to be run:
1. Click on the Frequency drop-down menu, and choose how
often you would like it to run.
2. Choose the day of the week you want the report to run.
3. Under the Start field, you can edit the date and time.
4. You may decide to enter an end date for the agent.
• For example, you only want this report to run four times. Therefore,
you select the report to run weekly on a specific day and end 4 weeks
from the start date.
Using the Agent
70Version #1.0 OBIEE 200
6)
1
2
3
4
NOTES
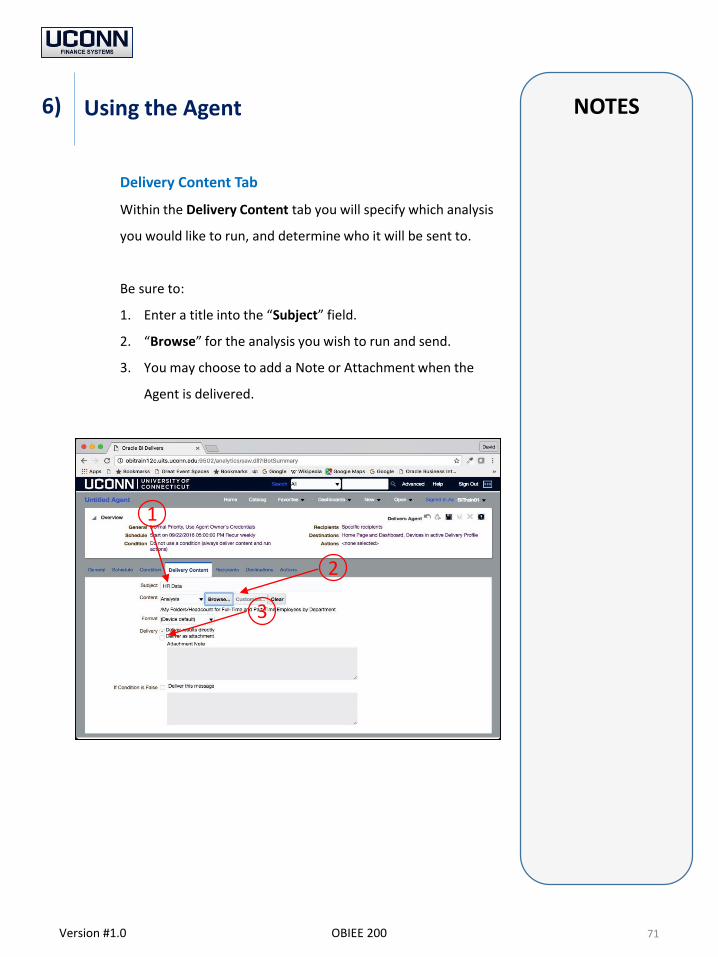
Delivery Content Tab
Within the Delivery Content tab you will specify which analysis
you would like to run, and determine who it will be sent to.
Be sure to:
1. Enter a title into the “Subject” field.
2. “Browse” for the analysis you wish to run and send.
3. You may choose to add a Note or Attachment when the
Agent is delivered.
Using the Agent
71Version #1.0 OBIEE 200
6)
2
3
1
NOTES
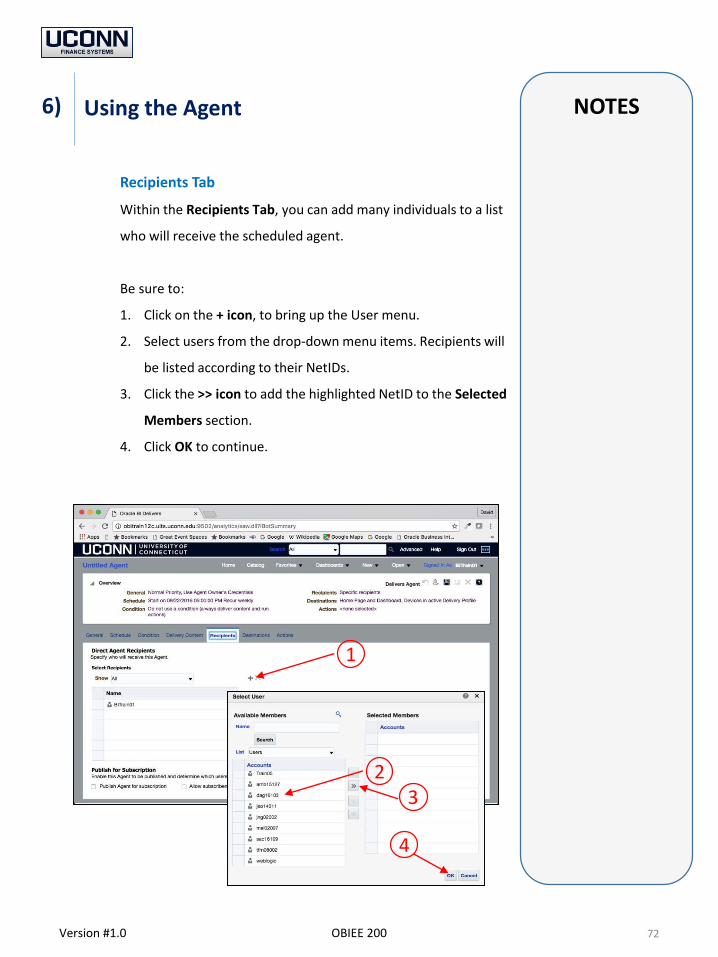
Recipients Tab
Within the Recipients Tab, you can add many individuals to a list
who will receive the scheduled agent.
Be sure to:
1. Click on the + icon, to bring up the User menu.
2. Select users from the drop-down menu items. Recipients will
be listed according to their NetIDs.
3. Click the >> icon to add the highlighted NetID to the Selected
Members section.
4. Click OK to continue.
Using the Agent
72Version #1.0 OBIEE 200
6)
1
23
4
NOTES
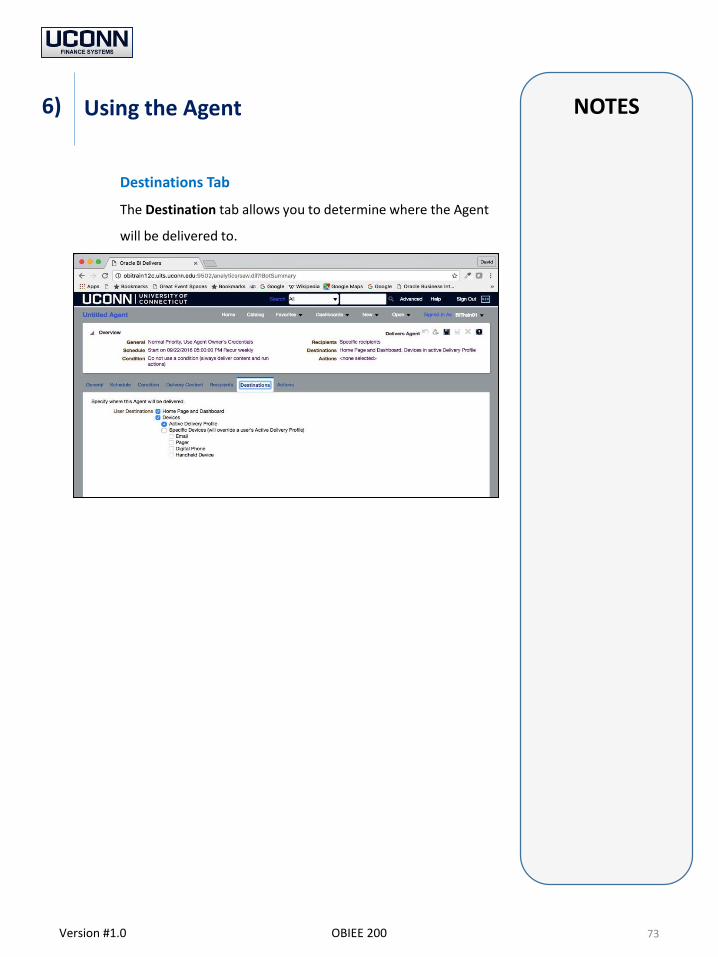
Destinations Tab
The Destination tab allows you to determine where the Agent
will be delivered to.
Using the Agent
73Version #1.0 OBIEE 200
6)
NOTES
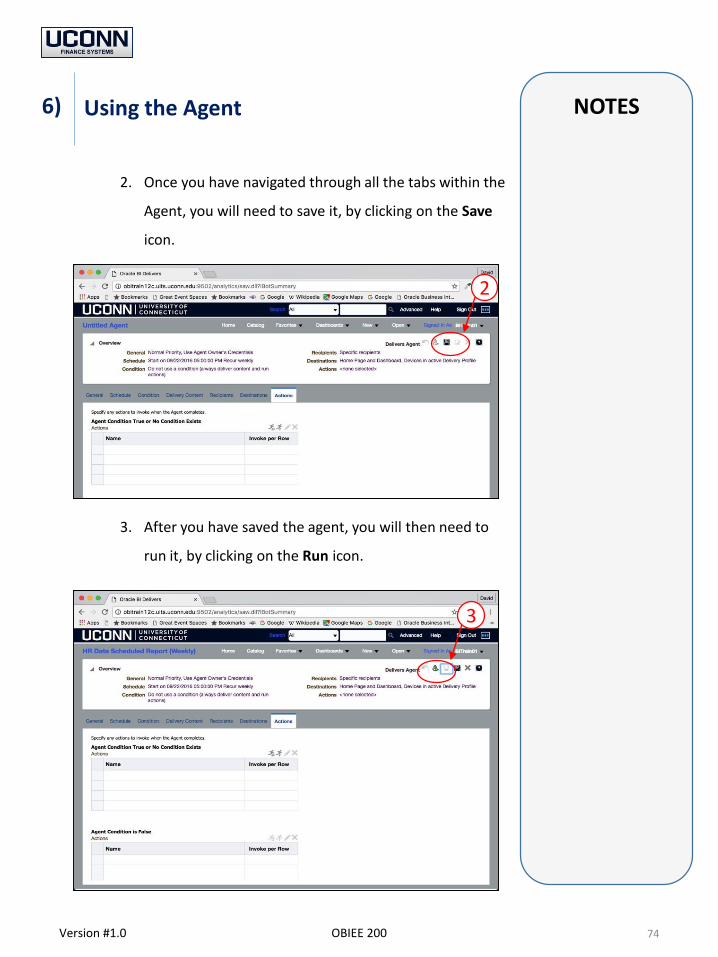
2. Once you have navigated through all the tabs within the
Agent, you will need to save it, by clicking on the Save
icon.
3. After you have saved the agent, you will then need to
run it, by clicking on the Run icon.
Using the Agent
74Version #1.0 OBIEE 200
6)
2
3
NOTES
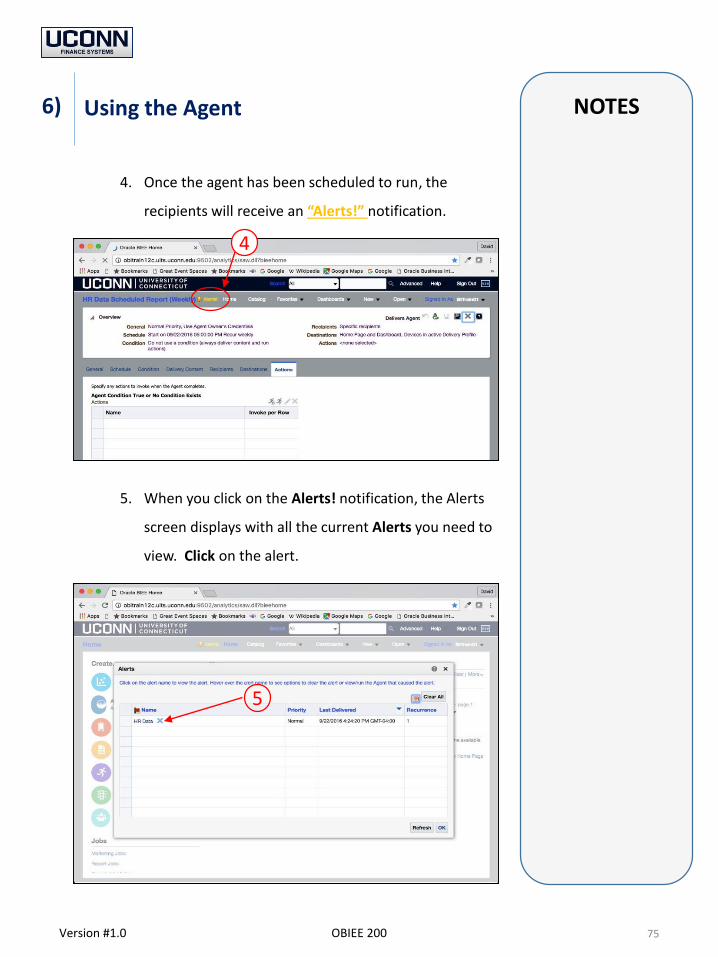
4. Once the agent has been scheduled to run, the
recipients will receive an “Alerts!” notification.
5. When you click on the Alerts! notification, the Alerts
screen displays with all the current Alerts you need to
view. Click on the alert.
Using the Agent
75Version #1.0 OBIEE 200
6)
4
5

NOTES
6. The analysis will be displayed. To clear the alert, and
remove it, click on the Clear Alert button.
7. This will remove the alerts, once cleared, from the top
menu bar.
Using the Agent
76Version #1.0 OBIEE 200
6)
6
NOTESAdding your Analysis to a Dashboard -Exercise Three
77OBIEE 200
6)
Version #1.0
Scenario: In this scenario you know need to create a new Dashboard so you can quickly view your analysis at any time.
Step #
Process
1. Go to the My Dashboard view.
Tip: You will want to edit the Dashboard.
2. Add two Columns and a Section to each column within the Content area.
3. From the Catalog, in My Folders, locate the analyses you saved in exercises one and two.
4. Add your analysis to Section 1 and another analysis to Section 2.
Tip: If you do not have another analysis created, try using different Objects, and add an image.
NOTESAdding your Analysis to a Dashboard -Exercise Three (continuation)
78OBIEE 200
6)
Version #1.0
Step #
Process
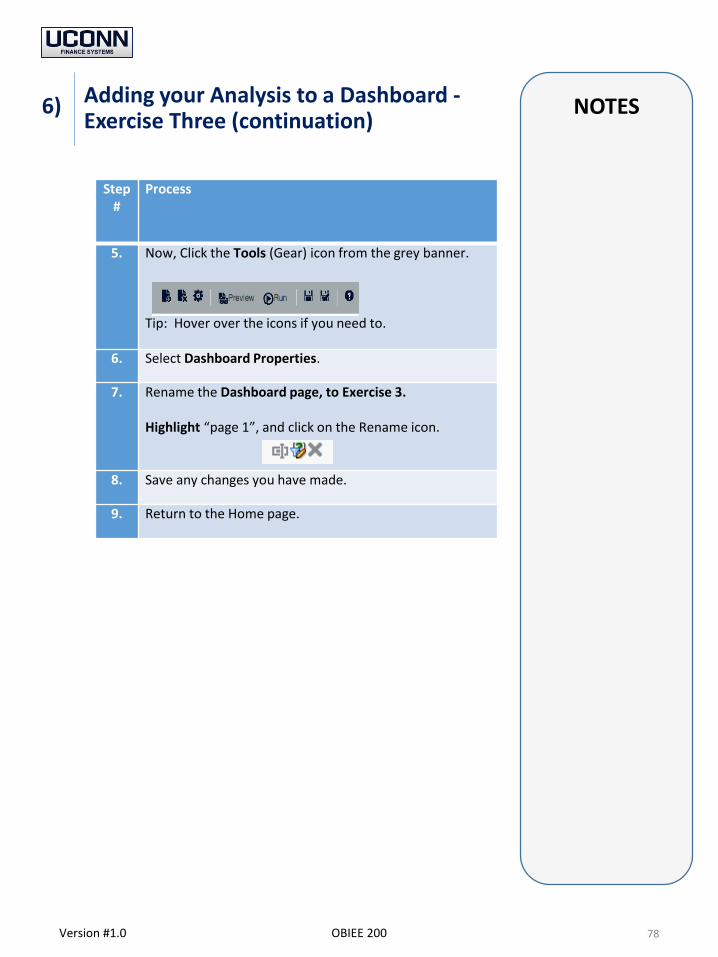
5. Now, Click the Tools (Gear) icon from the grey banner.
Tip: Hover over the icons if you need to.
6. Select Dashboard Properties.
7. Rename the Dashboard page, to Exercise 3.
Highlight “page 1”, and click on the Rename icon.
8. Save any changes you have made.
9. Return to the Home page.
NOTESOBIEE GLOSSARY
79OBIEE 200
7)
Version #1.0
ActionRule result which can impact users such forcing them to register a security profile, KBA-challenging them, blocking access, asking them for PIN or password, and so on.
AlertRule results containing messages targeted to specific types of Oracle Adaptive Access Manager users.
AttributeAttributes are the particular pieces of information associated with the activity being tracked. An example is the time of day for a login. Patterns collect data about members. If the member type is User, the pattern will collect data about users.
ConditionConditions are configurable evaluation statements used in the evaluation of historical and runtime data.
DashboardProvides a real-time view of activity via aggregates and trending.
Dashboard PageA user interface or Web page that gives a current summary, usually in graphic, easy-to-read form, of key information relating to progress and performance, especially of a business or website: Our managers use an interactive dashboard to monitor employee data.
EnvironmentTools for the configuration system properties and snapshots
FiltersFilters are used to limit the results that are displayed when an analysis is run, so that the results answer a particular question. Based on the filters, only those results are shown that matches the criteria passed in the filter condition. Filters are applied only to attribute and measure columns.
NOTESOBIEE GLOSSARY
80OBIEE 200
7)
Version #1.0
GroupsCollection of like items. Groups are found in the following situationsGroups are used in rule conditionsGroups that link policy to user groupsAction and alert groups
HTTPHypertext Transfer Protocol
IP addressInternet Protocol (IP) address
JobA job is a collection of tasks that can be run by OAAM. You can perform a variety of jobs such as load data, run risk evaluation, roll up monitor data, and other jobs.
KPIA KPI is a measurement of a particular business process which is compared against specific goals and objectives of an organization
Rule ConditionsConditions are the basic building blocks for security policies.
RulesRules are a collection of conditions used to evaluate user activity.
Subject AreaA subject area contains:• folders,• presentation tables,• measure columns,• attribute columns,• hierarchical columns.
UserA business or person, etc that is authorized to conduct transactions.
ValidationsAnswer validation used in the KBA question registration and challenge process