obesity and the hypothalamic-pituitary-adrenal axis in adolescent girls
TRANSCRIPT
M E T A B O L I S M C L I N I C A L A N D E X P E R I M E N T A L 6 1 ( 2 0 1 2 ) 3 4 1 – 3 4 8
Ava i l ab l e a t www.sc i enced i r ec t . com
Metabolismwww.metabo l i sm jou rna l . com
Obesity and the hypothalamic-pituitary-adrenal axis inadolescent girls
Jennifer B. Hillmana,⁎, Lorah D. Dorna, Tammy L. Loucksb, Sarah L. Bergab
a Cincinnati Children's Hospital Medical Center, Division of Adolescent Medicine and University of Cincinnati College of Medicine,Cincinnati, OH 45229, USAb Department of Gynecology and Obstetrics, Emory University School of Medicine, Atlanta, GA, USA
A R T I C L E I N F O
Author contributions: Dr Hillman wasinterpretation, and drafting the manuscript.from the participants. Dr Dorn also assisteinterpretation of analyses, and revising theprovided guidance on how to analyze the ur⁎ Corresponding author. Tel.: +1 513 636 3539
E-mail address: jennifer.hillman@cchmc.
0026-0495/$ – see front matter © 2012 Elsevidoi:10.1016/j.metabol.2011.07.009
A B S T R A C T
Article history:Received 19 April 2011Accepted 23 July 2011
Stress and stress-related concomitants, including hypothalamic-pituitary-adrenal (HPA)axis activation, are implicated in obesity and its attendant comorbidities. Little is knownabout this relationship in adolescents. To begin to address this important knowledge gap,we studied HPA axis activity in 262 healthy adolescent girls aged 11, 13, 15, and 17 years. Wehypothesized that obesity would be correlated with increased HPA axis activity andreactivity. Measures of HPA axis activity included 3 blood samples obtained midday(between 1:00 and 2:00 PM) over the course of 40 minutes; overnight urine free cortisol; andcortisol levels 0, 20, and 40 minutes after venipuncture (cortisol reactivity). Measures ofadiposity included body mass index (BMI), BMI z score (BMI-Z), percentage body fat, and fatdistribution (central adiposity) assessed by dual-energy x-ray absorptiometry. Daytimelevels of serum cortisol were inversely associated with BMI-Z and central adiposity (P < .05).The urine free cortisol excretion rate was positively correlated with BMI, BMI-Z, and centraladiposity. There was blunting of cortisol response to venipuncture with increasingadiposity. Our results suggest that there may be reduced cortisol levels during the dayand increased levels at night with increasing degree of adiposity. This study providespreliminary findings indicating an alteration of the circadian rhythm of cortisol withobesity. We conclude that obesity is associated with altered HPA activity in adolescent girls.The clinical implications of our findings require further investigation.
© 2012 Elsevier Inc. All rights reserved.
1. Introduction
Obesity is widespread in the United States and otherindustrialized nations [1,2], leading to significant healthproblems that impact nearly every organ system. Multipleendocrine disturbances, such as type 2 diabetes mellitus andpolycystic ovary syndrome, often coexist with obesity. In
responsible for the concDr Dorn conceptualized thd in developing the conmanuscript. Tammy Lo
ine free cortisol data, inte; fax: +1 513 636 1129.org (J.B. Hillman).
er Inc. All rights reserved
addition, changes in the functioning of the hypothalamic-pituitary-adrenal (HPA) axis have been implicated as both acause and a consequence of obesity [3,4]. Furthermore, obesityconstitutes a chronic stressor with central and peripheralconsequences. It has been proposed that a prolonged period ofHPA axis stimulation secondary to the chronic stress ofobesity is followed by a breakdown in the regulatory
eptualization of the secondary study aims, data analyses ande original parent study, received grant funding, and collected dataceptual organization of the aims and the current manuscript,ucks and Dr Berga completed the urine free cortisol assays andrpret the findings, and revise the manuscript.
.
342 M E T A B O L I S M C L I N I C A L A N D E X P E R I M E N T A L 6 1 ( 2 0 1 2 ) 3 4 1 – 3 4 8
mechanisms of the HPA axis [5]. For example, individuals withincreased abdominal obesity have greater endogenous gluco-corticoid responses to a meal [6] or adrenocorticotropichormone challenge [7]. It is also known that exogenousglucocorticoids increase food intake [8] and promote deposi-tion of abdominal fat that is predictive of cardiovasculardisease, particularly in women [5,6]. These observationssupport the notion that changes in the HPA axis in the settingof obesity may confer greater risk to develop obesity-relatedcomorbidities including anxiety and depression, hyperten-sion, hyperlipidemia, and diabetes.
Determining causality and directionality of the interac-tions between the HPA axis activity and obesity is hamperedby difficulty in characterizing a dynamic axis with a pro-nounced diurnal pattern. Not only is the cortisol rhythmdiurnal, cortisol levels rise following meals or in response toillness, psychosocial challenge, and exercise. In the circula-tion, the greatest amount of cortisol is bound to plasmaproteins (>90%), particularly corticosteroid binding globulin(CBG) and sex hormone binding globulin (SHBG), whereastissues “see” only the free (unbound) fraction. Because thesecretion of cortisol is diurnal and pulsatile, a single timepoint for cortisol is inherently unreliable in estimating thetotal cortisol secretion. Thus, it is not surprising that there areconflicting results concerning the association between corti-sol and obesity using single cortisol measures [9,10]. Moreconsistent findings were reported in studies using serialmeasures of the HPA axis [11-14]. Strain and colleaguesrevealed an increased metabolic clearance rate of cortisolamong obese compared with nonobese women [13] and apositive association between absolute cortisol production andrelative body weight in men and women [14]. Stimulatedmeasures of theHPA axis reflect the reactivity (ie, hypoactivityvs hyperactivity) of the stress system. Only one studyexamined the association between cortisol reactivity andobesity in children [15], demonstrating a positive associationbetween cortisol reactivity to a stressful situation and bodymass index (BMI).
An individual's reaction to acute and chronic stress hasbeen hypothesized to be related to the development ofobesity. Bjorntorp [16] postulated that a heightened vulnera-bility to psychosocial stress increases exposure to stress-induced cortisol, which in turn promotes central fat deposi-tion. Other studies supported this theory, particularly amongwomen with central body fat distribution (increased waist-to-hip ratio) [12,17,18]. In addition, research has evaluatedwhether increased stress contributed to the obesity epidemicin children [19]. In Swedish infants (N = 7443) followed throughage 5 years, children in families reporting stress in at least 2 ofthe 4 domains assessed had significantly higher odds (oddsratio, 2.6) of being obese [19].
The pediatric literature contains few studies involving theHPA axis and obesity. Chelew and colleagues [20] evaluatedserial serum cortisol concentrations over 20 to 24 hours in 16obese male and female subjects aged 5 to 16 years. Comparedwith lean children, the obese children had significantly lowermean cortisol concentrations. Another study reported nosignificant associations between the HPA axis and percentagebody fat in prepubertal obese children [21]. However, whencentral adiposity was examined, a significant inverse associ-
ation with salivary cortisol response to a meal was foundamong females but not males; and a positive associationbetween urinary glucocorticoid metabolites and central adi-posity was also found among females [21]. Although studieshave begun to explore associations between the HPA axis andobesity in childhood, much remains unknown; thus, investi-gations in younger, nonadult cohorts may provide insightinto the roots of metabolic disease that are expressedin adulthood.
In examining the association betweenmeasures of theHPAaxis and degree of adiposity in adolescent girls, we hypoth-esized that measures of adiposity would be correlated withincreased HPA axis activity and reactivity. As a secondary aim,we evaluated whether measures of the HPA axis are indepen-dently associated with central adiposity when controlling forpercentage body fat. This study is unique in capturingmultiple measures of both the HPA axis and adiposity in alarge cohort of adolescent girls.
2. Methods and procedures
Two-hundred sixty-two healthy girls aged 11, 13, 15, and 17years were enrolled in a cross-sequential longitudinal studyevaluating the impact of psychological symptoms andsmoking on reproductive and bone health [22]. The cross-sequential design allows for a cost-effective and moreefficient way to capture change across development.Participants are enrolled at different ages and followedfor fewer years compared with a traditional longitudinaldesign that enrolls all participants at the same age andfollows the girls for many years. The current study is asecondary data analysis and includes only baseline datathat are only available for girls (ie, no boys were enrolled inthe original study).
Participants were recruited from an academic medicalcenter and the surrounding community of a Midwestern city.Exclusion criteria included pregnancy or breastfeeding within6 months, primary (≥16 years) or secondary (<6 menstrualcycles per year and >2 years postmenarche) amenorrhea, BMIless than or equal to the first percentile or weight greater than300 lb (limitation of dual- energy x-ray absorptiometry [DXA]table), medication or medical disorder influencing bonehealth, or severe psychological disabilities impairing compre-hension or compliance with the protocol.
Institutional review board approval was obtained. Par-ents provided consent and adolescents assent for partici-pation. Visits were conducted at the General ClinicalResearch Center of a children's hospital. Eligible partici-pants received a container in which to collect overnighturine on the night before their study visit. Instructionsindicated to void before sleep and to save their urine fromsleep onset through the first morning void. Times of sleeponset and awakening were recorded to determine theduration of the collection.
The study visit began between 11:00 AM and 12:30 PM;postmenarcheal girls were scheduled during days 5 through9 of their menstrual cycle. Participants had a physicalexamination for pubertal maturation. Menstrual interviewand medication history, including use of hormonal
343M E T A B O L I S M C L I N I C A L A N D E X P E R I M E N T A L 6 1 ( 2 0 1 2 ) 3 4 1 – 3 4 8
contraceptives, were conducted by the medical professional.Height and weight were measured. Following a 2-hour fast,blood samples were obtained. Subsequently, a DXA scanwas performed.
2.1. Measures
2.1.1. Anthropometric measuresBodymass indexwasdeterminedby themeanof 3measuresofheight and weight using a wall-mounted stadiometer (Holtan,Crymych, Dyfed, UK) and digital scale (Scaletronix, CarolStream, IL), respectively. Body mass index was computed asweight (kilograms)/height (square meters).
Bodymass index z score (BMI-Z) is a standard calculation toaccount for relative adiposity in growing children andadolescents [23]. The z score accounts for age and sex bygenerating a standard deviation score from reference datafrom Centers for Disease Control and Prevention growthcurves [24,25].
Percentage body fat was determined from DXA HologicQDR4500A scans (Hologic, Bedford, MA) analyzed usingsoftware version 12.4. Percentage body fat was derivedfrom total body fat (kilograms) divided by total bodymass (kilograms).
Fat distribution, as a measure of central adiposity, wasdetermined from DXA subregion analyses, with 4 regionsdescribed by anatomical landmarks: android subscapular,android waist, gynoid hip, and gynoid thigh. Fat distributionis defined as the ratio of fat mass in the upper (android) vslower (gynoid) body regions [26]. This method has beenused in prior pediatric studies to evaluate central adiposity[27,28]. Fat distribution is analogous to waist-to-hip ratioand provides an objective assessment of the pattern of fatdeposition, with higher values corresponding to greatercentral adiposity.
2.1.2. HPA axis measuresSerum cortisol was determined from 3 samples obtained viaan indwelling catheter every 20 minutes beginning at 1:00 to2:00 PM. Girls fasted for 2 hours before the venipuncture.Radioimmunoassay (Coat-A-Count; Diagnostic Products, LosAngeles, CA) was used for cortisol measurement, with adetection limit of 0.3 μg/dL and standard curve range of 0.5 to60 μg/dL. Inter- and intraassay coefficients of variation were6.6% and 6.0%, respectively. Cortisol areas under the curvewith respect to ground (AUCg) and increase (AUCi) werecomputed [29] to represent integrated measures. Computa-tion of the AUC is a method used to comprise repeatedmeasurements over time and, in this instance, to estimateoverall hormone secretion over a specific time (ie, 40minutes). AUCg is a method that incorporates baselinehormone levels; AUCi is an alternative method that doesnot incorporate baseline hormone levels and thereforerepresents the change (ie, increase or decrease) in overallhormone secretion.
Urine free cortisol (UFC) excretion rate was obtained froman overnight urine collection, which is highly correlated witha 24-hour collection [30]. Subjects were instructed to voidbefore going to bed, collect any urine eliminated overnight,and collect the first morning void.
Urine free cortisol was measured using a modifiedradioimmunoassay (Coat-A-Count). Urine free cortisol con-centration, sleep duration, and volume of urine collected werethe components used to determine the UFC excretion rate(nanomoles per hour).
Cortisol reactivity cluster groupings were created usingthe K-means method [29,31] based on participants' serialserum cortisol measures in response to venipuncture [32,33].Cluster centers are chosen in a first pass of the data.Subsequent iterations grouped an observation based on thedistance to the mean, minimizing within-cluster varianceand maximizing variability between clusters [29,31]. The K-means method does not depend on the order of theobservations as do hierarchical cluster analyses methods.We anticipated 3 reactivity groupings based on previousliterature [32]. Participants were grouped into the following 3clusters based on their serial serum cortisol concentrations:(1) low concentration, stable; (2) moderate concentration,slightly increasing; and (3) high concentration, increasing.
2.2. Covariates
Tanner stage breast [34] was assessed by a trained medicalprofessional using inspection and palpation; 2 clinicianresearchers demonstrated 100% agreement on the Tannerstage in a nonrandom sample (n = 23). Socioeconomic status(SES) was determined using the Hollingshead Four-FactorIndex of Social Status, with a higher score corresponding tohigher SES [35]. Physical activity was assessed with thePhysical Activity Questionnaire for Older Children. Partici-pants recalled amount of moderate to vigorous activity overthe preceding 7 days. An average was used to create a scoreranging from 1 (low) to 5 (high) activity [36]. Use of hormonecontraceptives in the previous 2 weeks was ascertainedby interview.
2.3. Statistical analyses
Distributions were assessed for all primary variables andcovariates. Adiposity and HPA axis measures were allnormally distributed with the exception of UFC excretionrate. Thus, the log10 of the UFC excretion rate was used insubsequent analyses. Multiple linear regression was used toevaluate associations between adiposity and (a) integratedserum cortisol (AUCg, AUCi) and (b) log10 UFC excretion rate.Alongwith age, potential covariates were considered based onthe literature. Only significant covariates (P < .10) wereretained in the models. Analysis of variance was used toevaluate group differences in adiposity (BMI-Z) among the 3cortisol reactivity clusters.
3. Results
3.1. Participants
Two-hundred sixty-two girls were enrolled. Demographiccharacteristics are summarized in Table 1. Table 2 reportsdescriptive statistics for adiposity and HPA axis measures.
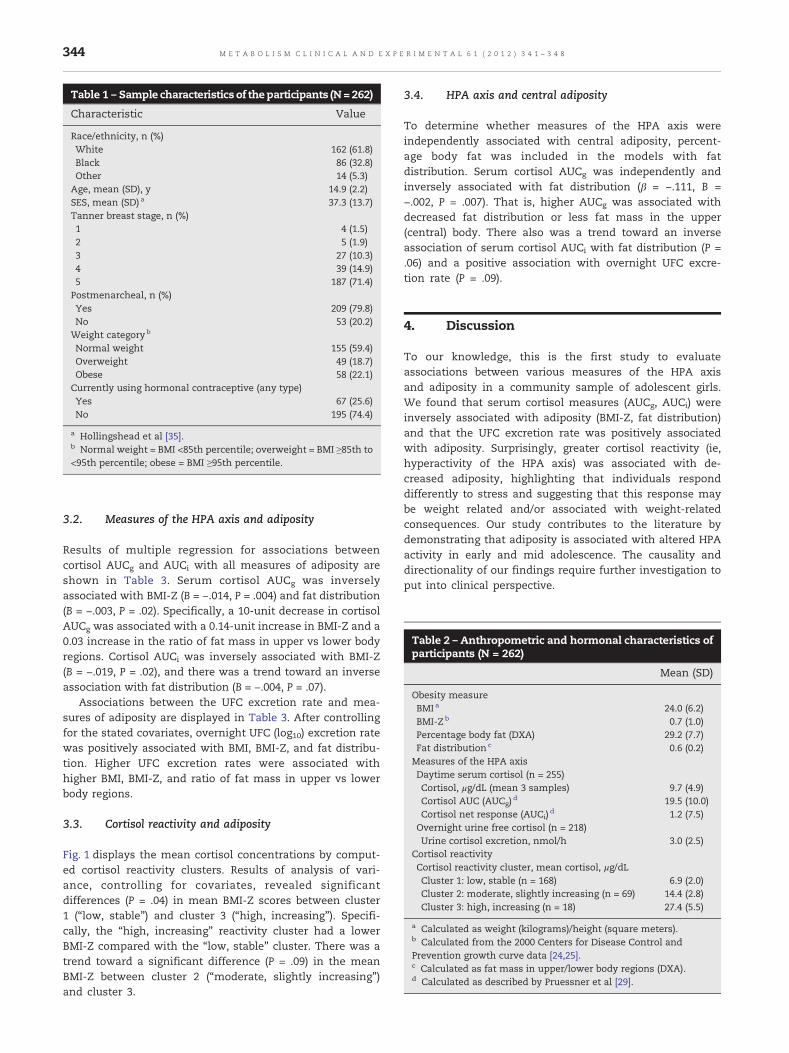
Table 2 – Anthropometric and hormonal characteristics ofparticipants (N = 262)
Mean (SD)
Obesity measureBMI a 24.0 (6.2)BMI-Z b 0.7 (1.0)Percentage body fat (DXA) 29.2 (7.7)Fat distribution c 0.6 (0.2)Measures of the HPA axisDaytime serum cortisol (n = 255)Cortisol, μg/dL (mean 3 samples) 9.7 (4.9)Cortisol AUC (AUCg) d 19.5 (10.0)Cortisol net response (AUCi) d 1.2 (7.5)
Overnight urine free cortisol (n = 218)Urine cortisol excretion, nmol/h 3.0 (2.5)
Cortisol reactivityCortisol reactivity cluster, mean cortisol, μg/dLCluster 1: low, stable (n = 168) 6.9 (2.0)Cluster 2: moderate, slightly increasing (n = 69) 14.4 (2.8)Cluster 3: high, increasing (n = 18) 27.4 (5.5)
a Calculated as weight (kilograms)/height (square meters).b Calculated from the 2000 Centers for Disease Control andPrevention growth curve data [24,25].c Calculated as fat mass in upper/lower body regions (DXA).d Calculated as described by Pruessner et al [29].
Table 1 – Sample characteristics of the participants (N= 262)
Characteristic Value
Race/ethnicity, n (%)White 162 (61.8)Black 86 (32.8)Other 14 (5.3)
Age, mean (SD), y 14.9 (2.2)SES, mean (SD) a 37.3 (13.7)Tanner breast stage, n (%)1 4 (1.5)2 5 (1.9)3 27 (10.3)4 39 (14.9)5 187 (71.4)
Postmenarcheal, n (%)Yes 209 (79.8)No 53 (20.2)
Weight categoryb
Normal weight 155 (59.4)Overweight 49 (18.7)Obese 58 (22.1)
Currently using hormonal contraceptive (any type)Yes 67 (25.6)No 195 (74.4)
a Hollingshead et al [35].b Normal weight = BMI <85th percentile; overweight = BMI ≥85th to<95th percentile; obese = BMI ≥95th percentile.
344 M E T A B O L I S M C L I N I C A L A N D E X P E R I M E N T A L 6 1 ( 2 0 1 2 ) 3 4 1 – 3 4 8
3.2. Measures of the HPA axis and adiposity
Results of multiple regression for associations betweencortisol AUCg and AUCi with all measures of adiposity areshown in Table 3. Serum cortisol AUCg was inverselyassociated with BMI-Z (B = −.014, P = .004) and fat distribution(B = −.003, P = .02). Specifically, a 10-unit decrease in cortisolAUCg was associated with a 0.14-unit increase in BMI-Z and a0.03 increase in the ratio of fat mass in upper vs lower bodyregions. Cortisol AUCi was inversely associated with BMI-Z(B = −.019, P = .02), and there was a trend toward an inverseassociation with fat distribution (B = −.004, P = .07).
Associations between the UFC excretion rate and mea-sures of adiposity are displayed in Table 3. After controllingfor the stated covariates, overnight UFC (log10) excretion ratewas positively associated with BMI, BMI-Z, and fat distribu-tion. Higher UFC excretion rates were associated withhigher BMI, BMI-Z, and ratio of fat mass in upper vs lowerbody regions.
3.3. Cortisol reactivity and adiposity
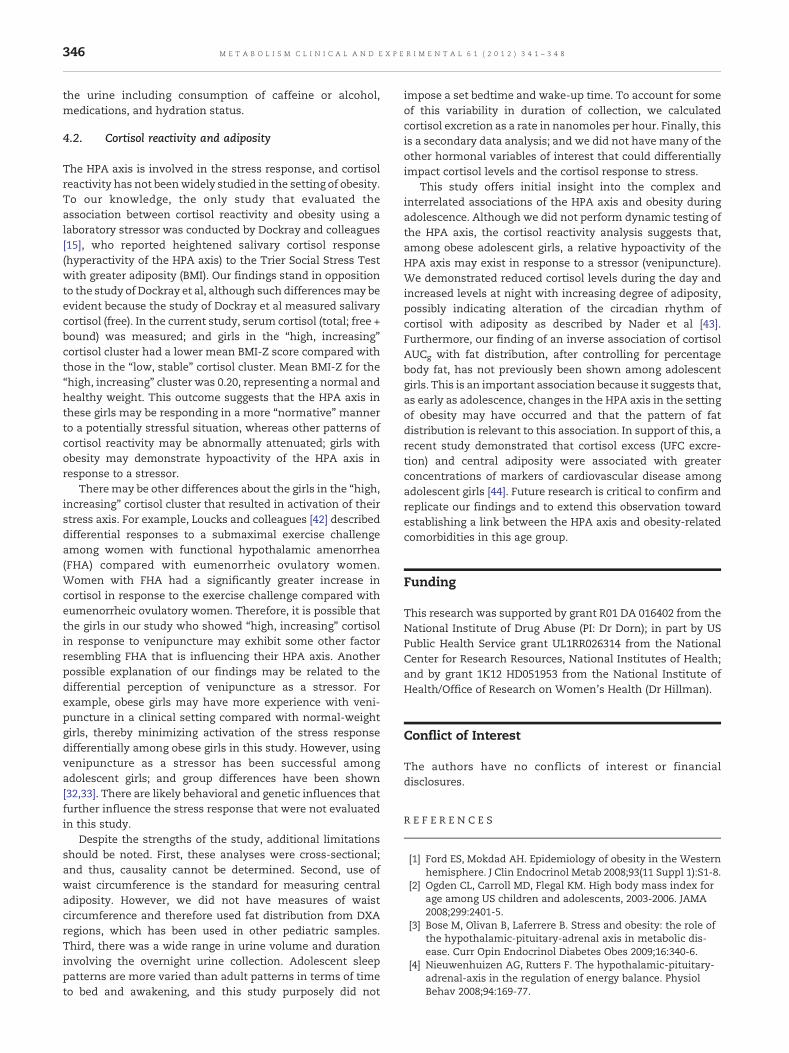
Fig. 1 displays the mean cortisol concentrations by comput-ed cortisol reactivity clusters. Results of analysis of vari-ance, controlling for covariates, revealed significantdifferences (P = .04) in mean BMI-Z scores between cluster1 (“low, stable”) and cluster 3 (“high, increasing”). Specifi-cally, the “high, increasing” reactivity cluster had a lowerBMI-Z compared with the “low, stable” cluster. There was atrend toward a significant difference (P = .09) in the meanBMI-Z between cluster 2 (“moderate, slightly increasing”)and cluster 3.
3.4. HPA axis and central adiposity
To determine whether measures of the HPA axis wereindependently associated with central adiposity, percent-age body fat was included in the models with fatdistribution. Serum cortisol AUCg was independently andinversely associated with fat distribution (β = −.111, B =−.002, P = .007). That is, higher AUCg was associated withdecreased fat distribution or less fat mass in the upper(central) body. There also was a trend toward an inverseassociation of serum cortisol AUCi with fat distribution (P =.06) and a positive association with overnight UFC excre-tion rate (P = .09).
4. Discussion
To our knowledge, this is the first study to evaluateassociations between various measures of the HPA axisand adiposity in a community sample of adolescent girls.We found that serum cortisol measures (AUCg, AUCi) wereinversely associated with adiposity (BMI-Z, fat distribution)and that the UFC excretion rate was positively associatedwith adiposity. Surprisingly, greater cortisol reactivity (ie,hyperactivity of the HPA axis) was associated with de-creased adiposity, highlighting that individuals responddifferently to stress and suggesting that this response maybe weight related and/or associated with weight-relatedconsequences. Our study contributes to the literature bydemonstrating that adiposity is associated with altered HPAactivity in early and mid adolescence. The causality anddirectionality of our findings require further investigation toput into clinical perspective.
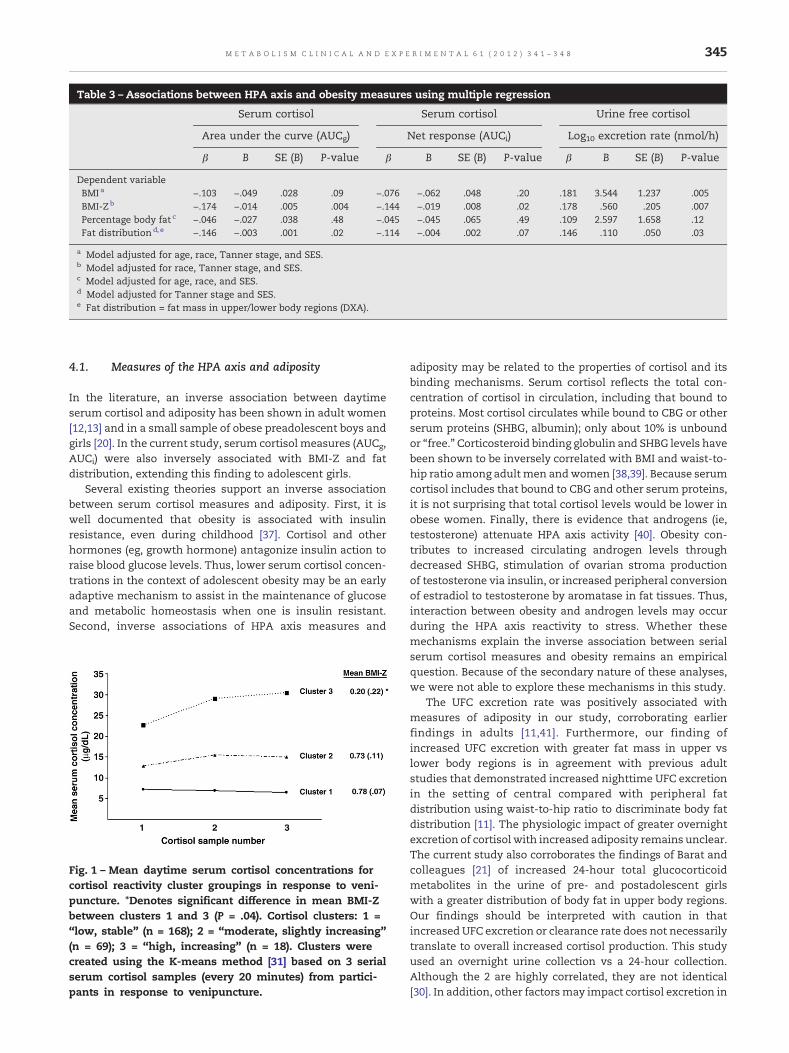
Table 3 – Associations between HPA axis and obesity measures using multiple regression
Serum cortisol Serum cortisol Urine free cortisol
Area under the curve (AUCg) Net response (AUCi) Log10 excretion rate (nmol/h)
β B SE (B) P-value β B SE (B) P-value β B SE (B) P-value
Dependent variableBMI a −.103 −.049 .028 .09 −.076 −.062 .048 .20 .181 3.544 1.237 .005BMI-Zb −.174 −.014 .005 .004 −.144 −.019 .008 .02 .178 .560 .205 .007Percentage body fat c −.046 −.027 .038 .48 −.045 −.045 .065 .49 .109 2.597 1.658 .12Fat distributiond, e −.146 −.003 .001 .02 −.114 −.004 .002 .07 .146 .110 .050 .03
a Model adjusted for age, race, Tanner stage, and SES.b Model adjusted for race, Tanner stage, and SES.c Model adjusted for age, race, and SES.d Model adjusted for Tanner stage and SES.e Fat distribution = fat mass in upper/lower body regions (DXA).
345M E T A B O L I S M C L I N I C A L A N D E X P E R I M E N T A L 6 1 ( 2 0 1 2 ) 3 4 1 – 3 4 8
4.1. Measures of the HPA axis and adiposity
In the literature, an inverse association between daytimeserum cortisol and adiposity has been shown in adult women[12,13] and in a small sample of obese preadolescent boys andgirls [20]. In the current study, serum cortisol measures (AUCg,AUCi) were also inversely associated with BMI-Z and fatdistribution, extending this finding to adolescent girls.
Several existing theories support an inverse associationbetween serum cortisol measures and adiposity. First, it iswell documented that obesity is associated with insulinresistance, even during childhood [37]. Cortisol and otherhormones (eg, growth hormone) antagonize insulin action toraise blood glucose levels. Thus, lower serum cortisol concen-trations in the context of adolescent obesity may be an earlyadaptive mechanism to assist in the maintenance of glucoseand metabolic homeostasis when one is insulin resistant.Second, inverse associations of HPA axis measures and
Fig. 1 – Mean daytime serum cortisol concentrations forcortisol reactivity cluster groupings in response to veni-puncture. ⁎Denotes significant difference in mean BMI-Zbetween clusters 1 and 3 (P = .04). Cortisol clusters: 1 =“low, stable” (n = 168); 2 = “moderate, slightly increasing”(n = 69); 3 = “high, increasing” (n = 18). Clusters werecreated using the K-means method [31] based on 3 serialserum cortisol samples (every 20 minutes) from partici-pants in response to venipuncture.
adiposity may be related to the properties of cortisol and itsbinding mechanisms. Serum cortisol reflects the total con-centration of cortisol in circulation, including that bound toproteins. Most cortisol circulates while bound to CBG or otherserum proteins (SHBG, albumin); only about 10% is unboundor “free.” Corticosteroid binding globulin and SHBG levels havebeen shown to be inversely correlated with BMI and waist-to-hip ratio among adult men andwomen [38,39]. Because serumcortisol includes that bound to CBG and other serum proteins,it is not surprising that total cortisol levels would be lower inobese women. Finally, there is evidence that androgens (ie,testosterone) attenuate HPA axis activity [40]. Obesity con-tributes to increased circulating androgen levels throughdecreased SHBG, stimulation of ovarian stroma productionof testosterone via insulin, or increased peripheral conversionof estradiol to testosterone by aromatase in fat tissues. Thus,interaction between obesity and androgen levels may occurduring the HPA axis reactivity to stress. Whether thesemechanisms explain the inverse association between serialserum cortisol measures and obesity remains an empiricalquestion. Because of the secondary nature of these analyses,we were not able to explore these mechanisms in this study.
The UFC excretion rate was positively associated withmeasures of adiposity in our study, corroborating earlierfindings in adults [11,41]. Furthermore, our finding ofincreased UFC excretion with greater fat mass in upper vslower body regions is in agreement with previous adultstudies that demonstrated increased nighttime UFC excretionin the setting of central compared with peripheral fatdistribution using waist-to-hip ratio to discriminate body fatdistribution [11]. The physiologic impact of greater overnightexcretion of cortisol with increased adiposity remains unclear.The current study also corroborates the findings of Barat andcolleagues [21] of increased 24-hour total glucocorticoidmetabolites in the urine of pre- and postadolescent girlswith a greater distribution of body fat in upper body regions.Our findings should be interpreted with caution in thatincreased UFC excretion or clearance rate does not necessarilytranslate to overall increased cortisol production. This studyused an overnight urine collection vs a 24-hour collection.Although the 2 are highly correlated, they are not identical[30]. In addition, other factorsmay impact cortisol excretion in
346 M E T A B O L I S M C L I N I C A L A N D E X P E R I M E N T A L 6 1 ( 2 0 1 2 ) 3 4 1 – 3 4 8
the urine including consumption of caffeine or alcohol,medications, and hydration status.
4.2. Cortisol reactivity and adiposity
The HPA axis is involved in the stress response, and cortisolreactivity has not beenwidely studied in the setting of obesity.To our knowledge, the only study that evaluated theassociation between cortisol reactivity and obesity using alaboratory stressor was conducted by Dockray and colleagues[15], who reported heightened salivary cortisol response(hyperactivity of the HPA axis) to the Trier Social Stress Testwith greater adiposity (BMI). Our findings stand in oppositionto the study of Dockray et al, although such differencesmay beevident because the study of Dockray et al measured salivarycortisol (free). In the current study, serum cortisol (total; free +bound) was measured; and girls in the “high, increasing”cortisol cluster had a lower mean BMI-Z score compared withthose in the “low, stable” cortisol cluster. Mean BMI-Z for the“high, increasing” cluster was 0.20, representing a normal andhealthy weight. This outcome suggests that the HPA axis inthese girls may be responding in a more “normative” mannerto a potentially stressful situation, whereas other patterns ofcortisol reactivity may be abnormally attenuated; girls withobesity may demonstrate hypoactivity of the HPA axis inresponse to a stressor.
Theremay be other differences about the girls in the “high,increasing” cortisol cluster that resulted in activation of theirstress axis. For example, Loucks and colleagues [42] describeddifferential responses to a submaximal exercise challengeamong women with functional hypothalamic amenorrhea(FHA) compared with eumenorrheic ovulatory women.Women with FHA had a significantly greater increase incortisol in response to the exercise challenge compared witheumenorrheic ovulatory women. Therefore, it is possible thatthe girls in our study who showed “high, increasing” cortisolin response to venipuncture may exhibit some other factorresembling FHA that is influencing their HPA axis. Anotherpossible explanation of our findings may be related to thedifferential perception of venipuncture as a stressor. Forexample, obese girls may have more experience with veni-puncture in a clinical setting compared with normal-weightgirls, thereby minimizing activation of the stress responsedifferentially among obese girls in this study. However, usingvenipuncture as a stressor has been successful amongadolescent girls; and group differences have been shown[32,33]. There are likely behavioral and genetic influences thatfurther influence the stress response that were not evaluatedin this study.
Despite the strengths of the study, additional limitationsshould be noted. First, these analyses were cross-sectional;and thus, causality cannot be determined. Second, use ofwaist circumference is the standard for measuring centraladiposity. However, we did not have measures of waistcircumference and therefore used fat distribution from DXAregions, which has been used in other pediatric samples.Third, there was a wide range in urine volume and durationinvolving the overnight urine collection. Adolescent sleeppatterns are more varied than adult patterns in terms of timeto bed and awakening, and this study purposely did not
impose a set bedtime and wake-up time. To account for someof this variability in duration of collection, we calculatedcortisol excretion as a rate in nanomoles per hour. Finally, thisis a secondary data analysis; and we did not have many of theother hormonal variables of interest that could differentiallyimpact cortisol levels and the cortisol response to stress.
This study offers initial insight into the complex andinterrelated associations of the HPA axis and obesity duringadolescence. Although we did not perform dynamic testing ofthe HPA axis, the cortisol reactivity analysis suggests that,among obese adolescent girls, a relative hypoactivity of theHPA axis may exist in response to a stressor (venipuncture).We demonstrated reduced cortisol levels during the day andincreased levels at night with increasing degree of adiposity,possibly indicating alteration of the circadian rhythm ofcortisol with adiposity as described by Nader et al [43].Furthermore, our finding of an inverse association of cortisolAUCg with fat distribution, after controlling for percentagebody fat, has not previously been shown among adolescentgirls. This is an important association because it suggests that,as early as adolescence, changes in the HPA axis in the settingof obesity may have occurred and that the pattern of fatdistribution is relevant to this association. In support of this, arecent study demonstrated that cortisol excess (UFC excre-tion) and central adiposity were associated with greaterconcentrations of markers of cardiovascular disease amongadolescent girls [44]. Future research is critical to confirm andreplicate our findings and to extend this observation towardestablishing a link between the HPA axis and obesity-relatedcomorbidities in this age group.
Funding
This research was supported by grant R01 DA 016402 from theNational Institute of Drug Abuse (PI: Dr Dorn); in part by USPublic Health Service grant UL1RR026314 from the NationalCenter for Research Resources, National Institutes of Health;and by grant 1K12 HD051953 from the National Institute ofHealth/Office of Research on Women's Health (Dr Hillman).
Conflict of Interest
The authors have no conflicts of interest or financialdisclosures.
R E F E R E N C E S
[1] Ford ES, Mokdad AH. Epidemiology of obesity in the Westernhemisphere. J Clin Endocrinol Metab 2008;93(11 Suppl 1):S1-8.
[2] Ogden CL, Carroll MD, Flegal KM. High body mass index forage among US children and adolescents, 2003-2006. JAMA2008;299:2401-5.
[3] Bose M, Olivan B, Laferrere B. Stress and obesity: the role ofthe hypothalamic-pituitary-adrenal axis in metabolic dis-ease. Curr Opin Endocrinol Diabetes Obes 2009;16:340-6.
[4] Nieuwenhuizen AG, Rutters F. The hypothalamic-pituitary-adrenal-axis in the regulation of energy balance. PhysiolBehav 2008;94:169-77.
347M E T A B O L I S M C L I N I C A L A N D E X P E R I M E N T A L 6 1 ( 2 0 1 2 ) 3 4 1 – 3 4 8
[5] Bjorntorp P, Rosmond R. Neuroendocrine abnormalities invisceral obesity. Int J Obes 2000;24:S80-5.
[6] Korbonits M, Trainer PJ, Nelson ML, Howse I, Kopelman PG,Besser GM, et al. Differential stimulation of cortisol anddehydroepiandrosterone levels by food in obese and normalsubjects: relation to body fat distribution. Clin Endocrinol(Oxf) 1996;45:699-706.
[7] Duclos M, Gatta B, Corcuff JB, Rashedi M, Pehourcq F, Roger P.Fat distribution in obese women is associated with subtlealterations of the hypothalamic-pituitary-adrenal axis activ-ity and sensitivity to glucocorticoids. Clin Endocrinol (Oxf)2001;55:447-54.
[8] Tataranni PA, Larson DE, Snitker S, Young JB, Flatt JP,Ravussin E. Effects of glucocorticoids on energy metabolismand food intake in humans. Am J Physiol 1996 Aug;271(2 Pt 1):E317-25.
[9] Cakir M, Sari R, Tosun O, Karayalcin U. Cortisol levels duringan oral glucose tolerance test in lean and obese women.Endocr Res 2005;31:213-8.
[10] Steptoe A, Kunz-Ebrecht SR, Brydon L, Wardle J. Centraladiposity and cortisol responses to waking in middle-agedmen and women. Int J Obes Relat Metab Disord 2004;28:1168-73.
[11] Duclos M, Corcuff JB, Etcheverry N, Rashedi M, Tabarin A,Roger P. Abdominal obesity increases overnight cortisolexcretion. J Endocrinol Invest 1999;22:465-71.
[12] Marin P, Darin N, Amemiya T, Andersson B, Jern S,Bjorntorp P. Cortisol secretion in relation to body fatdistribution in obese premenopausal women. Metabolism1992;41:882-6.
[13] Strain GW, Zumoff B, Kream J, Strain JJ, Levin J, FukushimaD. Sex difference in the influence of obesity on the 24 hrmean plasma concentration of cortisol. Metabolism1982;31:209-12.
[14] Strain GW, Zumoff B, Strain JJ, Levin J, Fukushima DK. Cortisolproduction in obesity. Metabolism 1980;29:980-5.
[15] Dockray S, Susman EJ, Dorn LD.Depression, cortisol reactivity,and obesity in childhood and adolescence. J Adolesc Health2009;45:344-50.
[16] Bjorntorp P. Visceral fat accumulation: the missing linkbetween psychosocial factors and cardiovascular disease?J Intern Med 1991;230:195-201.
[17] Duclos M, Marquez Pereira P, Barat P, Gatta B, Roger P.Increased cortisol bioavailability, abdominal obesity, and themetabolic syndrome in obese women. Obes Res 2005;13:1157-66.
[18] Epel ES, McEwen B, Seeman T, Matthews K, Castellazzo G,Brownell KD, et al. Stress and body shape: stress-inducedcortisol secretion is consistently greater among women withcentral fat. Psychosom Med 2000;62:623-32.
[19] Koch FS, Sepa A, Ludvigsson J. Psychological stress andobesity. J Pediatr 2008;153:839-44.
[20] Chalew SA, Lozano RA, Armour KM, Zadik Z, Kowarski AA.Reduction of plasma cortisol levels in childhood obesity.J Pediatr 1991;119:778-80.
[21] Barat P, Gayard-Cros M, Andrew R, Corcuff JB, Jouret B, BartheN, et al. Truncal distribution of fat mass, metabolic profileand hypothalamic-pituitary adrenal axis activity in prepu-bertal obese children. J Pediatr. 2007 May;150:535-9, 9 e1.
[22] Dorn LD, Susman EJ, Pabst S, Huang B, Kalkwarf H, Grimes S.Association of depressive symptoms and anxiety with bonemass and density in ever-smoking and never-smokingadolescent girls. Arch Pediatr Adolesc Med 2008;162:1181-8.
[23] Ogden CL, Kuczmarski RJ, Flegal KM, Mei Z, Guo S,Wei R, et al.Centers for Disease Control and Prevention 2000 growthcharts for the United States: improvements to the 1977National Center for Health Statistics version. Pediatrics2002;109:45-60.
[24] Kuczmarski RJ, Ogden CL, Grummer-Strawn LM, Flegal KM,Guo SS, Wei R, et al. CDC growth charts: United States. AdvData 2000;8:1-27.
[25] Kuczmarski RJ, Ogden CL, Guo SS, Grummer-Strawn LM,Flegal KM, Mei Z, et al. 2000 CDC growth charts for the UnitedStates: methods and development. Vital Health Stat 11 2002:1-190.
[26] Walton C, Lees B, Crook D, Worthington M, Godsland IF,Stevenson JC. Body fat distribution, rather than overalladiposity, influences serum lipids and lipoproteins in healthymen independently of age. Am J Med 1995;99:459-64.
[27] Daniels SR, Morrison JA, Sprecher DL, Khoury P, Kimball TR.Association of body fat distribution and cardiovascular riskfactors in children and adolescents. Circulation 1999;99:541-5.
[28] Hillman JB, Dorn LD, Bin H. Association of anxiety anddepressive symptoms and adiposity among adolescentfemales, using dual energy X-ray absorptiometry. Clin Pediatr(Phila) 2010;49:671-7.
[29] Pruessner JC, KirschbaumC,Meinlschmid G, Hellhammer DH.Two formulas for computation of the area under the curverepresent measures of total hormone concentration versustime-dependent change. Psychoneuroendocrinology 2003;28:916-31.
[30] Corcuff JB, Tabarin A, Rashedi M, Duclos M, Roger P, DucassouD. Overnight urinary free cortisol determination: a screeningtest for the diagnosis of Cushing's syndrome. Clin Endocrinol(Oxf) 1998;48:503-8.
[31] Romesburg C. Cluster analysis for researchers: Lulu.com;2004.
[32] Susman EJ, Dorn LD, Inoff-Germain G, Nottelmann ED,Chrousos GP. Cortisol reactivity, distress behavior, andbehavioral and psychological problems in young adoles-cents: a longitudinal perspective. J Res Adolesc 1997;7:81-105.
[33] Sontag LM, Dorn LD, Tissot A, Susman EJ, Beers S, Rose S.Executive functioning, cortisol reactivity, and symptoms ofpsychopathology in girls with premature adrenarche. Devel-opment and Psychopathology. In press.
[34] Marshall WA, Tanner JM. Variations in pattern of pubertalchanges in girls. Arch Dis Child 1969;44:291-303.
[35] Hollingshead AB. Four-factor index of social status. NewHaven: Yale University CT Press; 1975.
[36] Crocker PR, Bailey DA, Faulkner RA, Kowalski KC, McGrath R.Measuring general levels of physical activity: preliminaryevidence for the Physical Activity Questionnaire for OlderChildren. Med Sci Sports Exerc 1997;29:1344-9.
[37] Sinha R, Fisch G, Teague B, Tamborlane WV, Banyas B, AllenK, et al. Prevalence of impaired glucose tolerance amongchildren and adolescents with marked obesity. N Engl J Med2002;346:802-10.
[38] Fernandez-Real JM, Pugeat M, Grasa M, Broch M, Vendrell J,Brun J, et al. Serum corticosteroid-binding globulin concen-tration and insulin resistance syndrome: a population study.J Clin Endocrinol Metab 2002;87:4686-90.
[39] Pasquali R, Casimirri F, Plate L, Capelli M. Characterization ofobese women with reduced sex hormone–binding globulinconcentrations. Horm Metab Res 1990;22:303-6.
[40] Hermans EJ, Putman P, Baas JM, Gecks NM, Kenemans JL, vanHonk J. Exogenous testosterone attenuates the integratedcentral stress response in healthy young women. Psycho-neuroendocrinology 2007;32:1052-61.
[41] Pasquali R, Cantobelli S, Casimirri F, Capelli M, Bortoluzzi L,Flamia R, et al. The hypothalamic-pituitary-adrenal axis inobese women with different patterns of body fat distribution.J Clin Endocrinol Metab 1993;77:341-6.
[42] Loucks T, Dube J, Laychak K, Robertson R, Berga S. Metabolicand endocrine responses to submaximal exercise challengein women with functional hypothalamic amenorrhea (FHA).

348 M E T A B O L I S M C L I N I C A L A N D E X P E R I M E N T A L 6 1 ( 2 0 1 2 ) 3 4 1 – 3 4 8
Presented at the 51st Annual Meeting of the Society forGynecologic Investigation; 2004.
[43] Nader N, Chrousos GP, Kino T. Interactions of the circadianCLOCK system and the HPA axis. Trends Endocrinol Metab2010;21:277-86.
[44] Russell M, Bredella M, Tsai P, Mendes N, Miller KK, KlibanskiA, et al. Relative growth hormone deficiency and cortisolexcess are associated with increased cardiovascular riskmarkers in obese adolescent girls. J Clin Endocrinol Metab2009;94:2864-71.