nyc cso flow monitoring project newtown creek · pdf file06/02/2014 · nyc cso flow...
TRANSCRIPT

NYC CSO Flow Monitoring Project Newtown Creek
Newtown Creek CAG
February 6, 2014

2
Newtown Creek Catchment Area
3.5 mile long urban tributary to East River
Contains four major tributaries
Bulk headed and channelized
No Natural Surface Freshwater Flow
Watershed is approximately 10,741 acres
Land use in immediate vicinity of Newtown Creek is generally dominated by heavy industry, manufacturing, transportation, and utilities
Newtown Creek WWTP wet expansion to 700 MGD – reduces CSO into NC by 150 MGY
3
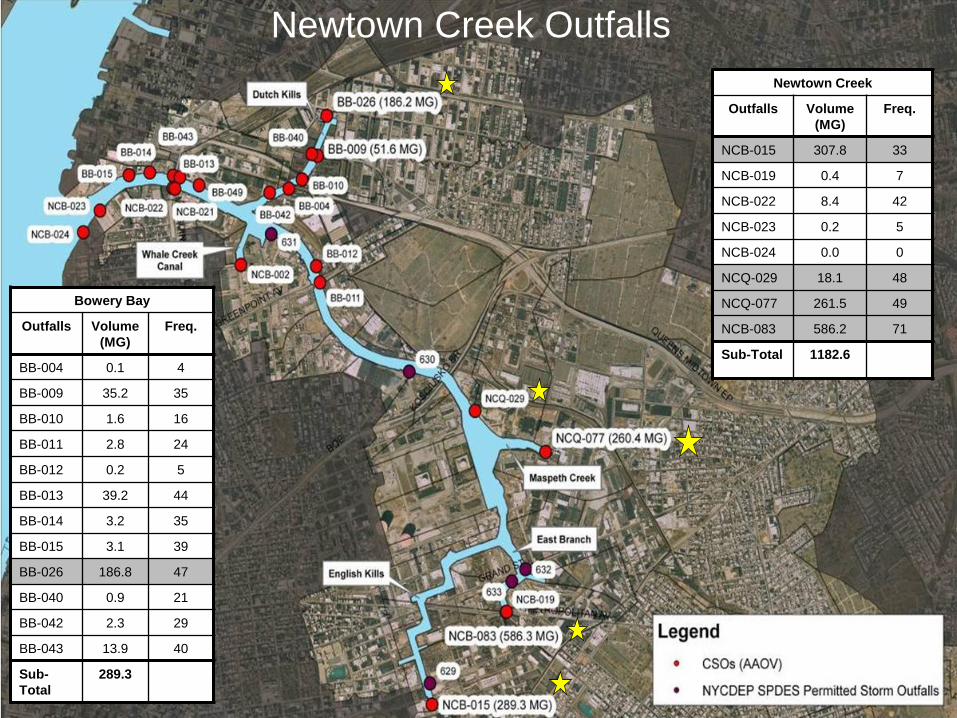
Bowery Bay
Outfalls Volume (MG)
Freq.
BB-004 0.1 4
BB-009 35.2 35
BB-010 1.6 16
BB-011 2.8 24
BB-012 0.2 5
BB-013 39.2 44
BB-014 3.2 35
BB-015 3.1 39
BB-026 186.8 47
BB-040 0.9 21
BB-042 2.3 29
BB-043 13.9 40
Sub-Total
289.3
Newtown Creek
Outfalls Volume (MG)
Freq.
NCB-015 307.8 33
NCB-019 0.4 7
NCB-022 8.4 42
NCB-023 0.2 5
NCB-024 0.0 0
NCQ-029 18.1 48
NCQ-077 261.5 49
NCB-083 586.2 71
Sub-Total 1182.6
Newtown Creek Outfalls

4
Simplified Schematic of Regulator
Dry Weather Flow to WTP
Overflow to Waterway
Simple Regulator
M1
M2
M3
DEP Ultrasonic Sensor - DEP Float Switch – DEP Conductivity Probe – ADS Influent Meter - ADS Tide Gate Trigger Sensor - ADS Outfall Meter -
M1
M2 M3

5
FlowShark Triton Flow Meter from ADS
• Battery power ~8 months • Sensors set for 2 min readings • 2 sensor channels per Triton x 3
parameters per sensor • Up to 6 individual parameters per
meter

6
Weir Cam Installation
Gas Sensor
Power cable to meter
Weir Cam

7
Data Verification
How accurately can we… Determine if CSO occurred Duration Quantity
Preliminary Data Preliminary DataMethod 1 Method 2
Event 1Event 2Event 3
Final Data Modeling SCADA Rain Gages Plant Flows
ADS Data Analysis NYCDEP Data AnalysisDate/Time
NYCDEP Data Analysis • Hydraulic model comparison • SCADA data comparison • Rain data comparison • Plant Flows
ADS Data Analysis • Field calibration of all sensors • Scattergraph analysis • Q vs. i for incoming flow

8
Preliminary Results
• BB026 was included in a pilot project for CSO flow monitoring
• Data collection began in October 2012 and will continue along with the additional four outfalls that DEP is currently installing flow monitoring systems in
• Preliminary results based on one year of data collection show that the model of the BB026 drainage area conservatively predicts 40% greater volume of CSO at this outfall compared to the end of pipe metering system
• NYCDEP is in the process of refining the hydraulic models based on the data collected to date to better align with the flow monitoring data
# Events HoursVolume
(MG)# Events Hours
Volume (MG)
BB-026 40 204 114 39 198 160
ADS Final Data NYCDEP Modeling Results
October 2012 - September 2013 Comparative Data Analysis
Site

9
Preliminary Flow Monitoring Schedule
Complete Installation: Feb 28, 2014 Start-up/Test Period: March 2014
Data Collection: Apr 2014 – Apr 2015

10
Development of a LTCP
DEP will develop a CSO LTCP by June 2017 per the existing administrative consent order Scope of work will cover the following: Additional characterization of the waterbody
Robust public participation
Determining the future “Highest Attainable Use” of waterbody per EPA CSO policy (sets the LTCP endpoint)
Evaluate Additional CSO Controls (Grey & Green) to achieve Highest Attainable Water Quality Use