nutritional control of gene expression larval … · nutritional control of gene expression, larval...
TRANSCRIPT
NUTRITIONAL CONTROL OF GENE EXPRESSION, LARVAL DEVELOPMENT AND PHYSIOLOGY IN FISH
Guillaume Salze
Dissertation submitted to the faculty of the Virginia Polytechnic Institute and State University in partial fulfillment of the requirements for the degree of
Doctor of Philosophy
In Biomedical & Veterinary Sciences
Ewen McLean, co‐chair Steven R. Craig, co‐chair
Eric M. Hallerman Johanna C. Craig
Michael H. Schwarz
12th of September 2008 Blacksburg, Virginia
Keywords: Aquaculture; Cobia; Rachycentron canadum; Sustainability; Fish meal and fish oil
replacement; Larvae; Enzyme; Ontogeny; Microarray;
Copyright, 2008, Guillaume Salze
NUTR I T I ONAL CONTROL OF GENE
EXPRES S I ON , LARVAL DEVELOPMENT AND
PHYS IOLOGY I N F I SH
Guillaume Salze GENERAL ABSTRACT
During preliminary research on cobia (Rachycentron canadum, L.) it became increasingly
clear that more in‐depth information was required to provide enabling techniques for the cobia
aquaculture industry to develop more rapidly. A unifying theme in many of the more important
issues facing cobia aquaculture is nutrition. This led to nutritional investigations with larval and
juvenile fish highlighting the impacts of dietary ingredients on animal performance. Indeed,
nutrition can be viewed as a central lever of action through which many aspects of the
physiology and the environmental (water) quality of the animal can be controlled.
ii
The first project focused on studying the larval development of cobia, a fish species highly
suitable for aquaculture for which the industry is nascent. I described the time‐course of
development of external sensory organs, gut morphology and relevant digestive enzymes under
controlled conditions using electron microscopy, histology and spectrophotometric assays. The
developmental sequence of larval cobia could be separated in two phases, with a transition
iii
period between 12 and 14 days post hatch (dph). This transition is characterized by the
formation of the intestinal loop, the establishment of basic cranial neuromast configuration,
leading to the initiation of the onset of pancreatic enzymes and the increase of growth rate. In
addition, the effects of dietary taurine supplementation and incorporation of mannan
oligosaccharides (MOS) into live feeds on cobia larvae development was examined. Fish fed
supplementary MOS did not grow faster but displayed higher microvilli length and density. In
addition, MOS‐fed fish were more resistant to salinity stress. The dietary supplementation of
taurine resulted in a dramatic increase in survival, growth and development rates, and
enzymatic activities.
The second project aimed at refining cobia juvenile nutrition, assessing fish meal and fish oil
replacements. Novel sources, including soy protein and oil, were investigated with and without
amino acid and MOS supplementations, yielding promising results. Indeed, both fish meal and
fish oil were replaced completely and successfully in feeds for juvenile cobia. In addition, novel
ingredients (e.g. marine algae meals and soy protein concentrate) were identified to effectively
achieve such replacement.
The third and last project dealt with nutrient‐gene interactions, specifically centering
attention on immunostimulants for which the underlying mechanisms of action remain poorly
characterized. Here, dietary MOS, nucleotides and selenomethionine (Se‐met) were offered to
zebrafish whose transcriptome was analyzed by microarray. The immune system, humoral or
cellular, innate or adaptive, exhibited different patterns of response according to the
immunostimulating nutrient used. In addition, various genes involved in cell cycle and
iv
cytokinesis were concomitantly expressed. An intriguing observation related to the
insulinomimetic effect of Se‐met. In other words, Se‐met impacted pathways normally
regulated by insulin, such as the MAPK and PI3K pathways. Some Insulin‐like Growth Factors
(IGF) and IGF bindgin proteins were up‐regulated. Additional research is however necessary
prior to advocating for the use of these additives, in order to further investigate their respective
pros and cons.
v
CONTROL NUTR I T I ONNEL DE
L ’ E XPRES S I ON GENET IQUE , DU
DEVELOPPEMENT LARVA I RE , ET DE LA
PHYS I O LOG I E CHEZ LE S PO I SONS
Guillaume Salze RESUME GENERAL
Au court des études préliminaires sur le cobia (Rachycentron canadum, L.), il est clairement
apparut que des informations approfondies permettant un développement commercial plus
rapide de l’élevage de ce poisson était indispensables. Le dénominateur commun des
problèmes que rencontre la culture du cobia est la nutrition, ce qui a conduit à des études
nutritionnelles sur les larves et les juvéniles. Ces études ont mis en évidence le rôle
prédominant des ingrédients sur les performances de l’animal. En effet, la nutrition peut être
considérée comme un levier central permettant de contrôler beaucoup d’aspects
physiologiques ainsi que la qualité de l’environnement (qualité de l’eau).
Le premier volet de la présente thèse porte sur le développement larvaire du cobia, une
espèce particulièrement adaptée à l’élevage et pour laquelle la culture à l’échelle commerciale
vi
est émergente. En utilisant des techniques de microscopie électronique, d’histologie et de
spectrophotométrie kinétique, la séquence de développement des organes sensoriels externes
a été décrite, avec celles de la morphologie gastro‐intestinale et de quelques enzymes
digestives importantes. Chez cette espèce, la séquence de développement peut être divisée en
deux phases, avec une période de transition entre 12 et 14 jours‐post‐éclosion. Cette transition
est caractérisée par la formation de la boucle intestinale, l’établissement de la configuration
générale des neuromastes, ainsi qu’une augmentation notable du taux de croissance et de
l’activité des enzymes pancréatiques. Par ailleurs, les effets de la supplémentation des proies
vivantes en taurine ou mannane‐oligosides (MOS) sur le développement des larves de cobia ont
été examinés. Les larves recevant une supplémentation en MOS ne grossissent pas plus
rapidement, mais présentent des microvillosités plus hautes et plus denses sur l’épithélium
digestif. De plus, ces larves montrent une résistance accrue à un stress hypersalin. La
supplémentation en taurine des proies vivantes permet une élévation considérable des taux
de croissance et de développement, une nette amélioration de la survie, ainsi qu’une forte
augmentation des activités enzymatiques.
Le but du second volet était d’optimiser la formulation d’un aliment pour des juvéniles de
cobia, en se concentrant sur le remplacement de la farine et de l’huile de poisson. Des sources
nouvelles, telles que des protéines et des huiles de soja, ont été testées avec ou sans addition
de MOS ou d’acide aminés, et ont donné des résultats prometteurs. D’autre part, de nouveaux
ingrédients (concentré de protéine de soja et micro‐algues séchées) ont été identifiés et ont
permis le remplacement total et simultané de la farine et l’huile de poisson dans un aliment
pour cobia.
vii
Le troisième et dernier volet concerne l’interaction entre nutriments et gènes, et plus
particulièrement sur les ingrédients immunostimulants, dont les mécanismes d’action
demeurent mal compris. Ici, des poissons‐zèbres (Danio rerio) ont été nourris avec une addition
de MOS, nucléotides, ou selenomethionine (Se‐met) pendant plusieurs semaines, à l’issue
desquelles leur transcriptome a été analysé avec une puce ADN. Selon le régime alimentaire
testé, des profiles d’expression différents apparaissent au niveau du système immunitaire –
aussi bien humoral que cellulaire, spécifique que non‐spécifique. Dans le même temps,
plusieurs gènes impliqués dans le mouvement et le cycle cellulaire sont exprimés. Le rôle
insulino‐mimétique de la Se‐met est intriguant. En d’autres termes, des cascades de gènes
normalement régulées par l’insuline, telles que les cascades MAPK et PI3K, se comportent
différemment avec ou sans addition de Se‐met. L’expression de gènes tels qu’IGF (insulin‐like
growth factor) et IGFbp (IGF binding protein) est aussi stimulée par la prise alimentaire de Se‐
met. De plus amples recherches pour mieux déterminer les avantages et inconvénients de ces
suppléments alimentaires sont toutefois nécessaires avant de conseiller ou non leur utilisation
régulière.

viii
Dedication
I dedicate this dissertation to my wife, Haruka, and my parents, Philippe and Brigitte, who always have given me unconditional love and support.

ix
Acknowledgments My time here at the Virginia Tech Aquaculture program has been rich in unique
experiences, teachings, and surprises. I could not have completed my degree without the help of many, through good and not‐so‐good moments.
First I would like to address my warmest thanks to my advising committee for their
guidance and support throughout my program: Drs. Hallerman, Johanna Craig, and Schwarz. However, I would like to most especialy thank my two co‐advisors, Drs. McLean and Craig. Not only have I learned so much from a scientific perspective, but also from a human and personal point of view. I feel like I have grown next to you, and I cannot thank you enough for this.
Many people also supported me during difficult times when uncertainty was drawing upon
my degree. I am grateful to Dr. DePauw for backing me up during those times, and to Dr. Hodgson, Dr. Eyestone and Dr. Wong for helping me going through the last few steps.
Naturally, none of this research could have been possible without the financial aid from Sea
Grant Virginia, Alltech Inc. and the U.S. Soybean Board. I am thankful for their support, as well as giving me the opportunity to work with novel and exciting materials. Likewise, I am grateful to the Fisheries and Wildlife Sciences department for their financial suppost and for welcoming me in the Aquaculture Center all along of my program.
Graduate school is not only about gaining academic knowledge: issues inevitably come
along the way, as various as they are numerous. I would like to thank the staff and faculty from both Large Animal Clinical Sciences department and Fisheries and Wildlife Sciences department for their help and support. Particularly, I am grateful to Rob Woods his help with taking care of the fish, and Kathy Lowe for teaching me histology and electronic microscopy techniques. Finally, I am most grateful to Becky Jones, who helped me dodge the last obstacles in the way.
Last but not least, graduate school is also about friends and sharing with other students,
FIWers and others, who made it all so much easier and fun. Thank you all!
x
TABLE OF CONTENT
Chapter I. General introduction ......................................................................................... 1
Chapter II. Development of the larval cobia gut ................................................................ 9
Introduction ........................................................................................................................ 10
Material and methods ........................................................................................................ 12
Results ................................................................................................................................. 16
Discussion............................................................................................................................ 20
Chapter III. Dietary taurine enhances growth and digestive enzyme activities in larval
cobia ................................................................................................................ 27
Introduction ........................................................................................................................ 28
Material and methods ........................................................................................................ 30
Results ................................................................................................................................. 37
Discussion............................................................................................................................ 41
Chapter IV. Morphological development of larval cobia ................................................... 51
Introduction ........................................................................................................................ 52
Materials & methods .......................................................................................................... 54
Results ................................................................................................................................. 59
Discussion............................................................................................................................ 66
Chapter V. Dietary mannan oligosaccharide enhances salinity tolerance and gut
development of larval cobia ........................................................................... 79
Introduction ........................................................................................................................ 80
Materials and methods ....................................................................................................... 81
xi
Results ................................................................................................................................. 85
Discussion............................................................................................................................ 87
Chapter VI. Replacement of fish oil with novel sources of n‐3 highly unsaturated fatty
acids in aquafeeds for juvenile cobia .............................................................. 96
Introduction ........................................................................................................................ 97
Materials and methods ..................................................................................................... 101
Results ............................................................................................................................... 105
Discussion.......................................................................................................................... 112
Chapter VII. Total replacement of dietary fish meal in cobia juvenile ............................. 122
Introduction ...................................................................................................................... 123
Materials and methods ..................................................................................................... 125
Results ............................................................................................................................... 132
Discussion.......................................................................................................................... 136
Chapter VIII. Expression of immune‐relevant genes in a cyprinid following feeding with a
mannan oligosaccharide ............................................................................... 143
Introduction ...................................................................................................................... 144
Materials and methods ..................................................................................................... 146
Results ............................................................................................................................... 151
Discussion.......................................................................................................................... 153
Chapter IX. Gene expression profiling of zebrafish fed diets containing high levels of
nucleotides .................................................................................................... 164
Introduction ...................................................................................................................... 165
Materials and methods ..................................................................................................... 166
Results and Discussion ...................................................................................................... 170
Chapter X. Microarray evaluation of the response of zebrafish to dietary
selenomethionine ......................................................................................... 181
xii
Introduction ...................................................................................................................... 182
Materials and Methods ..................................................................................................... 185
Results ............................................................................................................................... 189
Discussion.......................................................................................................................... 193
Chapter XI. General conclusions ...................................................................................... 209
Larval development .......................................................................................................... 209
Alternative protein and lipid sources ............................................................................... 211
Nutritional gene expression profiling ............................................................................... 213
Chapter XII. Appendix ....................................................................................................... 217
Histology and microscopy ................................................................................................. 217
Enzyme assays ................................................................................................................... 236
xiii
F IGURES , PLATES AND TABLES
Figures Figure I–1: Nutrition as a central lever of action ...................................................................... 2
Figure II–1: Diagram of the standard feeding strategy for larval cobia .................................. 14
Figure II–2: Diagram describing the morphological changes of larval cobia gastrointestinal
tract though development. ........................................................................................................... 19
Figure III–1: Growth curve of control (dashed line) and taurine‐fed (solid line) cobia larvae
and outline diagram summarizing feeding strategy. .................................................................... 33
Figure III–2: Taurine enrichment of live prey items ............................................................... 38
Figure III–3: Digestive enzyme activities in cobia larvae. ....................................................... 40
Figure IV–1: Histogram depicting growth of control and taurine‐fed fish throughout the trial
....................................................................................................................................................... 59
Figure IV–2: Plot of normal densities of the canonical variate calculated for morphological
analysis. ......................................................................................................................................... 63
Figure VI–1: n‐3 polyunsaturated fatty acid pathway .......................................................... 100
Figure VI–2: Percentage of total lipid in juvenile cobia livers at the end of the trial. .......... 109
Figure VIII–1: Diagram of the zebrafish recirculating life support system ........................... 147
Figure VIII–2: Growth of control‐ and mannan oligosaccharide‐fed zebrafish .................... 152
Figure VIII–3: Relationship between IL‐13α2, inflammation, and apoptosis ....................... 155
Figure X–1: Mean growth of control and Se‐fed zebrafish over the 9‐week trial ................ 190
xiv
Plates Plate II–1: Longitudinal sections of cobia larvae. Stained with toluidine blue O,
counterstained with safranin O. ................................................................................................... 18
Plate IV–1: Position of the points used for morphological analysis ....................................... 58
Plate IV–2: Overlay of a 27‐dph taurine‐fed larvae and an adult skull. .................................. 58
Plate IV–3: Scanning electron micrographs of CF cobia larvae illustrating cranial
development and changes in jaw and opercular structures. ....................................................... 61
Plate IV–4: Scanning electron micrographs of cobia larvae illustrating morphological
development. ................................................................................................................................ 62
Plate IV–5: Scanning electron micrographs of control larvae: gills, mouth, and skin ............ 67
Plate IV–6: Summary diagram of the cranial canal systems in cobia larvae .......................... 68
Plate V–1: Representative electron micrographs of enterocytes of the anterior intestine of
8‐dph cobia larvae ........................................................................................................................ 87
Plate V–2: Scanning electron micrograph of larval cobia at 4 dph illustrating lower jaw
deformity. ..................................................................................................................................... 88
Plate X–1: Mid‐intestine cross sections of control and nucleotide‐fed zebrafish ................ 175
Plate XI–1: Representative mid‐intestine cross section of control‐fed and Selenomethionine‐
fed zebrafish................................................................................................................................ 197
xv
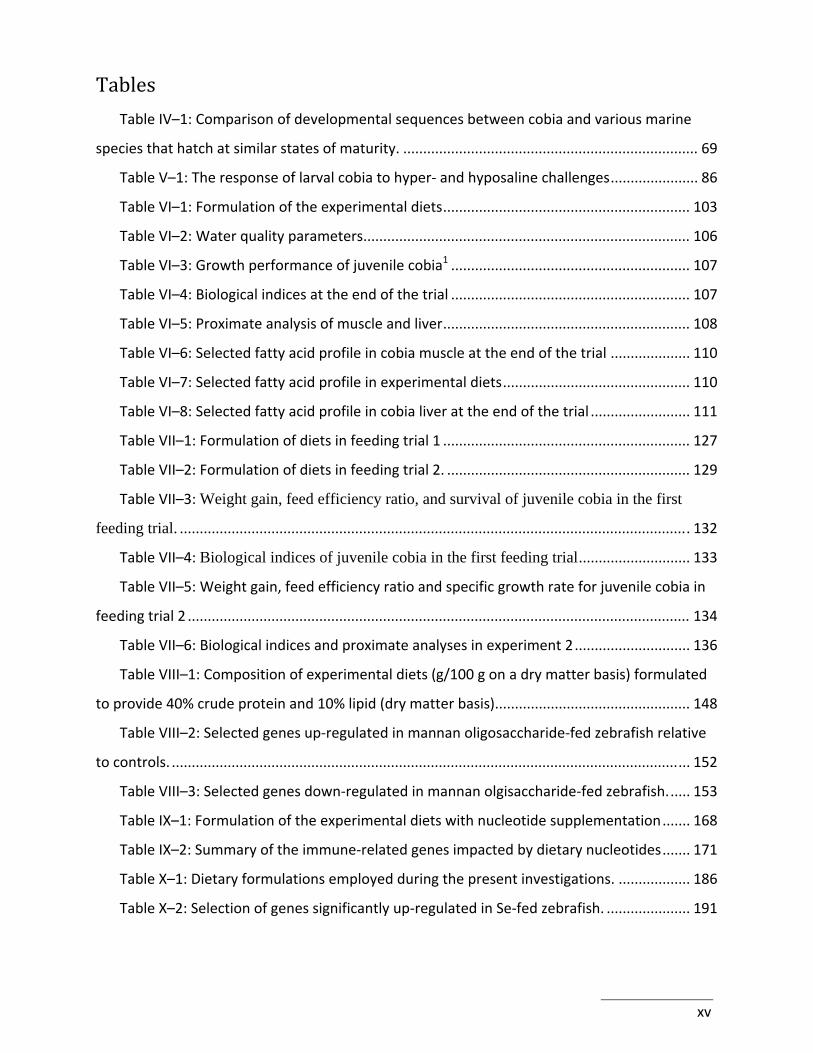
Tables Table IV–1: Comparison of developmental sequences between cobia and various marine
species that hatch at similar states of maturity. .......................................................................... 69
Table V–1: The response of larval cobia to hyper‐ and hyposaline challenges ...................... 86
Table VI–1: Formulation of the experimental diets .............................................................. 103
Table VI–2: Water quality parameters .................................................................................. 106
Table VI–3: Growth performance of juvenile cobia1 ............................................................ 107
Table VI–4: Biological indices at the end of the trial ............................................................ 107
Table VI–5: Proximate analysis of muscle and liver .............................................................. 108
Table VI–6: Selected fatty acid profile in cobia muscle at the end of the trial .................... 110
Table VI–7: Selected fatty acid profile in experimental diets ............................................... 110
Table VI–8: Selected fatty acid profile in cobia liver at the end of the trial ......................... 111
Table VII–1: Formulation of diets in feeding trial 1 .............................................................. 127
Table VII–2: Formulation of diets in feeding trial 2. ............................................................. 129
Table VII–3: Weight gain, feed efficiency ratio, and survival of juvenile cobia in the first
feeding trial. ................................................................................................................................ 132
Table VII–4: Biological indices of juvenile cobia in the first feeding trial ............................ 133
Table VII–5: Weight gain, feed efficiency ratio and specific growth rate for juvenile cobia in
feeding trial 2 .............................................................................................................................. 134
Table VII–6: Biological indices and proximate analyses in experiment 2 ............................. 136
Table VIII–1: Composition of experimental diets (g/100 g on a dry matter basis) formulated
to provide 40% crude protein and 10% lipid (dry matter basis)................................................. 148
Table VIII–2: Selected genes up‐regulated in mannan oligosaccharide‐fed zebrafish relative
to controls. .................................................................................................................................. 152
Table VIII–3: Selected genes down‐regulated in mannan olgisaccharide‐fed zebrafish. ..... 153
Table IX–1: Formulation of the experimental diets with nucleotide supplementation ....... 168
Table IX–2: Summary of the immune‐related genes impacted by dietary nucleotides ....... 171
Table X–1: Dietary formulations employed during the present investigations. .................. 186
Table X–2: Selection of genes significantly up‐regulated in Se‐fed zebrafish. ..................... 191

xvi
Table X–3: Selection of genes expressing significant up‐regulation in control zebrafish when
compared against Se‐fed zebrafish............................................................................................. 193
Chapter I . GENERAL I NTRODUCT ION
In 1973, Jacques Cousteau said: “With earth’s burgeoning human population to feed we
must turn to the sea with new understanding and new technology. We need to farm it as we
farm the land.” With a stagnating production from fisheries (90‐95 million tonnes since the
1990s), aquaculture produced 44.6% of the seafood for human consumption in 2005 (FAO,
2007a). China alone harvested 69.6% of global aquaculture production in 2006, followed by the
rest of Asia (21.9%), Western Europe (3.5%) and Latin and North America (3.5%). Taking the
combined growth of the world population and its demand for seafood, the FAO estimates that
an additional 40 million tonnes of seafood will be necessary to maintain per capita consumption
by 2030. Clearly, the aquaculture industry will become the essential actor in the supply of
seafood needed in a hungry world.
However, the continued development of aquaculture will not be without obstacles:
production, economics, public opinion, and environmental impact to name a few. All are
interconnected, and sustainability is the goal for meeting these challenges. As it has for many
other industries, sustainability has become a major concern for the aquaculture sector.
Sustainability has been given many definitions, sometimes contradicting each other. However, I
will summarize it as the way of conducting an activity to meet the needs of the present without
compromising those of the future. This is a fundamental concept: it defines a philosophy of
development that is increasingly adopted as mankind realizes that some practices cannot
1
continue as they have in the past.
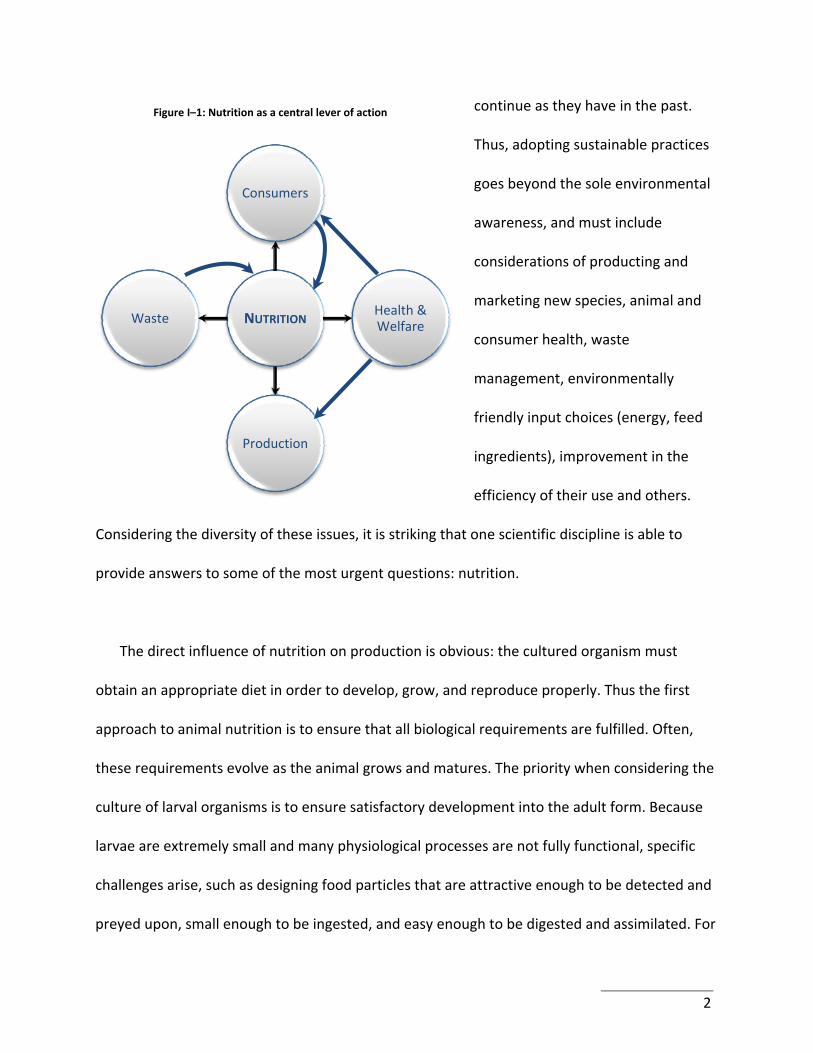
Thus, adopting sustainable practices
goes beyond the sole environmental
awareness, and must include
considerations of producting and
marketing new species, animal and
consumer health, waste
management, environmentally
friendly input choices (energy, feed
ingredients), improvement in the
efficiency of their use and others.
Considering the diversity of these issues, it is striking that one scientific discipline is able to
provide answers to some of the most urgent questions: nutrition.
NUTRITION
Consumers
Health & Welfare
Production
Waste
Figure I–1: Nutrition as a central lever of action
The direct influence of nutrition on production is obvious: the cultured organism must
obtain an appropriate diet in order to develop, grow, and reproduce properly. Thus the first
approach to animal nutrition is to ensure that all biological requirements are fulfilled. Often,
these requirements evolve as the animal grows and matures. The priority when considering the
culture of larval organisms is to ensure satisfactory development into the adult form. Because
larvae are extremely small and many physiological processes are not fully functional, specific
challenges arise, such as designing food particles that are attractive enough to be detected and
preyed upon, small enough to be ingested, and easy enough to be digested and assimilated. For
2
these reasons and others, the consistent and reliable production of post‐larvae is often a
bottleneck to establishing commercial‐scale aquaculture. For juveniles, growth to market size is
clearly a priority, whereas for broodstock the goal is to produce good quality gametes and
larvae. Therefore, for each stage of animal development and production, specific biological
requirements must be met with unique dietary formulations.
Nutrition also impacts the organism’s health and welfare. Beyond the absolute need for
survival and growth, an organism must be able to find in its diet what it needs to fight
pathogens and maintain its integrity. Disease is one of the most important sources of mortality
in aquaculture settings and causes tremendous economic losses, not only due to direct
mortality, but also because diseases result in sub‐optimal performance. Additionally, diseases
may cause an industrial crash, as was the case for the Ecuadorian shrimp farming industry,
wiped out by Taura virus in 2000. This tragedy resulted in an estimated loss of $1 billion, and
job losses for half a million people. Preventive approaches, such as HACCP (Hazard Analysis and
Critical Control Points) and prophylactic procedures may be implemented to reduce the
occurrence of diseases and chemical contamination. Proactive action may also complement
prevention, as certainly healthy animals perform (i.e. growth, health, etc.) better. Nutrition can
be employed to contribute to ensure optimum growing conditions for the cultured animal.
Consumer health also can be considered from a nutritional viewpoint. There has been in the
past few years, a growing interest toward healthier foods, especially among wealthier, more
educated consumers. Seafood benefits from a positive image in this regard, mainly due to the
3
publicity of the health advantages of n‐3 fatty acids in marine organisms. Since numerous
cultured aquatic species also require these fatty acids, a clear nutritional management
opportunity exists to enhance the healthful benefits of the final product.
All industrial activities generate by‐products of some type, and aquaculture is no exception.
The culture of aquatic organisms is particular in that they live in a medium (i.e. water) that not
only provides support and oxygen, but also receives wastes such as faecal matter, nitrogenous
wastes, and uneaten food. These wastes must be removed from the animal’s direct
surroundings in order to maintain good environment quality. In an open‐sea cage system,
wastes are dispersed by the action of waves and currents. However, in an inland, recirculating
system, wastes are collected and concentrated. They can be disposed of subsequently, or they
may be utilized and transformed into new ingredients that can be incorporated into various
diets again. For example, such technologies are being used to convert fish farm waste into
shrimp food, thereby providing both environmental and economical benefits. Nutrition science
can be employed at this level to control waste production (i.e. maximizing nutrient utilization
by the cultured organism), and also to ensure that unavoidable wastes are removed from the
system more efficiently, more easily concentrated, and utilizable as an additional ingredient.
Ingredient selection during dietary formulation is critical since it impacts animal
performance, health, waste production and hence overall sustainability of a farm. Traditionally,
fish meal has been the principal source of protein in aquafeeds. However, annual fish meal
supplies remain stagnant, averaging between 6 and 7 million tonnes a year (Shepherd, et al.,
4
2005). Moreover, the aquaculture industry has been increasing at an average rate of 6.9% per
year over the last 50 years, with some countries such as Turkey or Vietnam dramatically
increasing their production (24.0% and 30.6% respectively between 2002 and 2004; FAO, 2007).
A rising demand together with a stagnant supply has caused an increase in the retail price of
fish meal, and ultimately, a heavy reliance upon this ingredient will no longer be economical:
this is the “fish meal trap” (New and Wijkström, 2002). Born from a global economic
perspective, it has also become an environmental issue, since the extensive use of fish meal
results in net consumption of fish, as opposed to net production: in the late 1990s,
approximately 2.5‐3.0 kg of wild fish were necessary to produce 1 kg of Atlantic salmon (Åsgård,
et al., 2007). Similarly, lipid sources traditionally are derived from oily marine fishes (e.g.
herring, sardine), and the “fish oil trap” is also closing. Consequently, numbers of researchers
have worked on the identification and the testing of alternative protein and lipid sources, which
must satisfy all the requirements that were discussed above. While the proportions of fish meal
and oil in aquafeeds have been reduced significantly, more work is needed to further improve
the efficient use of these finite resources.
Nutritional research can assist the aquaculture industry proactively by providing solutions to
a number of problems of concern to consumers. For example, major concerns at present
include issues such as negative environmental impact, animal welfare, food safety and
contaminants, and zoonoses. Nutritionists, through sound dietary formulation, can ensure the
health and well‐being of the cultured animal. Reduced environmental impact can be attained
through appropriate ingredient choices, and utilization of modern pelleting technologies.
5
Consumer confidence can be enhanced through emplacement of quality control and assurance
programs for all ingredients to establish complete chain of custody and traceability. Moreover,
the nutritional quality of the final product can be improved through judicious dietary
formulation.
Approximately 300 aquatic species are cultured worldwide. However, 90.5% of the total
production is concentrated in only ten species groups (FAO, 2007a). For a number of reasons,
including environmental and economical, aquaculturists have examined the potential for
producing new cultured species. Cobia (Rachycentron canadum, L.) is such a species which
presents many characteristics attractive to the aquaculture industry, including extremely high
growth rates and global distribution. A major problem with cultivating new species is the lack of
general knowledge on their biology, with the consequence that early production levels are
often very low due to high mortality rates. Thus, a high level of research and development is
necessary prior to developing viable industrial production.
The following dissertation concentrates on nutritional research with cobia, a candidate
species for intensive aquaculture in the United States and elsewhere. Specifically, I addressed
critical gaps in our information base on cobia biology. These include:
• Larval development, emphasizing ontogeny of the gastrointestinal tract and sensory
epithelia and how these systems correlate to nutritional transitions in rapidly growing
animals.
6
• Replacement of fish meal and fish oil with alternative ingredients: new ingredients were
tested, and known feedstuffs investigated and refined using novel supplementations.
• Exploration of the inner workings of nutrients on the physiology of fish using
transcriptomic methods with a model species for which a microarray is readily
available– the zebrafish Danio rerio.
7
Cited references
Åsgård, T., Berge, G.M., Mørkøre, T., Refstie, S., 2007. Flexibility in the use of feed ingredients turns the salmon industry sustainable. Organic Aquaculture Symposium. National Organic Standards Board, Arlington, VA.
FAO, 2007. The State of World Fisheries and Aquaculture ‐ 2006 (SOFIA). Food and Agriculture Organization of the United Nations (FAO), Rome, Italy, pp. 180.
New, M.B., Wijkström, U.N., 2002. Use of fish meal and fish oil in aquafeeds: further thoughts on the fish meal trap. FAO Fisheries Circular No. 975.
Shepherd, C.J., Pike, I.H., Barlow, S.M., 2005. Sustainable feed resources of marine origin. Aquaculture Europe 2005. European Aquaculture Society, pp. 59‐66.
8
Chapter I I . DEVELOPMENT OF THE LARVAL COB IA GUT
Abstract
The development of a cobia aquaculture industry is constrained by the lack of a reliable supply of weaned juveniles. Together with genetic factors, nutrition plays a fundamental role in the proper development of finfish larvae. The present trial investigated the morphological and physiological ontogeny of the cobia digestive tract. Larvae were reared in a recirculated system and fed enriched rotifers in green water, followed by enriched Artemia, prior to being weaned on an artificial diet 25 days post‐hatch (dph). The digestive tract shape was a straight tube at first feeding (3 dph), acquired a loop at 10 dph, and exhibited its final, juvenile configuration by 18 dph. During development, two valves appeared (3 dph and 18 dph) that separated fore‐, mid‐, and hindgut. The stomach commenced differentiation at 10 dph, and displayed gastric glands by 16 dph. Together with the observations of others, the results presented herein could be used to refine diets and rearing protocols for cobia larvae especially as this relates to the presentation of appropriate nutrient composition in respect to the development of the digestive capacity of the gut.
Keywords: Rachycentron canadum, pepsin, intestine, enzyme, larval nutrition, ontogeny
9
INTRODUCTION
Cobia (Rachycentron canadum) is a fast‐growing (Lunger, et al., 2006), disease‐resistant
(McLean, et al., 2008a), globally‐distributed fish which has drawn increasing attention from the
aquaculture industry (McLean, et al., 2008b). In 2005, global production of cultivated cobia
exceeded 20,000 metric tonnes (FAO, 2007b), representing 70% of all cobia landings. More
rapid development of this industry is constrained, however, due to several bottlenecks, the
most urgent being the adequate production and supply of weaned juveniles (Salze, et al., 2008).
Presently, most cobia hatcheries produce 1‐2 weanlings per liter regardless of the starting
density, with animals being approximately 30‐35mm in total length at 30 days post‐hatch (dph;
Holt et al, 2007). This level of production is clearly insufficient to sustain commercial hatchery
operations, and significant improvements in weanling survival are needed (Benetti, et al., 2008;
Holt, et al., 2007; Niu, et al., 2008a).
In fish, the gastrointestinal (GI) tract integrity is paramount to good health and
performance. Indeed, it is not only involved in the digestion and absorption of nutrients, but
also plays a critical role in osmoregulation, especially during larval stages when gills are absent
or not fully functional (reviewed by Varsamos et al., 2005). Salts are transported against the
gradient by active ion transporters through the instestinal epithelium and followed by water
transfer. Fish, including larvae, regulate the amount of injested water in response to water
salinity (Tytler and Blaxter, 1988). In newly hatched larvae, the drinking rate increases during
10
the first few days of life, and then starts to decrease until adulthood (Evans, 1993), illustrating
the coordination between the GI tract and the gills.
The GI tract is characterized by its permeability and its exposition to the external
environement via drinking. While this is crucial for the establishment of the gut microflora, this
also constitutes an entry port for potential pathogens. Thus the GI tract is also an important site
of the fish immune apparatus. All the components of the immune system are represented in
the fish gut (Schley and Field, 2007; Gomez, 2008): physical barrier (e.g. gastric pH, intestinal
mucus), leucocytes (e.g. macrophages and lymphocytes), and soluble factors (e.g. complement,
acute‐phase proteins).
During development and metamorphosis, larvae undergo numerous and dramatic changes
both in external and internal morphology. In fish larvae, the GI tract is often immature at
hatching, especially in marine species. Typically starting from a straight tubular form with
limited histological differenciation from mouth to anus, the GI tract acquires its definitive adult
conformation through a series of folding, genesis of valves, and regional specialization of the
epithelium. The organogenesis speed and sequence is highly variable between species, but
completion of the GI tract organogenesis is generally regarded as the completion of the
individual’s metamorphosis.
Currently, our knowledge of cobia larval development and organogenesis is only partial.
Faulk et al. (2007a) have described some aspects of cobia gut development. In the current
11
study, we explore the development of the GI tract of cobia larvae held under a standard rearing
protocol. An enhanced understanding of such a process might shed light onto subtle but
nonetheless critical developmental steps, thereby providing the means to develop more
effective feeds and feeding protocols.
MATERIAL AND METHODS
Experimental systems and fish
Seventy‐two thousand 2‐dph (4.4 ± 0.28mm) cobia larvae, derived from the same batch of
eggs, were obtained from the University of Miami, Rosenstiel School of Marine and
Atmospheric Science. Larvae were randomly stocked into one of 8 replicated 3‐tank systems
(Salze, et al., 2008) at a density of 10 larvae L‐1. Each independent unit comprised three 300 L
tanks, linked to a reservoir that doubled as a fluidized KMT biofilter. Water from the reservoir
was pumped to a bubble bead filter (BBF‐2; Aquaculture Technologies Inc., Metaire, LA) to
remove suspended solids, then through a 100 μm bag filter, a UV sterilizer (80,000 microwatts
cm‐2 sec‐1; Emperor Aquatics, Pottstown, PA) for water disinfection and returned to the tanks. A
side‐looped protein skimmer (R&B Aquatic Distribution, Waring, TX) was employed to remove
small organic compounds and to decrease turbidity. Hydrodynamics of the larval tanks were
maintained to provide both horizontal and vertical circulation cells to optimize prey distribution
and minimize larvae‐larvae interactions. Water flow was adjusted throughout the rearing trial,
starting at approximately 1.5 L min‐1, and finishing at 12 L min‐1 for the tanks holding the
biggest fish. Initial system salinity was 35 g L‐1, which was reduced 1 g L‐1 day‐1 until a final
12
salinity of 24 g L‐1 was achieved at 13 dph. The reduction in salinity was employed based on
previous experience (Schwarz, personal communication) in cobia rearing and to reduce costs
associated with the purchase of artificial sea salt. Water temperature (27.8 ± 0.6oC) was
maintained using ambient air heating and the use of electronically‐controlled, thermostatic
titanium heaters (R&B Aquatics, Waring, TX) located in the reservoir. Bead filters were
backwashed daily. Make‐up water was supplied from a 38,000 L storage tank (Red Ewald Inc.,
Karnes City, TX). Once full, the storage water tank was treated with 20 mg L‐1 chlorine and
passed continuously through a rapid‐rate sand filter in series with a diatomaceous earth filter
before returning to the storage tank. Residual chlorine was neutralized with sodium thiosulfate
prior to using the water. A 24‐h photoperiod was maintained throughout the experimental
period using fluorescent lights positioned approximately 2.5 m above the systems.
Water quality
Water quality parameters were analyzed daily, and included total ammonia nitrogen, NO2‐N
and NO3‐N, which were measured spectrophotometrically (HACH DR/2400 Spectrophotometer,
HACH Co., Loveland, CO); dissolved oxygen, temperature and salinity, which were monitored
using a YSI model 85 probe (Yellow Springs Inc., Yellow Springs, OH, USA); pH, measured by a HI
9024 pH meter (HANNA Instruments, Woonsocket, RI), and alkalinity ,which was determined by
titration (APHA, 1998). No differences between systems in water quality were discerned
throughout the trial.
13
Feeds and feeding
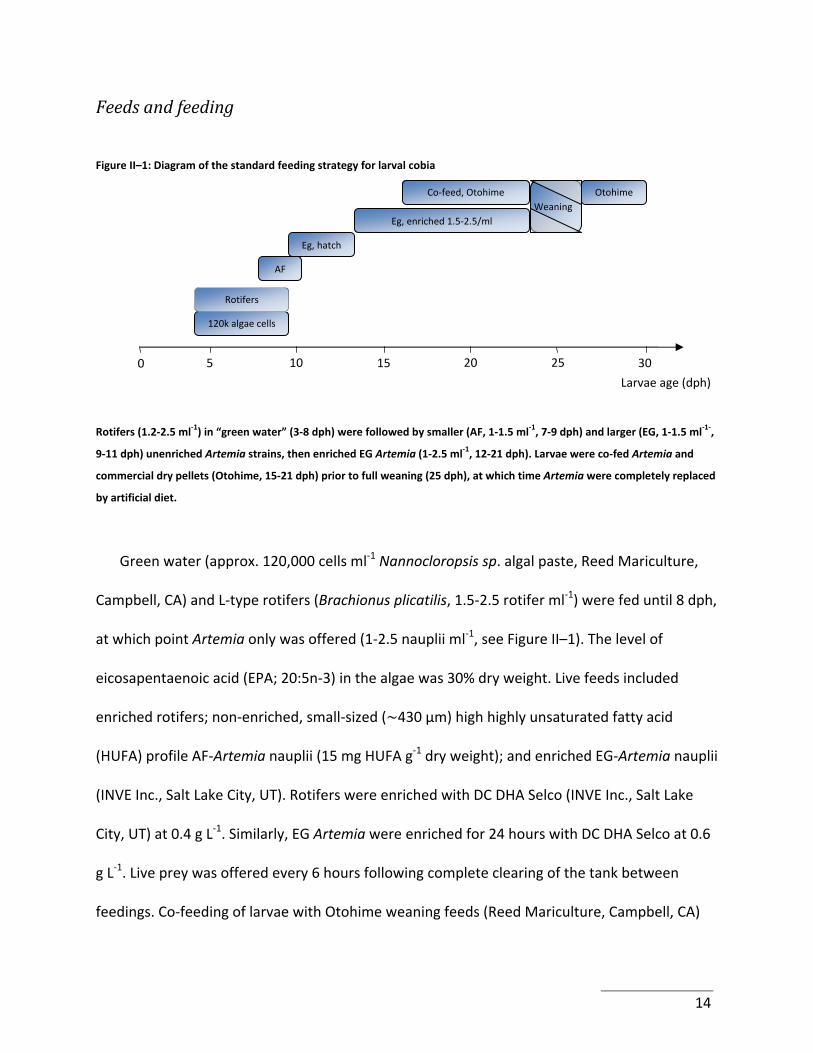
Figure II–1: Diagram of the standard feeding strategy for larval cobia
Weaning Eg, enriched 1.5‐2.5/ml
Eg, hatch
120k algae cells
Rotifers
Co‐feed, Otohime Otohime
AF
5 10 15 20 25 30 0
Larvae age (dph)
Rotifers (1.2‐2.5 ml‐1) in “green water” (3‐8 dph) were followed by smaller (AF, 1‐1.5 ml‐1, 7‐9 dph) and larger (EG, 1‐1.5 ml‐1‐,
9‐11 dph) unenriched Artemia strains, then enriched EG Artemia (1‐2.5 ml‐1, 12‐21 dph). Larvae were co‐fed Artemia and
commercial dry pellets (Otohime, 15‐21 dph) prior to full weaning (25 dph), at which time Artemia were completely replaced
by artificial diet.
Green water (approx. 120,000 cells ml‐1 Nannocloropsis sp. algal paste, Reed Mariculture,
Campbell, CA) and L‐type rotifers (Brachionus plicatilis, 1.5‐2.5 rotifer ml‐1) were fed until 8 dph,
at which point Artemia only was offered (1‐2.5 nauplii ml‐1, see Figure II–1). The level of
eicosapentaenoic acid (EPA; 20:5n‐3) in the algae was 30% dry weight. Live feeds included
enriched rotifers; non‐enriched, small‐sized ( 430 μm) high highly unsaturated fatty acid
(HUFA) profile AF‐Artemia nauplii (15 mg HUFA g‐1 dry weight); and enriched EG‐Artemia nauplii
(INVE Inc., Salt Lake City, UT). Rotifers were enriched with DC DHA Selco (INVE Inc., Salt Lake
City, UT) at 0.4 g L‐1. Similarly, EG Artemia were enriched for 24 hours with DC DHA Selco at 0.6
g L‐1. Live prey was offered every 6 hours following complete clearing of the tank between
feedings. Co‐feeding of larvae with Otohime weaning feeds (Reed Mariculture, Campbell, CA)
14
commenced at 15 dph, with 100% artificial diets being offered from 25 dph after a 3‐day
weaning period (Figure II–1). The dry food was distributed every hour using automated shaking
feeders (AF6 feeders, DFT3R8AC timer, Sweeney Feeders, Boerne, TX).
Sampling
Five larvae from each tank were randomly sampled every other day for histological analysis.
Larvae were euthanized by an overdose of clove oil (0.3 ml L‐1) prior to being rinsed with
distilled water in order to remove salt. Individual total lengths were recorded, and larvae were
immersed in fixative (5% glutaraldehyde, 4.4% formaldehyde, 2.75% picric acid, 0.05M sodium
cacodylate; pH 7.4) and stored at 4oC until processed. After completion of the weaning process,
weanlings were counted, bulk‐weighed and measured to determine final production, and
malformation frequency as assessed by spinal deformities.
Histological processing and analyses
Depending on size, larvae were processed as whole or tailed and/or headed. Typically, 3‐8
dph larvae were kept whole, 10‐16 dph were tailed, and 16‐27 dph larvae were both tailed and
headed. Samples were immersed in 0.05M sodium cacodylate (pH adjusted to 7.4) for 15 min
prior to being post‐fixed in 1% osmium tetroxide (OsO4) for 1 hour. Additional sodium
cacodylate baths were performed to ensure complete removal of OsO4. Dehydration was
achieved using ethanol baths (15% to 100%, 15 min each), and completed with a propylene
15
oxide bath (15 min). Samples were then infiltrated and embedded in plastic (Poly/Bed 812)
using standard methods (PolySciences, Inc. technical data sheet location) and positioned for
longitudinal sectioning. Thick sections (1μm) were prepared, stained (toluidine blue O,
counterstained with safranin O) and examined by light microscopy (Leitz Laborlux S Fixed Stage
microscope equipped with a Nikon 5500 digital camera).
RESULTS
Growth and survival
Larvae grew from an average of 4.4 ± 0.1 mm at 3 dph to 33.9 ± 1.0 mm at 27 dph. Fully
weaned cobia attained a weight of 0.35 ± 0.04 g. Survival was 7.09 ± 1.16% and tanks produced
an average of 0.71 ± 0.12 fish L‐1. The rate of deformity, as assessed by the presence of spinal
deformities was 2.39 ± 1.22%.
Development of the gastrointestinal tract
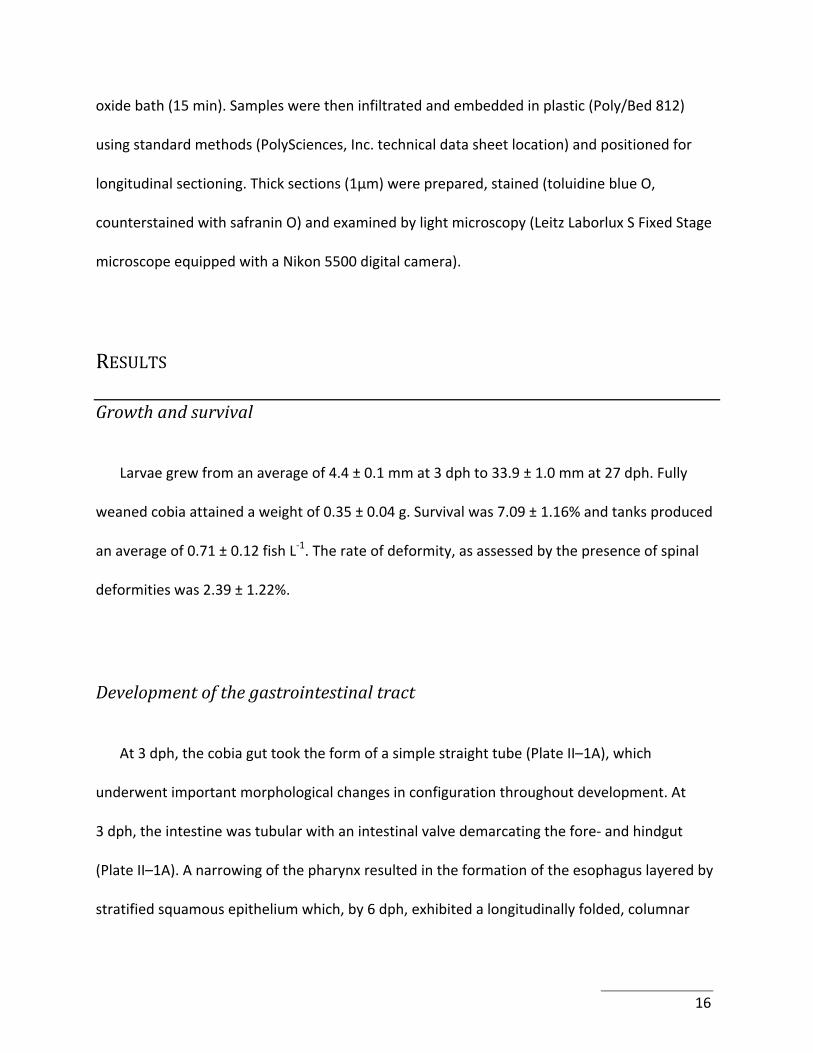
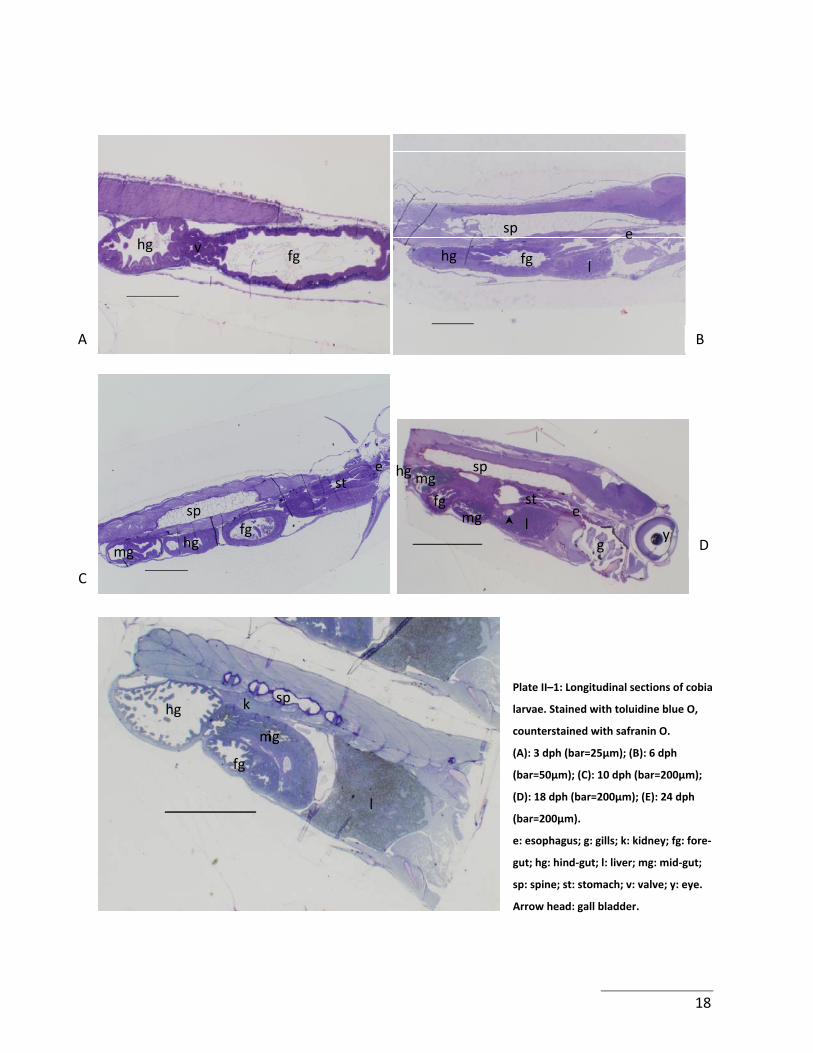
At 3 dph, the cobia gut took the form of a simple straight tube (Plate II–1A), which
underwent important morphological changes in configuration throughout development. At
3 dph, the intestine was tubular with an intestinal valve demarcating the fore‐ and hindgut
(Plate II–1A). A narrowing of the pharynx resulted in the formation of the esophagus layered by
stratified squamous epithelium which, by 6 dph, exhibited a longitudinally folded, columnar
16
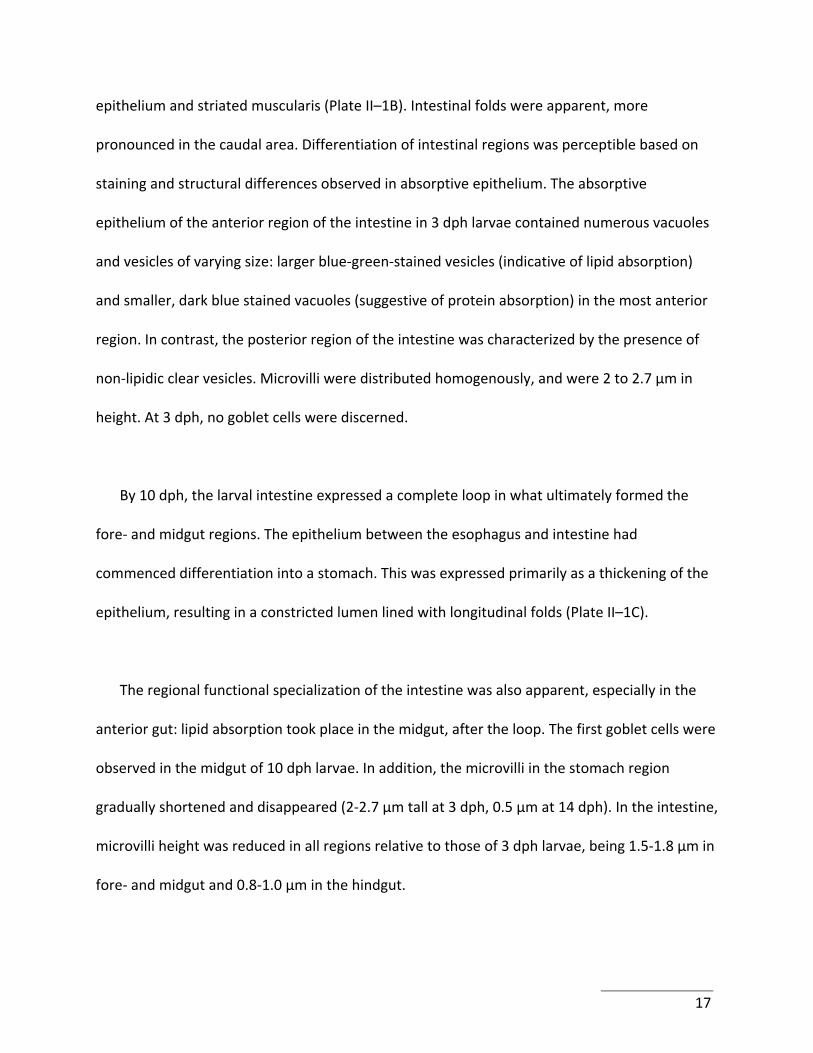
epithelium and striated muscularis (Plate II–1B). Intestinal folds were apparent, more
pronounced in the caudal area. Differentiation of intestinal regions was perceptible based on
staining and structural differences observed in absorptive epithelium. The absorptive
epithelium of the anterior region of the intestine in 3 dph larvae contained numerous vacuoles
and vesicles of varying size: larger blue‐green‐stained vesicles (indicative of lipid absorption)
and smaller, dark blue stained vacuoles (suggestive of protein absorption) in the most anterior
region. In contrast, the posterior region of the intestine was characterized by the presence of
non‐lipidic clear vesicles. Microvilli were distributed homogenously, and were 2 to 2.7 μm in
height. At 3 dph, no goblet cells were discerned.
By 10 dph, the larval intestine expressed a complete loop in what ultimately formed the
fore‐ and midgut regions. The epithelium between the esophagus and intestine had
commenced differentiation into a stomach. This was expressed primarily as a thickening of the
epithelium, resulting in a constricted lumen lined with longitudinal folds (Plate II–1C).
The regional functional specialization of the intestine was also apparent, especially in the
anterior gut: lipid absorption took place in the midgut, after the loop. The first goblet cells were
observed in the midgut of 10 dph larvae. In addition, the microvilli in the stomach region
gradually shortened and disappeared (2‐2.7 μm tall at 3 dph, 0.5 μm at 14 dph). In the intestine,
microvilli height was reduced in all regions relative to those of 3 dph larvae, being 1.5‐1.8 μm in
fore‐ and midgut and 0.8‐1.0 μm in the hindgut.
17
sp e
Plate II–1: Longitudinal sections of cobia
larvae. Stained with toluidine blue O,
counterstained with safranin O.
(A): 3 dph (bar=25μm); (B): 6 dph
(bar=50μm); (C): 10 dph (bar=200μm);
(D): 18 dph (bar=200μm); (E): 24 dph
(bar=200μm).
e: esophagus; g: gills; k: kidney; fg: fore‐
gut; hg: hind‐gut; l: liver; mg: mid‐gut;
sp: spine; st: stomach; v: valve; y: eye.
Arrow head: gall bladder.
A
sp
spst
fg mg
hg
fgmg
k
fg
hg sp
l
i mg
fg
mg
l
e hg
hgfg
e st
C
hg v
B
l y
D g
18
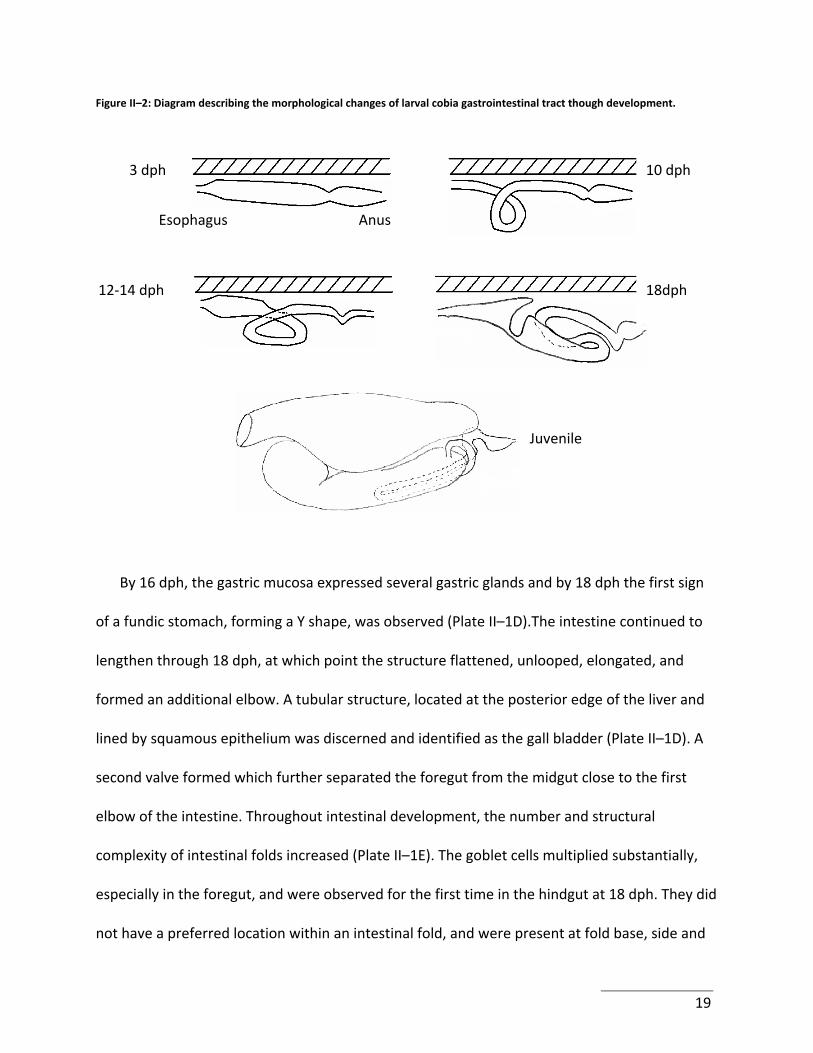
Figure II–2: Diagram describing the morphological changes of larval cobia gastrointestinal tract though development.
3 dph 10 dph
12‐14 dph
AnusEsophagus
18dph
Juvenile
By 16 dph, the gastric mucosa expressed several gastric glands and by 18 dph the first sign
of a fundic stomach, forming a Y shape, was observed (Plate II–1D).The intestine continued to
lengthen through 18 dph, at which point the structure flattened, unlooped, elongated, and
formed an additional elbow. A tubular structure, located at the posterior edge of the liver and
lined by squamous epithelium was discerned and identified as the gall bladder (Plate II–1D). A
second valve formed which further separated the foregut from the midgut close to the first
elbow of the intestine. Throughout intestinal development, the number and structural
complexity of intestinal folds increased (Plate II–1E). The goblet cells multiplied substantially,
especially in the foregut, and were observed for the first time in the hindgut at 18 dph. They did
not have a preferred location within an intestinal fold, and were present at fold base, side and
19
apex. Unlike the observations between 3 and 10 dph, microvilli height remained stable. By
24dph, the GI apparatus had achieved its metamorphosis and reflected that of a juvenile cobia
(Plate II–1E). The entire process is summarized in Figure II–2.
DISCUSSION
The growth rate of cobia during the present study was comparable to that observed by
Faulk et al. (2007a). However, fish from this study were approximately 40% longer than those
reported by Faulk et al. (2007b) and Hitzfelder et al. (2006) and 26% longer than those reported
for tank‐reared cobia by Benetti et al. (2008). Although survival was low, this fell within the
range of previously reported data for pond‐reared larvae (Weirich, et al., 2004), and at the
lower range for those reared in tanks (Faulk and Holt, 2005; Faulk, et al., 2007b; Hitzfelder, et
al., 2006; Salze, et al., 2008).
Although cobia are known to have a short, active cannibalistic period during development
(Salze, et al., 2008), it is unlikely that cannibalism was the main cause of mortality since the
rotational and convectional water movements in the tanks was highly effective at isolating fish
from one another. Deformity frequency (2.39%) was calculated for live fish at trial end and this
only took account of visible spinal curvatures. The actual number of deformed weanlings
therefore, was probably underestimated, since no consideration was given to jaw deformities,
which are common in cobia larvae (McLean, et al., 2008a). Various deformities can appear for a
range of reasons: maladapted husbandry or poor water quality (Bolla and Holmefjord, 1988;
20
Chatain, 1994; Rosenthal and Alderdice, 1976), poor larval and/or broodstock nutrition,
particularly that of vitamins (Cobcroft, et al., 2001; Cobcroft, et al., 2004), genetics
(Sindermann, 1990), and diseases (Oh, et al., 2002). In the present trial however, no signs of
diseases were observed. Water quality parameters were within accepted ranges for warm
marine fish larvae. Although these parameters have not been definitively determined for cobia
larvae, they probably did not contribute to the observed malformations. Rather, genetic and
nutritional challenges most likely exerted a more predominant role. Clearly, further research is
required in broodstock management, selection, nutrition, and egg quality in order to improve
survival. More specifically, I feel that protein and amino acid nutrition in larvae of such fast‐
growing species is critical and often overlooked.
The general morphological development of the cobia gut followed that described by Faulk
et al. (2007a), although some differences in the timing of events were evident. These
differences likely reflect variations in larval rearing temperature (25.9 vs. 27.8oC), but also
broodstock conditioning and use of spawning induction techniques; the latter have been shown
to result in differences in mRNA abundance of specific genes that impact gamete quality
(Bonnet, et al., 2007) and potentially overall larval quality. The feeding protocols employed,
stocking densities used and system‐specific characteristics, including water quality, salinity,
rearing temperature and photoperiod, may also have altered developmental rates. Noteworthy
however, was the relatively late appearance of intestinal goblet cells relative to previous
reports (Faulk, et al., 2007a; Schwarz, et al., 2006b), which in the present study coincided with
the feeding of Artemia. Another observation of interest related to the changes in microvilli
21
height. Reduced microvilli height, without attendant increases in diameter, would result in a
decreased surface area available for absorption. This incident however might be expected since
as the gut increased in diameter and complexity, in terms of fold height and number and
attendant number of absorptive enterocytes, there would be an overall augmentation in
intestinal absorptive capacity. Support for such an explanation is supplied by studies with rats,
where high energy diets resulted in a 28% reduction in microvilli length (Goda and Takase,
1994). Alternatively, reductions in microvilli height might have been driven by changes in diet,
microbial flora, or salinity. In this regard, changes in microvilli height and global absortive
surface area may reflect adjustments in the osmoregulatory process as the gills acquire their
ion and gas exchange function.
The GI development in other marine fish larvae has been reviewed by Zambonino Infante
and Cahu (2001). At 3‐dph (55 degree‐days; od) European sea bass (Dicentrarcus labrax, L.)
larvae, an absence of intestinal folds and the gradual appearance of the brush border
characterized the intestinal epithelium (Vu, 1976). Walford and Lam (1993) marked the
formation of the stomach between 13 and 17 dph (240‐314od) with the development of the
pyloric sphincter and the decrease of gastric pH in this species. However, gastric glands were
not observed before 25 dph (462od). In contrast, differentiation of the gastric mucosa is
initiated at 10 dph (290od), and completed at 18‐20 dph (522‐580od) in cobia, although the
timing of appearance of gastric glands is very similar (464od). In sole (Solea solea, L.), the
stomach starts to differentiate on 10 dph (190od), and the gastric glands appear at 22 dph
(418od; Bouhlic and Gabaudan, 1992). In addition, intestinal folds can be found only in the
22
posterior third in newly hatched sole, which is also similar to my observations in cobia. The
similarities in GI ontogenetic pattern between cobia and sole may reflect comparable
developmental strategies and/or natural prey items. Indeed, larvae of both species develop in
estuaries and live in close contact with the benthic environment, whereas D. labrax is a more
pelagic and oceanic species.
Taken together with the work of others, these findings could be used to refine diets and
rearing protocols. The appropriate nutrient composition, as well as degree of chemical
complexity of these nutrients, could be particularly important in respect to the ontogeny of
digestive capacity. Further, it is likely that the development of gut‐associated lymphoid tissue
can be driven by initial exposure to dietary and other antigenic materials. The latter may
partially explain the increasing appearance of goblet cells. Considerations of the nature of
nutrients and their role in digestive ontogeny, in regards to digestion mode and capacity of the
larvae, could lead to enhanced growth and survival, as well as to an earlier and more controlled
weaning date in marine finfish larvae.
Acknowledgements
This research was supported by Virginia SeaGrant (EM, SRC). The authors are pleased to
acknowledge the assistance of Brendan Delbos and Michael H. Schwarz.
23
Cited references
APHA, 1998. In: Clesceri, Greenberg, Trussell (Eds.), Standards methods for the examination of water and wastewater, Washington, DC.
Benetti, D.D., Sardenberg, B., Welch, A., Hoenig, R., Orhun, M.R., Zink, I., 2008. Intensive larval husbandry and fingerling production of cobia Rachycentron canadum. Aquaculture, in press.
Bolla, S., Holmefjord, I., 1988. Effect of temperature and light on development of Atlantic halibut larvae. Aquaculture 74, 355‐358.
Bonnet, E., Fostier, A., Bobe, J., 2007. Microarray‐based analysis of fish egg quality after natural or controlled ovulation. BMC Genomics 8:55.
Boulhic, M., Gabaudan, J., 1992. Histological study of the organogenesis of the digestive system and swim bladder of the Dover sole, Solea solea (Linnaeus 1758). Aquaculture 102, 373‐396.
Cahu, C.L., Zambonino Infante, J.L., 2001. Substitution of live food by formulated diets in marine fish larvae. Aquaculture 200, 161‐180.
Chatain, B., 1994. Abnormal swimbladder development and lordosis in sea bass (Dicentrarchus labrax) and sea bream (Sparus auratus). Aquaculture 119, 371‐379.
Cobcroft, J.M., Pankhurst, P.M., Sadler, J., Hart, P.R., 2001. Jaw development and malformation in cultured striped trumpeter Latris lineata. Aquaculture 199, 267‐282.
Cobcroft, J.M., Pankhurst, P.M., Poortenaar, C., Hickman, B., Tait, M., 2004. Jaw malformation in cultured yellowtail kingfish (Seriola lalandi) larvae. New Zealand Journal of Marine and Freshwater Research 38, 67‐71.
Evans, D.H., 1993. Osmotic and ionic regulation. In: Evans, D.H. (Ed.), The physiology of fishes. CRC Press, Boca Raton, FL, pp. 315‐ 341.
FAO, 2007. The state of world fisheries and aquaculture 2006. Food and Agriculture Organization of the United Nations, Rome, Italy, pp. 180.
Faulk, C.K., Holt, G.J., 2005. Advances in rearing cobia Rachycentron canadum larvae in recirculating aquaculture systems: Live prey enrichment and greenwater culture. Aquaculture 249, 231‐243.
Faulk, C.K., Benninghoff, A.D., Holt, G.J., 2007a. Ontogeny of the gastrointestinal tract and selected digestive enzymes in cobia Rachycentron canadum (L.). Journal of Fish Biology 70, 567‐583.
Faulk, C.K., Kaiser, J.B., Holt, G.J., 2007b. Growth and survival of larval and juvenile cobia Rachycentron canadum in a recirculating raceway system. Aquaculture 270, 149‐157.
Goda, T., Takase, S., 1994. Effect of dietary‐fat content on microvillus in rat jejunum. Journal of Nutritional Science and Vitaminology 40, 127‐136.
24
Gomez, G.D., Balcazar, J.L., 2008. A review on the interactions between gut microbiota and innate immunity of fish. FEMS Immunology and Medical Microbiology 52, 145‐154.
Hitzfelder, G.M., Holt, G.J., Fox, J.M., McKee, D.A., 2006. The effect of rearing density on growth and survival of cobia, Rachycentron canadum, larvae in a closed recirculating aquaculture system. Journal of the World Aquaculture Society 37, 204‐209.
Holt, G.J., Faulk, C.K., Schwarz, M.H., 2007. A review of the larviculture of cobia Rachycentron canadum, a warm water marine fish. Aquaculture 268, 181‐187.
Lunger, A.N., Craig, S.R., McLean, E., 2006. Replacement of fish meal in cobia (Rachycentron canadum) diets using an organically certified protein. Aquaculture 257, 393‐399.
McLean, E., Salze, G., Craig, S.R., 2008a. Parasites, diseases and deformities of cobia. Ribarstvo 66, 1‐16.
McLean, E., Salze, G., Schwarz, M.H., Craig, S.R., 2008b. Cobia cultivation. In: Burnell, G., Allan, G. (Eds.), New technologies in aquaculture: Improving production efficiency, quality and environmental management. Woodhead Publishing Limited, Cambridge, U.K. .
Niu, J., Liu, Y., Tian, L., Mai, K., Yang, H., Ye, C., Zhu, Y., 2008. Effects of dietary phospholipid level in cobia (Rachycentron canadum) larvae: growth, survival, plasma lipids and enzymes of lipid metabolism. Fish Physiology and Biochemistry 34, 9‐17.
Oh, M.J., Jung, S.J., Kim, S.R., Rajendran, K.V., Kim, Y.J., Choi, T.J., Kim, H.R., Kim, J.D., 2002. A fish nodavirus associated with mass mortality in hatchery‐reared red drum, Sciaenops ocellatus. Aquaculture 211, 1‐7.
Péres, A., Zambonino Infante, J.L., Cahu, C.L., 1998. Dietary regulation of activities and mRNA levels of trypsin and amylase in sea bass (Dicentrarchus labrax) larvae. Fish Physiology and Biochemistry 19, 145‐152.
Rosenthal, H., Alderdice, D.F., 1976. Sublethal effects of environmental stressors, natural and pollutional, on marine fish eggs and larvae. Journal of the Fisheries Research Board Canada 33, 2047–2065.
Salze, G., McLean, E., Schwarz, M.H., Craig, S.R., 2008. Dietary mannan oligosaccharide enhances salinity tolerance and gut development of larval cobia. Aquaculture 274, 148‐152.
Schley, P.D., Field, C.J., 2007. The immune‐enhancing effects of dietary fibres and prebiotics. British Journal of Nutrition 87, S221‐S230.
Schwarz, M.H., McLean, E., Craig, S.R., 2006. Research experience with cobia: larval rearing, juvenile nutrition and general physiology. In: Liao, C.I., Leaño, E.M. (Eds.), Cobia Aquaculture: Research Development and Commercial Production. Asian Fisheries Society, Manila, Philippines; World Aquaculture Society, Baton Rouge, Louisiana, USA; The Fisheries Society of Taiwan, Keelung, Taiwan; and National Taiwan Ocean University, Keelung, Taiwan.
25
Sindermann, C.J., 1990. Diseases of Marine Fish, 2ndth edition. Academic Press, San Diego, pp 201‐214.
Tytler, P., Blaxter, J.H.S., 1988. The effects of external salinity on the drinking rates of the larvae of herring, plaice and cod. Journal of Experimental Biology 138, 1‐15.
Varsamos, S., Nebel, C., Charmantier, G., 2005. Ontogeny of osmoregulation in postembryonic fish: A review. Comparative Biochemistry and Physiology ‐ A. Molecular & Integrative Physiology 141, 401‐429.
Vu, T.T., 1976. Etude du développement du tube digestif des larves de bar. Archives de Zoologie Experimentale et Générale 117, 493‐509.
Walford, J., Lam, T.J., 1993. Development of digestive tract and proteolytic enzyme activity in seabass (Lates calcarifer) larvae and juveniles. Aquaculture 109, 187‐205.
Weirich, C.R., Smith, T.I.J., Denson, M.R., Stokes, A.D., Jenkins, W.E., 2004. Pond culture of larval and juvenile cobia, Rachycentron canadum, in the southeastern United States: initial observations. Journal of Applied Aquaculture 16, 27‐44.
Yúfera, M., Darias, M.J., 2007. The onset of exogenous feeding in marine fish larvae. Aquaculture 268, 53‐63.
Zambonino Infante, J.L., Cahu, C.L., 2001. Ontogeny of the gastrointestinal tract of marine fish larvae. Comparative Biochemistry and Physiology Part C: Toxicology & Pharmacology 130, 477‐487.
26
Chapter I I I . DIETARY TAUR INE
ENHANCES GROWTH AND D IGEST IVE
ENZYME ACT IV I T I E S I N LARVAL COB IA
Abstract
While present in high concentrations in natural preys of marine fish larvae (e.g. copepods), taurine is absent from rotifers and very low in Artemia, which may thus be lacking in fish larvae. Therefore, the effect of increasing taurine intake on growth, amylase, trypsin, lipase and pepsin‐like activities during larval cobia development and weaning was investigated. Taurine was delivered using bioencapsulation techniques wherein rotifer and Artemia nauplii were co‐enriched with 4 g taurine L‐1 d‐1. In control larvae, amylase activity was detectable at 3 days post‐hatch (dph) and expressed a four‐fold increase from trial start to weaning, with peak levels being 1.38±0.31 U fish‐1 at 27 dph. Trypsin activity exhibited a similar profile to that of amylase: activity was low at 3 dph, and reached 0.08±0.00 U fish‐1 at weaning. Lipase activity was not detected at 3 dph, but by 27 days achieved levels of 2.89±0.38 U individual‐1. Pepsin‐like activity was not detectable prior to 22 dph (P<0.05), denoting a lack of gastric functionality until this time point. In control fish, maximum pepsin‐like activity reached 29.09 ± 1.47 UHb fish‐1 at weaning. Taurine‐fed larvae had a markedly increased amylase activity (P < 0.0001), commencing at 16 dph with maximal levels being recorded as 7.40±1.47 U fish‐1. Likewise, trypsin activity attained 0.29±0.02 U individual‐1 at 27 dph (P < 0.0001) in taurine‐fed fish. As with control‐fed larvae, lipase activity in taurine‐enhanced fish was undetectable at 3 dph, but by 22 dph attained twice the levels observed for controls (P < 0.0001) at weaning. Pepsin‐like activity was also first detected at 22 dph in taurine fed larvae. Maximum levels of pepsin‐like activity were remarkably high at 330.95±13.39 U fish‐1 at 27 dph (P < 0.0001). Possible underlying mechanisms of action of taurine are explored, such as mitochondrial function, protein translation, bone growth, as well as its participation in anti‐oxidative processes.
Keywords: Rachycentron canadum, pepsin, lipase, trypsin, larval nutrition, ontogeny.
27
INTRODUCTION
As a species for aquaculture, Cobia (Rachycentron canadum, L., 1766) has garnered
increasing interest due to its impressive growth performance (Lunger, et al., 2006), near‐global
distribution and disease resistance (McLean, et al., 2008a), desirable flesh characteristics
(Duncan, et al., 2007), and ability to utilize alternative proteins (Craig, et al., 2006) and
carbohydrates (Schwarz, et al., 2007). As with other new candidate species for cultivation, there
currently exists a dearth of information on cobia larval development and physiology, and this
may partially explain the relatively poor survival rates currently observed in many cobia
hatcheries. During cobia larviculture, comparatively high mortalities are experienced at critical
phases of development. This is especially so at decisive moments such as first exogenous
feeding and the transition from live to formulated diets (Benetti, et al., 2008; Holt, et al., 2007;
Salze, et al., 2008).
A number of explanations have been proposed to provide at least a partial rationale for
poor larval survival including water quality issues, physical damage to larvae, cannibalism,
various genetic factors and poor initial egg quality (Holt, et al., 2007; Salze, et al., 2008). Clearly,
nutrition plays a central role in any successful aquaculture practice, especially during
larviculture. Although morphological development is mainly determined genetically, critical
physiological control processes can be influenced strongly by diet (Cahu and Zambonino
Infante, 2001; Péres, et al., 1998). For example, inappropriate nutrition may delay and
compromise larval development, resulting in impaired growth, heightened frequencies of
28
malformations, and ultimately, death (Yúfera and Darias, 2007). Conversely, correctly delivered
premium diets with proper nutrient balance and energy serve to maximize growth,
development and survival.
Rotifers (Brachionus sp) and brine shrimp (Artemia salina) are typically employed as live
feeds for cultured marine fish larvae, but because they are generally considered nutritionally
deficient, enrichments are necessary to enhance growth and development of fish. Research on
larval fish nutrition has emphasized the fatty acid content of live feeds with comparatively little
attention being given to protein nutrition. Copepods are widely recognized as nutritionally
superior to Artemia, for they need not be enriched, and their use typically results in improved
growth and survival in fish larvae (Shields, et al., 1999). The amino acid profiles of copepods
differ from those of traditionally employed live feeds and they tend to be rich in taurine (van
der Meeren, et al., 2008). Taurine is not an amino acid sensus stricto as it lacks the
characteristic carboxyl group and is thus generally found in its free form and in high
concentrations in many fish tissues (Sakaguchi, et al., 1988). Although considered metabolically
inert, taurine functions in maintaining cellular osmolality and stabilizing cell membranes, and
has a function in detoxification and antioxidation processes (Huxtable, 1992). Several studies
with fishes have determined that dietary taurine has positive effects on fish growth and
development (Brotons Martinez, et al., 2004; Kim, et al., 2005; Matsunari, et al., 2005;
Takeuchi, 2001), while taurine supplementation permits higher fish meal replacement with
alternate proteins (Gaylord et al., 2006; Lunger et al., 2007; Chatzifotis et al., 2008). However,
29
limited information is available on the nutritional role, if any, that taurine plays during the
development of larval fishes.
Our knowledge of cobia larval digestive processes is currently only partial, and an enhanced
understanding of the developmental sequence for digestive enzymes might provide the means
to design more effective feeds and feeding protocols. Faulk et al. (2007a) have described the
ontogeny of the pancreatic enzymes trypsin, chymotrypsin, lipase and amylase. In the current
study, we extend the work of Faulk et al. (2007a) by examining the enzymatic and
developmental response of cobia larvae held under different rearing protocols, while also using
eggs from a dissimilar broodstock. As well, we report here, for the first time in cobia, the
developmental profiles for pepsin. Knowledge of the developmental process in toto may be
critical to adapting and adopting novel feeding strategies for larval cobia, which may in turn
enhance weanling survival. Finally, because dietary taurine appears to provide growth
advantage to juvenile fishes (see above), we examined the impact of increasing dietary taurine
levels on larval growth and enzyme activities.
MATERIAL AND METHODS
Experimental systems and fish
Two days‐post‐hatch (dph, 4.4 ± 0.28mm) cobia larvae, derived from the same batch of
eggs, were obtained from the University of Miami, Rosenstiel School of Marine and
Atmospheric Science. Larvae were stocked randomly into one of two replicated systems (Salze,
30
et al., 2008) at a density of 10 larvae L‐1. Each independent unit comprised three 300 L tanks,
linked to a reservoir that doubled as a fluidized KMT biofilter. Water from the reservoir was
pumped to a bubble bead filter (BBF‐2; Aquaculture Technologies Inc., Metaire, LA) to remove
suspended solids, then through a 100 μm bag filter, and a UV sterilizer (80,000 microwatts cm‐2
sec‐1; Emperor Aquatics, Pottstown, PA) for water disinfection and returned to the tanks. A
side‐looped protein skimmer (R&B Aquatic Distribution, Waring, TX) was employed to remove
small organic compounds and to decrease turbidity. Hydrodynamics of the larval tanks were
maintained to provide both horizontal and vertical cells to optimize larvae‐prey distribution and
minimize larvae‐larvae interactions. Horizontal flow was controlled using the water inlet, while
the vertical flow was manipulated using a circular air diffusion line placed at the base of the
tank (Schwarz, et al., 2006a). Water flow was adjusted throughout the rearing trial, starting at
approximately 1.5 L min‐1, and finishing at 12 L min‐1 for the tanks holding the biggest fish.
Initial system salinity was 35 g L‐1, which was reduced 1 g L‐1 day‐1 until a final salinity of 24 g L‐1
was achieved at 13 dph. The reduction in salinity was employed based on previous experience
(Schwarz, personal communication) in cobia rearing and as a means to reduce costs associated
with the purchase of artificial sea salt. Water temperature was maintained (27.8 + 0.6 ºC) using
ambient air heating and the use of electronically‐controlled, thermostatic titanium heaters
(R&B Aquatics, Waring, TX) located in the reservoir. Bead filters were backwashed daily. Make‐
up water was supplied from a 38,000 L storage tank (Red Ewald, Inc., Karnes City, TX). Once full,
the stored water was treated with 20 mg L‐1 chlorine and passed continuously through a rapid‐
rate sand filter in series with a diatomaceous earth filter before returning to the tower.
Residual chlorine was neutralized with sodium thiosulfate prior to using the water. A 24‐h
31
photoperiod was maintained throughout the experimental period using fluorescent lights
positioned approximately 2.5 m above the systems.
Water quality
Water quality parameters were analyzed daily and included total ammonia nitrogen (TAN),
NO2‐N and NO3‐N, which were measured spectrophotometrically (HACH DR/2400
Spectrophotometer, HACH Co., Loveland, CO); dissolved oxygen, temperature and salinity,
which were monitored using a YSI model 85 probe (Yellow Springs Inc., Yellow Springs, OH,
USA); pH, measured by a HI 9024 pH meter (HANNA Instruments, Woonsocket, RI); and
alkalinity which was determined by titration (APHA, 1998). Averages of water quality
parameters throughout the trial were as follows: temperature 27.8+0.6 ºC; salinity 27.0+3.2 mg
L‐1; DO2 6.2+0.3 mg L‐1; alkalinity 131.7+13.4 mg L‐1; pH 7.8+0.1; TAN 0.1+0.1 mg L‐1; NO3
3.7+0.71 mg L‐1; NO2 0.1+0.0 mg L‐1. No difference between systems in water quality was
discerned throughout the trial.
Feeds and feeding
Green water (approx. 120,000 cells ml‐1 Nannocloropsis sp. algal paste, Reed Mariculture,
Campbell, CA) and L‐type rotifers (Brachionus plicatilis, 1.5‐2.5 rotifer ml‐1) were fed until
8 dph, at which point Artemia only was offered (1‐2.5 nauplii ml‐1, Figure III–1). The level of
eicosapentaenoic acid (EPA; 20:5n‐3) in the algae was 30% dry weight.
32
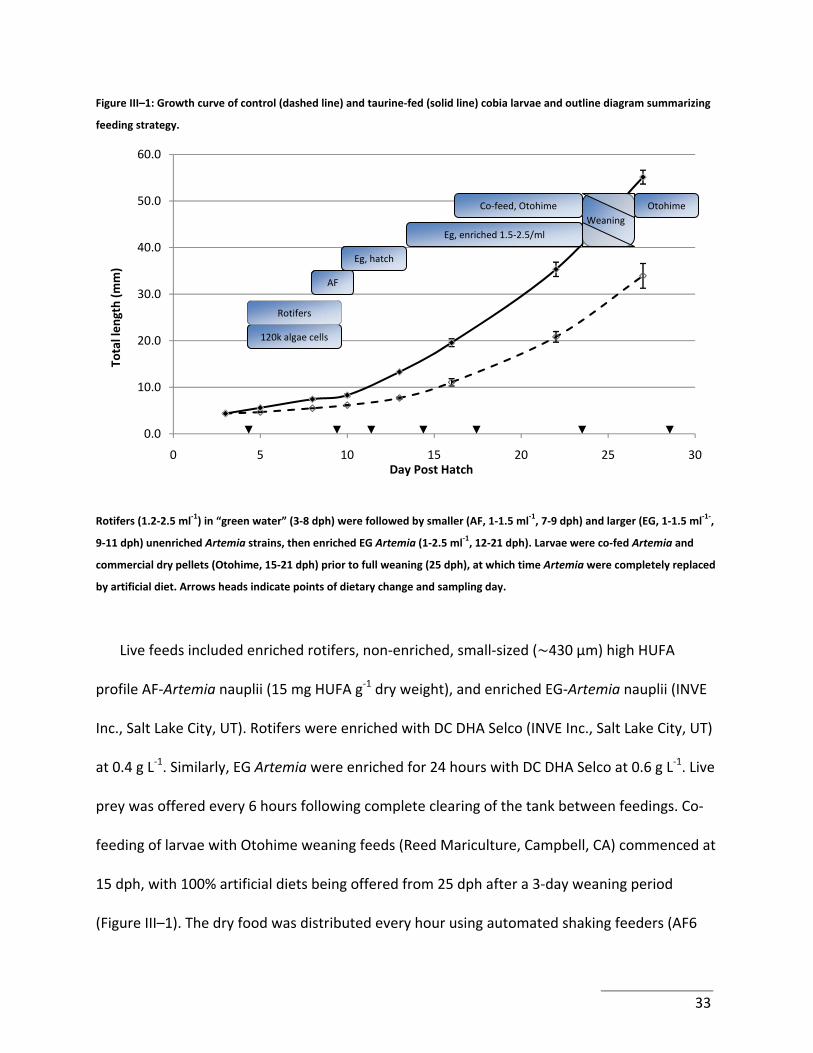
Figure III–1: Growth curve of control (dashed line) and taurine‐fed (solid line) cobia larvae and outline diagram summarizing
feeding strategy.
0.0
10.0
20.0
30.0
40.0
50.0
60.0
0 5 10 15 20 25 30
Total len
gth (m
m)
Day Post Hatch
Weaning Eg, enriched 1.5‐2.5/ml
Eg, hatch
120k algae cells
Rotifers
Co‐feed, Otohime Otohime
AF
Rotifers (1.2‐2.5 ml‐1) in “green water” (3‐8 dph) were followed by smaller (AF, 1‐1.5 ml‐1, 7‐9 dph) and larger (EG, 1‐1.5 ml‐1‐,
9‐11 dph) unenriched Artemia strains, then enriched EG Artemia (1‐2.5 ml‐1, 12‐21 dph). Larvae were co‐fed Artemia and
commercial dry pellets (Otohime, 15‐21 dph) prior to full weaning (25 dph), at which time Artemia were completely replaced
by artificial diet. Arrows heads indicate points of dietary change and sampling day.
Live feeds included enriched rotifers, non‐enriched, small‐sized ( 430 μm) high HUFA
profile AF‐Artemia nauplii (15 mg HUFA g‐1 dry weight), and enriched EG‐Artemia nauplii (INVE
Inc., Salt Lake City, UT). Rotifers were enriched with DC DHA Selco (INVE Inc., Salt Lake City, UT)
at 0.4 g L‐1. Similarly, EG Artemia were enriched for 24 hours with DC DHA Selco at 0.6 g L‐1. Live
prey was offered every 6 hours following complete clearing of the tank between feedings. Co‐
feeding of larvae with Otohime weaning feeds (Reed Mariculture, Campbell, CA) commenced at
15 dph, with 100% artificial diets being offered from 25 dph after a 3‐day weaning period
(Figure III–1). The dry food was distributed every hour using automated shaking feeders (AF6
33
feeders, DFT3R8AC timer, Sweeney Feeders, Boerne, TX). The taurine‐enriched live prey were
delivered according to the same schedule and prepared in a similar manner: rotifers were
enriched with 0.4 g L‐1 day‐1 of DHA Selco with the addition of 4 g L‐1 day‐1 of taurine, while
Artemia enrichment consisted in 0.6 g L‐1 of DHA Selco and 4 g L‐1 of taurine per day. Taurine
levels in prey items were measured using HPLC to verify the taurine enrichment.
Sampling and enzyme assays
Samples were collected after dietary change (i.e. 3, 8, 10, 13, 16, 22, and 27 dph, see Figure
III–1 ). Larvae were randomly netted from each tank (20 larvae per tank until 16 dph, 5 larvae
per tank subsequently). Larvae were rinsed with distilled water in order to remove salt, and
their length was recorded prior to storage in Eppendorf tubes, which were frozen at ‐80oC until
analyses. After completion of the weaning process, weanlings were counted, bulk‐weighed and
measured to determine final production.
In order to ensure easy and complete homogenization, larvae were tailed and/or headed
prior to grinding. Larvae from 3‐10 dph were headed, 11‐16 dph larvae were headed and tailed
and for 22‐27 dph larvae the whole gut was excised. All dissections were carried out on an ice‐
chilled glass slide using a binocular dissecting microscope. Samples were homogenized using an
etched‐glass tissue grinder (Fisher Scientific, Pittsburgh, PA). Each larva up to 16 dph was
homogenized in 50 μl of buffer (20mM Tris‐HCl, 1mM EDTA, 10mM CaCl2, pH=7.4). For larvae of
22 dph larvae and older, 100 μl of homogenization buffer was used. The homogenate was
34
centrifuged in an Eppendorf refrigerated microcentrifuge (14,000 rpm, 10 min, 3oC), and the
supernatant pipetted into new tubes and frozen at ‐80oC until assay. Since enzyme activities are
reduced following successive freezing/thawing cycles (Hale, et al., 2005; Jameel, et al., 1998), all
analyses were conducted over 2 days, and no sample was refrozen more than once.
Enzyme kinetic assays were conducted in a SpectraMax Plus 384 (Molecular Devices,
Sunnyvale, CA) plate reader using spectrophotometric methods. At all time points,
homogenates as well as the standard solutions were analyzed in duplicate, and each time point
consisted of 3 samples (i.e. n=3 in duplicate). Lipase and amylase activities were assayed using
commercial kits (Pointe Scientific, Inc., Canton, MI). Lipase and amylase plates were incubated
at 30oC for 4 min and the increase in absorbance recorded at 550 nm and 405 nm, respectively,
over 10 min.
Trypsin activity was measured using Nα‐P‐tosyl‐L‐arginine methyl ester hydrochloride
(TAME, Sigma‐Aldrich, St‐Louis, MO) as a substrate according to Walsh and Gertude (1970).
TAME has the advantage as a substrate in being highly sensitive and selective toward trypsin
(Uys and Hecht, 1987). This method was adapted to a microplate assay. Briefly, 100 μL of dH2O,
sample homogenate, or standard solution were pipetted in designated wells, and allowed to
warm to 30oC. Then, 300 μL of buffered substrate solution were added to each well and the
increase of absorbance recorded at 247 nm for 8 min.
35
Pepsin‐like activity was assayed using bovine hemoglobin (Hb, Sigma‐Aldrich) as a substrate
according to the method described by Ryle (1984). This method was adapted for use in a
microplate. After centrifugation of the reaction tubes, 250 μl of the supernatant were loaded in
a 96‐well plate, and the absorbance (endpoint) was read against the blank supernatant at
280 nm.
In international units, the enzyme activity (U) represents the quantity of enzyme that
catalyzes the reaction of 1 μmol of substrate per minute. Enzyme activity was determined for
lipase, amylase and trypsin. However, it was not possible to determine U for pepsin‐like enzyme
activity because of the non‐specificity of tyrosine residue absorbance at 280 nm (Ryle, 1984).
Thus, the pepsin activity unit is defined as ΔA280 min‐1 = 0.001 (Anson, 1938) under
experimental conditions (30oC, pH=1.7, light path = 1cm). Anson’s unit UHb is defined as the
ΔA280 between sample mean and blank by reference to a standard curve using Hb.
The following form ere us dulas w e :
For lipase activity: U A VL
For amylase activity: U A VV
VL
For trypsin activity: U A VV
VL
For pepsin‐like activity: UH AV
VL
36
Where ΔAbs is the change in absorbance per minute at the appropriate wavelength, α is the
slope of the standard curve, β is a conversion factor from L to ml (β=1000), Vs is the sample
volume (ml), Va is the assay volume (ml), ε is the extinction coefficient (M‐1 cm‐1) of the product,
l is the light path length (cm), δ is the ΔAbs defining pepsin‐like activity (δ=0.001), and t is the
duration of the pepsin assay (30 min).
Statistical analyses
JMP (Version 7, SAS Institute Inc., Cary, NC, 1989‐2005) was used for statistical analyses,
with significance levels set at 0.05. Growth performance and enzyme activities were subjected
to one‐way ANOVA (age vs. treatment) and two‐way ANOVA (age vs. treatment x activity)
analyses, respectively.
RESULTS
Growth and survival
Figure III–2 shows the enrichment in taurine of rotifers and Artemia: enriched rotifers
contained 0.09% (wet‐weight basis) taurine while unenriched rotifers were totally devoid of it.
Taurine levels in Artemia were increased 3 folds, reaching 0.26% taurine in enriched preys,
which suggest a more active uptake and/or better retention of taurine compared to rotifers.
Cobia larvae receiving dietary taurine grew significantly faster than controls (P<0.0001). At 27
dph, the length, wet weight and survival of taurine‐treated larvae was 55.1 ± 1.48 mm,
37
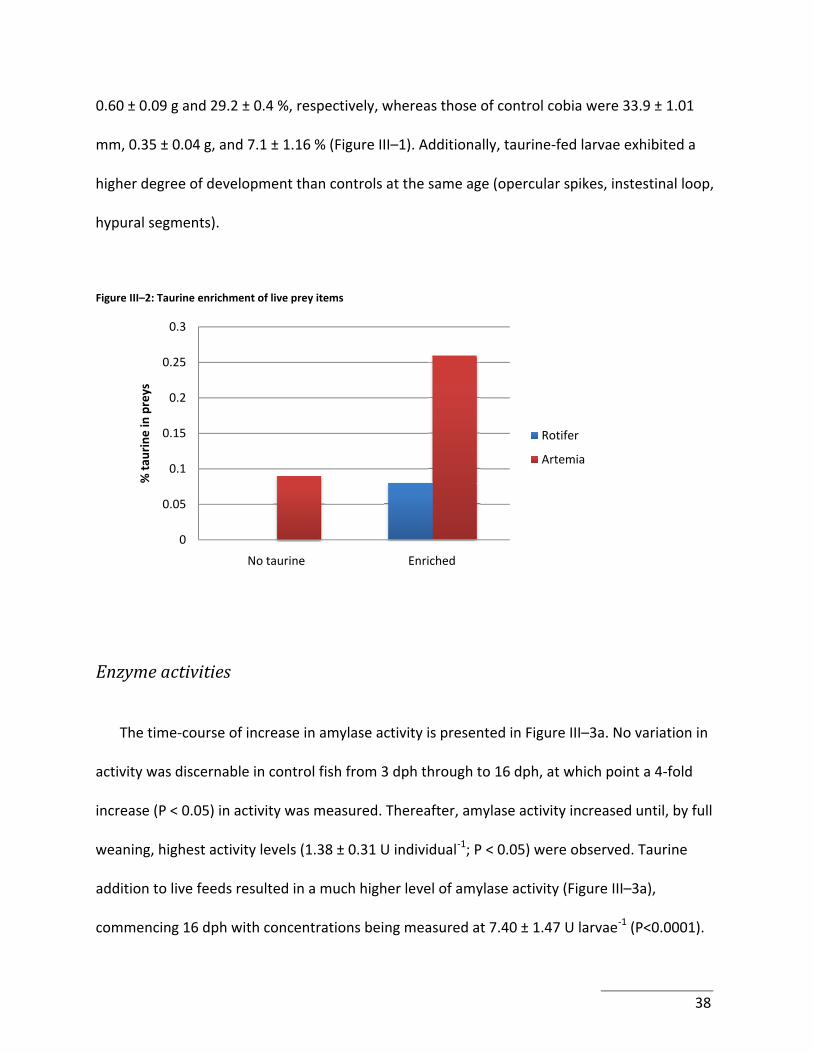
0.60 ± 0.09 g and 29.2 ± 0.4 %, respectively, whereas those of control cobia were 33.9 ± 1.01
mm, 0.35 ± 0.04 g, and 7.1 ± 1.16 % (Figure III–1). Additionally, taurine‐fed larvae exhibited a
higher degree of development than controls at the same age (opercular spikes, instestinal loop,
hypural segments).
Figure III–2: Taurine enrichment of live prey items
0
0.05
0.1
0.15
0.2
0.25
0.3
No taurine Enriched
% ta
urine in preys
Rotifer
Artemia
Enzyme activities
The time‐course of increase in amylase activity is presented in Figure III–3a. No variation in
activity was discernable in control fish from 3 dph through to 16 dph, at which point a 4‐fold
increase (P < 0.05) in activity was measured. Thereafter, amylase activity increased until, by full
weaning, highest activity levels (1.38 ± 0.31 U individual‐1; P < 0.05) were observed. Taurine
addition to live feeds resulted in a much higher level of amylase activity (Figure III–3a),
commencing 16 dph with concentrations being measured at 7.40 ± 1.47 U larvae‐1 (P<0.0001).
38
In contrast to amylase, lipase activity in control fish was not detected at 3 dph and
remained undetectable until 8 dph (Figure III–3b). From 13‐16 dph, lipase presence was
detected but increases in activity from baseline concentrations (P<0.05) were not discriminated
until 27 dph (Figure III–3b), at which point average activity was 2.89 ± 0.38 U fish‐1. Larval cobia
fed taurine‐enriched prey expressed nearly twice the lipase activity (P < 0.0001) when
compared against controls, with the highest levels of 5.16 ± 1.07 U fish‐1 being recorded at 27
dph.
The time‐course of trypsin activity in developing cobia larvae is summarized in Figure III–3c.
Trypsin was immediately detectable in 3 dph control animals with activities of 0.002 U larvae‐1.
Subsequently, trypsin levels remained relatively stable until 16 dph, when increased activities
(P<0.05) were observed. At weaning, trypsin activity was quantified at 0.08 ± 0.004 U individual‐
1 (Figure III–3c). In contrast to control cobia, larvae supplied with dietary taurine exhibited
maximum trypsin levels (0.29 ± 0.02 U individual‐1) that were some three‐fold greater
(P<0.0001) at trial end. Moreover, trypsin activity was observed to be greater at 16 dph in
taurine‐treated fish (P<0.0001).
The developmental progress of pepsin activity is presented in Figure III–3d. Pepsin activity
was not detected in 3 dph cobia larvae and remained at or below the level of assay detection
until 22 dph. At weaning, pepsin activity in control fish had attained levels of 29.09 ±1.47 UHb
animal‐1. Likewise, pepsin‐like activity also was undetected until 22 dph in taurine‐treated fish
39
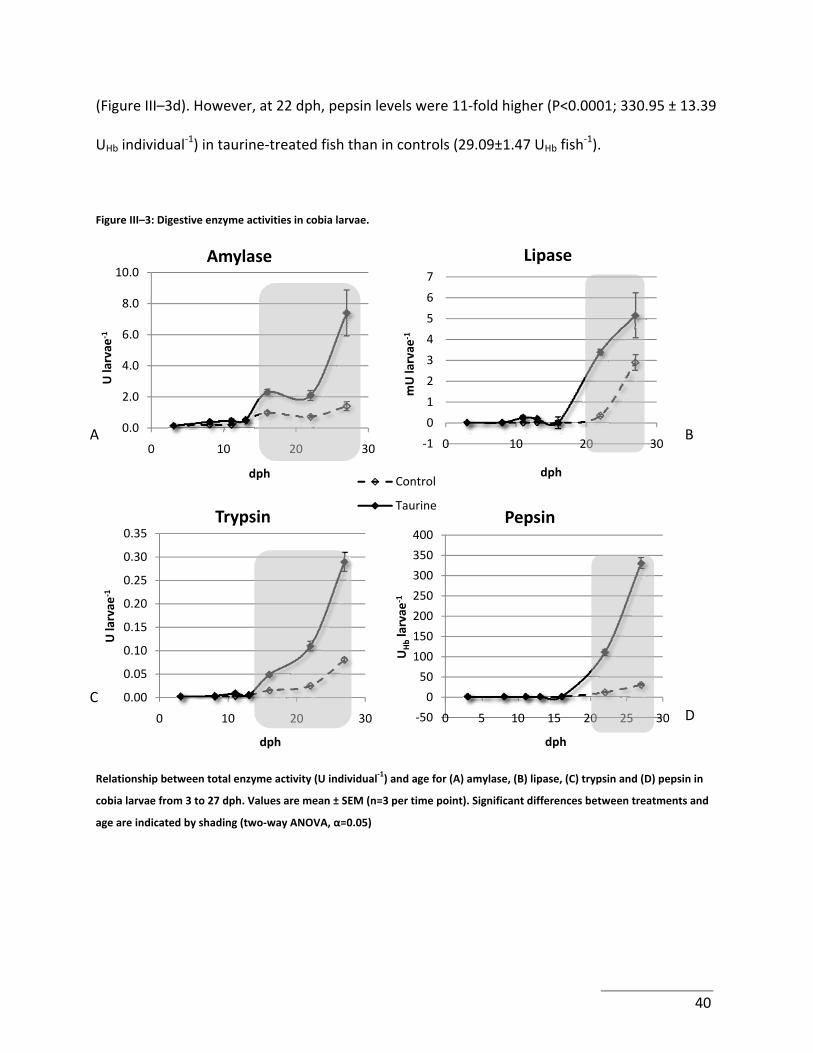
40
(Figure III–3d). However, at 22 dph, pepsin levels were 11‐fold higher (P<0.0001; 330.95 ± 13.39
UHb individual‐1) in taurine‐treated fish than in controls (29.09±1.47 UHb fish
‐1).
Figure III–3: Digestive enzyme activities in cobia larvae.
Relationship between total enzyme activity (U individual‐1) and age for (A) amylase, (B) lipase, (C) trypsin and (D) pepsin in
cobia larvae from 3 to 27 dph. Values are mean ± SEM (n=3 per time point). Significant differences between treatments and
age are indicated by shading (two‐way ANOVA, α=0.05)
0.0
2.0
4.0
6.0
8.0
10.0
0 10 20 3
U larvae
‐1
dph
Amylase
0
0.00
0.05
0.10
0.15
0.20
0.25
0.30
0.35
0 0 3
U larvae
‐1
Trypsin
10 2 0
dph
‐50
0
50
100
150
200
250
300
350
400
0 5 10 15 30
UHblarvae
‐1
Pepsin
20 25
dph
‐1
0
1
2
3
4
5
6
7
0 10 20 30
mU larvae
‐1
dph
Lipase
Control
Taurine
A
D C
B
DISCUSSION
The growth rate of control cobia during the present study was comparable to that observed
by Faulk et al. (2007a). However, the fish from this study were approximately 40% longer than
those reported by Faulk et al. (2007b) and Hitzfelder et al. (2006), and 26% longer than those
reported for tank‐reared cobia by Benetti et al. (2008). Although survival was low, it fell within
the range of data reported previously for pond‐reared larvae (Weirich, et al., 2004), and at the
lower end for cobia reared in tanks (Faulk and Holt, 2005; Faulk, et al., 2007b; Hitzfelder, et al.,
2006; Salze, et al., 2008). Taurine‐supplemented cobia larvae on the other hand, out‐performed
controls significantly in terms of survival, length and weight gain such that the weanlings from
this study represent the largest produced to date at 27 dph (P<0.05).
The precise mechanisms modulating the actions of taurine remain to be elucidated in fish.
Taurine is found in many tissue types (Huxtable, 1992), and is increasingly regarded as an
important, sometimes essential nutrient [e.g. in cats; (Hedberg, et al., 2007)]. Indeed, taurine is
incorporated in premature human infant milk formulas (Kendler, 1989; Sturman and Chesney,
1995), to prevent retinal degeneration and cholestasis (a condition occurring when bile cannot
flow to the duodenum), thereby underlining its importance during development, as also
suggested for fish by the results of the present trial. As in most developing animals, the
metabolic rate of fish larvae is high, denoting high demands for energy. Taurine is found in high
concentrations in mitochondria, where it is involved in the buffering and stabilization of the
mitochondrial matrix (Hansen, et al., 2006). Taurine modifies certain tRNA nucleotides that,
41
when missing, impair mitochondrial protein translation by increasing the frequency of codon
misreading (Umeda, et al., 2005). Additionally, in taurine transporter knockout mice, the
activity of oxidative phosphorylation enzymes is compromised (Ito, et al., 2006). Thus, taurine
appears to be of critical importance to mitochondrial function and energy production, which
partially could explain the poor performance of control larvae. Supplementation of taurine in
diets of juvenile fish (Gaylord, et al., 2006; Lunger, et al., 2007b; Sakaguchi, et al., 1988) where
better growth was observed likely occurred due to similar physiological impacts.
Marine fish larvae have an absolute requirement for long chain, highly unsaturated fatty
acids (HUFA) such as docosahexaenoic acid, ecosapentaenoic acid or arachidonic acid. These
molecules must be preserved, while at the same time the developing larvae must protect
themselves from oxidative stress. Taurine is known to participate in anti‐oxidative mechanisms
(Parvez, et al., 2008), and similar actions have been reported in fish (Sakai, et al., 1998).
Consequently, the beneficial effect of taurine on cobia growth also might arise from a
protective effect from oxidative stress and enhanced utilization of essential HUFA. Taurine is
also of primary importance to bone growth and growth regulation, and stimulates the
expression of connective tissue growth factor in human bone‐forming osteoblasts (Park, et al.,
2001; Yuan, et al., 2007). Moreover, taurine decreases the formation and survival of bone‐
degrading osteoclasts (Koide, et al., 1999) while strengthening bone structure (Jeon, et al.,
2007). These mechanisms may provide a partial explanation for the advanced growth in length
observed in taurine‐supplemented larvae.
42
Despite slight differences in larval rearing protocols, including temperature, salinity,
photoperiod regime and enrichment products, the ontogenic development of enzyme activities
in control animals was generally similar to those reported previously (Faulk, et al., 2007a). This
suggests that larval cobia development sequence is mainly driven by genetic and nutritional
factors, and is relatively independent from other environmental factors (Zambonino Infante
and Cahu, 2001). The timing and onset of appearance of enzyme activities however, was
different, as I observed a 2 to 5‐day delay for trypsin, amylase and lipase. This could have
occurred due to differences in assays employed, feeding strategies used, or the effects of
culture temperature. Irrespective of such considerations, when taken from a global perspective,
the initial elevation in enzyme activities occurs at around 16 dph. While 4‐dph cobia have been
observed to ingest Artemia nauplii, the results of the current trial indicate that larvae may be
more reliant on intracellular digestion prior to 16 dph, since pancreatic enzyme activity was
very low. However, the activity of brush‐border or cytosolic enzymes was not measured, which
would be necessary to ascertain this hypothesis. The 16‐dph time point also corresponded to
the beginning of the co‐feeding period, which suggests a possible role of the artificial diet in
modulating enzyme synthesis and activation. In their detailed review, Zambonino Infante and
Cahu (2007) considered potential influences of factors other than the enzymes themselves,
including hormones, cytokines, and nutrients on the onset of enzymatic activity in fish larvae.
These biomolecules could regulate enzyme synthesis at the transcriptional and translational
levels. Indeed, nutrients such as protein hydrolysate stimulate the activities of cytosolic
enzymes, but inhibits trypsin synthesis (Zambonino Infante and Cahu, 2007). Trypsin is also
translationally regulated by hormonal mechanisms involving cholecystokinin in response to the
43
presence of intact proteins, and fish meal can be a poor inducer of trypsin activity (Péres, et al.,
1998). Fish meal was an important ingredient in the weaning diet employed. Thus the nature of
dietary protein (fish meal vs. alternate sources), as well as the ratio of intact/hydrolyzed
protein, should be carefully adapted to the mode of digestion of the larvae. Just as in juvenile
nutrition, not only should a proper balance of energy to protein be presented to the larvae, but
it should also be delivered at the time the larva has the digestive enzymatic machinery to utilize
these nutrients.
Herein I describe for the first time the ontogeny of pepsin‐like activity in cobia larvae.
Although some marine fish larvae are weaned before the stomach reaches full functionality
(Hoehne‐Reitan, et al., 2001; Yúfera, et al., 2004), ontogeny of acidic protease activity remains
critical when evaluating the digestive capacity of cobia larvae. In larval cobia, acid peptidase
activity remained undetectable until 22 dph. This is well after the commencement of the
differentiation of the stomach mucosa and the presence of gastric glands described by Faulk et
al. (2007b). Similarly, in red porgy (Pagrus pagrus), pepsinogen mRNA is not expressed before
30 dph, even though gastric glands are fully developed, morphologically speaking, at 26 dph;
moreover, gastric pH only decreases at 35 dph in fed larvae (Darias, et al., 2005). In the present
study, the in vitro detection of pepsin‐like activity does not categorically demonstrate
hydrochloric acid production such that acidic peptidase activity may not occur in vivo at 22 dph.
Nevertheless, a remarkable feature of the present study was the 11‐fold increase in pepsin‐like
activity in fish receiving supplemental taurine. Whether this effect provided the young fish with
a digestive advantage, however, remains to be elucidated.
44
Dietary taurine has long been associated with bile salts and lipid digestion and assimilation
in fish (Walton, et al., 1982; Yokoyama and Nakazoe, 1992), with which the lipase activity
results in the present trial are in accordance. Lipid metabolism has been linked with thyroid
hormone status (Shin, et al., 2006), and which is known to influence development and
metamorphosis in many vertebrates, including anurans (McLean, et al., 1998) and fish (Brown
and Kim, 1995). Watanabe and co‐workers (2006) established a link between bile salts, energy
homeostasis and metabolic energy regulation. Using microarray technology, Park et al. (2006)
examined the impact of taurine on HepG2 human liver cells and confirmed interactions
between taurine, protein translation, bone growth, signalling pathways, growth and
development. Similar mechanisms of action would be likely for fish, with an abundance of
taurine in a diet signifying nutrient wealth, thus accelerating growth, development, and/or
cellular turnover and digestive efficiency as observed in the present trial. It is noteworthy that
taurine has been demonstrated to avert pancreatic alterations caused by gestational protein
malnutrition (Loizzo, et al., 2007), and it is possible that taurine had a like effect on the larval
cobia, thus highlighting the importance of this nutrient in development.
Acknowledgements
This research was supported by Virginia SeaGrant (EM, SRC). The authors are pleased to
acknowledge the assistance of Brendan Delbos and Michael H. Schwarz.
45
Cited references
Anson, M.L., 1938. The estimation of pepsin, trypsin, papain, and cathepsin with hemoglobin. Journal of General Physiology 22, 79‐89.
APHA, 1998. In: Clesceri, Greenberg, Trussell (Eds.), Standards methods for the examination of water and wastewater, Washington, DC.
Benetti, D.D., Sardenberg, B., Welch, A., Hoenig, R., Orhun, M.R., Zink, I., 2008. Intensive larval husbandry and fingerling production of cobia Rachycentron canadum. Aquaculture, in Press.
Brotons Martinez, J., Chatzifotis, S., Divanach, P., Takeuchi, T., 2004. Effect of dietary taurine supplementation on growth performance and feed selection of sea bass Dicentrarchus labrax fry fed with demand‐feeders. Fisheries Science 70, 74‐79.
Brown, C.L., Kim, B.G., 1995. Combined application of cortisol and triiodothyronine in the culture of larval marine finfish. Aquaculture 135, 79‐86.
Cahu, C.L., Zambonino Infante, J.L., 2001. Substitution of live food by formulated diets in marine fish larvae. Aquaculture 200, 161‐180.
Craig, S.R., Schwarz, M.H., McLean, E., 2006. Juvenile cobia (Rachycentron canadum) can utilize a wide range of protein and lipid levels without impacts on production characteristics. Aquaculture 261, 384‐391.
Darias, M.J., Murray, H.M., Martinez‐Rodriguez, G., Cardenas, S., Yufera, M., 2005. Gene expression of pepsinogen during the larval development of red porgy (Pagrus pagrus). Aquaculture 248, 245‐252.
Duncan, M., Craig, S.R., Lunger, A.N., Kuhn, D.D., Salze, G., McLean, E., 2007. Bioimpedance assessment of body composition in cobia Rachycentron canadum (L. 1766). Aquaculture 271, 432‐438.
Faulk, C.K., Holt, G.J., 2005. Advances in rearing cobia Rachycentron canadum larvae in recirculating aquaculture systems: Live prey enrichment and greenwater culture. Aquaculture 249, 231‐243.
Faulk, C.K., Benninghoff, A.D., Holt, G.J., 2007a. Ontogeny of the gastrointestinal tract and selected digestive enzymes in cobia Rachycentron canadum (L.). Journal of Fish Biology 70, 567‐583.
Faulk, C.K., Kaiser, J.B., Holt, G.J., 2007b. Growth and survival of larval and juvenile cobia Rachycentron canadum in a recirculating raceway system. Aquaculture 270, 149‐157.
Gaylord, T.G., Teague, A.M., Barrows, F.T., 2006. Taurine supplementation of all‐plant protein diets for rainbow trout (Oncorhynchus mykiss). Journal of the World Aquaculture Society 37, 509‐517.
Hale, L.P., Greer, P.K., Trinh, C.T., James, C.L., 2005. Proteinase activity and stability of natural bromelain preparations. International Immunopharmacology 5, 783‐793.
46
Hansen, S.H., Andersen, M.L., Birkedal, H., Cornett, C., Wibrand, F., 2006. The important role of taurine in oxidative metabolism. In: Oja, S.S., Saransaari, P. (Eds.), Taurine 6. Springer US, New York, pp. 129‐135.
Hedberg, G.E., Dierenfeld, E.S., Rogers, Q.R., 2007. Taurine and zoo felids: considerations of dietary and biological tissue concentrations. Zoo Biology 26, 517‐531.
Hitzfelder, G.M., Holt, G.J., Fox, J.M., McKee, D.A., 2006. The effect of rearing density on growth and survival of cobia, Rachycentron canadum, larvae in a closed recirculating aquaculture system. Journal of the World Aquaculture Society 37, 204‐209.
Hoehne‐Reitan, K., Kjørsvik, E., Reitan, K.I., 2001. Development of the pH in the intestinal tract of larval turbot. Marine Biology 139, 1159‐1164.
Holt, G.J., Faulk, C.K., Schwarz, M.H., 2007. A review of the larviculture of cobia Rachycentron canadum, a warm water marine fish. Aquaculture 268, 181‐187.
Huxtable, R.J., 1992. Physiological actions of taurine. Physiological Reviews 72, 101‐163. Ito, T., Uozumi, Y., Fujio, Y., Takahashi, K., Azuma, J., 2006. Impaired mitochondrial
ultrastructure and metabolic function in cardiac and skeletal muscle in taurine‐deficient mice. Circulation Research 99, E25‐E25.
Jameel, F., Mauri, F., Bogner, R., 1998. Identification and mass spectrometric sequence studies of fragments of l‐asparaginase produced during freeze/thaw cycling. Pda Journal of Pharmaceutical Science and Technology 52, 113‐122.
Jeon, S.‐H., Lee, M.‐Y., Kim, S.‐J., Joe, S.‐G., Kim, G.‐B., Kim, I.‐S., Kim, N.‐S., Hong, C.‐U., Kim, S.‐Z., Kim, J.‐S., Kang, H.‐S., 2007. Taurine increases cell proliferation and generates an increase in [Mg2+]i accompanied by ERK 1/2 activation in human osteoblast cells. FEBS Letters 581, 5929‐5934.
Kendler, B.S., 1989. Taurine: An overview of its role in preventive medicine. Preventive Medicine 18, 79‐100.
Kim, S.‐K., Takeuchi, T., Yokoyama, M., Murata, Y., Kaneniwa, M., Sakakura, Y., 2005. Effect of dietary taurine levels on growth and feeding behavior of juvenile Japanese flounder Paralichthys olivaceus. Aquaculture 250, 765‐774.
Koide, M., Okahashi, N., Tanaka, R., Kazuno, K., Shibasaki, K.‐i., Yamazaki, Y., Kaneko, K., Ueda, N., Ohguchi, M., Ishihara, Y., Noguchi, T., Nishihara, T., 1999. Inhibition of experimental bone resorption and osteoclast formation and survival by 2‐aminoethanesulphonic acid. Archives of Oral Biology 44, 711‐719.
Loizzo, A., Carta, S., Bennardini, F., Coinu, R., Loizzo, S., Guarino, I., Seghieri, G., Ghirlanda, G., Franconi, F., 2007. Neonatal taurine administration modifies metabolic programming in male mice. Early Human Development 83, 693‐696.
Lunger, A.N., Craig, S.R., McLean, E., 2006. Replacement of fish meal in cobia (Rachycentron canadum) diets using an organically certified protein. Aquaculture 257, 393‐399.
47
Lunger, A.N., McLean, E., Gaylord, T.G., Kuhn, D., Craig, S.R., 2007. Taurine supplementation to alternative dietary proteins used in fish meal replacement enhances growth of juvenile cobia (Rachycentron canadum). Aquaculture 271, 401‐410.
Matsunari, H., Takeuchi, T., Takahashi, M., Mushiake, K., 2005. Effect of dietary taurine supplementation on growth performance of yellowtail juveniles Seriola quinqueradiata. Fisheries Science 71, 1131‐1135.
McLean, E., Mayer, I., Kieffer, T.J., Donaldson, E.M., Souza, L.M., 1998. Growth and metamorphosis in tadpoles of Rana pretiosa pretiosa, treated with recombinant porcine growth hormone, prolactin, somatostatin (SRIF) and anti‐SRIF. Ribarstvo 56, 43‐54.
McLean, E., Salze, G., Craig, S.R., 2008. Parasites, diseases and deformities of Cobia. Ribarstvo 66, 1‐16.
Park, S., Kim, H., Kim, S.‐J., 2001. Stimulation of ERK2 by taurine with enhanced alkaline phosphatase activity and collagen synthesis in osteoblast‐like UMR‐106 cells. Biochemical Pharmacology 62, 1107‐1111.
Park, S.H., Lee, H., Park, K.K., Kim, H.W., Park, T., 2006. Taurine‐responsive genes related to signal transduction as identified by cDNA microarray analyses of HepG2 cells. Journal of Medicinal Food 9, 33‐41.
Parvez, S., Tabassum, H., Banerjee, B.D., Raisuddin, S., 2008. Taurine prevents tamoxifen‐induced mitochondrial oxidative damage in mice. Basic & Clinical Pharmacology & Toxicology 102, 382‐387.
Péres, A., Zambonino Infante, J.L., Cahu, C.L., 1998. Dietary regulation of activities and mRNA levels of trypsin and amylase in sea bass (Dicentrarchus labrax) larvae. Fish Physiology and Biochemistry 19, 145‐152.
Ryle, A.P., 1984. Pepsin, gastricsins and their zymogens. In: Bergmeyer, J. (Ed.), Methods of enzymatic analysis. Verlag Chemie, Weinheim, pp. 223‐238.
Sakaguchi, M., Murata, M., Daikoku, T., Arai, S., 1988. Effects of dietary taurine on tissue taurine and free amino acid levels of the Chum salmon Oncorhyncus keta, reared in freshwater and seawater environments. Comparative Biochemistry and Physiology 89A, 437‐442.
Sakai, T., Murata, H., Endo, M., Shimomura, T., Yamauchi, K., Ito, T., Yamaguchi, T., Nakajima, H., Fukudome, M., 1998. Severe oxidative stress is thought to be a principal cause of jaundice of yellowtail Seriola quinqueradiata. Aquaculture 160, 205‐214.
Salze, G., McLean, E., Schwarz, M.H., Craig, S.R., 2008. Dietary mannan oligosaccharide enhances salinity tolerance and gut development of larval cobia. Aquaculture 274, 148‐152.
Schwarz, M., Craig, S.R., McLean, E., 2006. Cobia update: Fast‐growing species first focus of international aquaculture initiative, Global Aquaculture Advocate, April 2006, 50‐52.
48
Schwarz, M.H., McLean, E., Craig, S.R., 2007. Research experience with cobia: larval rearing, juvenile nutrition and general physiology. In: Liao, C.I., Leaño, E.M. (Eds.), Cobia Aquaculture: Research Development and Commercial Production. Asian Fisheries Society, Manila, Philippines; World Aquaculture Society, Baton Rouge, Louisiana, USA; The Fisheries Society of Taiwan, Keelung Taiwan; and National Taiwan Ocean University, Keelung, Taiwan.
Shields, R.J., Bell, J.G., Luizi, F.S., Gara, B., Bromage, N.R., Sargent, J.R., 1999. Natural copepods are superior to enriched Artemia nauplii as feed for halibut larvae (Hippoglossus hippoglossus) in terms of survival, pigmentation and retinal morphology: Relation to dietary essential fatty acids. Journal of Nutrition 129, 1186‐1194.
Shin, D.‐J., Plateroti, M., Samarut, J., Osborne, T.F., 2006. Two uniquely arranged thyroid hormone response elements in the far upstream 5’ flanking region confer direct thyroid hormone regulation to the murine cholesterol 7a hydroxylase gene. Nucleic Acids Research 34, 3853–3861.
Sturman, J.A., Chesney, R.W., 1995. Taurine in pediatric nutrition. The Pediatric Clinics of North America 42, 879‐897.
Takeuchi, T., 2001. A review of feed development for early life stages of marine finfish in Japan. Aquaculture 200, 203‐222.
Umeda, N., Suzuki, T., Yukawa, M., Ohya, Y., Shindo, H., Watanabe, K., Suzuki, T., 2005. Mitochondria‐specific RNA‐modifying enzymes responsible for the biosynthesis of the wobble base in mitochondrial tRNAs. Implications for the molecular pathogenesis of human mitochondrial diseases. Journal of Biological Chemistry 280, 1613‐1624.
Uys, W., Hecht, T., 1987. Assays on the digestive enzymes of sharptooth catfish, Clarias gariepinus (Pisces: Clariidae). Aquaculture 63, 301‐313.
van der Meeren, T., Olsen, R.E., Hamre, K., Fyhn, H.J., 2008. Biochemical composition of copepods for evaluation of feed quality in production of juvenile marine fish. Aquaculture 274, 375‐397.
Walsh, K.A., Gertrude, E.P.a.L.L., 1970. Trypsinogens and trypsins of various species, Methods in Enzymology. Academic Press, New York, USA, pp. 41‐63.
Walton, M.J., Cowey, C.B., Adron, J.W., 1982. Methionine metabolism in rainbow trout fed diets of differing methionine and cystine content. Journal of Nutrition 112, 1525‐1535.
Watanabe, M., Houten, S.M., Mataki, C., Christoffolete, M.A., Kim, B.W., Sato, H., Messaddeq, N., Harney, J.W., Ezaki, O., Kodama, T., Schoonjans, K., Bianco, A.C., Auwerx, J., 2006. Bile acids induce energy expenditure by promoting intracellular thyroid hormone activation. Nature 439, 484‐489.
Weirich, C.R., Smith, T.I.J., Denson, M.R., Stokes, A.D., Jenkins, W.E., 2004. Pond culture of larval and juvenile cobia, Rachycentron canadum, in the Southeastern United States: initial observations. Journal of Applied Aquaculture 16, 27‐44.
49
Yokoyama, M., Nakazoe, J.‐I., 1992. Accumulation and excretion of taurine in rainbow trout (Oncorhynchus mykiss) fed diets supplemented with methionine, cystine and taurine. Comparative Biochemistry and Physiology Part A: Physiology 102, 565‐568.
Yuan, L.Q., Lu, Y., Luo, X.H., Xie, H., Wu, X.P., Liao, E.Y., 2007. Taurine promotes connective tissue growth factor (CTGF) expression in osteoblasts through the ERK signal pathway. Amino Acids 32, 425‐430.
Yúfera, M., Fernández‐Díaz, C., Vidaurreta, A., Cara, J.B., Moyano, F.J., 2004. Gastrointestinal pH and development of the acid digestion in larvae and early juveniles of Sparus aurata (Pisces: Teleostei). Marine Biology 144, 863‐869.
Yúfera, M., Darias, M.J., 2007. The onset of exogenous feeding in marine fish larvae. Aquaculture 268, 53‐63.
Zambonino Infante, J.L., Cahu, C.L., 2001. Ontogeny of the gastrointestinal tract of marine fish larvae. Comparative Biochemistry and Physiology Part C: Toxicology & Pharmacology 130, 477‐487.
Zambonino Infante, J.L., Cahu, C.L., 2007. Dietary modulation of some digestive enzymes and metabolic processes in developing marine fish: Applications to diet formulation. Aquaculture 268, 98‐105.
50
Chapter IV . MORPHOLOG I CAL
DEVELOPMENT OF LARVAL COB IA
Abstract
The morphological development of larval cobia Rachycentron canadum (L.) from 3 days‐post‐hatch (dph) until weaning was examined using scanning electron microscopy. Two groups of fish were studied: a control (CF) reared under standard feeding protocol, and a group in which prey items were enriched with supplemental taurine (4 g L‐1 d‐1; TF). TF fish grew faster (P<0.0001), attained greater size (55.1 ± 1.48 mm vs 33.9 ± 1.01 mm) and had higher survival (29.3 ± 0.4% vs. 7.1 ± 1.2 %) than CF fish. Canonical variance analysis confirmed findings with respect to differences in growth between the treatment groups, with separation being explained by two measurements. At 3 dph, larvae exhibited preopercular spikes, sensory epithelia on head and body, an open mouth exhibiting taste buds and primitive nares which took the form of simple concave depressions. The cephalic lateral line system commenced development 12‐14 dph in control groups, with invagination of both supra‐ and infraorbital canals. At the same time, the orbital bone acquired a thorn‐like or acanthoid crest. At 14 dph the mandibular and preopercular canals were observed and around 22 dph enclosure of all canals neared completion. In TF larvae, the cephalic lateral line system commenced development 4 days earlier than seen in CF cobia larvae, with enclosure commencing at 18 dph. Primordial gill arches were detected at 6 dph with arches, some of which bore filaments, appearing at 8 dph. Along the flanks of 6‐dph larvae, four to five equally‐spaced neuromasts delineated the future position of the trunk lateral line. As myomeres were added by the growing larvae, new neuromasts appeared such that each myomere was associated with a neuromast. Development of the trunk lateral line in terms of its enclosure was not observed in weaned CF fish (27 dph), although in the TF group, initiation of canal closure was observed. Teeth were recorded for the first time in CF fish at 20‐22 dph, whereas in TF animals teeth appeared between 18‐20 dph.
Keywords: ontogeny; taurine; neuromasts; lateral line; scanning electron microscopy;
aquaculture;
51
INTRODUCTION
Larval survival during ontogenesis is dependent, among other factors, on their ability to
detect, capture, handle, ingest, digest, and assimilate nutritionally complete food. In
carnivorous fishes, the ability to acquire energy is perfected over time, commencing with
passive encounters and ultimately evolving into active hunting. During this transformation,
there is a coordinated maturation of morphological and physiological enabling mechanisms that
include sensory epithelia and organs, locomotive function, oral manipulative abilities, digestive
apparatus, appropriate absorptive tissues and assimilative machinery. Delay in this
developmental course can lead to stunting, impaired function or even death. A good example
of this is seen with the starvation and death of larvae in spite of the presence of food in the
intestine (Katavic, 1986; Yúfera, et al., 1996).
Cobia (Rachycentron canadum, L., 1766) is monotypic of the family Rachycentridae. It has a
global distribution in tropical and subtropical waters, except for the eastern Pacific (McLean, et
al., 2008a). As with other candidate species for cultivation, there currently exists a dearth of
information on cobia larval development and physiology and this lack may partially contribute
to the relatively poor survival rates observed in hatcheries. The gross changes in external
morphology of larval cobia have been described previously using wild and museum specimens
(Ditty and Shaw, 1992; Finucane, et al., 1978; Hardy, 1978), but no definitive description of
larval development has been provided with respect to cultured cobia. Investigations with
cultured cobia larvae illustrate changes in lipid composition throughout the developmental
52
phase (Faulk and Holt, 2003) and diet‐related effects on larval fatty acid composition (Faulk and
Holt, 2005; Turner and Rooker, 2005). Moreover, diet impacts intestinal fold morphology and
integrity (Salze, et al., 2008; Schwarz, et al., 2007), the rate of scoliosis and jaw deformity
(McLean, et al., 2008a; Niu, et al., 2008a; Salze, et al., 2008), while also influencing hepatic
enzyme activities (Niu, et al., 2008a). Two studies have examined the time‐course of
appearance of various intestinal digestive enzymes in larval cobia in relation to the ontogeny of
the gastrointestinal (GI) tract (Faulk, et al., 2007a; Salze, 2008). These investigations
determined that a fully differentiated stomach appeared between 16 and 20 days post‐hatch
(dph), but enzymatic functionality (i.e., pepsin‐like activity) was not discerned until 22 dph
(Salze, 2008).
Some of the above information has been integrated into the design of feeding protocols and
diets in attempts to increase larval performance. Improved feeds have resulted in increased
productivity (Benetti, et al., 2008; Faulk and Holt, 2005; Holt, et al., 2007; Niu, et al., 2008b).
Notwithstanding these initial successes, reported weanling survival rates still hover around 3
larvae per liter, which is insufficient to support a more rapid growth of commercial activities.
Further improvements in weanling production can be built upon increased understanding and
knowledge of larval development and nutritional requirements.
Most studies with larval cobia have taken an end‐point approach – that is evaluation of
survival and or growth following changes to specific components of rearing protocols (e.g.
temperature, salinity, feeds, density). However, more comprehensive approaches, which
53
examine a greater range of responses, while being less common, clearly offer superior potential
in unravelling critical steps in ontogeny that may be employed to develop elite rearing
strategies to enhance larval cobia survival. Accordingly, the objective of the present study was
to examine the developmental sequence of cultured cobia larvae with particular regard to the
ontogeny of sensory epithelia. Concomitantly, the impact of dietary modification, which here
examined the effect of supplementary taurine, was explored with respect to developmental
ontogeny.
MATERIALS & METHODS
Fish and husbandry
Eighteen thousand, 2 days‐post‐hatch (dph, 4.4 ± 0.28 mm) cobia larvae, derived from the
same batch of eggs, were obtained from the University of Miami, Rosenstiel School of Marine
and Atmospheric Science. Animals were stocked randomly into one of two independent,
replicated recirculating aquaculture systems at a density of 10 larvae L‐1. The design and
operating characteristics of each system were described previously by Salze, et al. (2008).
Water quality parameters, analyzed daily, included total ammonia nitrogen (0.1 ± 0.1 mg L‐1),
NO2‐N (0.1 ± 0.0 mgL‐1) and NO3‐N (3.7 ± 0.7 mg L‐1) which were measured
spectrophotometrically (HACH DR/2400 Spectrophotometer, HACH Co., Loveland, CO);
dissolved oxygen (6.2 ± 0.3 mg L‐1), temperature (27.8 ± 0.6 ºC) and salinity (27.0 ± 3.2 mg L‐1),
which were monitored using a YSI model 85 meter (Yellow Springs Instruments., Yellow Springs,
54
OH); pH (7.8 ± 0.1), measured by a HI 9024 pH meter (HANNA Instruments, Woonsocket, RI)
and alkalinity (131.7 ± 13.4 mg/L), which was determined by titration (APHA, 1998).
Diets
The feeding schedules employed during the present study mimicked those of Salze et al
2008 (see Figure III–1). Briefly, green water (approx. 120,000 cells ml‐1 Nannochloropsis sp. algal
paste, Reed Mariculture, Campbell, CA) and L‐type rotifers (Brachionus plicatilis, 1.5‐2.5 rotifer
ml‐1) were fed until 8 dph, at which point Artemia only was offered (1‐1.5 nauplii ml‐1). Live
feeds included enriched rotifers, non‐enriched, small‐sized high‐HUFA profile AF‐Artemia
nauplii, and enriched EG‐Artemia nauplii. Rotifers were enriched with DC DHA Selco (INVE Inc.,
Salt Lake City, UT) at 0.4g L‐1 day‐1. Similarly, EG Artemia were enriched for 24 hours with DC
DHA Selco at 0.6g L‐1. All live‐prey diets were offered every 6 hours manually. Co‐feeding of
larvae with Otohime weaning feeds (Reed Mariculture, Campbell, CA) commenced at 15 dph,
with 100% artificial diets being offered from 25 dph after a 3‐day weaning period. The dry feed
was distributed every hour using automated vibrating feeders (Sweeney Feeders, Boerne, TX).
Taurine‐enriched live prey were delivered according to the same schedule and prepared in a
similar manner: rotifers were enriched with 0.6g L‐1 day‐1 of DHA Selco with the addition of
4g L‐1 day‐1 of taurine, while Artemia enrichment consisted in 0.6 g L‐1 of DHA Selco and 4g L‐1 of
taurine. The following text will refer to control‐fed fish as CF fish and larvae fed the taurine‐
based diet as TF fish.
55
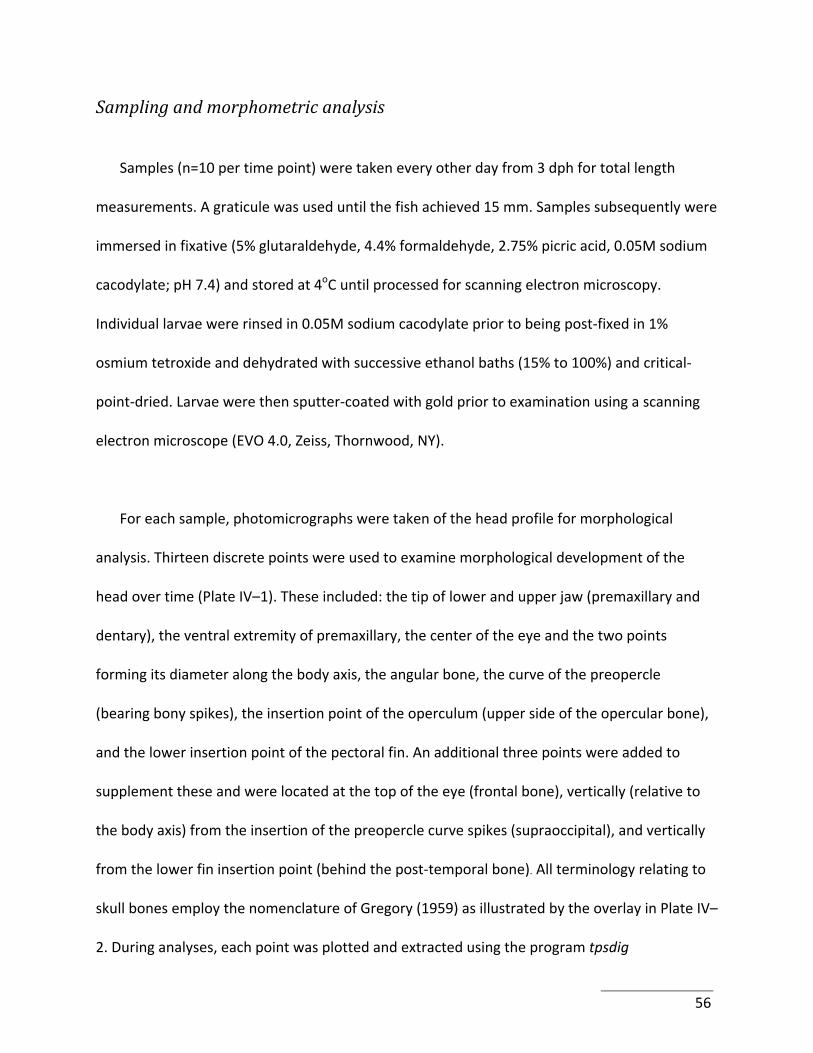
Sampling and morphometric analysis
Samples (n=10 per time point) were taken every other day from 3 dph for total length
measurements. A graticule was used until the fish achieved 15 mm. Samples subsequently were
immersed in fixative (5% glutaraldehyde, 4.4% formaldehyde, 2.75% picric acid, 0.05M sodium
cacodylate; pH 7.4) and stored at 4oC until processed for scanning electron microscopy.
Individual larvae were rinsed in 0.05M sodium cacodylate prior to being post‐fixed in 1%
osmium tetroxide and dehydrated with successive ethanol baths (15% to 100%) and critical‐
point‐dried. Larvae were then sputter‐coated with gold prior to examination using a scanning
electron microscope (EVO 4.0, Zeiss, Thornwood, NY).
For each sample, photomicrographs were taken of the head profile for morphological
analysis. Thirteen discrete points were used to examine morphological development of the
head over time (Plate IV–1). These included: the tip of lower and upper jaw (premaxillary and
dentary), the ventral extremity of premaxillary, the center of the eye and the two points
forming its diameter along the body axis, the angular bone, the curve of the preopercle
(bearing bony spikes), the insertion point of the operculum (upper side of the opercular bone),
and the lower insertion point of the pectoral fin. An additional three points were added to
supplement these and were located at the top of the eye (frontal bone), vertically (relative to
the body axis) from the insertion of the preopercle curve spikes (supraoccipital), and vertically
from the lower fin insertion point (behind the post‐temporal bone). All terminology relating to
skull bones employ the nomenclature of Gregory (1959) as illustrated by the overlay in Plate IV–
2. During analyses, each point was plotted and extracted using the program tpsdig
56
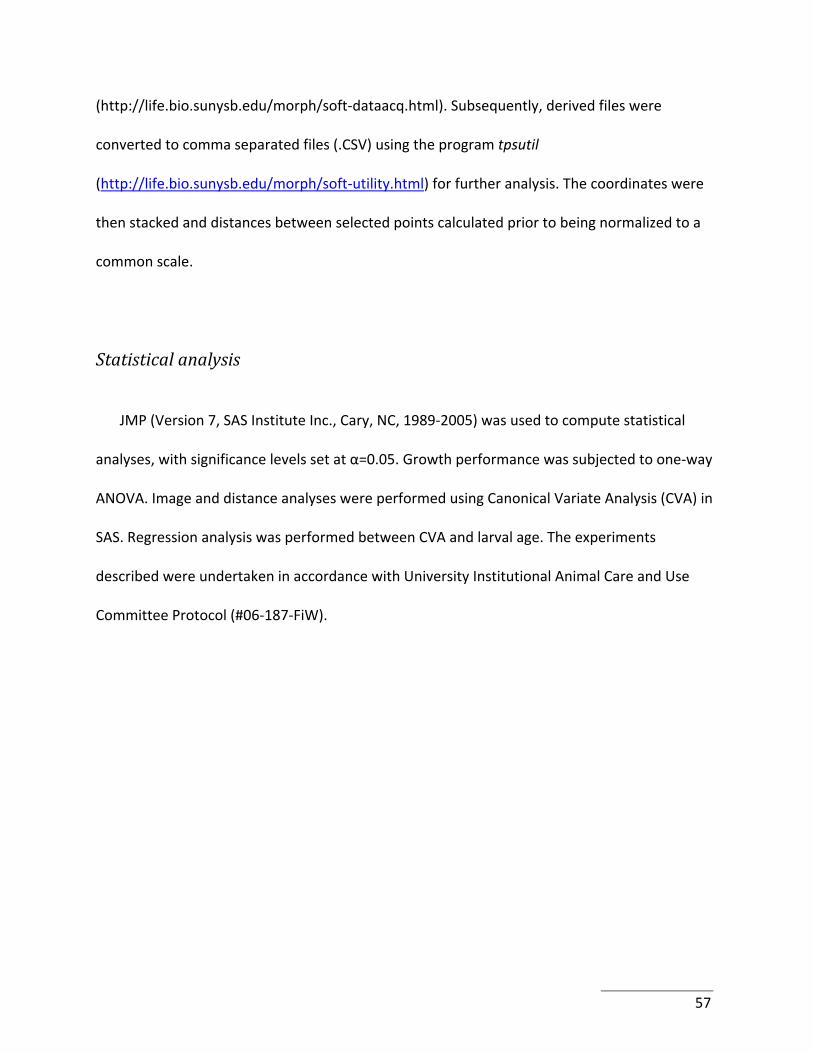
(http://life.bio.sunysb.edu/morph/soft‐dataacq.html). Subsequently, derived files were
converted to comma separated files (.CSV) using the program tpsutil
(http://life.bio.sunysb.edu/morph/soft‐utility.html) for further analysis. The coordinates were
then stacked and distances between selected points calculated prior to being normalized to a
common scale.
Statistical analysis
JMP (Version 7, SAS Institute Inc., Cary, NC, 1989‐2005) was used to compute statistical
analyses, with significance levels set at α=0.05. Growth performance was subjected to one‐way
ANOVA. Image and distance analyses were performed using Canonical Variate Analysis (CVA) in
SAS. Regression analysis was performed between CVA and larval age. The experiments
described were undertaken in accordance with University Institutional Animal Care and Use
Committee Protocol (#06‐187‐FiW).
57
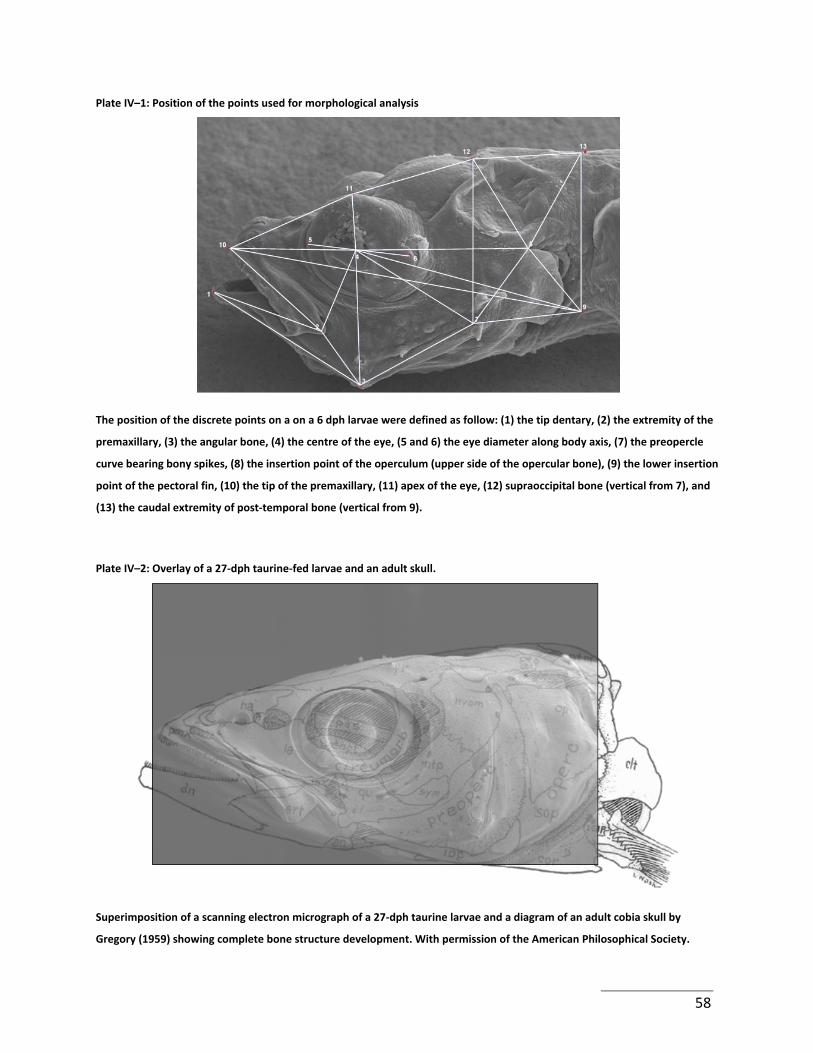
Plate IV–1: Position of the points used for morphological analysis
The position of the discrete points on a on a 6 dph larvae were defined as follow: (1) the tip dentary, (2) the extremity of the
premaxillary, (3) the angular bone, (4) the centre of the eye, (5 and 6) the eye diameter along body axis, (7) the preopercle
curve bearing bony spikes, (8) the insertion point of the operculum (upper side of the opercular bone), (9) the lower insertion
point of the pectoral fin, (10) the tip of the premaxillary, (11) apex of the eye, (12) supraoccipital bone (vertical from 7), and
(13) the caudal extremity of post‐temporal bone (vertical from 9).
Plate IV–2: Overlay of a 27‐dph taurine‐fed larvae and an adult skull.
Superimposition of a scanning electron micrograph of a 27‐dph taurine larvae and a diagram of an adult cobia skull by
Gregory (1959) showing complete bone structure development. With permission of the American Philosophical Society.
58
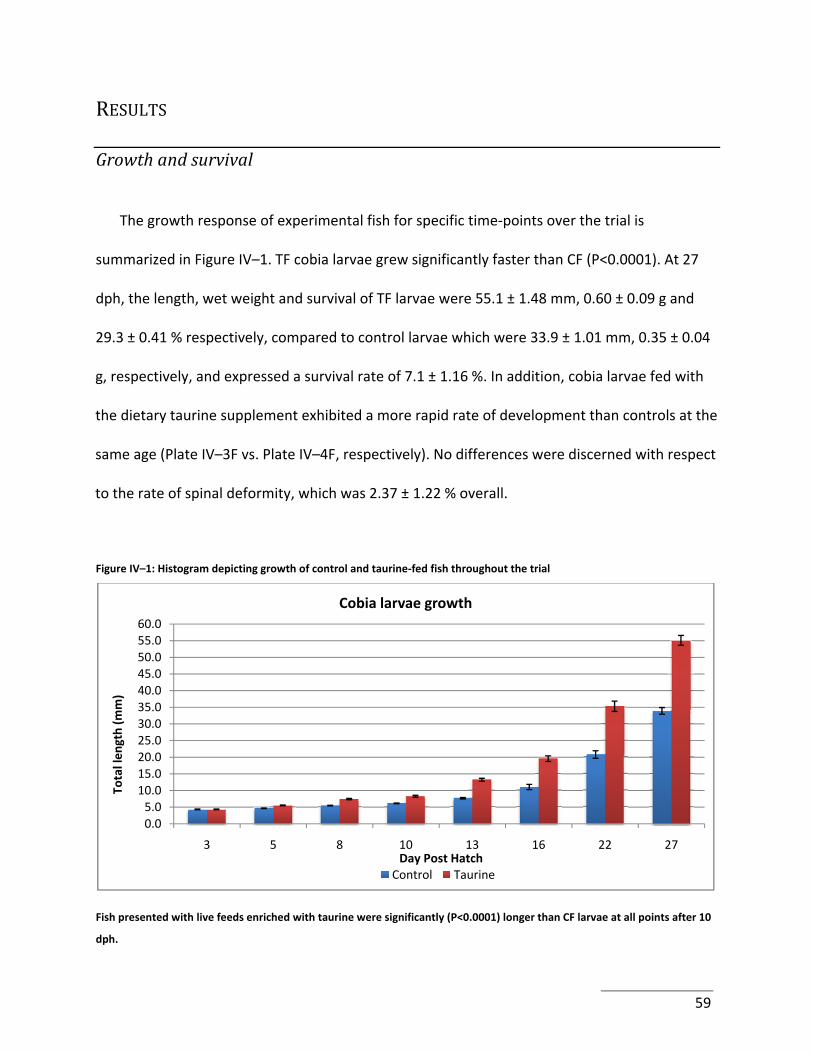
RESULTS
Growth and survival
The growth response of experimental fish for specific time‐points over the trial is
summarized in Figure IV–1. TF cobia larvae grew significantly faster than CF (P<0.0001). At 27
dph, the length, wet weight and survival of TF larvae were 55.1 ± 1.48 mm, 0.60 ± 0.09 g and
29.3 ± 0.41 % respectively, compared to control larvae which were 33.9 ± 1.01 mm, 0.35 ± 0.04
g, respectively, and expressed a survival rate of 7.1 ± 1.16 %. In addition, cobia larvae fed with
the dietary taurine supplement exhibited a more rapid rate of development than controls at the
same age (Plate IV–3F vs. Plate IV–4F, respectively). No differences were discerned with respect
to the rate of spinal deformity, which was 2.37 ± 1.22 % overall.
Figure IV–1: Histogram depicting growth of control and taurine‐fed fish throughout the trial
0.05.0
10.015.020.025.030.035.040.045.050.055.060.0
3 5 8 10 13 16 22 27
Total len
gth (m
m)
Day Post Hatch
Cobia larvae growth
Control Taurine
Fish presented with live feeds enriched with taurine were significantly (P<0.0001) longer than CF larvae at all points after 10
dph.
59
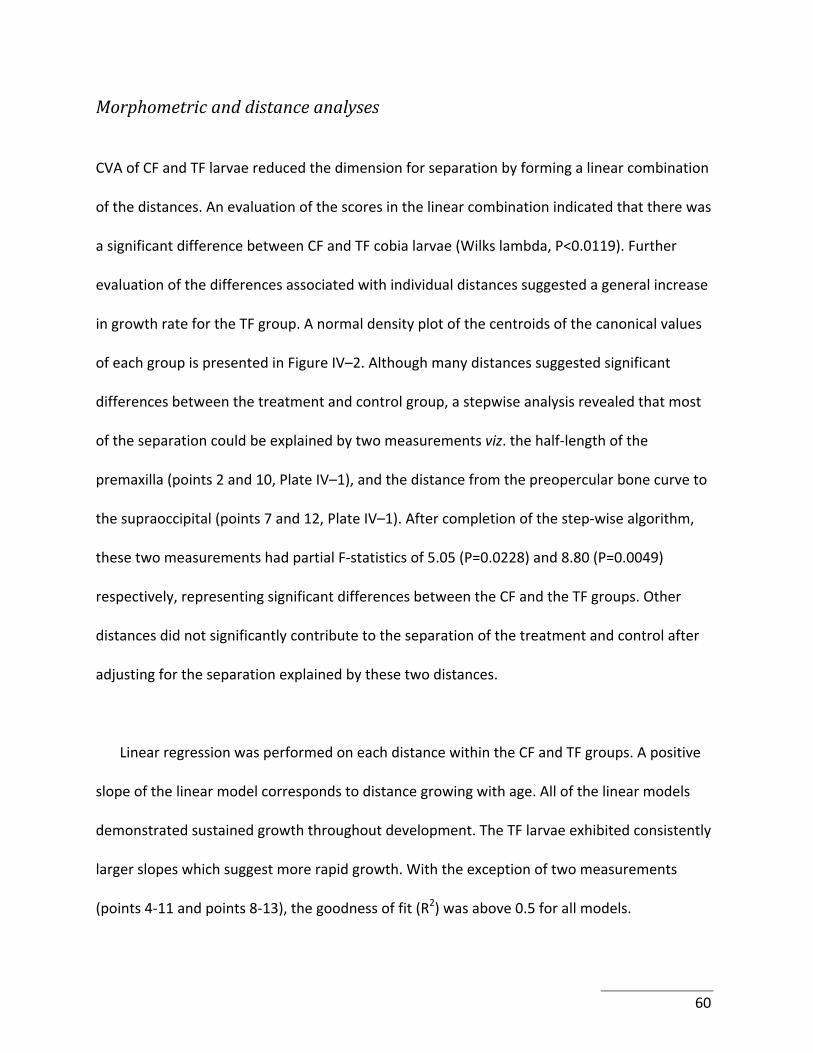
Morphometric and distance analyses
CVA of CF and TF larvae reduced the dimension for separation by forming a linear combination
of the distances. An evaluation of the scores in the linear combination indicated that there was
a significant difference between CF and TF cobia larvae (Wilks lambda, P<0.0119). Further
evaluation of the differences associated with individual distances suggested a general increase
in growth rate for the TF group. A normal density plot of the centroids of the canonical values
of each group is presented in Figure IV–2. Although many distances suggested significant
differences between the treatment and control group, a stepwise analysis revealed that most
of the separation could be explained by two measurements viz. the half‐length of the
premaxilla (points 2 and 10, Plate IV–1), and the distance from the preopercular bone curve to
the supraoccipital (points 7 and 12, Plate IV–1). After completion of the step‐wise algorithm,
these two measurements had partial F‐statistics of 5.05 (P=0.0228) and 8.80 (P=0.0049)
respectively, representing significant differences between the CF and the TF groups. Other
distances did not significantly contribute to the separation of the treatment and control after
adjusting for the separation explained by these two distances.
Linear regression was performed on each distance within the CF and TF groups. A positive
slope of the linear model corresponds to distance growing with age. All of the linear models
demonstrated sustained growth throughout development. The TF larvae exhibited consistently
larger slopes which suggest more rapid growth. With the exception of two measurements
(points 4‐11 and points 8‐13), the goodness of fit (R2) was above 0.5 for all models.
60
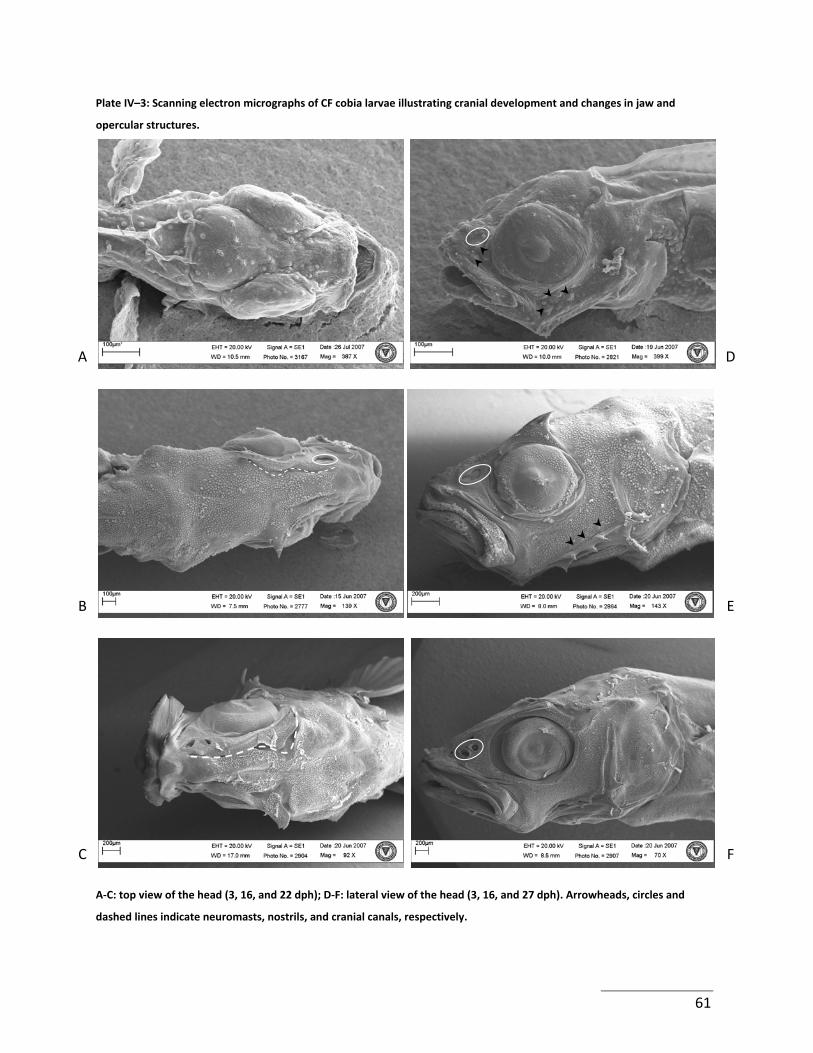
Plate IV–3: Scanning electron micrographs of CF cobia larvae illustrating cranial development and changes in jaw and
opercular structures.
A D
B E
C F
A‐C: top view of the head (3, 16, and 22 dph); D‐F: lateral view of the head (3, 16, and 27 dph). Arrowheads, circles and
dashed lines indicate neuromasts, nostrils, and cranial canals, respectively.
61
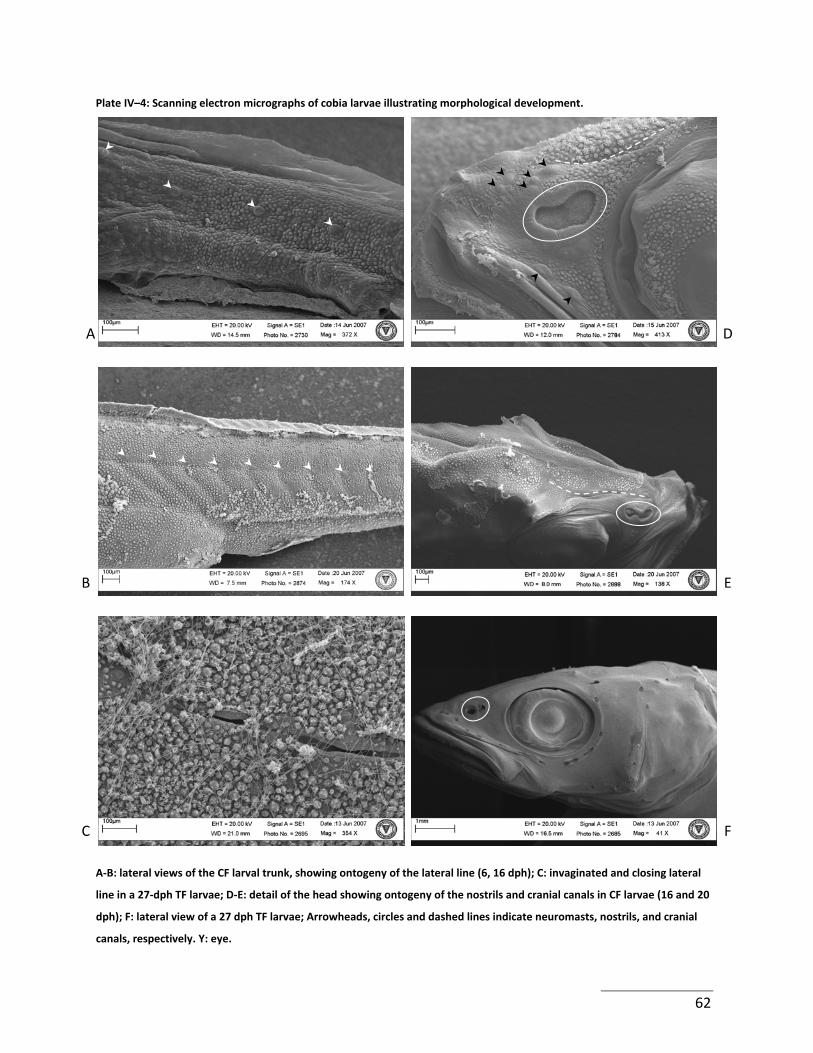
Plate IV–4: Scanning electron micrographs of cobia larvae illustrating morphological development.
A D
B E
C F
A‐B: lateral views of the CF larval trunk, showing ontogeny of the lateral line (6, 16 dph); C: invaginated and closing lateral
line in a 27‐dph TF larvae; D‐E: detail of the head showing ontogeny of the nostrils and cranial canals in CF larvae (16 and 20
dph); F: lateral view of a 27 dph TF larvae; Arrowheads, circles and dashed lines indicate neuromasts, nostrils, and cranial
canals, respectively. Y: eye.
62
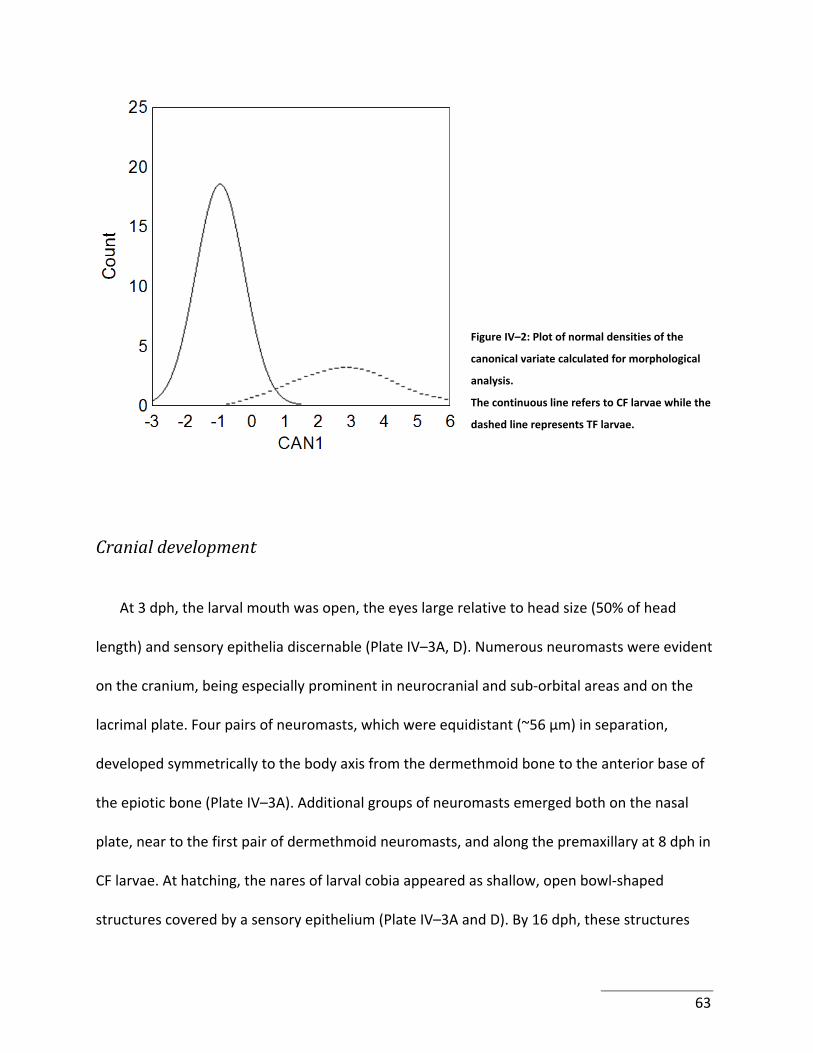
Figure IV–2: Plot of normal densities of the
canonical variate calculated for morphological
analysis.
The continuous line refers to CF larvae while the
dashed line represents TF larvae.
Cranial development
At 3 dph, the larval mouth was open, the eyes large relative to head size (50% of head
length) and sensory epithelia discernable (Plate IV–3A, D). Numerous neuromasts were evident
on the cranium, being especially prominent in neurocranial and sub‐orbital areas and on the
lacrimal plate. Four pairs of neuromasts, which were equidistant (~56 μm) in separation,
developed symmetrically to the body axis from the dermethmoid bone to the anterior base of
the epiotic bone (Plate IV–3A). Additional groups of neuromasts emerged both on the nasal
plate, near to the first pair of dermethmoid neuromasts, and along the premaxillary at 8 dph in
CF larvae. At hatching, the nares of larval cobia appeared as shallow, open bowl‐shaped
structures covered by a sensory epithelium (Plate IV–3A and D). By 16 dph, these structures
63
became more prominent, more concave and elongated. Moreover, the nares developed a
constriction which appeared in the middle of the structure’s long axis (Plate IV–4D, E). This
constriction merged, ultimately forming two apparently disconnected pits at 20‐22 dph (Plate
IV–3F). In TF larvae, the time to nares constriction occurred more rapidly (13 dph) and
separation into pits was completed approximately 4 days earlier – i.e. 16‐18 dph – than CF
larvae.
Nascent preopercular spikes were present at 3 dph (Table IV–1), attained maximum length
around 16 dph, and subsequently were resorbed at full metamorphosis. Development of the
cephalic lateral line system commenced between 12 to 14 dph in CF larvae with invagination of
the future supraorbital and infraorbital canals (SOC and IOC). Concomitantly, the orbital bone
acquired an acanthoid crest (Plate IV–3E), the resorption of which was complete by 22 dph. The
IOC was positioned over the circumorbital bone and terminated subordinately to the SOC. At 14
dph, two additional canals started to form: the mandibular and preopercular canals (Plate IV–
3E). No direct connection of the latter two canals was observed. At 16 dph, all cranial canals
were clearly visible and by 22 dph enclosure was near completion. In TF larvae, the SOC and IOC
commenced invagination at 8 dph, with the canals enclosing at 18 dph. The paired SOCs, which
adjoined over the frontal bones, connected to the trunk lateral line on their respective sides.
Likewise, the development of the mandibular and preopercular canals was contracted in time
relative to that of the CF group. Finally, presumptive taste‐buds were discerned on the lips and
palate of 3 dph larvae. In CF larvae, discrete teeth were first observed at 22 dph (Plate IV–4C).
64
Development of the gills, trunk and tail
At 6 dph, primordial gill arches were discerned (Plate IV–5A) and by 8 dph, of the 3 visible gill
arches observed, the second and third bore filaments and developing lamellae buds (Plate IV–
5B). By 13 dph, lamellae were discrete on observable filaments, which became obscured by the
operculum at 16‐22 dph. Similar developmental patterns for the gills were seen in fish fed
taurine at 6 and 8 dph. However, in contrast to CF larvae, by 13 dph, TF larvae presented more
advanced gill development, including the presence of longer lamellae.
At 3 dph, neuromasts were distinguishable along both flanks of the larvae, although cupulae
were not observed on any preparations. At 6 dph, four to five neuromasts were present on
either side of the trunk. These were equally spaced, occurring every 4 myomeres (~200 μm,
Plate IV–4A) with an apparent anterior‐to‐posterior pattern of maturation. Trunk neuromasts
increased in abundance over time until, at 16 dph, each myomere was associated with its own
neuromast (Plate IV–4B). At this point in ontogeny however, all trunk neuromasts were naked
with no canal invagination visible. Initiation of closure of the trunk lateral line was only
observed in 27 dph TF larvae (Plate IV–4C), suggesting a delayed developmental sequence
compared to the cranial lateral line complex.
Appearance of the hypural segments was observed between 8 and 9 dph, which preceded
the development of finrays and notochord flexion (10 dph; Table IV–1).
65
At hatching, the larval skin was scale‐less with initial scaling occurring at 6 dph. Nascent
scales or spicules were present over the entire body by 12 dph and displayed a characteristic
crown shape (Plate IV–5D). Desquamation, indicated by detached spicules above newly‐formed
ones, appeared to be a continuous process from 14 dph.
DISCUSSION
Ditty and Shaw (1992) provided a general description of wild larval cobia gross morphology,
and the overall developmental features of cultured fish did not deviate fundamentally from
their wild conspecifics. Specifically, Ditty and Shaw (1992) noted the appearance of notochord
flexion when larvae were 5 and 6.5‐8 mm respectively, which corresponded to a delay of 1 to 2
days when compared to the present study. These differences were likely the result of the lower
and more variable temperatures recorded during the museum specimens capture (range 24.2‐
32.0 degree‐days; od). The same authors observed “minute epithelial spicules” covering the
body of larval animals, which were observed in the present study even at 27 dph, indicating
that transition into true scales occurs later, as indicated in Vaughn‐Shaffer and Nakamura
(1989).
66
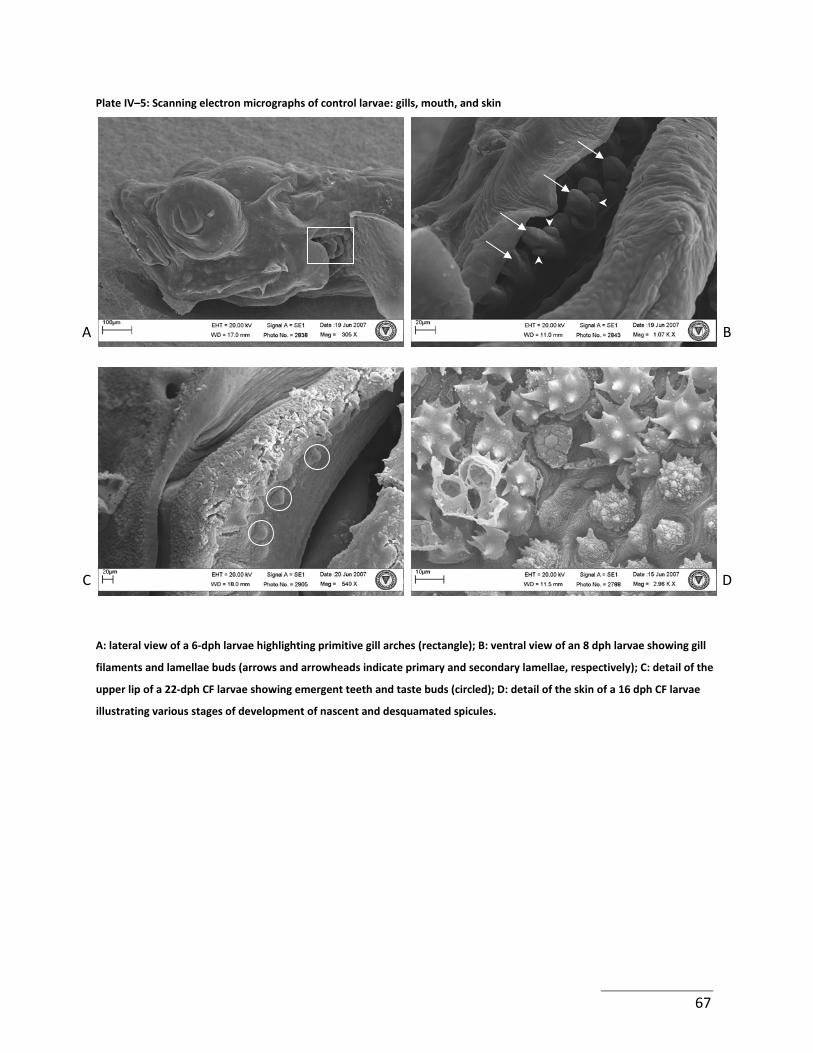
Plate IV–5: Scanning electron micrographs of control larvae: gills, mouth, and skin
A B
C D
A: lateral view of a 6‐dph larvae highlighting primitive gill arches (rectangle); B: ventral view of an 8 dph larvae showing gill
filaments and lamellae buds (arrows and arrowheads indicate primary and secondary lamellae, respectively); C: detail of the
upper lip of a 22‐dph CF larvae showing emergent teeth and taste buds (circled); D: detail of the skin of a 16 dph CF larvae
illustrating various stages of development of nascent and desquamated spicules.
67
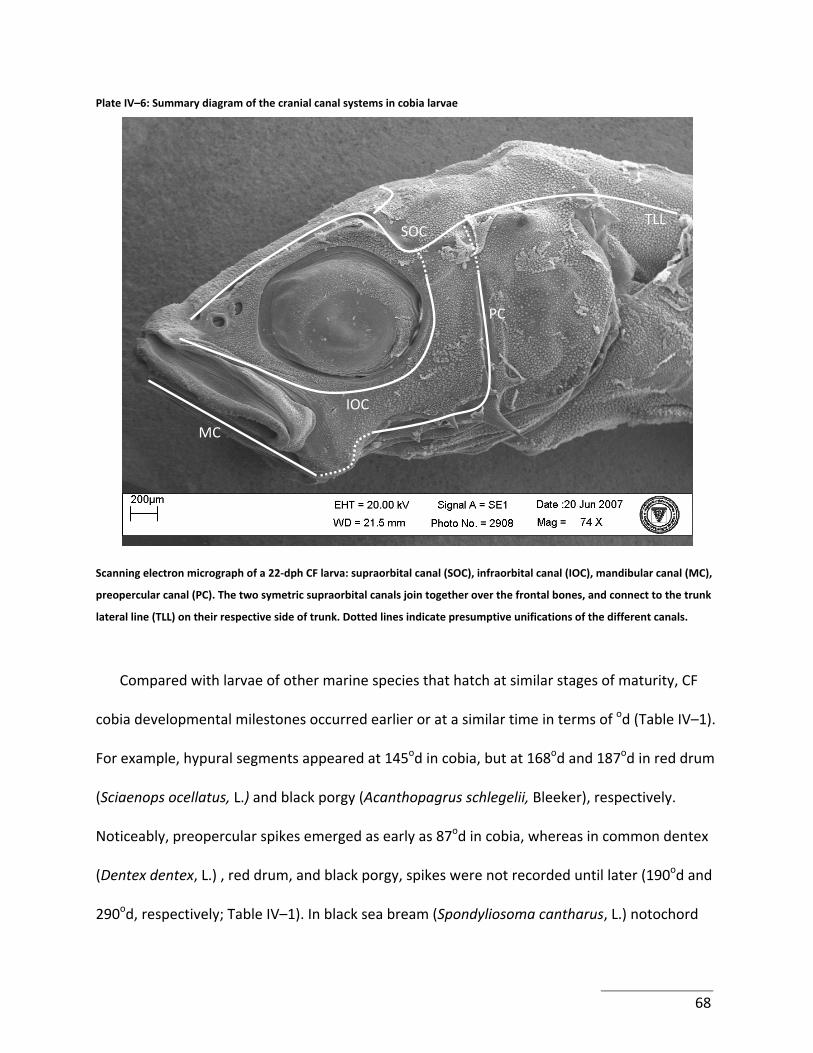
68
Plate IV–6: Summary diagram of the cranial canal systems in cobia larvae
Scanning electron micrograph of a 22‐dph CF larva: supraorbital canal (SOC), infraorbital canal (IOC), mandibular canal (MC),
preopercular canal (PC). The two symetric supraorbital canals join together over the frontal bones, and connect to the trunk
lateral line (TLL) on their respective side of trunk. Dotted lines indicate presumptive unifications of the different canals.
Compared with larvae of other marine species that hatch at similar stages of maturity, CF
cobia developmental milestones occurred earlier or at a similar time in terms of od (Table IV–1).
For example, hypural segments appeared at 145od in cobia, but at 168od and 187od in red drum
(Sciaenops ocellatus, L.) and black porgy (Acanthopagrus schlegelii, Bleeker), respectively.
Noticeably, preopercular spikes emerged as early as 87od in cobia, whereas in common dentex
(Dentex dentex, L.) , red drum, and black porgy, spikes were not recorded until later (190od and
290od, respectively; Table IV–1). In black sea bream (Spondyliosoma cantharus, L.) notochord
SOC
IOC
PC
MC
TLL
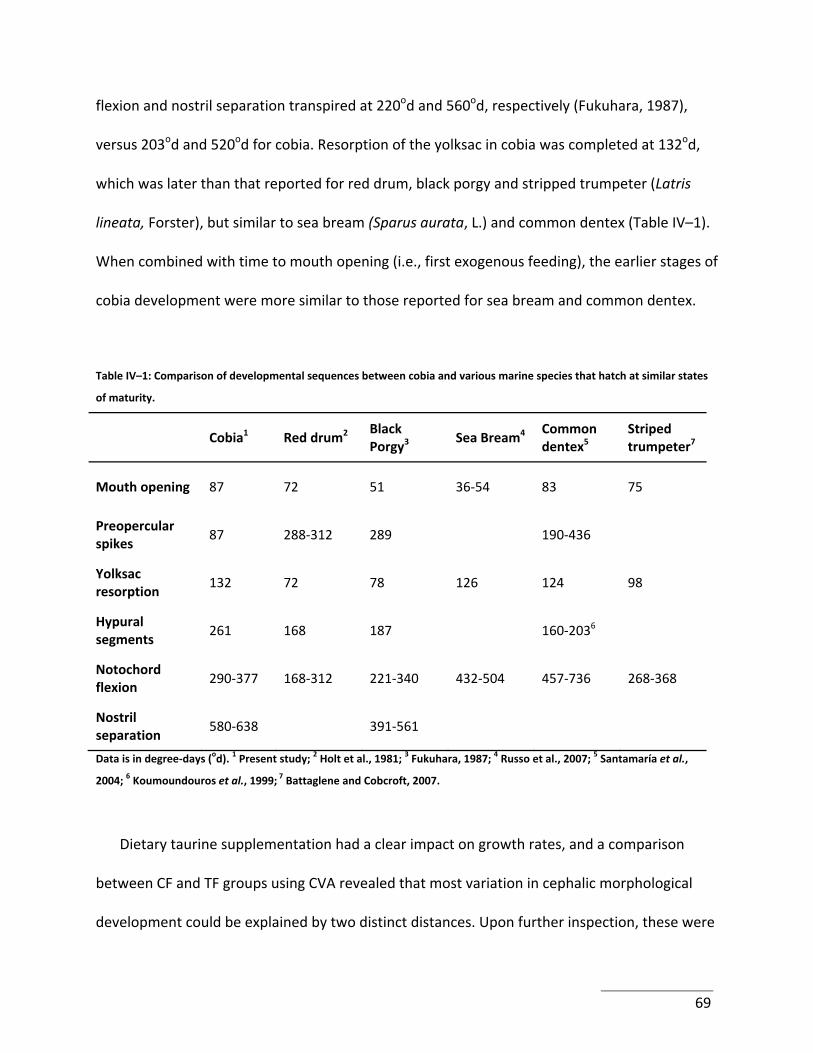
flexion and nostril separation transpired at 220od and 560od, respectively (Fukuhara, 1987),
versus 203od and 520od for cobia. Resorption of the yolksac in cobia was completed at 132od,
which was later than that reported for red drum, black porgy and stripped trumpeter (Latris
lineata, Forster), but similar to sea bream (Sparus aurata, L.) and common dentex (Table IV–1).
When combined with time to mouth opening (i.e., first exogenous feeding), the earlier stages of
cobia development were more similar to those reported for sea bream and common dentex.
Table IV–1: Comparison of developmental sequences between cobia and various marine species that hatch at similar states
of maturity.
Cobia1 Red drum2 Black Porgy3
Sea Bream4 Common dentex5
Striped trumpeter7
Mouth opening 87 72 51 36‐54 83 75
Preopercular spikes
87 288‐312 289 190‐436
Yolksac resorption
132 72 78 126 124 98
Hypural segments
261 168 187 160‐2036
Notochord flexion
290‐377 168‐312 221‐340 432‐504 457‐736 268‐368
Nostril separation
580‐638 391‐561
Data is in degree‐days (od). 1 Present study; 2 Holt et al., 1981; 3 Fukuhara, 1987; 4 Russo et al., 2007; 5 Santamaría et al.,
2004; 6 Koumoundouros et al., 1999; 7 Battaglene and Cobcroft, 2007.
Dietary taurine supplementation had a clear impact on growth rates, and a comparison
between CF and TF groups using CVA revealed that most variation in cephalic morphological
development could be explained by two distinct distances. Upon further inspection, these were
69
deemed almost geometrically perpendicular. Because of this relative orientation in the body
axis of each cobia, they form a two‐dimensional basis for cranial development. CVA illustrated
that cranial growth was identical in CF and TF larvae, thereby suggesting that taurine did not
affect growth patterns; rather the differences observed reflected an accelerated development
rate.
Irrespective of the presence of teeth, larval cobia are commonly presented with Artemia at
8 dph in hatcheries, and their ability to handle such prey effectively is confirmed via direct gut
content observation. Thus the lack of teeth, together with the presence of gill arches and fairly
well developed operculum and large mouth, suggests that the feeding mechanism at this stage
is suctorial (for discussion, see Drost, et al., 1988). The larval cobia gape size, even at 3 dph
indicates that larger‐sized prey could be ingested than is offered normally. For example various
copepods and small Artemia strains are smaller than 200 μm (Shields, et al., 1999), and the
gape size of a 6 dph cobia larvae ranges from 270 to 350 μm. However, ingestion potential does
not imply digestion capabilities, and physiological and enzymatic considerations (see Chapter
III) must be considered prior to adapting such feeding protocols.
Primordial gill arches were observed at 3 dph, whereas primitive gill lamellae were first
observed at 8 dph (232od). Similar observations with respect to mouth opening were reported
by Holt et al. (2007), although Benetti et al. (2008) did not detect the formation of primary gill
lamellae until 9 dph (275od). The more rapid development of primary lamellae observed herein
may have resulted due to genetic, nutritional and environmental factors. In TF fish, gill
70
development did not differ from that of controls through 8 dph, but thereafter a more rapid
growth ensued, suggesting that from 8 dph lamellar growth and differentiation was
nutritionally driven. During early life stages, fish rely on ion and respiratory gas exchange via
cutaneous diffusion and later, through the circulatory apparatus (Blaxter, 1988). The diffusional
respiratory mode generally predominates until gill ventilation is established and provides an
adequate solution for gas exchange (Osse, 1989). The replacement of cutaneous respiration is
generally considered to be a gradual process that is driven by the decreasing anatomical
diffusion factor, mass‐specific surface area per unit diffusion distance (Wells and Pinder, 1996).
Because TF larvae grew at an accelerated pace, parallel increase in gill growth would be
anticipated, as was observed. Fishes display great variation in the point at which the respiratory
switch occurs (Rombough, 1988), and more definitive information on the precise timing of this
process in cobia larvae will demand directed research. Because the gill is engaged in both
respiration and ion regulation, its state of morphological maturity does not correlate with the
decline of cutaneous respiration (Rombough, 2007).
The distribution of neuromasts and patterns of lateral line sensory system architecture are
extremely diverse in fishes; even in closely related species (Bleckmann, 2007). In cobia, the
distribution patterns of individual neuromasts, which were present before the formation of
budding scales, coincided with the layout of the various cranial and trunk canals. Indeed, only
one superficial neuromast could be observed on the head of cobia post‐larvae, all other
neuromasts being enclosed in the cephalic canal system. A notable feature of the development
process was that as the larvae added myomeres to the trunk, new neuromasts supplemented
71
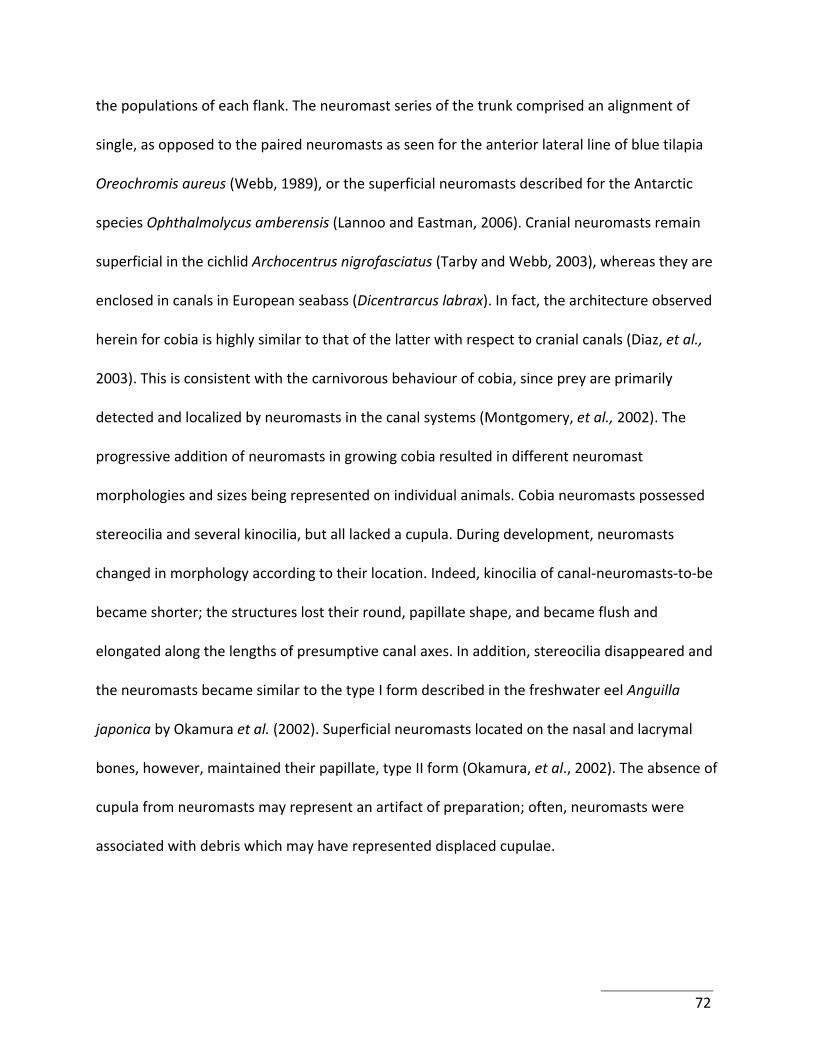
the populations of each flank. The neuromast series of the trunk comprised an alignment of
single, as opposed to the paired neuromasts as seen for the anterior lateral line of blue tilapia
Oreochromis aureus (Webb, 1989), or the superficial neuromasts described for the Antarctic
species Ophthalmolycus amberensis (Lannoo and Eastman, 2006). Cranial neuromasts remain
superficial in the cichlid Archocentrus nigrofasciatus (Tarby and Webb, 2003), whereas they are
enclosed in canals in European seabass (Dicentrarcus labrax). In fact, the architecture observed
herein for cobia is highly similar to that of the latter with respect to cranial canals (Diaz, et al.,
2003). This is consistent with the carnivorous behaviour of cobia, since prey are primarily
detected and localized by neuromasts in the canal systems (Montgomery, et al., 2002). The
progressive addition of neuromasts in growing cobia resulted in different neuromast
morphologies and sizes being represented on individual animals. Cobia neuromasts possessed
stereocilia and several kinocilia, but all lacked a cupula. During development, neuromasts
changed in morphology according to their location. Indeed, kinocilia of canal‐neuromasts‐to‐be
became shorter; the structures lost their round, papillate shape, and became flush and
elongated along the lengths of presumptive canal axes. In addition, stereocilia disappeared and
the neuromasts became similar to the type I form described in the freshwater eel Anguilla
japonica by Okamura et al. (2002). Superficial neuromasts located on the nasal and lacrymal
bones, however, maintained their papillate, type II form (Okamura, et al., 2002). The absence of
cupula from neuromasts may represent an artifact of preparation; often, neuromasts were
associated with debris which may have represented displaced cupulae.
72
The coincidental resorption of the acanthoid crest and preopercular spikes with the closure
of cranial canals was remarkable. While these crests and spikes are generally considered to
provide a defensive role, they may also serve as a calcium reserve for the completion of cranial
canals. The overall developmental observations for the sensory epithelia and associated
structures for cobia corroborate findings with other species of teleost (Tarby and Webb, 2003;
Webb, 1989). Thus, they emulate the sequential appearance of firstly, neuromasts, secondly,
canals, and ultimately scale formation. In cobia, the cranial canals formed before the trunk
lateral line (TLL), but lack of histological analyses precluded determination of precise canal
linkage. Nevertheless, the left and right SOC clearly connected via a bridge over the frontal
bones. A common basic plan is seen in the development of the teleost lateral line system, with
the SOC and IOC fusing behind the eye to unite with the TLL, and the preopercular and
mandibular canals combining to likewise connect to the TLL (Cernuda‐Cernuda and García‐
Fernández, 1996). This basic architectural arrangement appears to have been adhered to by
developing cobia (Plate IV–6).
In the hatchery environment, cobia initiate striking behavior at 3‐4 dph, corresponding to
mouth opening and jaw movement. At this stage, it is likely that larvae are passing through a
learning phase and that strikes are related more to visual acuity, as suggested by the large eye
size (about 50% of the head length). From 6 dph, when endogenous reserves are exhausted,
movements are more controlled and larvae more dynamic in their hunting actions, indicating
positive rheotaxis. These activities become progressively more vigorous over time, suggesting
that hunting is keyed not only visually but, as the cranial and TLL become more
73
developmentally complex, via the sensory system. The lateral line sensory system is unique to
aquatic vertebrates, and experimental evidence has demonstrated that this structure is
perceptive of water movement, low frequency vibrations and or movement of sound sources
(Blaxter, 1987; Bleckmann, 2008; Cernuda‐Cernuda and García‐Fernández, 1996). The extent to
which cobia rely on this sensory system for prey capture requires further examination, perhaps
using pharmacological or nerve ablative blocking methods.
Acknowledgments
The authors are grateful for support of Virginia Sea Grant for funding, and are pleased to
recognize the assistance of Kathy Lowe for the SEM work and Brendan Delbos and Michael H.
Schwarz for their hatchery expertise.
74
Cited references
APHA, 1998. In: Clesceri, Greenberg, Trussell (Eds.), Standards methods for the examination of water and wastewater, Washington, DC.
Battaglene, S. C. & Cobcroft, J. M. (2007). Advances in the culture of striped trumpeter larvae: A review. Aquaculture 268, 195‐208.
Benetti, D. D., Sardenberg, B., Welch, A., Hoenig, R., Orhun, M. R. & Zink, I. (2008). Intensive larval husbandry and fingerling production of cobia Rachycentron canadum. Aquaculture in Press.
Blaxter, J. H. S. (1987). Structure and development of the lateral line. Biological Reviews 62, 471‐514.
Blaxter, J. H. S. (1988). Pattern and variety in development. In Fish Physiology (Hoar, W. S. & Randall, D. J., eds.), pp. 1‐58. San Diego, CA: Academic Press.
Bleckmann, H. (2007). The lateral line system of fish. In Sensory Systems Neuroscience (Hara, T. J. & Zielinski, B. S., eds.), pp. 411‐454. San Diego, CA: Academic Press.
Bleckmann, H. (2008). Peripheral and central processing of lateral line information. Journal of Comparative Physiology A: Neuroethology, Sensory, Neural, and Behavioral Physiology 194, 145‐158.
Cernuda‐Cernuda, R. & García‐Fernández, J. M. (1996). Structural diversity of the ordinary and specialized lateral line organs. Microscopy Research and Technique 34, 302‐312.
Craig, S. R., Schwarz, M. H. & McLean, E. (2006). Juvenile cobia (Rachycentron canadum) can utilize a wide range of protein and lipid levels without impacts on production characteristics. Aquaculture 261, 384‐391.
Diaz, J. P., Prie‐Granie, M., Kentouri, M., Varsamos, S. & Connes, R. (2003). Development of the lateral line system in the sea bass. Journal of Fish Biology 62, 24‐40.
Ditty, J. G. & Shaw, R. F. (1992). Larval development, distribution, and ecology of cobia Rachycentron canadum (Family: Rachycentridae) in the northern Gulf of Mexico. Fishery Bulletin 90, 668‐677.
Drost, M. R., Muller, M. & Osse, J. W. M. (1988). A quantitative hydrodynamical model of suction feeding in larval fishes: the role of frictional forces. Proceedings of the Royal Society of London. Series B, Biological Sciences 234, 263‐281.
Duncan, M., Craig, S. R., Lunger, A. N., Kuhn, D. D., Salze, G. & McLean, E. (2007). Bioimpedance assessment of body composition in cobia Rachycentron canadum (L. 1766). Aquaculture 271, 432‐438.
Faulk, C. K. & Holt, G. J. (2003). Lipid nutrition and feeding of cobia Rachycentron canadum larvae. Journal of the World Aquaculture Society 34, 368–378.
75
Faulk, C. K. & Holt, G. J. (2005). Advances in rearing cobia Rachycentron canadum larvae in recirculating aquaculture systems: Live prey enrichment and greenwater culture. Aquaculture 249, 231‐243.
Faulk, C. K., Benninghoff, A. D. & Holt, G. J. (2007). Ontogeny of the gastrointestinal tract and selected digestive enzymes in cobia Rachycentron canadum (L.). Journal of Fish Biology 70, 567‐583.
Finucane, J. H., Collins, L. A. & Barger, L. E. (1978). Ichtyoplankton/mackerel eggs and larvae. Environmental studies of the south Texas outer continental shelf. In Final report to Bureau of Land Managment by the National Marine Fisheries Service, NOAA. Galviston, TX.
Fukuhara, O. (1987). Larval development and behavior in early life stages of black sea bream reared in the laboratory. Bulletin of the Japanese Society of Scientific Fisheries 53, 371‐379.
Gregory, W. K. (1959). Fish skulls ‐ A study of the evolution of natural mechanisms. Laurel, FL. Hardy, J. D. J. (1978). Development of fishes of the mid‐Atlantic Bight: an atlas of egg, larval and
juvenile stages. Vol. III ‐ Aphredoderidae through Rachycentridae. U.S. Fish and Wildlife Service, Biological Services Program.
Holt, G. J., Johnson, A. G., Arnold, C. R., Fable, W. A., Jr. & Williams, T. D. (1981). Description of eggs and larvae of laboratory reared red drum, Sciaenops ocellata. Copeia 1981, 751‐756.
Holt, G. J., Faulk, C. K. & Schwarz, M. H. (2007). A review of the larviculture of cobia Rachycentron canadum, a warm water marine fish. Aquaculture 268, 181‐187.
Katavic, I. (1986). Diet involvement in mass mortality of sea bass (Dicentrarchus labrax) larvae. Aquaculture 58, 45‐54.
Koumoundouros, G., Divanach, P. & Kentouri, M. (1999). Ontogeny and allometric plasticity of Dentex dentex (Osteichthyes: Sparidae) in rearing conditions. Marine Biology 135, 561‐572.
Lannoo, M. J. & Eastman, J. T. (2006). Brain and sensory organ morphology in Antarctic eelpouts (Perciformes : Zoarcidae : Lycodinae). Journal of Morphology 267, 115‐127.
Lunger, A. N., Craig, S. R. & McLean, E. (2006). Replacement of fish meal in cobia (Rachycentron canadum) diets using an organically certified protein. Aquaculture 257, 393‐399.
McLean, E., Salze, G. & Craig, S. R. (2008). Parasites, diseases and deformities of Cobia. Ribarstvo 66, 1‐16.
Montgomery, J. C., Macdonald, F., Baker, C. F. & Carton, A. G. (2002). Hydrodynamic contributions to multimodal guidance of prey capture behavior in fish. Brain, Behavior and Evolution 59, 190‐198.
76
Niu, J., Liu, Y. J., Tian, L. X., Mai, K. S., Yang, H. J., Ye, C. X. & Zhu, Y. (2008a). The effect of different levels of dietary phospholipid on growth, survival and nutrient composition of early juvenile cobia (Rachycentron canadum). Aquaculture Nutrition 14, 249‐256.
Niu, J., Liu, Y., Tian, L., Mai, K., Yang, H., Ye, C. & Zhu, Y. (2008b). Effects of dietary phospholipid level in cobia (Rachycentron canadum) larvae: growth, survival, plasma lipids and enzymes of lipid metabolism. Fish Physiology and Biochemistry 34, 9‐17.
Okamura, A., Oka, H. P., Yamada, Y., Utoh, T., Mikawa, N., Horie, N. & Tanaka, S. (2002). Development of lateral line organs in leptocephali of the freshwater eel Anguilla japonica (Teleostei, Anguilliformes). Journal of Morphology 254, 81‐91.
Osse, J. W. M. (1989). A functional explanation for a sequence of developmental events in the carp: the absence of gills in early larvae. Acta Morphologica Neerlando‐Scandinavica 27, 111‐118.
Rombough, P. J. (1988). Respiratory gas exchange, aerobic metabolism, and effetcs of hypoxia during early life. In Fish Physiology (Hoar, W. S. & Randall, D. J., eds.). San Diego, CA: Academic Press.
Rombough, P. J. (2007). The functional ontogeny of the teleost gill: Which comes first, gas or ion exchange? Comparative Biochemistry and Physiology a‐Molecular & Integrative Physiology 148, 732‐742.
Russo, T., Costa, C. & Cataudella, S. (2007). Correspondence between shape and feeding habit changes throughout ontogeny of gilthead sea bream Sparus aurata L., 1758. Journal of Fish Biology 71, 629‐656.
Salze, G., 2008. Nutritional control of gene expression, larval development and physiology in fish. In: Ph.D. dissertation, Virginia Polytechnic Institute and State University, Blacksburg, VA.
Salze, G., McLean, E., Schwarz, M. H. & Craig, S. R. (2008). Dietary mannan oligosaccharide enhances salinity tolerance and gut development of larval cobia. Aquaculture 274, 148‐152.
Santamaría, C. A., Marín de Mateo, M., Traveset, R., Sala, R., Grau, A., Pastor, E., Sarasquete, C. & Crespo, S. (2004). Larval organogenesis in common dentex Dentex dentex L. (Sparidae): histological and histochemical aspects. Aquaculture 237, 207‐228.
Schwarz, M. H., McLean, E. & Craig, S. R. (2007). Research experience with cobia: larval rearing, juvenile nutrition and general physiology. In Cobia Aquaculture: Research Development and Commercial Production (Liao, C. I. & Leaño, E. M., eds.): Asian Fisheries Society, Manila, Philippines; World Aquaculture Society, Baton Rouge, Louisiana, USA; The Fisheries Society of Taiwan, Keelung Taiwan; and National Taiwan Ocean University, Keelung, Taiwan.
Shields, R. J., Bell, J. G., Luizi, F. S., Gara, B., Bromage, N. R. & Sargent, J. R. (1999). Natural copepods are superior to enriched Artemia nauplii as feed for halibut larvae
77
(Hippoglossus hippoglossus) in terms of survival, pigmentation and retinal morphology: Relation to dietary essential fatty acids. Journal of Nutrition 129, 1186‐1194.
Tarby, M. L. & Webb, J. F. (2003). Development of the supraorbital and mandibular lateral line canals in the cichlid, Archocentrus nigrofasciatus. Journal of Morphology 255, 44‐57.
Turner, J. P. & Rooker, J. R. (2005). Effect of dietary fatty acids on the body tissues of larval and juvenile cobia and their prey. Journal of Experimental Marine Biology and Ecology 322, 13‐27.
Vaught Shaffer, R., Nakamura, E.L., 1989. Synopsis of biological data on the cobia Rachycentron canadum (Pisces: Rachycentridae), NOAA Technical Report NMFS 82 / FAO Fisheries Synopsis. FAO, Rome, Italy., pp. 1‐21.
Webb, J. F. (1989). Neuromast morphology and lateral line trunk canal ontogeny in two species of cichlids: An SEM study. Journal of Morphology 202, 53‐68.
Wells, P. R. & Pinder, A. W. (1996). The respiratory development of Atlantic salmon. 2 ‐ Partitioning of oxygen uptake among gills, yolk sac and body surfaces. Journal of Experimental Biology 199, 2737‐2744.
Yúfera, M., Sarasquete, M. C. & Fernández‐Díaz, C. (1996). Testing protein‐walled microcapsules for the rearing of first‐feeding gilthead sea bream (Sparus aurata L.) larvae. Marine and Freshwater Research 47, 211‐216.
78
Chapter V. DIETARY MANNAN OL IGOSACCHAR IDE ENHANCES
SAL IN ITY TOLERANCE AND GUT
DEVELOPMENT OF LARVAL COB IA
Abstract
The potential effects of supplementing live feeds with mannan oligosaccharide (MOS; BioMos®) upon cobia Rachycentron canadum larval performance were examined. Characteristics of fish examined included survival to weaning, growth, ability to withstand osmotic stress and the degree of development of the brush border of the intestine. Live feeds included rotifers (Brachionus plicatilis) and Artemia which were enriched for 24 h with a commercial enrichment media alone or in combination with 0.2% (dry weight basis) MOS. Salinity challenges were performed at 6, 7, 13, and 14 days post‐hatch (dph; 0 and 65 g L−1 for 6 dph, 0 and 55 g L−1 for 7+ dph) corresponding to transitions in feeding, to examine the ability of larval cobia to survive hyper‐ and hypohaline stress. Differences (P<0.05) in survival, favoring cobia receiving MOS‐supplemented feeds, were discerned at 6 and 7 dph when fish were challenged at 0 g L−1 and at 13 dph when challenged with 55 g L−1 salinity water. Electron microscopy of the mid‐intestine of developing larvae revealed that MOS‐supplemented diets enhanced (P<0.05) the height of microvilli while reducing (P<0.05) the occurrence and size of supranuclear vacuoles. Supplementation of diets with MOS could assist cobia larvae in maintaining allostasis especially when reared at sub‐optimal salinities.
Keywords: Rachycentron canadum; microvilli; supranuclear vacuoles; stress; feeding;
intestine
79
INTRODUCTION
An absolute requirement for sustainable aquaculture is total life cycle closure of the
cultivated species. Similarly, a critical factor during commercial operations is the timely supply
of high quality, fully weaned animals. For some marine finfish species, the unreliability of
weanling supply represents a crucial obstacle to more rapid expansion of the industry,
especially for higher‐value carnivores. Cobia are no exception to this rule, and high quality
weaned juvenile supply remains a decisive bottleneck to industry expansion (Holt, et al., 2007).
Although various groups have achieved successful cobia spawns (Arnold, et al., 2002; Caylor, et
al., 1994; Franks, et al., 2001; Liao, et al., 2001), reported survival from egg to weanling has
been low ( 1 fish L−1). Clearly, larval survival and weanling numbers must be increased
dramatically to enable sustainable growth of cobia aquaculture (Schwarz, et al., 2007). One
method of enhancing weanlings production might be through judicious manipulations of larval
diets.
Mannan oligosaccharides (MOS) are complex carbohydrates derived from yeast cell walls.
These compounds contain mannose as the primary carbohydrate element. MOS have a variety
of beneficial effects on livestock, ranging from growth promotion in cattle to
immunostimulation in swine and avian species (reviewed by Moran, 2004). In piglets, for
example, dietary MOS supplementation resulted in more uniform individual weights, enhanced
survival, and increased concentrations of immunoglobulin (Funderburke, 2002). The
immunomodulatory (Chansue, et al., 2000; Welker, et al., 2007) and growth (Li and Gatlin,
80
2004; Li, et al., 2005; Li and Gatlin, 2005; Pryor, et al., 2003) benefits of dietary MOS also have
been examined in fish but often with contrasting findings. Although the precise mechanism of
action of dietary MOS remains to be established, it has been suggested that these compounds
may beneficially influence gut bacterial colonization in poults (Juskiewicz, et al., 2006) and
humans (Asano, et al., 2004), with the consequent effects of enhanced welfare, gut maturation
and growth. These potential beneficial effects, alone or combined, represent significant issues
when considering enhanced production of larval marine fishes. It remains appropriate,
therefore, to continue the evaluation of MOS products. Herein I evaluate the effect of MOS on
larval cobia growth, survival, stress resistance and gut development.
MATERIALS AND METHODS
Animals, system and husbandry
Cobia Rachycentron canadum were purchased from a commercial supplier (Aquaculture
Center of the Florida Keys, Marathon, FL) at 2 days post‐hatch (dph). A total of 54,000 larvae
were stocked at 10 L−1 into one of 8 replicated 3‐tank systems. Each independent unit
comprised three 300 L tanks, linked to a reservoir that doubled as a fluidized KMT biofilter.
Water from the reservoir was pumped to a bubble bead filter (BBF‐2; Aquaculture Technologies
Inc., Metaire, LA) to remove suspended solids, then a 100 μm bag filter, a UV sterilizer (80,000
μW cm−2 s−1; Emperor Aquatics, Pottstown, PA) for water disinfection, and a protein skimmer
(R&B Aquatic Distribution, Waring, TX) to remove particulated organic matter and decrease
turbidity. Water temperature was maintained through ambient air heating and the use of
81
electronically controlled, thermostatic titanium heaters (R&B Aquatics, Waring, TX) located in
the reservoir. Bead filters were backwashed daily. Make‐up water was supplied from a 38,000 L
storage tank (Red Ewald, Inc., Karnes City, TX). Once full, the water was treated with 20 mg L−1
chlorine and passed continuously through a rapid‐rate sand filter in series with a diatomaceous
earth filter before returning to the storage tank. This water then was checked for complete
chlorine degassing prior to utilization. Hydrodynamics of the larval tanks was maintained to
provide both horizontal as well as vertical cells to optimize larvae–prey distribution and
minimize larvae–larvae interaction. Initial system salinity was 35 g L−1, which was reduced 1 g L‐1
day−1 until a final salinity of 24 g L−1 was achieved at 13 dph. At trial start, two of the eight
stocked three‐tank systems were randomly allocated as control and treatment systems.
Green water (approx. 120,000 cells ml−1 Nannochloropsis sp. algal paste) and L‐type rotifers
(Brachionus plicatilis) were fed to cobia larvae until 8 dph, at which point Artemia only was
offered (1.5–3.5 individuals mL−1). Algae and rotifers (2 mL−1) were added to the culture tanks
simultaneously every 6 h. The level of eicosapentaenoic acid (EPA; 20:5n3) in the algae was 30%
dry weight. Every 6 h, non‐enriched, small‐sized ( 430 μm) improved HUFA profile (15 mg g−1
dry weight) AF‐Artemia (INVE Aquaculture, Inc., Salt Lake City, UT) nauplii were fed, following
complete clearing of the tank between feedings, 6–9 dph. Densities used were 1.5 nauplii mL−1
6 dph, 2.5 nauplii mL−1 at 7 dph and 3.5 nauplii mL−1 between 8 and 9 dph. Likewise, every 6 h,
from 8–11 dph, 1.5–3.5 EG‐Artemia (INVE Aquaculture, Inc.) mL−1 were added to the tank
followed by the identical density of enriched EG‐Artemia (INVE Aquaculture, Inc.) nauplii from
12–21 dph (see Figure III–1). EG Artemia were enriched for 24 h with DC DHA Selco (INVE
82
Aquaculture, Inc.). Experimental diets employed the identical feeding regime except that
enrichments of EG Artemia employed MOS (0.2% dry weight; BioMos®, Alltech Inc.,
Nicholasville, KY) in addition to DC DHA Selco. Uptake of MOS by Artemia was established
visually using a red food dye in pre‐trial tests. Co‐feeding of larvae with Otohime weaning feeds
(Reed Mariculture, Campbell, CA) commenced at 18 dph. Co‐feedings consisted of feed delivery
30 min and 15 min prior to Artemia additions with prepared diets being delivered at 2 g
feeding−1 tank−1. Dry feed only was offered every 6 h from 21 dph. Decisions regarding feed
substitution during rearing were based upon daily gut content analyses. Photoperiod was
maintained at 24 h light until 22 dph, at which time photoperiod was reduced to 20:4 at 260 lx.
Sampling and analyses
Throughout the study, samples of fish were measured using a microscope and attached
graticule. At specific time points throughout the trial (indicated by arrows on the feeding
protocol; see Figure III–1), 30 fish were randomly taken from each tank (control and MOS‐
enriched; N=90 treatment‐1) and subjected to salinity challenge. The stress tests were
undertaken using eighteen 1L aerated beakers (10 fish treatment−1 beaker−1 tank−1 in triplicate).
Salinity stressors were set 0 and 65 g L−1 for 6 dph, at which point the high salinity stressor was
reduced to 55 g L−1 for the remaining challenges. The reduction in salinity was employed
following preliminary salinity tests with older larvae. Animals were evaluated every 5 min to
record mortality or the point at which no mortalities occurred over three consecutive time
intervals. Stress was measured using the stress sensitivity index (SSI; Dhert et al., 1992), which
83
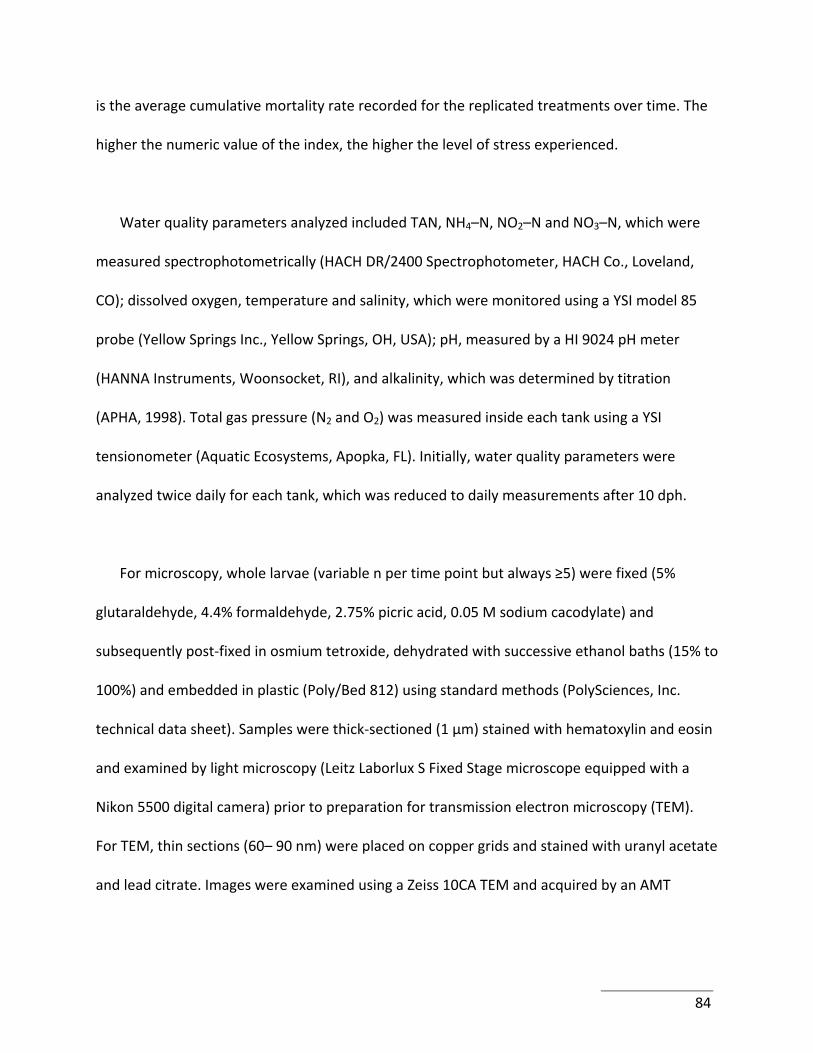
is the average cumulative mortality rate recorded for the replicated treatments over time. The
higher the numeric value of the index, the higher the level of stress experienced.
Water quality parameters analyzed included TAN, NH4–N, NO2–N and NO3–N, which were
measured spectrophotometrically (HACH DR/2400 Spectrophotometer, HACH Co., Loveland,
CO); dissolved oxygen, temperature and salinity, which were monitored using a YSI model 85
probe (Yellow Springs Inc., Yellow Springs, OH, USA); pH, measured by a HI 9024 pH meter
(HANNA Instruments, Woonsocket, RI), and alkalinity, which was determined by titration
(APHA, 1998). Total gas pressure (N2 and O2) was measured inside each tank using a YSI
tensionometer (Aquatic Ecosystems, Apopka, FL). Initially, water quality parameters were
analyzed twice daily for each tank, which was reduced to daily measurements after 10 dph.
For microscopy, whole larvae (variable n per time point but always ≥5) were fixed (5%
glutaraldehyde, 4.4% formaldehyde, 2.75% picric acid, 0.05 M sodium cacodylate) and
subsequently post‐fixed in osmium tetroxide, dehydrated with successive ethanol baths (15% to
100%) and embedded in plastic (Poly/Bed 812) using standard methods (PolySciences, Inc.
technical data sheet). Samples were thick‐sectioned (1 μm) stained with hematoxylin and eosin
and examined by light microscopy (Leitz Laborlux S Fixed Stage microscope equipped with a
Nikon 5500 digital camera) prior to preparation for transmission electron microscopy (TEM).
For TEM, thin sections (60– 90 nm) were placed on copper grids and stained with uranyl acetate
and lead citrate. Images were examined using a Zeiss 10CA TEM and acquired by an AMT
84
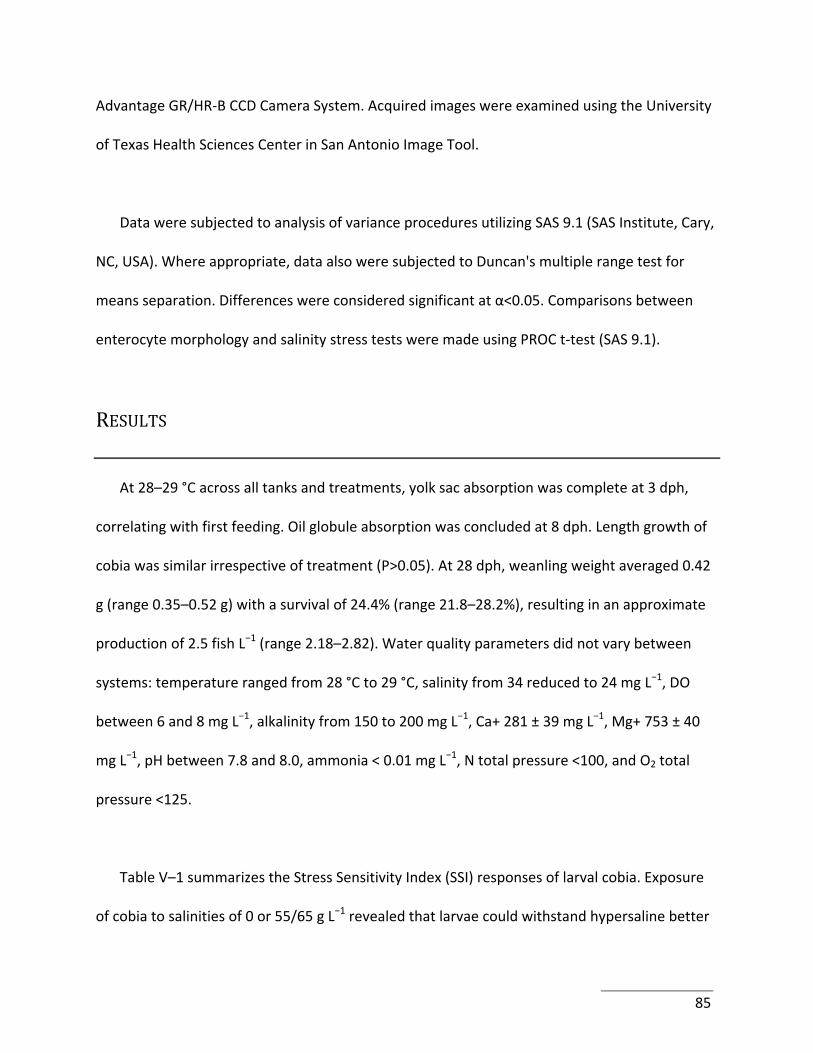
Advantage GR/HR‐B CCD Camera System. Acquired images were examined using the University
of Texas Health Sciences Center in San Antonio Image Tool.
Data were subjected to analysis of variance procedures utilizing SAS 9.1 (SAS Institute, Cary,
NC, USA). Where appropriate, data also were subjected to Duncan's multiple range test for
means separation. Differences were considered significant at α<0.05. Comparisons between
enterocyte morphology and salinity stress tests were made using PROC t‐test (SAS 9.1).
RESULTS
At 28–29 °C across all tanks and treatments, yolk sac absorption was complete at 3 dph,
correlating with first feeding. Oil globule absorption was concluded at 8 dph. Length growth of
cobia was similar irrespective of treatment (P>0.05). At 28 dph, weanling weight averaged 0.42
g (range 0.35–0.52 g) with a survival of 24.4% (range 21.8–28.2%), resulting in an approximate
production of 2.5 fish L−1 (range 2.18–2.82). Water quality parameters did not vary between
systems: temperature ranged from 28 °C to 29 °C, salinity from 34 reduced to 24 mg L−1, DO
between 6 and 8 mg L−1, alkalinity from 150 to 200 mg L−1, Ca+ 281 ± 39 mg L−1, Mg+ 753 ± 40
mg L−1, pH between 7.8 and 8.0, ammonia < 0.01 mg L−1, N total pressure <100, and O2 total
pressure <125.
Table V–1 summarizes the Stress Sensitivity Index (SSI) responses of larval cobia. Exposure
of cobia to salinities of 0 or 55/65 g L−1 revealed that larvae could withstand hypersaline better
85
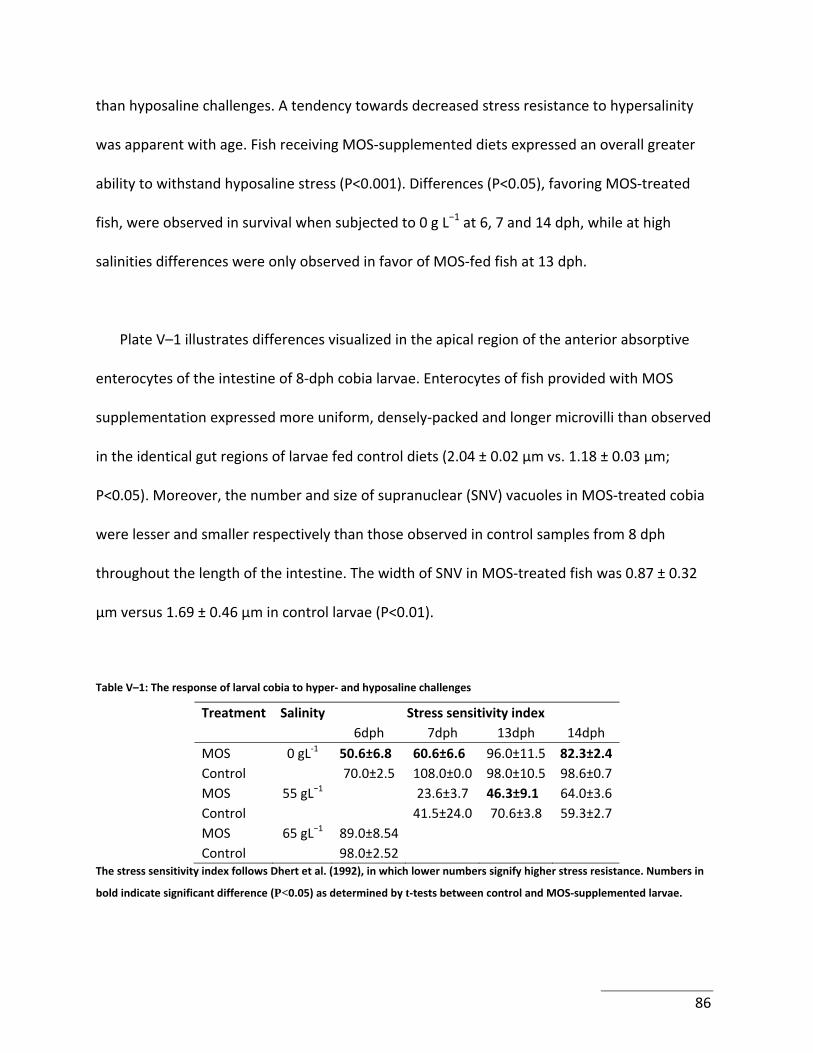
than hyposaline challenges. A tendency towards decreased stress resistance to hypersalinity
was apparent with age. Fish receiving MOS‐supplemented diets expressed an overall greater
ability to withstand hyposaline stress (P<0.001). Differences (P<0.05), favoring MOS‐treated
fish, were observed in survival when subjected to 0 g L−1 at 6, 7 and 14 dph, while at high
salinities differences were only observed in favor of MOS‐fed fish at 13 dph.
Plate V–1 illustrates differences visualized in the apical region of the anterior absorptive
enterocytes of the intestine of 8‐dph cobia larvae. Enterocytes of fish provided with MOS
supplementation expressed more uniform, densely‐packed and longer microvilli than observed
in the identical gut regions of larvae fed control diets (2.04 ± 0.02 μm vs. 1.18 ± 0.03 μm;
P<0.05). Moreover, the number and size of supranuclear (SNV) vacuoles in MOS‐treated cobia
were lesser and smaller respectively than those observed in control samples from 8 dph
throughout the length of the intestine. The width of SNV in MOS‐treated fish was 0.87 ± 0.32
μm versus 1.69 ± 0.46 μm in control larvae (P<0.01).
Table V–1: The response of larval cobia to hyper‐ and hyposaline challenges
Treatment Salinity Stress sensitivity index 6dph 7dph 13dph 14dph
MOS 0 gL‐1 50.6±6.8 60.6±6.6 96.0±11.5 82.3±2.4 Control 70.0±2.5 108.0±0.0 98.0±10.5 98.6±0.7 MOS 55 gL−1 23.6±3.7 46.3±9.1 64.0±3.6 Control 41.5±24.0 70.6±3.8 59.3±2.7 MOS 65 gL−1 89.0±8.54 Control 98.0±2.52
The stress sensitivity index follows Dhert et al. (1992), in which lower numbers signify higher stress resistance. Numbers in
bold indicate significant difference (P<0.05) as determined by t‐tests between control and MOS‐supplemented larvae.
86
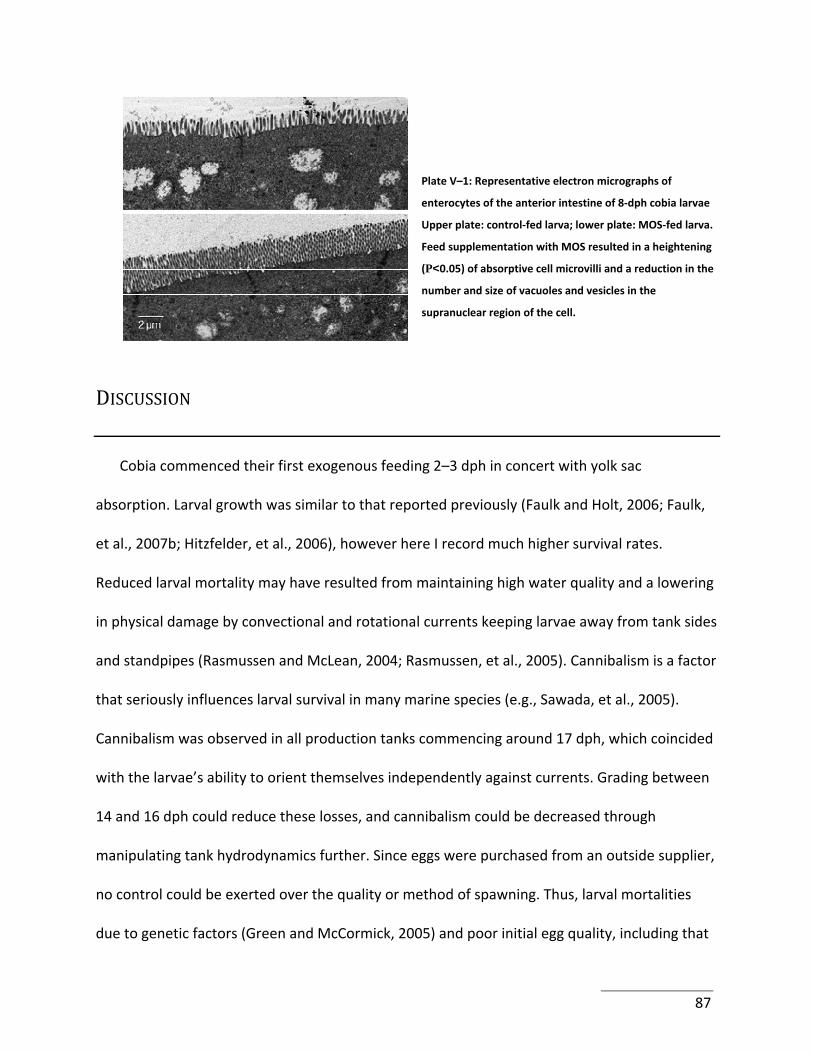
Plate V–1: Representative electron micrographs of
enterocytes of the anterior intestine of 8‐dph cobia larvae
Upper plate: control‐fed larva; lower plate: MOS‐fed larva.
Feed supplementation with MOS resulted in a heightening
(P<0.05) of absorptive cell microvilli and a reduction in the
number and size of vacuoles and vesicles in the
supranuclear region of the cell.
DISCUSSION
Cobia commenced their first exogenous feeding 2–3 dph in concert with yolk sac
absorption. Larval growth was similar to that reported previously (Faulk and Holt, 2006; Faulk,
et al., 2007b; Hitzfelder, et al., 2006), however here I record much higher survival rates.
Reduced larval mortality may have resulted from maintaining high water quality and a lowering
in physical damage by convectional and rotational currents keeping larvae away from tank sides
and standpipes (Rasmussen and McLean, 2004; Rasmussen, et al., 2005). Cannibalism is a factor
that seriously influences larval survival in many marine species (e.g., Sawada, et al., 2005).
Cannibalism was observed in all production tanks commencing around 17 dph, which coincided
with the larvae’s ability to orient themselves independently against currents. Grading between
14 and 16 dph could reduce these losses, and cannibalism could be decreased through
manipulating tank hydrodynamics further. Since eggs were purchased from an outside supplier,
no control could be exerted over the quality or method of spawning. Thus, larval mortalities
due to genetic factors (Green and McCormick, 2005) and poor initial egg quality, including that
87
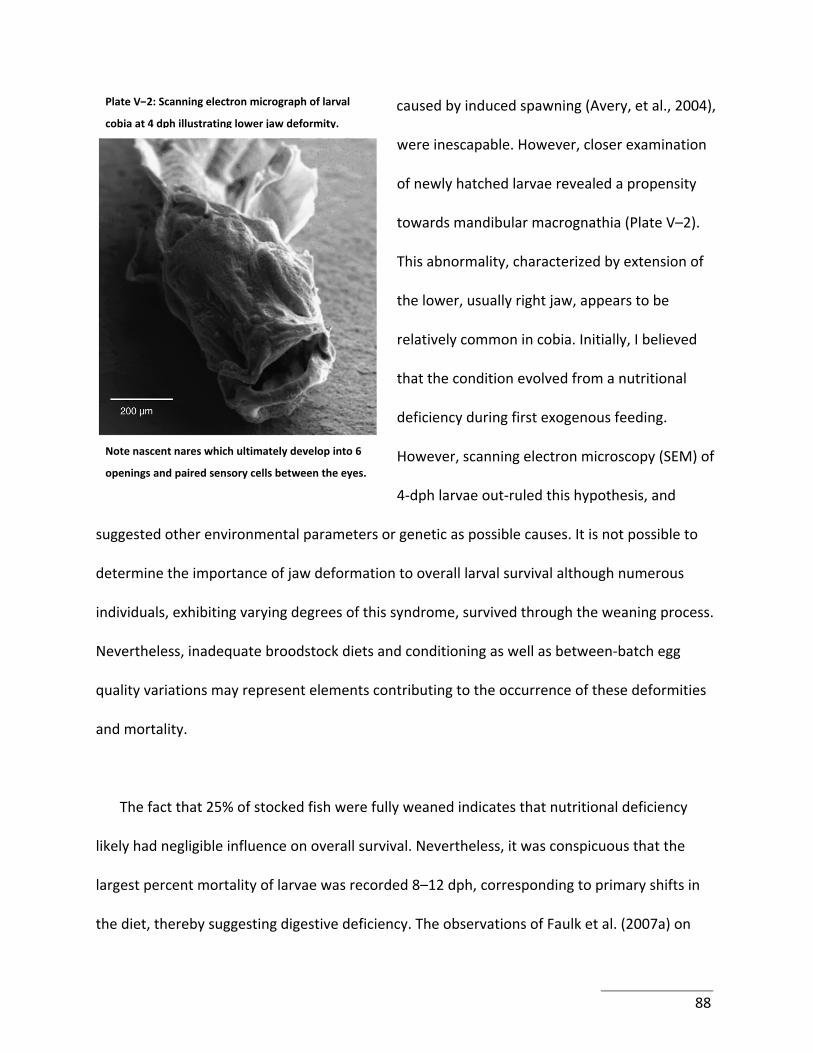
caused by induced spawning (Avery, et al., 2004),
were inescapable. However, closer examination
of newly hatched larvae revealed a propensity
towards mandibular macrognathia (Plate V–2).
This abnormality, characterized by extension of
the lower, usually right jaw, appears to be
relatively common in cobia. Initially, I believed
that the condition evolved from a nutritional
deficiency during first exogenous feeding.
However, scanning electron microscopy (SEM) of
4‐dph larvae out‐ruled this hypothesis, and
suggested other environmental parameters or genetic as possible causes. It is not possible to
determine the importance of jaw deformation to overall larval survival although numerous
individuals, exhibiting varying degrees of this syndrome, survived through the weaning process.
Nevertheless, inadequate broodstock diets and conditioning as well as between‐batch egg
quality variations may represent elements contributing to the occurrence of these deformities
and mortality.
Plate V–2: Scanning electron micrograph of larval
cobia at 4 dph illustrating lower jaw deformity.
Note nascent nares which ultimately develop into 6
openings and paired sensory cells between the eyes.
The fact that 25% of stocked fish were fully weaned indicates that nutritional deficiency
likely had negligible influence on overall survival. Nevertheless, it was conspicuous that the
largest percent mortality of larvae was recorded 8–12 dph, corresponding to primary shifts in
the diet, thereby suggesting digestive deficiency. The observations of Faulk et al. (2007a) on
88
cobia gut enzyme development might be used to argue for full gastrointestinal functionality at
12–16 dph. Nevertheless, enzymatic insufficiency may be compensated for by macromolecular
absorptive mechanisms. A notable feature of absorptive enterocytes of the larval cobia
intestine was the presence of supranuclear vacuoles (SNV) in the apical region of the cells.
These structures may act as a supplementary mechanism for the absorption and transport of
lipids and intact proteins and polypeptides in the anterior and posterior gut segments,
respectively (Iwai, 1967; Iwai and Tanaka, 1968; McLean, et al., 1999; Watanabe, 1984). Control
cobia had more numerous and larger SNV than MOS fed fish — a distinction which may have
resulted due to the MOS driving gut development more rapidly as evidenced by the longer
microvilli of the absorptive epithelia. It has been suggested that MOS acts to protect the gut by
blocking bacterial adhesion, modifying gut microflora to support increased nutrient availability,
reducing enterocyte cycling rates while enhancing the production of the protective mucin
barrier (see Ferket, 2004). The latter may have importance in terms of ion regulation.
It is well established that marine fish larvae are able to withstand dramatic short‐term
changes in salinity, ranging between 0 and 65 g L−1 (Varsamos, et al., 2005), and cobia were not
an exception to this generalization. Noteworthy was that larval cobia were more able to adjust
to hypersaline challenge and that osmoregulatory capabilities appeared to improve with age.
Similar observations have been reported for many other marine species (Hickman, 1959;
Holliday and Blaxter, 1960; Zydlewski and McCormick, 1997), and this response likely reflects
the maturation of the osmoregulatory apparatus (Alderdice, 1998). The role of the integument,
gills, digestive and endocrine systems in the maintenance and control of ionic balance in fish
89
larvae was reviewed by Varsamos et al. (2005). For most marine teleosts, short‐term tolerance
to salinity stress is considered high for early stage larvae but declines dramatically during mid‐
larval development. Even though the first remarks concerning the role of the fish gut in
maintaining hydromineral homeostasis were made 80 years ago (Smith, 1930), few studies have
examined the role of the larval gut in osmoregulation and how this may be impacted by
developmental stage. Whether the different abilities of MOS‐treated groups to withstand
salinity variations resulted due to a more rapid maturation or protection of the intestinal
epithelia requires further study.
The presence and role of branchial and extrabranchial ionocytes, their potential
involvement in osmoregulation and the relative importance of the gut to ionic homeostasis will
demand the use of tracers to establish drinking rates as well as evaluation of variations in larval
blood osmolality. An important issue with respect to the apparent protective nature of MOS
against hyposaline challenge relates to the emergence of inland, tank‐based cobia production.
Reductions in salinity are more likely to be experienced in these commercial hatcheries than
increases, and thus, fortifications of live feeds with MOS may assist the developing animal in
allostasis and future performance (see Varsamos, et al., 2006).
90

Acknowledgements
The authors are happy to recognize Ms. J. Zimmerman for assistance in data acquisition and
Virginia Sea Grant for research funding.
91
Cited references
Alderdice, D.F., 1998. Osmotic and ionic regulation in teleost eggs and larvae. In: Hoar, W.S., Randall, D.J. (Eds.), Fish Physiology. Academic Press, California, USA, XIa; 163–251.
APHA, 1998. In: Clesceri, Greenberg, Trussell (Eds.), Standards methods for the examination of water and wastewater, 20th ed., Washington, DC.
Arnold, C.R., Kaiser, J.B., Holt, G.J., 2002. Spawning of cobia Rachycentron canadum in captivity. Journal of the World Aquaculture Society 33, 205‐208.
Asano, I., Umemura, M., Fujii, S., Hoshino, H., Iino, H., 2004. Effects of mannooligosaccharides from coffee mannan on fecal microflora and defecation in healthy volunteers. Food Science and Technology Research 10, 93‐97.
Avery, T.S., Boyce, D., Brown, J.A., 2004. Mortality of yellowtail flounder, Limanda ferruginea (Storer), eggs: effects of temperature and hormone‐induced ovulation. Aquaculture 230, 297‐311.
Caylor, R.E., Biesiot, P.M., Franks, J.S., 1994. Culture of cobia (Rachycentron canadum): Cryopreservation of sperm and induced spawning. Aquaculture 125, 81‐92.
Chansue, N., Ponpornpisit, A., Endo, M., Sakai, M., Yoshida, S., 2000. Improved immunity of tilapia Oreochromis niloticus by C‐UPIII, a herb medicine. Fish Pathology 35, 89‐90.
Dhert, P., Lavens, P., Sorgeloos, P., 1992. Stress evaluation: a tool for quality control of hatchery‐produced shrimp and fish fry, Aquaculture Europe 17, 6‐10.
Faulk, C.K., Holt, G.J., 2006. Responses of cobia Rachycentron canadum larvae to abrupt or gradual changes in salinity. Aquaculture 254, 275‐283.
Faulk, C.K., Benninghoff, A.D., Holt, G.J., 2007a. Ontogeny of the gastrointestinal tract and selected digestive enzymes in cobia Rachycentron canadum (L.). Journal of Fish Biology 70, 567‐583.
Faulk, C.K., Kaiser, J.B., Holt, G.J., 2007b. Growth and survival of larval and juvenile cobia Rachycentron canadum in a recirculating raceway system. Aquaculture 270, 149‐157.
Ferket, P.R., 2004. Alternatives to antibiotics in poultry production: responses, practical experience and recommendations. In: Lyons, T.P., Jacques, K.A. (Eds.), Nutritional Biotechnology in the Feed and Food Industries. Nottingham University Press, UK, pp. 57–67.
Franks, J.S., Ogle, J.T., Lotz, J.M., Nicholson, L.C., Barnes, D.N., Larsen, K.M., Spontaneous spawning of cobia, Rachycentron canadum, induced by human chorionic gonadotropin (HCG), with comments on fertilization, hatching and larval development. In: Proceedings of the Gulf and Caribbean Fisheries Institute, Creswell, R.L. (Eds). Key West, FL, November 1999, pp. 598‐609.
Funderburke, D.W., 2002. Effects of dietary supplementation with mannan oligosaccharides on performance of commercial sows and their litters. Nutritional biotechnology in the feed
92
and food industries, Proceedings of Alltech's 18th Annual Symposium: from niche markets to mainstream, 13‐15 May 2002. Alltech UK, Stamford, UK.
Green, B.S., McCormick, M.I., 2005. Maternal and paternal effects determine size, growth and performance in larvae of a tropical reef fish. Marine Ecology‐Progress Series 289, 263‐272.
Hickman, C.P., 1959. The osmoregulatory role of the thyroid gland in the starry flounder, Platichthys stellatus. Canadian Journal of Zoology 37, 997‐1060.
Hitzfelder, G.M., Holt, G.J., Fox, J.M., McKee, D.A., 2006. The effect of rearing density on growth and survival of cobia, Rachycentron canadum, larvae in a closed recirculating aquaculture system. Journal of the World Aquaculture Society 37, 204‐209.
Holliday, F.G.T., Blaxter, J.H.S., 1960. The effects of salinity on the developing eggs and larvae of the herring. Journal of the Marine Biological Association of the United Kingdom 39, 591‐603.
Holt, G.J., Faulk, C.K., Schwarz, M.H., 2007. A review of the larviculture of cobia Rachycentron canadum, a warm water marine fish. Aquaculture 268, 181‐187.
Iwai, T., 1967. The comparative study of the digestive tracts of teleost larvae ‐ I. Fine structure of the gut epithelium in larvae of ayu. Bulletin of the Japanese Society of Scientific Fisheries 33, 489–496.
Iwai, T., Tanaka, M., 1968. The comparative study of the digestive tract of teleost larvae ‐ III. Epithelial cells in the posterior gut of halfbeak larvae. Bulletin of the Japanese Society of Scientific Fisheries 34, 44–48.
Juskiewicz, J., Zdunczyk, Z., Jankowski, J., 2006. Growth performance and metabolic response of the gastrointestinal tract of turkeys to diets with different levels of mannan‐oligosaccharide. World’s Poultry Science Journal 62, 612‐625.
Li, P., Gatlin, D.M., 2004. Dietary brewers yeast and the prebiotic Grobiotic(TM)AE influence growth performance, immune responses and resistance of hybrid striped bass (Morone chrysops x M. saxatilis) to Streptococcus iniae infection. Aquaculture 231, 445‐456.
Li, P., Burr, G.S., Goff, J., Whiteman, K.W., Davis, K.B., Vega, R.R., Neill, W.H., Gatlin, D.M., 2005. A preliminary study on the effects of dietary supplementation of brewers yeast and nucleotides, singularly or in combination, on juvenile red drum (Sciaenops ocellatus). Aquaculture Research 36, 1120‐1127.
Li, P., Gatlin, D.M., 2005. Evaluation of the prebiotic GroBiotic(R)‐A and brewers yeast as dietary supplements for sub‐adult hybrid striped bass (Morone chrysops x M. saxatilis) challenged in situ with Mycobacterium marinum. Aquaculture 248, 197‐205.
Liao, I.C., Su, H.M., Chang, E.Y., 2001. Techniques in finfish larviculture in Taiwan. Aquaculture 200, 1‐31.
McLean, E., Ronsholdt, B., Sten, C., Najamuddin, 1999. Gastrointestinal delivery of peptide and protein drugs to aquacultured teleosts. Aquaculture 177, 231‐247.
93
Moran, C.A., 2004. Functional components of the cell wall of Sacchromyces cerevisiae: applications for yeast glucan and mannan. In: Lyons, T.P., Jacques, K.A. (Eds.), Nutritional Biotechnology in the Feed and Food Industries. Nottingham University Press, UK, pp. 283–296.
Pryor, G.S., Royes, J.B., Chapman, F.A., Miles, R.D., 2003. Mannanoligosaccharides in fish nutrition: Effects of dietary supplementation on growth and gastrointestinal villi structure in gulf of Mexico sturgeon. North American Journal of Aquaculture 65, 106‐111.
Rasmussen, M.R., McLean, E., 2004. Comparison of two different methods for evaluating the hydrodynamic performance of an industrial‐scale fish‐rearing unit. Aquaculture 242, 397‐416.
Rasmussen, M.R., Laursen, J., Craig, S.R., McLean, E., 2005. Do fish enhance tank mixing? Aquaculture 250, 162‐174.
Sawada, Y., Okada, T., Miyashita, S., Murata, O., Kumai, H., 2005. Completion of the Pacific bluefin tuna Thunnus orientalis (Temminck et Schlegel) life cycle. Aquaculture Research 36, 413‐421.
Schwarz, M.H., McLean, E., Craig, S.R., 2007. Research experience with cobia: larval rearing, juvenile nutrition and general physiology. In: Liao, C.I., Leaño, E.M. (Eds.), Cobia Aquaculture: Research Development and Commercial Production. Asian Fisheries Society, Manila, Philippines; World Aquaculture Society, Louisiana, USA; The Fisheries Society of Taiwan, Keelung Taiwan; and National Taiwan Ocean University, Keelung, Taiwan.
Smith, H.W., 1930. The absorption and excretion of water and salts by marine teleosts. American Journal of Physiology 93, 480‐505.
Varsamos, S., Nebel, C., Charmantier, G., 2005. Ontogeny of osmoregulation in postembryonic fish: A review. Comparative Biochemistry and Physiology. A ‐ Molecular and Integrative Physiology 141, 401‐429.
Varsamos, S., Flik, G., Pepin, J.F., Bonga, S.E.W., Breuil, G., 2006. Husbandry stress during early life stages affects the stress response and health status of juvenile sea bass, Dicentrarchus labrax. Fish & Shellfish Immunology 20, 83‐96.
Watanabe, Y., 1984. An ultrastructural study of intracellular digestion of horseradish peroxidase by the rectal epithelium cells in larvae of a freshwater cottid fish Cottus nozawae. Bulletin of the Japanese Society of Scientific Fisheries 50, 409–416.
Welker, T.L., Lim, C., Yildirim‐Aksoy, M., Shelby, R., Klesius, P.H., 2007. Immune response and resistance to stress and Edwardsiella ictaluri challenge in channel catfish, Ictalurus punctatus, fed diets containing commercial whole‐cell yeast or yeast subcomponents. Journal of the World Aquaculture Society 38, 24‐35.
94
Zydlewski, J., McCormick, S.D., 1997. The ontogeny of salinity tolerance in the American shad, Alosa sapidissima. Canadian Journal of Fisheries and Aquatic Sciences 54, 182‐189.
95
Chapter VI . REPLACEMENT OF
F I SH O I L WITH NOVEL SOURCES OF N
3 H IGHLY UNSATURATED FATTY AC IDS
I N AQUAFEEDS FOR J UVEN I LE COB IA
Abstract
Replacement of fish ingredients in aquafeeds is a major line of research in aquaculture. However, the majority of this research has focused on alternate protein sources, despite the more pressing perspective of fish oil (FO) shortage. Two strategies may be employed to replace essential fatty acids (FA): direct supplementation, or supply of precursors to promote de novo biosynthesis. Both strategies were investigated in the present study through the use of two novel lipid sources: a docosahexaenoic acid (DHA)‐rich algae meal (ALG) and a stearidonic acid (STA, n‐3 FA precursor of EPA and DHA)‐rich oil, derived from a genetically modified soybean (MSO). Starting from a control diet (100% FO), FO was gradually replaced by MSO in the first 3 experimental diets, and MSO by ALG in 3 other diets (thereby were FO‐free). A 7th diet was formulated with a different algae meal produced at Virginia Tech (AVT). The response of juvenile cobia (starting individual weight: 30g) was measured in terms of growth, feed efficiency (FE), survival, body and liver composition, and biological indices. FE was high and similar across treatments (73%), while growth and hepatosomatic index were significantly impacted by dietary treatment. Proximate analysis did not reveal elevated levels of EPA or DHA levels in the muscle or liver, thus suggesting that juvenile cobia were unable to elongate STA. In contrast, juvenile cobia performed best when fed algal meals, and accumulated DHA levels in their muscle that would statisfy the USDA‐recommended daily DHA intake for healthy adults. In conclusion, feeding FA precursors does not appear to be a viable strategy for FO elimination in cobia aquafeeds. FO‐free diets were successfully formulated using DHA‐rich algal meal in conjunction with soy oil. Essential FA must be directly supplied through the diet by an EPA‐ and DHA‐rich source, whether naturally present or genetically engineered.
Keywords: Rachycentron canadum, soybean, fish oil replacement, elongation
96
INTRODUCTION
As the global demand for seafood products continues to rise, it is no longer feasible to rely
solely upon oceanic wild fisheries, and the aquaculture industry constitutes the only alternative
source for these commodities. However, aquaculture traditionally depends highly upon
reduction fisheries and the resulting fish meal and fish oil, which by all accounts cannot sustain
the levels of production that must be reached to fulfill this impending seafood deficit. Thus, the
industry must move away from these protein and lipid sources to achieve environmental and
economic sustainability, and utilize suitable alternative feedstuffs in formulated aquafeeds.
To be considered a viable alternative to fish meal or oil, a feedstuff must be widely available
and competitively priced, as well as easily handled, stored and amenable to feed production
(Gatlin, et al., 2007). The vast majority of research into use of alternative ingredients has
focused mainly on fish meal replacement (FMR), with investigations into the use of plant
proteins predominating. While other protein sources are available, their use is either
discouraged (e.g. meat and bone meals due to fears of Bovine Spongiform Encephalopathy) or
simply not economically feasible due to a lack of consistent and sufficient supply. As a result of
these research efforts, particularly with plant‐based alternatives, fish meal inclusion rates have
been significantly reduced over the past decade (Gomes, et al., 1995; Lunger, et al., 2007b),
although further reductions are mandatory if the aquaculture industry is to become truly
sustainable.
97
While advances in terms of limiting the utilization of fish meal in aquafeeds have been
noteworthy, depletion of fish oil resources are more pressing than that of fish meal. In fact, the
FAO predicted that in 2015, global use of fish oil will exceed 145% of the historic world
production levels (New and Wijkström, 2002). Fish oil replacement in aquafeeds is more
problematic for several reasons. First, marine fish species require n‐3 highly unsaturated fatty
acids (HUFA) that are prevalent in marine fish oils. These requirements must be addressed
when looking to replace fish oil, especially if fish meal, another source of these marine‐derived
n‐3 fatty acids (FA), is also replaced or reduced in the dietary formulation. Another aspect of
fish oil replacement that must be accounted for is the beneficial effects on human health that
have been clearly documented. These include, but are not limited to, decreased cardiovascular
disease, dementia, depression and Alzheimer’s disease (Bourre, 2006; Das, 2008).
Finally, it is essential that alternate sources to fish oil are sourced through commodity crops,
so they are produced consistently in sufficient quantities to support an industry. For instance,
while global production of fish oil remains stagnant, the production of vegetable oils has
steadily increased and reached a volume of a hundred‐fold higher than that of fish oil (Bimbo,
1990). Numerous studies have successfully examined the incorporation potential of vegetable
oils in fish diets in various marine carnivorous species, including European sea bass Dicentrarcus
labrax (Montero, et al., 2005), gilthead seabream Sparus auratus (Izquierdo, et al., 2005), and
turbot Psetta maxima (Regost, et al., 2003a; Regost, et al., 2003b). However, if the aquaculture
industry is to utilize vegetable oils as fish oil replacements, it is imperative that the beneficial
health impacts of fish oil, not only upon the targeted species, but also for the human consumer,
98
are retained. Undoubtedly, there is a need to further investigate alternate lipid sources that not
only fulfill the biological requirements of the cultured animal, but also will provide health
benefits accrued by the consumption of seafood on a regular basis.
When considering the replacement of fish oil with plant‐derived lipid sources, several
strategies could be employed to ensure that the n‐3 FA levels are maintained for both the fish
as well as the consumer. The most promising tactics relate to direct dietary supplementation
with novel, alternate n‐3 FA sources and/or enhancement of endogenous biosynthesis through
dietary manipulation.
Direct supplementation
Among the required n‐3 FA for marine fish species, docosahexaenoic acid (22:6n‐3: DHA) is
considered to be the most important. Currently, fish oils from wild marine catches constitute
the major source of n‐3 HUFA, although these products are hampered by market limitations
that include odor issues, stability problems, and seasonal and climatic variations of fish stocks.
Heavy metal and other contaminants in wild marine catches also raise concerns relating to fish
oil as dietary supplements. However, oils derived from terrestrial plants are devoid of DHA and
thus are unsuitable as the sole replacement for fish oil. Since microalgae are the primary
synthesizers of n‐3 HUFA in the natural environment, replacing fish oil with n‐3 HUFA‐enriched
algae provides an excellent opportunity to develop alternative n‐3 sources. Additionally, these
micro‐algae can be grown under controlled heterotrophic conditions, which allows for mass
production in a sustainable manner.
99
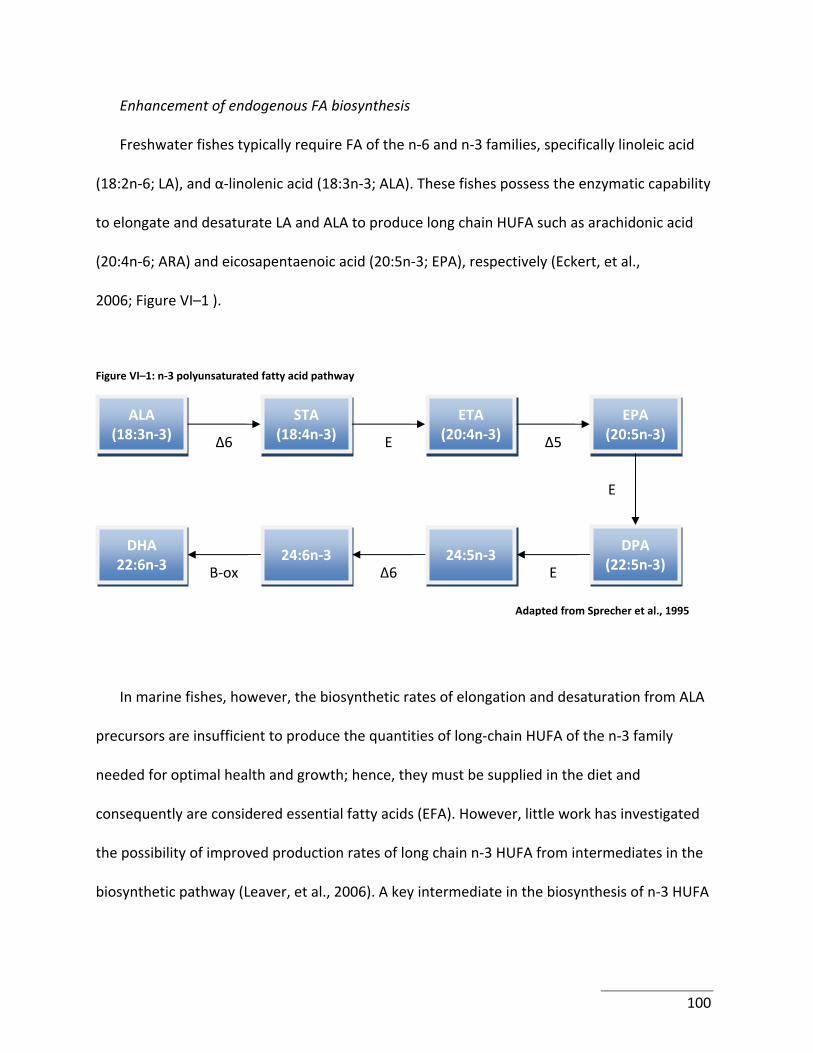
Enhancement of endogenous FA biosynthesis
Freshwater fishes typically require FA of the n‐6 and n‐3 families, specifically linoleic acid
(18:2n‐6; LA), and α‐linolenic acid (18:3n‐3; ALA). These fishes possess the enzymatic capability
to elongate and desaturate LA and ALA to produce long chain HUFA such as arachidonic acid
(20:4n‐6; ARA) and eicosapentaenoic acid (20:5n‐3; EPA), respectively (Eckert, et al.,
2006; Figure VI–1 ).
Figure VI–1: n‐3 polyunsaturated fatty acid pathway
ALA (18:3n‐3)
STA (18:4n‐3)
ETA (20:4n‐3)
EPA (20:5n‐3)
DPA (22:5n‐3)
24:5n‐3 24:6n‐3 Β‐ox Δ6 E
E
Δ5 E Δ6
22:6n‐3 DHA
Adapted from Sprecher et al., 1995
In marine fishes, however, the biosynthetic rates of elongation and desaturation from ALA
precursors are insufficient to produce the quantities of long‐chain HUFA of the n‐3 family
needed for optimal health and growth; hence, they must be supplied in the diet and
consequently are considered essential fatty acids (EFA). However, little work has investigated
the possibility of improved production rates of long chain n‐3 HUFA from intermediates in the
biosynthetic pathway (Leaver, et al., 2006). A key intermediate in the biosynthesis of n‐3 HUFA
100
is stearidonic acid (18:4n‐3; STA). This FA results from the Δ6 desaturation of ALA, and upon
elongation and Δ5 desaturation, becomes EPA (Sprecher, et al., 1995).
This study investigated the efficacy of fish oil replacement by novel algal‐meal supplements.
Additionally, the ability of juvenile cobia to produce endogenous n‐3 HUFA from intermediate
precursors in the biosynthetic pathway was estimated through the inclusion of STA‐enriched
oil. Finally, the impacts of these nutritional manipulations on the FA profiles of liver and muscle
tissues were determined.
MATERIALS AND METHODS
Stocking and live support system
The study was conducted at the Virginia Tech Aquaculture Center (VTAC) using a
recirculating life‐support system composed of twenty‐four, 300 L fiberglass tanks. Juvenile
cobia (average individual weight 30.0 ± 0.1 g) were obtained from the Virginia Seafood
Agricultural Research and Extension Center (VSAREC, Hampton, VA), and randomly stocked at
10 fish per tank. The water treatment loop consisted of a bubble bead filter (BBF‐2 Aquaculture
Technologies Inc., Metaire, LA) to remove suspended solids, a sump containing fluidized bed
KMT media (Kaldnes Inc., Providence, RI) for biological filtration, a UV light (Emperor Aquatics,
Pottstown, PA) for sterilization, a side‐looped protein skimmer (R&B Aquatic Distribution,
Waring, TX) to filter out smaller solids and decrease turbidity, and a thermostatically controlled
heater placed in the sump to maintain water temperature at 29oC . Salinity was maintained at
101
20 ppt with the addition of synthetic sea salt (Marine Enterprises International, Baltimore, MD).
All fish were subjected to a 12:12 light:dark cycle using a combination of fluorescent and
incandescent lighting to simulate dawn and dusk.
Water quality parameters were measured every other day and included temperature and
pH (HI 9024 pH meter, HANNA Instruments, Woonsocket, RI), dissolved oxygen (YSI
tensionometer, Aquatic Ecosystems, 154 Apopka, FL), salinity using a refractometer (Aquatic
Ecosystems, Apopka, FL), and TAN, NH4‐N, NO2‐N and NO3‐N, which were measured
spectrophotometrically (HACH DR/2400 Spectrophotometer, HACH Co., Loveland, CO). At the
start of the study, ten individuals were randomly allocated to each tank (average initial weight
30g/fish).
Feeding and feed formulation
Each tank was randomly assigned to one of eight diets (n=3 tanks/diet), and the fish were
hand‐fed twice daily at 09:00 and 16:00 for 7 weeks. Feeding rates were determined based on
the total biomass in each tank: the fish were initially fed 10% body weight, which was gradually
decreased to 4% by the end of the study to maintain a level of satiation without over‐feeding.
Daily feeding rations were divided equally between two feedings (9am and 4pm), and
uneatened feed was recorded daily. Fish from each tank were bulk‐weighed weekly to monitor
growth and adjust feeding rates.
102
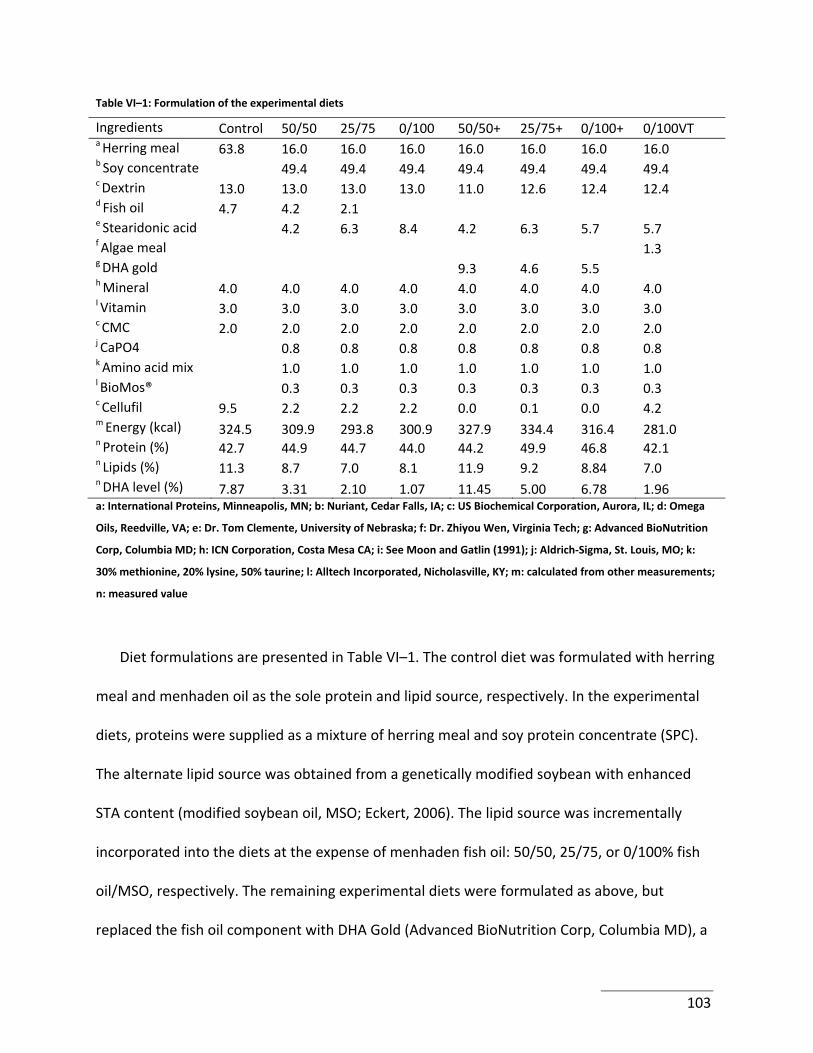
Table VI–1: Formulation of the experimental diets
Ingredients Control 50/50 25/75 0/100 50/50+ 25/75+ 0/100+ 0/100VT a Herring meal 63.8 16.0 16.0 16.0 16.0 16.0 16.0 16.0 b Soy concentrate 49.4 49.4 49.4 49.4 49.4 49.4 49.4 c Dextrin 13.0 13.0 13.0 13.0 11.0 12.6 12.4 12.4 d Fish oil 4.7 4.2 2.1 e Stearidonic acid 4.2 6.3 8.4 4.2 6.3 5.7 5.7 f Algae meal 1.3 g DHA gold 9.3 4.6 5.5 h Mineral 4.0 4.0 4.0 4.0 4.0 4.0 4.0 4.0 I Vitamin 3.0 3.0 3.0 3.0 3.0 3.0 3.0 3.0 c CMC 2.0 2.0 2.0 2.0 2.0 2.0 2.0 2.0 j CaPO4 0.8 0.8 0.8 0.8 0.8 0.8 0.8 k Amino acid mix 1.0 1.0 1.0 1.0 1.0 1.0 1.0 l BioMos® 0.3 0.3 0.3 0.3 0.3 0.3 0.3 c Cellufil 9.5 2.2 2.2 2.2 0.0 0.1 0.0 4.2 m Energy (kcal) 324.5 309.9 293.8 300.9 327.9 334.4 316.4 281.0 n Protein (%) 42.7 44.9 44.7 44.0 44.2 49.9 46.8 42.1 n Lipids (%) 11.3 8.7 7.0 8.1 11.9 9.2 8.84 7.0 n DHA level (%) 7.87 3.31 2.10 1.07 11.45 5.00 6.78 1.96 a: International Proteins, Minneapolis, MN; b: Nuriant, Cedar Falls, IA; c: US Biochemical Corporation, Aurora, IL; d: Omega
Oils, Reedville, VA; e: Dr. Tom Clemente, University of Nebraska; f: Dr. Zhiyou Wen, Virginia Tech; g: Advanced BioNutrition
Corp, Columbia MD; h: ICN Corporation, Costa Mesa CA; i: See Moon and Gatlin (1991); j: Aldrich‐Sigma, St. Louis, MO; k:
30% methionine, 20% lysine, 50% taurine; l: Alltech Incorporated, Nicholasville, KY; m: calculated from other measurements;
n: measured value
Diet formulations are presented in Table VI–1. The control diet was formulated with herring
meal and menhaden oil as the sole protein and lipid source, respectively. In the experimental
diets, proteins were supplied as a mixture of herring meal and soy protein concentrate (SPC).
The alternate lipid source was obtained from a genetically modified soybean with enhanced
STA content (modified soybean oil, MSO; Eckert, 2006). The lipid source was incrementally
incorporated into the diets at the expense of menhaden fish oil: 50/50, 25/75, or 0/100% fish
oil/MSO, respectively. The remaining experimental diets were formulated as above, but
replaced the fish oil component with DHA Gold (Advanced BioNutrition Corp, Columbia MD), a
103
DHA‐rich, algae‐based meal (ALG). These diets are referred to as 50/50+, 25/75+ and 0/100+,
respectively. An additional diet was designed by replacing DHA Gold with an algae meal
produced on an experimental scale at Virginia Tech (AVT; Chi, et al., 2007; Pyle, et al. 2008).
This meal provided 18.6% crude protein and 53.9% lipid (dry matter basis) with a DHA content
of 19.5% (dry matter basis).
Sampling and measurements
At the end of the trial, 3 fish per tank were randomly sampled, and euthanized by an
overdose of clove oil (Sigma‐Aldrich, St Louis, MO). They then were measured, weighed, and
dissected to obtain total viscera, liver and fillet masses. Viscera‐somatic index (VSI; visceral
mass wt * 100/body wt.), hepatosomatic index (HSI; liver wt. * 100/body wt.), and muscle ratio
(MR; fillet wt. * 100/body wt.) were calculated from these measurements. Muscle and liver
samples were frozen at ‐20oC pending proximate analysis for crude protein and lipid (AOAC,
1994).
Fatty acid analysis
Total lipids were extracted and measured according to the procedures of Folch (1957), prior
to being trans‐esterified according to the protocol developed by Indarti et al. (2005). The fatty
acid methyl esters then were analyzed on a Shimadzu GC 2010 gas chromatograph (Shimadzu
Scientific Instrument, Inc., Columbia, MD) equipped with a flame‐ionization detector and a SGE
104
SolGel‐Wax capillary column (30 m × 0.25 mm × 0.25 μm). The fatty acids were identified by
comparison of retention times with standards obtained from Sigma. Helium was used carrier
gas. The temperature settings for injector, column, and detector were described previously
(Chi, et al., 2007). The fatty acids were identified by comparing the retention times with those
of standard fatty acids (Nu‐Chek Prep, Inc., Elysian, MN) and quantified by comparing their peak
area with that of the internal standard (C17:0; Chi, et al., 2007). Quantification of fatty acids
was carried out by comparing their peak areas with that of the internal standard (C17:0).
Statistical analysis
Data were analyzed with one‐way analysis of variance using JMP 7.0 (SAS Institute, Cary,
NC). Significance level was set at α=0.05, and Tukey‐Kramer HSD was used for testing means
separation where appropriate.
RESULTS
Growth and feed efficiency
Water quality results are presented in Table VI–2. All measured parameters were within
their respective recommended ranges for juvenile cobia (Rodrigues, et al., 2007). Table VI–3
shows that over the course of the trial, fish that were fed the 50/50+ and 0/100+ achieved a
heavier average final weight and experienced a higher overall weight gain (P=0.0062 and
105
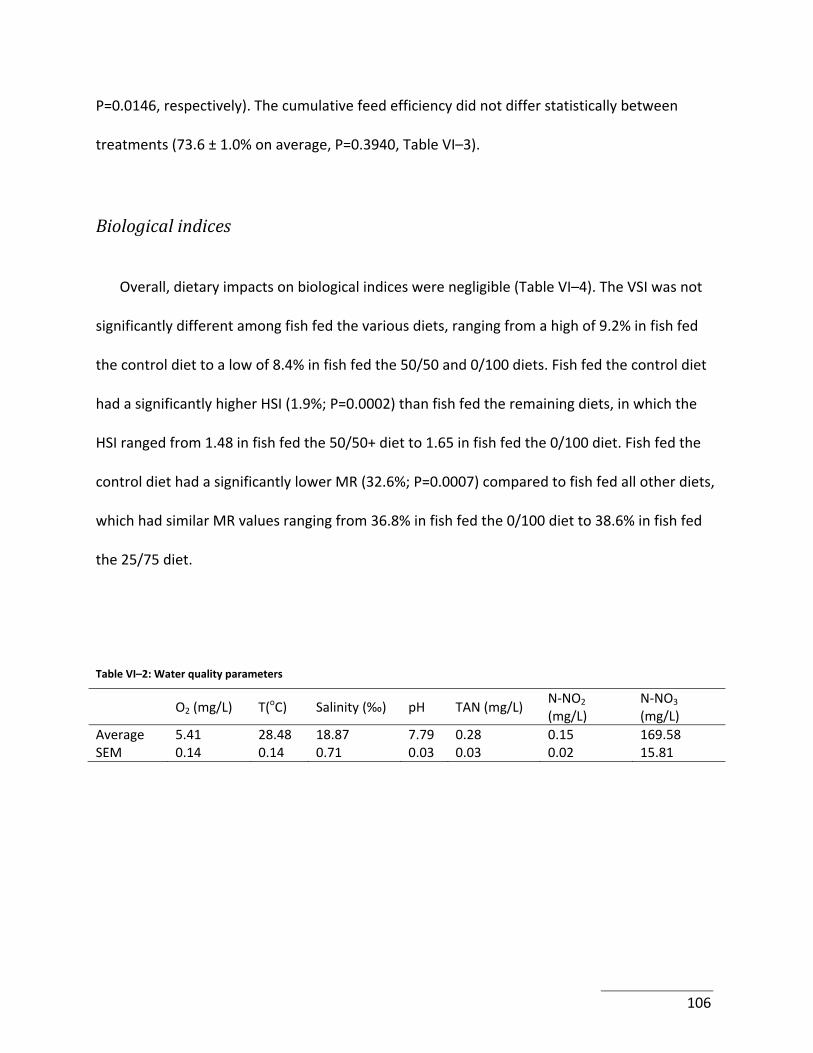
P=0.0146, respectively). The cumulative feed efficiency did not differ statistically between
treatments (73.6 ± 1.0% on average, P=0.3940, Table VI–3).
Biological indices
Overall, dietary impacts on biological indices were negligible (Table VI–4). The VSI was not
significantly different among fish fed the various diets, ranging from a high of 9.2% in fish fed
the control diet to a low of 8.4% in fish fed the 50/50 and 0/100 diets. Fish fed the control diet
had a significantly higher HSI (1.9%; P=0.0002) than fish fed the remaining diets, in which the
HSI ranged from 1.48 in fish fed the 50/50+ diet to 1.65 in fish fed the 0/100 diet. Fish fed the
control diet had a significantly lower MR (32.6%; P=0.0007) compared to fish fed all other diets,
which had similar MR values ranging from 36.8% in fish fed the 0/100 diet to 38.6% in fish fed
the 25/75 diet.
Table VI–2: Water quality parameters
O2 (mg/L) T(oC) Salinity (‰) pH TAN (mg/L)
N‐NO2 (mg/L)
N‐NO3 (mg/L)
Average 5.41 28.48 18.87 7.79 0.28 0.15 169.58 SEM 0.14 0.14 0.71 0.03 0.03 0.02 15.81
106
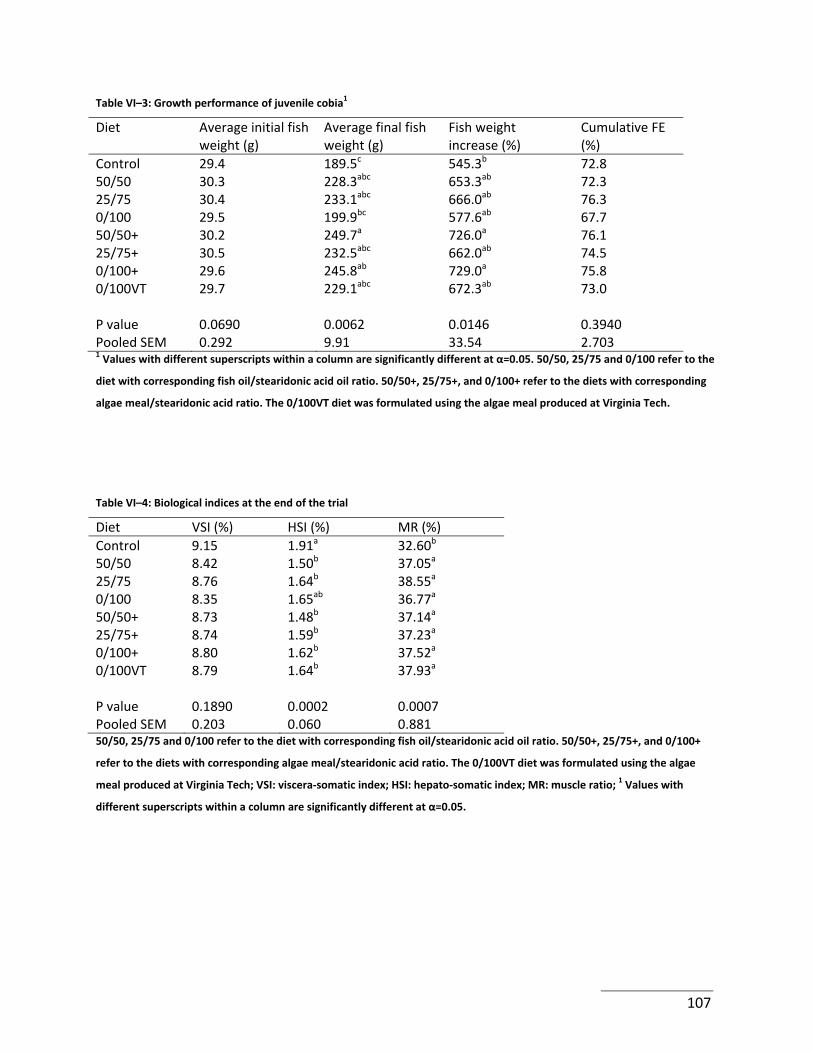
Table VI–3: Growth performance of juvenile cobia1
Diet Average initial fish weight (g)
Average final fish weight (g)
Fish weight increase (%)
Cumulative FE (%)
Control 29.4 189.5c 545.3b 72.8 50/50 30.3 228.3abc 653.3ab 72.3 25/75 30.4 233.1abc 666.0ab 76.3 0/100 29.5 199.9bc 577.6ab 67.7 50/50+ 30.2 249.7a 726.0a 76.1 25/75+ 30.5 232.5abc 662.0ab 74.5 0/100+ 29.6 245.8ab 729.0a 75.8 0/100VT 29.7 229.1abc 672.3ab 73.0 P value 0.0690 0.0062 0.0146 0.3940 Pooled SEM 0.292 9.91 33.54 2.703 1 Values with different superscripts within a column are significantly different at α=0.05. 50/50, 25/75 and 0/100 refer to the
diet with corresponding fish oil/stearidonic acid oil ratio. 50/50+, 25/75+, and 0/100+ refer to the diets with corresponding
algae meal/stearidonic acid ratio. The 0/100VT diet was formulated using the algae meal produced at Virginia Tech.
Table VI–4: Biological indices at the end of the trial
Diet VSI (%) HSI (%) MR (%) Control 9.15 1.91a 32.60b
50/50 8.42 1.50b 37.05a
25/75 8.76 1.64b 38.55a
0/100 8.35 1.65ab 36.77a
50/50+ 8.73 1.48b 37.14a
25/75+ 8.74 1.59b 37.23a
0/100+ 8.80 1.62b 37.52a
0/100VT 8.79 1.64b 37.93a
P value 0.1890 0.0002 0.0007 Pooled SEM 0.203 0.060 0.881 50/50, 25/75 and 0/100 refer to the diet with corresponding fish oil/stearidonic acid oil ratio. 50/50+, 25/75+, and 0/100+
refer to the diets with corresponding algae meal/stearidonic acid ratio. The 0/100VT diet was formulated using the algae
meal produced at Virginia Tech; VSI: viscera‐somatic index; HSI: hepato‐somatic index; MR: muscle ratio; 1 Values with
different superscripts within a column are significantly different at α=0.05.
107
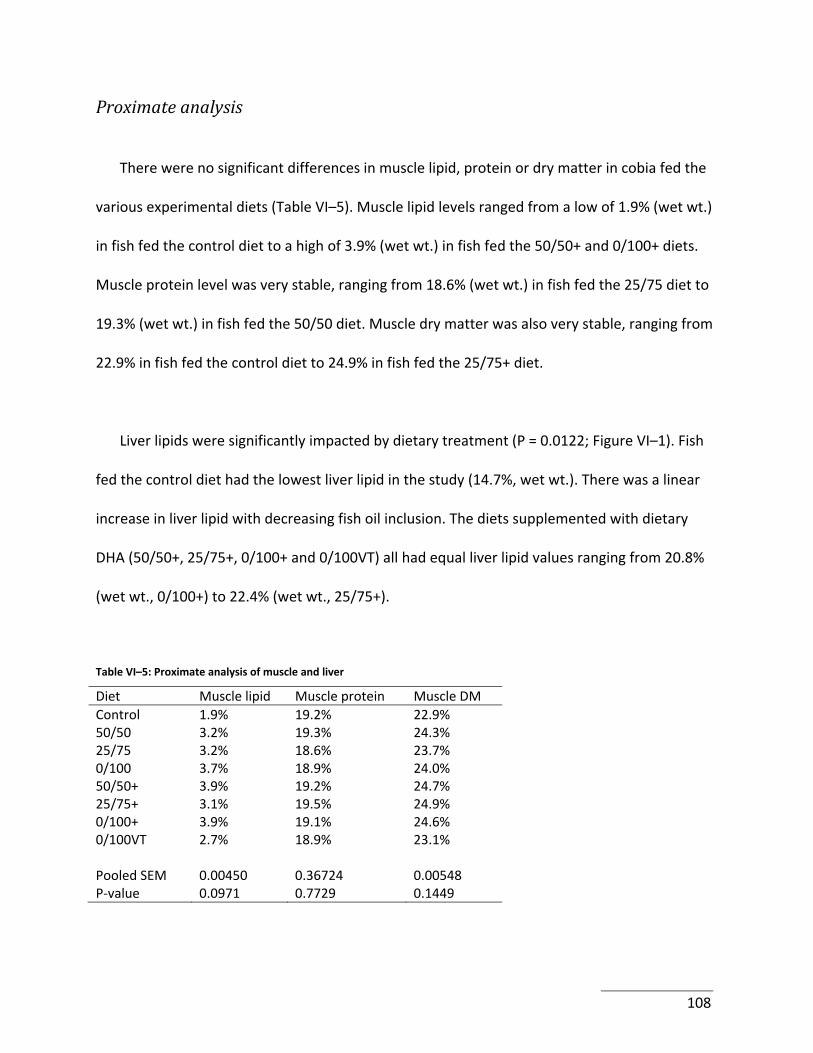
Proximate analysis
There were no significant differences in muscle lipid, protein or dry matter in cobia fed the
various experimental diets (Table VI–5). Muscle lipid levels ranged from a low of 1.9% (wet wt.)
in fish fed the control diet to a high of 3.9% (wet wt.) in fish fed the 50/50+ and 0/100+ diets.
Muscle protein level was very stable, ranging from 18.6% (wet wt.) in fish fed the 25/75 diet to
19.3% (wet wt.) in fish fed the 50/50 diet. Muscle dry matter was also very stable, ranging from
22.9% in fish fed the control diet to 24.9% in fish fed the 25/75+ diet.
Liver lipids were significantly impacted by dietary treatment (P = 0.0122; Figure VI–1). Fish
fed the control diet had the lowest liver lipid in the study (14.7%, wet wt.). There was a linear
increase in liver lipid with decreasing fish oil inclusion. The diets supplemented with dietary
DHA (50/50+, 25/75+, 0/100+ and 0/100VT) all had equal liver lipid values ranging from 20.8%
(wet wt., 0/100+) to 22.4% (wet wt., 25/75+).
Table VI–5: Proximate analysis of muscle and liver
Diet Muscle lipid Muscle protein Muscle DM Control 1.9% 19.2% 22.9% 50/50 3.2% 19.3% 24.3% 25/75 3.2% 18.6% 23.7% 0/100 3.7% 18.9% 24.0% 50/50+ 3.9% 19.2% 24.7% 25/75+ 3.1% 19.5% 24.9% 0/100+ 3.9% 19.1% 24.6% 0/100VT 2.7% 18.9% 23.1% Pooled SEM 0.00450 0.36724 0.00548 P‐value 0.0971 0.7729 0.1449
108
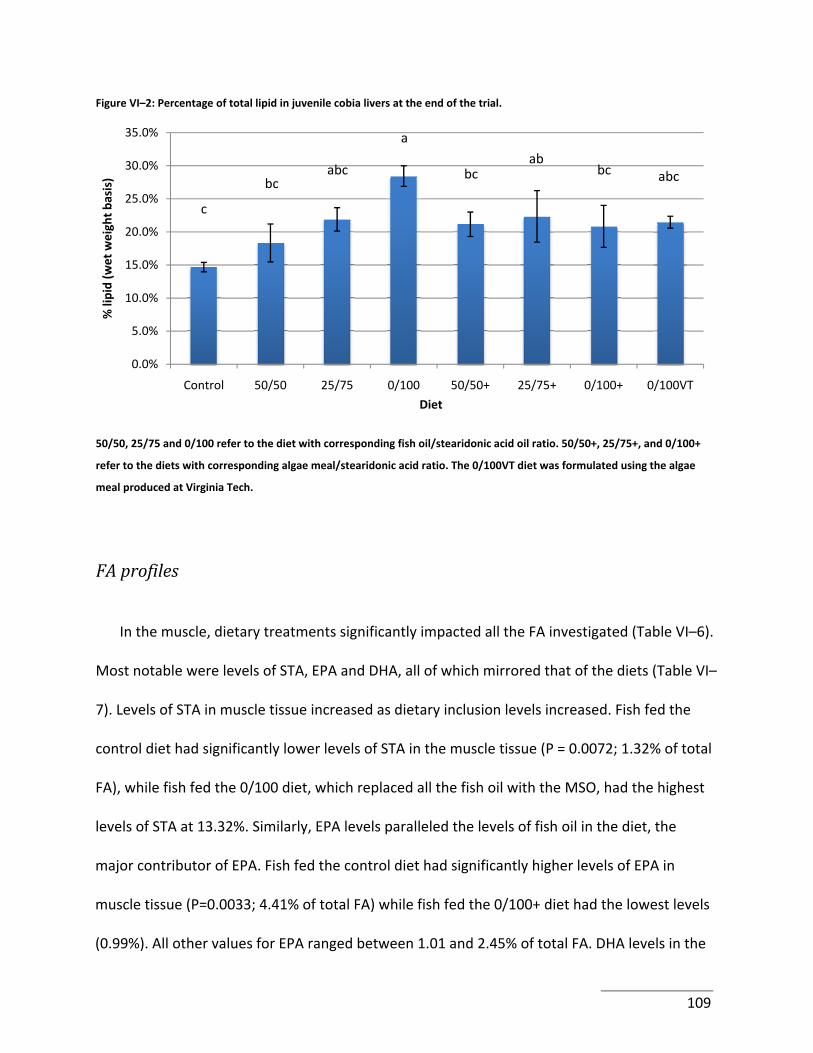
Figure VI–2: Percentage of total lipid in juvenile cobia livers at the end of the trial.
0.0%
5.0%
10.0%
15.0%
20.0%
25.0%
30.0%
35.0%
Control 50/50 25/75 0/100 50/50+ 25/75+ 0/100+ 0/100VT
% lipid (w
et weight b
asis)
Diet
a
ab bc
bc abc bc abc
c
50/50, 25/75 and 0/100 refer to the diet with corresponding fish oil/stearidonic acid oil ratio. 50/50+, 25/75+, and 0/100+
refer to the diets with corresponding algae meal/stearidonic acid ratio. The 0/100VT diet was formulated using the algae
meal produced at Virginia Tech.
FA profiles
In the muscle, dietary treatments significantly impacted all the FA investigated (Table VI–6).
Most notable were levels of STA, EPA and DHA, all of which mirrored that of the diets (Table VI–
7). Levels of STA in muscle tissue increased as dietary inclusion levels increased. Fish fed the
control diet had significantly lower levels of STA in the muscle tissue (P = 0.0072; 1.32% of total
FA), while fish fed the 0/100 diet, which replaced all the fish oil with the MSO, had the highest
levels of STA at 13.32%. Similarly, EPA levels paralleled the levels of fish oil in the diet, the
major contributor of EPA. Fish fed the control diet had significantly higher levels of EPA in
muscle tissue (P=0.0033; 4.41% of total FA) while fish fed the 0/100+ diet had the lowest levels
(0.99%). All other values for EPA ranged between 1.01 and 2.45% of total FA. DHA levels in the
109
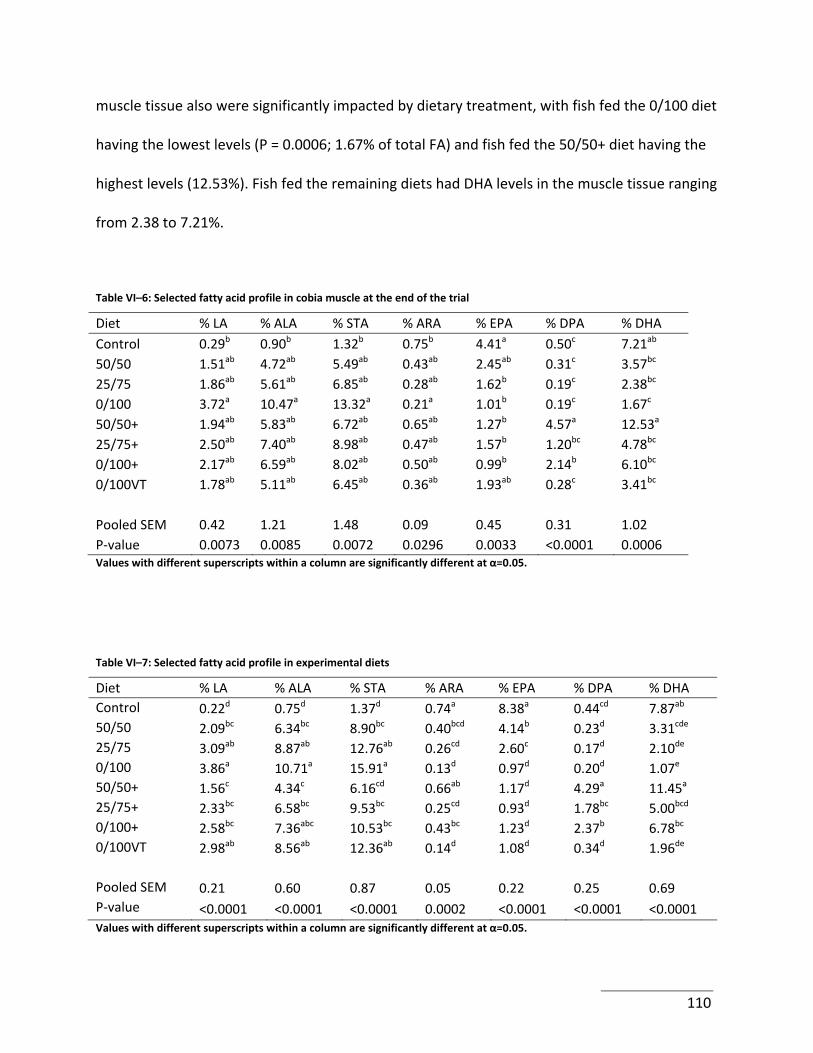
muscle tissue also were significantly impacted by dietary treatment, with fish fed the 0/100 diet
having the lowest levels (P = 0.0006; 1.67% of total FA) and fish fed the 50/50+ diet having the
highest levels (12.53%). Fish fed the remaining diets had DHA levels in the muscle tissue ranging
from 2.38 to 7.21%.
Table VI–6: Selected fatty acid profile in cobia muscle at the end of the trial
Diet % LA % ALA % STA % ARA % EPA % DPA % DHA Control 0.29b 0.90b 1.32b 0.75b 4.41a 0.50c 7.21ab
50/50 1.51ab 4.72ab 5.49ab 0.43ab 2.45ab 0.31c 3.57bc
25/75 1.86ab 5.61ab 6.85ab 0.28ab 1.62b 0.19c 2.38bc
0/100 3.72a 10.47a 13.32a 0.21a 1.01b 0.19c 1.67c
50/50+ 1.94ab 5.83ab 6.72ab 0.65ab 1.27b 4.57a 12.53a
25/75+ 2.50ab 7.40ab 8.98ab 0.47ab 1.57b 1.20bc 4.78bc
0/100+ 2.17ab 6.59ab 8.02ab 0.50ab 0.99b 2.14b 6.10bc
0/100VT 1.78ab 5.11ab 6.45ab 0.36ab 1.93ab 0.28c 3.41bc
Pooled SEM 0.42 1.21 1.48 0.09 0.45 0.31 1.02 P‐value 0.0073 0.0085 0.0072 0.0296 0.0033 <0.0001 0.0006 Values with different superscripts within a column are significantly different at α=0.05.
Table VI–7: Selected fatty acid profile in experimental diets
Diet % LA % ALA % STA % ARA % EPA % DPA % DHA Control 0.22d 0.75d 1.37d 0.74a 8.38a 0.44cd 7.87ab
50/50 2.09bc 6.34bc 8.90bc 0.40bcd 4.14b 0.23d 3.31cde
25/75 3.09ab 8.87ab 12.76ab 0.26cd 2.60c 0.17d 2.10de
0/100 3.86a 10.71a 15.91a 0.13d 0.97d 0.20d 1.07e
50/50+ 1.56c 4.34c 6.16cd 0.66ab 1.17d 4.29a 11.45a
25/75+ 2.33bc 6.58bc 9.53bc 0.25cd 0.93d 1.78bc 5.00bcd
0/100+ 2.58bc 7.36abc 10.53bc 0.43bc 1.23d 2.37b 6.78bc
0/100VT 2.98ab 8.56ab 12.36ab 0.14d 1.08d 0.34d 1.96de
Pooled SEM 0.21 0.60 0.87 0.05 0.22 0.25 0.69 P‐value <0.0001 <0.0001 <0.0001 0.0002 <0.0001 <0.0001 <0.0001 Values with different superscripts within a column are significantly different at α=0.05.
110
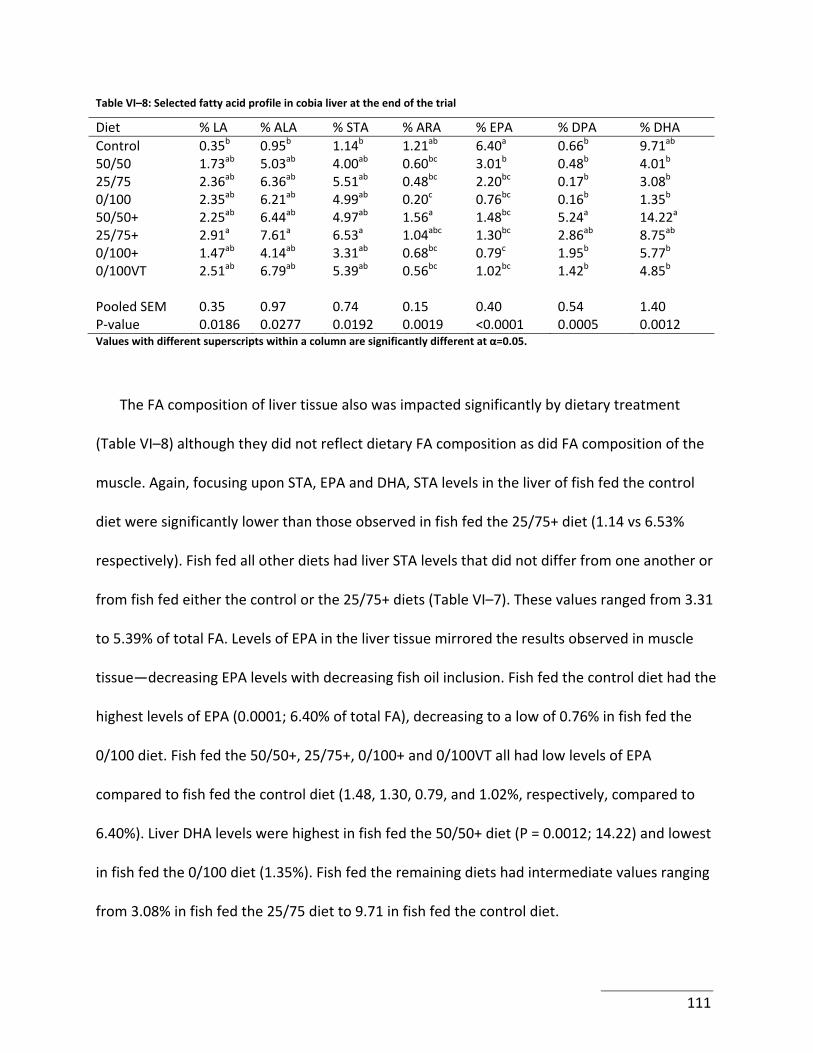
Table VI–8: Selected fatty acid profile in cobia liver at the end of the trial
Diet % LA % ALA % STA % ARA % EPA % DPA % DHA Control 0.35b 0.95b 1.14b 1.21ab 6.40a 0.66b 9.71ab
50/50 1.73ab 5.03ab 4.00ab 0.60bc 3.01b 0.48b 4.01b
25/75 2.36ab 6.36ab 5.51ab 0.48bc 2.20bc 0.17b 3.08b
0/100 2.35ab 6.21ab 4.99ab 0.20c 0.76bc 0.16b 1.35b
50/50+ 2.25ab 6.44ab 4.97ab 1.56a 1.48bc 5.24a 14.22a
25/75+ 2.91a 7.61a 6.53a 1.04abc 1.30bc 2.86ab 8.75ab
0/100+ 1.47ab 4.14ab 3.31ab 0.68bc 0.79c 1.95b 5.77b
0/100VT 2.51ab 6.79ab 5.39ab 0.56bc 1.02bc 1.42b 4.85b
Pooled SEM 0.35 0.97 0.74 0.15 0.40 0.54 1.40 P‐value 0.0186 0.0277 0.0192 0.0019 <0.0001 0.0005 0.0012 Values with different superscripts within a column are significantly different at α=0.05.
The FA composition of liver tissue also was impacted significantly by dietary treatment
(Table VI–8) although they did not reflect dietary FA composition as did FA composition of the
muscle. Again, focusing upon STA, EPA and DHA, STA levels in the liver of fish fed the control
diet were significantly lower than those observed in fish fed the 25/75+ diet (1.14 vs 6.53%
respectively). Fish fed all other diets had liver STA levels that did not differ from one another or
from fish fed either the control or the 25/75+ diets (Table VI–7). These values ranged from 3.31
to 5.39% of total FA. Levels of EPA in the liver tissue mirrored the results observed in muscle
tissue—decreasing EPA levels with decreasing fish oil inclusion. Fish fed the control diet had the
highest levels of EPA (0.0001; 6.40% of total FA), decreasing to a low of 0.76% in fish fed the
0/100 diet. Fish fed the 50/50+, 25/75+, 0/100+ and 0/100VT all had low levels of EPA
compared to fish fed the control diet (1.48, 1.30, 0.79, and 1.02%, respectively, compared to
6.40%). Liver DHA levels were highest in fish fed the 50/50+ diet (P = 0.0012; 14.22) and lowest
in fish fed the 0/100 diet (1.35%). Fish fed the remaining diets had intermediate values ranging
from 3.08% in fish fed the 25/75 diet to 9.71 in fish fed the control diet.
111
DISCUSSION
This study investigated the potential ability of juvenile cobia to elongate and desaturate STA
into longer‐chain n‐3 HUFA. As well, I examined the impacts of supplementing algae‐based DHA
for dietary fish oil replacement and the role of these novel alternate lipids for enhancing DHA
levels in the edible flesh.
The juvenile cobia in the present study accepted the experimental diets readily, with no
apparent issues regarding palatability. This is evidenced by excellent feed efficiency (FE) values,
which averaged approximately 73% over the trial course (approximately 1.3 as a feed
conversion ratio). Growth, as measured by percent increase from initial weight, was concordant
with growth trials described previously from our laboratory and others investigating cobia
(Craig, et al., 2006; Lunger, et al., 2007a; Resley, et al., 2006; Webb, et al., 2007; Zhou, et al.,
2005). Levels of STA in the muscle reflected that in the diet, although it cannot be determined
whether this FA was esterified into phosphatidylcholine, as observed in Atlantic salmon (Ghioni,
et al., 2002), or stored as triacylglyceride. Interestingly, liver STA levels in cobia were not
elevated above 5‐6.5% regardless of the dietary level. This finding suggests a maximum storage
concentration in hepatic tissue. The HSI was elevated significantly in fish fed the control diet
compared to all other diets. Among fish fed the diets without DHA supplementation, the liver
lipid content was correlated positively with dietary STA (P=0.0009, R2=0.398), and correlated
negatively with dietary n‐3 HUFA (P=0.0023, R2=0.316). This strongly suggests that the
112
processing function of hepatic lipids was impaired in fish fed the 0/100 diet due to a lack of
long‐chain n‐3 HUFA.
Correspondingly, based on the liver lipid data from the present study, it appears as if
juvenile cobia require a minimum of 1% DHA (of total lipid) for optimal growth and health. As
elevated liver lipid is a classic symptom of EFA deficiency in many marine fishes (Castell, et al.,
1972), the significantly higher liver lipid values in cobia fed the 0/100 diet suggest a sub‐clinical
indication of an EFA deficiency, even though weight gain was not significantly impacted. As the
EFA requirement for cobia has not been determined quantitatively, this is only an estimation.
However, most marine fish species require between 0.5 and 2% n‐3 HUFA (as a percentage of
total diet; Lochmann and Gatlin, 1993). In juvenile cobia, it appears as if an inclusion of 2% n‐3
HUFA (as a percentage of dry diet) ensures optimal growth, health and hepatic function.
In this trial, the STA‐rich oil utilized was derived from a genetically modified soybean strain
(Eckert, et al., 2006). Additionally, this oil contained significantly higher levels of STA than those
used by previous researchers (Bell, et al., 2006; Miller, et al., 2007; Tocher, et al., 2006). It is
widely accepted that marine fish have limited capabilities to elongate and desaturate precursor
FA such as ALA into longer‐chain FA of the n‐3 family (Almaida‐Pagan, et al., 2007; Miller, et al.,
2007; Tocher, et al., 2006). Hence, the replacement of fish oil in aquafeeds must address the
EFA requirement for these species, so that growth and health of the target species is not
impacted detrimentally. It is well known that in marine fishes the Δ6 desaturation is the main
rate‐limiting step in the biosynthetic pathway which converts C18 precursors into STA (Miller,
113
et al., 2007; Tocher, et al., 1998). This enzyme is also involved in the conversion of EPA to DHA
(Sprecher, et al., 1995; Yamazaki, et al., 1992; Figure 1). However, it has been shown that
feeding Atlantic salmon (Salmo salar) diets low in ALA may stimulate some FA desaturation and
elongation (Tocher, et al., 2002). Nevertheless, this bioconversion was insufficient to maintain
concentrations of EPA and DHA in the tissue to the same concentrations as observed in FO‐fed
fish; hence the need for dietary supplementation.
While many studies have replaced a proportion of fish oil successfully in a wide variety of
species (Almaida‐Pagan, et al., 2007; Karapanagiotidis, et al., 2007; Mourente, et al., 2005;
Peng, et al., 2008; Tocher, et al., 2003), very few have attempted to replace fish oil entirely by
providing a down‐stream intermediate to serve as a precursor for further elongation and
desaturation reactions. Moreover, all dealt with cold water and/or salmonid species exclusively.
In the present study, STA was incorporated to bypass the initial Δ6 desaturation step and to
determine whether juvenile cobia could further elongate and desaturate this precursor. In
other studies involving STA incorporation in aquafeeds, Bell and coworkers (2006) investigated
the total replacement of fish oil by echium oil, which contained γ‐linolenic (18:3n‐6; GLA) and
STA, in Atlantic cod (Gadus morhua), and observed an accumulation of STA, GLA and dihomo‐
GLA (20:3n‐6), along with a decrease in EPA and ARA concentrations in both flesh and liver.
Tocher et al. (2006) replaced 80% of dietary fish oil with echium oil, and examined its impact in
terms of elongation and desaturation into long chain n‐3 HUFA in Arctic charr (Salvelinus
alpines). Similar to the present study, these authors observed no bioconversion of these down‐
114
stream intermediates into EPA and DHA and noted that Arctic charr could not maintain tissue n‐
3 HUFA or ARA levels given these precursors.
Since the present study also bypassed the initial Δ6 desaturation step, the absence of EPA
implied that either elongation or Δ5 desaturation is more rate‐limiting. However
eicosatetraenoic acid (20:4n‐3; ETA), which is the product of STA elongation, was virtually
absent as well, thus suggesting this step might be most limiting in this biosynthetic pathway.
Ghioni et al. (1999) described a similar finding in vitro from a cell line derived from turbot
(Psetta maxima) in which the C18‐20 elongase activity was more rate‐limiting than that of the Δ5
desaturase. This result, however, differs from salmonids, which are capable of desaturating and
elongating STA into ETA and EPA, but not DHA (Ghioni, et al., 2002). Taken together, feeding FA
precursors such as STA does not appear to be a viable strategy for fish oil elimination in cobia
aquafeeds. This is most likely due to the involvement of the limiting elongase and Δ6desaturase
at multiple points in the endogenous biosynthetic pathway, regardless of the carbon chain
length or degree of unsaturation (Figure VI–1). However, research on genetic modification of
commodity crops such as oil seeds is conducted in order to enrich these seeds in EPA and DHA
directly. This would provide a safe, cheap and plentiful alternate source of long‐chain HUFA for
both aquaculture and human consumption (Napier and Sayanova, 2005).
Despite the requirement of a microbiological facility for their commercial exploitation,
marine algae represent another promising alternative to fish oil, especially for their high n‐3
HUFA content, which are of primary importance for marine carnivorous fish. They also provide
115
the opportunity to enhance the beneficial n‐3 HUFA levels in fish that normally would not
naturally accrue these FA, such as freshwater fishes. In the present trial, the algal meals (ALG
and AVT) were utilized as a replacement for fish oil in the “plus” diets, i.e., the lipid component
in these diets was composed of STA and algal meals only — no fish oil was present. Two types
of algae meals were utilized in the present study: one that is available commercially (ALG) and
the other (AVT) produced at Virginia Tech on a small, experimental scale utilizing crude glycerol
as the substrate (Pyle, et al., 2008). While the inclusion rates were significantly different, the
impacts upon muscle DHA levels were similar statistically. Additionally, there were no
significant differences with respect to weight gain or feed efficiency in cobia fed these two algal
meals. With both sources of DHA algal meals, muscle DHA contents reflected those of the
respective diets and were similar statistically. As well, DHA levels in the liver tissues from fish
fed both algal meals were the same (Table VI–8). This indicates comparable utilization of both
forms of DHA supplementation by juvenile cobia. In terms of final product quality with respect
to consumer health and DHA levels, cobia fed the diets supplemented with the algal meals
contained at least 138 mg/150 g fillet compared to 205 mg/150 g fillet from fish fed the control
diet containing 100% herring meal and added fish oil. These levels of DHA are relatively high,
especially if one takes into account the low total lipid levels measured in the cobia fillet (1.9‐
3.2% wet wt.). The US Food and Drug Administration (FDA) currently recommends a daily DHA
intake of approximately 150 mg DHA per day for healthy adults.
As these algae meals contained predominantly DHA, and STA is included typically in n‐3
HUFA calculations in terms of EFA requirements, the diets in the present study contained
116
extremely high levels of n‐3 HUFA. Previous work with red drum Sciaenops ocellatus (Lochmann
and Gatlin, 1993), coho salmon Oncorhynchus kisutch (Yu and Sinhuber, 1979) and channel
catfish Ictalurus punctatus (Satoh, et al., 1989) all indicated growth depression with high dietary
n‐3 HUFA levels . This depression was not observed herein, as cobia fed the diets containing the
highest levels of n‐3 HUFA (50/50+ and 0/100+) both exhibited the highest weight gain over the
7‐week feeding trial. It is noteworthy that both of these diets contained no fish oil, indicating
that manufacturing and administrating fish oil‐free diets is a distinct possibility in cultured
marine carnivorous fish. Additionally, all the experimental diets, as opposed to the control diet,
contained only 16% herring meal as the fish meal source, and all numerically outperformed the
100% herring meal control diet in terms of weight gain. This is a true indication that cobia
aquafeeds can be formulated with significantly lowered fish meal and fish oil inclusion rates
without impacting production performance or characteristics detrimentally.
Acknowledgments
Funding for this research was provided by the Illinois Soybean Association, Indiana Soybean
Alliance, Iowa Soybean Association, Nebraska Soybean Board, and the United Soybean Board.
117
Cited references
Almaida‐Pagan, R., Hernandez, M.D., Garcia, B.G., Madrid, J.A., De Costa, J., Mendiola, P., 2007. Effects of total replacement of fish oil by vegetable oils on n‐3 and n‐6 polyunsaturated fatty acid desaturation and elongation in sharpsnout seabream (Diplodus puntazzo) hepatocytes and enterocytes. Aquaculture 272, 589‐598.
AOAC, 1994. Official Methods of Analysis. Association of Official Analytical Chemists, Arlington, VA.
Bell, J.G., Strachan, F., Good, J.E., Tocher, D.R., 2006. Effect of dietary echium oil on growth, fatty acid composition and metabolism, gill prostaglandin production and macrophage activity in Atlantic cod (Gadus morhua L.). Aquaculture Research 37, 606‐617.
Bimbo, A.P., 1990. Production of fish oil. Van Nostrand Reinhold, New York. Bourre, J.M., 2006. Effects of nutrients (in food) on the structure and function of the nervous
system: Update on dietary requirements for brain. Part 2: Macronutrients. Journal of Nutrition Health & Aging 10, 386‐399.
Castell, J.D., Lee, D.J., Sinnhuber, R.O., 1972. Essential fatty acids in the diet of rainbow rrout (Salmo gairdneri): lipid metabolism and fatty acid composition. Journal of Nutrition 102, 93‐99.
Chi, Z., Pyle, D., Wen, Z., Frear, C., Chen, S., 2007. A laboratory study of producing docosahexaenoic acid from biodiesel‐waste glycerol by microalgal fermentation. Process Biochemistry 42, 1537‐1545.
Craig, S.R., Schwarz, M.H., McLean, E., 2006. Juvenile cobia (Rachycentron canadum) can utilize a wide range of protein and lipid levels without impacts on production characteristics. Aquaculture 261, 384‐391.
Das, U.N., 2008. Folic acid and polyunsaturated fatty acids improve cognitive function and prevent depression, dementia, and Alzheimer's disease ‐ But how and why? Prostaglandins Leukotrienes and Essential Fatty Acids 78, 11‐19.
Eckert, H., LaVallee, B., Schweiger, B., Kinney, A., Cahoon, E., Clemente, T., 2006. Co‐expression of the borage Δ6 desaturase and the Arabidopsis Δ15 desaturase results in high accumulation of stearidonic acid in the seeds of transgenic soybean. Planta 224, 1050‐1057.
Folch, J., Lees, M., Stanley, G.H.S., 1957. A simple method for the isolation and purification of total lipides from animal tissues. The Journal of Biological Chemistry 226, 497‐509.
Gatlin, D.M., Barrows, F.T., Brown, P., Dabrowski, K., Gaylord, T.G., Hardy, R.W., Herman, E., Hu, G., Krogdahl, Å., Nelson, R., Overturf, K., Rust, M., Sealey, W., Skonberg, D., Souza, E.J., Stone, D., Wilson, R., Wurtele, E., 2007. Expanding the utilization of sustainable plant products in aquafeeds: a review, Aquaculture Research, pp. 551‐579.
118
Ghioni, C., Porter, A.E.A., Taylor, G.W., Tocher, D.R., 2002. Metabolism of 18 : 4n‐3 (stearidonic acid) and 20 : 4n‐3 in salmonid cells in culture and inhibition of the production of prostaglandin F‐2 alpha (PGF(2 alpha)) from 20 : 4n‐6 (arachidonic acid). Fish Physiology and Biochemistry 27, 81‐96.
Ghioni, C., Tocher, D.R., Bell, M.V., Dick, J.R., Sargent, J.R., 1999. Low C‐18 to C‐20 fatty acid elongase activity and limited conversion of stearidonic acid, 18 : 4(n‐3), to eicosapentaenoic acid, 20 : 5(n‐3), in a cell line from the turbot, Scophthalmus maximus. Biochimica Et Biophysica Acta‐Molecular and Cell Biology of Lipids 1437, 170‐181.
Gomes, E.F., Rema, P., Kaushik, S.J., 1995. Replacement of fish meal by plant proteins in the diet of rainbow trout (Oncorhynchus mykiss): digestibility and growth performance. Aquaculture 130, 177‐186.
Indarti, E., Majid, M.I.A., Hashim, R., Chong, A., 2005. Direct FAME synthesis for rapid total lipid analysis from fish oil and cod liver oil. Journal of Food Composition and Analysis 18, 161‐170.
Izquierdo, M.S., Montero, D., Robaina, L., Caballero, M.J., Rosenlund, G., Ginés, R., 2005. Alterations in fillet fatty acid profile and flesh quality in gilthead seabream (Sparus aurata) fed vegetable oils for a long term period. Recovery of fatty acid profiles by fish oil feeding. Aquaculture 250, 431‐444.
Karapanagiotidis, I.T., Bell, M.V., Little, D.C., Yakupitiyage, A., 2007. Replacement of dietary fish oils by alpha‐linolenic acid‐rich oils lowers omega 3 content in tilapia flesh. Lipids 42, 547‐559.
Leaver, M.J., Tocher, D.R., Obach, A., Jensen, L., Henderson, R.J., Porter, A.R., Krey, G., 2006. Effect of dietary conjugated linoleic acid (CLA) on lipid composition, metabolism and gene expression in Atlantic salmon (Salmo salar) tissues. Comparative Biochemistry and Physiology ‐ A. Molecular & Integrative Physiology 145, 258‐267.
Lochmann, R.T., Gatlin, D.M., 1993. Essential fatty acid requirement of juvenile red drum (Sciaenops ocellatus). Fish Physiology and Biochemistry 12, 221‐235.
Lunger, A.N., McLean, E., Craig, S.R., 2007a. The effects of organic protein supplementation upon growth, feed conversion and texture quality parameters of juvenile cobia (Rachycentron canadum). Aquaculture 264, 342‐352.
Lunger, A.N., McLean, E., Gaylord, T.G., Kuhn, D., Craig, S.R., 2007b. Taurine supplementation to alternative dietary proteins used in fish meal replacement enhances growth of juvenile cobia (Rachycentron canadum). Aquaculture 271, 401‐410.
Miller, M.R., Nichols, P.D., Carter, C.G., 2007. Replacement of dietary fish oil for Atlantic salmon parr (Salmo salar L.) with a stearidonic acid containing oil has no effect on omega‐3 long‐chain polyunsaturated fatty acid concentrations. Comparative Biochemistry and Physiology ‐ B. Biochemistry & Molecular Biology 146, 197‐206.
119
Montero, D., Robaina, L., Caballero, M.J., Ginés, R., Izquierdo, M.S., 2005. Growth, feed utilization and flesh quality of European sea bass (Dicentrarchus labrax) fed diets containing vegetable oils: A time‐course study on the effect of a re‐feeding period with a 100% fish oil diet. Aquaculture 248, 121‐134.
Mourente, G., Dick, J.R., Bell, J.G., Tocher, D.R., 2005. Effect of partial substitution of dietary fish oil by vegetable oils on desaturation and beta‐oxidation of [1‐C‐14]18 : 3n‐3 (LNA) and [1‐C‐14]20 : 5n‐3 (EPA) in hepatocytes and enterocytes of European sea bass (Dicentrarchus labrax L.). Aquaculture 248, 173‐186.
Napier, J.A., Sayanova, O., 2005. The production of very‐long‐chain PUFA biosynthesis in transgenic plants: towards a sustainable source of fish oils. Proceedings of the Nutrition Society 64, 387–393.
New, M.B., Wijkström, U.N., 2002. Use of fish meal and fish oil in aquafeeds: further thoughts on the fish meal trap. FAO, Rome.
Peng, S., Chen, L., Qin, J.G., Hou, J., Yu, N., Long, Z., Ye, J., Sun, X., 2008. Effects of replacement of dietary fish oil by soybean oil on growth performance and liver biochemical composition in juvenile black seabream, Acanthopagrus schlegeli. Aquaculture 276, 154‐161.
Pyle, D.J., Garcia, R.A., Wen, Z., 2008. Producing docosahexaenoic acid (DHA)‐rich algae from biodiesel‐derived crude glycerol: effects of impurities on DHA production and algal biomass composition. Journal of Agricultural and Food Chemistry 56, 3933‐3939.
Regost, C., Arzel, J., Cardinal, M., Rosenlund, G., Kaushik, S.J., 2003a. Total replacement of fish oil by soybean or linseed oil with a return to fish oil in turbot (Psetta maxima) ‐ 2. Flesh quality properties. Aquaculture 220, 737‐747.
Regost, C., Arzel, J., Robin, J., Rosenlund, G., Kaushik, S.J., 2003b. Total replacement of fish oil by soybean or linseed oil with a return to fish oil in turbot (Psetta maxima) ‐ 1. Growth performance, flesh fatty acid profile, and lipid metabolism. Aquaculture 217, 465‐482.
Resley, M.J., Webb, K.A., Holt, G.J., 2006. Growth and survival of juvenile cobia, Rachycentron canadum, at different salinities in a recirculating aquaculture system. Aquaculture 253, 398‐407.
Rodrigues, R.V., Schwarz, M.H., Delbos, B.C., Sampaio, L.A., 2007. Acute toxicity and sublethal effects of ammonia and nitrite for juvenile cobia Rachycentron canadum. Aquaculture 271, 553‐557.
Satoh, S., Poe, W.E., Wilson, R.P., 1989. Effect of dietary n‐3 fatty acids on weight gain and liver polar lipid fatty acid composition of fingerling channel catfish. Journal of Nutrition 119, 23‐28.
Sprecher, H., Luthria, D.L., Mohammed, B.S., Baykousheva, S.P., 1995. Reevaluation of the pathways for the biosynthesis of polyunsaturated fatty acids. Journal of Lipid Research 36, 2471‐2477.
120
Tocher, D., Fonseca‐Madrigal, J., Bell, J., Dick, J., Henderson, R., Sargent, J., 2002. Effects of diets containing linseed oil on fatty acid desaturation and oxidation in hepatocytes and intestinal enterocytes in Atlantic salmon (Salmo salar). Fish Physiology and Biochemistry 26, 157‐170.
Tocher, D.R., Leaver, M.J., Hodgson, P.A., 1998. Recent advances in the biochemistry and molecular biology of fatty acyl desaturases. Progress in Lipid Research 37, 73‐117.
Tocher, D.R., Dick, J.R., MacGlaughlin, P., Bell, J.G., 2006. Effect of diets enriched in Δ6 desaturated fatty acids (18:3n‐6 and 18:4n‐3), on growth, fatty acid composition and highly unsaturated fatty acid synthesis in two populations of Arctic charr (Salvelinus alpinus L.). Comparative Biochemistry and Physiology ‐ B. Biochemistry & Molecular Biology 144, 245‐253.
Tocher, D.R., Bell, J.G., McGhee, F., Dick, J.R., Fonseca‐Madrigal, J., 2003. Effects of dietary lipid level and vegetable oil on fatty acid metabolism in Atlantic salmon (Salmo salar L.) over the whole production cycle. Fish Physiology and Biochemistry 29, 193‐209.
Webb, K.A., Hitzfelder, G.M., Faulk, C.K., Holt, G.J., 2007. Growth of juvenile cobia, Rachycentron canadum, at three different densities in a recirculating aquaculture system. Aquaculture 264, 223‐227.
Yamazaki, K., Fujikawa, M., Hamazaki, T., Yano, S., Shono, T., 1992. Comparison of the conversion rates of alpha‐linolenic acid (18‐3(N‐3)) and stearidonic acid (18‐4(N‐3)) to longer polyunsaturated fatty acids in rats. Biochimica Et Biophysica Acta 1123, 18‐26.
Yu, T.C., Sinnhuber, R.O., 1979. Effect of dietary ω3 and ω6 fatty acids on growth and feed conversion efficiency of coho salmon (Oncorhynchus kisutch). Aquaculture 16, 31‐38.
Zhou, Q.C., Mai, K.S., Tan, B.P., Liu, Y.J., 2005. Partial replacement of fishmeal by soybean meal in diets for juvenile cobia (Rachycentron canadum). Aquaculture Nutrition 11, 175‐182.
121
Chapter VII . TOTAL REPLACEMENT
OF D IETARY F I SH MEAL I N COB IA
J UVEN I LE
Abstract
Achieving true sustainability in fish farming requires the replacement of most of the fish meal and fish oil utilized as feedstuffs. The present experiment reports 2 feeding trials that resulted in the total replacement of fish meal and fish oil in juvenile cobia (Rachycentron canadum). The first trial was conceived as a 2x3 factorial design with three levels of fish meal replacement (FMR; 50, 75 and 100% of dietary protein) by soy protein concentrate (SPC), and two levels of mannan oligosaccharide (MOS) supplementation (0 or 0.3% of the diet). Since MOS has been reported to promote gut health and integrity, it was included in order to verify whether it would ease high levels of FMR. Lipids were supplied by menhaden oil. In the second feeding trial, fish meal was replaced by various combinations of SPC and soybean meal (SBM), again with or without MOS supplementation. In addition, some diets were supplemented with purified amino acids. Lipids were supplied by fish oil. A final diet (NOFM) was formulated using SPC, a marine worm meal, a nucleotide‐rich yeast extract protein source, MOS, and a yeast source of selenomethionine. In the latter diet, lipids were supplied with a mix of soy oil and a DHA‐rich algal meal. Over both feeding trials, juvenile cobia consistently exhibited excellent performance at 75% FMR and less. MOS did not have a significant effect, although a beneficial trend was observed in the first trial at 100% FMR. In the second trial, the fish fed the NOFM diet exhibited one of the best weight gains and feed efficiencies, with no mortality and no impact on muscle and liver composition. This result illustrates the crucial importance of the selection of feedstuffs for FMR and fish oil, since the NOFM diet did not receive amino acid supplementation. However, the consistent, successful replacement of 94% of the fish meal in the other diets is actually more promising to the future as they solely utilized commodities traded (soy products) as replacement sources, which is the only road to true environmental and economical sustainability for the aquaculture industry.
122
Keywords: Rachycentron canadum; sustainability; soy protein concentrate; mannan
oligosaccharide; algae meal.
INTRODUCTION
Over the past several years, intense focus has been trained upon the reduction and/or
elimination of fish meal protein in aquafeeds, especially those designed for high‐level marine
carnivores. This goal has also been driven by the desire and need for the aquaculture industry
to achieve true sustainability, while attempting to fill the massive seafood deficit that must be
eliminated through aquaculture (FAO, 2007; Lunger, et al., 2006). Sustainable replacements for
fish meal protein are most often those of plant origin, especially the grains, pulses and oilseeds
(Gatlin, et al., 2007; Gaylord, et al., 2006; Lunger, et al., 2006). Soybean meal (SBM) has been
one of the most studied alternatives to fish meal, but has several limitations, including anti‐
nutritional factors, low levels of methionine and adverse effects on the intestinal integrity of
some carnivorous species (Gatlin, et al., 2007). Additionally, SBM is relatively low in crude
protein levels, especially when compared to fish meal. Hence, complete replacement of fish
meal in aquafeeds designed for carnivorous species requiring higher levels of dietary protein is
problematic due to these lower crude protein levels. With the recent increase in the price of
fish meal, as well as the realization of the need for alternate proteins to drive the industry
forward, more emphasis has been placed upon technologies that can concentrate protein
content from traditionally lower‐protein sources, resulting in products such as corn gluten meal
and soy protein concentrate (SPC; Barrows et al., 2007). These technologies have provided new,
alternative sources of protein which, in many cases, have crude protein levels similar to fish
meal. As production capacities of these plant‐based protein concentrates continues to increase,
price and availability will make these products more cost‐effective. However, their use and
123
optimal inclusion rates in aquafeeds designed for high‐level marine carnivores must be
ascertained, and many feedstuffs have similar problems in terms of inadequate amino acid
profiles.
At the Virginia Tech Aquaculture Center (VTAC), recent research has concentrated upon
total fish meal replacement in aquafeeds designed for cobia (Rachycentron canadum) utilizing a
wide variety of alternate protein sources with varying levels of success (Craig and McLean,
2005; Lunger, et al., 2006; Lunger, et al., 2007a; McLean and Craig unpublished data). Over the
course of these studies, diets containing 100% replacement of fish meal have been investigated
using a yeast‐based protein source (Lunger, et al., 2006; Lunger, et al., 2007a), with the finding
that the addition of taurine in diets with high levels of fish meal replacement (FMR) significantly
improved production characteristics (Lunger, et al., 2007b). Positive impacts of taurine
supplementation upon weight gain also have been observed in rainbow trout (Gaylord, et al.,
2006) and olive flounder (Kim, et al., 2007; Kim, et al., 2005). Unpublished results from our
laboratory on feeding trials conducted with cobia indicated that supplementation of other
amino acids such as methionine and lysine in addition to taurine is imperative if complete
replacement of fish meal is to be achieved without detrimental impacts on production
characteristics in juvenile cobia. Due to the outstanding nutritional qualities of fish meal which ,
include a well‐balanced amino acid profile, high digestibility and palatability, and the presence
of potential growth factors, it is well accepted that complete replacement will not be possible
with a single alternative protein source (Craig and McLean, 2005). Drawing upon our previous
findings, recent studies have investigated a blend of alternate protein sources, including yeast‐
124
based feedstuffs, Neried sp. worm meals, SBM, and other organic alternative protein sources
(Lunger, et al., 2007a), in combination with and without specific amino acid supplementation.
This study sought to build upon these previous findings by utilizing various combinations of soy
protein products and other alternative protein sources in aquafeeds that can be considered
commercially feasible in terms of cost‐effectiveness. Additionally, the use of mannan
oligosaccharides (MOS), which have been shown to benefit larval cobia intestinal development
(Salze, et al., 2008), were evaluated in feeds for juvenile cobia. The addition of MOS was
investigated to determine whether this feed additive could enhance gastrointestinal (GI) tract
integrity in juvenile cobia, thus aiding in the digestion of high levels of plant protein
incorporated as SBM and SPC. Two separate trials were conducted, each containing at least one
diet totally devoid of fish meal protein.
MATERIALS AND METHODS
Experimental system and husbandry
Both studies were undertaken using a recirculating aquaculture life support system. The
3400 L recirculation configuration (flow rate = 4 L min‐1 per aquaria) was comprised of twenty‐
four, 110 L glass aquaria serviced with a 750 L (200 gal) KMT‐based (Kaldnes Miljøteknologi,
Tønsberg, Norway) fluidized bed biofilter, a bubble‐bead filter (Aquaculture Technologies Inc.,
Metaire, LA) for solids removal, a protein skimmer (R&B Aquatics, Waring, TX), and a 40‐watt
UV sterilizer (Aquatic Ecosystems, Apopka, FL). The fluidized bed was oxygenated using
diffusion air lines connected to a 1 hp Sweetwater remote drive regenerative blower (Aquatic
125
Ecosystems, Apopka, FL). A photoperiod using phosphorescent tubes positioned 1.8 m above
the system was implemented using a 12h photophase‐scotophase cycle using an automated
timer with a half hour dusk/dawn period. Water quality parameters were monitored (3 times a
week) during the feeding trials. Water temperature (28oC) and pH (8.4) were monitored using a
Hanna Instrument 9024 pH meter (Aquatic Ecosystems, Apopka, FL). Salinity was maintained at
18 ppt using Crystal Sea synthetic sea salt (Marineland, Baltimore, MD) added to well water and
monitored using a refractometer. Dissolved oxygen (7.0 ± 0.1 ppm) and total ammonia nitrogen
(0.12 ± 0.01 ppm) were measured using a YSI 85 Series dissolved oxygen meter (YSI Inc., Yellow
Springs, OH) and by spectrophotometric analysis (Hach Inc., Loveland, CO), respectively. Nitrite
(0.074 ± 0.012 ppm) and nitrate (97.7 ± 2.2 ppm) levels were quantified once a week by
spectrophotometric analysis.
Juvenile cobia (Rachycentron canadum) were supplied by the Virginia Seafood Agricultural
Research and Extension Center (VSAREC, Hampton, VA, USA). Fish were transported to the
Virginia Tech Aquaculture Center (VTAC, Blacksburg, VA) and were acclimated and maintained
in eight 500 L tanks for approximately 60 days. Upon commencement of the feeding trials,
seven (81.7 ± 0.3 g, initial mean weight ± SEM) and five (104.0 ± 0.8 g) juvenile cobia for
experiment 1 and 2, respectively, were randomly placed into each tank. Fish were hand‐fed the
experimental diets (three tanks per diet) twice daily, at 9h00 and 16h00 for 6 weeks, starting at
7% body weight (bw) per day, and gradually decreasing to 5% bw d‐1, equally divided between
the two daily feedings. This maintained a level of apparent satiation without overfeeding. Fish
126
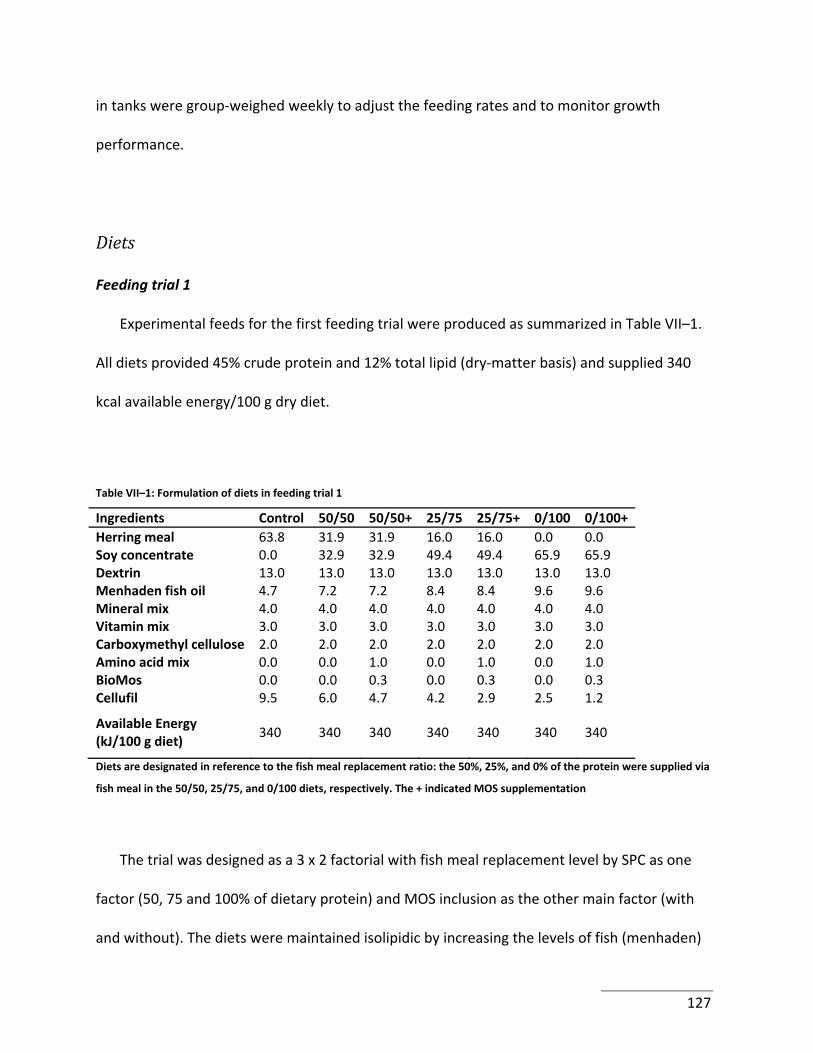
in tanks were group‐weighed weekly to adjust the feeding rates and to monitor growth
performance.
Diets
Feeding trial 1
Experimental feeds for the first feeding trial were produced as summarized in Table VII–1.
All diets provided 45% crude protein and 12% total lipid (dry‐matter basis) and supplied 340
kcal available energy/100 g dry diet.
Table VII–1: Formulation of diets in feeding trial 1
Ingredients Control 50/50 50/50+ 25/75 25/75+ 0/100 0/100+ Herring meal 63.8 31.9 31.9 16.0 16.0 0.0 0.0 Soy concentrate 0.0 32.9 32.9 49.4 49.4 65.9 65.9 Dextrin 13.0 13.0 13.0 13.0 13.0 13.0 13.0 Menhaden fish oil 4.7 7.2 7.2 8.4 8.4 9.6 9.6 Mineral mix 4.0 4.0 4.0 4.0 4.0 4.0 4.0 Vitamin mix 3.0 3.0 3.0 3.0 3.0 3.0 3.0 Carboxymethyl cellulose 2.0 2.0 2.0 2.0 2.0 2.0 2.0 Amino acid mix 0.0 0.0 1.0 0.0 1.0 0.0 1.0 BioMos 0.0 0.0 0.3 0.0 0.3 0.0 0.3 Cellufil 9.5 6.0 4.7 4.2 2.9 2.5 1.2
Available Energy (kJ/100 g diet)
340 340 340 340 340 340 340
Diets are designated in reference to the fish meal replacement ratio: the 50%, 25%, and 0% of the protein were supplied via
fish meal in the 50/50, 25/75, and 0/100 diets, respectively. The + indicated MOS supplementation
The trial was designed as a 3 x 2 factorial with fish meal replacement level by SPC as one
factor (50, 75 and 100% of dietary protein) and MOS inclusion as the other main factor (with
and without). The diets were maintained isolipidic by increasing the levels of fish (menhaden)
127
oil as fish meal levels decreased, and all diets except the control were supplemented with an
amino acid mix (methionine, lysine, and taurine; 20/30/50 w/w/w, respectively). The remaining
diets containing MOS were formulated by adding BioMos® (Alltech Inc., Nicholasville, KY), a
commercial MOS product, at a level of 0.3% of the diet at the expense of cellulose.
Feeding trial 2
In the second feeding trial, a total of six diets were prepared (Table VII–2) based on the
results of the first feeding trial, to further investigate MOS and amino acid supplementation in
high plant‐protein inclusion level diets for juvenile cobia, as well as to attempt to completely
replace fish meal and fish oil in a cobia diet. On a dry matter basis, total crude protein levels
were achieved with a combination of 25.3% from fish meal, 12.6% from SPC and 32.4% from
SBM. This served as the control diet. Neither the amino acid mix nor MOS was included in this
diet. The next two diets (SB and SB+) were formulated to contain 12.06% fish meal, 25.3% SPC
and 32.4% SBM as the dietary protein component. The SB+ diet was supplemented with MOS,
but did not receive the additional amino acid supplement utilized in the first feeding trial.
Two additional diets were formulated to contain the maximum inclusion levels of soy
products, in order to minimize overall protein costs. In these diets (MXSB and MXSB+), protein
levels from the soybean meal were maximized, resulting in 8.5% of the diet supplied by the fish
meal, 32.8% by the soy concentrate, and 39.9% by soybean meal. Both MXSB and MXSB+ diets
128
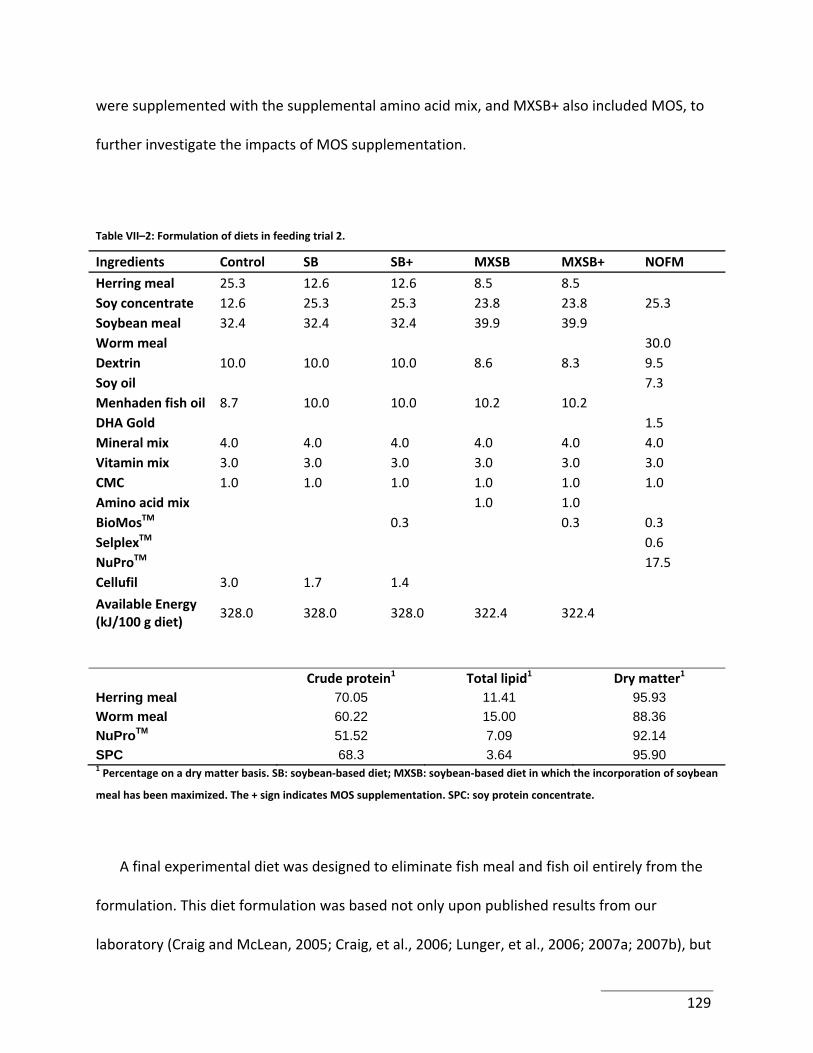
were supplemented with the supplemental amino acid mix, and MXSB+ also included MOS, to
further investigate the impacts of MOS supplementation.
Table VII–2: Formulation of diets in feeding trial 2.
Ingredients Control SB SB+ MXSB MXSB+ NOFM
Herring meal 25.3 12.6 12.6 8.5 8.5 Soy concentrate 12.6 25.3 25.3 23.8 23.8 25.3 Soybean meal 32.4 32.4 32.4 39.9 39.9 Worm meal 30.0 Dextrin 10.0 10.0 10.0 8.6 8.3 9.5 Soy oil 7.3 Menhaden fish oil 8.7 10.0 10.0 10.2 10.2 DHA Gold 1.5 Mineral mix 4.0 4.0 4.0 4.0 4.0 4.0 Vitamin mix 3.0 3.0 3.0 3.0 3.0 3.0 CMC 1.0 1.0 1.0 1.0 1.0 1.0 Amino acid mix 1.0 1.0 BioMosTM 0.3 0.3 0.3 SelplexTM 0.6 NuProTM 17.5 Cellufil 3.0 1.7 1.4
Available Energy (kJ/100 g diet)
328.0 328.0 328.0 322.4 322.4
Crude protein1 Total lipid1 Dry matter1
Herring meal 70.05 11.41 95.93 Worm meal 60.22 15.00 88.36 NuProTM 51.52 7.09 92.14 SPC 68.3 3.64 95.90 1 Percentage on a dry matter basis. SB: soybean‐based diet; MXSB: soybean‐based diet in which the incorporation of soybean
meal has been maximized. The + sign indicates MOS supplementation. SPC: soy protein concentrate.
A final experimental diet was designed to eliminate fish meal and fish oil entirely from the
formulation. This diet formulation was based not only upon published results from our
laboratory (Craig and McLean, 2005; Craig, et al., 2006; Lunger, et al., 2006; 2007a; 2007b), but
129
also incorporating the results of several unpublished feeding trials involving novel alternate
proteinsources in aquafeeds for juvenile cobia at our laboratory. In this diet – named NOFM –
proteins were supplied by 30% Nereid worm meal (SeaBait Industries, UK), 25.3% SPC, and
17.5% NuPro® (Alltech Inc., Nicholasville, KY), a yeast‐based protein source high in nucleotides.
Lipids were supplied endogenously from the worm meal as well as from soy oil and DHA‐
enriched algae meal (AquaGrow Gold, Advanced BioNutrition, Columbia, MD). This diet was not
supplemented with amino acids, but incorporated MOS and a selenomethionine‐rich yeast
extract (SelPlex®, Alltech Inc., Nicholasville, KY).
Diet manufacture
In both feeding trials, all diets were manufactured at the VTAC, where the dry dietary
components of the diet were first thoroughly mixed in a Patterson‐Kelley twin shell® Batch V‐
mixer (Patterson‐Kelley Co. Inc., East Stroudsburg, PA) prior to being transferred into a Hobart
D300 Floor Mixer (Hobart Co., Troy, OH), where oil was added and further mixed. The amount
of distilled water required for pelleting (20‐40% of feed weight) then was added to the mixture
and mixed until a pebble‐like consistency was achieved. The mixture then was pressure pelleted
using an appropriate die to provide pellets of suitable size for the fish. After air‐drying, feed
moisture content was approximately 15% and accurate dry matter determinations (AOAC,
1994) made so that feed quantity was based upon a dry‐matter basis. Bulk diets were frozen at
‐20°C and smaller portions were thawed and refrigerated as needed.
130
Data acquisition
At the end of the trials, three (n=9) and two fish (n=6) from each tank were used for data
acquisition in feeding trial 1 and 2, respectively. The fish were euthanized with an overdose of
anesthetic (clove oil, 3 mg L‐1; Sigma‐Aldrich, St. Louis, MO), prior to being measured for length
and weight. Overall weight gain, specific growth rate (SGR; 100 * Ln(final weight/initial
weight)/(trial duration)), and feed efficiency ratio were calculated from the latter. The fish were
then dissected and the visceral mass, liver, and filets were weighed to establish the viscera‐
somatic index (VSI; visceral weight / total body weight * 100), hepato‐somatic index (HSI; liver
weight / total body weight * 100), and muscle ratio (MR; total filet weight / total body weight *
100), respectively. Proximate analyses were performed on muscle and liver, and included crude
protein and lipid (AOAC, 1994).
Statistical analyses
In the first feeding trial, all data were subjected to factorial analysis of variance (ANOVA)
procedures utilizing JMP 7.0 (SAS, Cary, NC, USA). In the second trial, standard ANOVA
procedures were utilized. In both trials, when appropriate, Tukey‐Kramer HSD was used for
multiple comparisons of the means (α < 0.05).
131
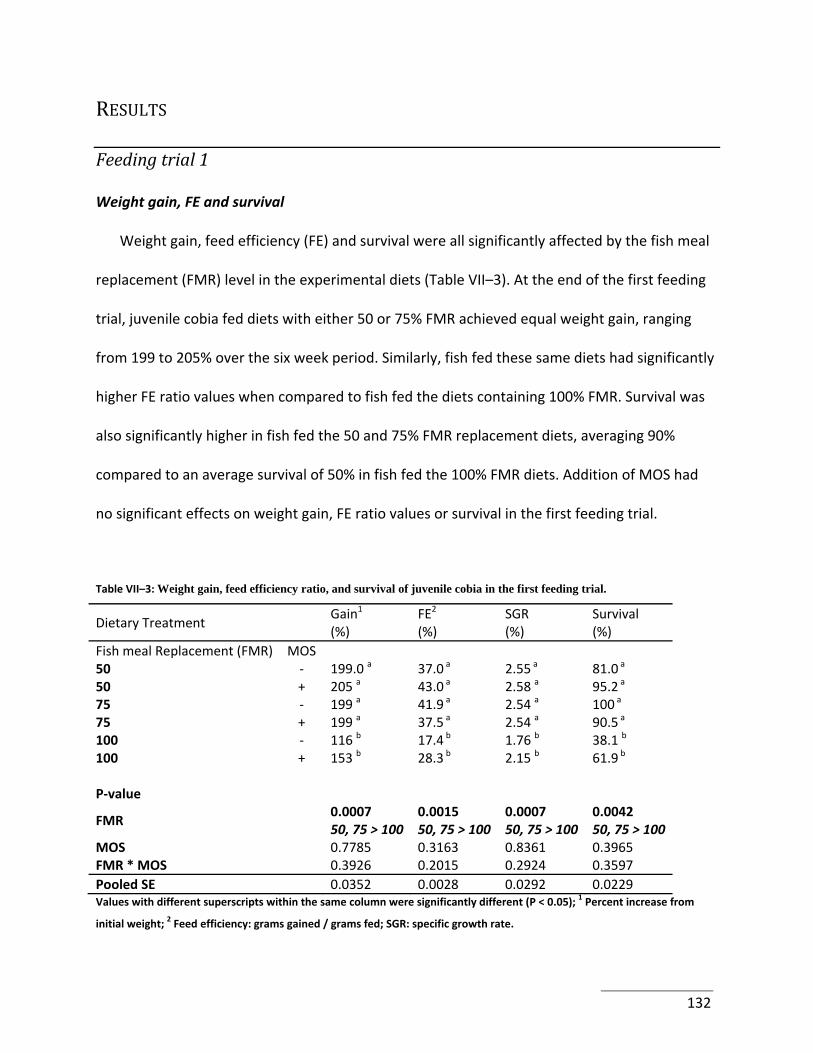
RESULTS
Feeding trial 1
Weight gain, FE and survival
Weight gain, feed efficiency (FE) and survival were all significantly affected by the fish meal
replacement (FMR) level in the experimental diets (Table VII–3). At the end of the first feeding
trial, juvenile cobia fed diets with either 50 or 75% FMR achieved equal weight gain, ranging
from 199 to 205% over the six week period. Similarly, fish fed these same diets had significantly
higher FE ratio values when compared to fish fed the diets containing 100% FMR. Survival was
also significantly higher in fish fed the 50 and 75% FMR replacement diets, averaging 90%
compared to an average survival of 50% in fish fed the 100% FMR diets. Addition of MOS had
no significant effects on weight gain, FE ratio values or survival in the first feeding trial.
Table VII–3: Weight gain, feed efficiency ratio, and survival of juvenile cobia in the first feeding trial.
Dietary Treatment Gain1 (%)
FE2 (%)
SGR (%)
Survival (%)
Fish meal Replacement (FMR) MOS 50 ‐ 199.0 a 37.0 a 2.55 a 81.0 a
50 + 205 a 43.0 a 2.58 a 95.2 a
75 ‐ 199 a 41.9 a 2.54 a 100 a
75 + 199 a 37.5 a 2.54 a 90.5 a
100 ‐ 116 b 17.4 b 1.76 b 38.1 b
100 + 153 b 28.3 b 2.15 b 61.9 b
P‐value
FMR 0.0007 50, 75 > 100
0.0015 50, 75 > 100
0.0007 50, 75 > 100
0.0042 50, 75 > 100
MOS 0.7785 0.3163 0.8361 0.3965 FMR * MOS 0.3926 0.2015 0.2924 0.3597 Pooled SE 0.0352 0.0028 0.0292 0.0229 Values with different superscripts within the same column were significantly different (P < 0.05); 1 Percent increase from
initial weight; 2 Feed efficiency: grams gained / grams fed; SGR: specific growth rate.
132
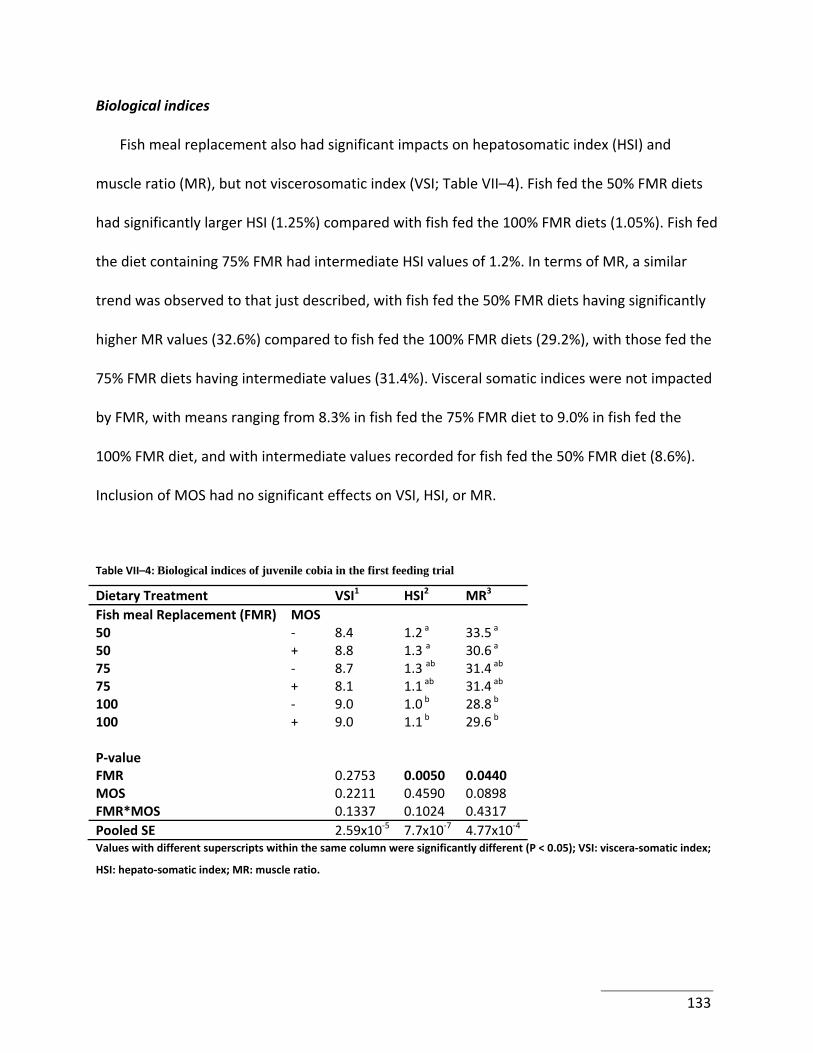
Biological indices
Fish meal replacement also had significant impacts on hepatosomatic index (HSI) and
muscle ratio (MR), but not viscerosomatic index (VSI; Table VII–4). Fish fed the 50% FMR diets
had significantly larger HSI (1.25%) compared with fish fed the 100% FMR diets (1.05%). Fish fed
the diet containing 75% FMR had intermediate HSI values of 1.2%. In terms of MR, a similar
trend was observed to that just described, with fish fed the 50% FMR diets having significantly
higher MR values (32.6%) compared to fish fed the 100% FMR diets (29.2%), with those fed the
75% FMR diets having intermediate values (31.4%). Visceral somatic indices were not impacted
by FMR, with means ranging from 8.3% in fish fed the 75% FMR diet to 9.0% in fish fed the
100% FMR diet, and with intermediate values recorded for fish fed the 50% FMR diet (8.6%).
Inclusion of MOS had no significant effects on VSI, HSI, or MR.
Table VII–4: Biological indices of juvenile cobia in the first feeding trial
Dietary Treatment VSI1 HSI2 MR3 Fish meal Replacement (FMR) MOS 50 ‐ 8.4 1.2 a 33.5 a
50 + 8.8 1.3 a 30.6 a
75 ‐ 8.7 1.3 ab 31.4 ab
75 + 8.1 1.1 ab 31.4 ab
100 ‐ 9.0 1.0 b 28.8 b
100 + 9.0 1.1 b 29.6 b
P‐value FMR 0.2753 0.0050 0.0440 MOS 0.2211 0.4590 0.0898 FMR*MOS 0.1337 0.1024 0.4317 Pooled SE 2.59x10‐5 7.7x10‐7 4.77x10‐4 Values with different superscripts within the same column were significantly different (P < 0.05); VSI: viscera‐somatic index;
HSI: hepato‐somatic index; MR: muscle ratio.
133
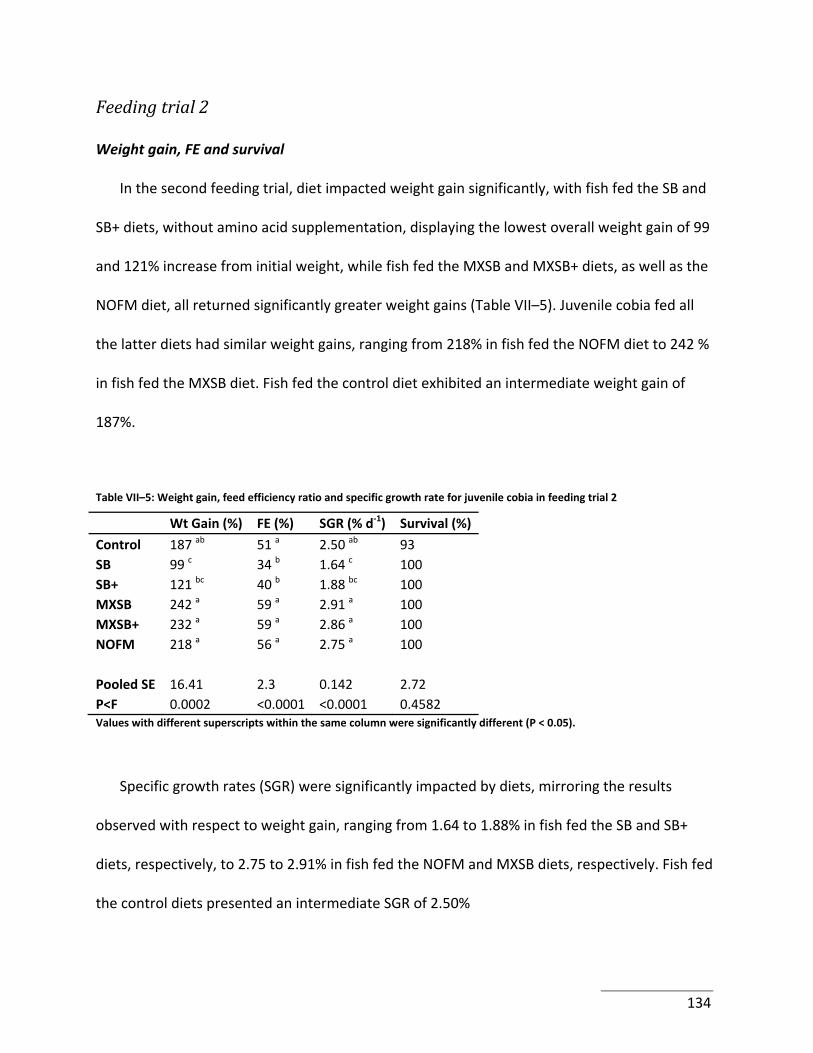
Feeding trial 2
Weight gain, FE and survival
In the second feeding trial, diet impacted weight gain significantly, with fish fed the SB and
SB+ diets, without amino acid supplementation, displaying the lowest overall weight gain of 99
and 121% increase from initial weight, while fish fed the MXSB and MXSB+ diets, as well as the
NOFM diet, all returned significantly greater weight gains (Table VII–5). Juvenile cobia fed all
the latter diets had similar weight gains, ranging from 218% in fish fed the NOFM diet to 242 %
in fish fed the MXSB diet. Fish fed the control diet exhibited an intermediate weight gain of
187%.
Table VII–5: Weight gain, feed efficiency ratio and specific growth rate for juvenile cobia in feeding trial 2
Wt Gain (%) FE (%) SGR (% d‐1) Survival (%)
Control 187 ab 51 a 2.50 ab 93 SB 99 c 34 b 1.64 c 100 SB+ 121 bc 40 b 1.88 bc 100 MXSB 242 a 59 a 2.91 a 100 MXSB+ 232 a 59 a 2.86 a 100 NOFM 218 a 56 a 2.75 a 100 Pooled SE 16.41 2.3 0.142 2.72 P<F 0.0002 <0.0001 <0.0001 0.4582 Values with different superscripts within the same column were significantly different (P < 0.05).
Specific growth rates (SGR) were significantly impacted by diets, mirroring the results
observed with respect to weight gain, ranging from 1.64 to 1.88% in fish fed the SB and SB+
diets, respectively, to 2.75 to 2.91% in fish fed the NOFM and MXSB diets, respectively. Fish fed
the control diets presented an intermediate SGR of 2.50%
134
FE ratio values were impacted significantly by diet, following a trend similar to that
observed with regards to weight gain (Table VII–5). Fish fed the MXSB (59%), MXSB+ (59%),
NOFM (56%) and control diets (51%) had statistically higher FE ratio values than fish fed the SB
and SB+ diets (34% and 40%, respectively).
Biological Indices and tissues analyses
Biological indices were all significantly impacted by dietary treatments (Table VII–6). With
respect to VSI, fish fed the SB and SB+ (10.62 and 10.78%, respectively) diets had significantly
higher VSI ratios than fish fed the MXSB diet (9.07%). Fish fed the remaining diets had
intermediate responses ranging from 9.33 (MXSB+) to 9.67% (control).
Hepatosomatic indices were also significantly affected by dietary treatments: MXSB and
MXSB+ ‐fed fish presented the lowest HSI levels (1.68 and 1.75%, respectively), compared to
that observed in fish fed the SB+ diet (2.55%). Fish fed the remaining diets had intermediate
responses ranging from 2.02 (control) to 2.30% (SB).
Finally, muscle ratio was significantly decreased in fish fed the SB and SB+ diets (30.06 and
31.63, respectively). Fish fed the remaining diets exhibited significantly higher MR values,
ranging from 36.87 (MXSB+) to 37.02% (control).
135
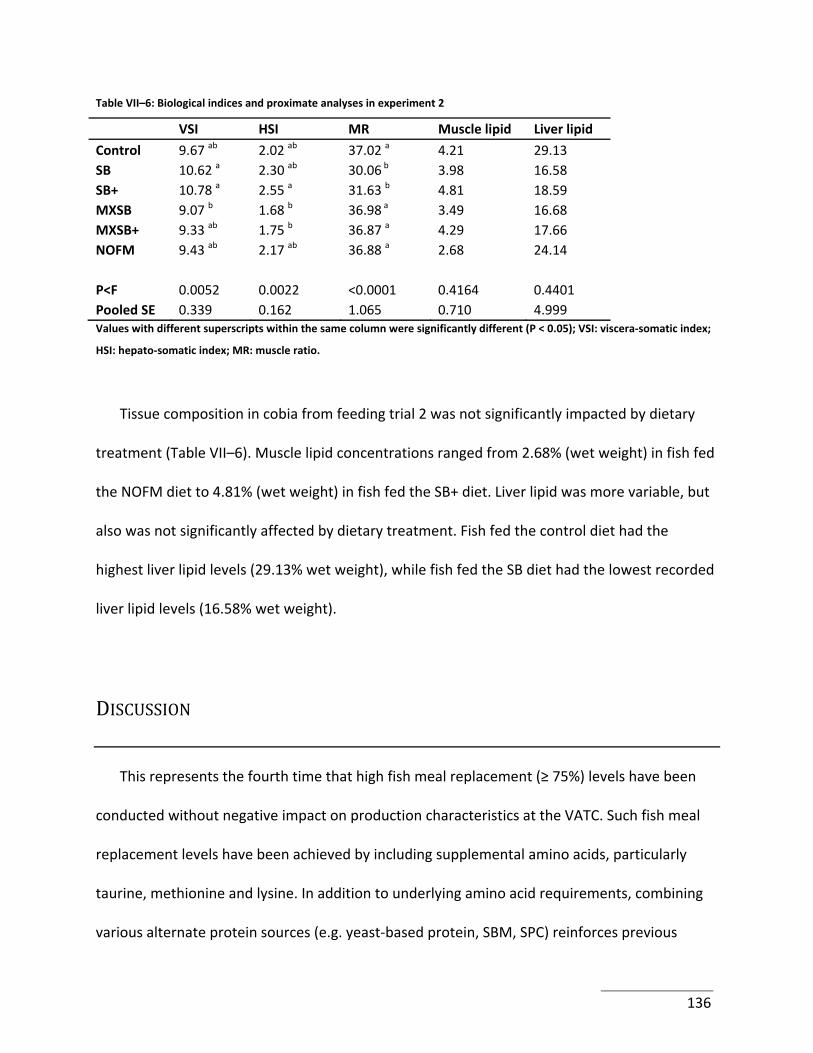
Table VII–6: Biological indices and proximate analyses in experiment 2
VSI HSI MR Muscle lipid Liver lipid
Control 9.67 ab 2.02 ab 37.02 a 4.21 29.13 SB 10.62 a 2.30 ab 30.06 b 3.98 16.58 SB+ 10.78 a 2.55 a 31.63 b 4.81 18.59 MXSB 9.07 b 1.68 b 36.98 a 3.49 16.68 MXSB+ 9.33 ab 1.75 b 36.87 a 4.29 17.66 NOFM 9.43 ab 2.17 ab 36.88 a 2.68 24.14 P<F 0.0052 0.0022 <0.0001 0.4164 0.4401 Pooled SE 0.339 0.162 1.065 0.710 4.999 Values with different superscripts within the same column were significantly different (P < 0.05); VSI: viscera‐somatic index;
HSI: hepato‐somatic index; MR: muscle ratio.
Tissue composition in cobia from feeding trial 2 was not significantly impacted by dietary
treatment (Table VII–6). Muscle lipid concentrations ranged from 2.68% (wet weight) in fish fed
the NOFM diet to 4.81% (wet weight) in fish fed the SB+ diet. Liver lipid was more variable, but
also was not significantly affected by dietary treatment. Fish fed the control diet had the
highest liver lipid levels (29.13% wet weight), while fish fed the SB diet had the lowest recorded
liver lipid levels (16.58% wet weight).
DISCUSSION
This represents the fourth time that high fish meal replacement (≥ 75%) levels have been
conducted without negative impact on production characteristics at the VATC. Such fish meal
replacement levels have been achieved by including supplemental amino acids, particularly
taurine, methionine and lysine. In addition to underlying amino acid requirements, combining
various alternate protein sources (e.g. yeast‐based protein, SBM, SPC) reinforces previous
136
hypotheses that a single alternate protein source cannot effectively replace fish meal (Craig and
McLean, 2005).
In the first feeding trial, juvenile cobia responded well to FMR levels of 50 and 75%, showing
equal weight gain and >91% survival. Fish fed an internal control diet consisting of 100% herring
meal as the protein source performed statistically well, but numerically lower than fish fed the
FMR 50 and 75% diets (167% increase from initial weight, data not presented). Conversely,
when 100% of the fish meal was replaced with a single ingredient (SPC), even with amino acid
supplementation, production performances declined significantly in all evaluated areas (e.g.
weight gain, SGR, survival, FE, Table VII–3).
The use of dietary MOS has been investigated in fish with ambiguous results: improvements
in growth and health status in rainbow trout (Yilmaz, et al., 2007) and European sea bass
(Torrecillas, et al., 2007) were observed, while no significant effects were discerned in trials
with Nile tilapia (Oreochromis niloticus; Craig and McLean, 2003), Gulf of Mexico sturgeon
(Acipenser oxyrinchus desotoi; Pryor, et al. 2003) and European sea bass (Sweetman and Davies,
2006). In the present experiment, juvenile cobia did not benefit from dietary MOS
supplementation in either feeding trial. However, when replacing 100% of the fish meal, a
beneficial trend was observed: fish fed the 100+ diet experienced a 24% increase in weight gain
and a 38% increase in survival on average, when compared to the non‐MOS supplemented
100% FMR diet. While these numbers were not significantly different, they may still be relevant
from a commercial production stand‐point when using high FMR levels. Based on these data, as
137
well as those observed by Salze et al. (2008) where beneficial effects were noted in larval cobia,
producers should be practical in their choices regarding dietary MOS supplementation.
In the second feeding trial, fish meal provided approximately 9% of the dietary protein in
the SB diets, while only 6% in the MXSB diets. Despite this reduction in fish meal, a doubling of
weight gain was achieved when the supplemental amino acid mix was included in the MXSB
diets. This, again, emphasizes the critical importance of supplementation of limiting amino
acids when high replacement levels (>75%) of dietary fish meal are employed. The amino acid
mix was developed at VTAC based upon novel findings with respect to taurine supplementation
in feeds for juvenile cobia (Lunger, et al., 2007b). During the course of many other unpublished
cobia studies, experimental diets were analyzed for amino acid composition which aided in the
refinement of the present amino acid supplement regime.
One of the most important and far‐reaching aspects of this experiment was the successful
total elimination of fish meal concomitantly with fish oil in cobia aquafeeds. In the second
feeding trial, this was achieved with a unique combination of alternate protein and lipid sources
as well as dietary additives (SelPlex® and MOS). The dietary protein components of the NOFM
were comprised of a Nereid sp. worm meal, SPC, and NuPro®, each supplying complementary
amino acid and nutrient profiles. Nereid worms are marine in origin (Dall, et al., 1991) and thus
their lipid component contains high levels of long chain highly unsaturated fatty acids (HUFA) of
the n‐3 family required by marine fishes. The SPC, containing 71% of crude protein, provided
the majority of the dietary protein. Finally, NuPro®, a yeast‐based protein source,
138
complemented the protein supply while also added valuable nutrients such as nucleotides, di‐
and tri‐peptides, and other potential nutrients from the yeast cytoplasm. Noteworthy are the
overall performances of fish fed this diet, given that it was not supplemented with the amino
acid mix. These findings highlight the importance of selecting alternate protein sources based
upon appropriate dietary amino acid profiles for the considered species.
In addition, NOFM was also devoid of any fish oil, but utilized two alternate lipid sources,
namely soy oil and a concentrated marine algal meal. Importantly, the latter contained the n‐3
HUFA, primarily docosahexaenoic acid (DHA). The combination of the algal meal and the marine
lipids from the worm meal satisfied the requirements of cobia for n‐3 HUFAs without using fish
oil.
These data are especially germane to the ongoing concerns regarding sustainable
production of marine carnivores – often species with higher market values. The complete
elimination of both fish meal and fish oil has now been successfully achieved in aquafeeds for
cobia juveniles. However, the ground‐breaking NOFM formulation relied on novel and
sometimes unique alternative feedstuffs, and therefore may hinder the economical feasibility
and sustainability of such diets. Hence, the consistent, successful replacement of up to 94% of
the fish meal protein achieved at VTAC is actually more promising to the future of the
aquaculture industry and the surrounding issues of true sustainability. Indeed, the use of
commodity traded plant protein sources as alternatives to fish meal is the only avenue to true
environmental and economical sustainability in the global aquaculture industry.
139

Acknowledgments
Funding for this research was provided by the: Illinois Soybean Association, Indiana
Soybean Alliance, Iowa Soybean Association, Nebraska Soybean Board, and the United Soybean
Board.
140
Cited references
AOAC, 1994. Official Methods of Analysis. Association of Official Analytical Chemists, Arlington, VA.
Barrows, F.T., Gaylord, T.G., Stone, D.A.J., Smith, C.E., 2007. Effect of protein source and nutrient density on growth efficiency, histology and plasma amino acid concentration of rainbow trout (Oncorhynchus mykiss Walbaum). Aquaculture Research 38, 1747‐1758.
Craig, S.R., McLean, E., 2003. Effect of dietary inclusion of Bio‐Mos upon performance characteristics of Nile tilapia, Alltech 19th Annual Symposium on Biotechnology and the Food Industry, Lexington, Kentucky, USA.
Craig, S.R., McLean, E., 2005. The organic aquaculture movement: a role for NuPro™ as an alternative protein source. In: Lyons, T.P., Jacques, K.A. (Eds.), Nutritional Biotechnology in the Feed and Food Industries ‐ Proceedings of Alltech’s 21st Annual Symposium. Alltech, Lexington, KY, pp. 285‐293.
Craig, S.R., Schwarz, M.H., McLean, E., 2006. Juvenile cobia (Rachycentron canadum) can utilize a wide range of protein and lipid levels without impacts on production characteristics. Aquaculture 261, 384‐391.
Dall, W., Smith, D.M., Moore, L.E., 1991. Biochemical composition of some prey species of Penaeus esculentus Haswell (Penaeidae: Decapoda). Aquaculture 96, 151‐166.
FAO, 2007. The State of World Fisheries and Aquaculture ‐ 2006 (SOFIA). Food and Agriculture Organization of the United Nations (FAO), Rome, Italy, pp. 180.
Gatlin, D.M., Barrows, F.T., Brown, P., Dabrowski, K., Gaylord, T.G., Hardy, R.W., Herman, E., Hu, G., Krogdahl, Å., Nelson, R., Overturf, K., Rust, M., Sealey, W., Skonberg, D., Souza, E.J., Stone, D., Wilson, R., Wurtele, E., 2007. Expanding the utilization of sustainable plant products in aquafeeds: a review, Aquaculture Research, pp. 551‐579.
Gaylord, T.G., Teague, A.M., Barrows, F.T., 2006. Taurine supplementation of all‐plant protein diets for rainbow trout (Oncorhynchus mykiss). Journal of the World Aquaculture Society 37, 509‐517.
Kim, S.‐K., Matsunari, H., Takeuchi, T., Yokoyama, M., Murata, Y., Ishihara, K., 2007. Effect of different dietary taurine levels on the conjugated bile acid composition and growth performance of juvenile and fingerling Japanese flounder Paralichthys olivaceus. Aquaculture 273, 595‐601.
Kim, S.‐K., Takeuchi, T., Akimoto, A., Furuita, H., Yamamoto, T., Yokoyama, M., Murata, Y., 2005. Effect of taurine supplemented practical diet on growth performance and taurine contents in whole body and tissues of juvenile Japanese flounder Paralichthys olivaceus. Fisheries Science 71, 627‐632.
Lunger, A.N., Craig, S.R., McLean, E., 2006. Replacement of fish meal in cobia (Rachycentron canadum) diets using an organically certified protein. Aquaculture 257, 393‐399.
141
Lunger, A.N., McLean, E., Craig, S.R., 2007a. The effects of organic protein supplementation upon growth, feed conversion and texture quality parameters of juvenile cobia (Rachycentron canadum). Aquaculture 264, 342‐352.
Lunger, A.N., McLean, E., Gaylord, T.G., Kuhn, D., Craig, S.R., 2007b. Taurine supplementation to alternative dietary proteins used in fish meal replacement enhances growth of juvenile cobia (Rachycentron canadum). Aquaculture 271, 401‐410.
Pryor, G.S., Royes, J.B., Chapman, F.A., Miles, R.D., 2003. Mannanoligosaccharides in fish nutrition: Effects of dietary supplementation on growth and gastrointestinal villi structure in gulf of Mexico sturgeon. North American Journal of Aquaculture 65, 106‐111.
Salze, G., McLean, E., Schwarz, M.H., Craig, S.R., 2008. Dietary mannan oligosaccharide enhances salinity tolerance and gut development of larval cobia. Aquaculture 274, 148‐152.
Sweetman, J.W., Davies, S., 2006. Improving growth performance and health status of aquaculture stocks in Europe through the use of Bio‐Mos®. In: Lyons, T.P., Jacques, K.A. (Eds.), Nutritional Biotechnology in the Feed and Food Industries, Proceedings of Alltech’s 22nd Annual Symposium. Nottingham University Press, Nottingham, UK, Lexington, KY, pp. 445‐452.
Torrecillas, S., Makol, A., Caballero, M.J., Montero, D., Robaina, L., Real, F., Sweetman, J., Tort, L., Izquierdo, M.S., 2007. Immune stimulation and improved infection resistance in European sea bass (Dicentrarchus labrax) fed mannan oligosaccharides. Fish & Shellfish Immunology 23, 969‐981.
Yilmaz, E., Genc, M.A., Genc, E., 2007. Effects of dietary mannan oligosaccharides on growth, body composition, and intestine and liver histology of rainbow trout, Oncorhynchus mykiss. Israeli Journal of Aquaculture‐Bamidgeh 59, 182‐188.
142
Chapter VII I . EXPRESS ION OF IMMUNE RELEVANT GENES I N A
CYPR IN ID FOLLOWING FEED ING WITH
A MANNAN OL IGOSACCHAR IDE
Abstract
Among the various available dietary immunostimulants, yeast‐derived mannan oligosaccharides (MOS) are commonly used in fish and animal feeds. Considering the inconsistencies reported on the effects of dietary MOS, I explored its impacts on the zebrafish transcriptome. Fish were fed a MOS‐free control diet or a MOS‐enriched diet for 9 weeks prior to extracting mRNA from the whole fish and comparing the expression profiles using a microarray technologies. Several immune‐related genes were affected by dietary MOS, including Kruppel‐like factor2, Complement 3 Component, Major Histocompatibility Complex (MHC) class I uea, MHC I uad and MCH I ufa. In addition, some genes were involved in cell‐cycling (e.g. SKP2), and cytokinesis and vesicle trafficking (e.g. COPB2, DDX41). Noticeably, no up‐ or down‐regulation of mucin genes was observed, which may be to the result of the up‐regulation of the mucus regulator IL‐13 receptor α2. This lack of altered mucin expression may be due to dose, timing, species and previous physiological state. This study highlighted a mechanism of action for dietary MOS, explaining previous observations, while also suggesting possible reasons for the previously reported inconsistencies. More research is required to explain the conditional benefits of dietary MOS.
Keywords: Danio rerio, microarray, nutrigenomics, immunostimulant, probiotic,
transcriptome.
143
INTRODUCTION
The vertebrate gastrointestinal (GI) tract is a complex ecosystem that hosts a vast number
of microbes along its length. In humans, at least 500‐1000 different Bacteria, Eukarya and
Archaea species inhabit the gut (Xu and Gordon, 2003). Moreover, microbial abundance and
diversity varies along the intestine’s length (Magalhaes, et al., 2007) in many vertebrate
species, including teleosts. In fishes, changes in microbial loading and species composition
follow shifts in culture conditions, with pathogen challenge, and after dietary modification
(Moffitt and Mobin, 2006; Ringø, et al., 1995). These GI mutualists have significant effects on a
range of host functions, including development of gut‐associated lymphoid tissue and hence
immunocompetence; epithelial cell proliferation and thus gut barrier management;
angiogenesis and development of the enteric nervous system thereby impacting peristaltic
mechanisms; as well as playing a role in nutrient processing (Hooper and Gordon, 2001). The
manner in which mutualistic bacteria influence host gut functions is diverse and includes
modulation of the expression of host genes (Hooper, et al., 2001). Therefore, perturbating the
normal gut flora may impact host gene expression.
A number of studies indicate that dietary pre‐, pro‐ and synbiotics (see: Schrezenmeir
and de Vrese, 2001 for definitions) each exert beneficial effects on various immunological
functions in aquacultured animals (Chen and Ainsworth, 1992; Gildberg and Mikkelsen, 1998;
Villamil, et al., 2003). Similar claims have been made also for mannan oligosaccharides (MOS).
Oligosaccharides occur naturally in many feed ingredients. A number of oligosaccharides are
144
produced commercially either by disaccharide isomerization through enzymatic hydrolysis, or
by extraction from microbial cell walls (Perry, 1995). However, MOS derived from yeast cell
walls, are utilized most commonly in animal feedstuffs (Monsan and Paul, 1995). In fishes,
dietary MOS supplementation reportedly confers enhanced resistance to mycobacteriosis and
vibriosis challenges in hybrid striped bass (Morone saxatilis x M. saxatilis; Li and Gatlin, 2005).
In European sea bass (Dicentrarchus labrax), MOS reportedly increases the phagocytic index
(Torrecillas, et al., 2007) whereas Staykov et al. (2005; 2007) observed augmented serum
lysozyme and complement activity in common carp (Cyprinus carpio) and rainbow trout
(Oncorhynchus mykiss) fed diets that included MOS at 0.2%. A few studies also have
commented on improved gut structure of fish fed MOS‐containing diets (Salze, et al., 2008;
Sweetman and Davies, 2006; Yilmaz, et al., 2007).
Irrespective of reported benefits of MOS supplementation, several studies conducted on
a diverse species range reported a lack of such an effect. These include trials with Nile tilapia
(Oreochromis niloticus; Craig and McLean, 2003), Gulf of Mexico sturgeon (Acipenser oxyrinchus
desotoi; Pryor, et al. 2003) and European sea bass (Sweetman and Davies, 2006). In channel
catfish (Ictalurus punctatus) fed rations containing various, commercially‐available MOS
preparations, no differences were seen in plasma lysozyme, bactericidal, or spontaneous
hemolytic complement activities. Moreover, MOS did not impact respiratory burst activities of
phagocytes or survival of catfish when immersion‐challenged with Edwardsiella ictaluri (Welker,
et al., 2007). Other studies also have provided inconclusive results with MOS. These
inconsistencies may reflect inappropriate dosage or indicate species‐specific differences in
145
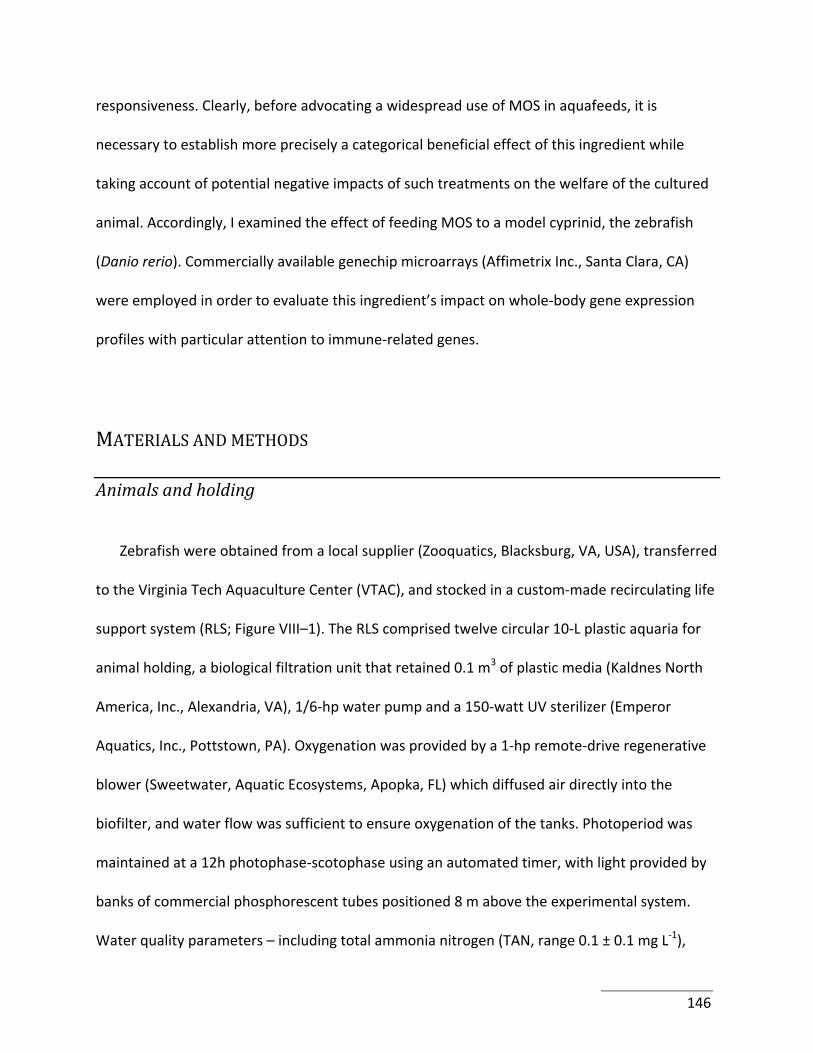
responsiveness. Clearly, before advocating a widespread use of MOS in aquafeeds, it is
necessary to establish more precisely a categorical beneficial effect of this ingredient while
taking account of potential negative impacts of such treatments on the welfare of the cultured
animal. Accordingly, I examined the effect of feeding MOS to a model cyprinid, the zebrafish
(Danio rerio). Commercially available genechip microarrays (Affimetrix Inc., Santa Clara, CA)
were employed in order to evaluate this ingredient’s impact on whole‐body gene expression
profiles with particular attention to immune‐related genes.
MATERIALS AND METHODS
Animals and holding
Zebrafish were obtained from a local supplier (Zooquatics, Blacksburg, VA, USA), transferred
to the Virginia Tech Aquaculture Center (VTAC), and stocked in a custom‐made recirculating life
support system (RLS; Figure VIII–1). The RLS comprised twelve circular 10‐L plastic aquaria for
animal holding, a biological filtration unit that retained 0.1 m3 of plastic media (Kaldnes North
America, Inc., Alexandria, VA), 1/6‐hp water pump and a 150‐watt UV sterilizer (Emperor
Aquatics, Inc., Pottstown, PA). Oxygenation was provided by a 1‐hp remote‐drive regenerative
blower (Sweetwater, Aquatic Ecosystems, Apopka, FL) which diffused air directly into the
biofilter, and water flow was sufficient to ensure oxygenation of the tanks. Photoperiod was
maintained at a 12h photophase‐scotophase using an automated timer, with light provided by
banks of commercial phosphorescent tubes positioned 8 m above the experimental system.
Water quality parameters – including total ammonia nitrogen (TAN, range 0.1 ± 0.1 mg L‐1),
146
nitrite (0.03 ± 0.02 mg L‐1) and nitrate (44.6 ± 12.4 mg L‐1), pH (7.6 ± 0.3), dissolved oxygen (7.8
± 0.3 mg L‐1) and temperature (23.5 ± 0.6oC) were monitored daily using a pH meter (Hanna
Instruments, Woonsocket, RI), spectrophotometric analyses (DR2010; Hach Company,
Loveland, CO) and a combined temperature‐oxygen meter (YSI Inc., Yellow Springs, OH).
Figure VIII–1: Diagram of the zebrafish recirculating life support system
Aerated biofilter
UV
Return line
Pump
Primary feed
Each tank was of 10 L volume. Water was returned to the biofilter‐sump via gravity feed. The biological filtration unit
comprised a 280 L sump containing 140 L of water and 0.1 m3 of KMT media, vigorously aerated via air stones. Water from
the biofilter‐sump was pumped back to tanks using a 1/6 hp pump (A.O. Smith, Tipp City, Ohio) via a 150‐watt UV sterilizer.
Diet formulation and husbandry
Ten zebrafish (initial weight 0.3 ± 0.04 g) were randomly stocked into 6 tanks and each tank
then arbitrarily assigned one of two diets. Experimental diets (Table VIII–1) were formulated on
a dry‐weight basis and prepared at the VTAC. The control diet (CD) was devoid of MOS,
whereas the experimental diet (MD) contained 0.5% MOS at the expense of cellulose. Lipids
were provided in both diets by menhaden oil, and were formulated to be isonitrogenous (40%
147
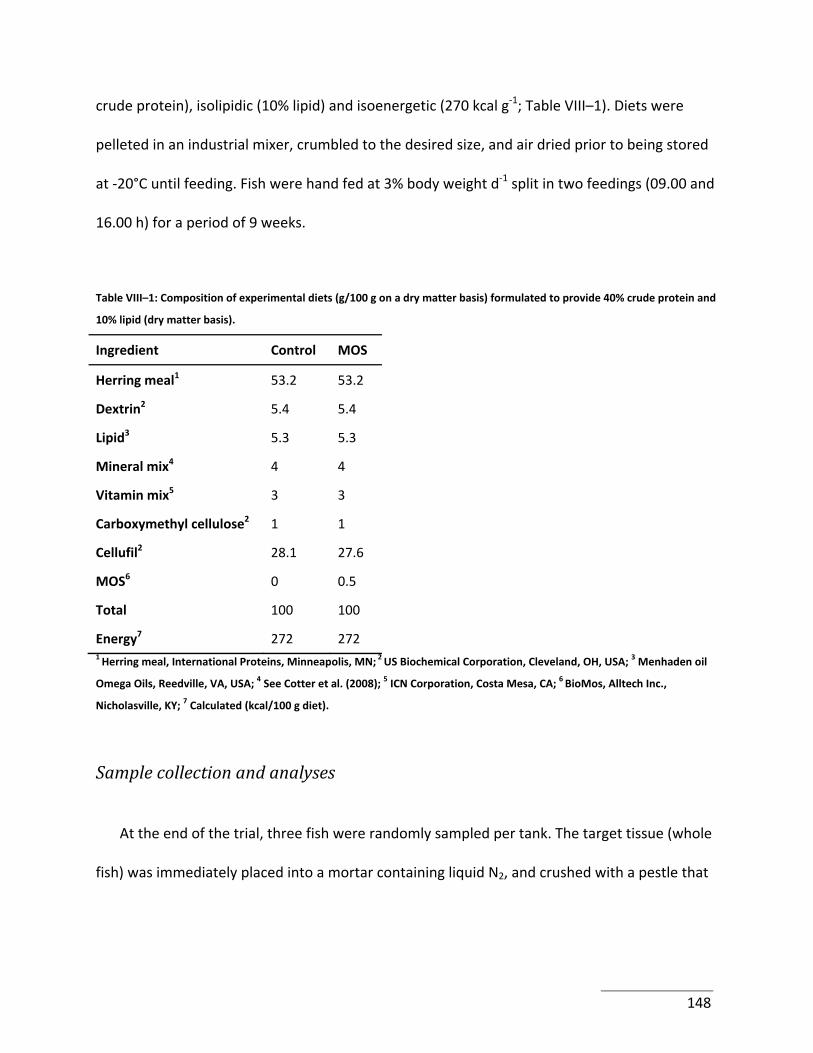
crude protein), isolipidic (10% lipid) and isoenergetic (270 kcal g‐1; Table VIII–1). Diets were
pelleted in an industrial mixer, crumbled to the desired size, and air dried prior to being stored
at ‐20°C until feeding. Fish were hand fed at 3% body weight d‐1 split in two feedings (09.00 and
16.00 h) for a period of 9 weeks.
Table VIII–1: Composition of experimental diets (g/100 g on a dry matter basis) formulated to provide 40% crude protein and
10% lipid (dry matter basis).
Ingredient Control MOS
Herring meal1 53.2 53.2
Dextrin2 5.4 5.4
Lipid3 5.3 5.3
Mineral mix4 4 4
Vitamin mix5 3 3
Carboxymethyl cellulose2 1 1
Cellufil2 28.1 27.6
MOS6 0 0.5
Total 100 100
Energy7 272 272 1 Herring meal, International Proteins, Minneapolis, MN; 2 US Biochemical Corporation, Cleveland, OH, USA; 3 Menhaden oil
Omega Oils, Reedville, VA, USA; 4 See Cotter et al. (2008); 5 ICN Corporation, Costa Mesa, CA; 6 BioMos, Alltech Inc.,
Nicholasville, KY; 7 Calculated (kcal/100 g diet).
Sample collection and analyses
At the end of the trial, three fish were randomly sampled per tank. The target tissue (whole
fish) was immediately placed into a mortar containing liquid N2, and crushed with a pestle that
148
was pre‐cooled in liquid N2. The samples then were pooled and utilized for total RNA isolation
and microarray assays (i.e., three fish per chip, three chips per treatments).
RNA isolation and microarray preparation
Total RNA samples were isolated from the whole fish using the RNeasy RNA isolation kit
(Qiagen, Valencia, CA). Each sample was precipitated with ethanol to concentrate the total
RNA, and the resultant pellet was brought up to volume in RNase‐free distilled water. RNA
quality, quantity and DNA contamination were determined with an Agilent Bioanalyzer 2100
(Agilent Technologies, Palo Alto, CA). The quality‐checked total RNA was used for synthesizing
biotin‐labeled cRNA. Briefly, 10 μg of total RNA was used to generate first‐strand cDNA with a
T7‐linked oligo(dT) primer. After second‐strand cDNA synthesis, in vitro transcription was
performed with biotinylated UTP and CTP (Enzo Diagnostics, Farmingdale, NY), resulting in
approximately 100‐fold amplification of the cRNA population. The cRNA was fragmented (15 μg
per sample), spiked with internal controls (Affymetrix Inc., Santa Clara, CA) and hybridized
overnight to the Affymetrix D. rerio (DsRed) zebrafish gene chips (n = 6 chips total). The
genechips were washed and stained with streptavidin‐phycoerythrin, before being scanned on
the GeneChip scanner (Affymetrix, Inc.).
149
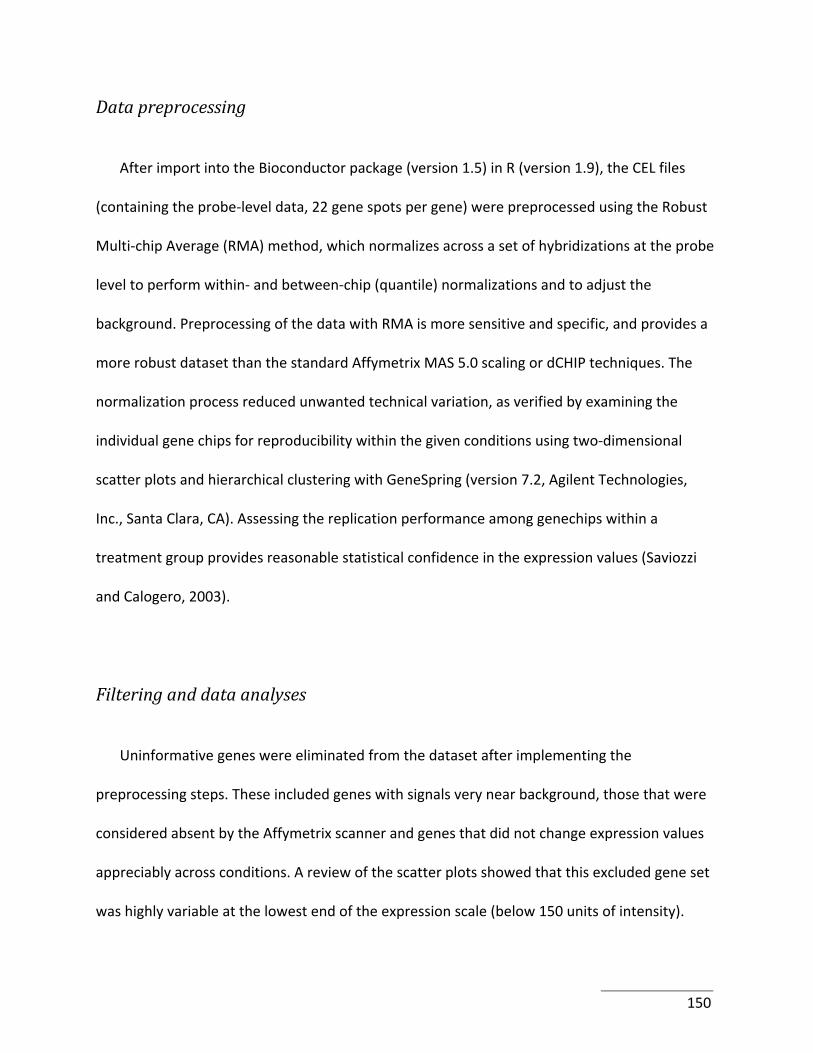
Data preprocessing
After import into the Bioconductor package (version 1.5) in R (version 1.9), the CEL files
(containing the probe‐level data, 22 gene spots per gene) were preprocessed using the Robust
Multi‐chip Average (RMA) method, which normalizes across a set of hybridizations at the probe
level to perform within‐ and between‐chip (quantile) normalizations and to adjust the
background. Preprocessing of the data with RMA is more sensitive and specific, and provides a
more robust dataset than the standard Affymetrix MAS 5.0 scaling or dCHIP techniques. The
normalization process reduced unwanted technical variation, as verified by examining the
individual gene chips for reproducibility within the given conditions using two‐dimensional
scatter plots and hierarchical clustering with GeneSpring (version 7.2, Agilent Technologies,
Inc., Santa Clara, CA). Assessing the replication performance among genechips within a
treatment group provides reasonable statistical confidence in the expression values (Saviozzi
and Calogero, 2003).
Filtering and data analyses
Uninformative genes were eliminated from the dataset after implementing the
preprocessing steps. These included genes with signals very near background, those that were
considered absent by the Affymetrix scanner and genes that did not change expression values
appreciably across conditions. A review of the scatter plots showed that this excluded gene set
was highly variable at the lowest end of the expression scale (below 150 units of intensity).
150
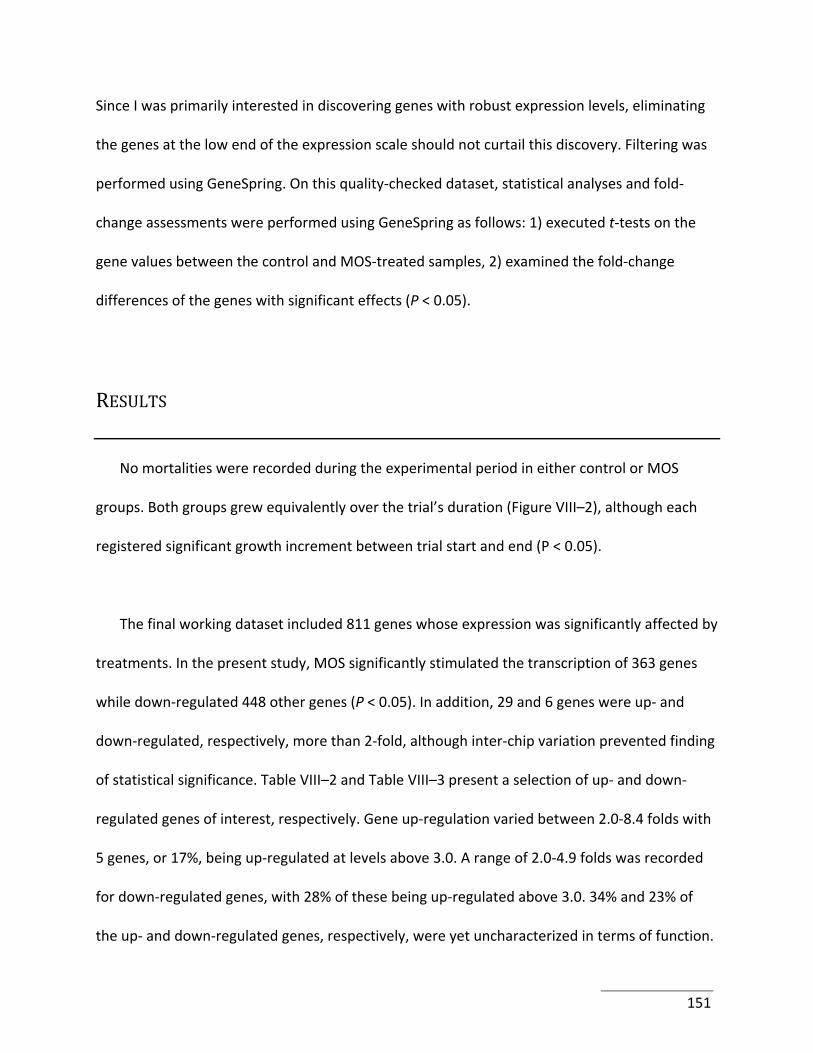
Since I was primarily interested in discovering genes with robust expression levels, eliminating
the genes at the low end of the expression scale should not curtail this discovery. Filtering was
performed using GeneSpring. On this quality‐checked dataset, statistical analyses and fold‐
change assessments were performed using GeneSpring as follows: 1) executed t‐tests on the
gene values between the control and MOS‐treated samples, 2) examined the fold‐change
differences of the genes with significant effects (P < 0.05).
RESULTS
No mortalities were recorded during the experimental period in either control or MOS
groups. Both groups grew equivalently over the trial’s duration (Figure VIII–2), although each
registered significant growth increment between trial start and end (P < 0.05).
The final working dataset included 811 genes whose expression was significantly affected by
treatments. In the present study, MOS significantly stimulated the transcription of 363 genes
while down‐regulated 448 other genes (P < 0.05). In addition, 29 and 6 genes were up‐ and
down‐regulated, respectively, more than 2‐fold, although inter‐chip variation prevented finding
of statistical significance. Table VIII–2 and Table VIII–3 present a selection of up‐ and down‐
regulated genes of interest, respectively. Gene up‐regulation varied between 2.0‐8.4 folds with
5 genes, or 17%, being up‐regulated at levels above 3.0. A range of 2.0‐4.9 folds was recorded
for down‐regulated genes, with 28% of these being up‐regulated above 3.0. 34% and 23% of
the up‐ and down‐regulated genes, respectively, were yet uncharacterized in terms of function.
151
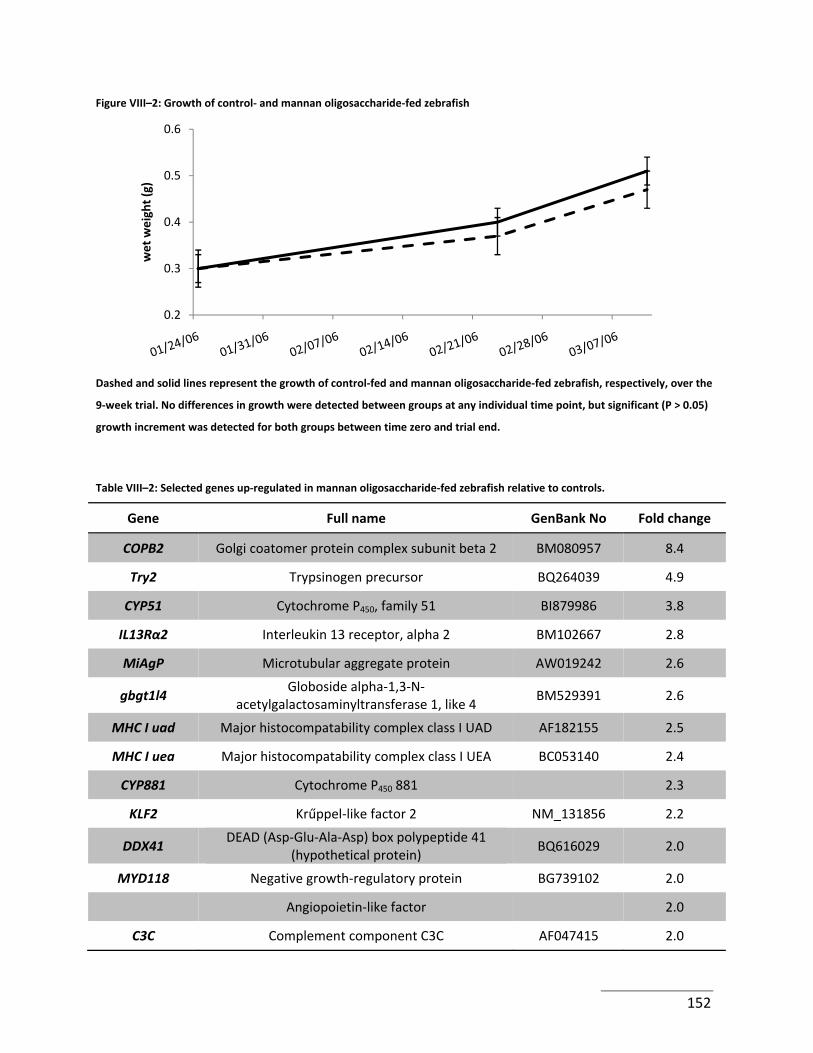
Figure VIII–2: Growth of control‐ and mannan oligosaccharide‐fed zebrafish
Dashed and solid lines represent the growth of control‐fed and mannan oligosaccharide‐fed zebrafish, respectively, over the
9‐week trial. No differences in growth were detected between groups at any individual time point, but significant (P > 0.05)
growth increment was detected for both groups between time zero and trial end.
0.2
0.3
0.4
0.5
0.6wet weight (g)
Table VIII–2: Selected genes up‐regulated in mannan oligosaccharide‐fed zebrafish relative to controls.
Gene Full name GenBank No Fold change
COPB2 Golgi coatomer protein complex subunit beta 2 BM080957 8.4
Try2 Trypsinogen precursor BQ264039 4.9
CYP51 Cytochrome P450, family 51 BI879986 3.8
IL13Rα2 Interleukin 13 receptor, alpha 2 BM102667 2.8
MiAgP Microtubular aggregate protein AW019242 2.6
gbgt1l4 Globoside alpha‐1,3‐N‐
acetylgalactosaminyltransferase 1, like 4 BM529391 2.6
MHC I uad Major histocompatability complex class I UAD AF182155 2.5
MHC I uea Major histocompatability complex class I UEA BC053140 2.4
CYP881 Cytochrome P450 881 2.3
KLF2 Krűppel‐like factor 2 NM_131856 2.2
DDX41 DEAD (Asp‐Glu‐Ala‐Asp) box polypeptide 41
(hypothetical protein) BQ616029 2.0
MYD118 Negative growth‐regulatory protein BG739102 2.0
Angiopoietin‐like factor 2.0
C3C Complement component C3C AF047415 2.0
152
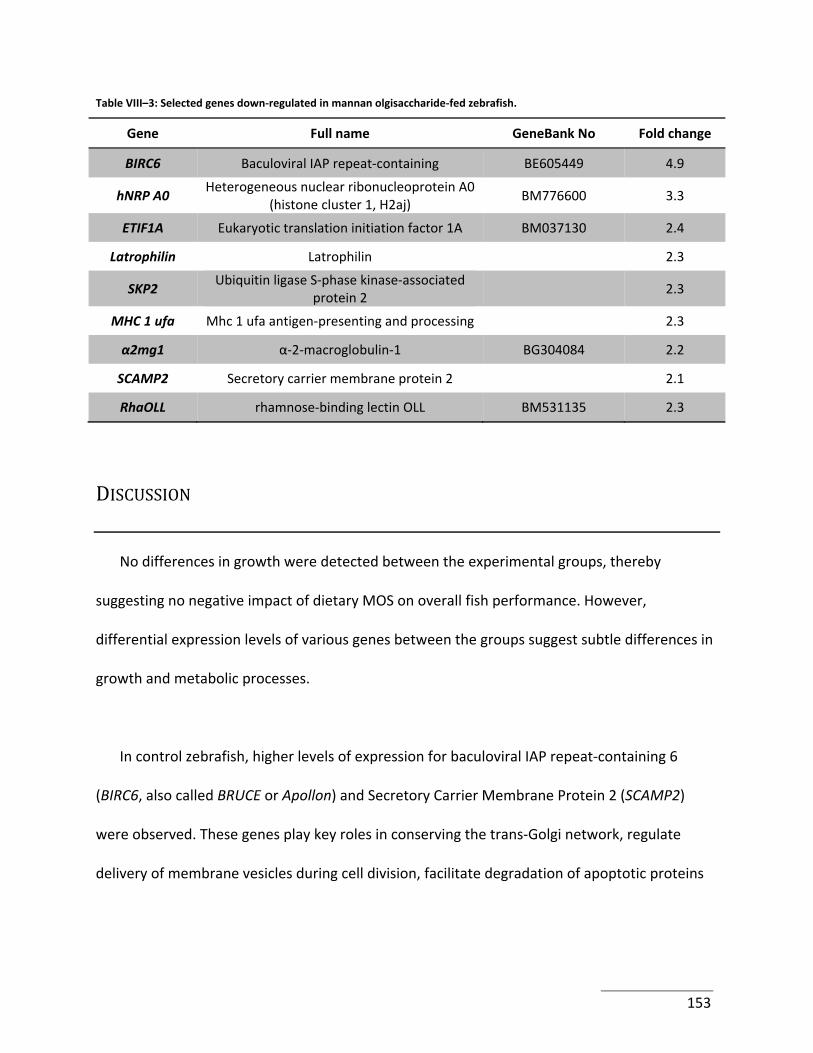
Table VIII–3: Selected genes down‐regulated in mannan olgisaccharide‐fed zebrafish.
Gene Full name GeneBank No Fold change
BIRC6 Baculoviral IAP repeat‐containing BE605449 4.9
hNRP A0 Heterogeneous nuclear ribonucleoprotein A0
(histone cluster 1, H2aj) BM776600 3.3
ETIF1A Eukaryotic translation initiation factor 1A BM037130 2.4
Latrophilin Latrophilin 2.3
SKP2 Ubiquitin ligase S‐phase kinase‐associated
protein 2 2.3
MHC 1 ufa Mhc 1 ufa antigen‐presenting and processing 2.3
α2mg1 α‐2‐macroglobulin‐1 BG304084 2.2
SCAMP2 Secretory carrier membrane protein 2 2.1
RhaOLL rhamnose‐binding lectin OLL BM531135 2.3
DISCUSSION
No differences in growth were detected between the experimental groups, thereby
suggesting no negative impact of dietary MOS on overall fish performance. However,
differential expression levels of various genes between the groups suggest subtle differences in
growth and metabolic processes.
In control zebrafish, higher levels of expression for baculoviral IAP repeat‐containing 6
(BIRC6, also called BRUCE or Apollon) and Secretory Carrier Membrane Protein 2 (SCAMP2)
were observed. These genes play key roles in conserving the trans‐Golgi network, regulate
delivery of membrane vesicles during cell division, facilitate degradation of apoptotic proteins
153
through ubiquitination and are engaged in cytokinesis, cell growth and cellular transformation
(Hao, et al., 2004; Hauser, et al., 1998; Liao, et al., 2007; Pohl and Jentsch, 2008).
Various studies with fish illustrate that diet and nutritional condition can have profound
impacts on gene expression profiles for specific tissues (McLean and Craig, 2006; Panserat, et
al., 2008; Rise, et al., 2006; Salem, et al., 2007). In general, microarray studies have assisted to
explain the biological basis for the measured biological responses of animals to various
manipulations. For example, starvation of rainbow trout down‐regulates many hundreds of
genes involved in protein synthesis, lipid metabolism and transport, glucose metabolism and
immune function (Salem, et al., 2007) – reactions that could have been predicted based on
known whole‐animal responses (Loughna and Goldspink, 1984; Morata, et al., 1982; Sumpter,
et al., 1991). Likewise, the feeding of probiotics to trout resulted in up‐regulation of genes
engaged in immunity (Panigrahi, et al., 2007), thereby confirming previously measured whole‐
animal biological responses (Gomez and Balcazar, 2008). Based on recorded reactions of
various fishes to dietary MOS, similar findings might have been anticipated for the present
study. However, little information exists regarding the precise action mechanisms of dietary
MOS, and observations made here provide a distinctive process that has hitherto not been
considered.
Surprisingly, mucin genes, such as MUC5B or MUC2, were not up‐regulated significantly in
the MOS‐fed fish. This may be due to a dilution of the transcripts, since mRNA was extracted
from the whole fish, and mucin genes may not be up‐regulated in all mucosal tissues. However,
154
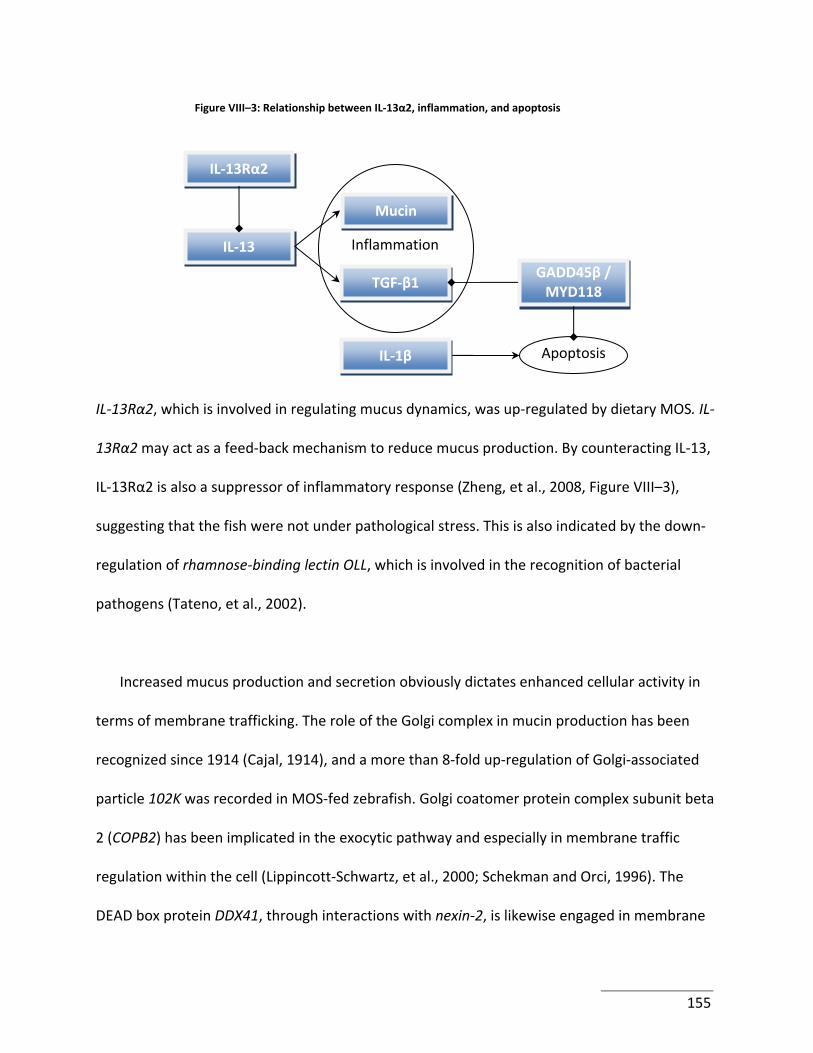
Figure VIII–3: Relationship between IL‐13α2, inflammation, and apoptosis
IL‐13Rα2
Inflammation IL‐13
Mucin
TGF‐β1
IL‐1β
GADD45β / MYD118
Apoptosis
IL‐13Rα2, which is involved in regulating mucus dynamics, was up‐regulated by dietary MOS. IL‐
13Rα2 may act as a feed‐back mechanism to reduce mucus production. By counteracting IL‐13,
IL‐13Rα2 is also a suppressor of inflammatory response (Zheng, et al., 2008, Figure VIII–3),
suggesting that the fish were not under pathological stress. This is also indicated by the down‐
regulation of rhamnose‐binding lectin OLL, which is involved in the recognition of bacterial
pathogens (Tateno, et al., 2002).
Increased mucus production and secretion obviously dictates enhanced cellular activity in
terms of membrane trafficking. The role of the Golgi complex in mucin production has been
recognized since 1914 (Cajal, 1914), and a more than 8‐fold up‐regulation of Golgi‐associated
particle 102K was recorded in MOS‐fed zebrafish. Golgi coatomer protein complex subunit beta
2 (COPB2) has been implicated in the exocytic pathway and especially in membrane traffic
regulation within the cell (Lippincott‐Schwartz, et al., 2000; Schekman and Orci, 1996). The
DEAD box protein DDX41, through interactions with nexin‐2, is likewise engaged in membrane
155
trafficking (Abdul‐Ghani, et al., 2005) and transcription levels for this gene were 2‐fold higher in
MOS‐fed zebrafish. These transcriptomic outcomes of dietary MOS provide strong evidence for
the hypersecretion of mucus and gut barrier enhancement, and may represent one mechanism
explaining the increased resistance of some MOS‐fed fish species to artificial bacterial
challenges. Nevertheless, further augmentation of other host defense mechanisms would likely
be necessary to explain all the reported benefits of dietary MOS. This might be explained by the
2.3 to 2.6‐fold up‐regulation of zebrafish major histocompatibility complex class I UAD/UEA
genes (mhc 1 uda/uea). For an immune response to be triggered, MHC molecules must process
and present antigens to T‐cells and Kruppel‐like factor 2a (KLF2), a zinc finger transcription
factor, plays a critical role in T‐cell cycling (Carlson, et al., 2006). When over‐expressed, and for
fish in receipt of MOS, a 2.2‐fold up‐regulation was recorded; KLF2 inhibits cell‐cycle
progression and ensures against premature activation and death of mature T cells (Buckley, et
al., 2001; Kuo, et al., 1997; Sebzda, et al., 2008). KLF2, which activates T‐cells by its induction of
IL‐2 (Wu and Lingrel, 2005), may serve to bolster T‐cell populations.
Several studies indicate enhanced development and maturation of the intestine in various
species following dietary MOS supplementation. For example, addition of 2% MOS to turkey
diets increased ileal villus height, surface area, crypt depth and goblet cell density (de los
Santos, et al., 2007) and height of ileal villi increased in rabbits fed MOS at 0.1‐0.2% (Mourao, et
al., 2006). Fishes do not possess villi. Rather, the surface area of the intestine is increased
through complex folding and or by appendages such as caeca (Harder, 1975). Nevertheless, the
microscopic integrity of the gut of Senegal sole (Solea senegalensis), rainbow trout and larval
156
white sea bream (Diplodus sargus) and cobia (Rachycentron canadum) was apparently
improved due to MOS supplementation (Sweetman and Davies, 2006; Yilmaz, et al., 2007;
Salze, et al., 2008, respectively). In larval cobia, a beneficial effect of MOS was also recorded
with regard to salinity stress resistance, possibly related to the accelerated maturation of the
gut (Salze, et al., 2008).
Given the histological findings of MOS impact on gut growth, and hence the presumptive
enhancement in intestinal barrier function, it might be anticipated that supplemental MOS also
impacts genes involved in cellular cycling. This effect was seen in the ubiquitin ligase S‐phase
kinase‐associated protein 2 (F‐box protein SKP2), a major cell cycle regulation protagonist
(Nakayama and Nakayama, 2006). In control zebrafish, the expression level for the SKP2 gene
was over twice that recorded for MOS‐fed fish. SKP2 specifically targets cyclin‐dependent
kinase inhibitor p27 for degradation (Tsvetkov, et al., 1999), thus promoting cell cycle
progression (Nakayama and Nakayama, 2005). The lower expression levels for SKP2 and a
concomitant decrease in p27 may have decreased apoptosis in MOS‐fed fish, which could
thereby provide a partial explanation for the changes observed in gut architecture in MOS‐fed
animals (Nakayama and Nakayama, 2005). One MOS mechanism may be its ability to augment
intestinal populations of beneficial mutualists while preventing pathogens establishment.
Boosting the symbiotic and commensal gut flora also might drive changes in the gut
architecture. However, hybrid tilapia (O. niloticus x O. aureus; Genc, et al., 2007) and rainbow
trout (Yilmaz, et al., 2007) fed MOS at levels above 1.5% of diet did not display changes in gut
structure. These contradictory responses are difficult to explain, but may be related to dose,
157
species, age and/or previous nutritional status. While MOS is already used in aquaculture,
further research is needed to determine whether changes in mucin composition occur, and
whether increased mucus production is associated with enhanced presence of antimicrobial
compounds. Another factor that will require further research relates to establishing optimal
dietary doses of MOS and cost‐benefit analysis. Due to its apparent beneficial protective actions
in terms of conferring resistance to pathogens, MOS might act to decrease industry reliance on
antibiotics. It is possible that dietary MOS supplementation might only be necessary during high
disease risk periods.
158
Cited references
Abdul‐Ghani, M., Hartman, K.L., Ngsee, J.K., 2005. Abstrakt interacts with and regulates the expression of sorting Nexin‐2. Journal of Cellular Physiology 204, 210‐218.
Buckley, A.F., Kuo, C.T., Leiden, J.M., 2001. Transcription factor LKLF is sufficient to program T cell quiescence via a c‐Myc‐dependent pathway. Nature Immunology 2, 698‐704.
Cajal, S.R., 1914. Algunas variaciones fisiologicas y patologicas del aparato reticular de Golgi. Trabajos del Laboratorio Cajal de lnvestigaciones BioIogicas (Madrid). 12, 127.
Carlson, C.M., Endrizzi, B.T., Wu, J.H., Ding, X.J., Weinreich, M.A., Walsh, E.R., Wani, M.A., Lingrel, J.B., Hogquist, K.A., Jameson, S.C., 2006. Kruppel‐like factor 2 regulates thymocyte and T‐cell migration. Nature 442, 299‐302.
Chen, D., Ainsworth, A.J., 1992. Glucan administration potentiates immune defense mechanisms of channel catfish (Ictalurus punctatus Rafinesque). Journal of Fish Diseases 15, 295‐304.
Craig, S.R., McLean, E., 2003. Effect of dietary inclusion of Bio‐Mos upon performance characteristics of Nile tilapia, Alltech 19th Annual Symposium on Biotechnology and the Food Industry, Lexington, Kentucky, USA.
de los Santos, F.S., Donoghue, A.M., Farnell, M.B., Huff, G.R., Huff, W.E., Donoghue, D.J., 2007. Gastrointestinal maturation is accelerated in turkey poults supplemented with a mannan‐oligosaccharide yeast extract (Alphamune). Poultry Science 86, 921‐930.
Genc, M.A., Yilmaz, E., Genc, E., Aktas, M., 2007. Effects of dietary mannan oligosaccharides (MOS) on growth, body composition, and intestine and liver histology of the hybrid Tilapia (Oreochromis niloticus x O‐aureus). Israeli Journal of Aquaculture‐Bamidgeh 59, 10‐16.
Gildberg, A., Mikkelsen, H., 1998. Effects of supplementing the feed to Atlantic cod (Gadus morhua) fry with lactic acid bacteria and immuno‐stimulating peptides during a challenge trial with Vibrio anguillarum. Aquaculture 167, 103‐113.
Gomez, G.D., Balcazar, J.L., 2008. A review on the interactions between gut microbiota and innate immunity of fish. Fems Immunology and Medical Microbiology 52, 145‐154.
Hao, Y.Y., Sekine, K., Kawabata, A., Nakamura, H., Ishioka, T., Ohata, H., Katayama, R., Hashimoto, C., Zhang, X.D., Noda, T., Tsuruo, T., Naito, M., 2004. Apollon ubiquitinates SMAC and caspase‐9, and has an essential cytoprotection function. Nature Cell Biology 6, 849‐860.
Harder, W., 1975. Anatomy of fishes. Schweizerbart'sche Verlagsbuchhandlung, Stuttgart, Germany.
Hauser, H.P., Bardroff, M., Pyrowolakis, G., Jentsch, S., 1998. A giant ubiquitin‐conjugating enzyme related to IAP apoptosis inhibitors. Journal of Cell Biology 141, 1415‐1422.
159
Hooper, L.V., Gordon, J.I., 2001. Commensal host‐bacterial relationships in the gut. Science 292, 1115‐1118.
Hooper, L.V., Wong, M.H., Thelin, A., Hansson, L., Falk, P.C., Gordon, J.I., 2001. Molecular analysis of commensal host‐microbial relationships in the intestine. Science 291, 881‐884.
Kuo, C.T., Veselits, M.L., Leiden, J.M., 1997. LKLF: A transcriptional regulator of single‐positive T cell quiescence and survival. Science 277, 1986‐1990.
Li, P., Gatlin, D.M., 2005. Evaluation of the prebiotic GroBiotic(R)‐A and brewers yeast as dietary supplements for sub‐adult hybrid striped bass (Morone chrysops x M. saxatilis) challenged in situ with Mycobacterium marinum. Aquaculture 248, 197‐205.
Liao, H., Ellena, J., Liu, L., Szabo, G., Cafiso, D., Castle, D., 2007. Secretory carrier membrane protein SCAMP2 and phosphatidylinositol 4,5‐bisphosphate interactions in the regulation of dense core vesicle exocytosis. Biochemistry 46, 10909‐10920.
Lippincott‐Schwartz, J., Roberts, T.H., Hirschberg, K., 2000. Secretory protein trafficking and organelle dynamics in living cells. Annual Review of Cell and Developmental Biology 16, 557‐589.
Loughna, P.T., Goldspink, G., 1984. The effects of starvation upon protein turnover in red and white myotomal muscle of rainbow trout, Salmo gairdneri Richardson. Journal of Fish Biology 25, 223‐230.
Magalhaes, J.G., Tattoli, I., Girardin, S.E., 2007. The intestinal epithelial barrier: How to distinguish between the microbial flora and pathogens. Seminars in Immunology 19, 106‐115.
McLean, E., Craig, S.R., 2006. Nutrigenomics in aquaculture research: a key in the ‘Aquanomic’ revolution. In: Lyons, T.P., Jacques, K.A., Hower, J.M. (Eds.), Nutritional Biotechnology in the Feed and Food Industries ‐ Proceedings of Alltech’s 22nd Annual Symposium. Alltech Inc., Lexington, KY, pp. 433‐444.
Moffitt, C.M., Mobin, S.M.A., 2006. Profile of microflora of the posterior intestine of Chinook salmon before, during, and after administration of rations with and without erythromycin. North American Journal of Aquaculture 68, 176‐185.
Monsan, P.F., Paul, F., 1995. Oligosaccharide feed additives. In: Wallace, R.J., Chesson, A. (Eds.), Biotechnology in Animal Feeds and Feeding. VCH, New York, pp. 233‐245.
Morata, P., Vargas, A.M., Sanchez‐Medina, F., Garcia, M., Cardenete, G., Zamora, S., 1982. Evolution of gluconeogenic enzyme activities during starvation in liver and kidney of rainbow trout (Salmo gairdneri). Comparative Biochemistry and Physiology ‐ B. Biochemistry & Molecular Biology 71, 65‐70.
Mourao, J.L., Pinheiro, V., Alves, A., Guedes, C.M., Pinto, L., Saavedra, M.J., Spring, P., Kocher, A., 2006. Effect of mannan oligosaccharides on the performance, intestinal morphology
160
and cecal fermentation of fattening rabbits. Animal Feed Science and Technology 126, 107‐120.
Nakayama, K.I., Nakayama, K., 2005. Regulation of the cell cycle by SCF‐type ubiquitin ligases. Seminars in Cell & Developmental Biology 16, 323‐333.
Nakayama, K.I., Nakayama, K., 2006. Ubiquitin ligases: cell‐cycle control and cancer. Nature Reviews Cancer 6, 369‐381.
Panigrahi, A., Kiron, V., Satoh, S., Hirono, I., Kobayshi, T., Sugita, H., Puangkaew, J., Aoki, T., 2007. Immune modulation and expression of cytokine genes in rainbow trout Oncorhynchus mykiss upon probiotic feeding. Developmental and Comparative Immunology 31, 372‐382.
Panserat, S., Ducasse‐Cabanot, S., Plagnes‐Juan, E., Srivastava, P.P., Kolditz, C., Piumi, F., Esquerre, D., Kaushik, S., 2008. Dietary fat level modifies the expression of hepatic genes in juvenile rainbow trout (Oncorhynchus mykiss) as revealed by microarray analysis. Aquaculture 275, 235‐241.
Perry, F.G., 1995. Biotechnology in animal feeds and feeding, an overview. In: Wallace, R.J., Chesson, A. (Eds.), Biotechnology in Animal Feeds and Feeding. VCH, New York, pp. 1‐15.
Pohl, C., Jentsch, S., 2008. Final stages of cytokinesis and midbody ring formation are controlled by BRUCE. Cell 132, 832‐845.
Pryor, G.S., Royes, J.B., Chapman, F.A., Miles, R.D., 2003. Mannanoligosaccharides in fish nutrition: Effects of dietary supplementation on growth and gastrointestinal villi structure in gulf of Mexico sturgeon. North American Journal of Aquaculture 65, 106‐111.
Ringø, E., Strøm, E., Tabachek, J.A., 1995. Intestinal microflora of salmonids: a review. Aquaculture Research 26, 773‐789.
Rise, M.L., Douglas, S.E., Sakhrani, D., Williams, J., Ewart, K.V., Rise, M., Davidson, W.S., Koop, B.F., Devlin, R.H., 2006. Multiple microarray platforms utilized for hepatic gene expression profiling of GH transgenic coho salmon with and without ration restriction. Journal of Molecular Endocrinology 37, 259‐282.
Salem, M., Silverstein, J., Rexroad, C., Yao, J., 2007. Effect of starvation on global gene expression and proteolysis in rainbow trout (Oncorhynchus mykiss). BMC Genomics 8, 328.
Salze, G., McLean, E., Schwarz, M.H., Craig, S.R., 2008. Dietary mannan oligosaccharide enhances salinity tolerance and gut development of larval cobia. Aquaculture 274, 148‐152.
Saviozzi, S., Calogero, R.A., 2003. Microarray probe expression measures, data normalization and statistical validation. Comparative and Functional Genomics 4, 442–446.
Schekman, R., Orci, L., 1996. Coat proteins and vesicle budding. Science 271, 1526‐1533.
161
Schrezenmeir, J., de Vrese, M., 2001. Probiotics, prebiotics, and synbiotics ‐ approaching a definition. American Journal of Clinical Nutrition 73, 361S‐364S.
Sebzda, E., Zou, Z.Y., Lee, J.S., Wang, T., Kahn, M.L., 2008. Transcription factor KLF2 regulates the migration of naive T cells by restricting chemokine receptor expression patterns. Nature Immunology 9, 292‐300.
Staykov, Y., Denev, S., Spring, P., 2005. Influence of dietary mannan oligosaccharides (Bio‐Mos) on growth rate and immune function of common carp (Cyprinus carpio L.). In: Howell, B., Flos, R. (Eds.), Lessons from the past to optimise the future. European Aquaculture Society, pp. 431–432.
Staykov, Y., Spring, P., Denev, S., Sweetman, J., 2007. Effect of a mannan oligosaccharide on the growth performance and immune status of rainbow trout (Oncorhynchus mykiss). Aquaculture International 15, 153‐161.
Sumpter, J.P., Lebail, P.Y., Pickering, A.D., Pottinger, T.G., Carragher, J.F., 1991. The effect of starvation on growth and plasma growth hormone concentrations of rainbow trout, Oncorhynchus mykiss. General and Comparative Endocrinology 83, 94‐102.
Sweetman, J.W., Davies, S., 2006. Improving growth performance and health status of aquaculture stocks in Europe through the use of Bio‐Mos®. In: Lyons, T.P., Jacques, K.A. (Eds.), Nutritional Biotechnology in the Feed and Food Industries, Proceedings of Alltech’s 22nd Annual Symposium. Nottingham University Press, Nottingham, UK, Lexington, KY, pp. 445‐452.
Tateno, H., Shibata, Y., Nagahama, Y., Hirai, T., Saneyoshi, M., Ogawa, T., Muramoto, K., Kamiya, H., 2002. Tissue‐specific expression of rhamnose‐binding lectins in the steelhead trout (Oncorhynchus mykiss). Bioscience, Biotechnology, and Biochemistry 66, 1427‐1430.
Torrecillas, S., Makol, A., Caballero, M.J., Montero, D., Robaina, L., Real, F., Sweetman, J., Tort, L., Izquierdo, M.S., 2007. Immune stimulation and improved infection resistance in European sea bass (Dicentrarchus labrax) fed mannan oligosaccharides. Fish & Shellfish Immunology 23, 969‐981.
Tsvetkov, L.M., Yeh, K.H., Lee, S.J., Sun, H., Zhang, H., 1999. P27Kip1 ubiquitination and degradation is regulated by the SCFSkp2 complex through phosphorylated Thr187 in p27. Current Biology 9, 661‐664.
Villamil, L., Figueras, A., Novoa, B., 2003. Immunomodulatory effects of nisin in turbot (Scophthalmus maximus L.). Fish & Shellfish Immunology 14, 157‐169.
Welker, T.L., Lim, C., Yildirim‐Aksoy, M., Shelby, R., Klesius, P.H., 2007. Immune response and resistance to stress and Edwardsiella ictaluri challenge in channel catfish, Ictalurus punctatus, fed diets containing commercial whole‐cell yeast or yeast subcomponents. Journal of the World Aquaculture Society 38, 24‐35.
162
Wu, J.H., Lingrel, J.B., 2005. Kruppel‐like factor 2, a novel immediate‐early transcriptional factor, regulates IL‐2 expression in T lymphocyte activation. Journal of Immunology 175, 3060‐3066.
Xu, J., Gordon, J.I., 2003. Honor thy symbionts. Proceedings of the National Academy of Sciences of the United States of America 100, 10452‐10459.
Yilmaz, E., Genc, M.A., Genc, E., 2007. Effects of dietary mannan oligosaccharides on growth, body composition, and intestine and liver histology of rainbow trout, Oncorhynchus mykiss. Israeli Journal of Aquaculture‐Bamidgeh 59, 182‐188.
Zheng, T., Liu, W., Oh, S.Y., Zhu, Z., Hu, B.Q., Homer, R.J., Cohn, L., Grusby, M.J., Elias, J.A., 2008. IL‐13 receptor alpha 2 selectively inhibits IL‐13‐induced responses in the murine lung. Journal of Immunology 180, 522‐529.
163
Chapter IX . GENE EXPRES S ION
PROF I L ING OF ZEBRAF I SH FED D IETS
CONTA IN ING H IGH LEVELS OF
NUCLEOT IDES
Abstract
Zebrafish (Danio rerio) were fed either a control or nucleotide‐enhanced diet for 9 weeks. At the trial termination, fish were assayed for transcriptional alterations by dietary free nucleotide supplementation. As determined by microarray–mediated assay of gene expression, nucleotide‐supplementation impacted 681 genes significantly (P < 0.05). The nucleotide diet stimulated the transcription of 368 genes while down‐regulating 313 others (P < 0.05). Categorization of the up‐regulated genes revealed that 22% were engaged in transport and signaling, 20% were implicated in transcription and translation, and 5% each in immunity and cell cycling. Sixteen percent of the significantly up‐regulated genes could not be categorized while the remainders were uncharacterized. Since dietary nucleotides are efficiently catabolized in the intestinal epithelium, such result could be explained by a signaling role of nucleotides, starting in the absorptive cells. Indeed, the expression of numerous genes involved in signaling cascades, such as FAST (Fas‐activated serine/threonine kinase), were impacted by dietaty nucleotides.
Keywords: transcriptomics, nutrigenomics, genomics, nucleotide, immunity, microarray
164
INTRODUCTION
Apart from constituting the basic components of nucleic acids (DNA or RNA), nucleotides
can remain unincorporated as ‘free’ molecules of significant dietary importance. Nucleotides
are low molecular weight intracellular compounds of three components: a nitrogenous base, a
sugar molecule and one or more phosphate groups. Whether as free molecules or nucleic acids,
nucleotides play key roles in a wide variety of metabolic processes and are present in all foods
(Gil, 2002). While not considered essential, nucleotides positively influence lipid metabolism,
immunity, as well as tissue growth, development and repair (Aggett, et al., 2003; Gutiérrez‐
Castrellón, et al., 2007). Because rapidly proliferating tissues, including those comprising the
immune system and intestine, are unable to meet the cellular nucleotide requirements by de
novo synthesis, it has been suggested that dietary nucleotides might be required conditionally
(Van Buren and Rudolph, 1997). Studies on animals, as well as humans, support this possibility,
since during disease states, dietary nucleotides assist in the repair of insulted tissues (Carver,
1999).
In fish, aquafeed nucleotide supplementations of 0.5‐5.0% appear to enhance active
components of the non‐specific immune system, elicit elevations in leukocyte count and
respiratory burst activities, and increase survival to bacterial and viral challenges (Burrells and
Williams, 2006; Jha, et al., 2007; Li, et al., 2004; Russo, et al., 2006; Sakai, et al., 2001).
Furthermore, dietary nucleotides have been shown to lower the incidence of salmon louse
(Lepeophtheirus salmonis) infestations, (Burrells, et al., 2001a) and to exert beneficial effects on
165
intestinal structure, osmoregulatory capacity (Burrells, et al., 2001b; Burrells and Williams,
2006), and response to vaccination (Ramadan, et al., 1994). Although the potential production
benefits conferred by dietary nucleotides are wide‐ranging, the mechanism(s) of action of these
compounds nevertheless remain poorly characterized. A chief goal is the determination of
optimal protocols for nucleotide administration including dose, frequency and timing of use.
Moreover, selection of the appropriate nucleotide source and the form in which these are
delivered to provide the most advantageous response remains fertile ground for investigation.
In the present study, I examined the response of the cyprinid zebrafish (Danio rerio, Hamilton,
1822) to dietary nucleotide supplementation. Gene expression profiling using microarray
technologies was employed with particular reference to genes engaged in the immune system.
MATERIALS AND METHODS
Animals and holding
The zebrafish were obtained from a local supplier (Zooquatics, Blacksburg, VA, USA),
transferred to the Virginia Tech Aquaculture Center (VTAC), and stocked in a custom‐made
recirculating life support system (RLS). The RLS comprised twelve circular 10 L plastic aquaria
for animal holding, a biological filtration unit that retained 0.1 m3 of plastic media (Kaldnes
North America, Inc., Alexandria, VA), and a 150‐watt UV sterilizer (Emperor Aquatics, Inc.,
Pottstown, PA). Oxygenation was provided through diffusion air lines connected to a 1‐hp
remote‐drive regenerative blower (Sweetwater, Aquatic Ecosystems, Apopka, FL). Photoperiod
was maintained at a 12‐h photophase‐scotophase using an automated timer, with light
166
provided by banks of commercial phosphorescent tubes positioned 8 m above the experimental
system. Water quality parameters – including total ammonia nitrogen (TAN, range 0.1+0.1 mg l‐
1), nitrite (0.03+0.02 mg l‐1) and nitrate (44.6+12.4 mg l‐1), pH (7.6+0.3), dissolved oxygen
(7.8+0.3 mg l‐1) and temperature (23.5+0.6°C) were monitored daily using a pH meter (Hanna
Instruments, Woonsocket, RI), a spectrophotometer (DR2010; Hach Company, Loveland, CO)
and a combined temperature‐oxygen meter (YSI Inc., Yellow Springs, OH).
Fish husbandry and diet formulation
Eight zebrafish (initial weight 0.3 ± 0.03 g) were randomly stocked into 6 tanks, and each
tank was arbitrarily assigned one of two diets. The experimental diets were formulated on a
dry‐ weight basis and prepared at the VTAC. The control diet (CD) was formulated with herring
meal as the sole protein source. In the experimental nucleotide‐enriched diet (ND), fish meal
was completely replaced by a yeast cytoplasm extract (NuPro®, Alltech Inc., Lexington, KY)
which contained a minimum of 5% nucleotides (on dry‐matter basis). Lipids were provided in
both diets by menhaden oil, and both diets were formulated to be isonitrogenous (40% crude
protein), isolipidic (10% lipid) and isoenergetic (270 kcal g‐1; Table IX–1). The diets were pelleted
in an industrial mixer, crumbled to the desired size, and air‐dried prior to storage at ‐20°C until
feeding. The fish were hand‐fed at 3% body weight d‐1 split into two feedings (at 09.00 and
16.00 h) for a period of nine weeks.
167
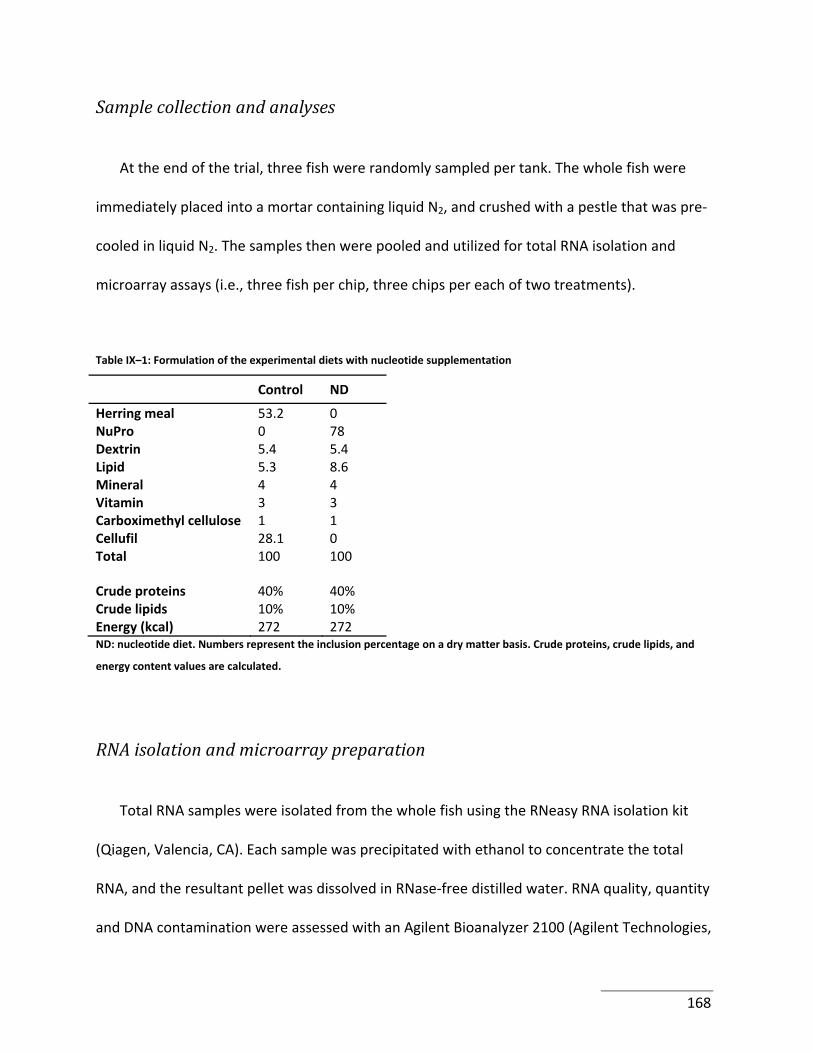
Sample collection and analyses
At the end of the trial, three fish were randomly sampled per tank. The whole fish were
immediately placed into a mortar containing liquid N2, and crushed with a pestle that was pre‐
cooled in liquid N2. The samples then were pooled and utilized for total RNA isolation and
microarray assays (i.e., three fish per chip, three chips per each of two treatments).
Table IX–1: Formulation of the experimental diets with nucleotide supplementation
Control ND
Herring meal 53.2 0 NuPro 0 78 Dextrin 5.4 5.4 Lipid 5.3 8.6 Mineral 4 4 Vitamin 3 3 Carboximethyl cellulose 1 1 Cellufil 28.1 0 Total 100 100
Crude proteins 40% 40% Crude lipids 10% 10% Energy (kcal) 272 272 ND: nucleotide diet. Numbers represent the inclusion percentage on a dry matter basis. Crude proteins, crude lipids, and
energy content values are calculated.
RNA isolation and microarray preparation
Total RNA samples were isolated from the whole fish using the RNeasy RNA isolation kit
(Qiagen, Valencia, CA). Each sample was precipitated with ethanol to concentrate the total
RNA, and the resultant pellet was dissolved in RNase‐free distilled water. RNA quality, quantity
and DNA contamination were assessed with an Agilent Bioanalyzer 2100 (Agilent Technologies,
168
Palo Alto, CA). The quality‐checked total RNA was used for synthesizing biotin‐labeled cDNA.
Briefly, I used 10 μg of total RNA to generate first‐strand cDNA with a T7‐linked oligo(dT)
primer. After second‐strand cDNA synthesis, in vitro transcription was performed with
biotinylated UTP and CTP (Enzo Diagnostics, Farmingdale, NY), resulting in approximately 100‐
fold amplification of the cRNA population. The cRNA was fragmented (15 μg per sample),
spiked with internal controls (Affymetrix Inc., Santa Clara, CA) and hybridized overnight to the
Affymetrix D. rerio (DsRed) zebrafish gene chips (n = 6 chips total). The genechips were washed
and stained with streptavidin‐phycoerythrin, before being scanned on the GeneChip scanner
(Affymetrix, Inc.).
Data preprocessing
After import into the Bioconductor package (version 1.5) in R (version 1.9), the CEL files
(containing the probe‐level data, 22 gene spots per gene) were preprocessed using the Robust
Multi‐chip Average (RMA) method, which normalizes across a set of hybridizations at the probe
level to perform within‐ and between‐chip (quantile) normalizations and to adjust the
background. Preprocessing of the data with RMA is more sensitive and specific, and provides a
more robust dataset than the standard Affymetrix MAS 5.0 scaling or dCHIP techniques. The
normalization process reduced unwanted technical variation, as verified by examining the
individual gene chips for reproducibility within the given conditions using two‐dimensional
scatter plots and hierarchical clustering with GeneSpring (version 7.2, Silicongenetics, Redwood
City, CA). Assessing the replication performance among gene chips within a treatment group
169
provides reasonable statistical confidence in the expression values (Saviozzi and Calogero,
2003).
Filtering and data analyses
Uninformative genes were eliminated from the dataset after implementing the
preprocessing steps. These included genes with signals very near background, those that were
considered absent by the Affymetrix scanner and genes that did not change expression values
appreciably across conditions. A review of the scatter plots showed that this excluded gene set
was highly variable at the lowest end of the expression scale (below 150 units of intensity).
Since I was primarily interested in discovering genes with robust expression levels, eliminating
the genes at the low end of the expression scale should not curtail this discovery. Filtering was
performed with GeneSpring. On this quality‐checked dataset, I performed statistical analyses
and fold‐change assessments using GeneSpring as follows: 1) executed t‐tests on the gene
values between the control and nucleotide‐treated samples, 2) examined the fold change
differences of the significant genes (P < 0.05).
RESULTS AND DISCUSSION
The final working dataset included 681 genes whose expression differed significantly among
treatments. In the present study, ND stimulated the transcription of 368 genes, while down‐
170
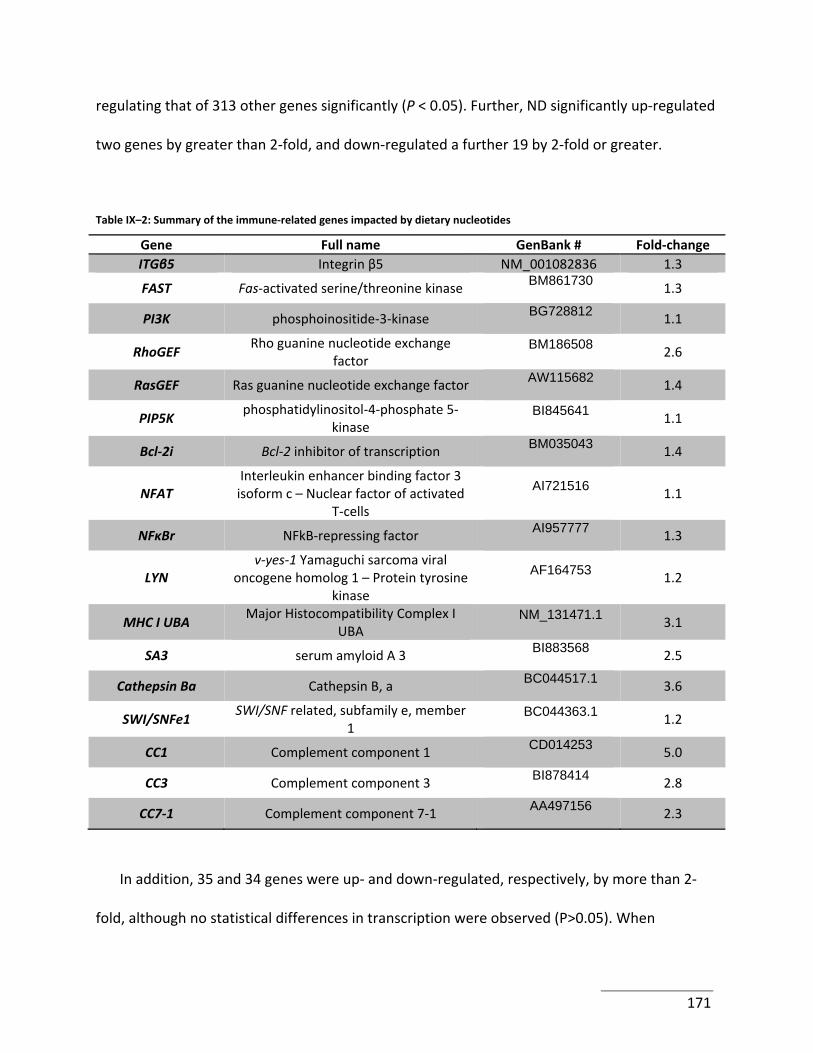
regulating that of 313 other genes significantly (P < 0.05). Further, ND significantly up‐regulated
two genes by greater than 2‐fold, and down‐regulated a further 19 by 2‐fold or greater.
Table IX–2: Summary of the immune‐related genes impacted by dietary nucleotides
Gene Full name GenBank # Fold‐change ITGβ5 Integrin β5 NM_001082836 1.3
FAST Fas‐activated serine/threonine kinase BM861730 1.3
PI3K phosphoinositide‐3‐kinase BG728812 1.1
RhoGEF Rho guanine nucleotide exchange
factor BM186508 2.6
RasGEF Ras guanine nucleotide exchange factor AW115682 1.4
PIP5K phosphatidylinositol‐4‐phosphate 5‐
kinase BI845641 1.1
Bcl‐2i Bcl‐2 inhibitor of transcription BM035043 1.4
NFAT Interleukin enhancer binding factor 3 isoform c – Nuclear factor of activated
T‐cells
AI721516 1.1
NFκBr NFkB‐repressing factor AI957777 1.3
LYN v‐yes‐1 Yamaguchi sarcoma viral
oncogene homolog 1 – Protein tyrosine kinase
AF164753 1.2
MHC I UBA Major Histocompatibility Complex I
UBA NM_131471.1 3.1
SA3 serum amyloid A 3 BI883568 2.5
Cathepsin Ba Cathepsin B, a BC044517.1 3.6
SWI/SNFe1 SWI/SNF related, subfamily e, member
1 BC044363.1 1.2
CC1 Complement component 1 CD014253 5.0
CC3 Complement component 3 BI878414 2.8
CC7‐1 Complement component 7‐1 AA497156 2.3
In addition, 35 and 34 genes were up‐ and down‐regulated, respectively, by more than 2‐
fold, although no statistical differences in transcription were observed (P>0.05). When
171
categorizing the up‐regulated genes according to function, 22% were involved in transport and
signaling, and 20% were implicated in transcription and translation. Cell cycle‐ and immune‐
related genes each represented 5% of up‐regulated genes. Finally, 16% of the significantly up‐
regulated genes could not be categorized, and a further 32% remained uncharacterized. Table
IX–2 presents a summary of the most relevant genes up‐regulated in ND‐fed fish.
While 5% of the up‐regulated genes are reportedly involved directly in immune system
function, numerous other genes also were engaged indirectly in immune response via signaling
or transcription/translation regulation. However, upon further inspection, certain genes that
stimulate or repress lymphocyte activation were expressed concomitantly. For example, the
ND‐fed fish expressed higher levels of Lyn, a membrane‐associated tyrosine kinase that
participates in antigen‐mediated signal transduction in B‐cells (Yamanashi, et al., 1991). Nuclear
Factor of Activated T‐cells (NFAT), which participates in the activation of both T‐ and B‐cells
(Kneitz, et al., 2002), was also up‐regulated in ND‐fed fish. In contrast, a predicted Fas‐activated
serine/threonine kinase (FAST) was also up‐regulated (Table IX–2). Fas is one of the most
potent triggers for lymphocyte apoptosis (Tian, et al., 1995). In addition, the inhibitor factor of
nuclear factor κ light polypeptide gene enhancer in B‐cells 1 (NFκB), which is involved in
regulating inflammation and transcription from the RNApol II promoter (Meyer, et al., 1991),
apoptosis (Cahir‐McFarland, et al., 2000) and ubiquitin‐mediated proteolysis, was up‐regulated
in the ND‐treated fish.
172
Interestingly, expressions of immunoglobulin (Ig)‐coding genes were not increased in the
ND‐fed fish, a finding that is inconsistent with previous reports in mammals (Jyonouchi, et al.,
1994; Navarro and Maldonado, 1999; Sudo, et al., 2000). In tilapia (Ramadan, et al., 1994),
rainbow trout (Leonardi, et al., 2003), and hybrid striped bass (Li, et al., 2004), nucleotide‐
enriched diets have also been reported to increase Ig. However, unlike previous studies with
fish, experimental animals used herein were not exposed to pathogen challenge, which may
explain the lack of an Ig effect. It is also possible that the transcription of Igs was masked
between treatments because the mRNA was extracted from whole fish. Indeed, Low et al.
(2003) described an up‐regulation of IgM expression in fish gills and spleen, and a down‐
regulation in the kidney. Nonetheless, the up‐regulation of a MHC I UBA gene by over 3‐fold in
the present study indicates that cell‐mediated immunity remained unsuppressed. Overall, these
results diverge slightly from previous findings in which lymphocyte‐mediated responses were
stimulated, but rather suggest an intensification of lymphocyte signal transduction, and
turnover of the lymphocyte pool.
Fish immunity relies primarily upon innate processes, such as those involving phagocytes
and the complement cascade (Ellis, 2001). In the present study, several genes related to the
innate immune system (humoral and cellular components) were up‐regulated between 2‐ and
5‐fold. Although individual variation likely prevented statistical separation, this may remain
biologically relevent. These genes included RasGEF domain 1Ba, RhoGEF, PI3K, PIP5K,
complement components 1, 3 and 7, serum amyloid A3 (which is engaged in the acute phase
response), and cathepsin B, a lysozomal proteinase. Similarly, the dietary nucleotides increased
173
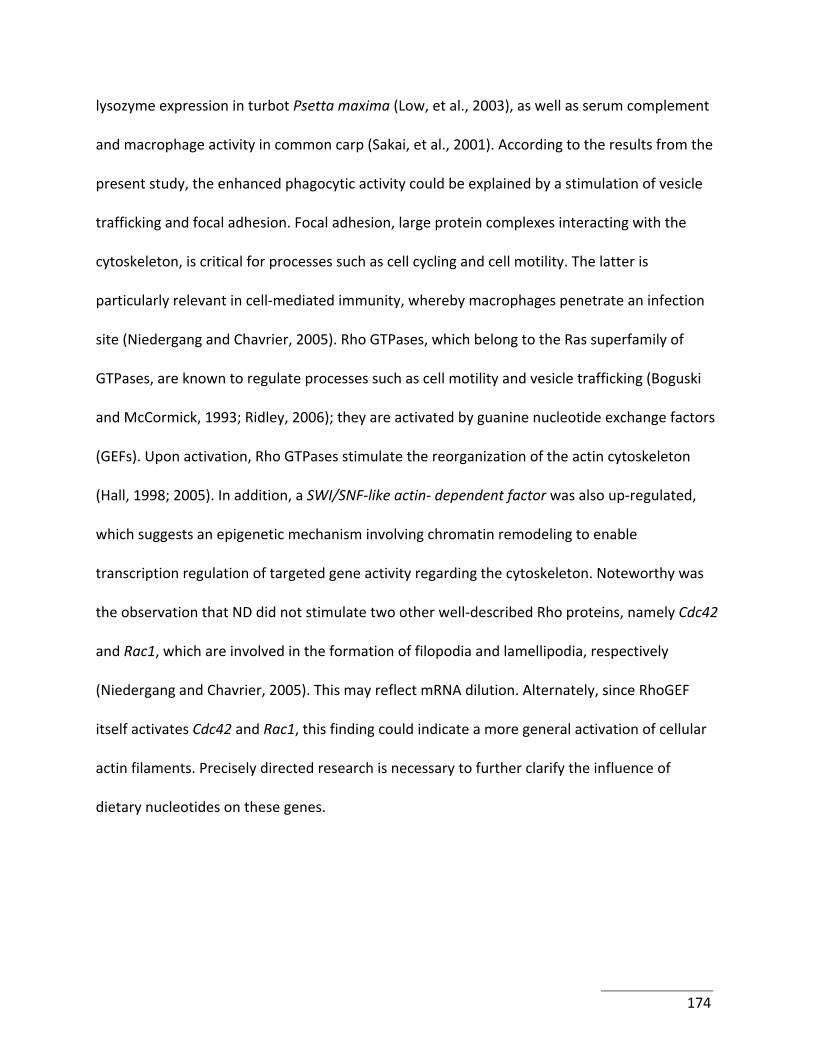
lysozyme expression in turbot Psetta maxima (Low, et al., 2003), as well as serum complement
and macrophage activity in common carp (Sakai, et al., 2001). According to the results from the
present study, the enhanced phagocytic activity could be explained by a stimulation of vesicle
trafficking and focal adhesion. Focal adhesion, large protein complexes interacting with the
cytoskeleton, is critical for processes such as cell cycling and cell motility. The latter is
particularly relevant in cell‐mediated immunity, whereby macrophages penetrate an infection
site (Niedergang and Chavrier, 2005). Rho GTPases, which belong to the Ras superfamily of
GTPases, are known to regulate processes such as cell motility and vesicle trafficking (Boguski
and McCormick, 1993; Ridley, 2006); they are activated by guanine nucleotide exchange factors
(GEFs). Upon activation, Rho GTPases stimulate the reorganization of the actin cytoskeleton
(Hall, 1998; 2005). In addition, a SWI/SNF‐like actin‐ dependent factor was also up‐regulated,
which suggests an epigenetic mechanism involving chromatin remodeling to enable
transcription regulation of targeted gene activity regarding the cytoskeleton. Noteworthy was
the observation that ND did not stimulate two other well‐described Rho proteins, namely Cdc42
and Rac1, which are involved in the formation of filopodia and lamellipodia, respectively
(Niedergang and Chavrier, 2005). This may reflect mRNA dilution. Alternately, since RhoGEF
itself activates Cdc42 and Rac1, this finding could indicate a more general activation of cellular
actin filaments. Precisely directed research is necessary to further clarify the influence of
dietary nucleotides on these genes.
174
Plate X–1: Mid‐intestine cross sections of control and nucleotide‐fed zebrafish
IF M
Note the increased mucus production in the ND‐fed fish (right) compared to the CD‐fed fish (left). IF: intestinal fold; M:
mucus. Stained with toluidine blue O and counterstained with safranin O.
In fishes, numerous studies have converged upon a potential mechanism for dietary
nucleotides enhancing resistance to bacterial and viral pathogens (Li and Gatlin, 2006); Burrels
et al. (2001a) also observed a positive effect of dietary nucleotides on sea lice infestation of
salmonids, and the authors suggested that nucleotides reduced immunosuppressive factors
such as cortisol and prostaglandin E2. While we did not observe these effects at the
transcriptional level, histological sections of the zebrafish intestine revealed a significant
increase in mucus production in ND‐fed fish compared to CD‐fed fish (P<0.05; Plate IX–1).
Accordingly, the mucin‐encoding gene Muc5b was up‐regulated in ND‐fed fish (2.23‐fold; Table
IX–2). The observed enhanced mucus production could also partly explain the multipotent
immunostimulation by reinforcing first barriers (e.g. intestinal epithelium and skin) and
shedding of infesting parasites. This is consistent with previous studies with human infants, in
which diarrhea occurrence is reduced and the intestinal microflora composition is improved
with dietary nucleotide supplementation (Singhal, et al., 2008). In fish, the gastrointestinal (GI)
epithelium is an extremely important interface for digestion, immune function and
175
osmoregulation. Therefore, the effects of dietary nucleotides on GI function and integrity could
have significant implications for growth, development and health. However, further research is
required to validate this hypothesis.
Most studies with fish – including the present one – have reported immunostimulating
properties for dietary nucleotides (Jha, et al., 2007; Li and Gatlin, 2006), but the effect of
dietary nucleotides on growth remains unclear. Oliva‐Teles et al. (2006) reported a significant
growth response to different nucleotides (brewer’s yeast or yeast‐extracted RNA) in gilthead
sea bream (Sparus aurata) juveniles (12‐46g). Nucleotide‐fed fish were 12‐19% heavier than the
control fish after 10 weeks. Conversely, Li et al. (2007) observed a transient positive effect of
dietary nucleotide supplementation in juvenile red drum (Sciaenops ocellatus, 10‐30g); namely,
the growth and feed efficiency response was only significant during the first week of the trial. In
the latter study, nucleotides incorporated into experimental diets were either via a purified mix
or a commercial product, and both sources impacted fish growth similarly. Previously, Rumsey
and coworkers (1992) observed a growth depression in rainbow trout fed free purines. Fournier
(2002) observed no nitrogen‐sparing effect of nucleotides in rainbow trout and turbot, along
with a 2‐fold increase in urea‐nitrogen excretion rate. In the present study, ND had no
significant impact on individual fish growth. However, adult fish were used, which likely limited
overall growth potential. Other authors also have speculated that different growth responses
result from different nucleotide mixes (Li and Gatlin, 2006). Preliminary studies suggested that
mammals respond differently to nutritional immunostimulation depending on their genotype
and antioxidant backgrounds (Grimble, 2001). Since dietary nucleotides are efficiently
176
catabolized in the intestinal epithelium, such broad impact on gene expression could be
explained by a signaling role of nucleotides, starting in the absorptive cells. I observed the up‐
regulation of guanine‐based second messenger pathways (Ras GTPases). Cyclic AMP
(adenosine‐based) is another important second messenger involved in different functions than
guanine‐based messengers. Thus the ratios between the different nucleic bases as well as their
phosphorylation status may be relevant in terms of nutritional effects. Additional research,
combining transcriptomics and more traditional assay methods, is necessary to further
investigate this hypothesis.
177
Cited references
Aggett, P., Leach, J.L., Rueda, R., MacLean, W.C., 2003. Innovation in infant formula development: A reassessment of ribonucleotides in 2002. Nutrition 19, 375‐384.
Boguski, M.S., McCormick, F., 1993. Proteins regulating Ras and its relatives. Nature 366, 643‐654.
Burrells, C., Williams, P.D., 2006. Fish feed with increased nucleotide content. Ewos Ltd, USA. Burrells, C., Williams, P.D., Forno, P.F., 2001a. Dietary nucleotides: a novel supplement in fish
feeds: 1. Effects on resistance to disease in salmonids. Aquaculture 199, 159‐169. Burrells, C., Williams, P.D., Southgate, P.J., Wadsworth, S.L., 2001b. Dietary nucleotides: a novel
supplement in fish feeds: 2. Effects on vaccination, salt water transfer, growth rates and physiology of Atlantic salmon (Salmo salar L.). Aquaculture 199, 171‐184.
Cahir‐McFarland, E.D., Davidson, D.M., Schauer, S.L., Duong, J., Kieff, E., 2000. NF‐kB inhibition causes spontaneous apoptosis in Epstein‐Barr virus‐transformed lymphoblastoid cells. Proceedings of the National Academy of Sciences of the United States of America 97, 6055‐6060.
Carver, J.D., 1999. Dietary nucleotides: effects on the immune and gastrointestinal systems. Acta Paediatrica 88.
Ellis, A.E., 2001. Innate host defense mechanisms of fish against viruses and bacteria. Developmental & Comparative Immunology 25, 827‐839.
Fournier, V., Gouillou‐Coustans, M.F., Métailler, R., Vachot, C., Moriceau, J., Le Delliou, H., Huelvan, C., Desbruyeres, E., Kaushik, S.J., 2002. Nitrogen utilisation and ureogenesis as affected by dietary nucleic acid in rainbow trout (Oncorhynchus mykiss) and turbot (Psetta maxima). Fish Physiology and Biochemistry 26, 177‐188.
Gil, A., 2002. Modulation of the immune response mediated by dietary nucleotides. European Journal of Clinical Nutrition 56, S1‐S4.
Grimble, R.F., 2001. Nutritional modulation of immune function, Symposium on 'Evidence‐based nutrition'. Proceedings of the Nutrition Society, Harrogate, UK, pp. 389‐397.
Gutiérrez‐Castrellón, P., Mora‐Magaña, I., Díaz‐García, L., Jiménez‐Gutiérrez, C., Ramirez‐Mayans, J., Solomon‐Santibáñez, G.A., 2007. Immune response to nucleotide‐supplemented infant formulae: systematic review and meta‐analysis. British Journal of Nutrition 98, S64‐S67.
Hall, A., 1998. Rho GTPases and the actin cytoskeleton. Science 279, 509‐514. Hall, A., 2005. Rho GTPases and the control of cell behaviour. Biochemical Society Transactions
33, 891‐895. Jha, A.K., Pal, A.K., Sahu, N.P., Kumar, S., Mukherjee, S.C., 2007. Haemato‐immunological
responses to dietary yeast RNA, ω‐3 fatty acid and β‐carotene in Catla catla juveniles. Fish & Shellfish Immunology 23, 917‐927.
178
Jyonouchi, H., Zhang‐Shanbhag, L., Tomita, Y., Yokoyama, H., 1994. Nucleotide‐free diet impairs T‐helper cell functions in antibody production in response to T‐dependent antigens in normal C57Bl/6 mice. Journal of Nutrition 124, 475‐484.
Kneitz, C., Goller, M., Tony, H.‐P., Simon, A., Stibbe, C., König, T., Serfling, E., Avots, A., 2002. The CD23b promoter is a target for NF‐AT transcription factors in B‐CLL cells. Biochimica et Biophysica Acta (BBA) ‐ Molecular Basis of Disease 1588, 41‐47.
Leonardi, M., Sandino, A.M., Klempau, A., 2003. Effect of a nucleotide‐enriched diet on the immune system, plasma cortisol levels and resistance to infectious pancreatic necrosis (IPN) in juvenile rainbow trout (Oncorhynchus mykiss). Bulletin of the European Association of Fish Pathologists 23, 52‐59.
Li, P., Gatlin, D.M., 2006. Nucleotide nutrition in fish: Current knowledge and future applications. Aquaculture 251, 141‐152.
Li, P., Lewis, D.H., Gatlin, D.M., 2004. Dietary oligonucleotides from yeast RNA influence immune responses and resistance of hybrid striped bass (Morone chrysops × Morone saxatilis) to Streptococcus iniae infection. Fish & Shellfish Immunology 16, 561‐569.
Li, P., Lawrence, A.L., Castille, F.L., Gatlin, D.M., 2007. Preliminary evaluation of a purified nucleotide mixture as a dietary supplement for Pacific white shrimp Litopenaeus vannamei (Boone). Aquaculture Research 38, 887‐890.
Low, C., Wadsworth, S., Burrells, C., Secombes, C.J., 2003. Expression of immune genes in turbot (Scophthalmus maximus) fed a nucleotide‐supplemented diet. Aquaculture 221, 23‐40.
Meyer, R., Hatada, E.N., Hohmann, H.P., Haiker, M., Bartsch, C., Röthlisberger, U., Lahm, H.W., Schlaeger, E.J., van Loon, A.P., Scheidereit, C., 1991. Cloning of the DNA‐binding subunit of human nuclear factor kappa B: the level of its mRNA is strongly regulated by phorbol ester or tumor necrosis factor alpha. Proceedings of the National Academy of Sciences of the United States of America 88, 966‐970.
Navarro, J., Maldonado, J., 1999. Influence of dietary nucleotides on plasma immunoglobulin levels and lymphocyte subsets of preterm infants. Biofactors 10, 67‐76.
Niedergang, F., Chavrier, P., 2005. Regulation of phagocytosis by Rho GTPases, Bacterial Virulence Factors and Rho GTPases. Springer‐Verlag Berlin, Berlin, pp. 43‐60.
Oliva‐Teles, A., Guedes, M.J., Vachot, C., Kaushik, S.J., 2006. The effect of nucleic acids on growth, ureagenesis and nitrogen excretion of gilthead sea bream Sparus aurata juveniles. Aquaculture 253, 608‐617.
Ramadan, A., Afifi, N.A., Moustafa, M.M., Samy, A.M., 1994. The effect of ascogen on the immune response of tilapia fish to Aeromonas hydrophila vaccine. Fish & Shellfish Immunology 4, 159‐165.
Ridley, A.J., 2006. Rho GTPases and actin dynamics in membrane protrusions and vesicle trafficking. Trends in Cell Biology 16, 522‐529.
179
Rumsey, G.L., Winfree, R.A., Hughes, S.G., 1992. Nutritional value of dietary nucleic acids and purine bases to rainbow trout (Oncorhynchus mykiss). Aquaculture 108, 97‐110.
Russo, R., Yanong, R.P.E., Mitchell, H., 2006. Dietary beta‐glucans and nucleotides enhance resistance of red‐tail black shark (Epalzeorhynchos bicolor, fam. Cyprinidae) to Streptococcus iniae infection. Journal of the World Aquaculture Society 37, 298‐306.
Sakai, M., Taniguchi, K., Mamoto, K., Ogawa, H., Tabata, M., 2001. Immunostimulant effects of nucleotide isolated from yeast RNA on carp, Cyprinus carpio L. Journal of Fish Diseases 24, 433‐438.
Saviozzi, S., Calogero, R.A., 2003. Microarray probe expression measures, data normalization and statistical validation. Comparative and Functional Genomics 4, 442–446.
Singhal, A., Macfarlane, G., Macfarlane, S., Lanigan, J., Kennedy, K., Elias‐Jones, A., Stephenson, T., Dudek, P., Lucas, A., 2008. Dietary nucleotides and fecal microbiota in formula‐fed infants: a randomized controlled trial. American Journal of Clinical Nutrition 87, 1785‐1792.
Sudo, N., Aiba, Y., Takaki, A., Tanaka, K., Yu, X.‐N., Oyama, N., Koga, Y., Kubo, C., 2000. Dietary nucleic acids promote a shift in Th1/Th2 balance toward Th1‐dominant immunity. Clinical & Experimental Allergy 30, 979‐987.
Tian, Q., Taupin, J.‐L., Elledge, S., Kobertson, M., Anderson, P., 1995. Fas‐activated serine/threonine kinase (FAST) phosphorylates TIA‐1 during Fas‐mediated apoptosis. Journal of Experimental Medicine 182, 865–874.
Van Buren, C.T., Rudolph, F., 1997. Dietary nucleotides: A conditional requirement. Nutrition 13, 470‐472.
Yamanashi, Y., Kakiuchi, T., Mizuguchi, J., Yamamoto, T., Toyoshima, K., 1991. Association of B cell antigen receptor with protein tyrosine kinase Lyn. Science 251, 192‐194.
180
Chapter X. MICROARRAY
EVALUAT ION OF THE RESPONSE OF
ZEBRAF I SH TO D IETARY
SELENOMETH ION INE
Abstract
The effect of supplementing feed with organic selenium (selenomethionine; Se‐met) on gene expression was examined in zebrafish. Two diets were used: a control and one that incorporated Se‐met at 0.06% of the diet on a dry‐matter basis. Feeds were fed to triplicate groups of fish (n = 8 fish per tank) twice per day to satiation for 9 weeks. At trial termination, three animals per tank were sacrificed and pooled. The tissues were immediately prepared for total RNA isolation, quality checked and subsequently hybridized overnight to an Affymetrix zebrafish gene chip (n = 3 per treatment). Se‐met addition to the diet resulted in up‐regulation (p<0.05) of 6112 genes. Of these, 1279 were up‐regulated more than 2‐fold, 158 more than 3‐fold, and 5 at over 6‐fold when compared to control groups. A narrower examination showed that Se up‐regulated a number of genes involved in leukocyte activation and differentiation and regulation of the complement cascade. A number of non‐immune‐specific genes that nonetheless have significant relevance to body defense were also up‐regulated, including those involved in mucin production, endocytosis and exocytosis. A noteworthy effect of dietary Se‐met treatment was seen on a range of genes associated with the insulin signaling cascade, suggesting that Se may be insulinomimetic in fish. Significant differences also were observed in various gene classes involved in the maturation process, with the Se‐met treatment apparently suppressing gamete development. The present study indicates that Se may play a more wide‐ranging role in vertebrate metabolism than currently appreciated.
Keywords: transcriptomics, nutrigenomics, insulinomimetic, immunity, selenium, mucin
181
INTRODUCTION
The last two decades have witnessed fundamental changes in nutritional research, with
traditional physiological and epidemiological studies being supplemented by molecular and
genetic analyses (Milner, 2004). The ascendancy of the latter methodologies reflects not only
acquisition of new technologies and knowledge, but also the recognition that nutrients: 1)
modify gene expression, 2) may alter normal metabolism, and 3) affect normal health
(Corthésy‐Theulaz, et al., 2005). This has stimulated the scientific community to engage
molecular techniques to more rigorously define inter‐relationships between diet, health and
disease (Kaput and Rodriguez, 2004). These approaches herald a new era for the
pharmaceutical and feed ingredient industries in particular, since both will be able to develop,
refine and modify bioactive and natural compounds that target specific diseases and/or provide
health benefits. Fundamental differences exist, however, between clinical and animal
production settings and in how these emerging technologies may be applied at the practical
level.
In humans, it is well established that many medications express individual variability in
efficacy and toxicity. This may result due to environmental factors or genetic variation. Indeed,
many genes have small sequence differences or polymorphisms, and these distinctions may
affect protein‐protein or protein‐substrate interactions. Inconsistencies in some
epidemiological studies may partially be explained by polymorphisms, as exemplified by those
upon folate metabolism and altered risk to colon cancer and responsiveness to hypolipemiant
182
drugs (Davis and Hord, 2005; Ruano, et al., 2005). These recognized deviations from the “norm”
in human subjects has led to the development of the concept of “personalized medicine”,
wherein gene expression profiling (GEP) is employed to provide tailored treatment regimens
based upon molecular classification of gene subtypes (Chin, et al., 2004; Jain, 2004). The use of
GEP, in which transcriptomic or microarray methods are employed, has recently been applied
to adjust dietary intake of humans to provide health benefit ‐ the so‐called “nutrigenomics”
approach (Castle and Ries, 2007; Lau, et al., 2008). In the animal nutrition field, far from
adapting nutrition to each individual, these same technologies may be harnessed to assist in
the formulation of élite animal feeds.
The recognition that certain nutrients interact beneficially with the immune system of
aquatic animals has led several feed manufacturers to develop diets that focus upon enhancing
health through nutrient manipulation. These specialty feeds originally commenced with simple
vitamin, and especially ascorbic acid, additions, but subsequently have evolved into more
complex formulations that incorporate various minerals, vitamins, β‐glucans, nucleotides, and
other immunostimulating ingredients (McLean, et al., 2008). The cynic might suggest that
today’s “enhanced” feeds simply reflect a deeper understanding of fish nutritional
requirements and that even greater refinement to aquafeeds is possible. Gene expression
profiling represents one means by which nutrient‐gene interactions can be evaluated and
information on key nutrients rapidly accumulated with respect to their overall impact potential
on animal production performance. In addition, GEP could be applied to examine the negative
impacts of stressors and latent infections on nutritional status. Such information may be of
183
significance where micronutrients are preferentially mined, leading to a transient or sustained
imbalance which may have significant consequences to the operation of the immune system
(Institute of Medicine, 1999).
A resurgence of interest in selenium (Se) utilization in vertebrates has emphasized the
essentiality of this trace element, while highlighting a greater potential role of this mineral in a
wider range of biochemical pathways than previously imagined (Surai, 2006). In fish, Se is
present in the form of selenocysteine, and it has been suggested that the Se requirement for
fish in general may be higher than for other vertebrates (Kryukov and Gladyshev, 2000). In
higher vertebrates, Se compounds are known to be involved in a variety of biological processes,
but are especially important as antioxidants and perhaps as transport proteins. Se represents
one mineral that may become rapidly depleted during stress events (Gill and Walker, 2008),
such that dietary over‐formulation (i.e. above established requirement levels) for this mineral
may be a rational option, especially during periods in the production cycle where the risk of
stress events is high. A prerequisite to recommending over‐formulation for any nutrient,
however, is a detailed picture of not only biological response, but also a mechanistic
understanding of observed effect. The latter is important since nutrient excess can have
negative as well as positive impacts on a range of physiological control processes.
Microarray technologies permit an exquisite way in which the effects of dietary over‐
formulation of one ingredient can be examined on a genome‐wide basis. Accordingly, in order
to gain greater insight of the biological effects of supplemental dietary Se on fish, the impact of
184
supplementing feeds with selenomethionine was examined using zebrafish Danio rerio. The
response of Se‐fed fish was compared against a control treatment in which Se was fed at
requirement levels only. Zebrafish were chosen as a model due to the commercial availability of
zebrafish gene chips.
MATERIALS AND METHODS
Animals and holding
Zebrafish were obtained from a local supplier (Zooquatics, Blacksburg, VA, USA) and
transferred to the Virginia Tech Aquaculture Center (VTAC), and stocked in a custom‐made
recirculating life support system (RLS). The RLS comprised twelve circular 10‐L plastic aquaria
for animal holding, a biological filtration unit that retained 0.1 m3 of plastic media (Kaldnes
North America, Inc., Alexandria, VA), and a 150‐watt UV sterilizer (Emperor Aquatics, Inc.,
Pottstown, PA). Oxygenation was provided through diffusion air lines connected to a 1‐hp
remote‐drive regenerative blower (Sweetwater, Aquatic Ecosystems, Apopka, FL). Photoperiod
was maintained at a 12‐h photophase‐scotophase using an automated timer, with light
provided by banks of commercial phosphorescent tubes positioned 8 m above the experimental
system. Water quality parameters, including total ammonia nitrogen (range 0.1 ± 0.1 mg l‐1),
nitrite (0.03 ± 0.02 mg l‐1) and nitrate (44.6 ± 12.4 mg l‐1), pH (7.6 ± 0.3), dissolved oxygen (7.8 ±
0.3 mg l‐1) and temperature (23.5 ± 0.6°C), were monitored daily using a pH meter (Hanna
Instruments, Woonsocket, RI), spectrophotometer (DR2010; Hach Company, Loveland, CO) and
a combined temperature‐oxygen meter (YSI Inc., Yellow Springs, OH).
185
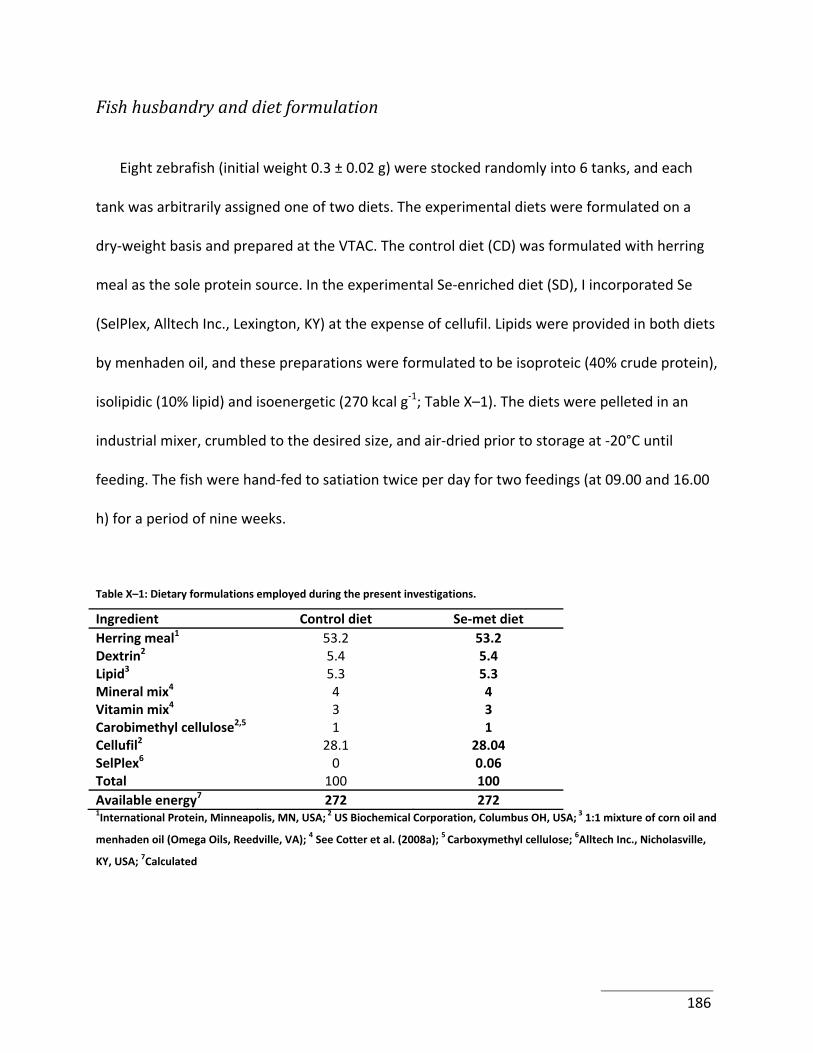
Fish husbandry and diet formulation
Eight zebrafish (initial weight 0.3 ± 0.02 g) were stocked randomly into 6 tanks, and each
tank was arbitrarily assigned one of two diets. The experimental diets were formulated on a
dry‐weight basis and prepared at the VTAC. The control diet (CD) was formulated with herring
meal as the sole protein source. In the experimental Se‐enriched diet (SD), I incorporated Se
(SelPlex, Alltech Inc., Lexington, KY) at the expense of cellufil. Lipids were provided in both diets
by menhaden oil, and these preparations were formulated to be isoproteic (40% crude protein),
isolipidic (10% lipid) and isoenergetic (270 kcal g‐1; Table X–1). The diets were pelleted in an
industrial mixer, crumbled to the desired size, and air‐dried prior to storage at ‐20°C until
feeding. The fish were hand‐fed to satiation twice per day for two feedings (at 09.00 and 16.00
h) for a period of nine weeks.
Table X–1: Dietary formulations employed during the present investigations.
Ingredient Control diet Se‐met diet Herring meal1 53.2 53.2 Dextrin2 5.4 5.4 Lipid3 5.3 5.3 Mineral mix4 4 4 Vitamin mix4 3 3 Carobimethyl cellulose2,5 1 1 Cellufil2 28.1 28.04 SelPlex6 0 0.06 Total 100 100 Available energy7 272 272 1International Protein, Minneapolis, MN, USA; 2 US Biochemical Corporation, Columbus OH, USA; 3 1:1 mixture of corn oil and
menhaden oil (Omega Oils, Reedville, VA); 4 See Cotter et al. (2008a); 5 Carboxymethyl cellulose; 6Alltech Inc., Nicholasville,
KY, USA; 7Calculated
186
Sample collection and analyses
At the end of the trial, I sampled three fish per tank randomly. Samples were immediately
placed into a mortar containing liquid N2, and crushed with a pestle that was pre‐cooled in
liquid N2. The samples then were pooled and utilized for total RNA isolation and microarray
assays (i.e. three fish per chip, three chips per treatment).
RNA isolation and microarray preparation
The total RNA samples were isolated from the tissue samples with the RNeasy RNA isolation
kit (Qiagen, Valencia, CA). Each sample was precipitated with ethanol to concentrate the total
RNA, and the resultant pellet was dissolved in RNase‐free distilled water. RNA quality, quantity
and DNA contamination were determined with an Agilent Bioanalyzer 2100 (Agilent
Technologies, Palo Alto, CA). The quality‐checked total RNA was used for synthesizing biotin‐
labeled cRNA. Briefly, I used 10 µg of total RNA to generate first‐strand cDNA with a T7‐linked
oligo(dT) primer. After second‐strand cDNA synthesis, in vitro transcription was performed with
biotinylated UTP and CTP (Enzo Diagnostics, Farmingdale, NY), resulting in approximately 100‐
fold amplification of the cRNA population. The cRNA was fragmented (15 μg per sample),
spiked with internal controls (Affymetrix Inc., Santa Clara, CA) and hybridized overnight to the
Affymetrix D. rerio (DsRed) gene chips (n = 6 chips total). The gene chips were washed and
stained with streptavidin‐phycoerythrin, before being scanned on the GeneChip scanner
(Affymetrix, Inc.).
187
Data preprocessing
After import into the Bioconductor package (version 1.5) in R (version 1.9), the CEL files
(containing the probe‐level data, 22 gene spots per gene) were preprocessed using the Robust
Multi‐chip Average (RMA) method, which normalizes across a set of hybridizations at the probe
level to perform within‐ and between‐chip (quantile) normalizations and to adjust the
background. Preprocessing of the data with RMA is more sensitive and specific, and provides a
more robust dataset than the standard Affymetrix MAS 5.0 scaling or dCHIP techniques. The
normalization process reduced unwanted technical variation, as verified by examining the
individual gene chips for reproducibility within the given conditions using two‐dimensional
scatter plots and hierarchical clustering in GeneSpring (version 7.2, Silicongenetics, Redwood
City, CA). Assessing the replication performance among gene chips within a treatment group
provides reasonable statistical confidence in the expression values (Saviozzi and Calogero,
2003).
Filtering and data analyses
Uninformative genes were eliminated from the dataset after implementing the
preprocessing steps. These included genes with signals very near background, those that were
considered absent by the Affymetrix scanner and genes that did not change expression values
appreciably across conditions. A review of the scatter plots showed that this excluded gene set
was highly variable at the lowest end of the expression scale (below 150 units of intensity).
188
Since I was primarily interested in discovering genes with robust expression levels, eliminating
the genes at the low end of the expression scale should not curtail this discovery. Filtering was
performed using GeneSpring. On this quality‐checked dataset, I performed statistical analyses
and fold‐change assessments utilizing GeneSpring as follows: 1) executed t‐tests on the gene
values between the control and Se‐met‐treated samples, 2) examined the fold‐change
differences of the genes showing statistically significant differences in expression between
treatments (P < 0.05).
RESULTS
No mortalities were recorded throughout the trial, and fish in both control and treatment
groups grew well over the 9‐week period (Figure X–1). The final working dataset included 9210
genes whose expression differed significantly between treatments. This represented over 60%
of the entire zebrafish genome. Of these genes, 6112 expressed significantly higher levels of
transcription in Se‐fed fish, while 3098 had greater levels of transcription in control zebrafish.
For animals maintained on the Se‐supplemented diet, 1279 genes were up‐regulated greater
than 2‐fold, while 1427 genes exhibited 2‐fold or greater levels of expression in control groups.
The most highly up‐regulated transcript observed for Se‐fed fish, at 8.3‐fold, was a
hypothetical protein of unknown function. As summarized in Table X–2, microarray analysis of
Se‐fed zebrafish revealed significant up‐regulation of various genes involved in the immune
system, including lymphocyte secreted C‐type lectin (P < 0.008), IL‐16 (P < 0.008), stromal cell‐
189
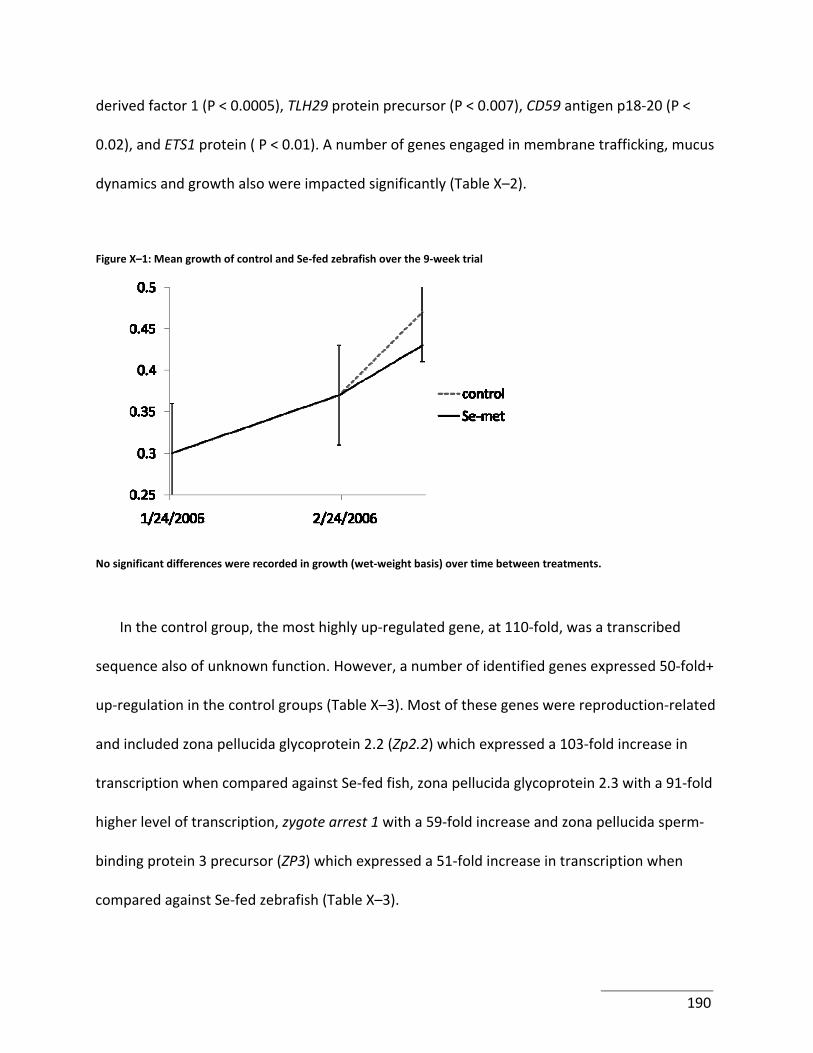
derived factor 1 (P < 0.0005), TLH29 protein precursor (P < 0.007), CD59 antigen p18‐20 (P <
0.02), and ETS1 protein ( P < 0.01). A number of genes engaged in membrane trafficking, mucus
dynamics and growth also were impacted significantly (Table X–2).
Figure X–1: Mean growth of control and Se‐fed zebrafish over the 9‐week trial
No significant differences were recorded in growth (wet‐weight basis) over time between treatments.
In the control group, the most highly up‐regulated gene, at 110‐fold, was a transcribed
sequence also of unknown function. However, a number of identified genes expressed 50‐fold+
up‐regulation in the control groups (Table X–3). Most of these genes were reproduction‐related
and included zona pellucida glycoprotein 2.2 (Zp2.2) which expressed a 103‐fold increase in
transcription when compared against Se‐fed fish, zona pellucida glycoprotein 2.3 with a 91‐fold
higher level of transcription, zygote arrest 1 with a 59‐fold increase and zona pellucida sperm‐
binding protein 3 precursor (ZP3) which expressed a 51‐fold increase in transcription when
compared against Se‐fed zebrafish (Table X–3).
190
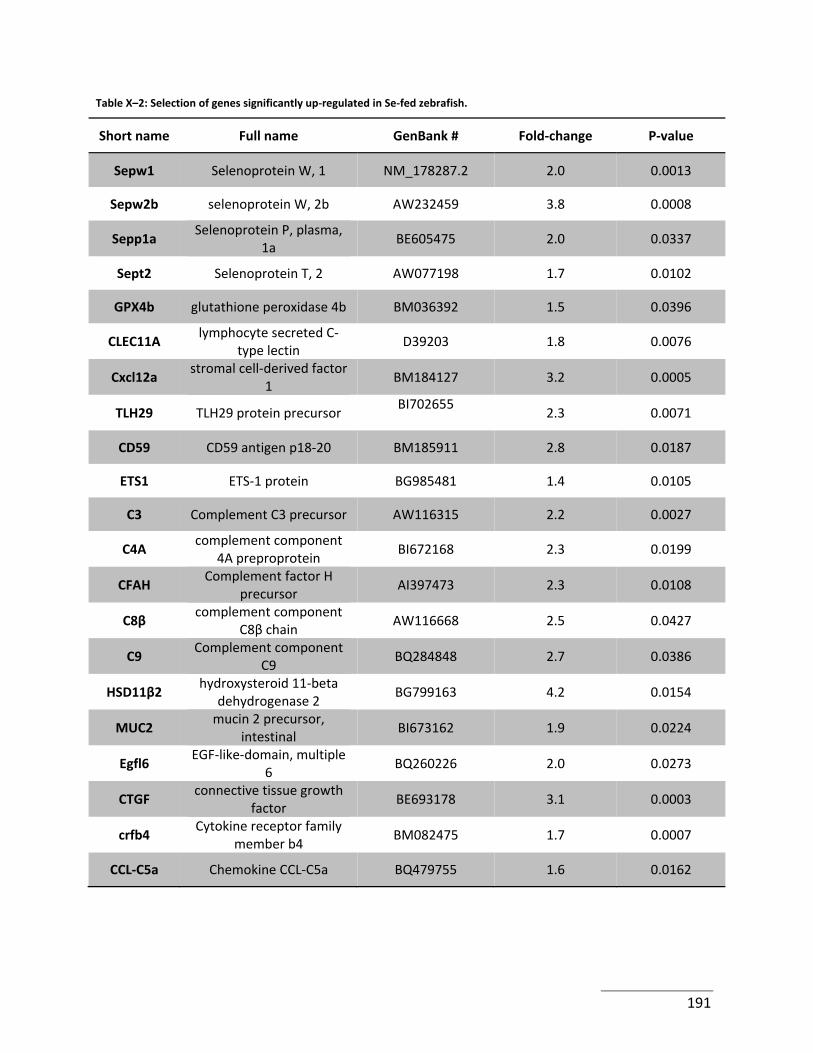
Table X–2: Selection of genes significantly up‐regulated in Se‐fed zebrafish.
Short name Full name GenBank # Fold‐change P‐value
Sepw1 Selenoprotein W, 1 NM_178287.2 2.0 0.0013
Sepw2b selenoprotein W, 2b AW232459 3.8 0.0008
Sepp1a Selenoprotein P, plasma,
1a BE605475 2.0 0.0337
Sept2 Selenoprotein T, 2 AW077198 1.7 0.0102
GPX4b glutathione peroxidase 4b BM036392 1.5 0.0396
CLEC11A lymphocyte secreted C‐
type lectin D39203 1.8 0.0076
Cxcl12a stromal cell‐derived factor
1 BM184127 3.2 0.0005
TLH29 TLH29 protein precursor BI702655
2.3 0.0071
CD59 CD59 antigen p18‐20 BM185911 2.8 0.0187
ETS1 ETS‐1 protein BG985481 1.4 0.0105
C3 Complement C3 precursor AW116315 2.2 0.0027
C4A complement component
4A preproprotein BI672168 2.3 0.0199
CFAH Complement factor H
precursor AI397473 2.3 0.0108
C8β complement component
C8β chain AW116668 2.5 0.0427
C9 Complement component
C9 BQ284848 2.7 0.0386
HSD11β2 hydroxysteroid 11‐beta
dehydrogenase 2 BG799163 4.2 0.0154
MUC2 mucin 2 precursor,
intestinal BI673162 1.9 0.0224
Egfl6 EGF‐like‐domain, multiple
6 BQ260226 2.0 0.0273
CTGF connective tissue growth
factor BE693178 3.1 0.0003
crfb4 Cytokine receptor family
member b4 BM082475 1.7 0.0007
CCL‐C5a Chemokine CCL‐C5a BQ479755 1.6 0.0162
191
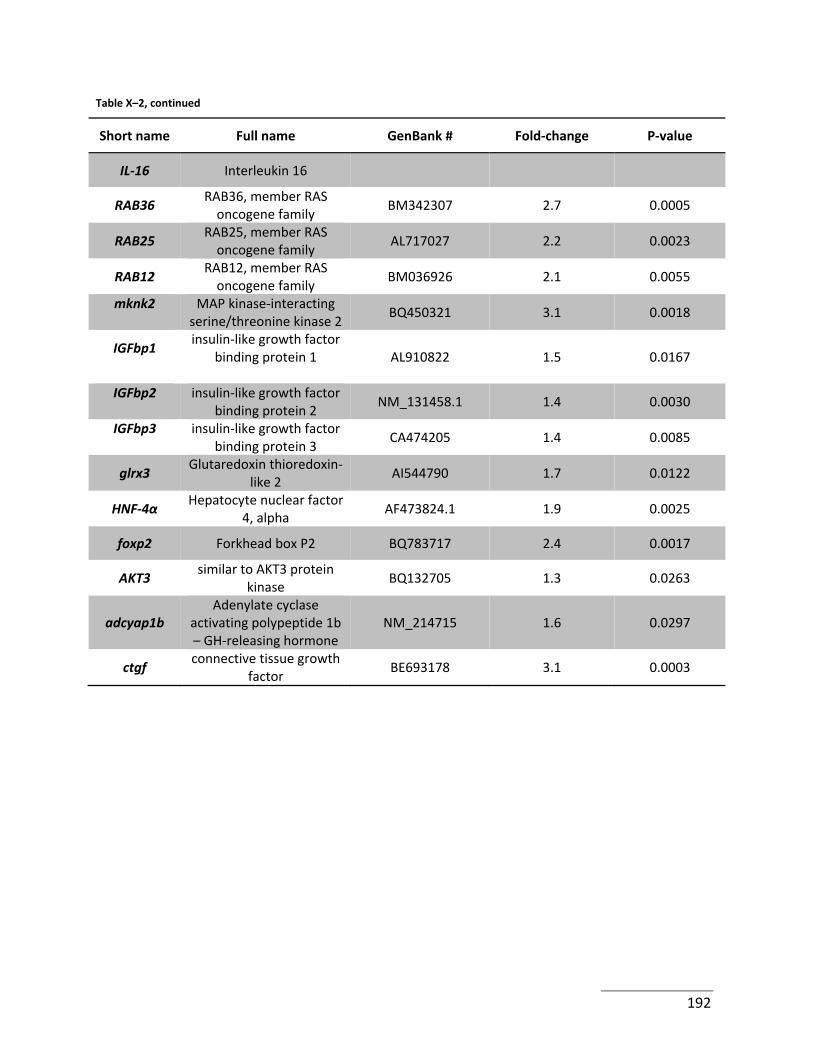
Table X–2, continued
Short name Full name GenBank # Fold‐change P‐value
IL‐16 Interleukin 16
RAB36 RAB36, member RAS oncogene family
BM342307 2.7 0.0005
RAB25 RAB25, member RAS oncogene family
AL717027 2.2 0.0023
RAB12 RAB12, member RAS oncogene family
BM036926 2.1 0.0055
mknk2
MAP kinase‐interacting serine/threonine kinase 2
BQ450321 3.1 0.0018
IGFbp1
insulin‐like growth factor binding protein 1
AL910822 1.5 0.0167
IGFbp2
insulin‐like growth factor binding protein 2
NM_131458.1 1.4 0.0030
IGFbp3
insulin‐like growth factor binding protein 3
CA474205 1.4 0.0085
glrx3 Glutaredoxin thioredoxin‐
like 2 AI544790 1.7 0.0122
HNF‐4α Hepatocyte nuclear factor
4, alpha AF473824.1 1.9 0.0025
foxp2 Forkhead box P2 BQ783717 2.4 0.0017
AKT3 similar to AKT3 protein
kinase BQ132705 1.3 0.0263
adcyap1b Adenylate cyclase
activating polypeptide 1b – GH‐releasing hormone
NM_214715 1.6 0.0297
ctgf connective tissue growth
factor BE693178 3.1 0.0003
192
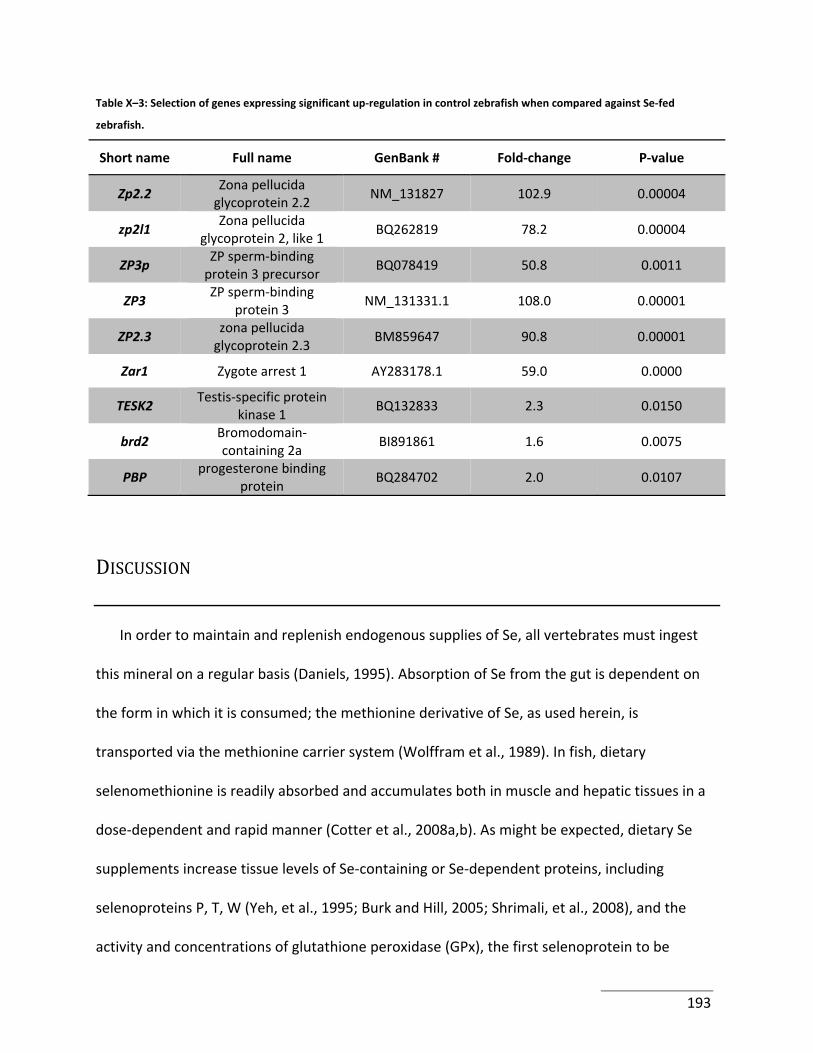
Table X–3: Selection of genes expressing significant up‐regulation in control zebrafish when compared against Se‐fed
zebrafish.
Short name Full name GenBank # Fold‐change P‐value
Zp2.2 Zona pellucida glycoprotein 2.2
NM_131827 102.9 0.00004
zp2l1 Zona pellucida
glycoprotein 2, like 1 BQ262819 78.2 0.00004
ZP3p ZP sperm‐binding protein 3 precursor
BQ078419 50.8 0.0011
ZP3 ZP sperm‐binding
protein 3 NM_131331.1 108.0 0.00001
ZP2.3 zona pellucida glycoprotein 2.3
BM859647 90.8 0.00001
Zar1 Zygote arrest 1 AY283178.1 59.0 0.0000
TESK2 Testis‐specific protein
kinase 1 BQ132833 2.3 0.0150
brd2 Bromodomain‐containing 2a
BI891861 1.6 0.0075
PBP progesterone binding
protein BQ284702 2.0 0.0107
DISCUSSION
In order to maintain and replenish endogenous supplies of Se, all vertebrates must ingest
this mineral on a regular basis (Daniels, 1995). Absorption of Se from the gut is dependent on
the form in which it is consumed; the methionine derivative of Se, as used herein, is
transported via the methionine carrier system (Wolffram et al., 1989). In fish, dietary
selenomethionine is readily absorbed and accumulates both in muscle and hepatic tissues in a
dose‐dependent and rapid manner (Cotter et al., 2008a,b). As might be expected, dietary Se
supplements increase tissue levels of Se‐containing or Se‐dependent proteins, including
selenoproteins P, T, W (Yeh, et al., 1995; Burk and Hill, 2005; Shrimali, et al., 2008), and the
activity and concentrations of glutathione peroxidase (GPx), the first selenoprotein to be
193
identified (Rotruck, et al., 1973; Flohé, et al., 1973). GPx catalyses the reduction of hydrogen
peroxide and lipid peroxides, thereby protecting organisms from oxidative damage. During Se
deficiency, GPx activity decreases (Lei, et al., 1998) whereas Se supplementation increases GPx
activities. In the present trial, the GPX4B glutathione peroxidase gene was up‐regulated
together with the selenoproteins P, T and W. More surprising was that a dietary level of 0.06%
supplemental Se exerted major changes in transcription levels of many genes not normally
associated with Se, thus suggesting an influence of Se on their expression.
The close relationship between diet and fish health, especially in consideration of the
micronutrients, has accelerated research and discovery in this area. A number of vitamins and
minerals have been linked to disease and immunity in cultured fish, and although the mode of
action of these nutrients varies, many are believed to act via the enhancement of innate
immunity and especially by stimulating leukocyte activity. In several trials with laboratory and
farm animals, Se deficiency has been linked to increased virulence of viral, bacterial and
protozoan pathogens (Boyne and Arthur, 1986; Beck, et al., 1994, 2001; Nelson, et al., 2001;
Gomez, et al., 2002). Conversely, Se supplementation confers beneficial effects during
infections (Davis, et al., 1998; de Souza, et al., 2003), perhaps mediated through its action on a
variety of immune mechanisms (Boyne and Arthur, 1979; Gynag, et al., 1984; Mckenzie, et al.,
1998). In fish, a recurrent observation during pathogen exposure, both in field and laboratory
environments, has been the probable participation of Se in the disease process. Thus, Atlantic
salmon infected with Vibrio exhibit significantly reduced hepatic Se levels (Hjeltnes and
Julshamn, 1992). Supplemental dietary Se has been reported to enhance antibody production
194
and survival in channel catfish challenged with Edwardsiella (Wang, et al., 1997). Beneficial
impacts on innate immunity in Edwardsiella‐infected hybrid striped bass (Jaramillo and Gatlin,
2004) and elevated glutathione peroxidase activity in Renibacterium‐infected Chinook salmon
also have been reported (Thorarinsson, et al., 1994). Taken together, these observations
suggest that immune‐related advantages may incur when Se is supplemented into aquafeeds.
In the present study, whether by direct or indirect action, supplemental dietary Se up‐
regulated a number of immune‐specific genes in zebrafish by 1.4‐2.8‐fold. These included
lymphocyte‐secreted C‐type lectin, IL‐16, stromal cell‐derived factor 1 and 2, TLH29 protein
precursor, CD59 antigen p18‐20, and ETS1 protein. These genes are involved in leukocyte
activation and differentiation and regulation of the complement cascade. In addition, genes
involved in the humoral component of the innate immune system were also up‐regulated (2.3‐
to 2.8‐fold), such as the complement component C3, C4, complement factor H, membrane
attack complex (MAC) components C8β and C9. The concomitant up‐regulation of the CD59
antigen is noteworthy since CD59 blocks the final step of MAC formation, thus inhibiting its
functionality (Farkas, et al., 2002). Supplemental dietary Se thereby may act to maintain the
functionality of the MAC while controlling ultimate formation through a CD59 feedback. This
enhanced potential may improve both the speed and amplitude of the immune response
during infection. Further research is necessary to investigate this hypothesis. A number of non‐
immune‐specific genes, that nonetheless have significant relevance to innate immunity, were
also up‐regulated, including those involved in exocytosis, endocytosis and vesicle transport. In
fish, the innate immune system (phagocytic cells, natural killer cells, inflammatory cells,
195
cytokines, complement, and acute phase proteins [APP]), plays a significant role in protection
against pathogens. Integral to the APP response (APPR) are changes in nutrient utilization
brought about by the action of a number of cytokines superseding the normal hypothalamic‐
somatotropic control of nutrient utilization. During the APPR, concentrations of specific
circulating nutrients are preferentially mined (Louw, et al., 1992), presumably to assist in the
hepatic synthesis of APP. When such nutrients are inadequate, the APPR may be compromised
(Grimble, 2001), leading to increased susceptibility to disease. Se may represent such a nutrient
and if this were the case, then benefit may arise by Se over‐formulation of fish diets.
Noteworthy in these trials was the upregulation of the hydroxysteroid 11‐β dehydrogenase 2
(11β‐HSD2), which controls occupancy of non‐selective mineralcorticoid and glucocorticoid
receptors by glucocorticoids (Albiston, et al., 1994; Baker, 2004). In fish, glucocorticoids
decrease phagocytic activity, antibody production, complement activity, lymphocyte number
and disease resistance (Maule, et al., 1989; Ortuno, et al., 2002). Logically, amplified expression
of the 11β‐HSD2 gene would thus be expected, as was the case. Taken together with those
relating to growth, these results suggest the existence of a nutrition‐neuroendocrine‐immune
syntax which acts synergistically to ensure optimal physiological functionality of the organism.
A particularly interesting outcome of Se supplementation of zebrafish diets was that several
genes involved in regulating mucus dynamics were up‐regulated. Mucous glycoproteins, or
mucins, provide the structural basis for the formation of gels that lubricate and protect
epithelial surfaces. Mucus is a potent barrier to bacterial colonization and is able to entrap and
remove pathogens via increased flow and turnover. In order to avoid being washed away,
196
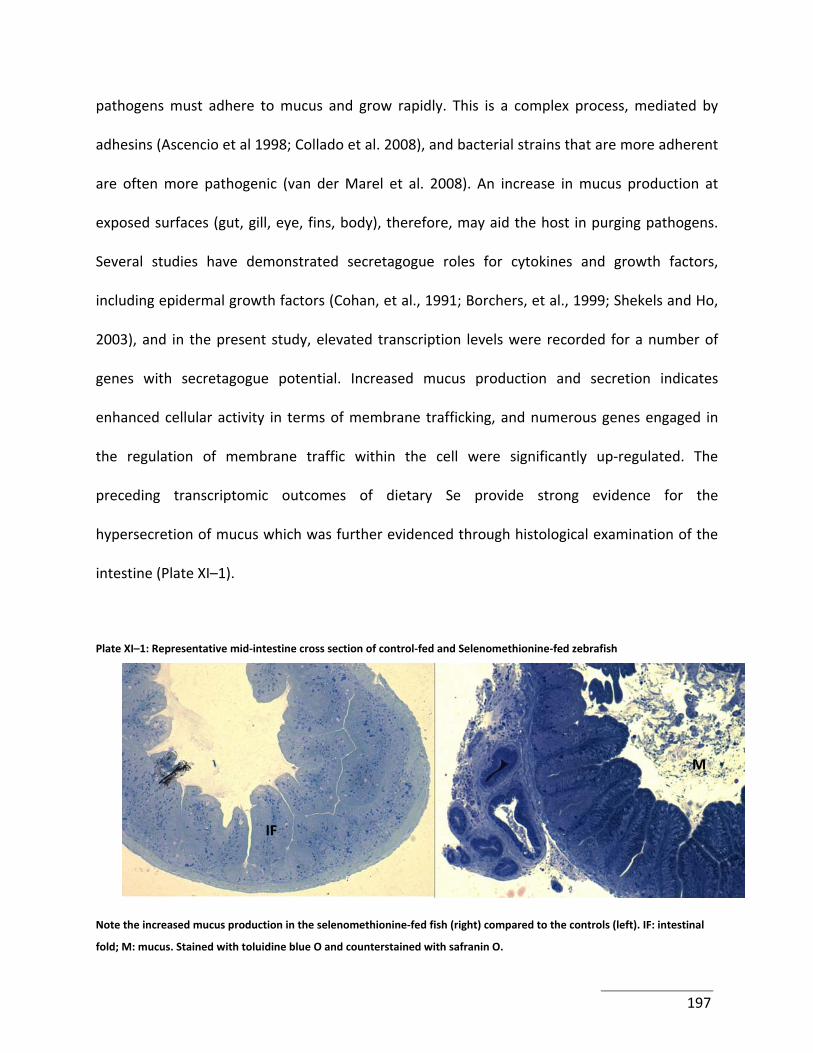
pathogens must adhere to mucus and grow rapidly. This is a complex process, mediated by
adhesins (Ascencio et al 1998; Collado et al. 2008), and bacterial strains that are more adherent
are often more pathogenic (van der Marel et al. 2008). An increase in mucus production at
exposed surfaces (gut, gill, eye, fins, body), therefore, may aid the host in purging pathogens.
Several studies have demonstrated secretagogue roles for cytokines and growth factors,
including epidermal growth factors (Cohan, et al., 1991; Borchers, et al., 1999; Shekels and Ho,
2003), and in the present study, elevated transcription levels were recorded for a number of
genes with secretagogue potential. Increased mucus production and secretion indicates
enhanced cellular activity in terms of membrane trafficking, and numerous genes engaged in
the regulation of membrane traffic within the cell were significantly up‐regulated. The
preceding transcriptomic outcomes of dietary Se provide strong evidence for the
hypersecretion of mucus which was further evidenced through histological examination of the
intestine (Plate XI–1).
Plate XI–1: Representative mid‐intestine cross section of control‐fed and Selenomethionine‐fed zebrafish
M
IF
Note the increased mucus production in the selenomethionine‐fed fish (right) compared to the controls (left). IF: intestinal
fold; M: mucus. Stained with toluidine blue O and counterstained with safranin O.
197
Accordingly, hypersecretion of mucus may represent a further mechanism through which Se
enhances resistance of fish to pathogen challenges (i.e., augmented barrier functions). In
cultivated fishes, a building body of evidence suggests that certain pathogens, including the
causative agents of columnaris disease, Flavobacterium columnare, vibirosis Vibrio anguillarum,
and cold‐water vibriosis in Atlantic salmon (Salmo salar) modify their growth (Denkin and
Nelson, 1999) and gene expression in response to elevated mucus presence. These reactions
include increased extracellular protease activity (Staroscik and Nelson, 2008), increased
motility, and up‐regulation of genes involved in oxidative stress responses (Raeder, et al. 2006).
Accordingly, even given enhancement of barrier function that Se‐driven increased mucus
production might confer, further augmentation of host defense mechanisms would likely be
necessary in the production environment.
In higher vertebrates, an intriguing new physiological role for dietary Se has been proposed
‐ that it possesses insulinomimetic properties. Evidence in support of a function for Se in the
insulin signal cascade includes its stimulation of glucose transport and translocation of glucose
transporters in rat adipocytes in vitro (Ezaki, 1990), normalization of blood glucose levels in
diabetic rats (McNeill, et al., 1991), and regulation of some insulin‐mediated metabolic
processes (Berg, et al., 1995; Becker, et al., 1996). Moreover, Se alleviates or prevents the
adverse effects of diabetes on cardiac, renal and platelet function (Battell, et al., 1998; Douillet,
et al., 1996a,b). Evidence to suggest that Se may also exert a similar insulinomimetic effect in
teleosts is provided by the present study. A number of MAP and tyrosine kinases, which are
involved in the distal signaling of the insulin signaling cascade (Kusari, et al., 1997; Stapleton,
198
2000), were significantly (P<0.03) up‐regulated in zebrafish receiving Se‐supplemented diets.
Transcription levels increased for thioredoxin‐like and glutathione peroxidase (see: Holmgren,
1979; Jung and Thomas, 1996), HNF‐4a (Fajans, et al., 2001), forkhead box protein (Walter, et
al., 2008) and akt3, which is known to be a regulator of cell signaling processes in response to
insulin and other growth factors (Cichy, et al., 1998). Insulin drives the hepatic expression of
insulin‐like growth factors (IGF) and associated binding proteins (IGFbp), and in zebrafish fed
Se‐supplemented feeds significant (P<0.04) up‐regulation of numerous IGF‐related genes was
observed (Table X–2). Insulin‐like peptides and their binding proteins modulate somatic growth
and metabolism while also influencing a number of other developmental processes (Nelson and
Sheridan, 2006). Se‐supplemented diets also increased transcription levels of a number of
growth‐related hormones and receptors, including growth hormone‐releasing hormone,
connective, stem‐cell and epidermal growth factors and thyroid receptors (Table X–2). The
results of the present trial therefore, may provide a molecular explanation for the positive
growth effects observed for fish fed Se‐enhanced diets (Abdel‐Tawwab, et al., 2007; Wang, et
al., 2007). Se also may act as an appetite stimulant, as inferred by the observations of Cotter, et
al. (2008) with hybrid striped bass, and demonstrated in Se‐deficient chicks (Bunk and Combs,
1980). Although the present research provides strong circumstantial evidence for an
insulinomimetic effect in fish, confirmation of such a role will nevertheless require more
detailed study. Such experiments might include evaluation of circulating glucose levels and
hormone profiles, more detailed evaluation of changes in gluconeogenic enzyme activities, as
well as more thorough examination of protein synthesis.
199
Development and maturation of testes and ovaries demands the carefully orchestrated
expression of various gene classes that ultimately produce viable gametes (von Schalburg, et
al., 2005). A conspicuous feature of control groups was higher levels of transcription for
reproduction‐related genes, some of which were 100‐fold higher than those observed in Se‐fed
zebrafish. Examples of prominently over‐expressed genes and their fold‐change included: zona
pellucida glycoprotein 2.2 (100‐fold), zona pellucida B protein (78‐fold), sperm‐binding
glycoprotein ZP3 (65‐fold), zygote arrest 1 (60‐fold), zona pellucida glycoprotein 2.4 (58‐fold)
and oocyte maturation factor (24‐fold). Other significantly up‐regulated genes of reproductive
importance are exemplified by testis‐specific protein kinase 1 (2.3‐fold), bromodomain‐
containing 2 (2‐fold) and progesterone binding protein (2‐fold). The zona pellucida provides
communication between oocytes and follicle cells during oogenesis and protects oocytes, eggs
and ultimately embryos during development. The zona pellucida also normalizes interactions
between ovulated eggs and free‐swimming sperm during and following fertilization
(Wassarman, et al., 1999). The oocyte‐specific gene zygote arrest 1 functions during the oocyte‐
to‐embryo transition (Wu, et al., 2003), while bromodomain‐containing 2 expression appears to
correlate with stages of oocyte maturation (Trousdale and Wolgemuth, 2004). Testis‐specific
protein kinase 1 expression increases in testicular germ cells at the stages of late pachytene
spermatocytes (Toshima, et al., 1998), whereas sperm‐binding glycoprotein ZP3 facilitates the
binding of sperm to egg (Rodeheffer and Shur, 2004). These data indicate that experimental
animals in the control group were of both sexes and that, unlike the case for Se‐fed fish, control
animals were maturing. The slight predominance of oocyte‐related genes compared to sperm‐
related genes could be due to a skewed sex‐ratio, or may indicate a higher sensitivity of female
200
zebrafish to dietary Se‐met. One of the most important aspects of Se toxicity in fish is its
negative impacts on reproduction. Se bioaccumulation has been associated with reduced
growth (Hamilton, et al. 1990), embryonic deformity and complete reproductive failure of fish
inhabiting Se‐contaminated aquatic ecosystems (Lemly, 1993b; Maier and Knight, 1994). Clearly
the distinct differences in gene expression, with regard to reproduction, between groups signify
a significant concern since it is unlikely that the results represent a chance occurrence.
Accordingly, future studies with supplemental Se should examine this potentially negative
impact more thoroughly.
The present experiment demonstrates nutrient‐gene interactions in fish. Moreover, the
results indicate that Se as an essential mineral probably plays a more wide‐ranging role in
vertebrate metabolism than currently is appreciated. Although clear production‐related
benefits may accrue by supplementing diets with organic Se, there nevertheless exist significant
questions that must be answered prior to advocating the general use of Se‐enriched diets by
the aquaculture industry.
201
Cited references
Abdel‐Tawwab, M., Mousa, M.A.A., Abbass, F.E., 2007. Growth performance and physiological response of African catfish, Clarias gariepinus (B.) fed organic selenium prior to the exposure to environmental copper toxicity. Aquaculture 272, 335‐345.
Albiston, A.L., Obeyesekere, V.R., R.E., S., Krozowski, Z.S., 1994. Cloning and tissue distribution of the human 11 beta‐hydroxysteroid dehydrogenase type 2 enzyme. Molecular and Cellular Endocrinology 105, R11‐17.
Ascensio, S.M., Sharon, M., Ofek, I., 1998. Adhesion of bacteria to mucosal surfaces. In: Gallin, J.I., Fauci, A.S. (Eds.), Mucosal Immunology. Academic Press, San Diego, USA, pp. 31‐42.
Baker, M.E., 2004. Evolutionary analysis of 11β‐hydroxysteroid dehydrogenase‐type 1, ‐type 2, ‐type 3 and 17β‐hydroxysteroid dehydrogenase‐type 2 in fish. FEBS Letters 574, 167‐170.
Battell, M.L., Delgatty, H.L.M., McNeill, J.H., 1998. Sodium selenate corrects glucose tolerance and heart function in STZ diabetic rats. Molecular and Cellular Biochemistry 179, 27‐34.
Beck, M.A., Kolbeck, P.C., Shi, Q., Rohr, L.H., Morris, V.C., Levander, O.A., 1994. Increased virulence of a human enterovirus (Coxsackievirus B3) in selenium‐defficient mice. Journal of Infectious Diseases 170, 351‐357.
Beck, M.A., Nelson, H.K., Shi, Q., Van Dael, P., Schiffrin, E.J., Blum, S., Barclay, D., Levander, O.A., 2001. Selenium deficiency increases the pathology of an influenza virus infection. FASEB Journal 15, 1481‐+.
Becker, D.J., Reul, B., Ozcelikay, A.T., Buchet, J.P., Henquin, J.C., Brichard, S.M., 1996. Oral selenate improves glucose homeostasis and partly reverses abnormal expression of liver glycolytic and gluconeogenic enzymes in diabetic rats. Diabetologia 39, 3‐11.
Berg, E.A., Wu, J.Y., Campbell, L., Kagey, M., Stapleton, S.R., 1995. Insulin‐like effects of vanadate and selenate on the expression of glucose‐6‐phosphate dehydrogenase and fatty acid synthase in diabetic rats. Biochimie 77, 919‐924.
Borchers, M.T., Carty, M.P., Leikauf, G.D., 1999. Regulation of human airway mucins by acrolein and inflammatory mediators. American Journal of Physiology‐Lung Cellular and Molecular Physiology 276, L549‐L555.
Boyne, R., Arthur, J.R., 1979. Alterations of neutophil function in selenium‐deficient cattle. Journal of Comparative Pathology 89, 151‐158.
Boyne, R., Arthur, J.R., 1986. The response of selenium‐deficient mice to Candida albicans infection. Journal of Nutrition 116, 816‐822.
Bunk, M.J., Combs, G.F., 1980. Effect of selenium on appetite in the selenium‐deficient chick. Journal of Nutrition 110, 743‐749.
Burk, R.F., Hill, K.E., 2005. Selenoprotein P: An extracellular protein with unique physical characteristics and a role in selenium homeostasis. Annual Review of Nutrition 25, 215‐235.
202
Castle, D., Ries, N.A., 2007. Ethical, legal and social issues in nutrigenomics: The challenges of regulating service delivery and building health professional capacity. Mutation Research‐Fundamental and Molecular Mechanisms of Mutagenesis 622, 138‐143.
Chin, K.V., Selvanayagam, Z.E., Vittal, R., Kita, T., Kudoh, K., Yang, C.S., Wong, Y.F., Cheung, T.H., Yeo, W., Chung, T.K.H., Lin, Y., Liao, J., Shih, J.W.C., Yap, S.F., Lin, A.W., 2004. Application of expression genomics in drug development and genomic medicine. Drug Development Research 62, 124‐133.
Cichy, S.B., Uddin, S., Danilkovich, A., Guo, S.D., Klippel, A., Unterman, T.G., 1998. Protein kinase B/Akt mediates effects of insulin on hepatic insulin‐like growth factor‐binding protein‐1 gene expression through a conserved insulin response sequence. Journal of Biological Chemistry 273, 6482‐6487.
Cohan, V.L., Scott, A.L., Dinarello, C.A., Prendergast, R.A., 1991. Interleukin‐1 is a mucus secretagogue. Cellular Immunology 136, 425‐434.
Collado, M.C., Meriluoto, J., Salminen, S., 2008. Adhesion and aggregation properties of probiotic and pathogen strains. European Food Research and Technology 226, 1065‐1073.
Corthésy‐Theulaz, I., den Dunnen, J.T., Ferré, P., Geurts, J.M.W., Müller, M., van Belzen, N., van Ommen, B., 2005. Nutrigenomics: The Impact of Biomics Technology on Nutrition Research. Annals of Nutrition and Metabolism 49, 355‐365.
Cotter, P.A., McLean, E., Craig, S.R., 2008a. Designing fish for improved human health status. Nutr. Health 19, in press.
Cotter, P.A., Craig, S.R., McLean, E., 2008b. Hyperaccumulation of selenium in hybrid striped bass: a functional food for aquaculture? Aquaculture Nutrition 14, 215‐222.
Daniels, L., 1996. Selenium metabolism and bioavailability. Biological Trace Element Research 54, 185‐199.
Davis, C.D., Hord, N.G., 2005. Nutritional "Omics" technologies for elucidating the role(s) of bioactive food components in colon cancer prevention. Journal of Nutrition 135, 2694‐2697.
Davis, C.D., Brooks, L., Calisi, C., Bennett, B.J., McElroy, D.M., 1998. Beneficial effect of selenium supplementation during murine infection with Trypanosoma cruzi. Journal of Parasitology 84, 1274‐1277.
de Souza, A.P., de Oliveira, G.M., Vanderpas, J., de Castro, S.L., Rivera, M.T., Araujo‐Jorge, T.C., 2003. Selenium supplementation at low doses contributes to the decrease in heart damage in experimental Trypanosoma cruzi infection. Parasitology Research 91, 51‐54.
Denkin, S.M., Nelson, D.R., 1999. Induction of protease activity in Vibrio anguillarum by gastrointestinal mucus. Applied and Environmental Microbiology 65, 3555‐3560.
Douillet, C., Bost, M., Accominotti, M., BorsonChazot, F., Ciavatti, M., 1996a. In vitro and in vivo effects of selenium and selenium with vitamin E on platelet functions in diabetic rats
203
relationship to platelet sorbitol and fatty acid distribution. Biological Trace Element Research 55, 263‐277.
Douillet, C., Tabib, A., Bost, M., Accominotti, M., BorsonChazot, F., Ciavatti, M., 1996b. A selenium supplement associated or not with vitamin E delays early renal lesions in experimental diabetes in rats. Proceedings of the Society for Experimental Biology and Medicine 211, 323‐331.
Ezaki, O., 1990. The insulin‐like effects of selenate in rat adipocytes. Journal of Biological Chemistry 265, 1124‐1128.
Fajans, S.S., Bell, G.I., Polonsky, K.S., 2001. Mechanisms of disease: Molecular mechanisms and clinical pathophysiology of maturity‐onset diabetes of the young. New England Journal of Medicine 345, 971‐980.
Farkas, I., Baranyi, L., Ishikawa, Y., Okada, N., Bohata, C., Budai, D., Fukuda, A., Imai, M., Okada, H., 2002. CD59 blocks not only the insertion of C9 into MAC but inhibits ion channel formation by homologous C5b‐8 as well as C5b‐9. Journal of Physiology‐London 539, 537‐545.
Flohe, L., Günzler, W.A., Schock, H.H., 1973. Glutathione peroxidase: A selfnoenzyme. FEBS Letters 32, 132‐134.
Gill, H., Walker, G., 2008. Selenium, immune function and resistance to viral infections. Nutrition & Dietetics 65, S41‐S47.
Gomez, R.M., Solana, M.E., Levander, O.A., 2002. Host selenium deficiency increases the severity of chronic inflammatory myopathy in Trypanosoma cruzi‐inoculated mice. Journal of Parasitology 88, 541‐547.
Grimble, R.F., 2001. Nutritional modulation of immune function, Symposium on 'Evidence‐based nutrition'. Proceedings of the Nutrition Society, Harrogate, UK, pp. 389‐397.
Gyang, E.O., Stevens, J.B., Olson, W.G., Tsitsamis, S.D., Usenik, E.A., 1984. Effects of selenium‐vitamin E injection on bovine polymorphonucleated leukicytes phagocytosis and killing of Staphylococcus aureus. American Journal of Veterinary Research 45, 175‐177.
Hamilton, S.J., Buhl, K.J., Faerber, N.L., Wiedmeyer, R.H., Bullard, F.A., 1990. Toxicity of organic selenium in the diet to chinook salmon. Environmental Toxicology and Chemistry 9, 347‐358.
Hjeltnes, B., Julshamn, K., 1992. Concentration of iron, copper, zinc and selenium in liver of Atlantic salmon Salmo salar infected with Vibrio salmonicida. Diseases of Aquatic Organisms 12, 147‐149.
Holmgren, A., 1979. Reduction of disulfides by thioredoxin ‐ Exceptional reactivity of insulin and suggested functions of thioredoxin in mechanism of hormon action. Journal of Biological Chemistry 254, 9113‐9119.
Institute of Medicine, 1999. Military strategies for the sustainment of nutrition in the field. National Academy Press, Washington D.C., 722 pp.
204
Jain, K.K., 2004. Applications of biochips: From diagnostics to personalized medicine. Current Opinion in Drug Discovery & Development 7, 285‐289.
Jaramillo, F., Gatlin, D.M., 2004. Comparison of purified and practical diets supplemented with or without beta‐glucan and selenium on resistance of hybrid striped bass Morone chrysops female x M‐saxatilis male to Streptococcus iniae infection. Journal of the World Aquaculture Society 35, 245‐252.
Jung, C.H., Thomas, J.A., 1996. S‐glutathiolated hepatocyte proteins and insulin disulfides as substrates for reduction by glutaredoxin, thioredoxin, protein disulfide isomerase, and glutathione. Archives of Biochemistry and Biophysics 335, 61‐72.
Kaput, J., Rodriguez, R.L., 2004. Nutritional genomics: the next frontier in the postgenomic era. Physiological Genomics 16, 166‐177.
Kryukov, G.V., Gladyshev, V.N., 2000. Selenium metabolism in zebrafish: multiplicity of selenoprotein genes and expression of a protein containing 17 selenocysteine residues. Genes to Cells 5, 1049‐1060.
Kusari, A.B., Byon, J., Bandyopadhyay, D., Kenner, K.A., Kusari, J., 1997. Insulin‐induced mitogen‐activated protein (MAP) kinase phosphatase‐1 (MKP‐1) attenuates insulin‐stimulated MAP kinase activity: A mechanism for the feedback inhibition of insulin signaling. Molecular Endocrinology 11, 1532‐1543.
Lau, F.C., Bagchi, M., Sen, C., Roy, S., Bagchi, D., 2008. Nutrigenomic analysis of diet‐gene interactions on functional supplements for weight management. Current Genomics 9, 239‐251.
Lei, X.G., Dann, H.M., Ross, D.A., Cheng, W.H., Combs, G.F., Roneker, K.R., 1998. Dietary selenium supplementation is required to support full expression of three selenium‐dependent glutathione peroxidases in various tissues of weanling pigs. Journal of Nutrition 128, 130‐135.
Lemly, A.D., 1993. Teratogenic effects of selenium in natural populations of freshwater fish. Ecotoxicology and Environmental Safety 26, 181‐204.
Louw, J.A., Werbeck, A., Louw, M.E.J., Kotze, T.J.V., Cooper, R., Labadarios, D., 1992. Blood vitamin concentrations during the acute‐phase response. Critical Care Medicine 20, 934‐941.
Maier, K.J., Knight, A.W., 1994. Ecotoxicology of selenium in freshwater systems. Reviews in Environmental Contamination and Toxicology 134, 31‐48.
Maule, A.G., Tripp, R.A., Kaattari, S.L., Schreck, C.B., 1989. Stress alters immune function and disease resistance in chinook salmon (Oncorhynchus tshawytscha) Journal of Endocrinology 120, 135‐142.
McKenzie, R.C., Rafferty, T.S., Beckett, G.J., 1998. Selenium: An essential element for immune function. Immunology Today 19, 342‐345.
205
McLean, E., Salze, G., Craig, S.R., 2008. Parasites, diseases and deformities of cobia. Ribarstvo 66, 1‐16.
McNeill, J.H., Delgatty, H.L.M., Battell, M.L., 1991. Insulin‐like effects of sodium selenate in streptozocin‐induced diabetic rates. Diabetes 40, 1675‐1678.
Milner, J.A., 2004. Molecular targets for bioactive food components. Journal of Nutrition 134, 2492S‐2498S.
Nelson, H.K., Shi, Q., Van Dael, P., Schiffrin, E.J., Blum, S., Barclay, D., Levander, O.A., Beck, M.A., 2001. Host nutritional selenium status as a driving force for influenza virus mutations. FASEB Journal 15, 1846‐+.
Nelson, L.E., Sheridan, M.A., 2006. Gastroenteropancreatic hormones and metabolism in fish. General and Comparative Endocrinology 148, 116‐124.
Ortuno, J., Esteban, M.A., Meseguer, J., 2002. Lack of effect of combining different stressors on innate immune responses of seabream (Sparus aurata L.). Veterinary Immunology and Immunopathology 84, 17‐27.
Rodeheffer, C., Shur, B.D., 2004. Characterization of a novel ZP3‐independent sperm‐binding ligand that facilitates sperm adhesion to the egg coat. Development 131, 503‐512.
Rotruck, J.T., Pope, A.L., Ganther, H.E., Swanson, A.B., Hafeman, D.G., Hoekstra, W.G., 1973. Selenium: Biochemical Role as a Component of Glutathione Peroxidase. Science 179, 588‐590.
Ruano, J., Fuentes, F., Perez‐Jimenez, F., Lopez‐Miranda, J., 2005. Pharmacogenetics of drugs influencing lipidic metabolism. Current Genomics 6, 115‐126.
Saviozzi, S., Calogero, R.A., 2003. Microarray probe expression measures, data normalization and statistical validation. Comparative and Functional Genomics 4, 442–446.
Shekels, L.L., Ho, S.B., 2003. Characterization of the mouse Muc3 membrane bound intestinal mucin 5 ' coding and promoter regions: regulation by inflammatory cytokines. Biochimica Et Biophysica Acta‐Gene Structure and Expression 1627, 90‐100.
Shrimali, R.K., Irons, R.D., Carlson, B.A., Sano, Y., Gladyshev, V.N., Park, J.M., Hatfield, D.L., 2008. Selenoproteins mediate T cell immunity through an antioxidant mechanism. Journal of Biological Chemistry 283, 20181‐20185.
Stapleton, S.R., 2000. Selenium: an insulin‐mimetic. Cellular and Molecular Life Sciences 57, 1874‐1879.
Staroscik, A.M., Nelson, D.R., 2008. The influence of salmon surface mucus on the growth of Flavobacterium columnare. Journal of Fish Diseases 31, 59‐69.
Surai, P.F., 2006. Selenium in Nutrition and Health. Nottingham University Press, Nottingham, UK.
Thorarinsson, R., Landolt, M.L., Elliott, D.G., Pascho, R.J., Hardy, R.W., 1994. Effect of dietary vitamin E and selenium on growth, survival and the prevalence of Renibacterium
206
salmoninarum infection in chinook salmon (Oncorhynchus tshawytscha). Aquaculture 121, 343‐358.
Toshima, J., Koji, T., Mizuno, K., 1998. Stage‐specific expression of testis‐specific protein kinase 1 (TESK1) in rat spermatogenic cells. Biochemical and Biophysical Research Communications 249, 107‐112.
Trousdale, R.K., Wolgemuth, D.J., 2004. Bromodomain containing 2 (Brd2) is expressed in distinct patterns during ovarian folliculogenesis independent of FSH or GDF9 action. Molecular Reproduction and Development 68, 261‐268.
Uttakleiv Ræder, I.L., Paulsen, S.M., Smalås, A.O., Willassen, N.P., 2007. Effect of fish skin mucus on the soluble proteome of Vibrio salmonicida analysed by 2‐D gel electrophoresis and tandem mass spectrometry. Microbial Pathogenesis 42, 36‐45.
van der Marel, M., Schroers, V., Neuhaus, H., Steinhagen, D., 2008. Chemotaxis towards, adhesion to, and growth in carp gut mucus of two Aeromonas hydrophila strains with different pathogenicity for common carp, Cyprinus carpio L. Journal of Fish Diseases 31, 321‐330.
von Schalburg, K.R., Rise, M.L., Brown, G.D., Davidson, W.S., Koop, B.F., 2005. A comprehensive survey of the genes involved in maturation and development of the rainbow trout ovary. Biol Reprod 72, 687 ‐ 699.
Walter, P.L., Steinbrenner, H., Barthel, A., Klotz, L.O., 2008. Stimulation of selenoprotein P promoter activity in hepatoma cells by FoxO1a transcription factor. Biochemical and Biophysical Research Communications 365, 316‐321.
Wang, C.L., Lovell, R.T., Klesius, P.H., 1997. Response to Edwardsiella ictaluri challenge by channel catfish fed organic and inorganic sources of selenium. Journal of Aquatic Animal Health 9, 172‐179.
Wang, Y.B., Han, J.Z., Li, W.F., Xu, Z.R., 2007. Effect of different selenium source on growth performances, glutathione peroxidase activities, muscle composition and selenium concentration of allogynogenetic crucian carp (Carassius auratus gibelio). Animal Feed Science and Technology 134, 243‐251.
Wassarman, P., Chen, J., Cohen, N., Litscher, E., Liu, C.Y., Qi, H.Y., Williams, Z., 1999. Structure and function of the mammalian egg zona pellucida, Spallanzani Symposium on Reproduction at the End of the Millennium, Pavia, Italy, pp. 251‐258.
Wolffram, S., Berger, B., Grenacher, B., Scharrer, E., 1989. Transport of selenoamino acids and their sulfur analogs across the intestinal brush‐border membrane of pigs. Journal of Nutrition 119, 706‐712.
Wu, X.M., Viveiros, M.M., Eppig, J.J., Bai, Y.C., Fitzpatrick, S.L., Matzuk, M.M., 2003. Zygote arrest 1 (Zar1) is a novel maternal‐effect gene critical for the oocyte‐to‐embryo transition. Nature Genetics 33, 187‐191.
207

Yeh, J.Y., Beilstein, M.A., Andrews, J.S., Whanger, P.D., 1995. Tissue distribution and influence of selenium status on levels of selenoprotein‐W. FASEB Journal 9, 392‐396.
208
Chapter XI . GENERAL
CONCLUS IONS
This dissertation represents two‐and‐a‐half years of research, directed by three major
themes: larval development, alternative sources of dietary proteins and lipids, and gene
expression in response to nutrition.
LARVAL DEVELOPMENT
The larval development of cobia was extensively studied in the first chapters, from external
and internal, morphological and physiological, digestive and sensory points of view. During fish
larval development, the following steps are critical to any cultured species: the transition from
endogenous to exogenous diet and from live prey to inert diet. Proper development ensures
low mortality rates during these critical transitions. In cobia, resorption of endogenous reserves
(yolk‐sac and oil globule) occurs around 145‐174od (5‐6 dph). Histological investigation revealed
that the gastrointestinal tract undergoes important changes during this period. However, these
changes are more dramatic between 290 and 464od (10‐16 dph), including re‐arrangement of
gut configuration with loops and valves. Concomitant to morphological changes, a dramatic
increase was observed in all studied digestive enzymes, except pepsin, as well as the formation
of external sensory organs, such as nostrils and the cranial canal system. Clearly, this point in
209
ontogenetic development constitutes a major onset in digestive capacity. It is also noteworthy
that no dietary manipulation explored in the present work hastened or delayed this transition,
which occurred at 12‐14 dph (348‐406od), even in taurine‐fed larvae. This suggests a strong
genetic influence at this level. However, as demonstrated by taurine supplementation studies,
dietary manipulations at optimum temperature may prepare the organism for an easier and
more efficient transition, subsequently resulting in higher survival, and faster development and
growth thereafter.
This has numerous and essential consequences from the farmer’s perspective. Live prey, as
well as being less reliable in terms of their nutritional adequacy, is more difficult and expensive
to produce than formulated diets. During larviculture, most of the mortalities occur prior to and
during weaning. Thus, larval rearing may be viewed as a race to weaning. In my studies, cobia
larvae were weaned between 696 and 783od (24‐27 dph), and based on the results from the
taurine‐fed larvae, there is little doubt that the weaning process can be compressed and with
better survival. However, more research is necessary to achieve this goal. Especially, studies of
brush border enzymes would provide valuable information regarding the transition between
intra‐ to extra‐cellular digestions. In addition, there is a general imbalance in knowledge and
understanding between lipid and protein nutrition in fish larvae, which is surprising in the
context of rapidly growing and developing organisms. Undoubtedly, more research in this area
would benefit larval rearing for various cultured species.
210
ALTERNATIVE PROTEIN AND LIPID SOURCES
The sixth and seventh chapters of this dissertation were dedicated to the refinement of
cobia juvenile nutrition through the replacement of fish meal and fish oil by various alternative
ingredients. Several main results arose from this series of experiments. First of all, cobia was
shown to grow efficiently on a wide variety of feedstuffs, which was somewhat surprising for a
marine carnivore. This “omnivorous tendency” adds to the long list of desirable traits and
characteristics of cobia, because it allows nutritionists to work with a greater range of
ingredients, which in turn facilitates choices that would combine biological performance, cost,
and respect for the environment (see Chapter I).
Second, it is unlikely that a single, natural ingredient could solely replace 100% of its fish
counterpart (i.e. meal or oil) without any detrimental impacts, and considering the economical
aspect as well as the volumes necessary to supply the global aquaculture industry. Rather, a
combination of several feedstuffs, selected not only for their intrinsic value, but also for their
complementarity, would be more realistic. Numerous factors must be taken into account when
attempting such replacements, and satisfactory results were herein attained by mixing multiple
feedstuffs. In fact, performance on experimental diets often surpassed that on fish meal‐based
control diet in experiments with cobia. No contaminants or degradation of the fish meal utilized
in the formulations were detected (data not shown), which suggests that the diversity of
ingredients may be beneficial for the fish. Indeed, the successful formulation of a fish meal‐ and
211
fish oil‐free diet that sustain cobia’s growth potential is, as shown in Chapter VII, technically
feasible.
Third, total replacement of fish meal and oil has been previously reported in other species,
including tilapia, rainbow trout and Atlantic cod. However, in marine carnivorous species, 100%
replacement often is reported with reduced growth and health issues (e.g. enteritis‐like
conditions). Hence, the results of the present studies are of primary importance, as I did not
observe any detrimental effects from the experimental diets. This may, upon further
investigation, assist in the replacement of both fish meal and fish oil for other carnivorous
species, which would contribute to alleviate the aquaculture‐related pressure on corresponding
fisheries (e.g. herring and menhaden).
However, the economic feasibility of these experimental formulations was not estimated,
since complete economic assessment was beyond the scope of this dissertation. Nonetheless, I
quickly explore this important aspect. Most of the alternative ingredients used here were
derived from soy, which is commonly used for this purpose. I discussed the advantage that
alternative ingredients are chosen among commodities. However, this implies that such
commodities are already traded on other markets, with which the aquaculture industry will
inevitably compete, and their price will fluctuate under the influence of the laws of supply and
demand. Consequently, we may witness shifts in the competitiveness of these ingredients.
From a solely environmental perspective, there is no need for an absolute and complete
replacement of fish meal and oil in diets of farmed aquatic species. Rather, aquaculturists must
212
achieve high‐enough replacement rates to produce seafood while respecting the capture
capacity of natural stocks and taking into account economic dynamics.
NUTRITIONAL GENE EXPRESSION PROFILING
The last chapters of this dissertation diverged from the applied science as it is traditionally
conducted in aquaculture to explore realms that were until recently dedicated to mammalian
and avian research, as well as other more basic scientific research. In aquaculture, diseases
constitute a major concern (see Chapter I), which drives an intense search for diets with
immuno‐stimulating properties. A few promising ingredients of particular interest have been
discovered so far. However, only a phenotypic response is usually measured (e.g. mortality
during a challenge, serum immunoglobulin levels, lysozyme activity, etc.), and the underlying
mechanisms remain poorly defined. When considering a function as complex as immunity, it is
important to understand these mechanisms in order to utilize these ingredients in the most
appropriate situations. By exploring the response of an organism at the gene level, results from
microarrays provide pieces of this complex puzzle and give us an insight into potential
mechanisms.
As previously reported, dietary mannan oligosaccharides (MOS) altered the expression of
several immune‐related genes, including MHC or complement component C3. However, against
expectations, transcription levels of mucin genes were not increased, neither did MOS influence
gut structure. This study is not the first to report inconsistencies in the effects of dietary MOS in
213
fish, which may elicit different responses according to the species, age, as well as past and
current health and nutritional status. It may be that the incorporation of MOS in formulations is
advantageous only under certain conditions, which, however, remain to be determined. In spite
of this, MOS already are utilized in aquaculture, and additional research investigating observed
inconsistencies would allow refinement in the use of this feed additive.
One aspect of the zebrafish response to dietary nucleotide enrichment was the stimulation
of immune function, and more particularly innate immunity. In general accord with previous
reports, I observed an increase in transcription levels of immune genes like MHC I UBA, RasGEF,
complement C7 and lysozyme components. However, a number of these genes are involved in
the signal transduction between leukocytes. In fact, most of the transcriptional responses to
dietary nucleotides involved signalling molecules, guanine‐based, cyclic AMP and other
secondary messengers. Such routes of action would be in accordance with some of the
paradoxes when it comes to the nutritional role of nucleotides: the de novo and salvage
pathway are sufficient for ensuring anabolic needs, and supplemental presence of nucleotides
then may associate with a variety of receptors, even after being processed by the intestinal
epithelium and/or liver. This may be of particular relevance for developing animals such as
larvae, since proper signalling is paramount to well canalized ontogenesis. However, more
directed research is necessary to establish which nucleotide family, or combination of families,
would best promote larval development, as well as determine a precise protocol (dose,
frequency, etc.) to this end.
214
The first striking aspect of the response of zebrafish to selenomethionine (Se‐met) was its
amplitude and expansion across the genome: almost two‐third of the 14,900 scanned
transcripts were significantly impacted by the mere addition of 0.06% of Se‐met in the diet,
which constitutes by far the most important overall response observed in the present research.
This clearly demonstrates the far‐reaching roles of selenium in fish. Indeed, in addition to the
known selenium‐containing proteins such as GPX, the regulation of a vast number of genes was
unforeseen since their relation to selenium was never expected. These include genes involved
in mucus production, gonad maturation, as well as insulin‐related pathways. This has direct
implications for the aquaculture industry: if dietary supplementation of Se‐met may benefit fish
health, metabolism and growth during larval and juvenile stages, it might hinder oocyte and
sperm production in broodstock. However, the extent of selenium impacts on fish physiology
raises numerous questions. Additional investigations on the complex effects of dietary selenium
and their inter‐relation must be conducted prior to recommending – or otherwise – the use of
this micronutrient in teleosts.
In conclusion, this series of gene expression studies not only confirmed the close
relationship between diet and gene expression, but also highlighted its relevance to applied
research. Indeed, the investigation of practical feedstuffs using transcriptomic tools led to a
better understanding of their roles and actions, hence allowing us to utilize them more
appropriately and efficiently. Nevertheless, transcriptomics only reveals a snapshot of the gene
expression profile at a specific time‐point. Time‐series experiments could provide valuable
insights on the sequence of mechanisms in place. In addition, proteomics would complete this
215

molecular approach by following the gene products to their respective biologically active forms.
Thus, there is no doubt that future investigations combining “omics” with traditional tools will
yield a more complete picture of the molecular mechanisms involved.
216
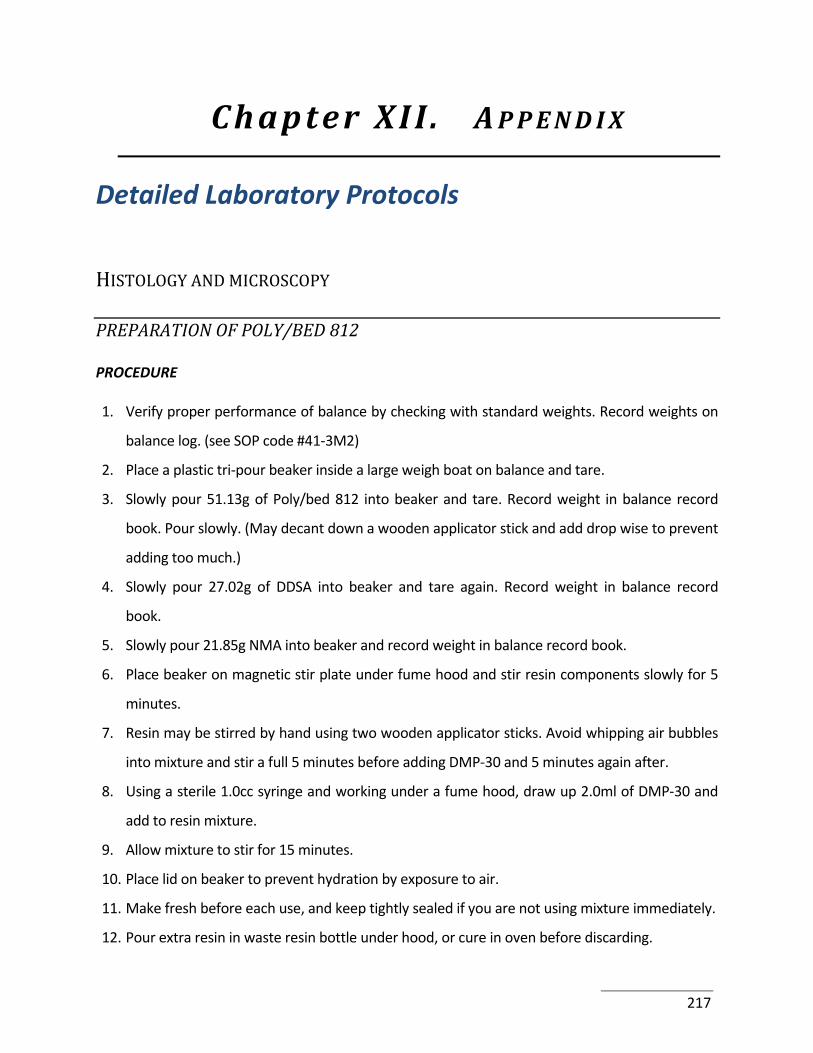
Chapter XII . APPEND IX
Detailed Laboratory Protocols
HISTOLOGY AND MICROSCOPY
PREPARATION OF POLY/BED 812
PROCEDURE
1. Verify proper performance of balance by checking with standard weights. Record weights on
balance log. (see SOP code #41‐3M2)
2. Place a plastic tri‐pour beaker inside a large weigh boat on balance and tare.
3. Slowly pour 51.13g of Poly/bed 812 into beaker and tare. Record weight in balance record
book. Pour slowly. (May decant down a wooden applicator stick and add drop wise to prevent
adding too much.)
4. Slowly pour 27.02g of DDSA into beaker and tare again. Record weight in balance record
book.
5. Slowly pour 21.85g NMA into beaker and record weight in balance record book.
6. Place beaker on magnetic stir plate under fume hood and stir resin components slowly for 5
minutes.
7. Resin may be stirred by hand using two wooden applicator sticks. Avoid whipping air bubbles
into mixture and stir a full 5 minutes before adding DMP‐30 and 5 minutes again after.
8. Using a sterile 1.0cc syringe and working under a fume hood, draw up 2.0ml of DMP‐30 and
add to resin mixture.
9. Allow mixture to stir for 15 minutes.
10. Place lid on beaker to prevent hydration by exposure to air.
11. Make fresh before each use, and keep tightly sealed if you are not using mixture immediately.
12. Pour extra resin in waste resin bottle under hood, or cure in oven before discarding.
217
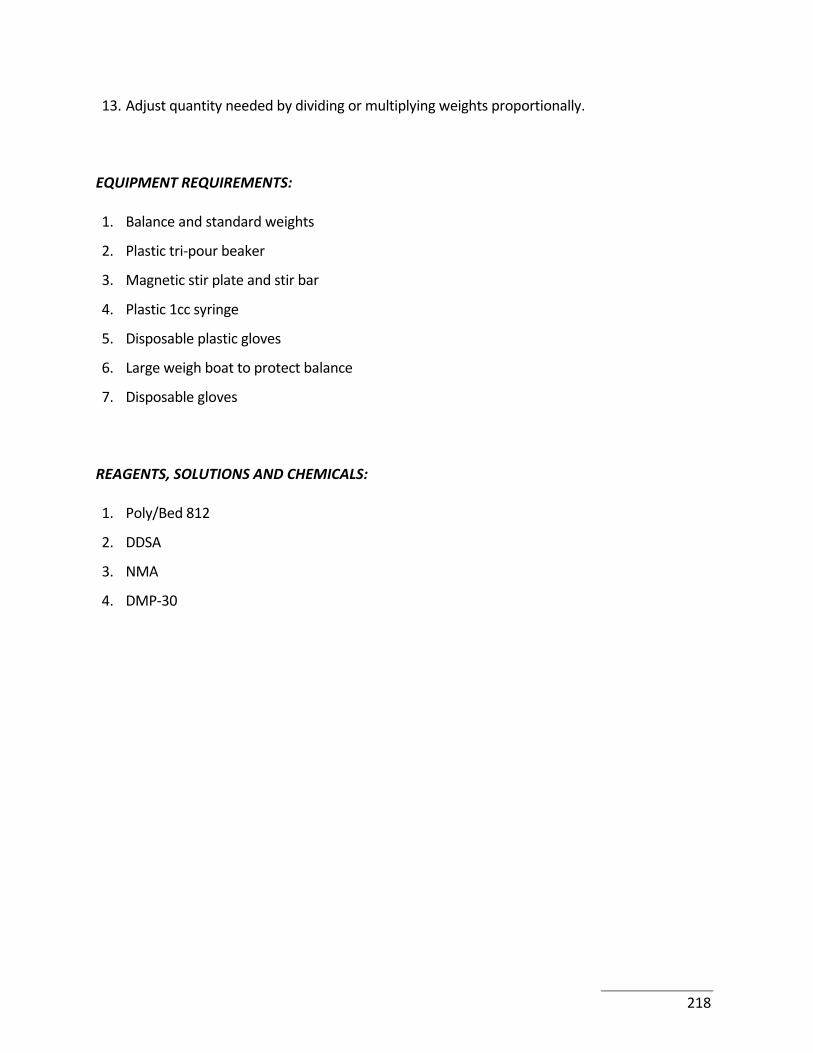
13. Adjust quantity needed by dividing or multiplying weights proportionally.
EQUIPMENT REQUIREMENTS:
1. Balance and standard weights
2. Plastic tri‐pour beaker
3. Magnetic stir plate and stir bar
4. Plastic 1cc syringe
5. Disposable plastic gloves
6. Large weigh boat to protect balance
7. Disposable gloves
REAGENTS, SOLUTIONS AND CHEMICALS:
1. Poly/Bed 812
2. DDSA
3. NMA
4. DMP‐30
218
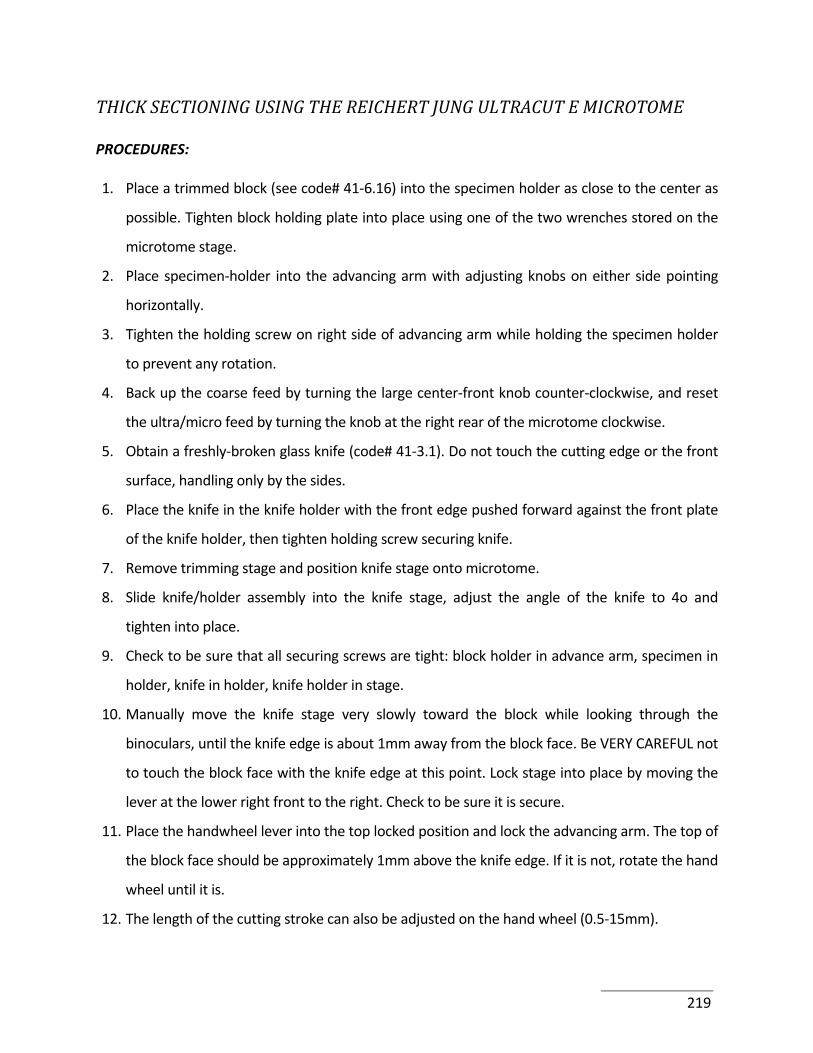
THICK SECTIONING USING THE REICHERT JUNG ULTRACUT E MICROTOME
PROCEDURES:
1. Place a trimmed block (see code# 41‐6.16) into the specimen holder as close to the center as
possible. Tighten block holding plate into place using one of the two wrenches stored on the
microtome stage.
2. Place specimen‐holder into the advancing arm with adjusting knobs on either side pointing
horizontally.
3. Tighten the holding screw on right side of advancing arm while holding the specimen holder
to prevent any rotation.
4. Back up the coarse feed by turning the large center‐front knob counter‐clockwise, and reset
the ultra/micro feed by turning the knob at the right rear of the microtome clockwise.
5. Obtain a freshly‐broken glass knife (code# 41‐3.1). Do not touch the cutting edge or the front
surface, handling only by the sides.
6. Place the knife in the knife holder with the front edge pushed forward against the front plate
of the knife holder, then tighten holding screw securing knife.
7. Remove trimming stage and position knife stage onto microtome.
8. Slide knife/holder assembly into the knife stage, adjust the angle of the knife to 4o and
tighten into place.
9. Check to be sure that all securing screws are tight: block holder in advance arm, specimen in
holder, knife in holder, knife holder in stage.
10. Manually move the knife stage very slowly toward the block while looking through the
binoculars, until the knife edge is about 1mm away from the block face. Be VERY CAREFUL not
to touch the block face with the knife edge at this point. Lock stage into place by moving the
lever at the lower right front to the right. Check to be sure it is secure.
11. Place the handwheel lever into the top locked position and lock the advancing arm. The top of
the block face should be approximately 1mm above the knife edge. If it is not, rotate the hand
wheel until it is.
12. The length of the cutting stroke can also be adjusted on the hand wheel (0.5‐15mm).
219
13. Adjust the lateral position of the knife so that the trimmed section is a little to the right of
center.
14. Place the hand wheel lever in the middle manual operation position.
15. Using small increments, advance the knife using the coarse feed (center front) knob. After
each advance, slowly crank the hand wheel once to make sure the knife is not too close.
16. Adjust angle of knife with respect to the trimmed block face.
• The rotation of the specimen in its mount is adjusted by using the Rotation knob
(thinner one on the specimen‐holder). This should initially be set at 90o, but may need
to be adjusted to accomodate for trimming imperfections. As the knife approaches the
block, adjust rotation so that the knife edge and lower edge of trimmed face are parallel
on the vertical plane. Do not cut at this point.
• The angle of the knife with respect to the trimmed block face is adjusted by turning the
long knob on the left side of the knife stage. Adjust so that the knife edge is parallel with
the lower edge of the face on the horizontal plane.
• The thicker knob on the specimen holder (tilt angle knob) adjusts the tilt of the block
face so that block face and knife edge are parallel at all points from top to bottom. Using
the shadow from the knife edge on the face of the block, determine the need for this
adjustment by manually moving the block up and down and watching for a consistently
even shadow width from top to bottom.
• Slowly approach the block face, using manual control, until sections are coming off onto
knife. Continue to advance 0.5 to 2.0 um at a time using the fine feed knob (large knob
on the left of the microtome) until complete face is being sectioned. Adjust knife angle if
only one side of block is being cut, or specimen tilt if only top or bottom are being
sectioned, always backing up knife and re‐advancing following any change in
adjustments.
17. Back the knife out and move it laterally to the right, lining the left center edge of the knife up
with the faced‐up block.
220
18. Re‐approach the block as described in steps 15 and 16, adjusting knife angle if necessary to
due to variations in edge.
19. Check the electronic control panel to see that the automatic feed is set on micro‐feed. It is the
bottom display marked "semi". Set the reading on 98 by pressing the appropriate + or –
buttons.
20. Begin cutting 1.0um sections by slowly and evenly turning the hand wheel on right of
microtome manually. Sections should come off shiny and intact. Check for visible knife marks.
Move the knife to a new position or replace if necessary.
21. Clear knife edge of section debris using compressed air.
22. Wet a small paint brush with distilled water and glide it close to, but not touching, the knife
edge until a small pool of water beads up against the cutting surface. You will see section
debris floating in this pool. Without touching the knife edge, pick up debris by rolling it onto
the brush.
23. Rinse brush thoroughly.
24. Obtain a clean microscope slide and wipe any dust or debris off with a kimwipe. Then place a
few drops of water on the slide, wipe again with the kimwipe and dry. Label the slide
according to sample.
25. Place several drops of distilled H2O on the slide, labeled side up.
26. Set speed between 1.0 ‐ 1.5 mm/sec.
27. Move the handwheel lever to the lowest position to begin automatic micro‐feeding. While
peering through the binoculars, slowly bring water from the paintbrush up to the knife edge.
As the section comes off the block, gently roll it onto the brush.
28. Gently roll the section off of the brush and onto the pool of water on the slide.
29. Rinse brush and repeat steps 27‐28 four to six times, discarding any sections that appear to
wrinkle.
30. Move hand wheel lever to middle or manual operation position and place slide with sections
onto hot plate for staining procedure (code# 41‐6.13; 41‐6.15).
221
EQUIPMENT REQUIREMENTS:
1. Reichert‐Jug Ultracut E Ultramicrotome
2. Glass knives
3. Small paint brush
4. Microscope slide
5. Trimmed TEM block
6. Kimwipes
7. Compressed air
8. Pipettes and bulbs
9. Hot plate
REAGENTS, SOLUTIONS AND CHEMICALS:
1. Distilled water
222
STAINING THICK SECTIONS WITH TOLUIDINE BLUE AND SAFRANIN O
PROCEDURES:
1. Place slide on hot plate set on "LO" or approximately 70o for at least five minutes to fix
sections onto slide.
2. Place 2‐3 drops of toluidine blue on slide.
3. Spread with toothpick to cover all sections.
4. Place slide back on hot plate for 7‐10 seconds or until metallic appearing ring forms around
edge of stain. Avoid allowing stains to dry onto slide before rinsing.
5. Remove slide and thoroughly rinse excess stain into waste stain beaker with a distilled water
wash bottle.
6. Using a kimwipe, remove any excess water from the underside of the slide.
7. Return slide to hot plate and leave on until excess water disappears.
8. Remove slide from hot plate and place 1‐2 drops safranin stain on slide.
9. Repeat step 3 using a different toothpick.
10. Place slide back on hot plate for 3 seconds.
11. Repeat steps 5‐7.
12. Remove slide from hot plate and check under light microscope for stain quality.
13. Pour waste stain from beaker into 1 gallon waste container labelled stains and record
amount.
14. Avoid skin contact with stains if at all possible. Can remove fairly well with "eradistain" cream.
EQUIPMENT REQUIREMENTS:
1. Hot plate
2. Slide with sections
3. 5.0ml plastic syringes with disk filters to hold stain
4. Toothpicks
5. Kimwipes
6. Waste containers for stain (beaker and gallon jug)
223
7. Wash bottle
REAGENTS, SOLUTIONS AND CHEMICALS:
1. Safranin O stain, 0.5% (see SOP code #41‐5C3)
2. Toluidine blue stain, 1% (see SOP code #41‐5C6)
3. Distilled water
224
CUTTING AND COLLECTING THIN SECTIONS FOR TEM
PROCEDURES:
1. Once the block is trimmed properly for thin sectioning (code# 41‐6.19), mount specimen
holder with block in the arm of the microtome.
2. Place a fresh glass knife in the knife holder of the microtome and adjust the tilt angle of knife
to 3‐4o.
3. Align block face with knife edge and adjust knife cutting angle and tilt of block face as needed
to achieve a knife approach parallel to the full face of the block.
4. Take a few sections with the glass knife to assure proper alignment. Make sure you are
getting complete sections of the cutting surface.
5. Back off the knife without changing the alignment established.
6. Remove glass knife and replace it with the diamond knife, (see code# for use and cleaning of
the diamond).
7. Fill the trough of the diamond knife with distilled water.
8. Adjust the water level so that the meniscus is concave and a silver reflection is apparent on
the surface, but water level is still even with the edge of the blade.
9. Make sure that the adjustments on the microtome advance are set for thin sections.
10. Carefully approach block face, advancing 1/2 micron at a time until you see the first indication
of a section come off the knife onto the water surface. DO NOT advance further after this
point but allow microtome to advance automatically as set for thin sections.
11. Section should be complete and even in color.
12. If you are only getting partial sections, back off diamond, adjust angle by 1/4 to 1/2o as
appropriate, and re‐approach as described in step 10.
13. If alignment is correct and block face is trimmed properly (top and bottom edges parallel),
sections should float into boat in a straight ribbon.
14. Check the thickness of the sections by observing the interference colors of light reflected from
the sections. Sections should appear silver to light gold in color.
225
15. Stop the microtome with the arm in the lower position when you have enough good sections
in the knife boat.
16. Ribbon may have to be broken into sections or sections moved into accessible position for
picking up. This can be done with a single eyelash or dog hair attached to an applicator stick
(hair may be cleaned in 10% nitric acid solution if it appears dirty or adheres to sections).
17. Sections can be picked up onto grids by several acceptable methods, including the following:
• Pick up new, dry grid with forceps and dip in 10% nitric acid.
• Rinse with distilled water and blot dry with triangle of filter paper.
• Position dull side over sections to be picked up and lower grid to touch surface.
• Lift grid, now containing sections, and blot dry from back (shiny) side.
• Store grids in 100% ethanol. Remove a few and air dry on filter paper before use.
• Pick up grid with forceps and carefully lower, at an angle of 30 to 45o, beneath the
surface of the water in front of sections.
• Move the grid under the sections.
• Slowly raise the grid, still at an angle, and pick up the sections.
• An eyelash or the side of the trough may be help to keep the sections centered on the
grid.
18. Take two to three grids of each block.
19. Hold grids in a petri dish until they are stained.
EQUIPMENT REQUIREMENTS:
1. Microtome (see codes# 41‐2.15, 41‐2.16)
2. Glass knives (see code# 41‐3.1)
3. Diamond knife (see code# 41‐6.20)
4. Block trimmed as described in code# 41‐6.16.
5. Filter paper, cut into triangles
6. Clean new 200 mesh grids (or size required)
226
7. Disposable pipette with bulb or dust‐off
8. Forceps
9. Eyelash
10. Interference color index and thickness scale card
11. Beaker
12. Petri dish
REAGENTS, SOLUTIONS AND CHEMICALS:
1. Distilled water
2. 100% ethanol
3. Nitric acid, 10%
227
STAINING THIN SECTIONS WITH 2% URANYL ACETATE AND LEAD CITRATE
PROCEDURES:
1. Procedure for 4 or fewer grids
2. Pipette small amount (about 5ml) of each stain (uranyl acetate and lead citrate) into screw
top centrifuge tubes, and cap loosely.
3. Spin for 5 minutes at speed #6 in IEC Clinical centrifuge.
4. Place square of dental wax in petri dish.
5. With pipette, place a small drop (approx. 5‐8mm in diameter) of uranyl acetate on dental wax
for each grid to be stained.
6. Float 1 grid on each drop, section side (dull side) down, place lid on petri dish and time for 12
minutes.
7. Rinse each grid either by holding in forceps and decanting distilled water down forceps and
over grid, or by moving each grid through a series of 4 or 5 drops of fresh distilled water. Rinse
thoroughly to prevent contamination.
8. Dry grids, using filter paper cut into triangles and place back into holder.
9. Place uranyl acetate drops into waste container and wash dental wax with distilled water.
10. Wipe dental wax dry with kimwipes.
11. Place sodium hydroxide pellets in petri dish and the place dental wax on top of them.
12. Minimize exposure of lead citrate to the air in order to prevent precipitation of lead crystals
on sections. (Lead precipitate can be removed by exposing grids to 10% acetic acid for 1
minute).
13. Place drops of lead citrate on dental wax as in step 4, then float each grid as before, section
side, place cover on dish and time for 5 minutes.
14. Rinse quickly and thoroughly with dist. water (step 6).
15. Dry grids and place in grid box, being careful to record grid identity on grid box formaldehyde.
16.
17. Procedure for more than 4 grids, using the Hiraoka Staining Kit (including plastic grid holder,
mounting block and staining tray) for multiple grid staining
228
18. Place plastic grid holder onto curved mounting block in order to open slots for receiving grids.
19. Carefully place grids into holding slots, being careful not to bend them.
20. With great care, lift plastic grid holder out of one end of block and bend back to a flat
position, thus closing slots and allowing grids to be grasped securely.
21. Place Staining tray into petri dish and fill to near overflowing with distilled water.
22. Invert grid holder with grids and place on staining tray, submersing grids into distilled water in
well. Let stand for about 2 minutes to wet surface of grids.
23. Remove grid holder, pour off water and fill well with uranyl acetate.
24. Replace grid holder, submersing grids into stain for 12 minutes. Pour used stain into waste
container for uranyl acetate and lead citrate.
25. Rinse grids with several changes (3 ‐ 5) of distilled water for 1 to 2 minutes each.
26. Place stain tray into petri dish, surrounded by NaOH pellets.
27. Fill well with lead citrate stain, replace grid holder, then petri dish cover and allow staining for
5 minutes.
28. Pour used stain into waste container and rinse grids as in step 8.
29. Pour rinse water in waste container.
30. Dry grids and place in grid box, being careful to record identity of each on grid box record
sheet.
31. Freshly cut grids offer the best staining properties.
EQUIPMENT REQUIREMENTS:
1. Petri dish
2. Dental wax (for procedure A)
3. IEC Clinical centrifuge
4. Pipettes and bulbs
5. Timer
6. Kimwipes and filter paper triangles
7. forceps
229
8. Waste container for used stains
9. Hiraoka Staining Kit (for procedure B)
10. Waste container for sodium hydroxide pellets
11. Grids with sections
12. Screw top centrifuge tubes
13. Test tube rack
REAGENTS, SOLUTIONS AND CHEMICALS:
1. Uranyl Acetate
2. Lead Citrate
3. NaOH pellets, Sodium hydroxide
4. Distilled water in squirt bottle
230
INSTRUCTIONS FOR USE OF LADD CRITICAL POINT DRYER
PROCEDURES:
1. Turn power switch on about 10 minutes before use.
2. Remove three knurled nuts from chamber door, remove door and check O ring to be sure it is
clean and seated correctly.
3. Replace chamber cover and tighten down the knurled nuts by tightening each one only ¼ turn
at a time until all three are tight. All three must be tightened gradually at the same time to
distribute pressure evenly.
4. Close all valves on chamber (vent, fill, drain and drain rate). Do not place undue force on vent
rate valve as copper threads may easily strip.
5. Open main CO2 tank valve fully. CAUTION….NEVER STAND IN FRONT OF THE CONNECTION
NOZZLE.
6. Open fill valve and vent valve, watching for CO2 level to rise on the glass front to
approximately 3/4 full. (Observe by standing to the side; do not stand directly in front).
7. Set timer for 5 minutes.
8. After 5 minutes, drain and vent chamber completely.
9. Close drain and vent valves and then repeat steps 6‐8 several times (5 to 8) until temperature
gage has dropped to between 10o and 15oC.
10. The CPD is now ready for samples (dehydrated in ethanol to 100%).
11. Close the main valve on the CO2 tank completely and open drain and vent valves to empty
chamber.
12. Specimens should be placed in appropriate holders or baskets while resting in a petri dish
filled with absolute ETOH to prevent them from drying out during this process.
13. Prepared sample baskets should now be first blotted briefly but thoroughly on a paper towel
to remove excess alcohol (without allowing samples to dry out), and then placed onto the
specimen carrier in the CPD chamber.
14. Place samples into chamber, check O ring and replace chamber cover as in step 3.
231
15. Fill and Vent/drain as in steps 6‐9 for 4 to 8 times depending on sample number and size.
Avoid draining completely as samples should remain covered with CO2 at all times. Record
number of fills on card attached to top of CPD. Allow samples to stand 5 minutes after each
fill.
16. Repeat procedure until "fog" has subsided in chamber during drain process, indicating alcohol
is gone.
17. When alcohol is gone, fill the chamber to 3/4 full and close all valves on chamber.
18. Close the main valve on the CO2 tank.
19. Turn the power switch to heat and begin to monitor the rise in temperature and pressure.
20. When the pressure reaches 1300‐1350, begin careful venting to maintain pressure in that
range until temperature reaches 42o at which point it will turn off automatically.
21. Set timer for 15 min and start timing at this point.
22. Begin to slowly drain off pressure with careful adjustments of the vent and vent rate valves.
Bleed off pressure at about 100 psi/minute, using the timer as a guide.
23. When pressure gage reaches 0, crack the knurled nuts on the chamber cover. If difficult to
loosen, wait a few minutes for all pressure to subside.
24. Turn power off and leave vent and drain valves open and chamber door loosely secured after
use.
25. Remove specimens to desiccator or mount on stubs (see SOP code# 41‐6D2, 41‐6D3).
26. Record date, investigator and acct# on card attached to top of CPD.
27. Make sure the main CO2 valve is completely closed when finished.
EQUIPMENT REQUIREMENTS:
1. Ladd Critical Point Dryer
2. Timer
3. Paper towels
4. Petri dish
5. Sample holders
232
6. Samples
REAGENTS, SOLUTIONS AND CHEMICALS:
1. Syphon CO2
2. Absolute ethyl alcohol
233
INSTRUCTIONS FOR USING THE SPIMODULE SPUTTER COATER
PROCEDURE:
1. Carefully remove the glass work chamber and metal top plate assembly.
2. Place mounted samples (see SOP code #41‐6D2, 41‐6D3 to be coated on the base plate.
3. Check O‐rings for debris and replace glass chamber and metal top plate assembly.
4. Turn "power" switch of the Central Scientific Co. mechanical pump to "ON".
5. Switch "ON" power to SPI‐Module Control Unit.
6. Switch "ON" power to SPI‐Module Sputter Coater. After 10 to 15 seconds the fall in pressure
within the work chamber will register on the vacuum gage.
7. Watch for the "Ready" light and "Power" light to illuminate when the pressure falls below
0.2mbar, indicating sufficient vacuum for the high voltage power to be applied.
8. When a vacuum of 0.04 ‐ 0.02mbar is reached, set timer to desired setting.
9. Open the gas leak valve very slightly until the chamber pressure just begins to rise (about
0.06mbar).
10. Depress the "test" button and notice plasma current level.
11. Adjust current level up or down as required by making slight changes in the gas leak valve
until an 18mA plasma current is obtained.
12. Depress the "START" button to deposit gold on sample. Re‐depressing the "START" button will
repeat the process to double the time as set.
13. After coating is complete, turn OFF power switches to the SPI‐Module control and Sputter
Coater units, and turn off the vacuum pump. The gas leak valve should also be closed.
14. "Vent" the work chamber by lifting the "vent" valve on top of the metal top plate of the
chamber.
15. Lift and set aside the work chamber, then remove the samples.
16. Samples should be viewed immediately or placed in holder and stored in desiccator.
17. Replace glass chamber and metal top plate assembly on baseplate.
234
EQUIPMENT REQUIREMENTS:
1. SPI‐Module Sputter Coater
2. Forceps
3. Desiccator
4. Sample holder
5. Critical point dried or air dried specimens
235
ENZYME ASSAYS
HOMOGENIZATION
PROCEDURE
1. Take the tubes containing frozen larvae out of the freezer to thaw;
2. Meanwhile, prepare dissecting microscope, scalpel, twizers. Chill two glass microscope slides
on ice. Prepare a shallow cup with ice under the dissecting microscope;
3. When larvae are thawed, place them on a chilled microscope slide under the microscope.
Dissect while keeping the slide on the ice. 3‐10 dph larvae are headed, 11‐16 dph larvae are
headed and tailed, 22‐27 dph larvae have their whole gut carefully removed;
4. Place pooled larvae in a etched‐glass tissue grinder for homogenization with homogenization
buffer (HB; 20mM Tris‐HCL, 1mM EDTA, 10mM CaCl2, pH=7.4): 50 μl per larva until 16 dph,
100 μl per larva for older larvae;
5. Grind the tissue carefully until a homogenous solution is obtained and no big debris is visible;
6. Transfer to centrifuge eppendorf tube, and repeat the procedure for all samples. Alternate
microscope slide in order to keep them chilled;
7. Centrifuge samples in a refrigerated micro‐centrifuge (14000 rpm, 15 min, 3oC) to separated
cellular debris, and transfer supernatant (avoid possible top fat layer) to another set of
eppendorf tubes;
8. Analyze immediately or freeze at ‐80oC.
EQUIPMENT AND REAGENTS:
1. Dissecting microscope
2. Dissection kit: scalpel, twizers
3. Refrigerated micro‐centrifuge
4. Tris‐HCl pH=8 (Sigma‐Aldrich #93378)
5. EDTA (Sigma‐Aldrich #E5134)
6. CaCl2 (Sigma‐Aldrich #C1016)
236
TRYPSIN ASSAY
PROCEDURE
1. Prepare trypsin assay buffer (TAB): 0.01 M CaCl2, 0.04 M Tris‐buffer, pH=8. Mix 0.222 g CaCl2
and 1.134 g of Tris‐buffer in 200 ml distilled water. Store at 4oC for 3 months;
2. Prepare substrate solution (TSAS): 1.5x10‐3 M TAME. Mix 29.3 mg of TAME in 50 ml TAB.
Store TAME at ‐20oC, and TSAS at ‐80oC;
3. If frozen homogenates are used, thaw at room‐temperature. Re‐centrifuge if necessary
(14000 rpm, 2 min, 3oC) and dilute the 22 and 27 dph samples to 25% of full strength with
homogenization buffer (HB);
4. Prepare standard series: prepare mother solution by dissolving 15 mg purified trypsin in 15 ml
TAB. Dilute 100 times to obtain a 10 μg ml‐1 solution. Do 5 serial dilutions to obtain the
standard series: 10, 5, 2.5, 1.25, and 0.625 μg ml‐1;
5. Turn on the spectrophotometer, and set temperature to 30oC;
6. In a UV‐transparent 96‐well plate, pipette 100 μl of distilled water (blank), standard, or
sample in designated well. Run all samples in duplicate. Pre‐incubate at 30oC for 3 min;
7. Using a channel pipette, add 200 μl TSAS in each well as quickly and cleanly as possible. Avoid
splashing and touching the plate with pipette tips;
8. Plate the plate in spectrophotometer and read the increase of absorbance at 247 nm for 8
min
237
EQUIPMENT AND REAGENTS:
1. UV capable spectrophotometer
2. UV‐transparent 96‐well plates (Fisher Scientific #EK25801)
3. Refrigerated micro‐centrifuge
4. Micro‐pipettes
5. CaCl2 (Sigma‐Aldrich #C1016)
6. Tris‐HCl pH=8 (Sigma‐Aldrich #93378)
7. Nα‐P‐Tosyl‐L‐Arginine methyl ester Hydrochloride, TAME (Fisher Scientific #AC13920)
8. Purified trypsin from bovine pancreas (Sigma‐Aldrich #T1426)
238
PEPSIN ASSAY (adapted from Ryle, 1984)
PROCEDURE
1. Turn on the water‐bath and set at 30oC;
2. Prepare the trichloroacetic acid (TCA) solution by mixing 20 g TCA into 500 ml of distilled
water;
3. Prepare the neutral haemoglobin (Hb) solution by mixing 2.5 g of purified bovine
haemoglobin into 90 ml of distilled water in a beacher with vigorous mixing. Store at 4oC for
up to two weeks;
4. Prepare acid Hb solution with a 0.3 M HCl solution 4:1 (v:v). This solution must be used within
24h.
5. Prepare standard series: dissolve 10.4 μg of purified porcine pepsin in 10 ml distilled water
buffered at pH=4.1 to create a 30 μM solution. Create the standards by serial dilutions: 30, 15,
7.5, 3.75, 1.875, 0.938, 0.469, 0.234 μM. Standard solution may be frozen at ‐80oC for the
next analysis;
6. In 15 ml tubes, pipett 15 μl of distilled water, standard, or sample;
7. Pipett 1 ml of acidified Hb solution;
8. Incubate at 30oC for 30 min exactly;
9. Stop the reaction by introducing 5 ml TCA solution in each tube. Shake;
10. Centrifuge the tubes at 1000 G for 10 min;
11. Transfer ~1 ml of the supernatants into UV‐transparent cuvettes;
12. Read the absorbance (endpoint) at 280 nm.
EQUIPMENT AND REAGENTS:
1. UV capable spectrophotometer
2. UV‐transparent cuvettes semi‐micro (Fisher Scientific # 13‐688‐74)
3. Centrifuge
4. Stirring plate
5. Micro‐pipettes
239

240
6. 0.3 M HCl solution
7. trichloroacetic acid (Sigma‐Aldrich #T9159)
8. Haemoglobin (Sigma‐Aldrigh #H2625)
9. Purified pepsin (Sigma‐Aldrich #P7012)