nutrient availability under trickle irrigation: ii. mineral nitrogen1
TRANSCRIPT

Nutrient Availability Under Trickle Irrigation: II. Mineral Nitrogen1
P. E. BACON AND B. G. DAVEY2
ABSTRACT
The effects of irrigation and fertilizer application on nitrate, nitrite,and ammonium concentration in a Chromic Luvisol were studied inan orchard that had been trickle irrigated for 5 years. Immediatelybefore the first irrigation of the season, mean plot nitrate-N was 5ppm; 8 h of irrigation reduced this to 0.5 ppm. Nitrite concentrationfell from 0.8 to 0.4 ppm in the same period. During irrigation am-monium concentration rose from 7.1 to 13.5 ppm (the average rateof increase being 0.8 ppm/h) in the surface 6-cm depth of soil ex-tending up to a distance varying from 30 to'65 cm from the outlet.There was no evidence that nitrate or nitrite accumulated at the A/B horizon boundary and it is likely that the loss was due todenitrification.
Ammonium concentration decreased rapidly as the soil dried outand 8 h after the end of irrigation it had fallen from 13.5 to 8.5 ppm.As there was no change in the nitrate concentration in this regionduring the same 8-h period the ammonium was being immobilizedrather than nitrified. The only place where nitrification took placeduring the first 3-d cycle was immediately below the fertilizer bandat site D where nitrate concentration rose from 0 to 15 ppm in 3 d.Mean plot nitrate-N at the end of the first cycle was 2.6 ppm. Some32 cycles later at the beginning of the midseason 3-d cycle nitrate-Nhad fallen to 0.6 ppm. Neither nitrate nor nitrite varied with timeduring the midseason 3-d cycle. Ammonium concentration rose sig-nificantly over the region extending from at least 12 cm below thesurface under the outlet to the 3- to 6-cm depth 65 cm away fromthe outlet. Over this volume of soil ammonium-N increased from 3.9to 19.4 ppm during irrigation. In the 4 h after the end of irrigationthe ammonium concentration decreased and there was no significantdifference between the pre- and post-irrigation ammonium concen-trations within the volume defined above. Apparently all the am-monium released during irrigation and not taken up by plants wasimmobilized by the soil microbial population. The amount of am-monium released was greater in the midseason (15.5 ppm) than inthe first 3-d cycle (6.4 ppm). Ammonium release rate during themidseason irrigation was 1.3 ppm N • h~'. There were no significantchanges in nitrate, nitrite, or ammonium during the midseason 1-dcycle.
The results obtained for five 3-d irrigation cycles in early summeragain demonstrated that the decrease in nitrate during the irrigationcycle was accompanied by an increase in ammonium. The phenomenawas part of a continuous cycle which increased the mineral nitrogenavailability during the wet portion of every 3-d cycle.
Additional Index Words: ammonium release, wet-dry cycles, nitraterelease, nitrate loss, nitrite availability, anaerobic conditions, dripirrigation.
Bacon, P. E., and B. G. Davey. 1982. Nutrient availability undertrickle irrigatiion. II. Mineral nitrogen. Soil Sci. Soc. Am. J.46:987-993.
ALTHOUGH trickle irrigation has been used for thepast 10 years, very few studies have been made
of the availability of nitrogen under this system ofirrigation. Several papers (Bar-Yosef and Sheikhols-lami, 1976; Miller et al., 1976; Jawarski et al., 1978)have examined the response of plants to applied ni-trogen in trickle irrigation systems. Nitrogen distri-bution in the soil following short periods of trickleirrigation were investigated by Goldberg et al. (1971)and Keng et al. (1979). None of these experimentsattempted to relate the effect of fertilizer applicationand irrigation management to gains and losses of ni-trogen in the soil.
The aim of these experiments was to examine thedistribution of nitrite, nitrate, and ammonium in timeand space in the soil around trickle-irrigated trees andto relate the observed distribution patterns to soilphysical properties and biochemical processes.
MATERIALS AND METHODS
Site ConditionsSite conditions are described in detail in Bacon and Davey
(1982). Briefly, the experiments were carried out in an or-chard containing a range of perennial horticultural trees lo-cated on the Agricultural Research Centre, Yanco, Australia(34°34'S, 146°34'E) between 1974 and 1977. The orchard hadbeen trickle irrigated from establishment (1969) onwards.Table 1 shows the experimental conditions used. Water wassupplied according to plant requirements (Doorenbos andPruitt, 1975) either daily or every 3 d, depending on theexperiment at 7.5 L/h through a single outlet placed 10 cmfrom the base of each tree.
Fertilizer application methods are described elsewhere(Bacon and Davey, 1982), and consisted of annual appli-cations of 260 g of N as ammonium nitrate and 58.5 g ofP as single superphosphate per plant spread in two bandsbetween 50 and 80 cm from and parallel to the tree rows.Ten cycles prior to the multicycle experiment, an additional58.5 g of P as superphosphate and 260 g of N as ammoniumnitrate was broadcast evenly over the area (3.7 by 1.85 m)surrounding each tree.
1 Contribution from Yanco Agricultural Research Centre, N.S.W.Dep. of Agriculture, Yanco, 2703, N.S.W., and the Dep. of SoilScience, Univ. of Sydney, 2006, N.S.W. Australia. The work wassupported by a research grant from the N.S.W. Dep. of Agric. andthe Univ. of Sydney. Received 9 Sept. 1981. Approved 27 Apr.1982.
2 Senior Chemist, N.S.W. Dep. of Agric, Agric. Res. Ctr., Yanco,N.S.W. 2703; and Senior Lecturer in Soil Science, Univ. of Sydney,N.S.W. 2006, Australia, respectively.

988 SOIL SCI. SOC. AM. J . , VOL. 46, 1982
Table 1—Outline of trickle irrigation experiments.
CropDateDurationDuration of watering, h
Attribute measuredNumber of sampling timesReplicationSampling sites, distance
from outlet (cm)
First 3-d cycle of theirrigation season
PeachesNovember 19743-d cycle8
NO,, NO,, NH,72A (0 cm), B (15), C (30),
D (65 cm perpendicular to
Midseason 3-d cycle
PeachesFebruary 19753-d cycle12
NO,, NO,, NO.72As for 1st 3-d cycle
Midseason 1-d cycle
PeachesFebruary 19751 single-d cycle4
NO,, NO2, NH4
42As for 1st 3-d cycle
Multicycle
Peaches, apples, grapesDecember 1976Five 3-d cyclesVaried with evaporation,
average 11. 25 hNO,, NH.253A (15) and B (30) cm
Sampling depths, cm
Fertilizer application,late spring
tree row in fertilizer band)E (65 cm parallel to tree row)
1 (0-3 cm), 2 (3-6), 3 (6-9),4 (22-25)
775gNH4NO3 + 500 gsuperphosphate banded50 to 80 cm from outlet
1(0-3), 2(3-61,3(9-12),4 (22-25 cm)
As for first 3-d cycle
As for mid season 3-d cycle
As for first 3-d cycle
1 (0-3), 2 (3-6) cm
As for first 3-d cycle. Plussame quantity broadcast10 3-d cycles prior toexperiment
Table 2—Coefficients of variation for sampling error andexperimental error for nitrate and nitrite, t
Nitrate Nitrite Ammonium
SamplingErrorExperimentalError
Site ASiteDSite ASiteD
27.692.067.4
135.6
27.0124.799.9
166.1
20.333.797.0
157.7
t First 3-d cycle, under the outlet (Site A) and under the fertilizer band(Site D), 0 to 3 cm below the surface.
Soil PropertiesThe soil profile used belonged to the Merungle loam se-
ries, principal profile form Dr 2.23 (Northcote, 1974), andis classified as a Chromic Luvisol in the world classificationscheme. Some characteristics of a reference soil situated1 km away are presented elsewhere (Bacon and Davey,1982). The major difference between the reference soil andthe soil used in the study is the thickness of the A horizon.The profile has a sharp transition between the sandy loamA2 horizon and the subplastic medium clay B horizon whichtakes place over a maximum distance of 2 cm at a meandepth of 23 cm below the surface. This boundary occurredat 40 to 50 cm at the reference soil site (Bacon and Davey,1982). The A/B transition was particularly constant over theexperimental plots and never varied by >2 cm, consequentlyall of the samples collected at depth 4 (22 to 25 cm) werealways dominated by the B horizon. The saturated hydraulicconductivity of the profile changed from 8.6 to 0.1 x 10~4
cm/s at this boundary, so that the sampling procedure wasvery likely to collect any nitrate or nitrite that had beenleached by the infiltering irrigation and had accumulated atthe surface of the B horizon.
Sampling and AnalysisSoil samples were collected with 5 cm i.d. tubes driven
into the soil with a percussion hammer. In the first 3-d cycleand the multicycle experiments the soil was cut into ap-propriate segments, tightly wrapped in black polythene, andplaced in a deep freezer within 3 to 5 min of collection. Thesoil samples were later quickly thawed and approximately10 g (weighed to 0.001 g) added to 100 cm3 of \M KC1 forammonium or distilled water for nitrate and nitrite analyses.The suspension was then vigorously shaken for 30 min, andfiltered through Whatman no. 42 filter paper.
There was some concern that the time taken to freeze thelarge numbers of samples collected in the single-cycle stud-
ies could allow continued microbial activity, therefore in themidseason cycle, preweighed bottles containing frozen ex-tractant were taken to the field and a subsample of ap-proximately 10 g of soil was placed in the bottles within 2to 3 min of sampling. The bottle was shaken to allow somemixing of the soil and the thawing extractant. They werethen placed in insulated boxes and transported to thefreezer. The bottles were later rapidly thawed, shaken vig-orously for 30 min, and the suspension filtered throughWhatman no. 42 filter paper. Soil moisture content wasdetermined by oven drying at 105°C for 3 to 4 d. All sampleswere corrected for soil water content. Nitrate was analyzedusing the technique of Mullin and Riley (1955). Absorbancewas read at 520 nm with a Varian UV-Vis spectrophotometer.
Nitrite was determined on a 10-cm3 subsample of thewater extract. This was mixed in 5 cm3 of the sulphanilamidereagent (1.25 g of sulphanilamide in 250 cm3 of 1:1 waterto concentrated hydrochloric acid). After standing for 2 min,2 cm3 of coupling reagent (0.5 g JV-1-naphthylethylene-dia-mine dihydrochloride in 100 cm3 water) was added. Theabsorbance was determined at 540 nm with a Varian UV-Vis spectrophotometer.
Ammonium concentration of the KC1 extract was deter-mined colorimetrically using salicylic acid and sodium di-chloroisocyanurate (Pym and Milham, 1976). Absorbancewas determined at 650 nm with a Varian UV-Vis spectro-photometer.
Statistical AnalysisMuch of the data was not normally distributed so the data
was transformed to Iog10 (N + 1) to standardize the variancebefore analysis of variance. The regressions of ammoniumand nitrate on soil water content for sites A and B wereobtained from the data for depths 1 and 2 for all 25 samplingtimes and three replicates in the multicycle experiment. Theequations for depths 1 and 2 utilized data for sites A andB. The errors quoted are the conventional standard errorsfor the slope and intercept.
The within-plot variability was measured by analysis oftwo separate cores from each sampling site, while the be-tween-plot variability was examined by comparison of rep-licates (Steel and Torrie, 1960).
The within-plot variability (sampling error) was higherunder the fertilizer band (site D) than under the outlet (siteA) (Table 2). The sampling error accounted for 41% of theexperimental (between-plot) error in nitrate concentrationmeasurement at site A and 68% at site D. The corresponding

BACON & DAVEY: NUTRIENT AVAILABILITY UNDER TRICKLE IRRIGATION: n. 989
distance fromsite outlet (cm).A 0
1530
D 65(fert)65
Hours since start of irrigation.Fig. 1 — Nitrate concentration at five sites (each mean of four depths).
First 3-d cycle.
figures for nitrite were 27 and 75% while those for ammo-nium were 21% at both sites. The higher within-plot vari-ability at site D for nitrate and nitrite reflect localized vari-ation in fertilizer distribution and soil properties.
RESULTS AND DISCUSSIONFirst Three-Day Cycle
The first 8-h irrigation of the season significantlyreduced nitrate concentration at all sites (except E)as Fig. 1 shows. Plot mean nitrate-N decreased from5 to 0.5 ppm, and the fall was significant at all sitesexcept E where the pre-irrigation nitrate concentrationwas already very low. This nitrate had disappearedfrom the infiltrating solution by the time the wettingfront had reached depth 4; on average 9.8 ppm NO3-N was present in the top 9 cm of soil immediatelybelow the outlet (site A) prior to irrigation; 8 h laterthere was 0.5 ppm. Prior to the wetting front reachingthe A/B horizon boundary at site A there was 0.5 ppmnitrate-N present at the boundary. Eight hours later,following the arrival of the wetting front, there was1.3 ppm NO3-N present, leaving 90% of the initialnitrate unaccounted for. The rate of uptake of NO3-N by citrus trees is about 0.5 ppm/d (Chapman andParker, 1942; Huffaker and Rains, 1978). This estimateseems reasonable as it is known that many trees ab-sorb ammonium in preference to nitrate (Frith andNichols, 1975a). As plant roots could not have re-moved the nitrate, the only other process likely tohave been operative is denitrification. The importanceof denitrification in unsaturated soil has been stressedby Broadbent (1973), Guenzi et al. (1978), and Hsiehet al. (1981). The very low levels of nitrate inducedby the denitrification process would allow the redoxpotential of the soil to decrease, and the reduction offerric iron to commence, leading to an increase inBray no. 1 phosphate as observed by Bacon andDavey (1982).
Prior to irrigation the highest concentration of nitritewas found below the fertilizer band where the nitri-fication rate was also reduced by the high ammonium
distance fromsite outlet [cm]»A 0.B 15oC 30, ,vD 65ferta E 65t soil samplings
differenttimedifferentsites
20 40Hours since start of irrigation.
Fig. 2—Nitrate concentrations during the first 3-d cycle—mean offour depths.
content (Quastal, 1965) and by a soil pH of 4.75 whichwas close to the pH causing total inhibition of nitri-fication (Alexander, 1965). Eight hours of irrigationreduced nitrite concentration to 0.2 ppm; the otherchanges recorded during this period were not signif-icant (Fig. 2).
Nitrite concentration, like that of nitrate, fell as theirrigation water moved into the soil. Most had dis-appeared before the arrival of the wetting front at thedeepest sampling depth and it was denitrified alongwith the nitrate (Campbell and Lees, 1967; Ponnam-peruma, 1972).
Ammonium concentration increased from 7.1 to13.5 ppm in the surface 6 cm of soil extending 30 to65 cm from the trickle outlet. This represents an av-erage ammonification rate of 0.8 ppm/h reflecting mi-crobial excretion of excess nitrogen. This process ismost important when low oxygen concentration pre-vents oxidation of ammonium to nitrate (Acharya,1935; Tusneem and Patrick, 1971; Ponnamperuma,1972).
The average nitrate concentration rose at a rate ofabout 1 ppm/d as the soil dried out but this was mostlydue to the rapid increase in nitrate immediately belowthe fertilizer band at site D (Fig. 1). In the 3 cm belowthe fertilizer band, nitrate-N concentration increasedfrom 0.3 to 15 ppm in 56 h which was in contrast tothe unfertilized site (site E) where the increase wasfrom 0.1 to 1.2 ppm. Nitrite-N increased in a similarway to nitrate at site E.
Ammonium concentration decreased as the soildried out and most of the change took place in the8 h following the end of irrigation. For example, themean ammonium concentration in the surface 6 cmof soil extending up to 30 cm from the outlet fell from13.5 to 8.5 ppm in the 8 h after irrigation; 48 h laterit was 4.3 ppm. Some of the ammonium would havebeen nitrified during the drying phase and some am-
990 SOIL SCI. SOC. AM. J . , VOL. 46, 1982
m
umPPm
Depth cm* 0 3
2 . 3-63 a 9-124 o 22-2S
O lOotf ' 30 50Hours since start of irrigation.
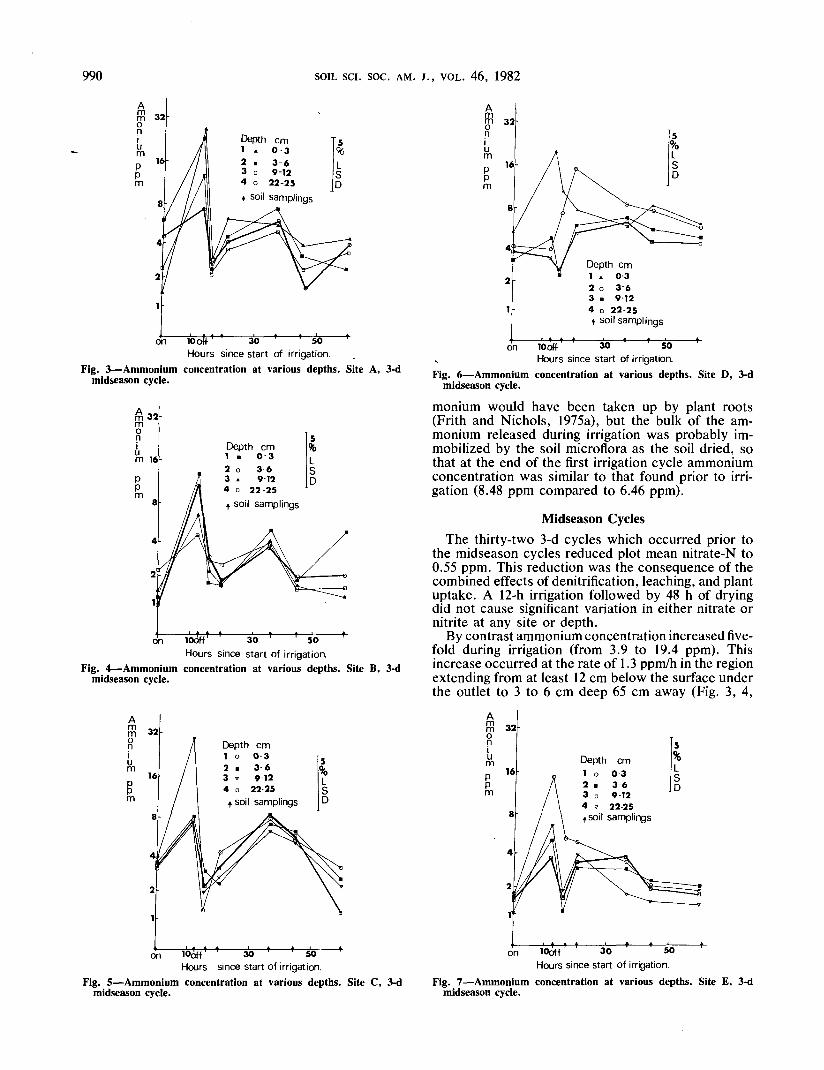
Fig. 3—Ammonium concentration at various depths. Site A, 3-dmidseason cycle.
looff1 30 ' ' 5 0Hours since start of irrigation.
Fig. 4—Ammonium concentration at various depths. Site B, 3-dmidseason cycle.
Ammonim
Depth cm1 o 0 32 • 3 63 , 9 124 D 22 25t soil samplings
30 ' ' 50since start of irrigation.
Fig. 5—Ammonium concentration at various depths. Site C, 3-dmidseason cycle.
AoniumPPm
Depth cm1 i 032 o 3 63 . 9 124 D 22 25t soil samplings
... lOoFf 30 ^50^ Hours since start of irrigation.Fig. 6—Ammonium concentration at various depths. Site D, 3-d
midseason cycle.
monium would have been taken up by plant roots(Frith and Nichols, 1975a), but the bulk of the am-monium released during irrigation was probably im-mobilized by the soil microflora as the soil dried, sothat at the end of the first irrigation cycle ammoniumconcentration was similar to that found prior to irri-gation (8.48 ppm compared to 6.46 ppm).
Midseason CyclesThe thirty-two 3-d cycles which occurred prior to
the midseason cycles reduced plot mean nitrate-N to0.55 ppm. This reduction was the consequence of thecombined effects of denitrification, leaching, and plantuptake. A 12-h irrigation followed by 48 h of dryingdid not cause significant variation in either nitrate ornitrite at any site or depth.
By contrast ammonium concentration increased five-fold during irrigation (from 3.9 to 19.4 ppm). Thisincrease occurred at the rate of 1.3 ppm/h in the regionextending from at least 12 cm below the surface underthe outlet to 3 to 6 cm deep 65 cm away (Fig. 3, 4,
AmmoniumPPm
16Depth cm1 o 0-32 . 3 63 D 9-124 v 22-25^ soil samplings
looff 30 50Hours since start of irrigation.
Fig. 7—Ammonium concentration at various depths. Site £, 3-dmidseason cycle.

BACON & DAVEY: NUTRIENT AVAILABILITY UNDER TRICKLE IRRIGATION: 11. 991
Fig. 8—Effect of irrigation on nitrate concentration. Mean of allpositions during five 3-d irrigation.
5,6, and 7). The soil volume and the rate of increasewas greater in the midseason than in the first cycle,reflecting the longer irrigation period of 12 h comparedwith 8 h in the first cycle. The higher soil temperaturesin the summer compared with spring and the lowersoil moisture content prior to irrigation (Bacon andDavey, 1982) would accentuate the Birch effect (Birch,1958, 1960, 1964) on rewetting. The fall in ammonium-N was extremely rapid (from 19.4 to 4.3 ppm or 3.8ppm/h) following the end of irrigation. As no increasein nitrate-N was recorded and the rate of loss was toolarge for plant uptake (Reisenauer, 1978), the am-monium must have been adsorbed by the soil microflora.
The change in mineral nitrogen during a single-daycycle involving irrigation for 4 h was studied at thesame time as the midseason 3-d cycle. The cycle stud-ied was the 31st in a series of 1-d cycles, each re-ceiving an average of 4 h of irrigation. Plot meannitrate was lower in the single-day cycle than in theconcurrent 3-d cycle (0.3 compared to 0.6 ppm). Thusreducing the period of high water content, and there-fore reducing the possibility of denitrification, did notincrease the concentration of nitrate-N in the soil.Nitrite concentration was also very low (0.1 ppm)during the midseason 1-d cycle. Neither nitrate nornitrite concentration varied significantly during thiscycle.
Ammonium-N concentration also did not changeduring the 4-h irrigation (3.54 compared with 3.71ppm) over the region 0 to 6 cm deep and 0 to 30 cmfrom the outlet. The increase during irrigation in thesame soil region during the corresponding 3-d cyclewas 21 ppm. This shows that > 4 h at high soil watercontent is required to create conditions necessary forammonium release.
Multicycle ExperimentExamination of five 3-d cycles some ten 3-d cycles
after application of nitrogenous fertilizer revealed es-sentially the same pattern as was found in earliercycles (Fig. 8). Nitrate-N concentration fell duringirrigation at a rate of 9.5 ppm/d and then rose to pre-irrigation concentration as the soil dried out. This
A81niumI
160
100
40
Fig. 9—Ammonium-N concentration at two sites during five irrigationcycles. Mean of two depth.
pattern was very similar to that found under the fer-tilizer band in the first cycle of the season. It is likelythat each cycle produced a sequence of denitrificationfollowed by nitrification.
Changes in ammonium concentration also followedthe pattern found in the earlier cycles: mean ammo-nium concentration immediately prior to irrigation was57.7 ppm, significant increases (at the rate of 4.1 ppm/h) were noted 7 to 9 h after the start of irrigation, withmaximum concentration (mean 99.3 ppm NH4-N) oc-curring several hours after the end of irrigation (Fig.9). Soil water content at this time was still above fieldcapacity (Bacon and Davey, 1982) and near the mois-ture content considered optimal for ammonification(Miller and Johnson, 1964; Stanford and Epstein,1974). The ammonium concentration fell rapidly (av-erage of 5.6 ppm/h) as the soil dried out, and a sig-nificant decrease was observed between 12 and 24 hafter irrigation. These rates of change in ammoniumconcentration are higher than those recorded by Stan-ford and Epstein (1974) and Stanford et al. (1975) andreflect intense microbial activity frequently reportedin rewetted soil (Stevenson, 1956; Van Schreven,1967).
Relationships between Soil Water Content andMineral Nitrogen
Regression analysis (Table 3) showed there weresignificant correlations between nitrate and soil watercontent and between ammonium and soil water con-
Table 3—The relationships between mineral N and soil watercontent during the multicycle experiment.
A. Relationship between nitrate and soil water contentSite 1(15 cm) NOS-N = 12.2 (SE 1.2) - 34.3 (4.8)9Site 2 (30 cm)Depth 1 (0-3 cm)Depth 2 (3-6 cm)
NO,-N = 15.4(1.2) - 34.3(4.8)9NOj-N = 15.0(1.2) - 34.3(4.8)9NO.-N = 12.6(1.2) - 34.3(4.8)9
B. Relationship between ammonium and soil water contentSite 1 (15 cm) NH.-N ppm = 19.2 (SE 8.8) + 334.4 (50.7)9Site 2 (30 cm) NH.-N ppm = 37.8 (8.8) + 334.4 (50.7)9Depth 1 (0-3 cm) NH.-Nppm = 41.3(11.6) + 199.4(71.6)9Depth 2 (3-6 cm) NH.-N ppm = 15.7 (11.6) + 469.4 (71.6)9

992 SOIL sci. soc. AM. J., VOL. 46, 1982
tent. These relationships applied over the full rangeof moisture contents in the multicycle experiment.
The rate of fall in nitrate concentration with in-creasing soil water content was the same for all po-sitions sampled in the multicycle experiment. Thedifferent intercept values are related to changes inleaching intensity with change in distance from thetrickle outlet.
The rate of change in ammonium concentration wasthe same at both sites, but the rate of change increasedwith increasing soil depth. This probably reflectedlower aeration status at depth 2 since oxygen had alonger diffusion pathway at depth 2 than at depth 1.This would lead to a lower aeration status at depth2 even when the soil water content at both depthswas similar. This lower aeration status would allowgreater ammonium accumulation.
Implications for Plant NutritionIt has been shown that trickle irrigation increases
ammonium availability during the wet period of eachcycle. Ammonium not removed during this phase isreabsorbed and a similar quantity is rereleased duringthe wet portion of the next cycle. This immobilizationof previously excreted ammonium as the soil driedwas very rapid and greatly reduced the time availablefor nitrification and subsequent denitrification andleaching.
The ammonium concentration decreased betweenthe end of the first 3-d cycle (6.57 ppm) and the be-ginning of the midseason 3-d (3.37 ppm) and 1-d (2.98ppm) cycles. This decrease probably reflected plantuptake as well as nitrification followed by leachingand denitrification, suggesting that at least a portionof the ammonium released under wet conditions waseventually lost from the system.
An average of 4 ppm of nitrate-N was lost eachcycle in the multicycle experiment. This is equivalentto 50 g of N lost over the 50 irrigation cycles eachseason from the region 0 to 65 cm from the outlet and0 to 12 cm below the surface. While this is a very highrate of denitrification it is <10% of the nitrogen in-volved in the release and resorption cycles describedabove. Irrigations of >8 h in duration resulted in upto 10 g of N per tree being temporarily mineralized.Maximum mineralization occurred when ammoniumnitrate was broadcast rather than banded 50 to 80 cmfrom the outlet.
Thus, a combination of 3-d cycles and placementof fertilizer in the wetted zone should improve plantnutrition provided the plant can respond to rapidchange in nutrient status without being adversely af-fected by temporary localized reduction in soil oxygencontent.
Plant Nitrogen Uptake during Transient Increase inSoil Ammonium
The importance of ammonium released during ir-rigation to plant nutrition depends on the plants' abil-ity to rapidly absorb ammonium from a relatively smallvolume of soil. Reisenauer (1978) indicated that plantsrespond extremely rapidly to changes in ammoniumconcentration. Frith and Nichols (1975b) showed that
the portion of the root zone exposed to high ammo-nium concentration had a much greater uptake ratethan the rest of the root system. This suggests thatplants could benefit from the transient increases inammonium concentration near the trickle outlet.Therefore management practices involving a 3-d cyclerather than a 1-d cycle together with placement offertilizer in the wetted zone should increase plant ni-trogen uptake provided that the lower aeration statusaccompanying irrigation does not seriously interferewith plant nutrient uptake mechanisms. Further workis necessary to examine the mechanisms behind therapid rise and fall in ammonium and to assess thepossibility of this process occurring in other undis-turbed systems such as irrigated pasture.
ACKNOWLEDGMENTWe acknowledge the skilled assistance of R. V. E. Polk-
inghorne, R. J. Nolan, and G. M. Cobden with field andlaboratory measurements. We are also appreciative of theassistance of M. Scott and V. Solah in manuscript prepa-ration. Statistical analysis was by courtesy of B. Coote andB. Cullis.

PAY AN & BINGHAM: TOXICITY OF ALUMINUM TO COFFEE SEEDLINGS GROWN IN NUTRIENT SOLUTION 993