numerical simulations of lab-scale brine-water mixing...
TRANSCRIPT
SANDIA REPORT SAND2006-5418 Unlimited Release Printed October 2006
Numerical Simulations of Lab-Scale Brine-Water Mixing Experiments Imane Khalil and Stephen W. Webb Prepared by Sandia National Laboratories Albuquerque, New Mexico 87185 and Livermore, California 94550 Sandia is a multiprogram laboratory operated by Sandia Corporation, a Lockheed Martin Company, for the United States Department of Energy’s National Nuclear Security Administration under Contract DE-AC04-94AL85000. Approved for public release; further dissemination unlimited.
Issued by Sandia National Laboratories, operated for the United States Department of Energy by Sandia Corporation. NOTICE: This report was prepared as an account of work sponsored by an agency of the United States Government. Neither the United States Government, nor any agency thereof, nor any of their employees, nor any of their contractors, subcontractors, or their employees, make any warranty, express or implied, or assume any legal liability or responsibility for the accuracy, completeness, or usefulness of any information, apparatus, product, or process disclosed, or represent that its use would not infringe privately owned rights. Reference herein to any specific commercial product, process, or service by trade name, trademark, manufacturer, or otherwise, does not necessarily constitute or imply its endorsement, recommendation, or favoring by the United States Government, any agency thereof, or any of their contractors or subcontractors. The views and opinions expressed herein do not necessarily state or reflect those of the United States Government, any agency thereof, or any of their contractors. Printed in the United States of America. This report has been reproduced directly from the best available copy. Available to DOE and DOE contractors from U.S. Department of Energy Office of Scientific and Technical Information P.O. Box 62 Oak Ridge, TN 37831 Telephone: (865) 576-8401 Facsimile: (865) 576-5728 E-Mail: [email protected] Online ordering: http://www.osti.gov/bridge Available to the public from U.S. Department of Commerce National Technical Information Service 5285 Port Royal Rd. Springfield, VA 22161 Telephone: (800) 553-6847 Facsimile: (703) 605-6900 E-Mail: [email protected] Online order: http://www.ntis.gov/help/ordermethods.asp?loc=7-4-0#online
3
SAND2006-5418 Unlimited Release
Printed October 2006
Numerical Simulations of Lab-Scale Brine-Water Mixing Experiments
Imane Khalil Analysis & Modeling Department
Stephen W. Webb
Geohydrology Department
Sandia National Laboratories P.O. Box 5800
Albuquerque, NM 87185-0735
Abstract Laboratory-scale experiments simulating the injection of fresh water into brine in a Strategic Petroleum Reserve (SPR) cavern were performed at Sandia National Laboratories for various conditions of injection rate and small and large injection tube diameters. The computational fluid dynamic (CFD) code FLUENT was used to simulate these experiments to evaluate the predictive capability of FLUENT for brine-water mixing in an SPR cavern. The data-model comparisons show that FLUENT simulations predict the mixing plume depth reasonably well. Predictions of the near-wall brine concentrations compare very well with the experimental data. The simulated time for the mixing plume to reach the vessel wall was underpredicted for the small injection tubes but reasonable for the large injection tubes. The difference in the time to reach the wall is probably due to the three-dimensional nature of the mixing plume as it spreads out at the air-brine or oil-brine interface. The depth of the mixing plume as it spreads out along the interface was within a factor of 2 of the experimental data. The FLUENT simulation results predict the plume mixing accurately, especially the water concentration when the mixing plume reaches the wall. This parameter value is the most significant feature of the mixing process because it will determine the amount of enhanced leaching at the oil-brine interface.

4
5
TABLE OF CONTENTS
1. INTRODUCTION ................................................................................................................13 2. PROBLEM PARAMETERS ................................................................................................15
2.1 Experiment Details ......................................................................................................15 2.2 Experimental Setup.....................................................................................................15 2.3 Diagnostics..................................................................................................................17
3. MODEL PARAMETERS .....................................................................................................19 3.1 Meshing of the Cylindrical Vessel ...............................................................................19 3.2 Material Properties ......................................................................................................19
3.2.1 Air ..............................................................................................................................19 3.2.2 Brine ..........................................................................................................................20 3.2.3 Fresh Water ...............................................................................................................20
3.3 CFD Model Settings ....................................................................................................20 3.4 Turbulence Model........................................................................................................20 3.5 Boundary Conditions...................................................................................................21
3.5.1 Boundary Conditions at the Injection Tube Inlet ........................................................21 3.5.2 Boundary Conditions at the Top of the Vessel ..........................................................21
4. RESULTS........................................................................................................................23 4.1 Model 1........................................................................................................................29
4.1.1 Model 1. Camera Position P2 .................................................................................30 4.1.2 Model 1. Camera Position P3 .................................................................................35
4.2 Model 2........................................................................................................................40 4.2.1 Model 2. Camera Position P2 ................................................................................40 4.2.2 Model 2. Camera Position P3 .................................................................................47
4.3 Model 3........................................................................................................................53 4.3.1 Model 3. Camera Position P2................................................................................54 4.3.2 Model 3. Camera Position P3 ................................................................................59
4.4 Model 4........................................................................................................................63 4.4.1 Model 4. Camera Position P1..................................................................................64 4.4.2 Model 4. Camera Position P2 ..................................................................................69 4.4.3 Model 4. Camera Position P3..................................................................................75
4.5 Model 5........................................................................................................................82 4.5.1 Model 5. Camera Position P1 .................................................................................83 4.5.2 Model 5. Camera Position P2..................................................................................87 4.5.3 Model 5. Camera Position P3 .................................................................................93
4.6 Model 6........................................................................................................................98 4.6.1 Model 6. Camera Position P1 .................................................................................99 4.6.2 Model 6 Camera Position P3 ................................................................................103
4.7 Model 7......................................................................................................................108 4.7.1 Model 7. Camera Position P1 ...............................................................................109 4.7.2 Model 7. Camera Position P3 ...............................................................................114
4.8 Model 8......................................................................................................................120 4.8.1 Model 8. Camera Position P1................................................................................121 4.8.2 Model 8. Camera Position P3................................................................................124
5. DISCUSSION AND CONCLUSIONS ...............................................................................127 6. REFERENCES .................................................................................................................135
6
LIST OF FIGURES
Figure 1. Experimental setup .....................................................................................................16 Figure 2. Vessel used in the experiments..................................................................................16 Figure 3. Camera positions........................................................................................................17 Figure 4. Mesh of CFD model....................................................................................................19 Figure 5. Model 1. Contours of time average density (kg/m3). FLUENT simulations on the right
side. Experimental results on the left side ...........................................................................23 Figure 6. Model 2. Contours of time average density (kg/m3). FLUENT simulations on the right
side. Experimental results on the left side ...........................................................................24 Figure 7. Model 3. Contours of time average density (kg/m3). FLUENT simulations on the right
side. Experimental results on the left side ...........................................................................24 Figure 8. Model 4. Contours of time average density (kg/m3). FLUENT simulations on the right
side. Experimental results on the left side ...........................................................................25 Figure 9. Model 5. Contours of time average density (kg/m3). FLUENT simulations on the right
side. Experimental results on the left side ...........................................................................25 Figure 10. Model 6. Contours of time average density (kg/m3). FLUENT simulations on the right
side. Experimental results on the left side ...........................................................................26 Figure 11. Model 7. Contours of time average density (kg/m3). FLUENT simulations on the right
side. Experimental results on the left side ...........................................................................26 Figure 12. Model 8. Contours of time average density (kg/m3). FLUENT simulations on the right
side. Experimental results on the left side ...........................................................................27 Figure 13. Model 1. Camera Position P2. Experimental data at t=8 sec ....................................30 Figure 14. Experimental data at t=9 sec .....................................................................................30 Figure 15. Experimental data at t=10 sec ...................................................................................30 Figure 16. Experimental data at t=11 sec ...................................................................................31 Figure 17. Experimental data at t=12 sec ...................................................................................31 Figure 18. Experimental data at t=13 sec ...................................................................................31 Figure 19. Experimental data at t=14 sec ...................................................................................32 Figure 20. Experimental data at t=15 sec ...................................................................................32 Figure 21. Experimental data at t=16 sec ...................................................................................32 Figure 22. Experimental data at t=17 sec ...................................................................................33 Figure 23. Experimental data at t=18 sec ...................................................................................33 Figure 24. Experimental data at t=19 sec ...................................................................................33 Figure 25. Experimental data at t=20 sec ...................................................................................34 Figure 26. Experimental data at t=21 sec ...................................................................................34 Figure 27. Experimental data at t=22 sec ...................................................................................34 Figure 28. Model 1. Camera Position P3. Experimental data at t=14 sec ..................................35 Figure 29. Experimental data at t=15 sec ...................................................................................35 Figure 30. Experimental data at t=16 sec ...................................................................................35 Figure 31. Experimental data at t=17 sec ...................................................................................36 Figure 32. Experimental data at t=18 sec ...................................................................................36 Figure 33. Experimental data at t=19 sec ...................................................................................36 Figure 34. Experimental data at t=20 sec ...................................................................................37 Figure 35. Experimental data at t=21 sec ...................................................................................37 Figure 36. Experimental data at t=22 sec ...................................................................................37 Figure 37. Experimental data at t=23 sec ...................................................................................38 Figure 38. Experimental data at t=24 sec ...................................................................................38 Figure 39. Experimental data at t=25 sec ...................................................................................38 Figure 40. Experimental data at t=26 sec ...................................................................................39 Figure 41. Model 2. Camera Position P2. Experimental data at t=7 sec ...................................40
7
Figure 42. Experimental data at t=8 sec .....................................................................................40 Figure 43. Experimental data at t=9 sec .....................................................................................41 Figure 44. Experimental data at t=10 sec ...................................................................................41 Figure 45. Experimental data at t=11 sec ...................................................................................41 Figure 46. Experimental data at t=12 sec ...................................................................................42 Figure 47. Experimental data at t=13 sec ...................................................................................42 Figure 48. Experimental data at t=14 sec ...................................................................................42 Figure 49. Experimental data at t=15 sec ...................................................................................43 Figure 50. Experimental data at t=16 sec ...................................................................................43 Figure 51. Experimental data at t=17 sec ...................................................................................43 Figure 52. Experimental data at t=18 sec ...................................................................................44 Figure 53. Experimental data at t=19 sec ...................................................................................44 Figure 54. Experimental data at t=20 sec ...................................................................................44 Figure 55. Experimental data at t=21 sec ...................................................................................45 Figure 56. Experimental data at t=22 sec ...................................................................................45 Figure 57. Experimental data at t=23 sec ...................................................................................45 Figure 58. Experimental data at t=24 sec ...................................................................................46 Figure 59. Experimental data at t=25 sec ...................................................................................46 Figure 60. Experimental data at t=26 sec ...................................................................................46 Figure 61. Model 2. Camera Position P3. Experimental data at t=15 sec ..................................47 Figure 62. Experimental data at t=16 sec ...................................................................................47 Figure 63. Experimental data at t=17 sec ...................................................................................47 Figure 64. Experimental data at t=18 sec ...................................................................................48 Figure 65. Experimental data at t=19 sec ...................................................................................48 Figure 66. Experimental data at t=20 sec ...................................................................................48 Figure 67. Experimental data at t=21 sec ...................................................................................49 Figure 68. Experimental data at t=22 sec ...................................................................................49 Figure 69. Experimental data at t=23 sec ...................................................................................49 Figure 70. Experimental data at t=24 sec ...................................................................................50 Figure 71. Experimental data at t=25 sec ...................................................................................50 Figure 72. Experimental data at t=26 sec ...................................................................................50 Figure 73. Experimental data at t=27 sec ...................................................................................51 Figure 74. Experimental data at t=28 sec ...................................................................................51 Figure 75. Experimental data at t=29 sec ...................................................................................51 Figure 76. Experimental data at t=30 sec ...................................................................................52 Figure 77. Experimental data at t=31 sec ...................................................................................52 Figure 78. Model 3. Camera Position P2. Experimental data at t=5 sec ....................................54 Figure 79. Experimental data at t=6 sec .....................................................................................54 Figure 80. Experimental data at t=7 sec .....................................................................................54 Figure 81. Experimental data at t=8 sec .....................................................................................55 Figure 82. Experimental data at t=9 sec .....................................................................................55 Figure 83. Experimental data at t=10 sec ...................................................................................55 Figure 84. Experimental data at t=11 sec ...................................................................................56 Figure 85. Experimental data at t=12 sec ...................................................................................56 Figure 86. Experimental data at t=13 sec ...................................................................................56 Figure 87. Experimental data at t=14 sec ...................................................................................57 Figure 88. Experimental data at t=15 sec ...................................................................................57 Figure 89. Experimental data at t=16 sec ...................................................................................57 Figure 90. Experimental data at t=17 sec ...................................................................................58 Figure 91. Experimental data at t=18 sec ...................................................................................58 Figure 92. Model 3. Camera Position P3. Experimental data at t=14 sec ..................................59
8
Figure 93. Experimental data at t=15 sec ...................................................................................59 Figure 94. Experimental data at t=16 sec ...................................................................................59 Figure 95. Experimental data at t=17 sec ...................................................................................60 Figure 96. Experimental data at t=18 sec ...................................................................................60 Figure 97. Experimental data at t=19 sec ...................................................................................60 Figure 98. Experimental data at t=20 sec ...................................................................................61 Figure 99. Experimental data at t=21 sec ...................................................................................61 Figure 100. Experimental data at t=22 sec .................................................................................61 Figure 101. Experimental data at t=23 sec .................................................................................62 Figure 102. Experimental data at t=24 sec .................................................................................62 Figure 103. Model 4. Camera Position P1. Experimental data at t=1 sec ..................................64 Figure 104. Experimental data at t=2 sec ...................................................................................64 Figure 105. Experimental data at t=3 sec ...................................................................................64 Figure 106. Experimental data at t=4 sec ...................................................................................65 Figure 107. Experimental data at t=5 sec ...................................................................................65 Figure 108. Experimental data at t=6 sec ...................................................................................65 Figure 109. Experimental data at t=7 sec ...................................................................................66 Figure 110. Experimental data at t=8 sec ...................................................................................66 Figure 111. Experimental data at t=9 sec ...................................................................................66 Figure 112. Experimental data at t=10 sec .................................................................................67 Figure 113. Experimental data at t=11 sec .................................................................................67 Figure 114. Experimental data at t=12 sec .................................................................................67 Figure 115. Experimental data at t=13 sec .................................................................................68 Figure 116. Experimental data at t=14 sec. ................................................................................68 Figure 117. Experimental data at t=15 sec .................................................................................68 Figure 118. Model 4. Camera Position P2. Experimental data at t=4 sec ..................................69 Figure 119. Experimental data at t=5 sec ...................................................................................69 Figure 120. Experimental data at t=6 sec ...................................................................................69 Figure 121. Experimental data at t=7 sec ...................................................................................70 Figure 122. Experimental data at t=8 sec ...................................................................................70 Figure 123. Experimental data at t=9 sec ...................................................................................70 Figure 124. Experimental data at t=10 sec .................................................................................71 Figure 125. Experimental data at t=11 sec .................................................................................71 Figure 126. Experimental data at t=12 sec .................................................................................71 Figure 127. Experimental data at t=13 sec .................................................................................72 Figure 128. Experimental data at t=14 sec .................................................................................72 Figure 129. Experimental data at t=15 sec .................................................................................72 Figure 130. Experimental data at t=16 sec .................................................................................73 Figure 131. Experimental data at t=17 sec .................................................................................73 Figure 132. Experimental data at t=18 sec .................................................................................73 Figure 133. Experimental data at t=19 sec .................................................................................74 Figure 134. Experimental data at t=20 sec .................................................................................74 Figure 135. Experimental data at t=21 sec .................................................................................74 Figure 136. Model 4. Camera Position P3. Experimental data at t=13 sec ................................75 Figure 137. Experimental data at t=14 sec .................................................................................75 Figure 138. Experimental data at t=15 sec .................................................................................75 Figure 139. Experimental data at t=16 sec .................................................................................76 Figure 140. Experimental data at t=17 sec .................................................................................76 Figure 141. Experimental data at t=18 sec .................................................................................76 Figure 142. Experimental data at t=19 sec .................................................................................77 Figure 143. Experimental data at t=20 sec .................................................................................77
9
Figure 144. Experimental data at t=21 sec .................................................................................77 Figure 145. Experimental data at t=22 sec .................................................................................78 Figure 146. Experimental data at t=23 sec .................................................................................78 Figure 147. Experimental data at t=24 sec .................................................................................78 Figure 148. Experimental data at t=25 sec .................................................................................79 Figure 149. Experimental data at t=26 sec .................................................................................79 Figure 150. Experimental data at t=27 sec .................................................................................79 Figure 151. Experimental data at t=28 sec .................................................................................80 Figure 152. Experimental data at t=29 sec .................................................................................80 Figure 153. Experimental data at t=30 sec .................................................................................80 Figure 154. Experimental data at t=31 sec .................................................................................81 Figure 155. Experimental data at t=32 sec .................................................................................81 Figure 156. Experimental data at t=33 sec .................................................................................81 Figure 157. Model 5. Camera Position P1. Experimental data at t=3 sec ..................................83 Figure 158. Experimental data at t=4 sec ...................................................................................83 Figure 159. Experimental data at t=5 sec ...................................................................................83 Figure 160. Experimental data at t=6 sec ...................................................................................84 Figure 161. Experimental data at t=7 sec ...................................................................................84 Figure 162. Experimental data at t=8 sec ...................................................................................84 Figure 163. Experimental data at t=9 sec ...................................................................................85 Figure 164. Experimental data at t=10 sec .................................................................................85 Figure 165. Experimental data at t=11 sec .................................................................................85 Figure 166. Experimental data at t=12 sec .................................................................................86 Figure 167. Experimental data at t=13 sec .................................................................................86 Figure 168. Experimental data at t=14 sec .................................................................................86 Figure 169. Model 5. Camera Position P2. Experimental data at t=5 sec ..................................87 Figure 170. Experimental data at t=6 sec ...................................................................................87 Figure 171. Experimental data at t=7 sec ...................................................................................87 Figure 172. Experimental data at t=8 sec ...................................................................................88 Figure 173. Experimental data at t=9 sec ...................................................................................88 Figure 174. Experimental data at t=10 sec .................................................................................88 Figure 175. Experimental data at t=11 sec .................................................................................89 Figure 176. Experimental data at t=12 sec .................................................................................89 Figure 177. Experimental data at t=13 sec .................................................................................89 Figure 178. Experimental data at t=14 sec .................................................................................90 Figure 179. Experimental data at t=15 sec .................................................................................90 Figure 180. Experimental data at t=16 sec .................................................................................90 Figure 181. Experimental data at t=17 sec .................................................................................91 Figure 182. Experimental data at t=18 sec .................................................................................91 Figure 183. Experimental data at t=19 sec .................................................................................91 Figure 184. Experimental data at t=20 sec .................................................................................92 Figure 185. Experimental data at t=21 sec .................................................................................92 Figure 186. Experimental data at t=22 sec .................................................................................92 Figure 187. Model 5. Camera Position P3. Experimental data at t=17 sec ................................93 Figure 188. Experimental data at t=18 sec .................................................................................93 Figure 189. Experimental data at t=19 sec .................................................................................93 Figure 190. Experimental data at t=20 sec .................................................................................94 Figure 191. Experimental data at t=21 sec .................................................................................94 Figure 192. Experimental data at t=22 sec .................................................................................94 Figure 193. Experimental data at t=23 sec .................................................................................95 Figure 194. Experimental data at t=24 sec .................................................................................95
10
Figure 195. Experimental data at t=25 sec .................................................................................95 Figure 196. Experimental data at t=26 sec .................................................................................96 Figure 197. Experimental data at t=27 sec .................................................................................96 Figure 198. Experimental data at t=28 sec .................................................................................96 Figure 199. Experimental data at t=29 sec .................................................................................97 Figure 200. Experimental data at t=30 sec .................................................................................97 Figure 201. Model 6. Camera Position P1. Experimental data at t=1 sec ..................................99 Figure 202. Experimental data at t=2 sec ...................................................................................99 Figure 203. Experimental data at t=3 sec ...................................................................................99 Figure 204. Experimental data at t=4 sec .................................................................................100 Figure 205. Experimental data at t=5 sec .................................................................................100 Figure 206. Experimental data at t=6 sec .................................................................................100 Figure 207. Experimental data at t=7 sec .................................................................................101 Figure 208. Experimental data at t=8 sec .................................................................................101 Figure 209. Experimental data at t=9 sec .................................................................................101 Figure 210. Experimental data at t=10 sec ...............................................................................102 Figure 211. Experimental data at t=11 sec ...............................................................................102 Figure 212. Model 6. Camera Position P3. Experimental data at t=4 sec ................................103 Figure 213. Experimental data at t=5 sec .................................................................................103 Figure 214. Experimental data at t=6 sec .................................................................................103 Figure 215. Experimental data at t=7 sec .................................................................................104 Figure 216. Experimental data at t=8 sec .................................................................................104 Figure 217. Experimental data at t=9 sec .................................................................................104 Figure 218. Experimental data at t=10 sec ...............................................................................105 Figure 219. Experimental data at t=11 sec ...............................................................................105 Figure 220. Experimental data at t=12 sec ...............................................................................105 Figure 221. Experimental data at t=13 sec ...............................................................................106 Figure 222. Experimental data at t=14 sec ...............................................................................106 Figure 223. Experimental data at t=15 sec ...............................................................................106 Figure 224. Experimental data at t=16 sec ...............................................................................107 Figure 225. Experimental data at t=17 sec ...............................................................................107 Figure 226. Experimental data at t=18 sec ...............................................................................107 Figure 227. Model 7. Camera Position P1. Experimental data at t=2 sec ................................109 Figure 228. Experimental data at t=3 sec .................................................................................109 Figure 229. Experimental data at t=4 sec .................................................................................109 Figure 230. Experimental data at t=5 sec .................................................................................110 Figure 231. Experimental data at t=6 sec .................................................................................110 Figure 232. Experimental data at t=7 sec .................................................................................110 Figure 233. Experimental data at t=8 sec .................................................................................111 Figure 234. Experimental data at t=9 sec .................................................................................111 Figure 235. Experimental data at t=10 sec ...............................................................................111 Figure 236. Experimental data at t=11 sec ...............................................................................112 Figure 237. Experimental data at t=12 sec ...............................................................................112 Figure 238. Experimental data at t=13 sec ...............................................................................112 Figure 239. Experimental data at t=14 sec ...............................................................................113 Figure 240. Experimental data at t=15 sec ...............................................................................113 Figure 241. Experimental data at t=16 sec ...............................................................................113 Figure 242. Model 7. Camera Position P3. Experimental data at t=5 sec ................................114 Figure 243. Experimental data at t=6 sec .................................................................................114 Figure 244. Experimental data at t=7 sec .................................................................................114 Figure 245. Experimental data at t=8 sec .................................................................................115
11
Figure 246. Experimental data at t=9 sec .................................................................................115 Figure 247. Experimental data at t=10 sec ...............................................................................115 Figure 248. Experimental data at t=11 sec ...............................................................................116 Figure 249. Experimental data at t=12 sec ...............................................................................116 Figure 250. Experimental data at t=13 sec ...............................................................................116 Figure 251. Experimental data at t=14 sec ...............................................................................117 Figure 252. Experimental data at t=15 sec ...............................................................................117 Figure 253. Experimental data at t=16 sec ...............................................................................117 Figure 254. Experimental data at t=17 sec ...............................................................................118 Figure 255. Experimental data at t=18 sec ...............................................................................118 Figure 256. Experimental data at t=19 sec ...............................................................................118 Figure 257. Experimental data at t=20 sec ...............................................................................119 Figure 258. Experimental data at t=21 sec ...............................................................................119 Figure 259. Model 8. Camera Position P1. Experimental data at t=1 sec ................................121 Figure 260. Experimental data at t=2 sec .................................................................................121 Figure 261. Experimental data at t=3 sec .................................................................................121 Figure 262. Experimental data at t=4 sec .................................................................................122 Figure 263. Experimental data at t=5 sec .................................................................................122 Figure 264. Experimental data at t=6 sec .................................................................................122 Figure 265. Experimental data at t=7 sec .................................................................................123 Figure 266. Experimental data at t=8 sec .................................................................................123 Figure 267. Experimental data at t=9 sec .................................................................................123 Figure 268. Model 8. Camera Position P3. Experimental data at t=10 sec ..............................124 Figure 269. Experimental data at t=11 sec ...............................................................................124 Figure 270. Experimental data at t=12 sec ...............................................................................124 Figure 271. Experimental data at t=13 sec ...............................................................................125 Figure 272. Experimental data at t=14 sec ...............................................................................125 Figure 273. P2, P3 and isocontours of 0.01 water concentration at t=13 sec...........................129 Figure 274. Isocontours of 0.01 water concentration at t=13 sec .............................................130 Figure 275. Isocontours of 0.01 water concentration at t=15 sec .............................................131 Figure 276. Isocontours of 0.01 water concentration at t=17 sec .............................................132
LIST OF TABLES
Table 1. Summary of test runs...................................................................................................15 Table 2. Plume length comparison ............................................................................................27 Table 3. Near-wall brine concentration ....................................................................................127 Table 4. Time for fresh water to hit the vessel walls ................................................................128

12
13
1. INTRODUCTION
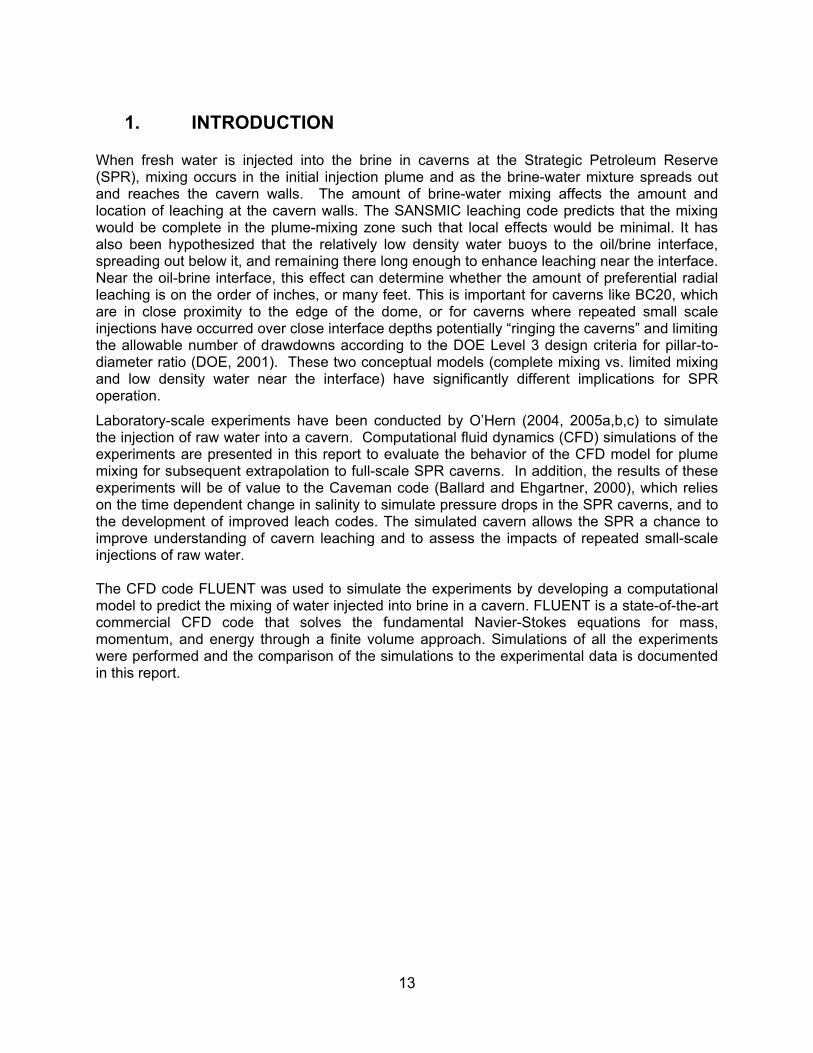
When fresh water is injected into the brine in caverns at the Strategic Petroleum Reserve (SPR), mixing occurs in the initial injection plume and as the brine-water mixture spreads out and reaches the cavern walls. The amount of brine-water mixing affects the amount and location of leaching at the cavern walls. The SANSMIC leaching code predicts that the mixing would be complete in the plume-mixing zone such that local effects would be minimal. It has also been hypothesized that the relatively low density water buoys to the oil/brine interface, spreading out below it, and remaining there long enough to enhance leaching near the interface. Near the oil-brine interface, this effect can determine whether the amount of preferential radial leaching is on the order of inches, or many feet. This is important for caverns like BC20, which are in close proximity to the edge of the dome, or for caverns where repeated small scale injections have occurred over close interface depths potentially “ringing the caverns” and limiting the allowable number of drawdowns according to the DOE Level 3 design criteria for pillar-to-diameter ratio (DOE, 2001). These two conceptual models (complete mixing vs. limited mixing and low density water near the interface) have significantly different implications for SPR operation.
Laboratory-scale experiments have been conducted by O’Hern (2004, 2005a,b,c) to simulate the injection of raw water into a cavern. Computational fluid dynamics (CFD) simulations of the experiments are presented in this report to evaluate the behavior of the CFD model for plume mixing for subsequent extrapolation to full-scale SPR caverns. In addition, the results of these experiments will be of value to the Caveman code (Ballard and Ehgartner, 2000), which relies on the time dependent change in salinity to simulate pressure drops in the SPR caverns, and to the development of improved leach codes. The simulated cavern allows the SPR a chance to improve understanding of cavern leaching and to assess the impacts of repeated small-scale injections of raw water. The CFD code FLUENT was used to simulate the experiments by developing a computational model to predict the mixing of water injected into brine in a cavern. FLUENT is a state-of-the-art commercial CFD code that solves the fundamental Navier-Stokes equations for mass, momentum, and energy through a finite volume approach. Simulations of all the experiments were performed and the comparison of the simulations to the experimental data is documented in this report.

14
15
2. PROBLEM PARAMETERS
2.1 Experiment Details
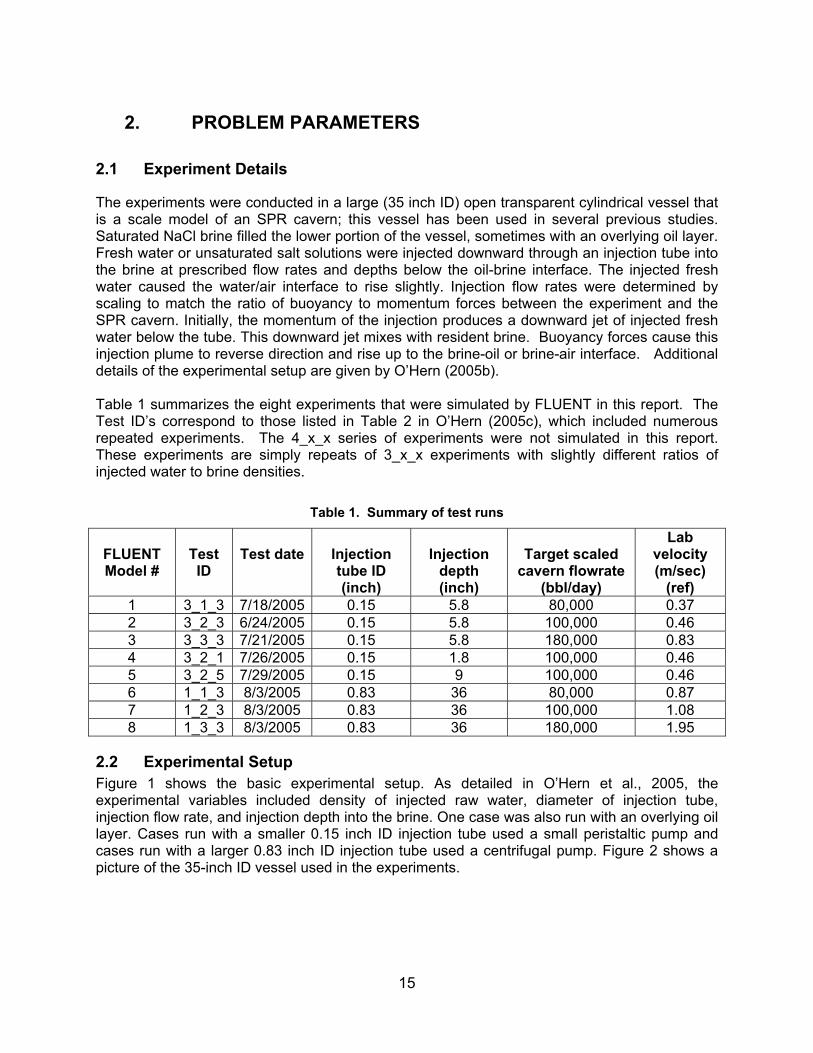
The experiments were conducted in a large (35 inch ID) open transparent cylindrical vessel that is a scale model of an SPR cavern; this vessel has been used in several previous studies. Saturated NaCl brine filled the lower portion of the vessel, sometimes with an overlying oil layer. Fresh water or unsaturated salt solutions were injected downward through an injection tube into the brine at prescribed flow rates and depths below the oil-brine interface. The injected fresh water caused the water/air interface to rise slightly. Injection flow rates were determined by scaling to match the ratio of buoyancy to momentum forces between the experiment and the SPR cavern. Initially, the momentum of the injection produces a downward jet of injected fresh water below the tube. This downward jet mixes with resident brine. Buoyancy forces cause this injection plume to reverse direction and rise up to the brine-oil or brine-air interface. Additional details of the experimental setup are given by O’Hern (2005b). Table 1 summarizes the eight experiments that were simulated by FLUENT in this report. The Test ID’s correspond to those listed in Table 2 in O’Hern (2005c), which included numerous repeated experiments. The 4_x_x series of experiments were not simulated in this report. These experiments are simply repeats of 3_x_x experiments with slightly different ratios of injected water to brine densities.
Table 1. Summary of test runs
FLUENT Model #
Test ID
Test date
Injection tube ID (inch)
Injection
depth (inch)
Target scaled
cavern flowrate (bbl/day)
Lab velocity (m/sec)
(ref) 1 3_1_3 7/18/2005 0.15 5.8 80,000 0.37 2 3_2_3 6/24/2005 0.15 5.8 100,000 0.46 3 3_3_3 7/21/2005 0.15 5.8 180,000 0.83 4 3_2_1 7/26/2005 0.15 1.8 100,000 0.46 5 3_2_5 7/29/2005 0.15 9 100,000 0.46 6 1_1_3 8/3/2005 0.83 36 80,000 0.87 7 1_2_3 8/3/2005 0.83 36 100,000 1.08 8 1_3_3 8/3/2005 0.83 36 180,000 1.95
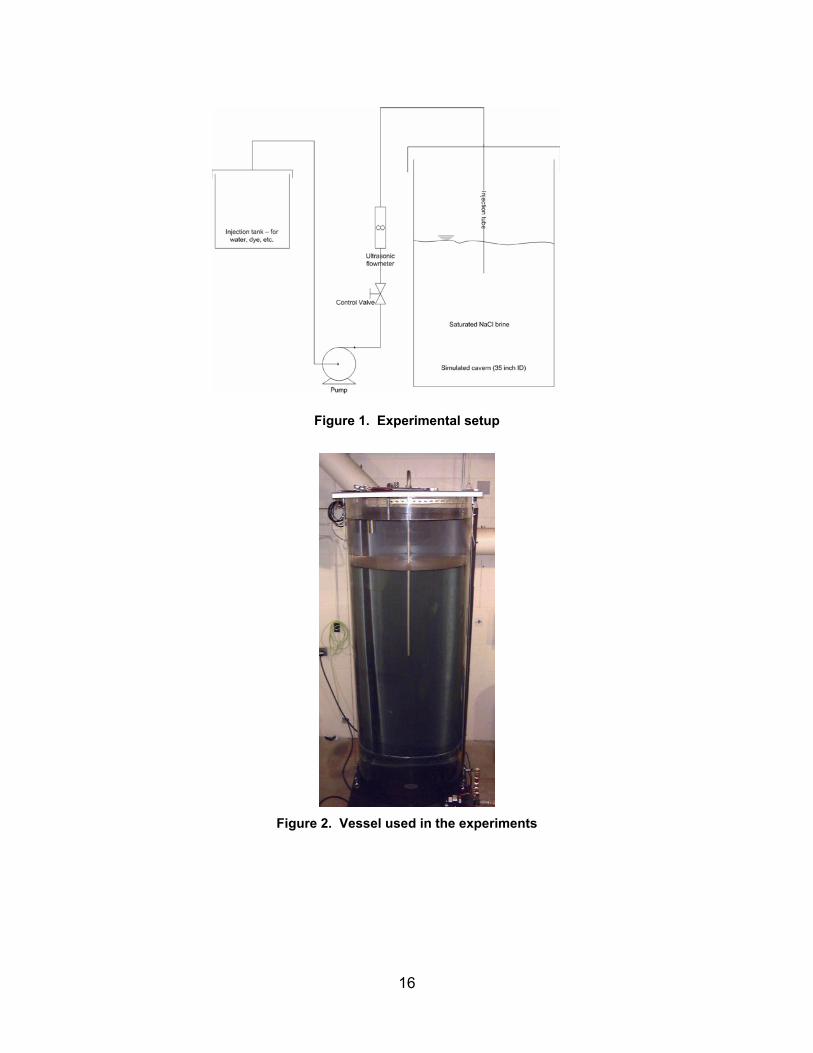
2.2 Experimental Setup Figure 1 shows the basic experimental setup. As detailed in O’Hern et al., 2005, the experimental variables included density of injected raw water, diameter of injection tube, injection flow rate, and injection depth into the brine. One case was also run with an overlying oil layer. Cases run with a smaller 0.15 inch ID injection tube used a small peristaltic pump and cases run with a larger 0.83 inch ID injection tube used a centrifugal pump. Figure 2 shows a picture of the 35-inch ID vessel used in the experiments.
16
Figure 1. Experimental setup
Figure 2. Vessel used in the experiments
17
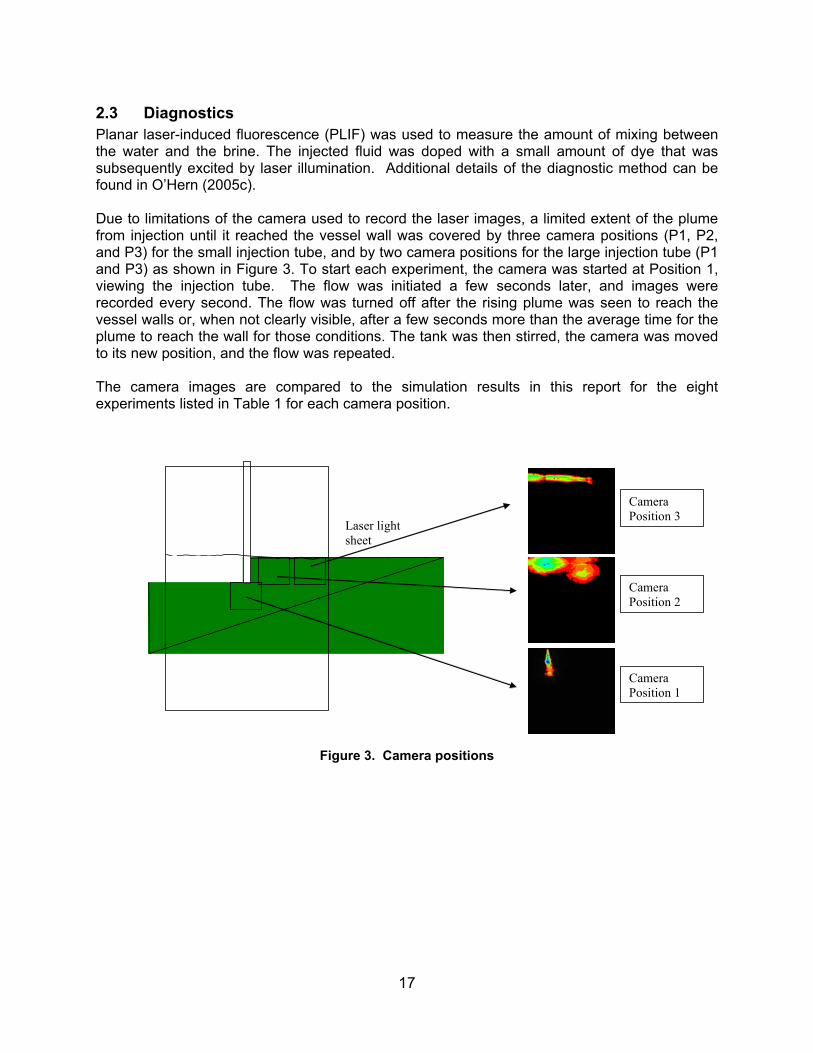
2.3 Diagnostics Planar laser-induced fluorescence (PLIF) was used to measure the amount of mixing between the water and the brine. The injected fluid was doped with a small amount of dye that was subsequently excited by laser illumination. Additional details of the diagnostic method can be found in O’Hern (2005c). Due to limitations of the camera used to record the laser images, a limited extent of the plume from injection until it reached the vessel wall was covered by three camera positions (P1, P2, and P3) for the small injection tube, and by two camera positions for the large injection tube (P1 and P3) as shown in Figure 3. To start each experiment, the camera was started at Position 1, viewing the injection tube. The flow was initiated a few seconds later, and images were recorded every second. The flow was turned off after the rising plume was seen to reach the vessel walls or, when not clearly visible, after a few seconds more than the average time for the plume to reach the wall for those conditions. The tank was then stirred, the camera was moved to its new position, and the flow was repeated. The camera images are compared to the simulation results in this report for the eight experiments listed in Table 1 for each camera position.
Figure 3. Camera positions
Laser light sheet
Camera Position 1
Camera Position 2
Camera Position 3

18
19
3. MODEL PARAMETERS
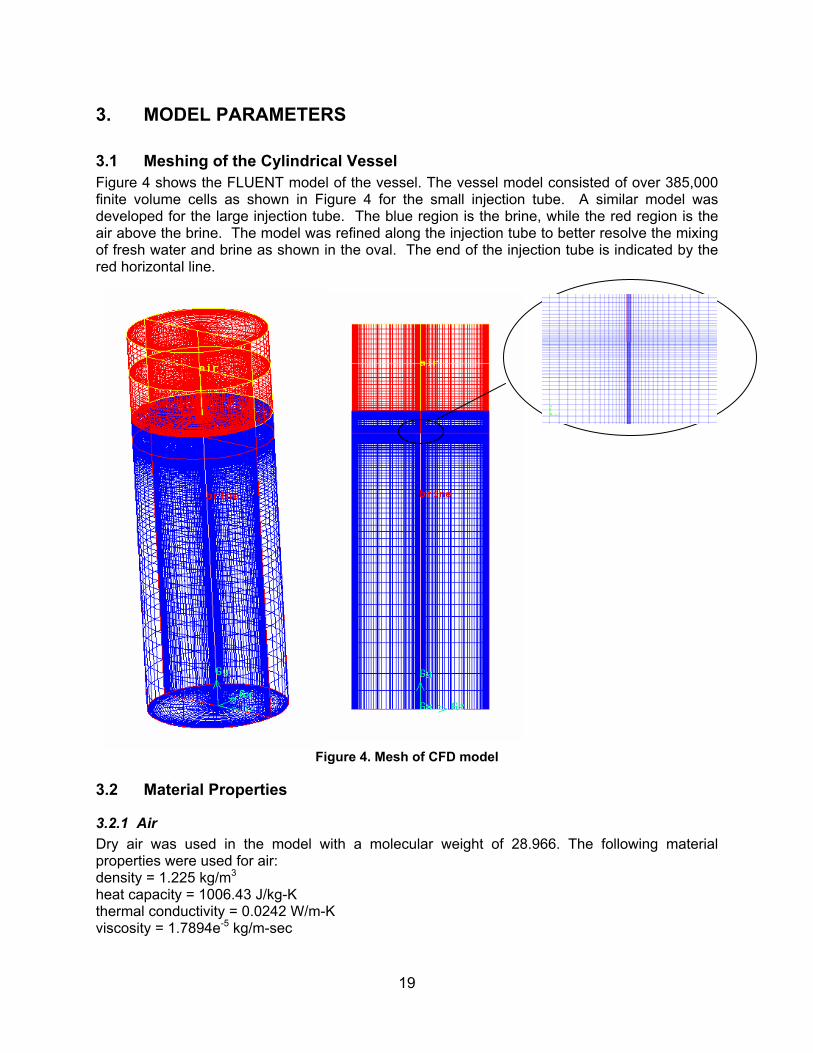
3.1 Meshing of the Cylindrical Vessel Figure 4 shows the FLUENT model of the vessel. The vessel model consisted of over 385,000 finite volume cells as shown in Figure 4 for the small injection tube. A similar model was developed for the large injection tube. The blue region is the brine, while the red region is the air above the brine. The model was refined along the injection tube to better resolve the mixing of fresh water and brine as shown in the oval. The end of the injection tube is indicated by the red horizontal line.
Figure 4. Mesh of CFD model
3.2 Material Properties
3.2.1 Air Dry air was used in the model with a molecular weight of 28.966. The following material properties were used for air: density = 1.225 kg/m3 heat capacity = 1006.43 J/kg-K thermal conductivity = 0.0242 W/m-K viscosity = 1.7894e-5 kg/m-sec
20
3.2.2 Brine The density of the brine used in the simulations matched the value of the brine density used in the experiments and ranged from 1,181-1,199 kg/m3. The following material properties were used for brine: heat capacity = 4,182 J/kg-K viscosity = 0.0017 kg/m-sec molecular weight = 18.0152 kg/kgmol
3.2.3 Fresh Water The density used for the fresh water is 1,000 kg/m3. The following material properties were used for fresh water: heat capacity = 4,182 J/kg-K viscosity = 0.001003 kg/m-sec molecular weight = 18.0152 kg/kgmol
3.3 CFD Model Settings The multiphase Volume of Fluid (VOF) model was used with two phases in order to follow the rising brine-air interface. The solution was run as a transient until the water/brine plume reached the vessel wall. Gravity was included with a gravitational constant of 9.81 m/s2. The SIMPLEC method was used for pressure-velocity coupling. The Body Force Weighted approach was used for pressure discretization, while second order was used for momentum, turbulence, energy, and phase 2 (water). Under-relaxation parameters between 0.9 and 1 were used. Second-order time discretization was used. Convergence during the simulations was judged by monitoring the residuals. The time step was considered converged when all the residuals, except the energy equation, were less than 10-4, and the energy residual was less than 10-6. Typical time steps for the simulations were 0.0025 second. A value of 0 is specified as the operating density. The operating pressure was specified as 101,325 Pa. In reality, the operating pressure should be atmospheric pressure in Albuquerque of about 85,000 Pa. However, because we are modeling liquid flow and mixing, the absolute value will have a negligible impact on the results.
3.4 Turbulence Model We used the Large Eddy Simulations (LES) model for turbulence. The Smagorinski subgrid-scale model was used for turbulence. Ideally, the “constant” in the Smagorinski model would be dynamically calculated by the code based on local stress conditions. However, in the present version of FLUENT, this enhancement is not yet available when the VOF model is used. A turbulent Schmidt number of 0.7 (default value) was used in the simulations. A sensitivity study for the Smagorinski constant was performed. The depth of the initial fresh water plume was monitored while different Smagorinski constant were used and a value of 0.05 was chosen to perform the simulations.
21
3.5 Boundary Conditions Wall boundary conditions were applied to the inside walls of the vessel, outside walls of the injection tube, and the bottom of the vessel.
3.5.1 Boundary Conditions at the Injection Tube Inlet Velocity inlet boundary condition is used at the face of the injection tube (downward) with 20% turbulence intensity.
3.5.2 Boundary Conditions at the Top of the Vessel Pressure outlet boundary condition is used at the top of the vessel. A constant temperature value of 300K was specified. Air escapes out the top of the model as water is injected due to the rising air-brine interface.

22
23
4. RESULTS
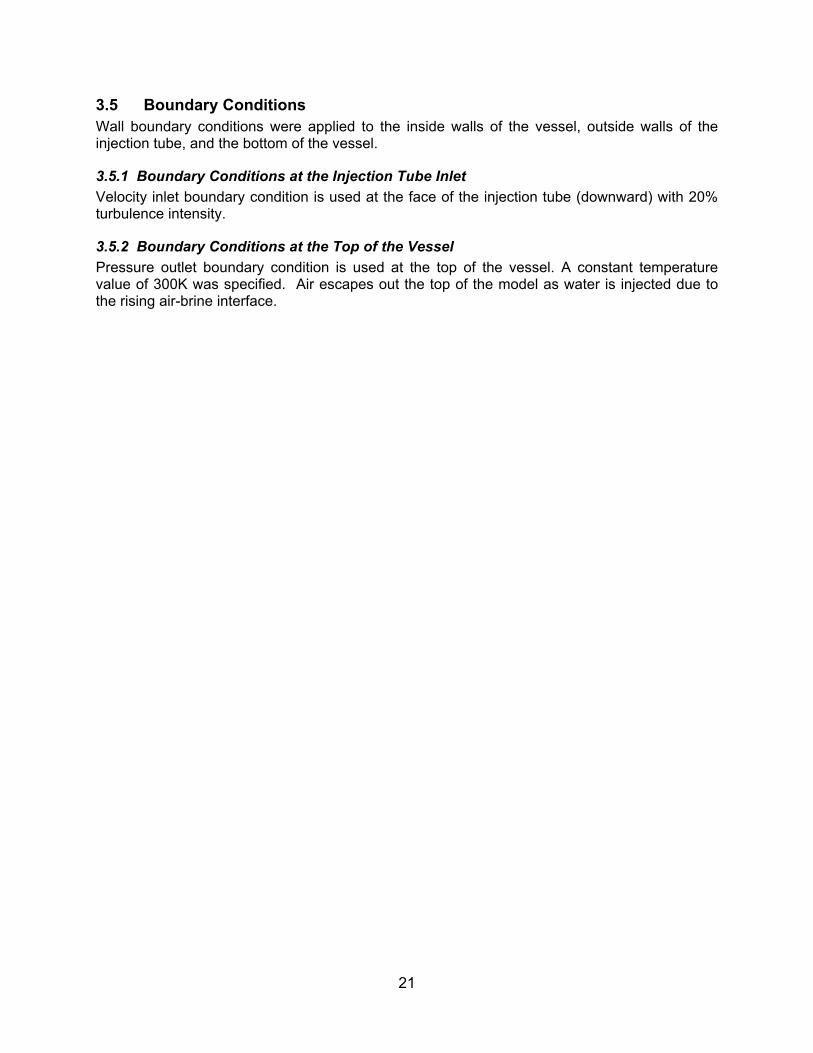
The goal for this CFD calculation is to compare the FLUENT simulations and the experimental results of the mixing of the injected water into the brine. Eight experiments were simulated in FLUENT corresponding as listed in Table 1. Note that the measurement uncertainty is estimated to be ~±15 % (O’Hern, 2005c). For each model, the time-averaged plume density of camera position P1 was calculated and compared to the experimental value. The time averaged values are appropriate to use due to the strong mixing dynamics in the plume. Figures 5 through 12 compare the modeled and the experimental average of the plume at the injection (position P1) for all models. The FLUENT simulation’s snapshots are taken in a cross-plane through the middle of the modeled cylindrical vessel (mid-plane). Some experiments were repeated but had similar averages and therefore only one of the experiments for each model is used for the comparison. The axes in Figures 5 through 12 corresponding to the FLUENT simulations (right side) had a scale of meters while the experimental figures (left side) had a scale of centimeters. The center for the experimental figures was located at the level of the injection tube while the center in the simulations was at the bottom of the vessel.
Figure 5. Model 1. Contours of time average density (kg/m3). FLUENT simulations on the right side. Experimental results on the left side
24
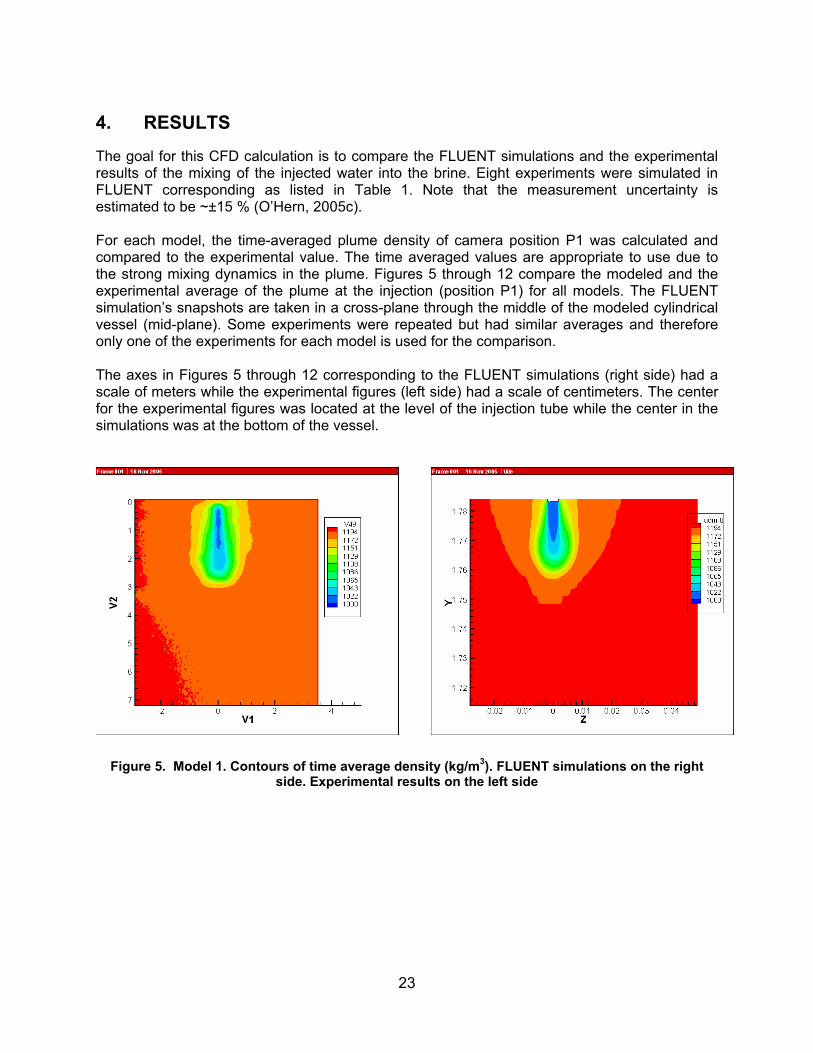
Figure 6. Model 2. Contours of time average density (kg/m3). FLUENT simulations on the right side. Experimental results on the left side
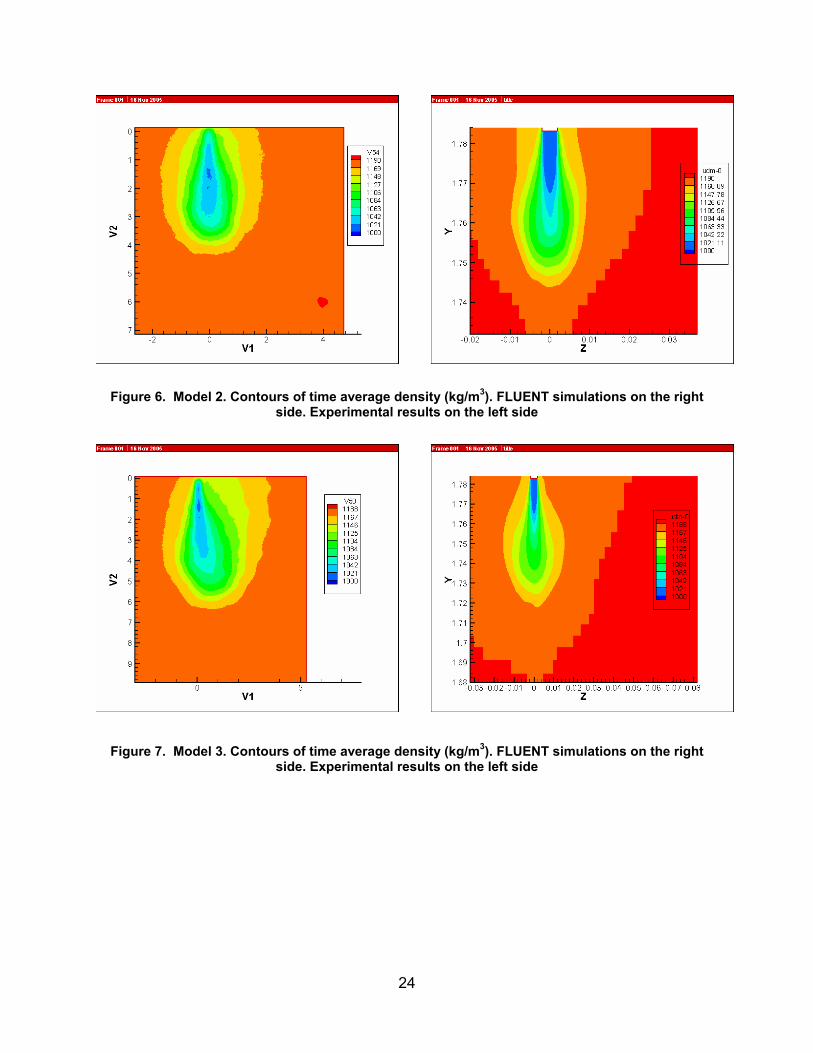
Figure 7. Model 3. Contours of time average density (kg/m3). FLUENT simulations on the right side. Experimental results on the left side
25
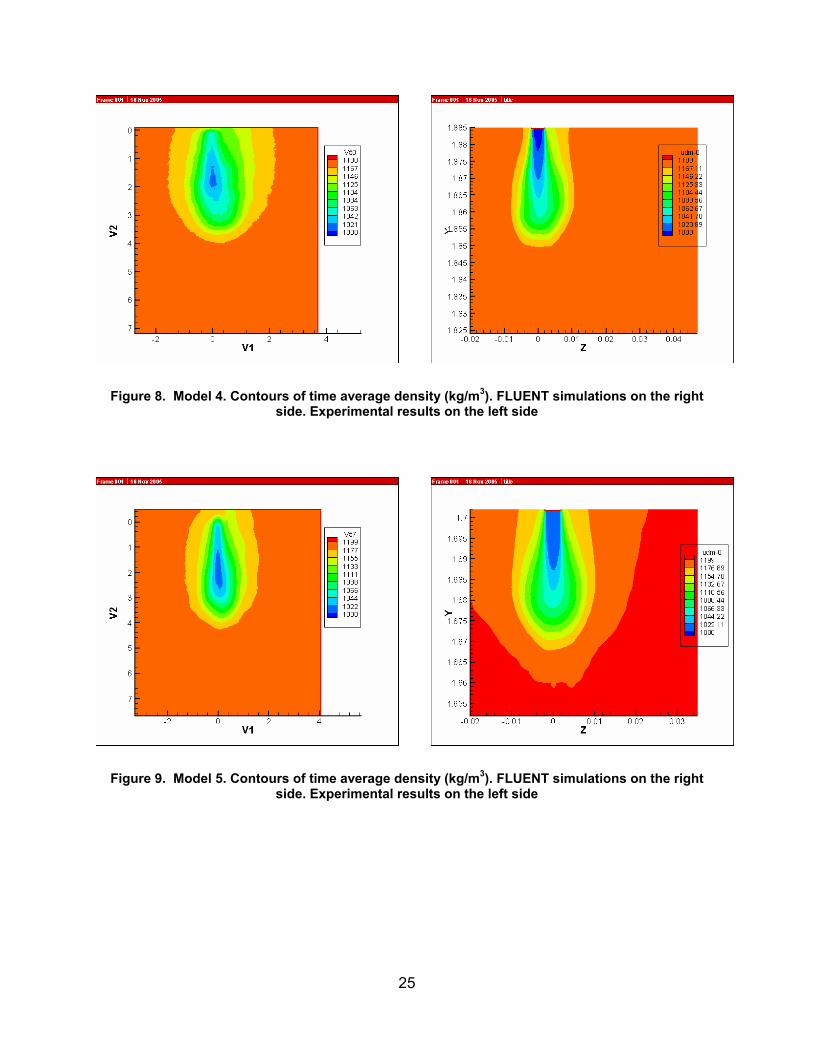
Figure 8. Model 4. Contours of time average density (kg/m3). FLUENT simulations on the right side. Experimental results on the left side
Figure 9. Model 5. Contours of time average density (kg/m3). FLUENT simulations on the right side. Experimental results on the left side
26
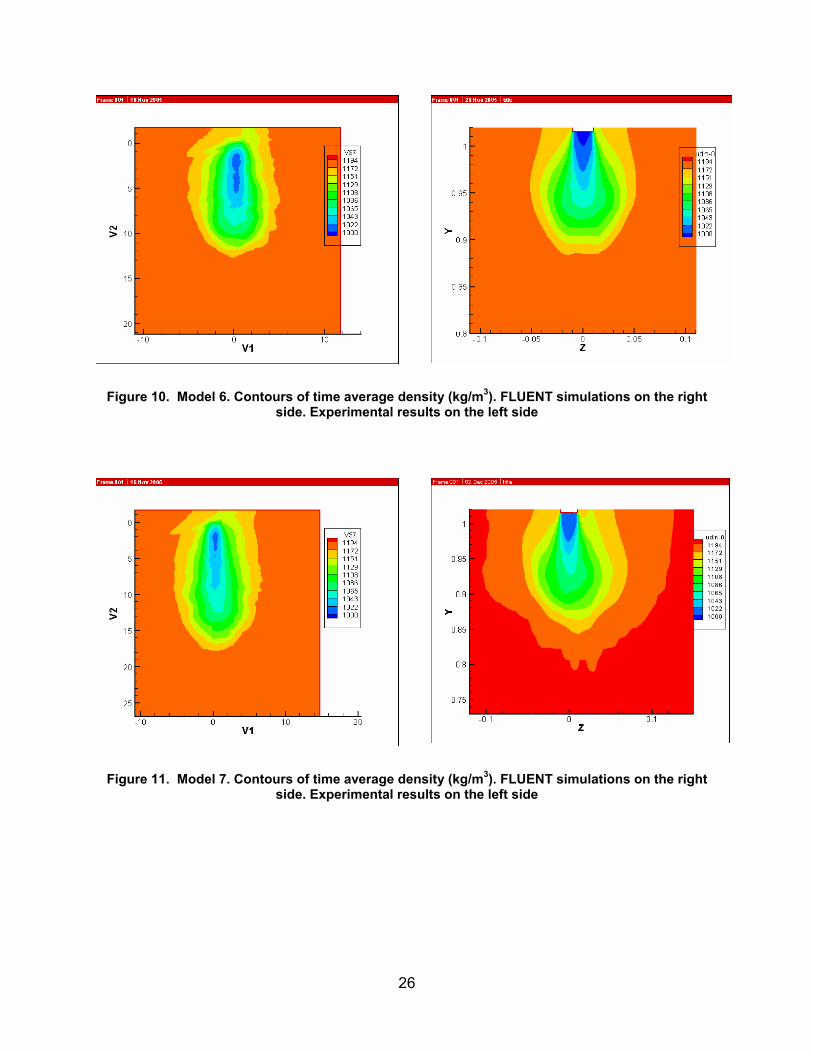
Figure 10. Model 6. Contours of time average density (kg/m3). FLUENT simulations on the right side. Experimental results on the left side
Figure 11. Model 7. Contours of time average density (kg/m3). FLUENT simulations on the right side. Experimental results on the left side
27
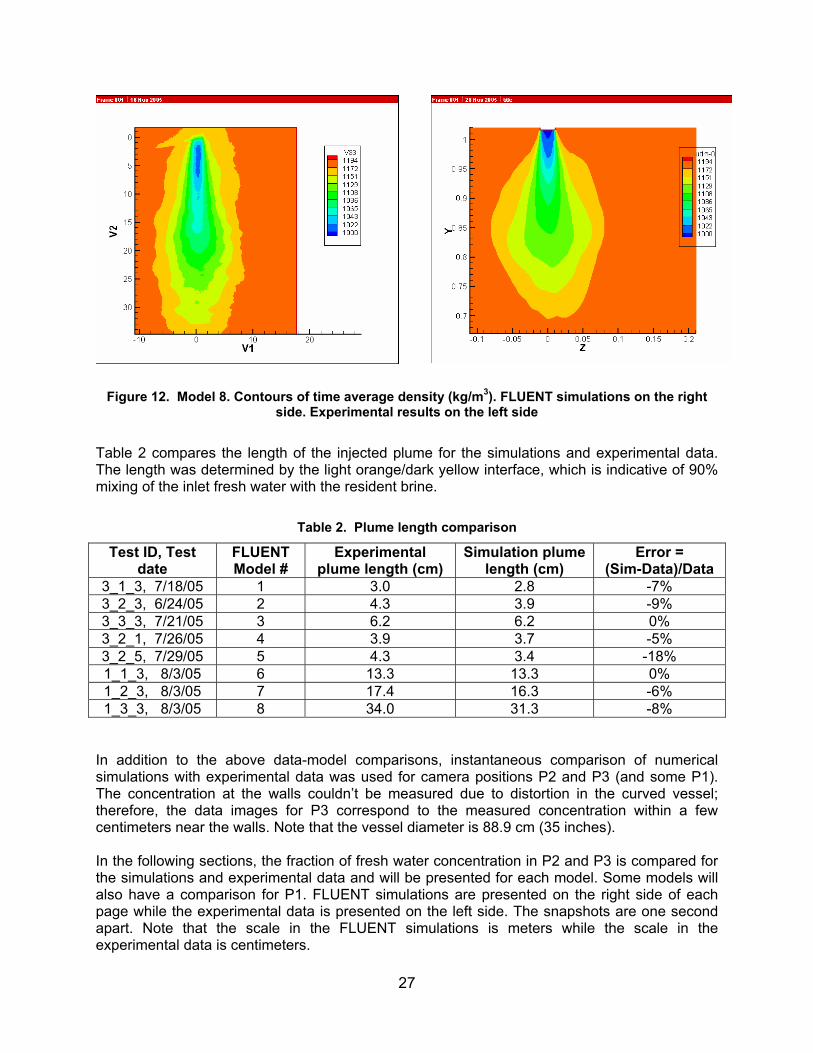
Figure 12. Model 8. Contours of time average density (kg/m3). FLUENT simulations on the right side. Experimental results on the left side
Table 2 compares the length of the injected plume for the simulations and experimental data. The length was determined by the light orange/dark yellow interface, which is indicative of 90% mixing of the inlet fresh water with the resident brine.
Table 2. Plume length comparison
Test ID, Test date
FLUENT Model #
Experimental plume length (cm)
Simulation plume length (cm)
Error = (Sim-Data)/Data
3_1_3, 7/18/05 1 3.0 2.8 -7% 3_2_3, 6/24/05 2 4.3 3.9 -9% 3_3_3, 7/21/05 3 6.2 6.2 0% 3_2_1, 7/26/05 4 3.9 3.7 -5% 3_2_5, 7/29/05 5 4.3 3.4 -18% 1_1_3, 8/3/05 6 13.3 13.3 0% 1_2_3, 8/3/05 7 17.4 16.3 -6% 1_3_3, 8/3/05 8 34.0 31.3 -8%
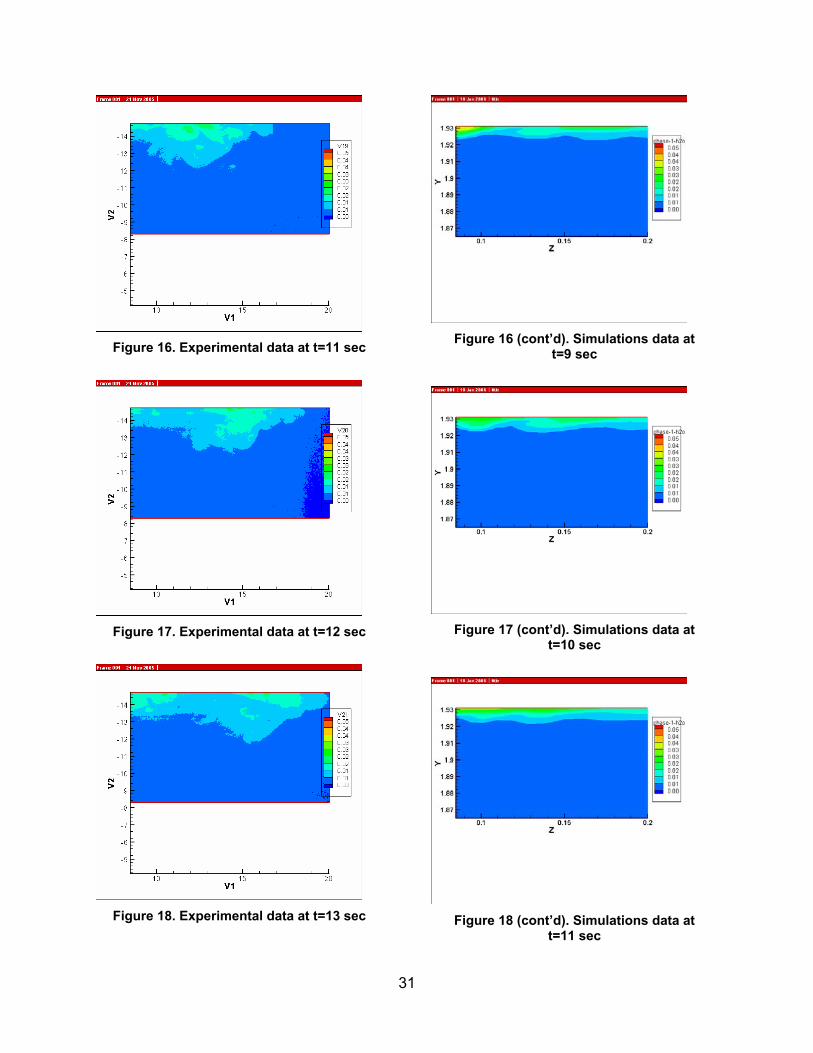
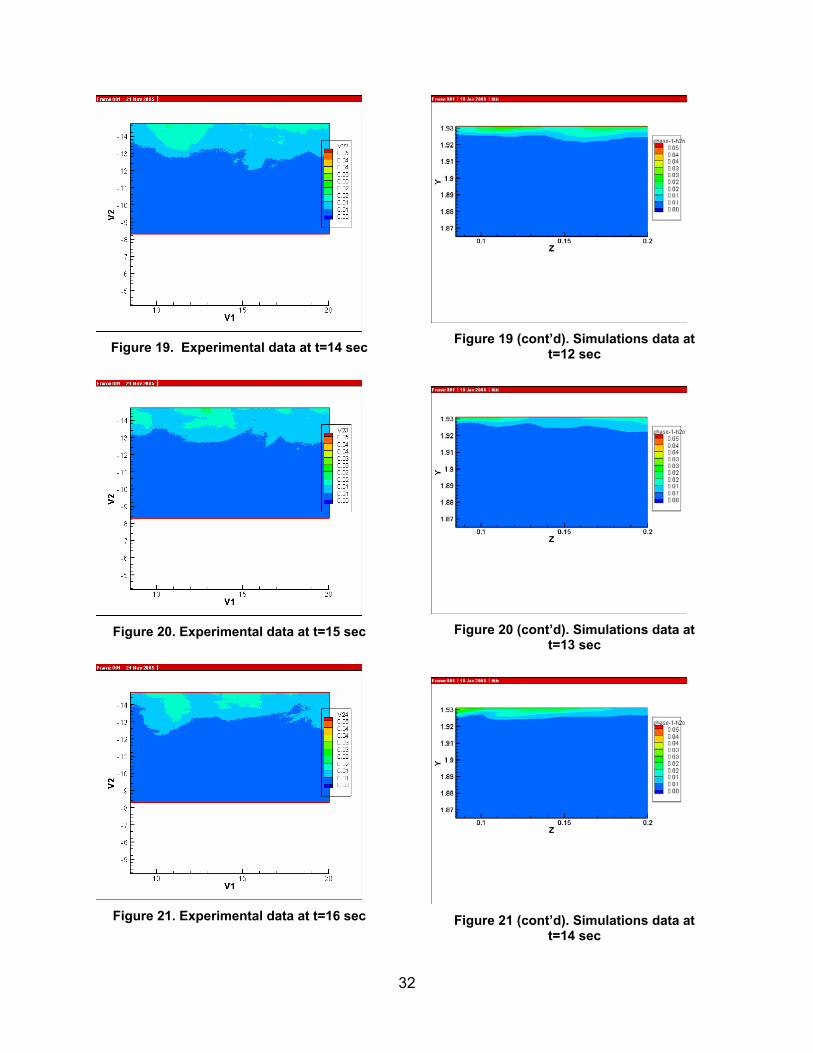
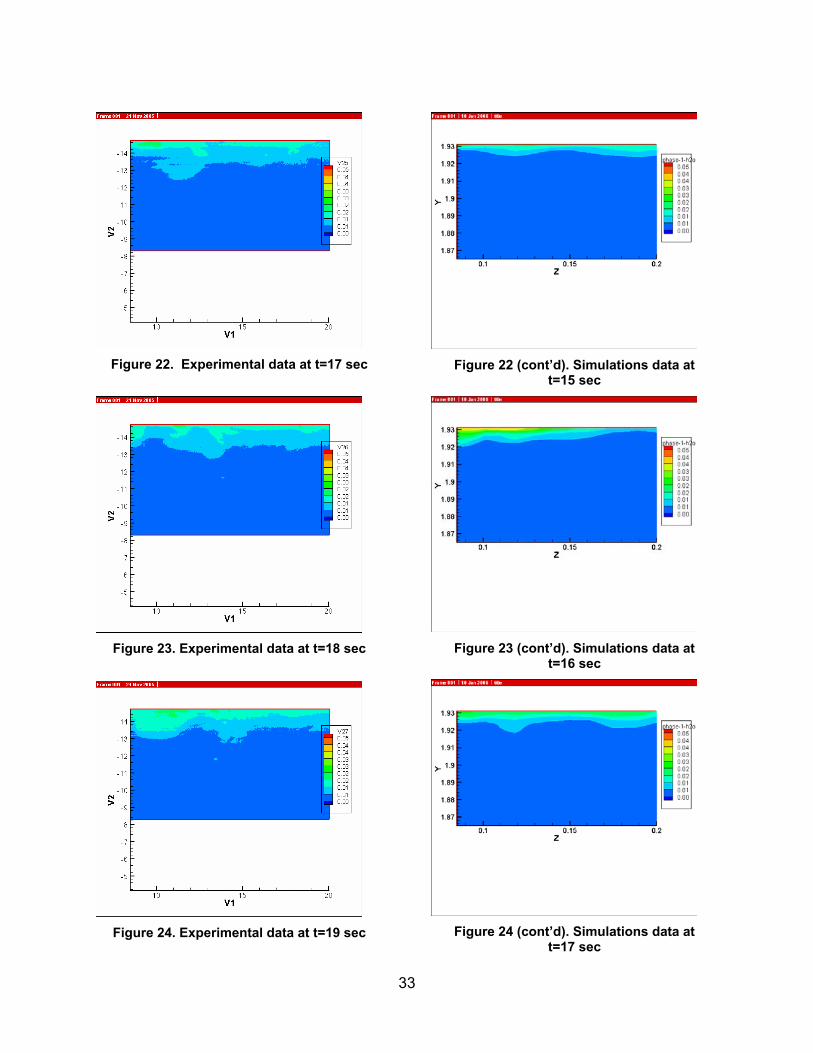
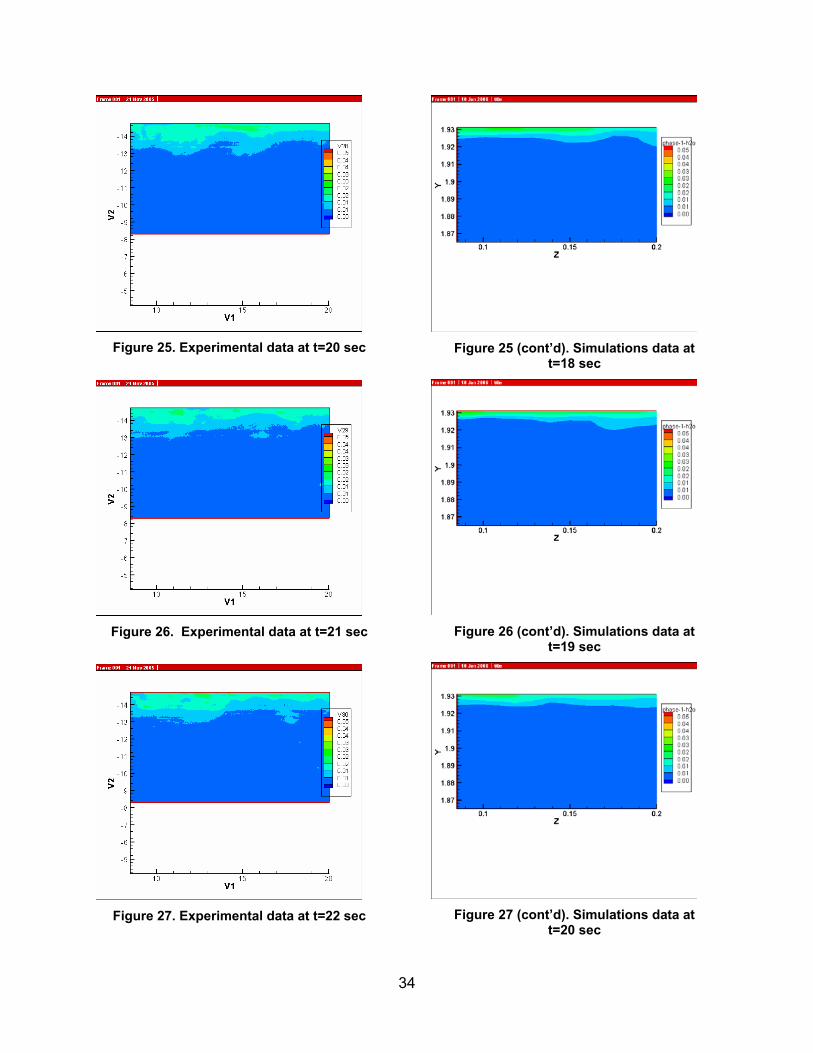
In addition to the above data-model comparisons, instantaneous comparison of numerical simulations with experimental data was used for camera positions P2 and P3 (and some P1). The concentration at the walls couldn’t be measured due to distortion in the curved vessel; therefore, the data images for P3 correspond to the measured concentration within a few centimeters near the walls. Note that the vessel diameter is 88.9 cm (35 inches). In the following sections, the fraction of fresh water concentration in P2 and P3 is compared for the simulations and experimental data and will be presented for each model. Some models will also have a comparison for P1. FLUENT simulations are presented on the right side of each page while the experimental data is presented on the left side. The snapshots are one second apart. Note that the scale in the FLUENT simulations is meters while the scale in the experimental data is centimeters.

28
Note that some figures from the Fluent simulations were made from FLUENT movies using the “hard copy options” and therefore these figures do not have a Y-Z coordinates. These figures correspond to a frame that is exactly equal in dimensions to the frame of the compared experimental data.
29
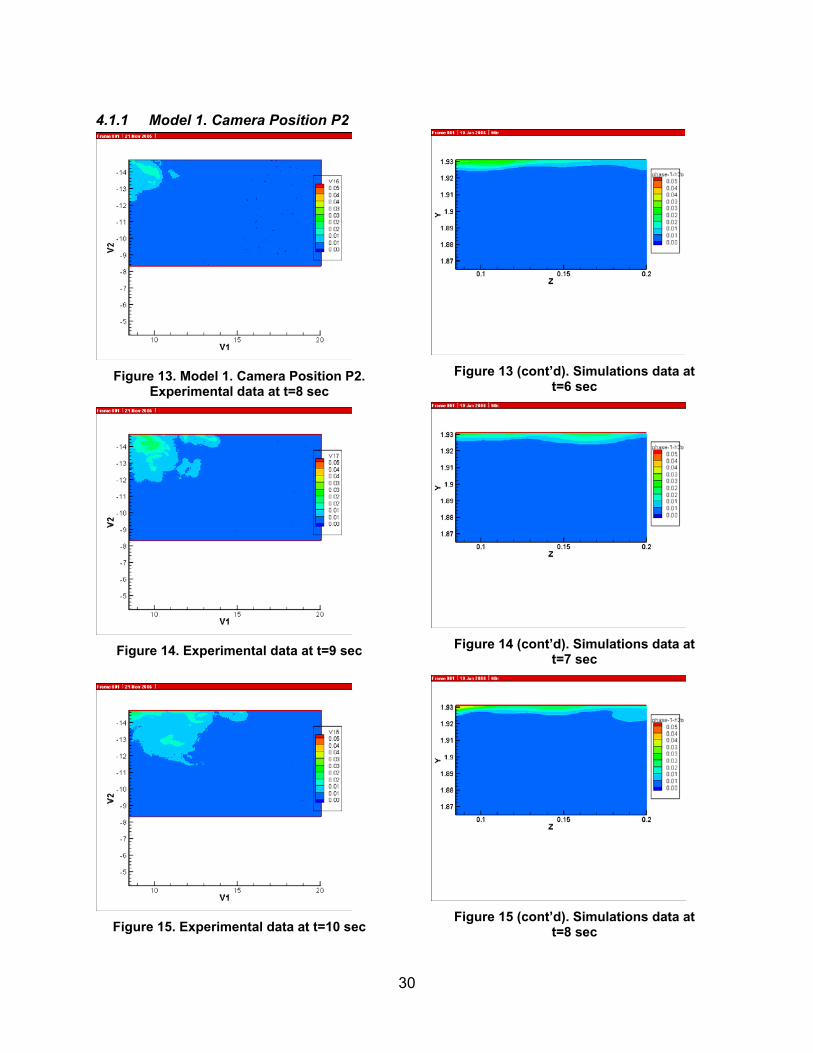
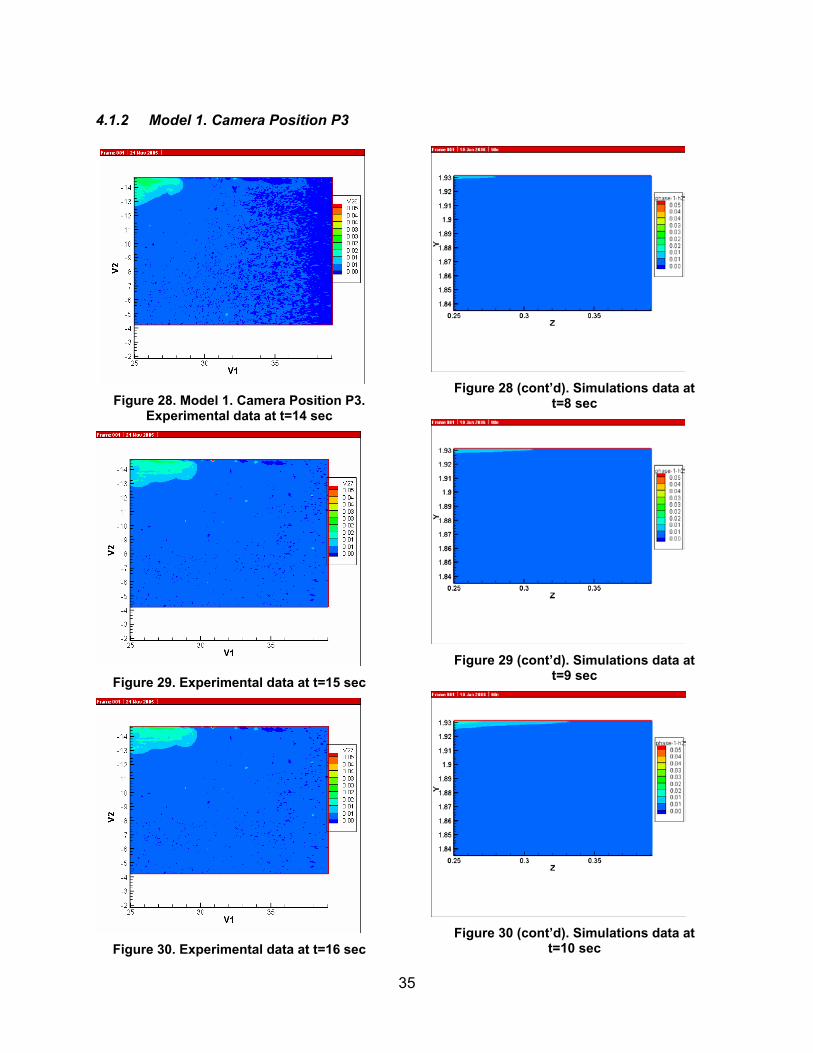
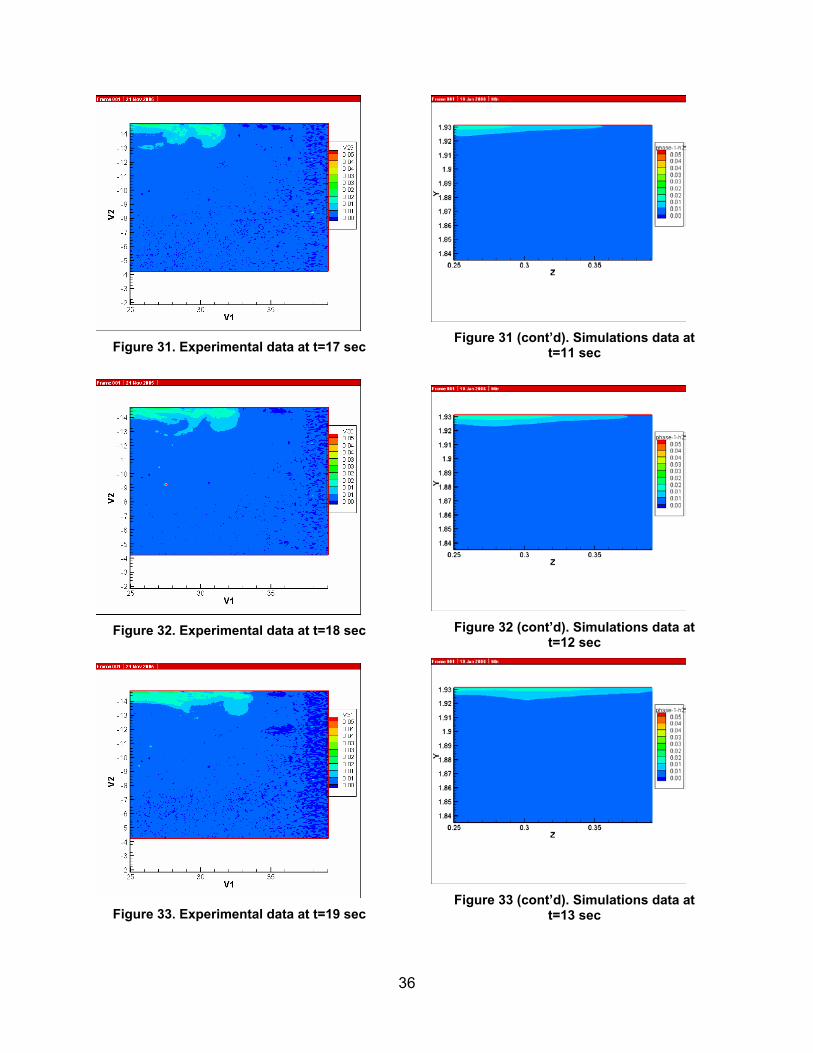
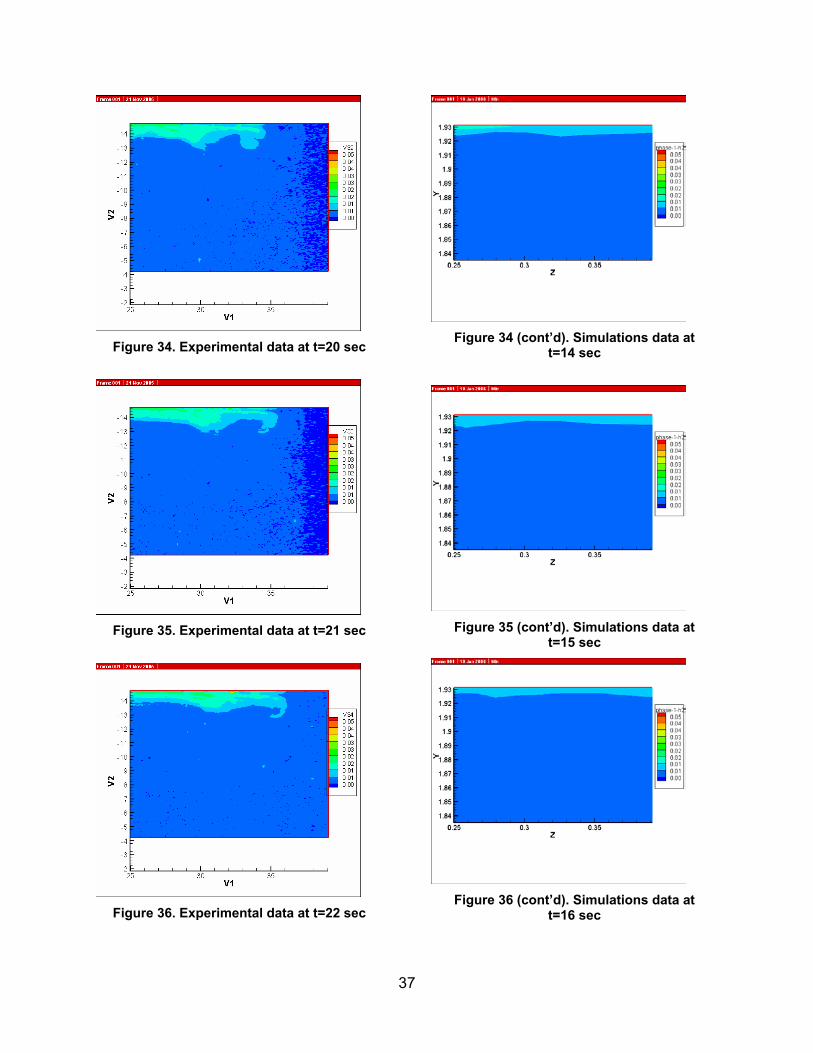
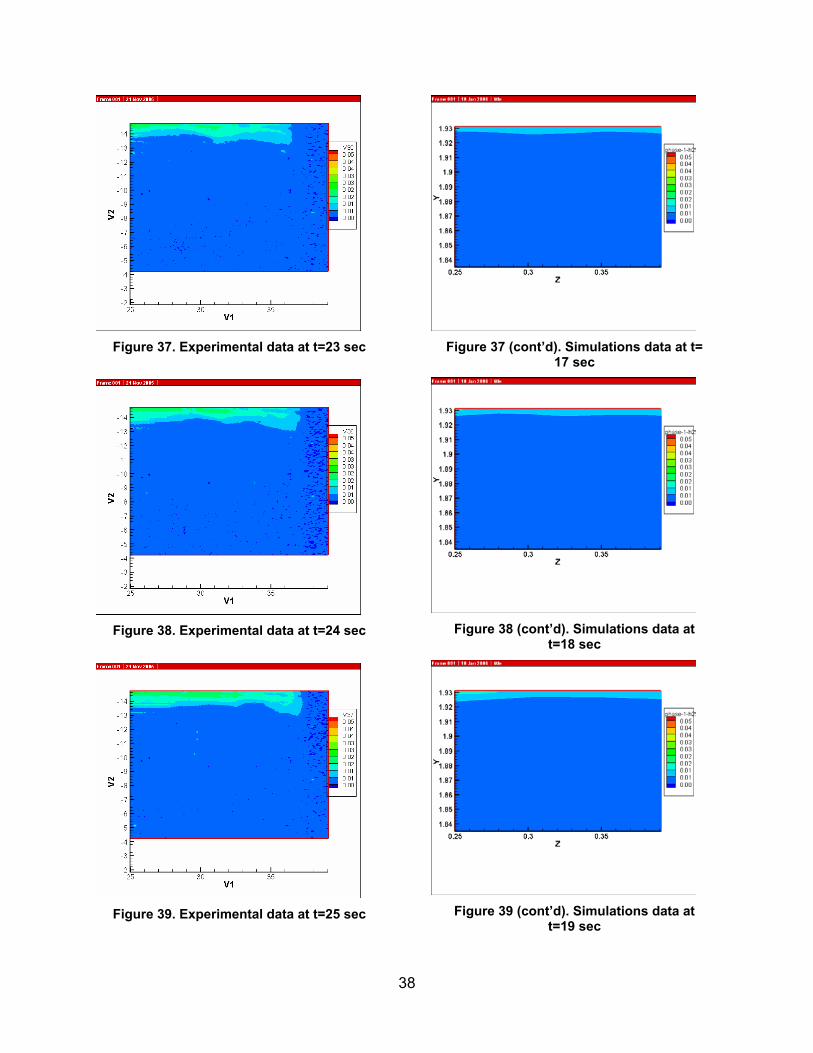
4.1 Model 1 This is test ID 3_1_3 where the 0.15 inch tube is used for the injection of fresh water and is placed 5.8 inch deep below the brine-air interface. The equivalent full-scale cavern flow rate is 80,000 bbl/day. The experimental data shown correspond to the test performed on 7/18/2005. Section 4.1.1 shows data-model comparisons for camera position P2, while Section 4.1.2 shows the results for camera position P3. For both camera positions, the mixing zone depth is underpredicted by the simulations. In addition, the simulated plume moves faster than the experimental plume (the simulated plume reaches frame P3 at time t=8 sec while the experimental plume reaches the frame at t=14 sec).
30
4.1.1 Model 1. Camera Position P2
Figure 13. Model 1. Camera Position P2.
Experimental data at t=8 sec
Figure 14. Experimental data at t=9 sec
Figure 15. Experimental data at t=10 sec
Figure 13 (cont’d). Simulations data at
t=6 sec
Figure 14 (cont’d). Simulations data at
t=7 sec
Figure 15 (cont’d). Simulations data at
t=8 sec
31
Figure 16. Experimental data at t=11 sec
Figure 17. Experimental data at t=12 sec
Figure 18. Experimental data at t=13 sec
Figure 16 (cont’d). Simulations data at
t=9 sec
Figure 17 (cont’d). Simulations data at
t=10 sec
Figure 18 (cont’d). Simulations data at
t=11 sec
32
Figure 19. Experimental data at t=14 sec
Figure 20. Experimental data at t=15 sec
Figure 21. Experimental data at t=16 sec
Figure 19 (cont’d). Simulations data at
t=12 sec
Figure 20 (cont’d). Simulations data at
t=13 sec
Figure 21 (cont’d). Simulations data at
t=14 sec
33
Figure 22. Experimental data at t=17 sec
Figure 23. Experimental data at t=18 sec
Figure 24. Experimental data at t=19 sec
Figure 22 (cont’d). Simulations data at
t=15 sec
Figure 23 (cont’d). Simulations data at
t=16 sec
Figure 24 (cont’d). Simulations data at
t=17 sec
34
Figure 25. Experimental data at t=20 sec
Figure 26. Experimental data at t=21 sec
Figure 27. Experimental data at t=22 sec
Figure 25 (cont’d). Simulations data at
t=18 sec
Figure 26 (cont’d). Simulations data at
t=19 sec
Figure 27 (cont’d). Simulations data at
t=20 sec
35
4.1.2 Model 1. Camera Position P3
Figure 28. Model 1. Camera Position P3.
Experimental data at t=14 sec
Figure 29. Experimental data at t=15 sec
Figure 30. Experimental data at t=16 sec
Figure 28 (cont’d). Simulations data at
t=8 sec
Figure 29 (cont’d). Simulations data at
t=9 sec
Figure 30 (cont’d). Simulations data at
t=10 sec
36
Figure 31. Experimental data at t=17 sec
Figure 32. Experimental data at t=18 sec
Figure 33. Experimental data at t=19 sec
Figure 31 (cont’d). Simulations data at
t=11 sec
Figure 32 (cont’d). Simulations data at
t=12 sec
Figure 33 (cont’d). Simulations data at
t=13 sec
37
Figure 34. Experimental data at t=20 sec
Figure 35. Experimental data at t=21 sec
Figure 36. Experimental data at t=22 sec
Figure 34 (cont’d). Simulations data at
t=14 sec
Figure 35 (cont’d). Simulations data at
t=15 sec
Figure 36 (cont’d). Simulations data at
t=16 sec
38
Figure 37. Experimental data at t=23 sec
Figure 38. Experimental data at t=24 sec
Figure 39. Experimental data at t=25 sec
Figure 37 (cont’d). Simulations data at t=
17 sec
Figure 38 (cont’d). Simulations data at
t=18 sec
Figure 39 (cont’d). Simulations data at
t=19 sec
39
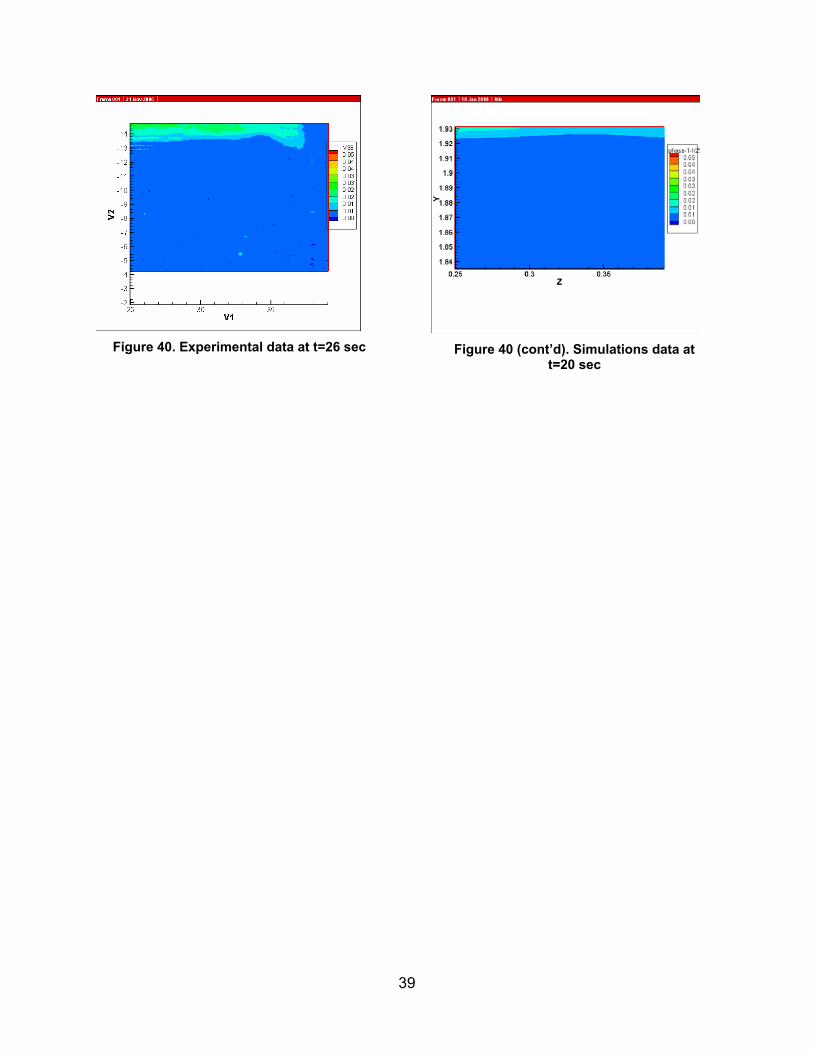
Figure 40. Experimental data at t=26 sec
Figure 40 (cont’d). Simulations data at
t=20 sec
40
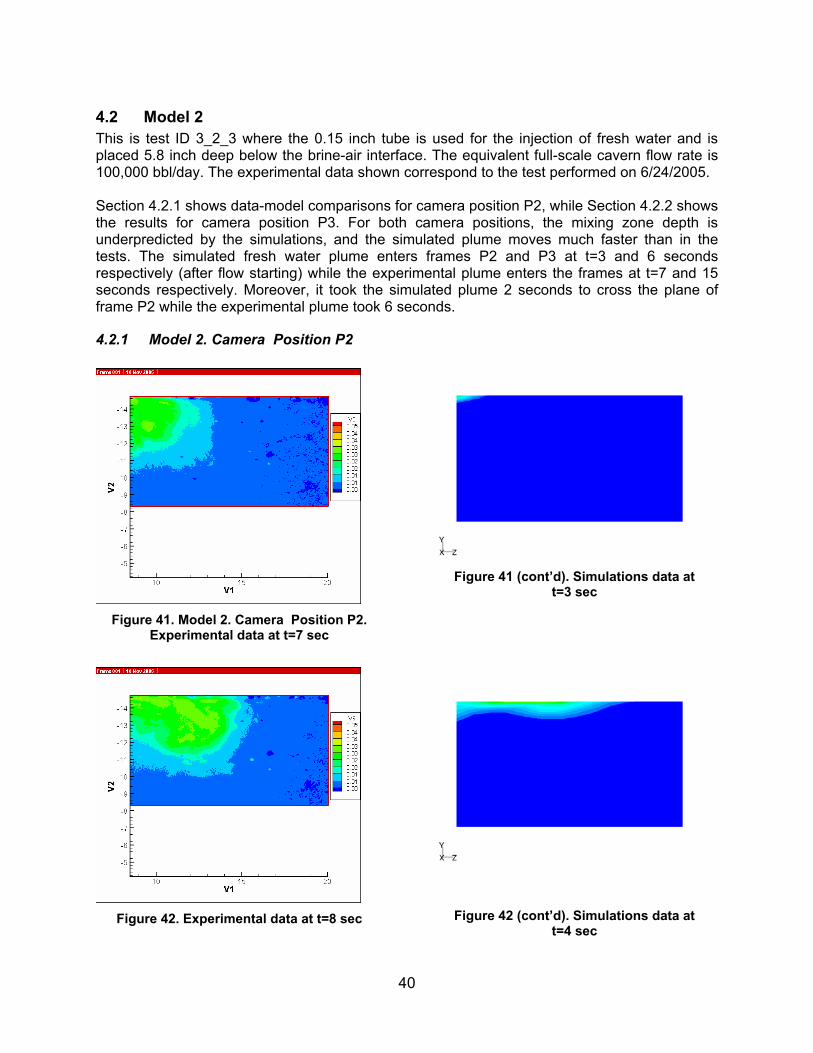
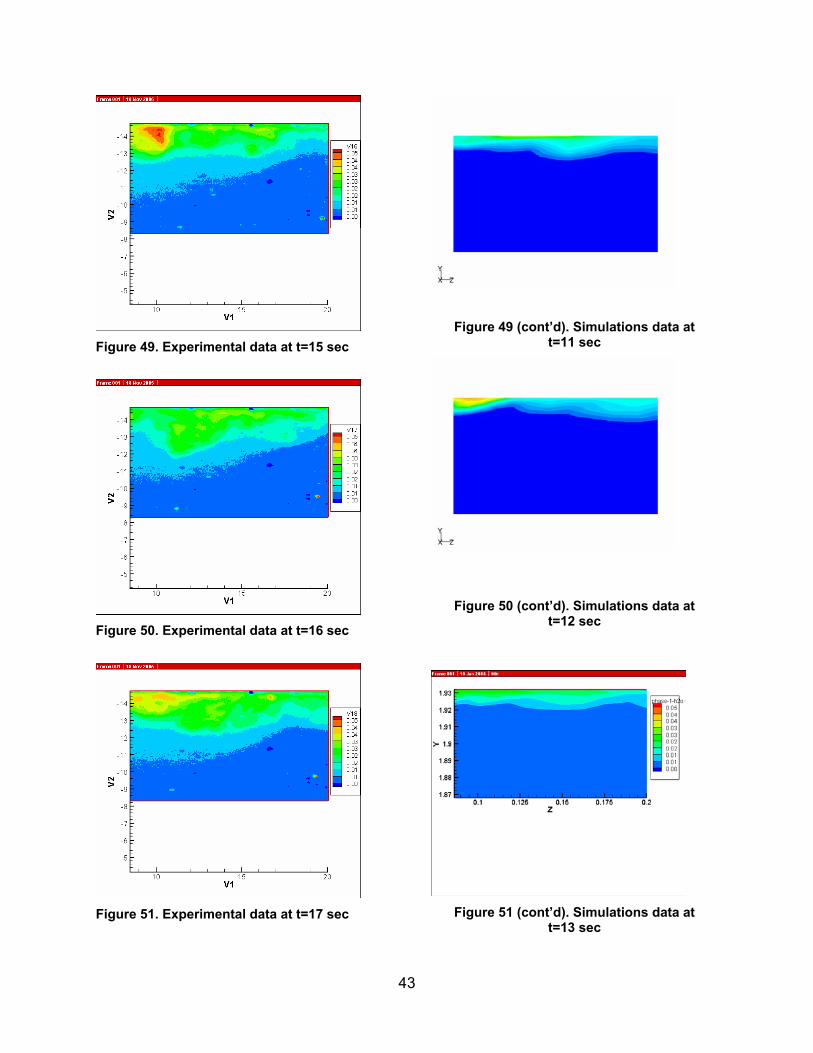
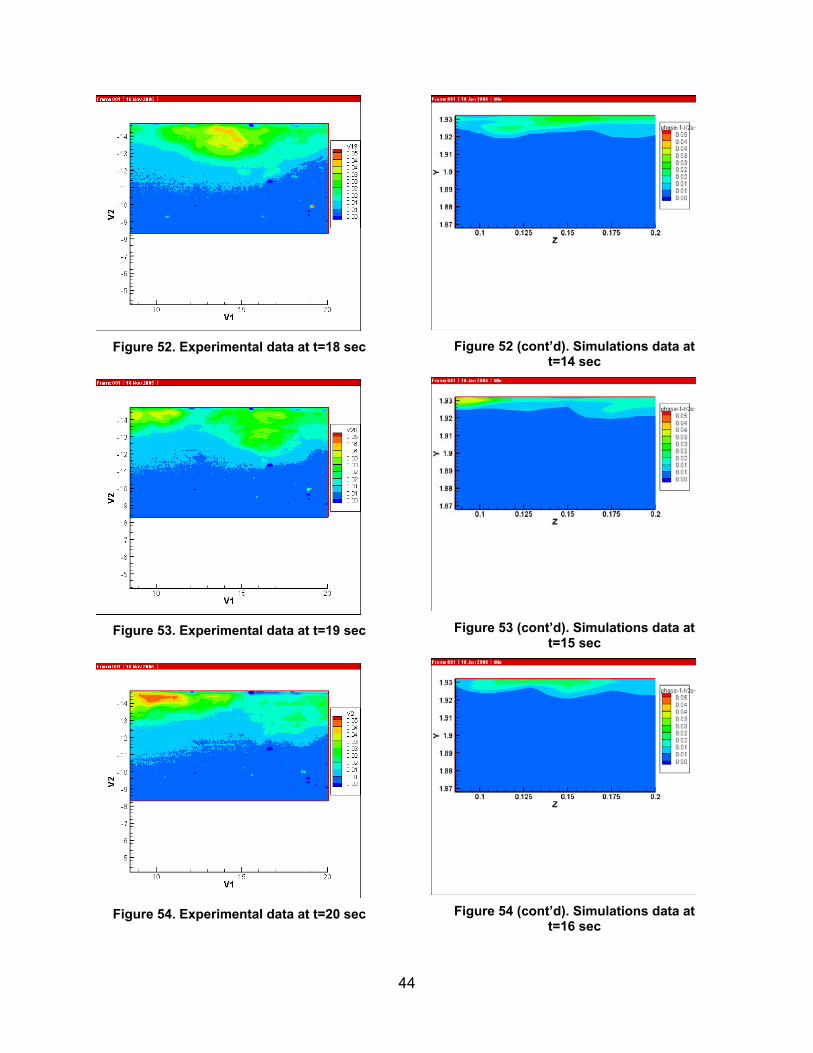
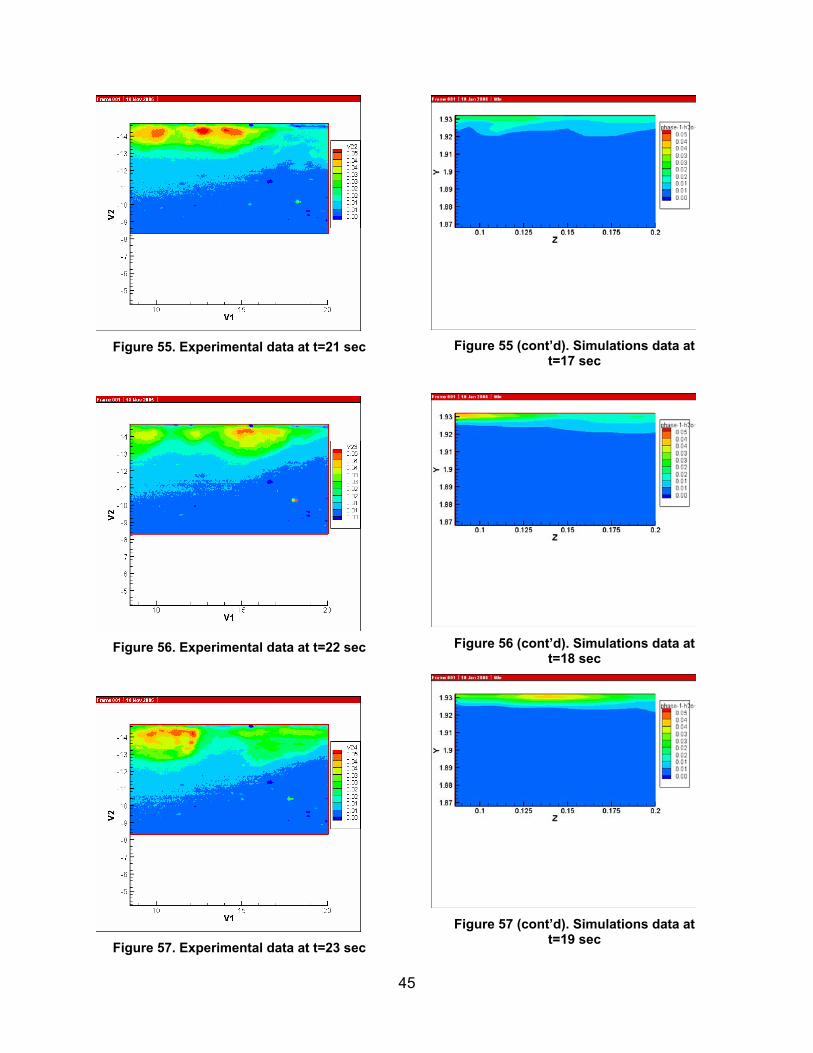
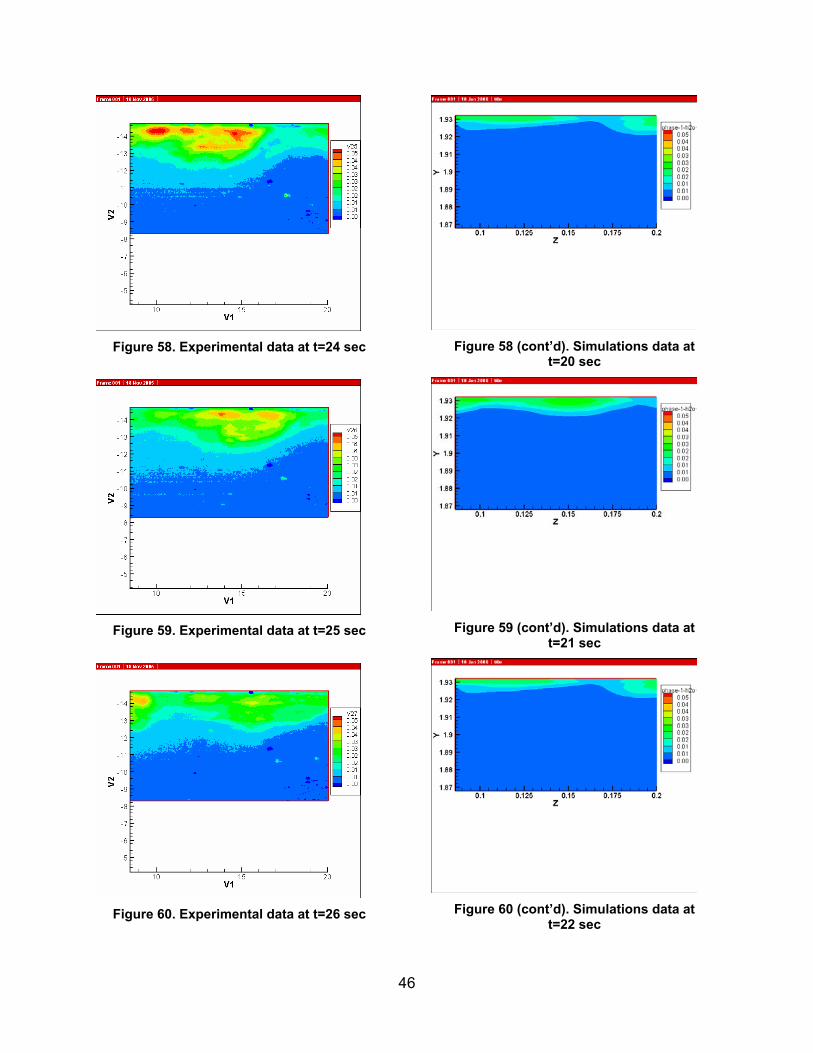
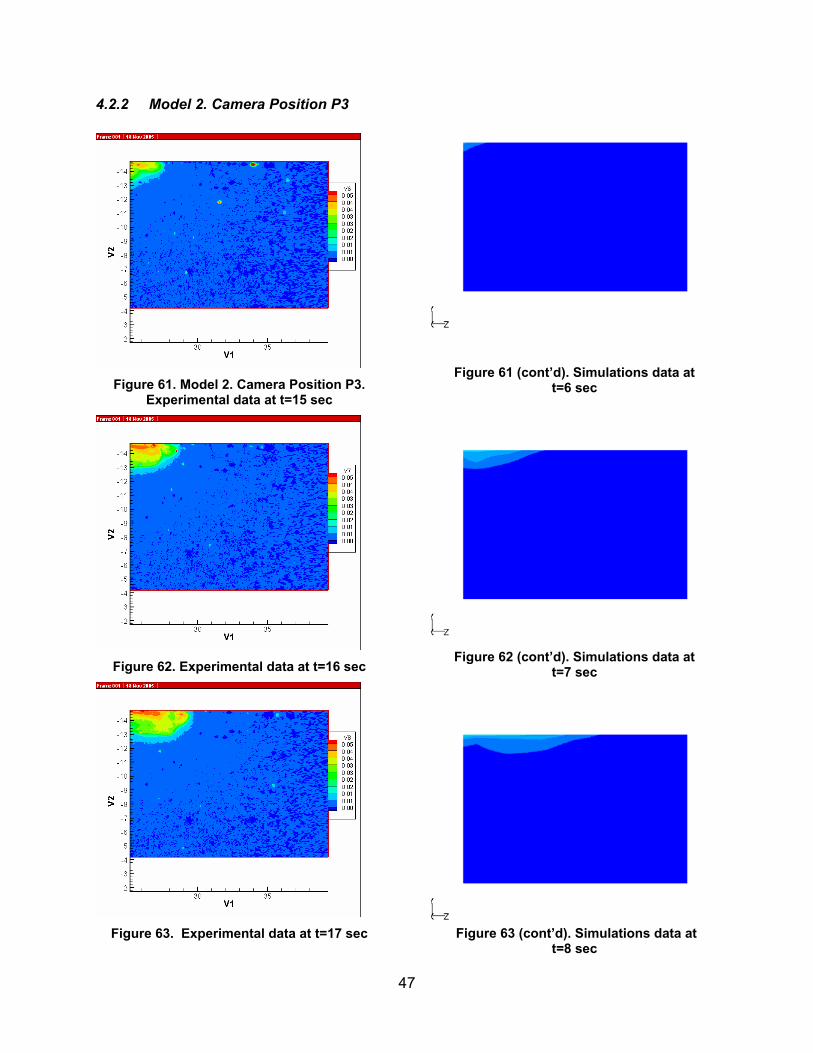
4.2 Model 2 This is test ID 3_2_3 where the 0.15 inch tube is used for the injection of fresh water and is placed 5.8 inch deep below the brine-air interface. The equivalent full-scale cavern flow rate is 100,000 bbl/day. The experimental data shown correspond to the test performed on 6/24/2005. Section 4.2.1 shows data-model comparisons for camera position P2, while Section 4.2.2 shows the results for camera position P3. For both camera positions, the mixing zone depth is underpredicted by the simulations, and the simulated plume moves much faster than in the tests. The simulated fresh water plume enters frames P2 and P3 at t=3 and 6 seconds respectively (after flow starting) while the experimental plume enters the frames at t=7 and 15 seconds respectively. Moreover, it took the simulated plume 2 seconds to cross the plane of frame P2 while the experimental plume took 6 seconds.
4.2.1 Model 2. Camera Position P2
Figure 41. Model 2. Camera Position P2.
Experimental data at t=7 sec
Figure 42. Experimental data at t=8 sec
Figure 41 (cont’d). Simulations data at
t=3 sec
Figure 42 (cont’d). Simulations data at t=4 sec
41
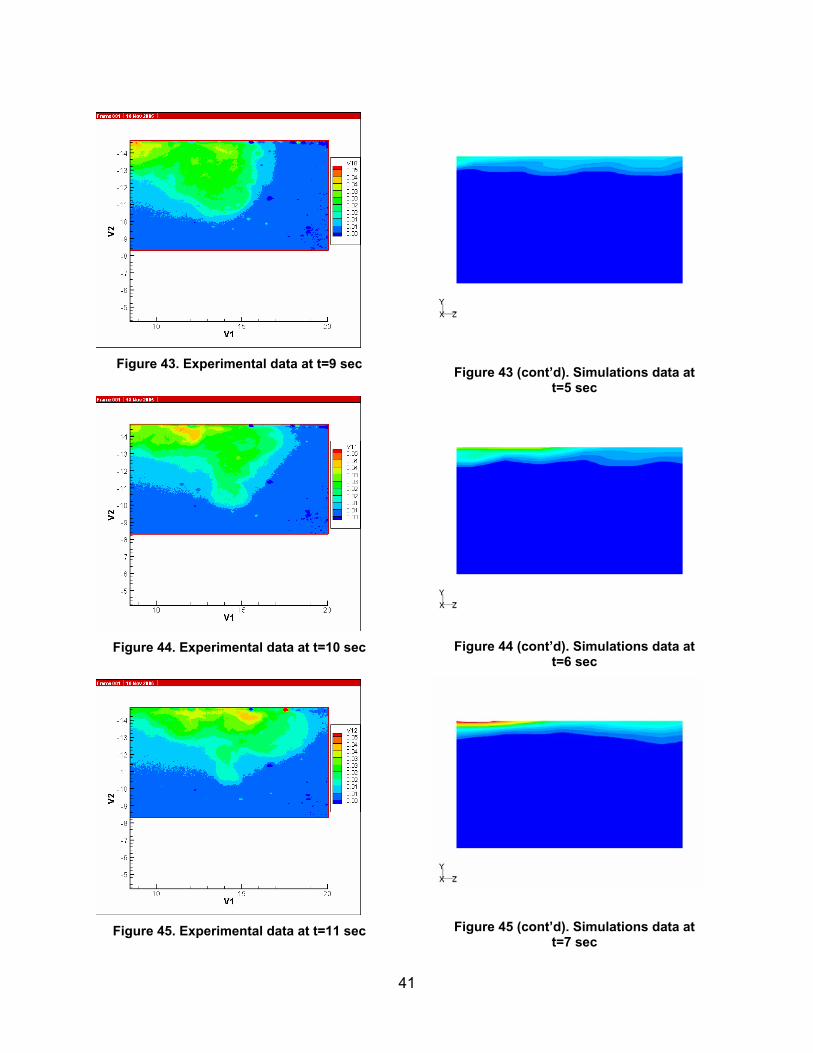
Figure 43. Experimental data at t=9 sec
Figure 44. Experimental data at t=10 sec
Figure 45. Experimental data at t=11 sec
Figure 43 (cont’d). Simulations data at t=5 sec
Figure 44 (cont’d). Simulations data at t=6 sec
Figure 45 (cont’d). Simulations data at t=7 sec
42
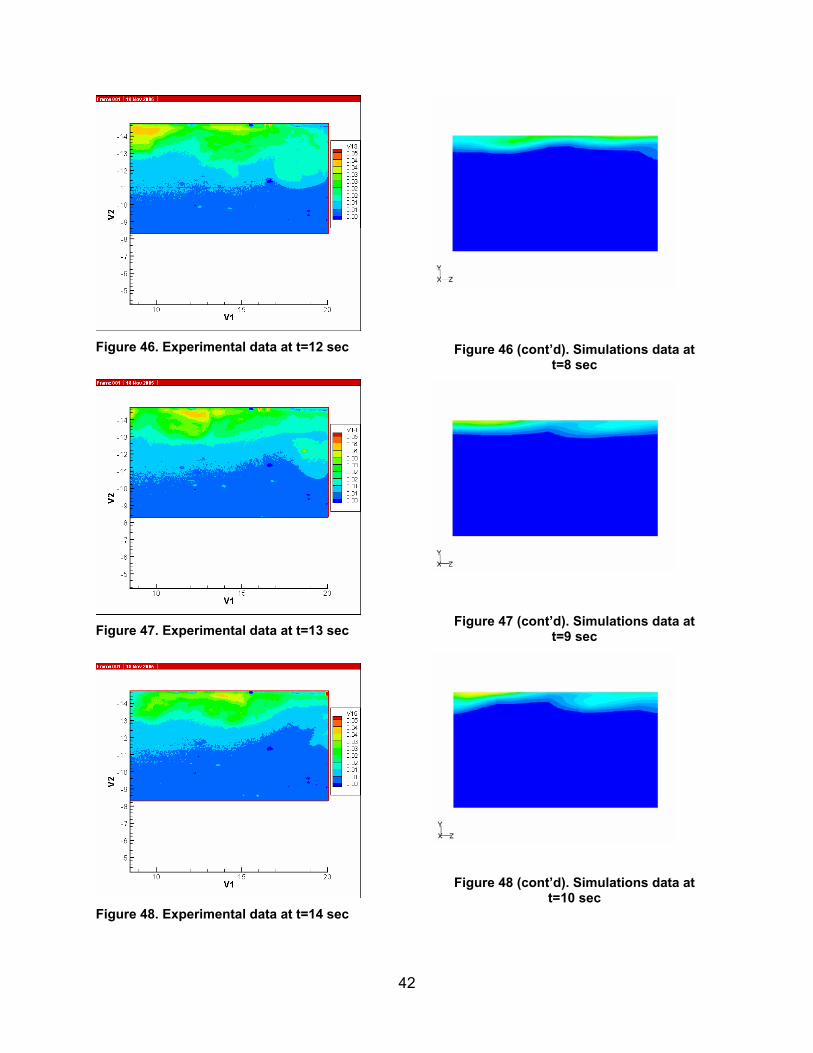
Figure 46. Experimental data at t=12 sec
Figure 47. Experimental data at t=13 sec
Figure 48. Experimental data at t=14 sec
Figure 46 (cont’d). Simulations data at t=8 sec
Figure 47 (cont’d). Simulations data at t=9 sec
Figure 48 (cont’d). Simulations data at t=10 sec
43
Figure 49. Experimental data at t=15 sec
Figure 50. Experimental data at t=16 sec
Figure 51. Experimental data at t=17 sec
Figure 49 (cont’d). Simulations data at t=11 sec
Figure 50 (cont’d). Simulations data at t=12 sec
Figure 51 (cont’d). Simulations data at
t=13 sec
44
Figure 52. Experimental data at t=18 sec
Figure 53. Experimental data at t=19 sec
Figure 54. Experimental data at t=20 sec
Figure 52 (cont’d). Simulations data at
t=14 sec
Figure 53 (cont’d). Simulations data at
t=15 sec
Figure 54 (cont’d). Simulations data at
t=16 sec
45
Figure 55. Experimental data at t=21 sec
Figure 56. Experimental data at t=22 sec
Figure 57. Experimental data at t=23 sec
Figure 55 (cont’d). Simulations data at
t=17 sec
Figure 56 (cont’d). Simulations data at
t=18 sec
Figure 57 (cont’d). Simulations data at
t=19 sec
46
Figure 58. Experimental data at t=24 sec
Figure 59. Experimental data at t=25 sec
Figure 60. Experimental data at t=26 sec
Figure 58 (cont’d). Simulations data at
t=20 sec
Figure 59 (cont’d). Simulations data at
t=21 sec
Figure 60 (cont’d). Simulations data at
t=22 sec
47
4.2.2 Model 2. Camera Position P3
Figure 61. Model 2. Camera Position P3.
Experimental data at t=15 sec
Figure 62. Experimental data at t=16 sec
Figure 63. Experimental data at t=17 sec
Figure 61 (cont’d). Simulations data at t=6 sec
Figure 62 (cont’d). Simulations data at
t=7 sec
Figure 63 (cont’d). Simulations data at t=8 sec
48
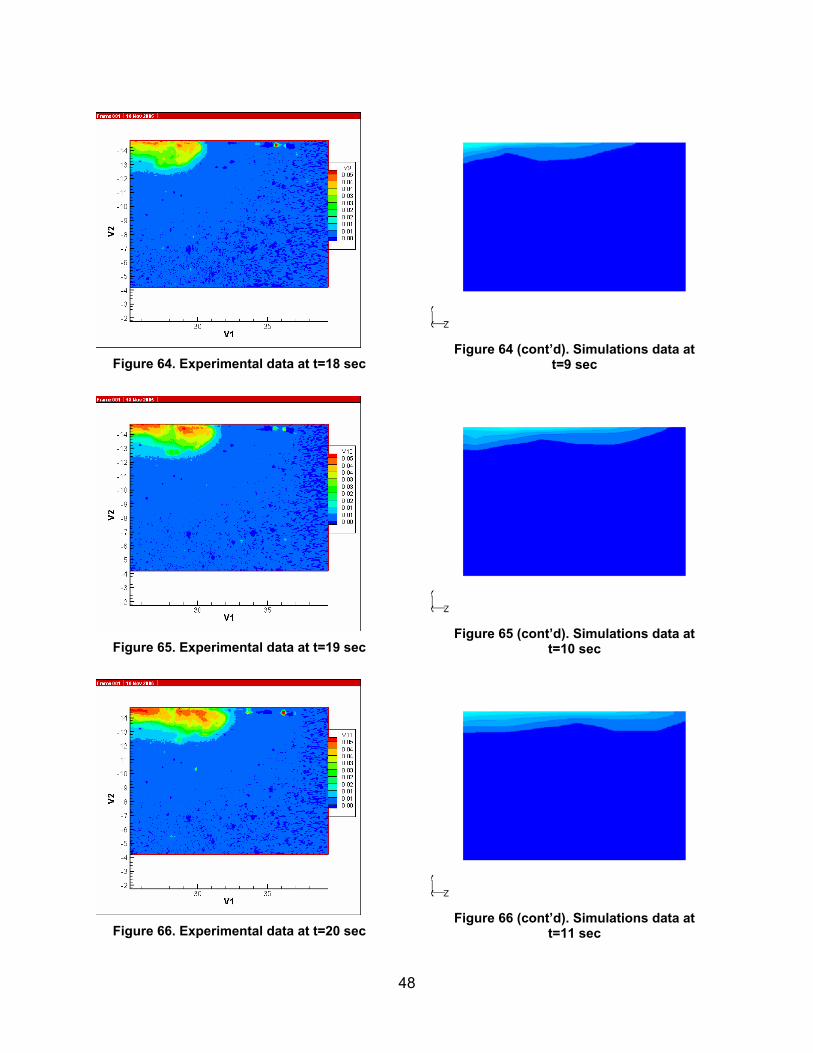
Figure 64. Experimental data at t=18 sec
Figure 65. Experimental data at t=19 sec
Figure 66. Experimental data at t=20 sec
Figure 64 (cont’d). Simulations data at
t=9 sec
Figure 65 (cont’d). Simulations data at
t=10 sec
Figure 66 (cont’d). Simulations data at
t=11 sec
49
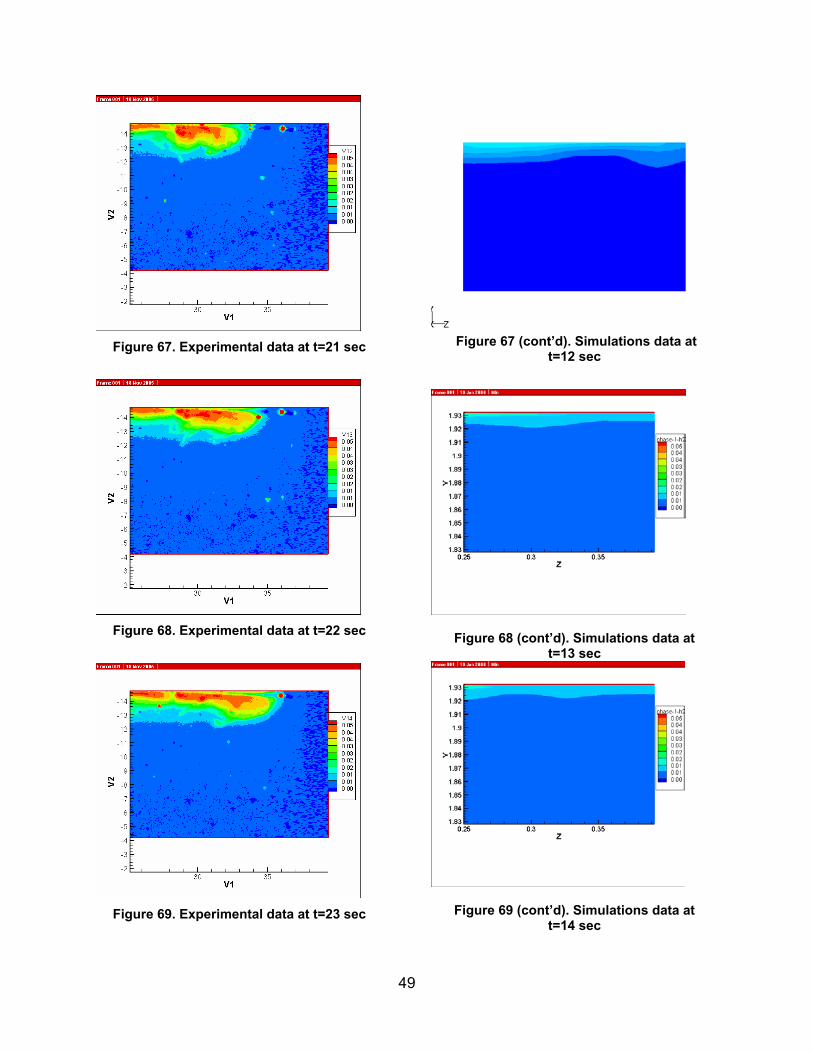
Figure 67. Experimental data at t=21 sec
Figure 68. Experimental data at t=22 sec
Figure 69. Experimental data at t=23 sec
Figure 67 (cont’d). Simulations data at t=12 sec
Figure 68 (cont’d). Simulations data at t=13 sec
Figure 69 (cont’d). Simulations data at t=14 sec
50
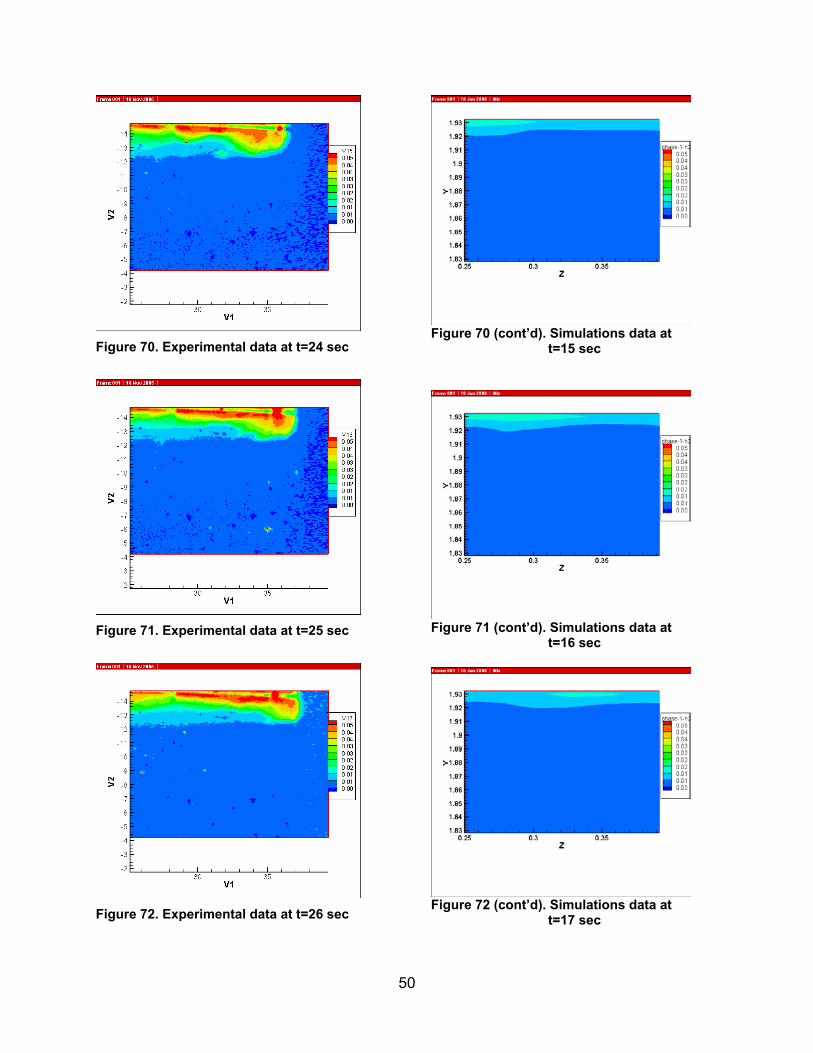
Figure 70. Experimental data at t=24 sec
Figure 71. Experimental data at t=25 sec
Figure 72. Experimental data at t=26 sec
Figure 70 (cont’d). Simulations data at
t=15 sec
Figure 71 (cont’d). Simulations data at
t=16 sec
Figure 72 (cont’d). Simulations data at
t=17 sec
51
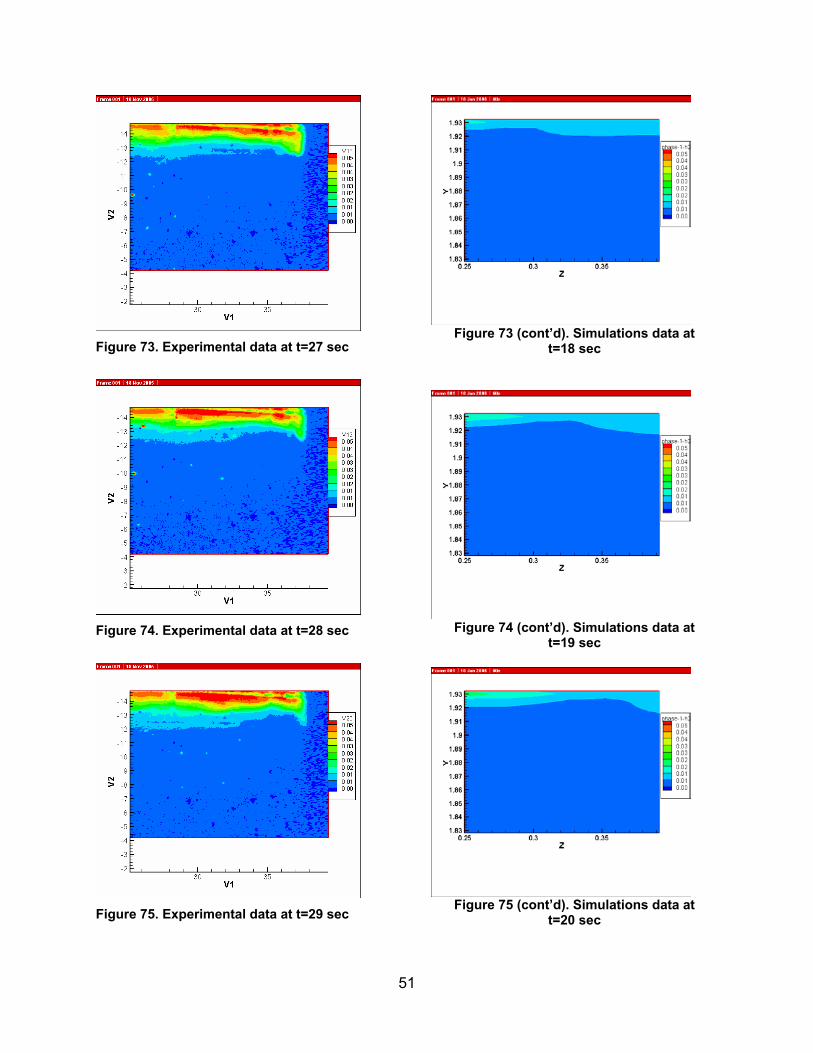
Figure 73. Experimental data at t=27 sec
Figure 74. Experimental data at t=28 sec
Figure 75. Experimental data at t=29 sec
Figure 73 (cont’d). Simulations data at
t=18 sec
Figure 74 (cont’d). Simulations data at
t=19 sec
Figure 75 (cont’d). Simulations data at
t=20 sec
52
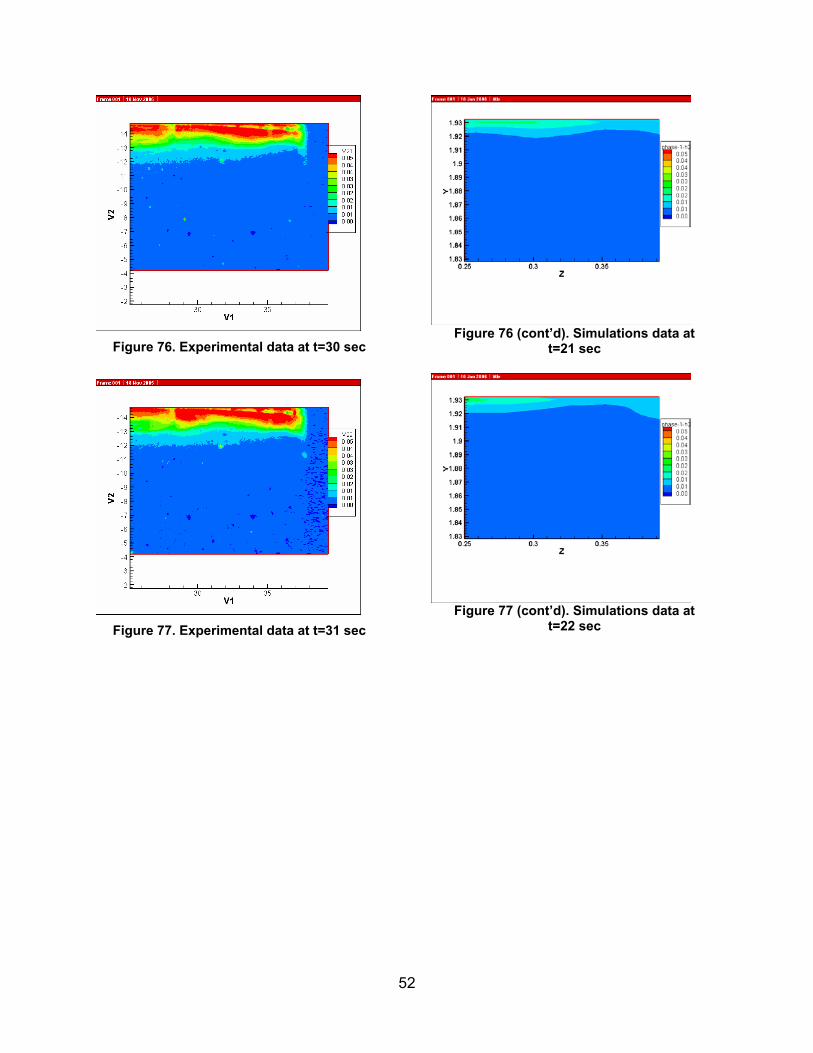
Figure 76. Experimental data at t=30 sec
Figure 77. Experimental data at t=31 sec
Figure 76 (cont’d). Simulations data at
t=21 sec
Figure 77 (cont’d). Simulations data at
t=22 sec
53
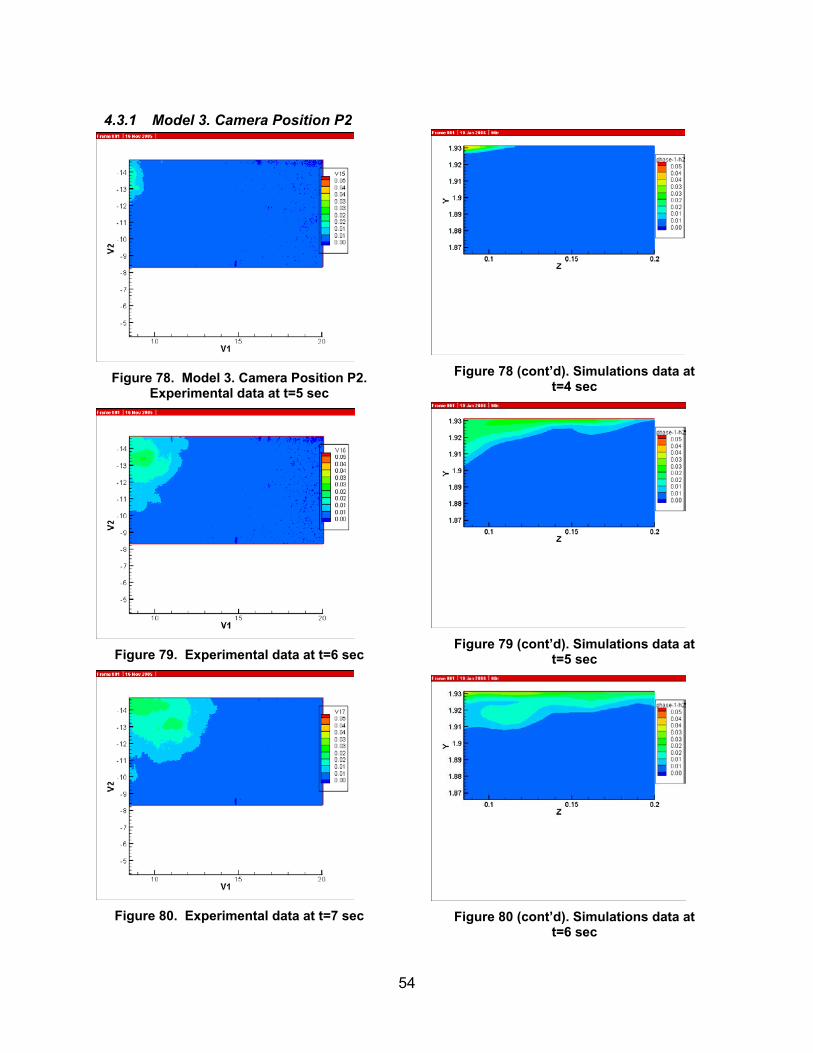
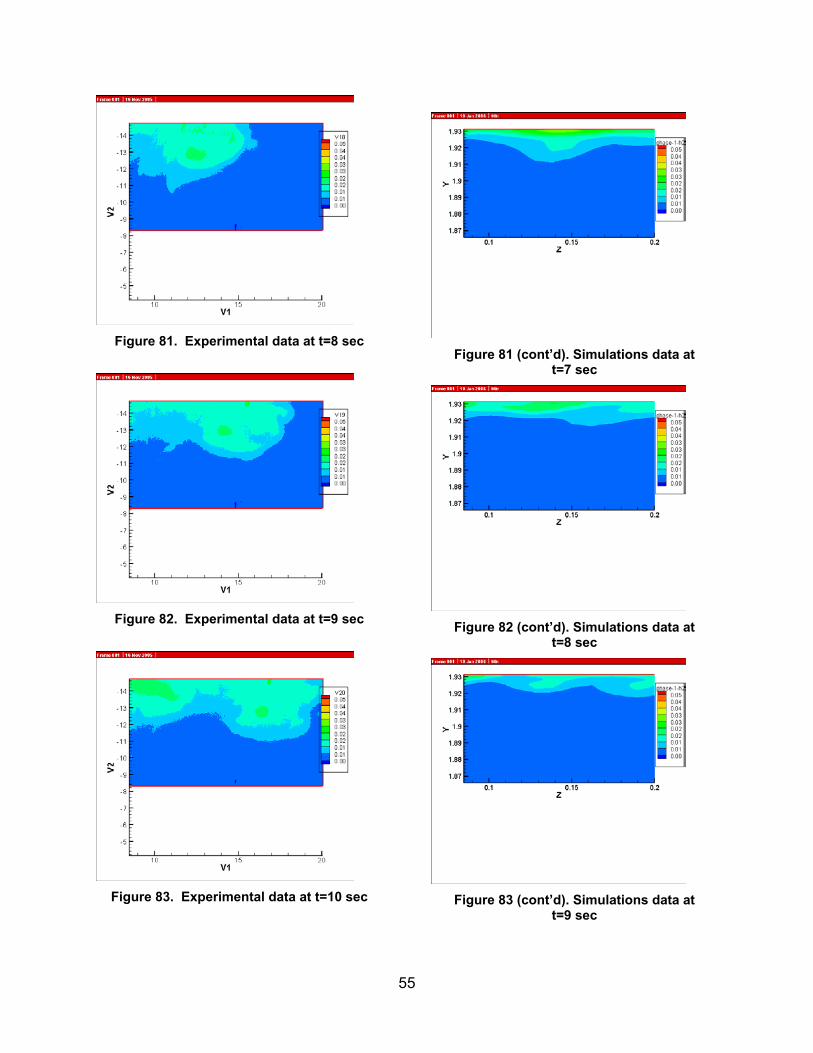
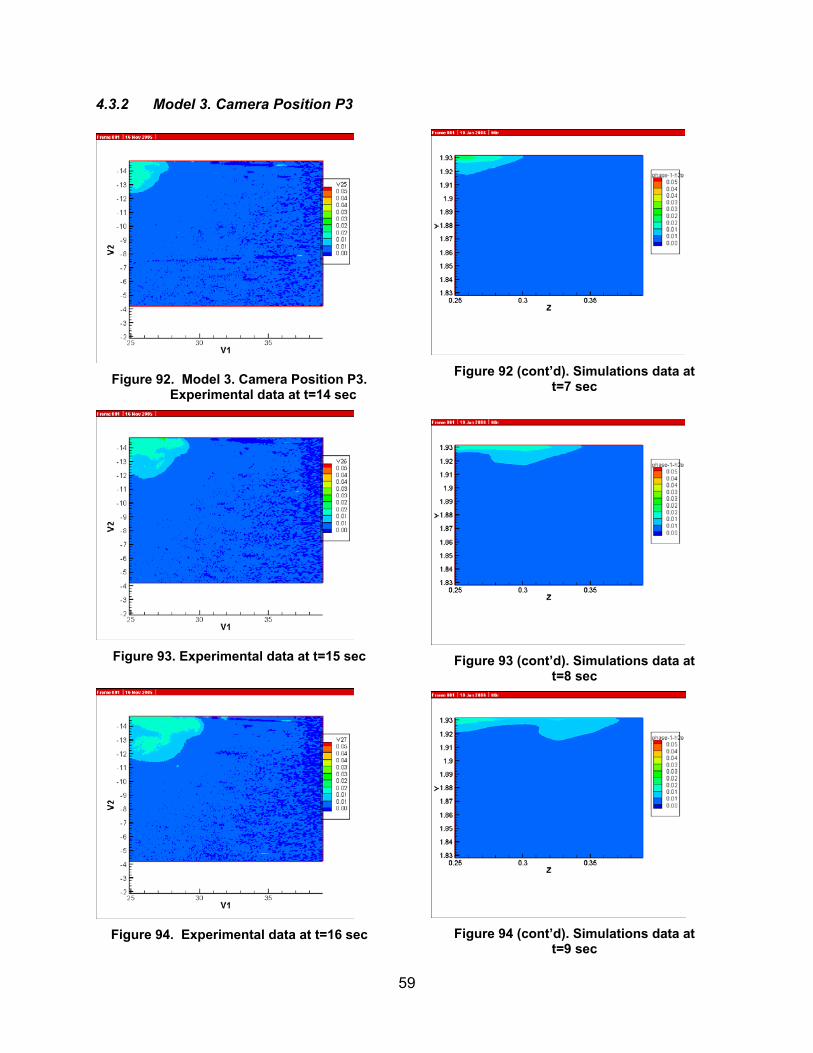
4.3 Model 3 This is test ID 3_3_3 where the 0.15 inch tube is used for the injection of fresh water and is placed 5.8 inch deep below the brine-air interface. The equivalent full-scale cavern flow rate is 180,000 bbl/day. The experimental data shown correspond to the test performed on 7/21/2005. Section 4.3.1 shows data-model comparisons for camera position P2, while Section 4.3.2 shows the results for camera position P3. The mixing zone depth is underpredicted by the simulations for camera Position P2, and the simulated plume moves much faster than in the tests. It took the simulated fresh water plume 2 seconds to cross the plane of frame P2 while the experimental plume took 5 seconds. In addition, the simulated plume enters frame P3 at t=7 seconds after starting the flow while the experimental plume enters the same frame at t=14 seconds.
54
4.3.1 Model 3. Camera Position P2
Figure 78. Model 3. Camera Position P2.
Experimental data at t=5 sec
Figure 79. Experimental data at t=6 sec
Figure 80. Experimental data at t=7 sec
Figure 78 (cont’d). Simulations data at
t=4 sec
Figure 79 (cont’d). Simulations data at
t=5 sec
Figure 80 (cont’d). Simulations data at
t=6 sec
55
Figure 81. Experimental data at t=8 sec
Figure 82. Experimental data at t=9 sec
Figure 83. Experimental data at t=10 sec
Figure 81 (cont’d). Simulations data at
t=7 sec
Figure 82 (cont’d). Simulations data at
t=8 sec
Figure 83 (cont’d). Simulations data at
t=9 sec
56
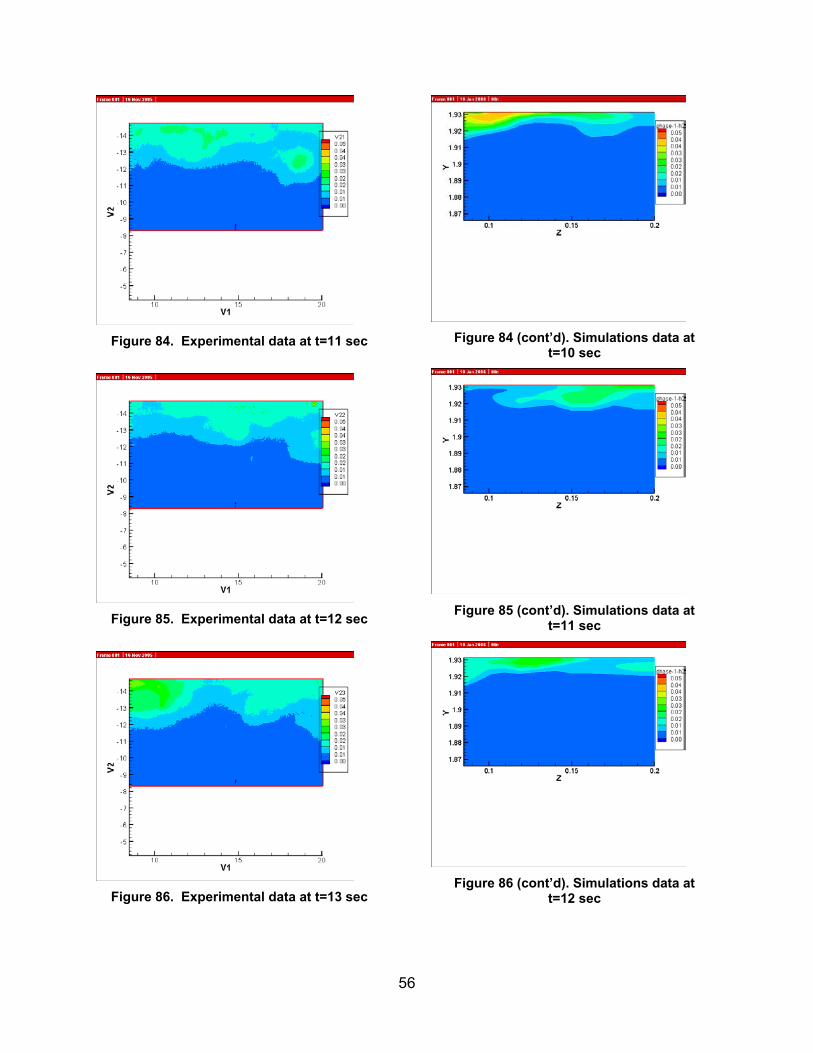
Figure 84. Experimental data at t=11 sec
Figure 85. Experimental data at t=12 sec
Figure 86. Experimental data at t=13 sec
Figure 84 (cont’d). Simulations data at
t=10 sec
Figure 85 (cont’d). Simulations data at
t=11 sec
Figure 86 (cont’d). Simulations data at
t=12 sec
57
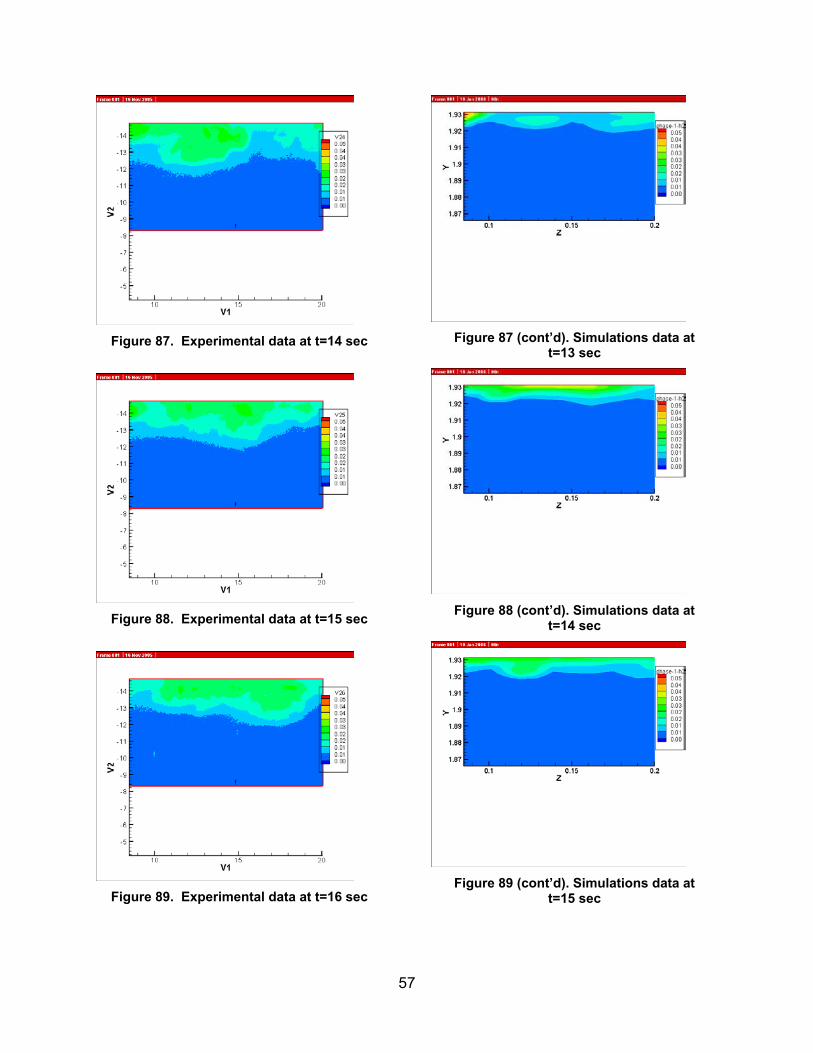
Figure 87. Experimental data at t=14 sec
Figure 88. Experimental data at t=15 sec
Figure 89. Experimental data at t=16 sec
Figure 87 (cont’d). Simulations data at
t=13 sec
Figure 88 (cont’d). Simulations data at
t=14 sec
Figure 89 (cont’d). Simulations data at
t=15 sec
58
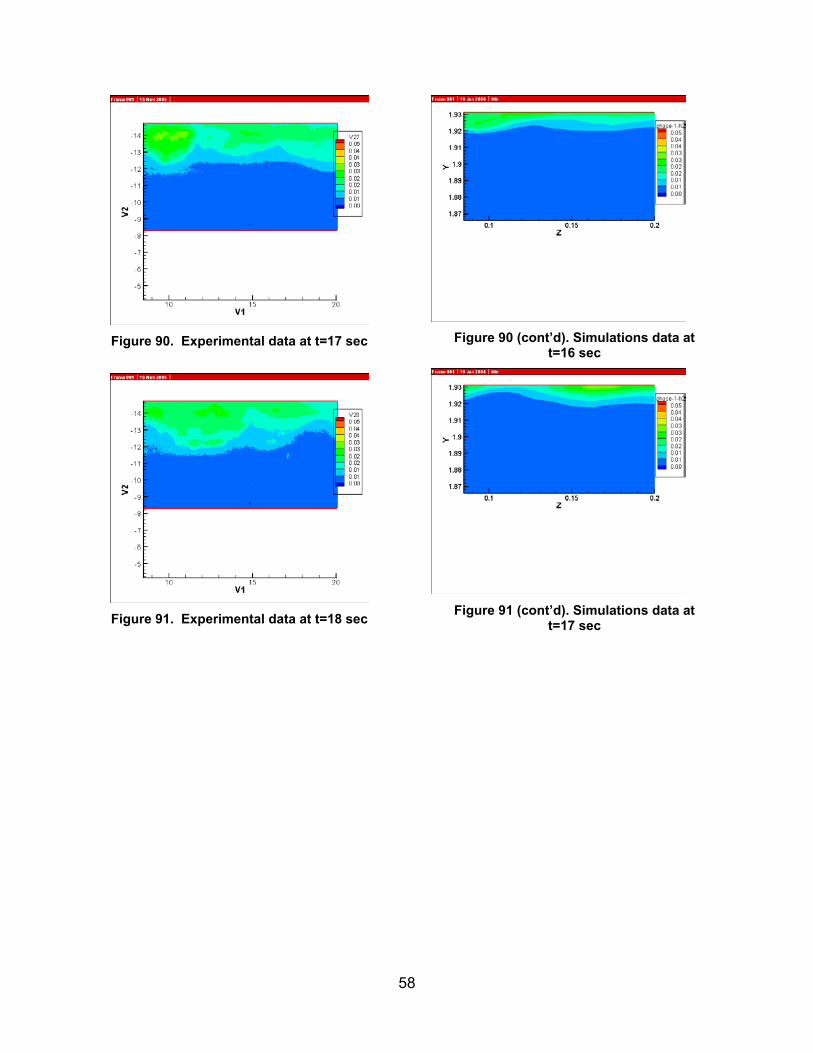
Figure 90. Experimental data at t=17 sec
Figure 91. Experimental data at t=18 sec
Figure 90 (cont’d). Simulations data at
t=16 sec
Figure 91 (cont’d). Simulations data at
t=17 sec
59
4.3.2 Model 3. Camera Position P3
Figure 92. Model 3. Camera Position P3.
Experimental data at t=14 sec
Figure 93. Experimental data at t=15 sec
Figure 94. Experimental data at t=16 sec
Figure 92 (cont’d). Simulations data at
t=7 sec
Figure 93 (cont’d). Simulations data at
t=8 sec
Figure 94 (cont’d). Simulations data at
t=9 sec
60
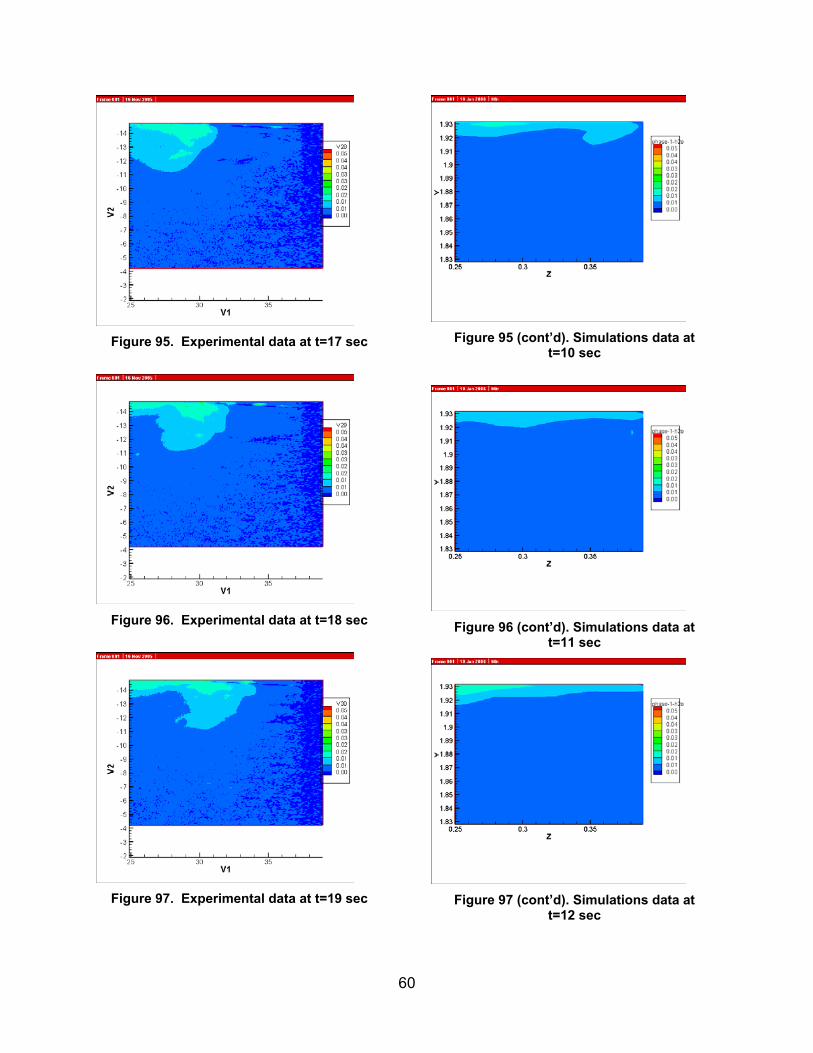
Figure 95. Experimental data at t=17 sec
Figure 96. Experimental data at t=18 sec
Figure 97. Experimental data at t=19 sec
Figure 95 (cont’d). Simulations data at
t=10 sec
Figure 96 (cont’d). Simulations data at
t=11 sec
Figure 97 (cont’d). Simulations data at
t=12 sec
61
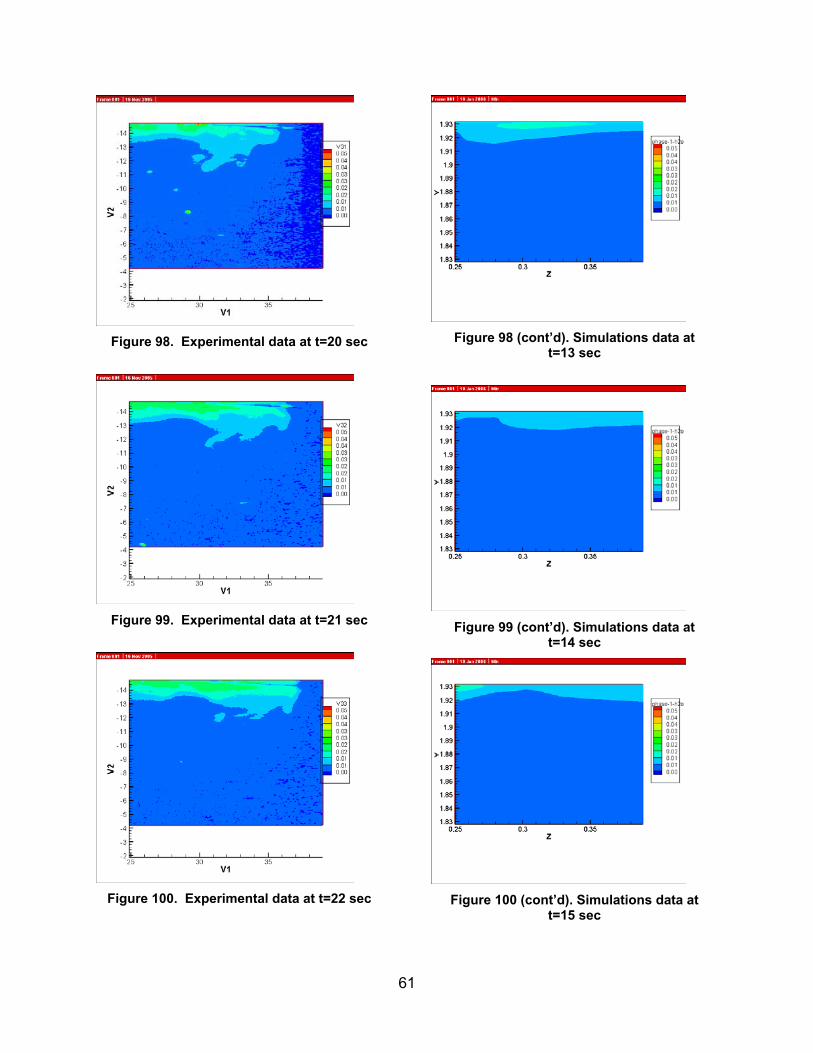
Figure 98. Experimental data at t=20 sec
Figure 99. Experimental data at t=21 sec
Figure 100. Experimental data at t=22 sec
Figure 98 (cont’d). Simulations data at
t=13 sec
Figure 99 (cont’d). Simulations data at
t=14 sec
Figure 100 (cont’d). Simulations data at
t=15 sec
62
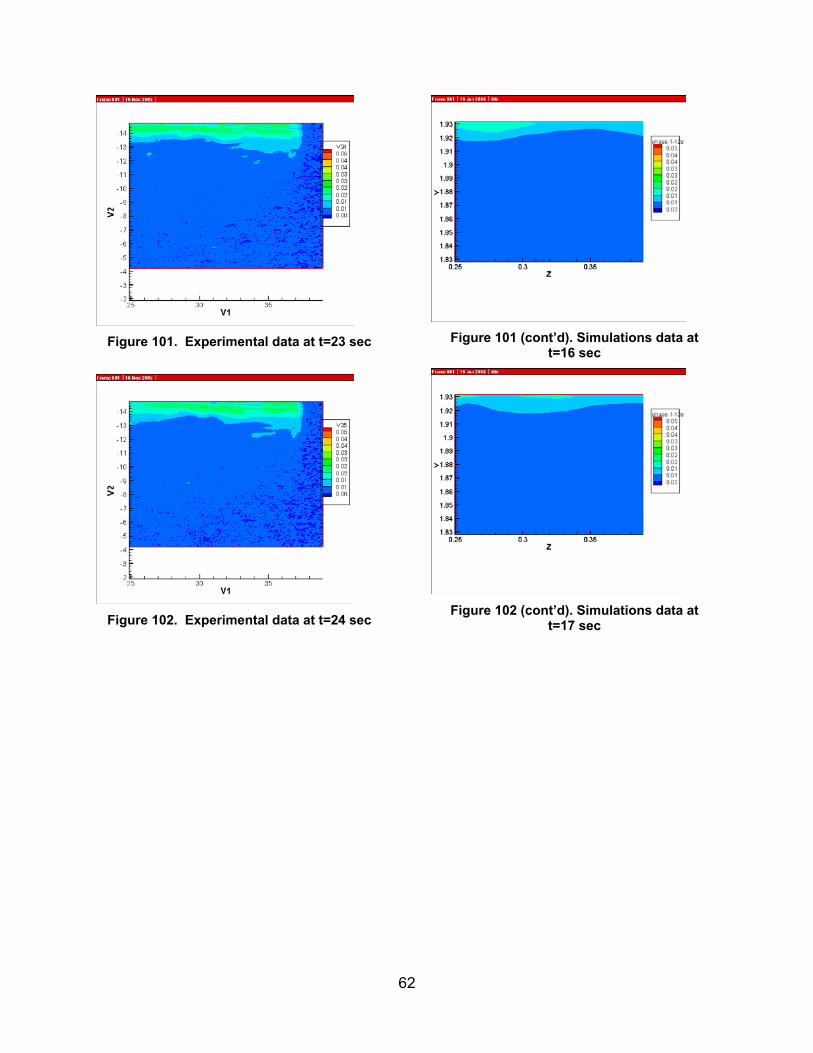
Figure 101. Experimental data at t=23 sec
Figure 102. Experimental data at t=24 sec
Figure 101 (cont’d). Simulations data at
t=16 sec
Figure 102 (cont’d). Simulations data at
t=17 sec
63
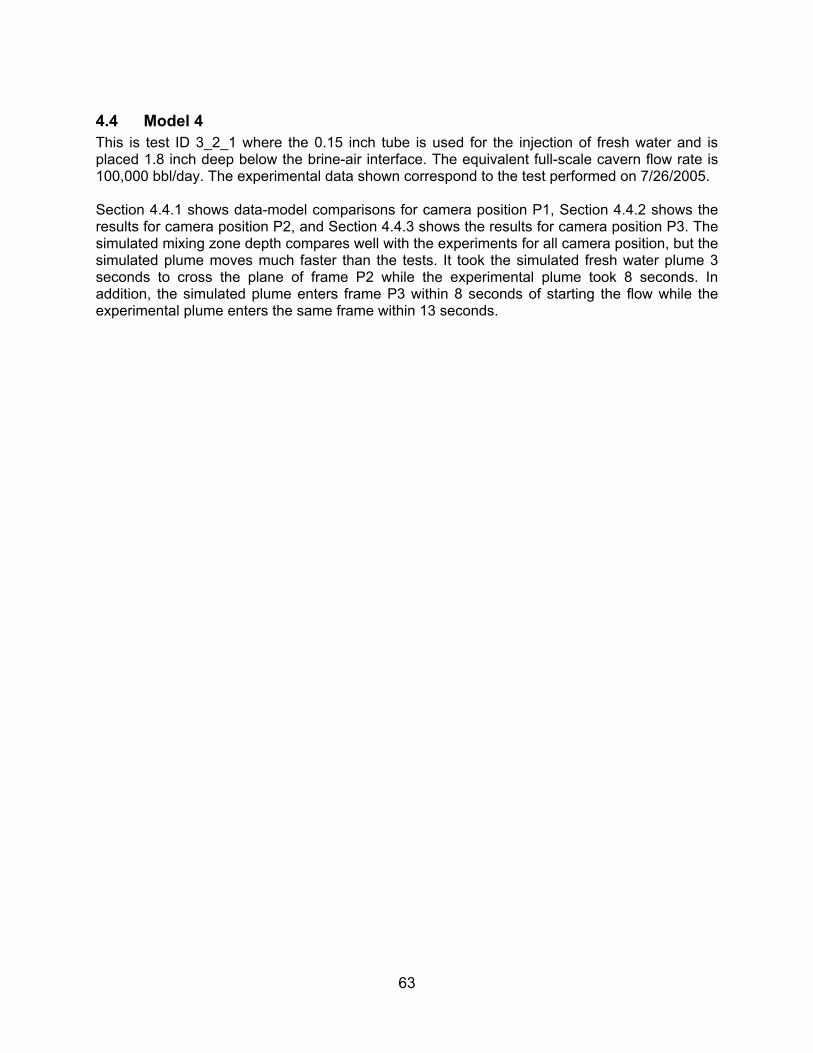
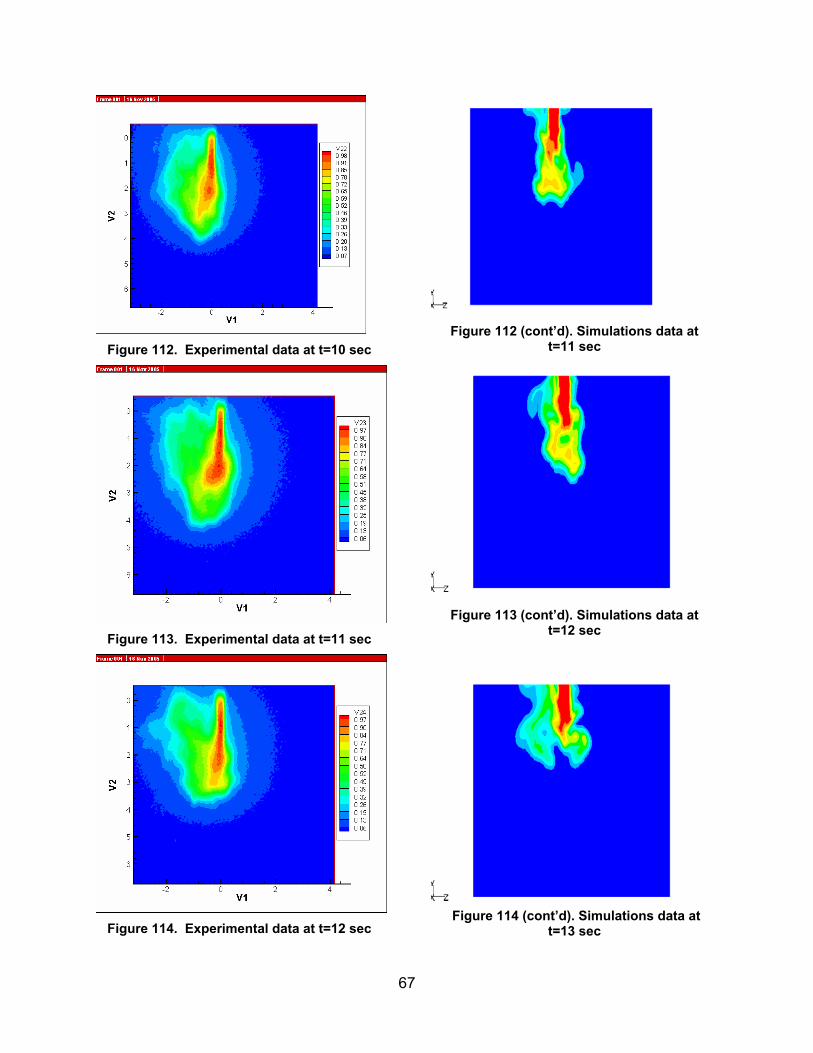
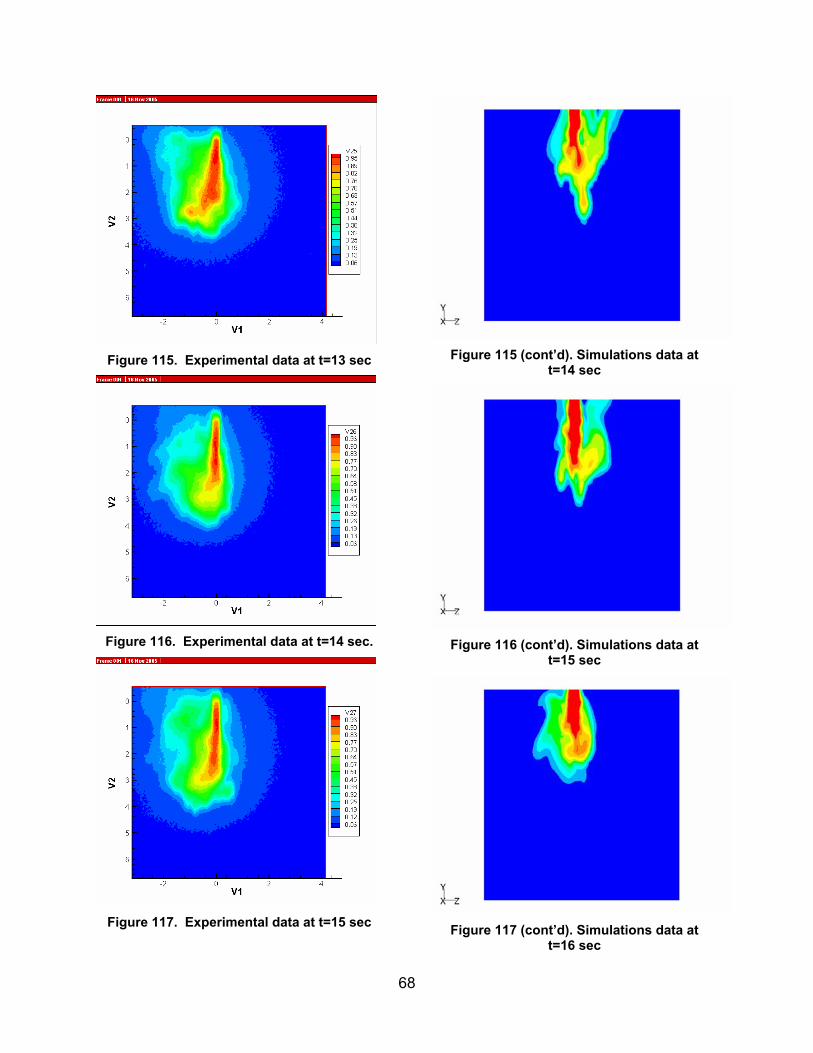
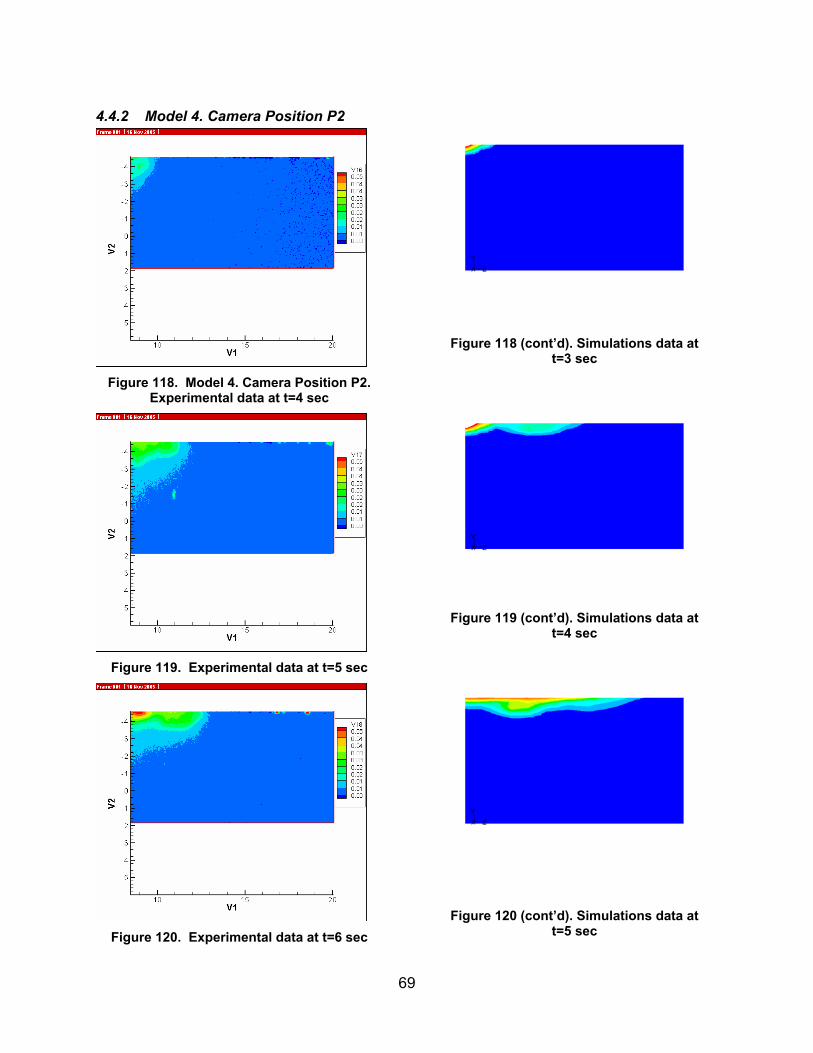
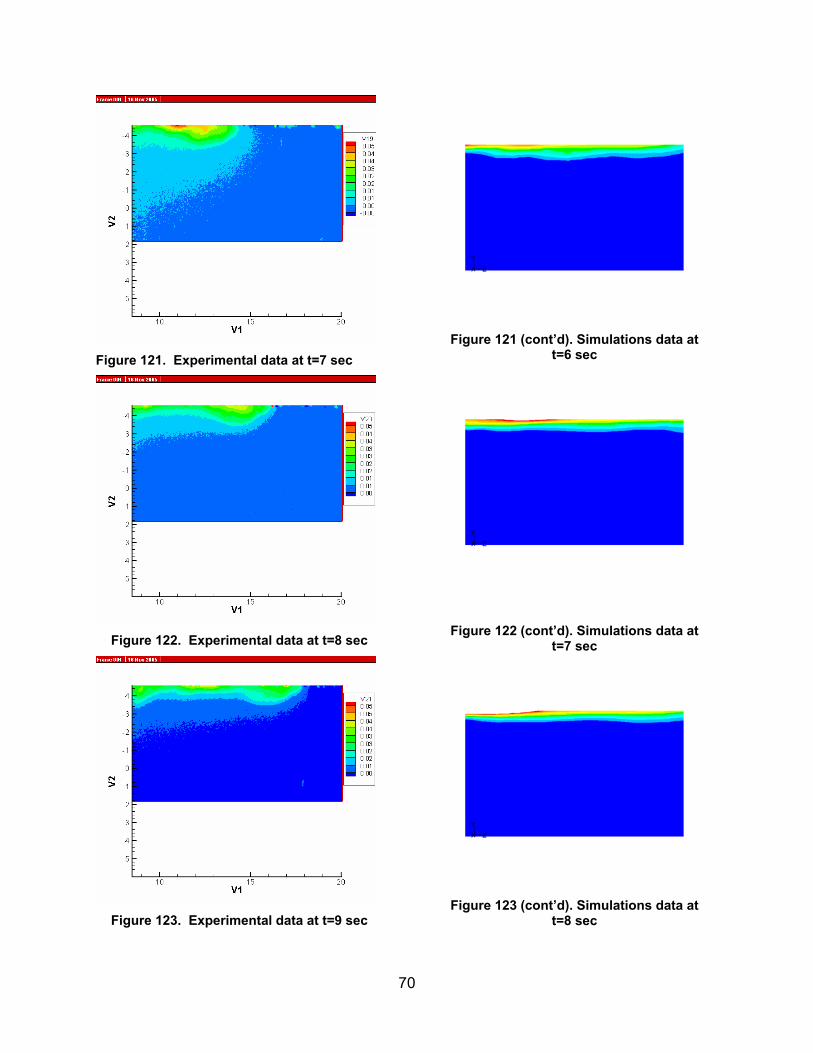
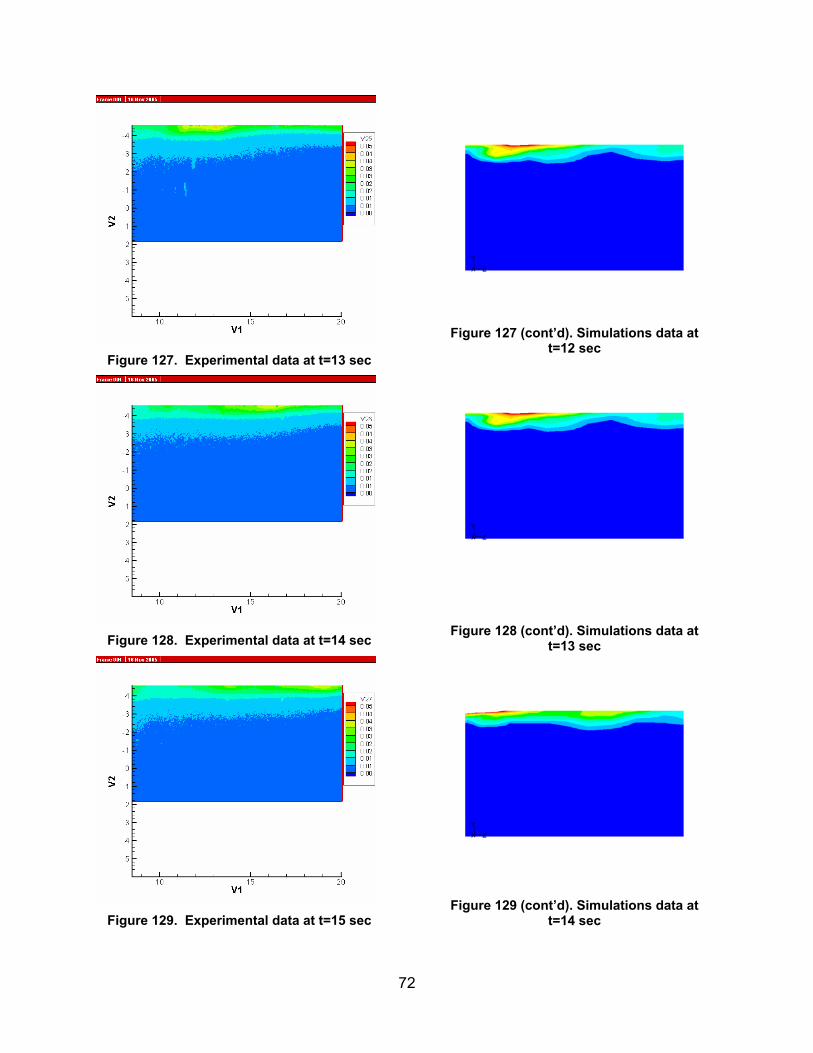
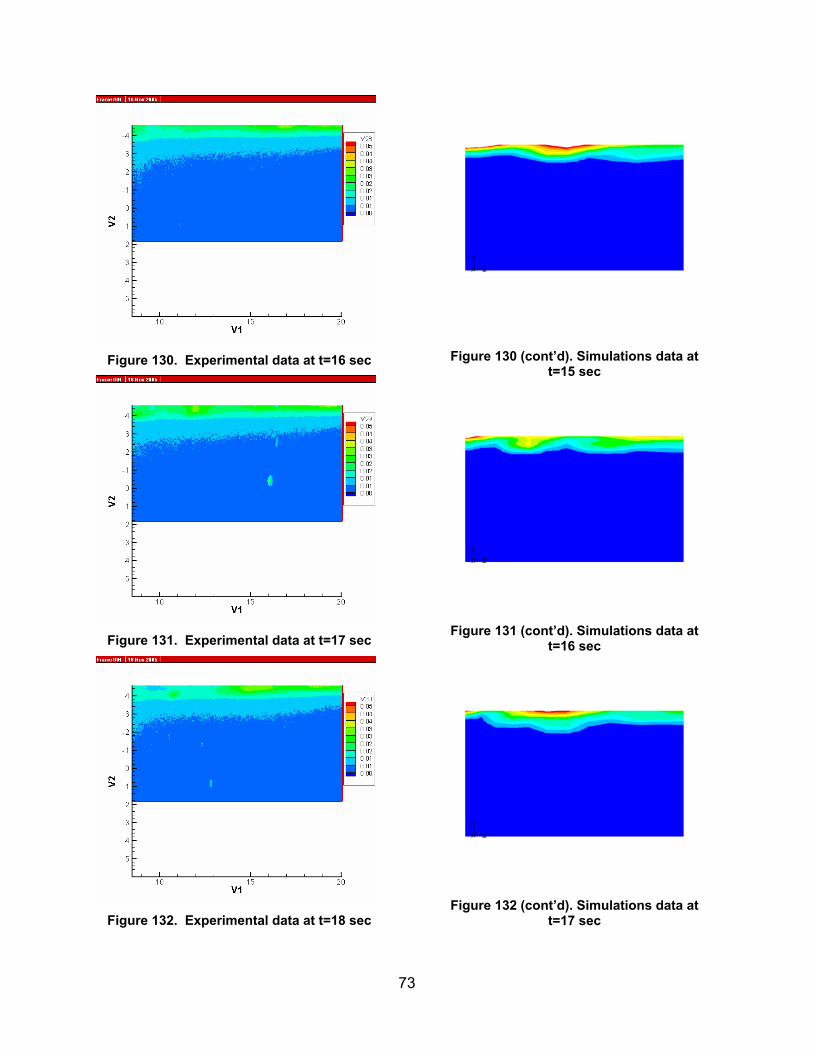
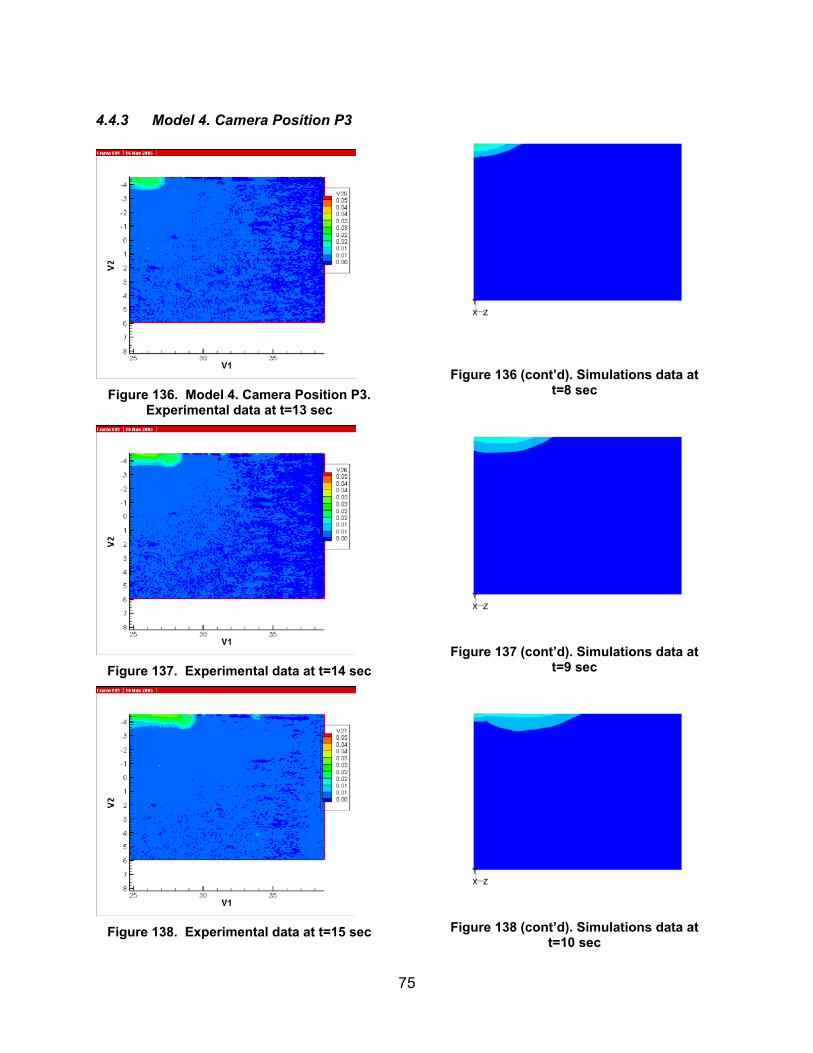
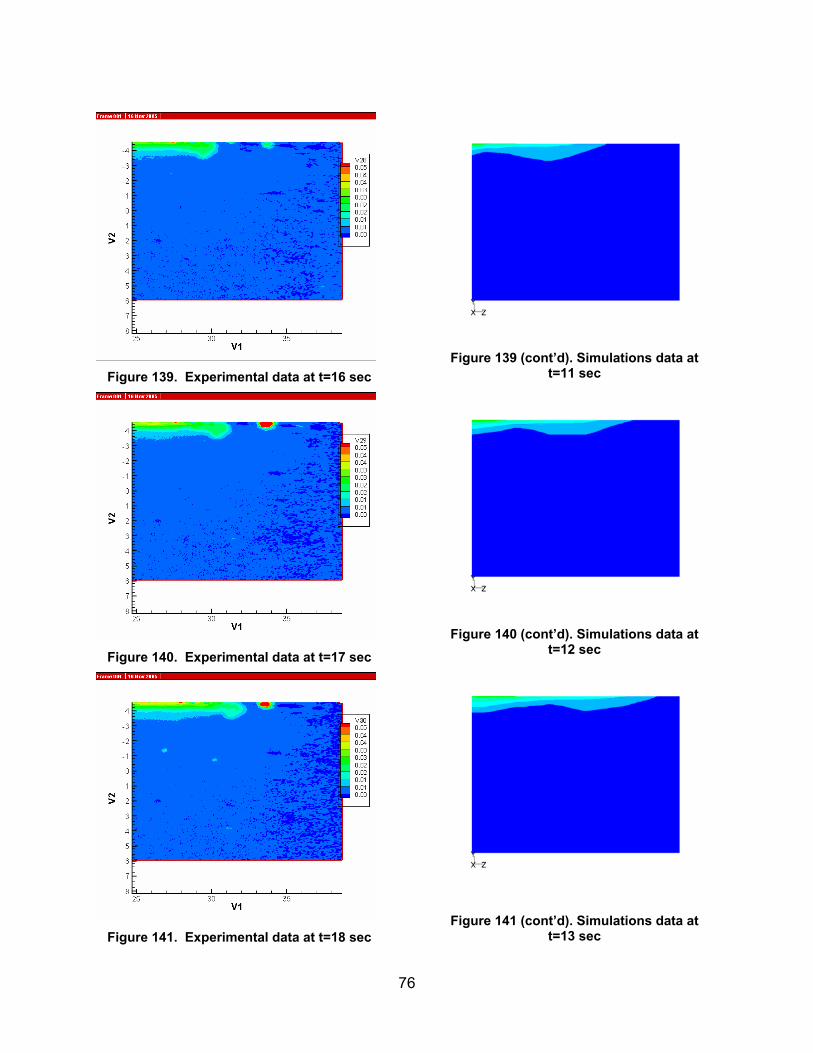
4.4 Model 4 This is test ID 3_2_1 where the 0.15 inch tube is used for the injection of fresh water and is placed 1.8 inch deep below the brine-air interface. The equivalent full-scale cavern flow rate is 100,000 bbl/day. The experimental data shown correspond to the test performed on 7/26/2005. Section 4.4.1 shows data-model comparisons for camera position P1, Section 4.4.2 shows the results for camera position P2, and Section 4.4.3 shows the results for camera position P3. The simulated mixing zone depth compares well with the experiments for all camera position, but the simulated plume moves much faster than the tests. It took the simulated fresh water plume 3 seconds to cross the plane of frame P2 while the experimental plume took 8 seconds. In addition, the simulated plume enters frame P3 within 8 seconds of starting the flow while the experimental plume enters the same frame within 13 seconds.
64
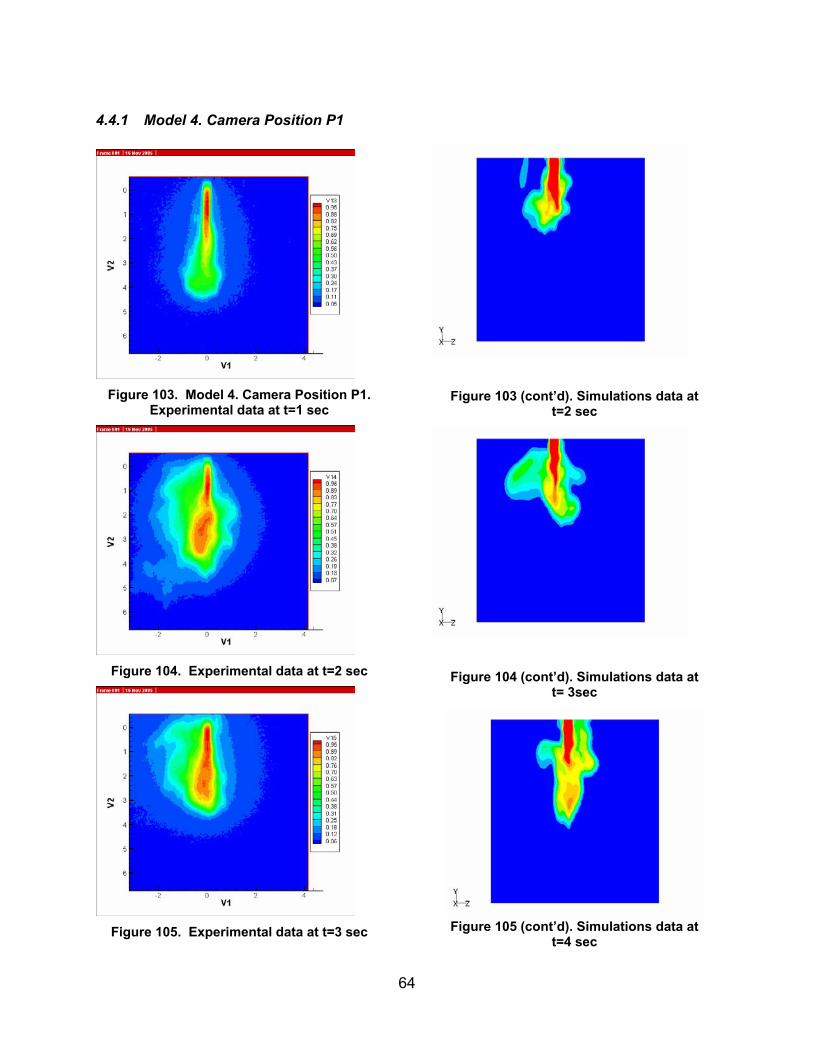
4.4.1 Model 4. Camera Position P1
Figure 103. Model 4. Camera Position P1.
Experimental data at t=1 sec
Figure 104. Experimental data at t=2 sec
Figure 105. Experimental data at t=3 sec
Figure 103 (cont’d). Simulations data at t=2 sec
Figure 104 (cont’d). Simulations data at t= 3sec
Figure 105 (cont’d). Simulations data at
t=4 sec
65
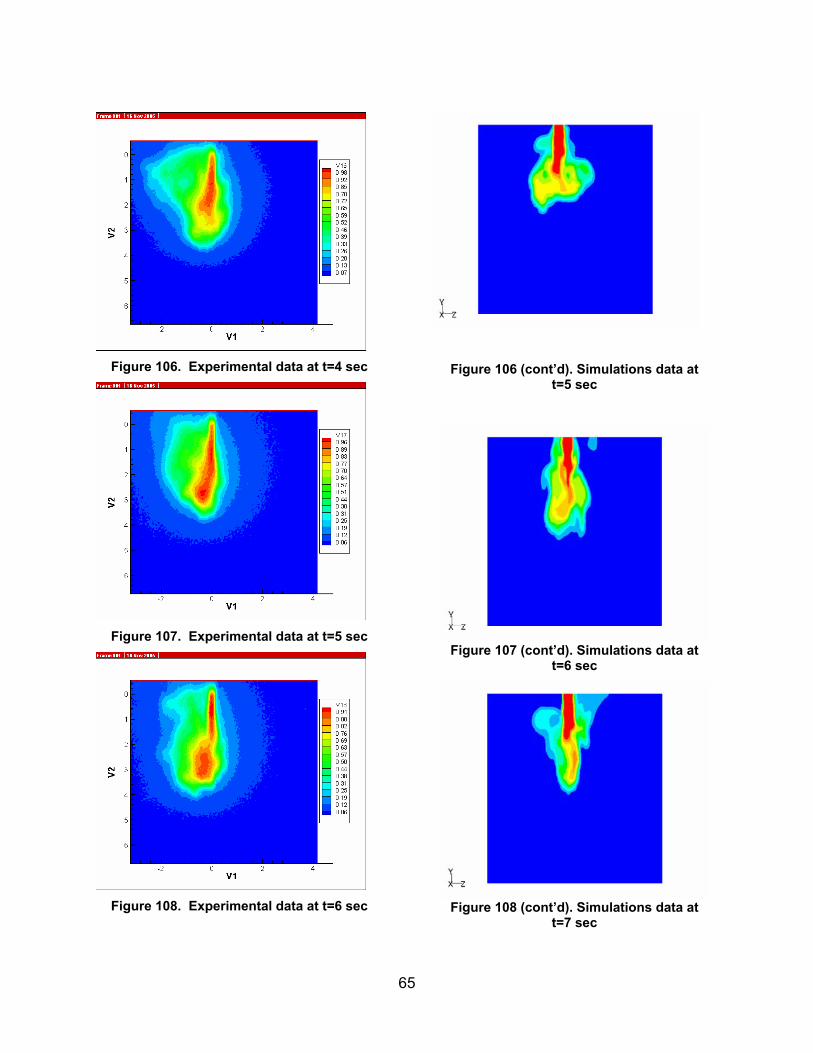
Figure 106. Experimental data at t=4 sec
Figure 107. Experimental data at t=5 sec
Figure 108. Experimental data at t=6 sec
Figure 106 (cont’d). Simulations data at t=5 sec
Figure 107 (cont’d). Simulations data at
t=6 sec
Figure 108 (cont’d). Simulations data at
t=7 sec
66
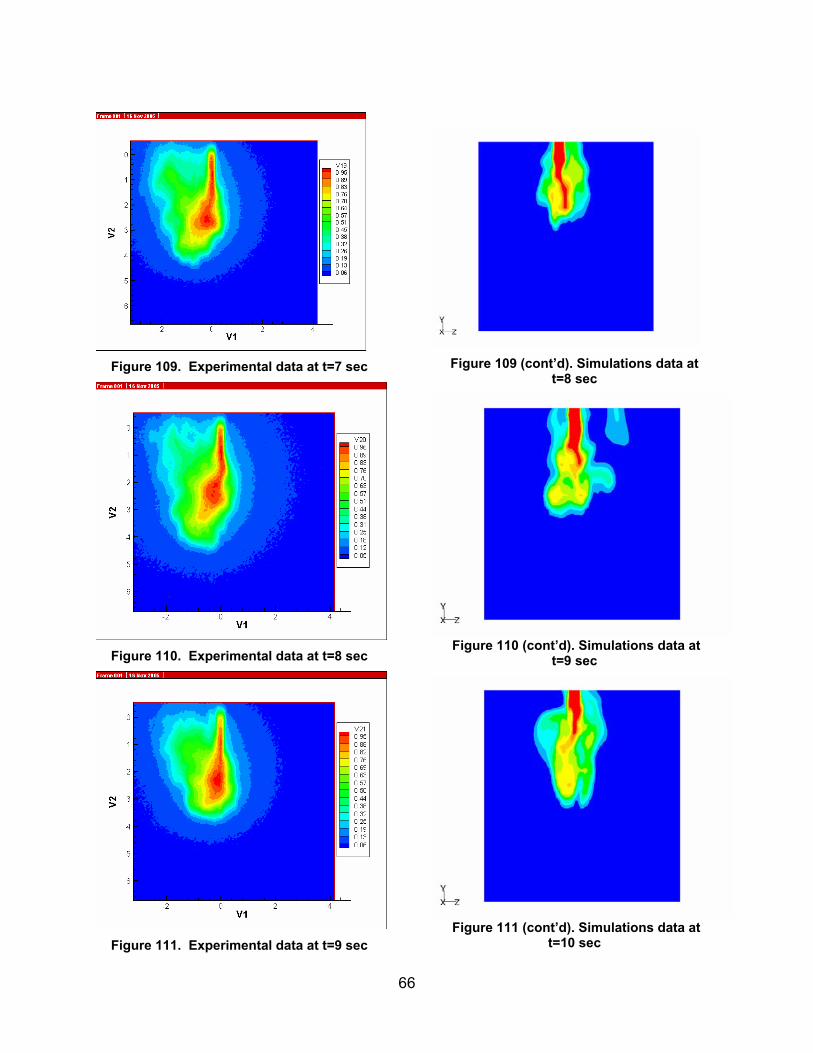
Figure 109. Experimental data at t=7 sec
Figure 110. Experimental data at t=8 sec
Figure 111. Experimental data at t=9 sec
Figure 109 (cont’d). Simulations data at
t=8 sec
Figure 110 (cont’d). Simulations data at t=9 sec
Figure 111 (cont’d). Simulations data at t=10 sec
67
Figure 112. Experimental data at t=10 sec
Figure 113. Experimental data at t=11 sec
Figure 114. Experimental data at t=12 sec
Figure 112 (cont’d). Simulations data at
t=11 sec
Figure 113 (cont’d). Simulations data at
t=12 sec
Figure 114 (cont’d). Simulations data at t=13 sec
68
Figure 115. Experimental data at t=13 sec
Figure 116. Experimental data at t=14 sec.
Figure 117. Experimental data at t=15 sec
Figure 115 (cont’d). Simulations data at
t=14 sec
Figure 116 (cont’d). Simulations data at
t=15 sec
Figure 117 (cont’d). Simulations data at
t=16 sec
69
4.4.2 Model 4. Camera Position P2
Figure 118. Model 4. Camera Position P2.
Experimental data at t=4 sec
Figure 119. Experimental data at t=5 sec
Figure 120. Experimental data at t=6 sec
Figure 118 (cont’d). Simulations data at t=3 sec
Figure 119 (cont’d). Simulations data at t=4 sec
Figure 120 (cont’d). Simulations data at t=5 sec
70
Figure 121. Experimental data at t=7 sec
Figure 122. Experimental data at t=8 sec
Figure 123. Experimental data at t=9 sec
Figure 121 (cont’d). Simulations data at t=6 sec
Figure 122 (cont’d). Simulations data at t=7 sec
Figure 123 (cont’d). Simulations data at t=8 sec

71
Figure 124. Experimental data at t=10 sec
Figure 125. Experimental data at t=11 sec
Figure 126. Experimental data at t=12 sec
Figure 124 (cont’d). Simulations data at t=9 sec
Figure 125 (cont’d). Simulations data at t=10 sec
Figure 126 (cont’d). Simulations data at t=11 sec
72
Figure 127. Experimental data at t=13 sec
Figure 128. Experimental data at t=14 sec
Figure 129. Experimental data at t=15 sec
Figure 127 (cont’d). Simulations data at t=12 sec
Figure 128 (cont’d). Simulations data at t=13 sec
Figure 129 (cont’d). Simulations data at t=14 sec
73
Figure 130. Experimental data at t=16 sec
Figure 131. Experimental data at t=17 sec
Figure 132. Experimental data at t=18 sec
Figure 130 (cont’d). Simulations data at t=15 sec
Figure 131 (cont’d). Simulations data at t=16 sec
Figure 132 (cont’d). Simulations data at t=17 sec

74
Figure 133. Experimental data at t=19 sec
Figure 134. Experimental data at t=20 sec
Figure 135. Experimental data at t=21 sec
Figure 133 (cont’d). Simulations data at t=18 sec
Figure 134 (cont’d). Simulations data at t=19 sec
Figure 135 (cont’d). Simulations data at t=20 sec
75
4.4.3 Model 4. Camera Position P3
Figure 136. Model 4. Camera Position P3.
Experimental data at t=13 sec
Figure 137. Experimental data at t=14 sec
Figure 138. Experimental data at t=15 sec
Figure 136 (cont’d). Simulations data at t=8 sec
Figure 137 (cont’d). Simulations data at t=9 sec
Figure 138 (cont’d). Simulations data at t=10 sec
76
Figure 139. Experimental data at t=16 sec
Figure 140. Experimental data at t=17 sec
Figure 141. Experimental data at t=18 sec
Figure 139 (cont’d). Simulations data at t=11 sec
Figure 140 (cont’d). Simulations data at t=12 sec
Figure 141 (cont’d). Simulations data at t=13 sec

77
Figure 142. Experimental data at t=19 sec
Figure 143. Experimental data at t=20 sec
Figure 144. Experimental data at t=21 sec
Figure 142 (cont’d). Simulations data at t=14 sec
Figure 143 (cont’d). Simulations data at t=15 sec
Figure 144 (cont’d). Simulations data at t=16 sec
78
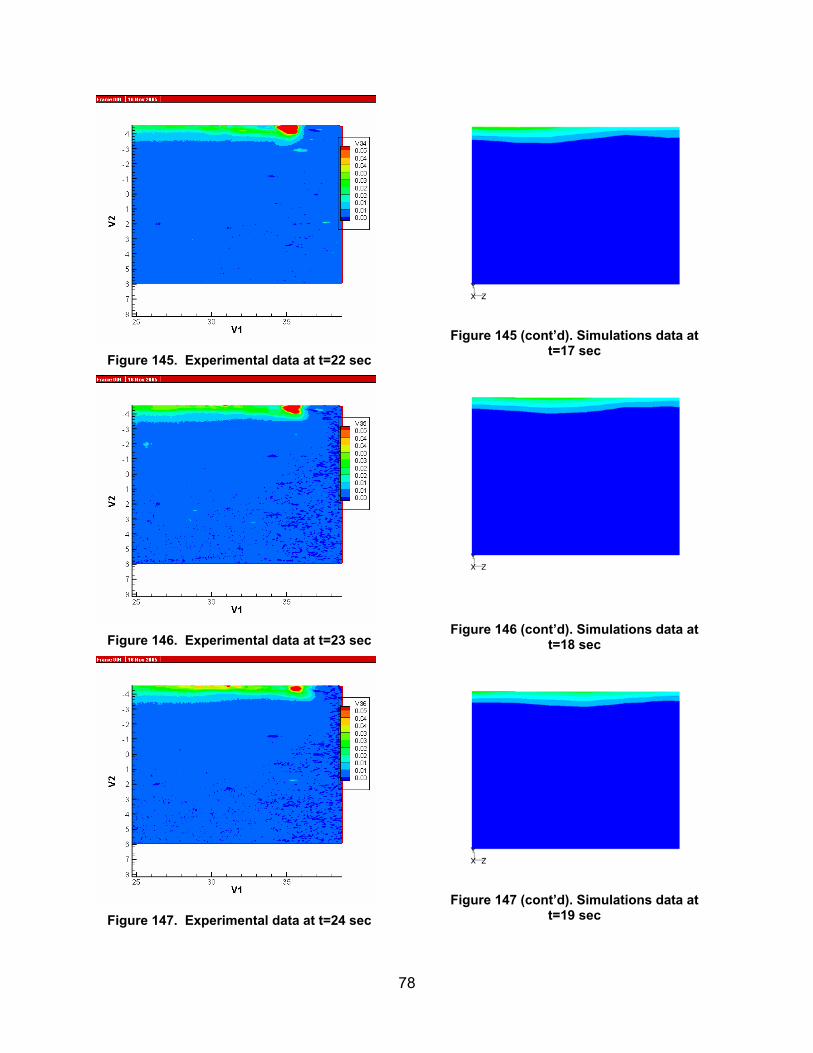
Figure 145. Experimental data at t=22 sec
Figure 146. Experimental data at t=23 sec
Figure 147. Experimental data at t=24 sec
Figure 145 (cont’d). Simulations data at t=17 sec
Figure 146 (cont’d). Simulations data at t=18 sec
Figure 147 (cont’d). Simulations data at t=19 sec

79
Figure 148. Experimental data at t=25 sec
Figure 149. Experimental data at t=26 sec
Figure 150. Experimental data at t=27 sec
Figure 148 (cont’d). Simulations data at t=20 sec
Figure 149 (cont’d). Simulations data at t=21 sec
Figure 150 (cont’d). Simulations data at t=22 sec
80
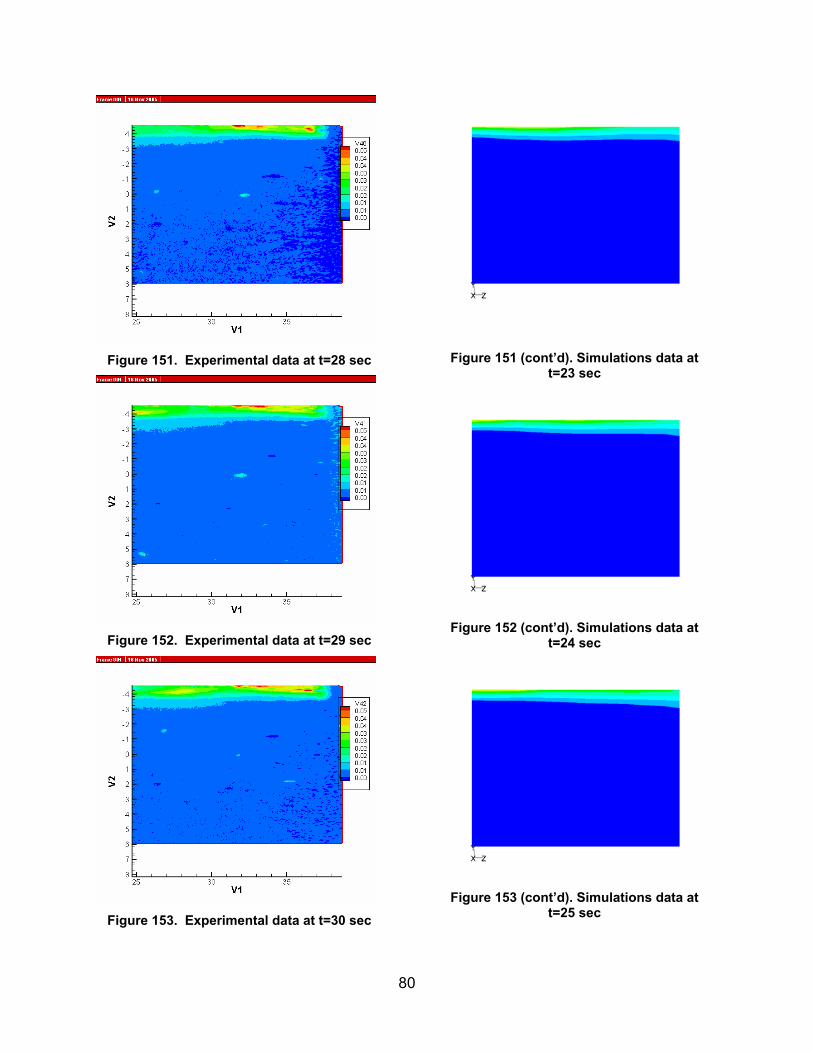
Figure 151. Experimental data at t=28 sec
Figure 152. Experimental data at t=29 sec
Figure 153. Experimental data at t=30 sec
Figure 151 (cont’d). Simulations data at t=23 sec
Figure 152 (cont’d). Simulations data at t=24 sec
Figure 153 (cont’d). Simulations data at t=25 sec
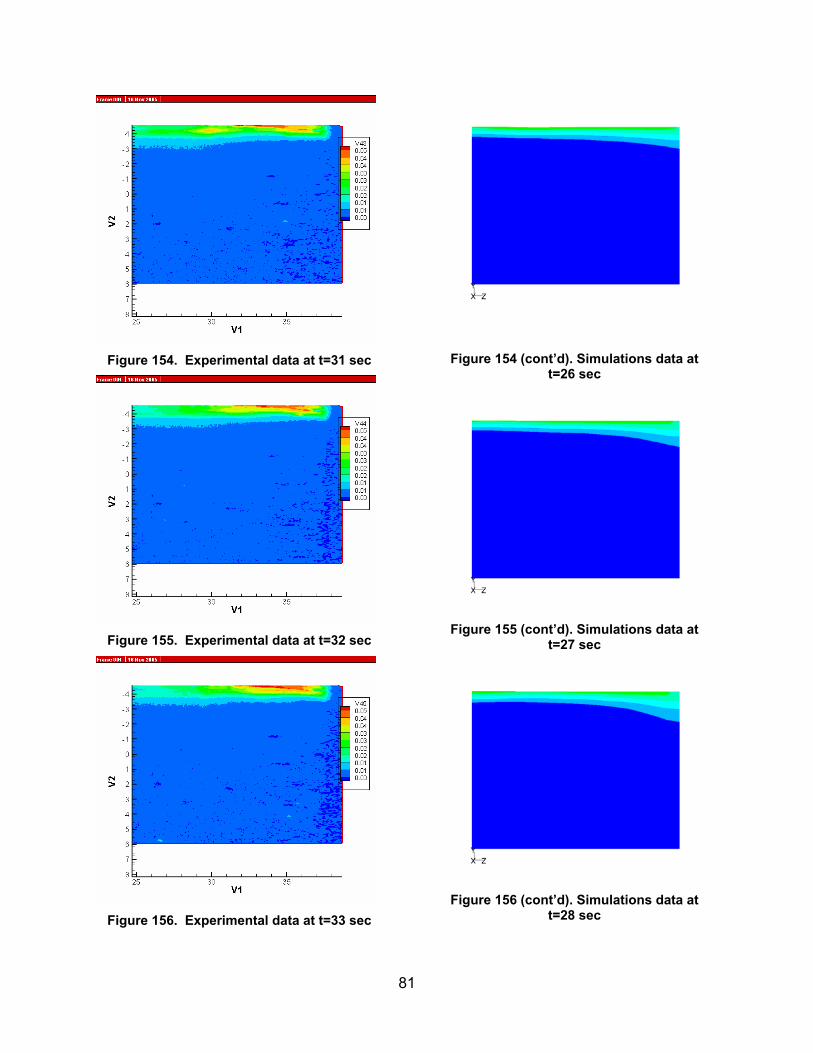
81
Figure 154. Experimental data at t=31 sec
Figure 155. Experimental data at t=32 sec
Figure 156. Experimental data at t=33 sec
Figure 154 (cont’d). Simulations data at t=26 sec
Figure 155 (cont’d). Simulations data at t=27 sec
Figure 156 (cont’d). Simulations data at t=28 sec

82
4.5 Model 5 This is test ID 3_2_5 where the 0.15 inch tube is used for the injection of fresh water and is placed 9 inches deep below the brine-air interface. The equivalent full-scale cavern flow rate is 100,000 bbl/day. The experimental data shown correspond to the test performed on 7/29/2005. Section 4.4.1 shows data-model comparisons for camera position P1, Section 4.4.2 shows the results for camera position P2, and Section 4.4.3 shows the results for camera position P3. The simulated mixing zone depth is underpredicted for camera positions P2 and P3. In addition, the simulated plume moves much faster than in the tests. It took the simulated fresh water plume less than 2 seconds to cross the plane of frame P2 while the experimental plume took 7 seconds. In addition, the simulated plume enters frame P3 within 8 seconds of starting the flow while the experimental plume enters the same frame after 17 seconds.
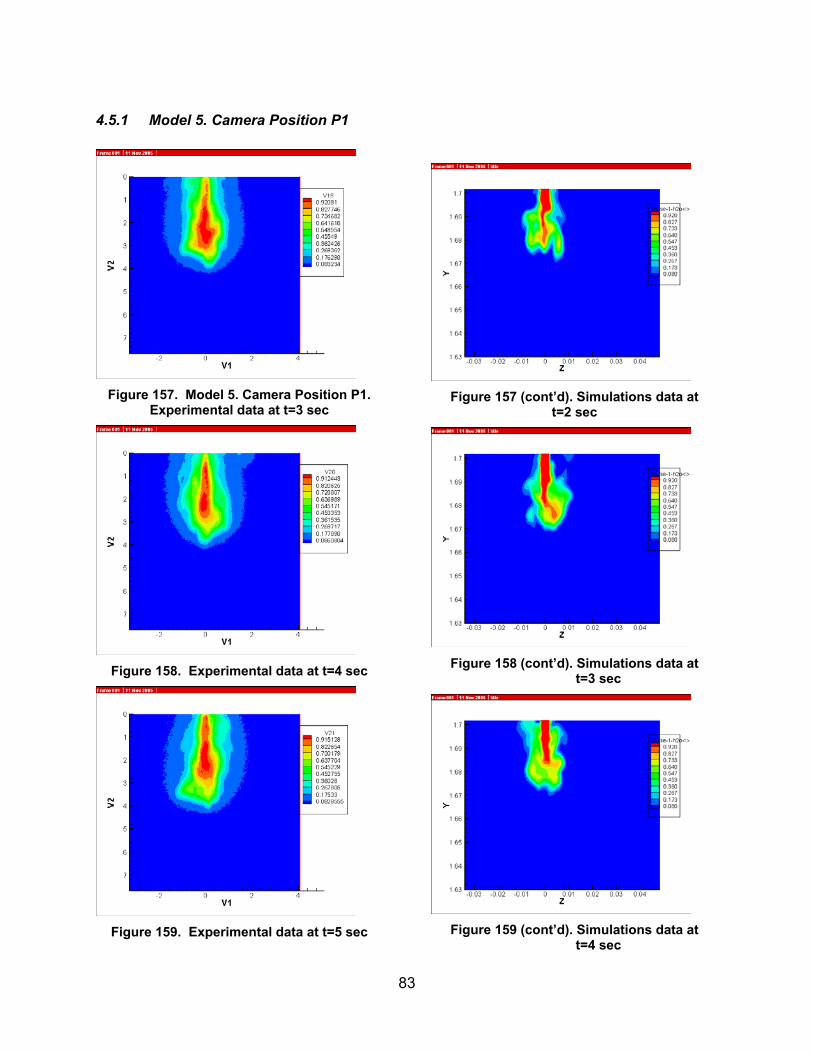
83
4.5.1 Model 5. Camera Position P1
Figure 157. Model 5. Camera Position P1.
Experimental data at t=3 sec
Figure 158. Experimental data at t=4 sec
Figure 159. Experimental data at t=5 sec
Figure 157 (cont’d). Simulations data at
t=2 sec
Figure 158 (cont’d). Simulations data at
t=3 sec
Figure 159 (cont’d). Simulations data at
t=4 sec
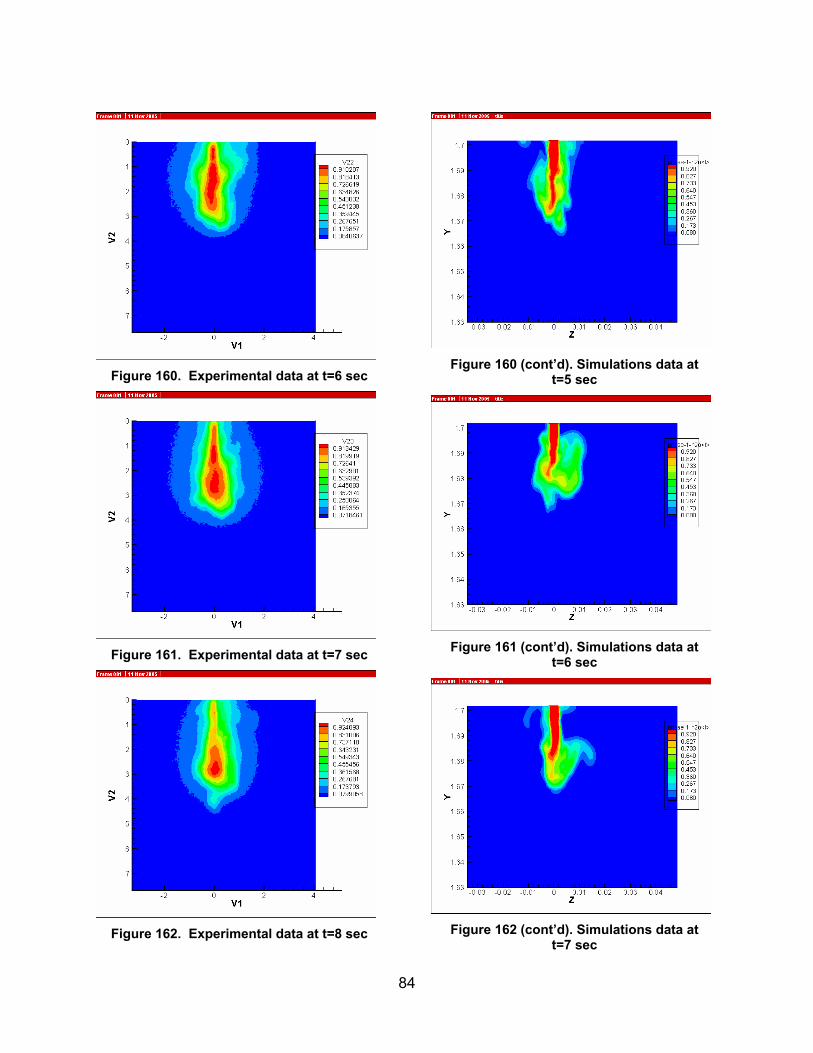
84
Figure 160. Experimental data at t=6 sec
Figure 161. Experimental data at t=7 sec
Figure 162. Experimental data at t=8 sec
Figure 160 (cont’d). Simulations data at
t=5 sec
Figure 161 (cont’d). Simulations data at
t=6 sec
Figure 162 (cont’d). Simulations data at
t=7 sec
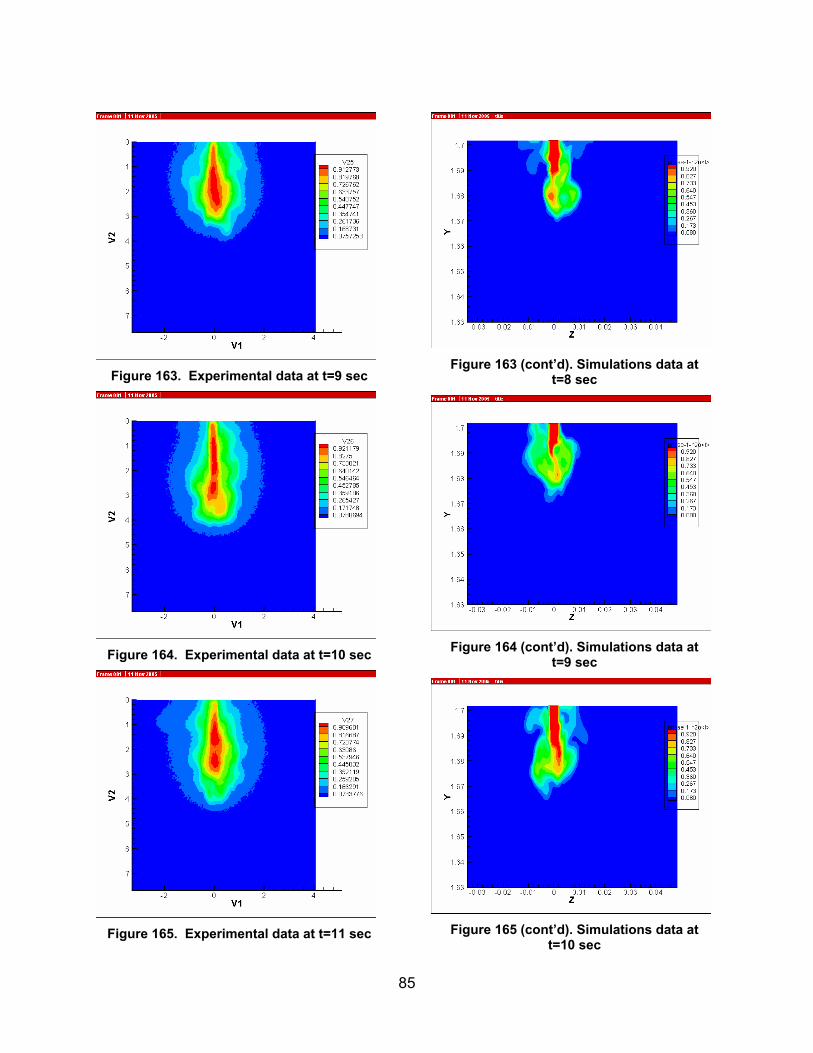
85
Figure 163. Experimental data at t=9 sec
Figure 164. Experimental data at t=10 sec
Figure 165. Experimental data at t=11 sec
Figure 163 (cont’d). Simulations data at
t=8 sec
Figure 164 (cont’d). Simulations data at
t=9 sec
Figure 165 (cont’d). Simulations data at
t=10 sec
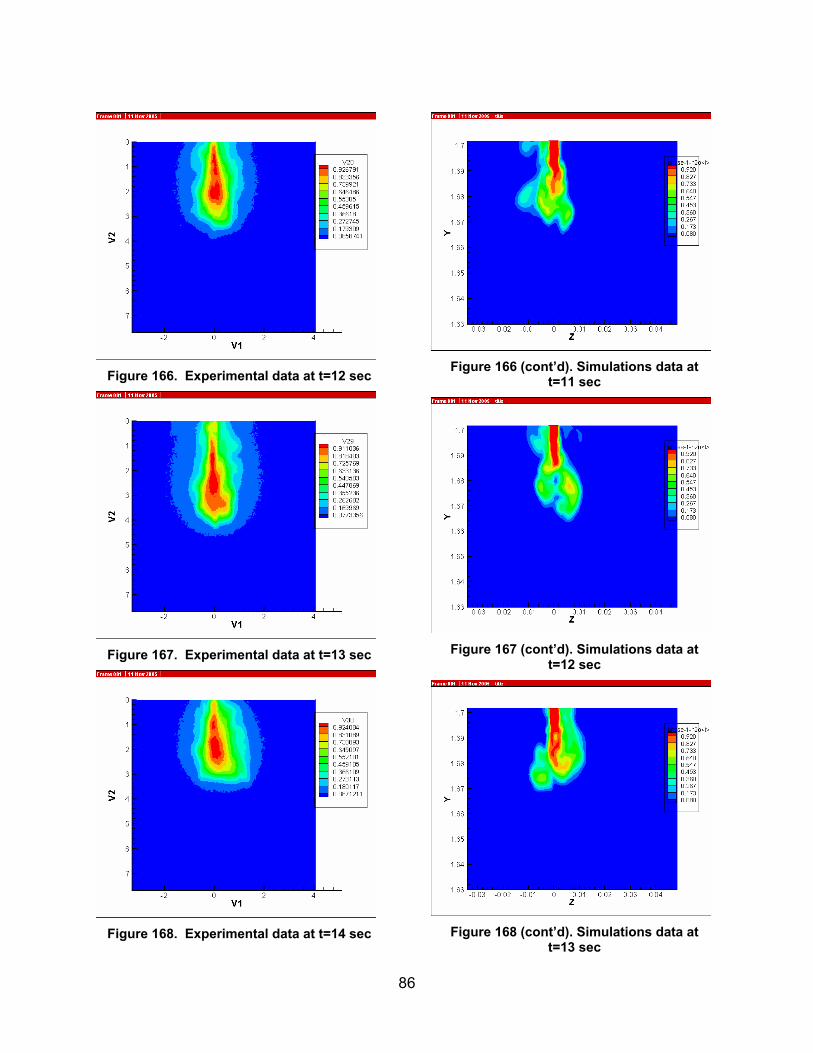
86
Figure 166. Experimental data at t=12 sec
Figure 167. Experimental data at t=13 sec
Figure 168. Experimental data at t=14 sec
Figure 166 (cont’d). Simulations data at
t=11 sec
Figure 167 (cont’d). Simulations data at
t=12 sec
Figure 168 (cont’d). Simulations data at
t=13 sec
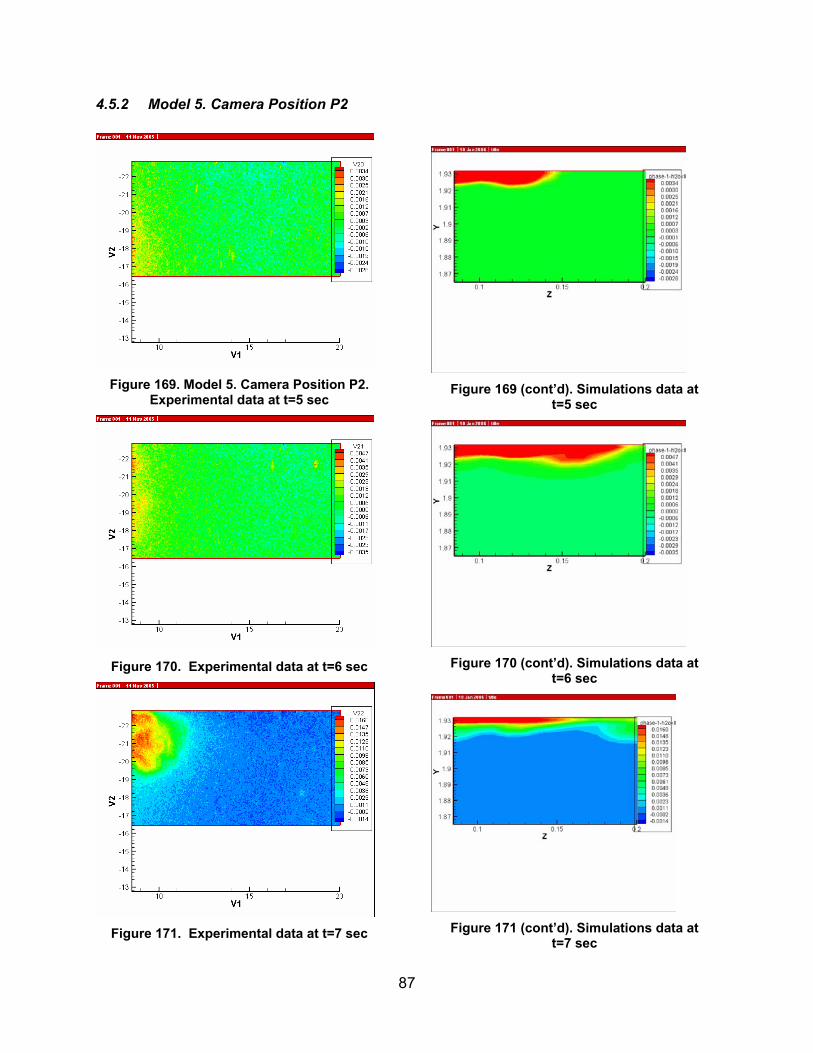
87
4.5.2 Model 5. Camera Position P2
Figure 169. Model 5. Camera Position P2.
Experimental data at t=5 sec
Figure 170. Experimental data at t=6 sec
Figure 171. Experimental data at t=7 sec
Figure 169 (cont’d). Simulations data at
t=5 sec
Figure 170 (cont’d). Simulations data at
t=6 sec
Figure 171 (cont’d). Simulations data at
t=7 sec
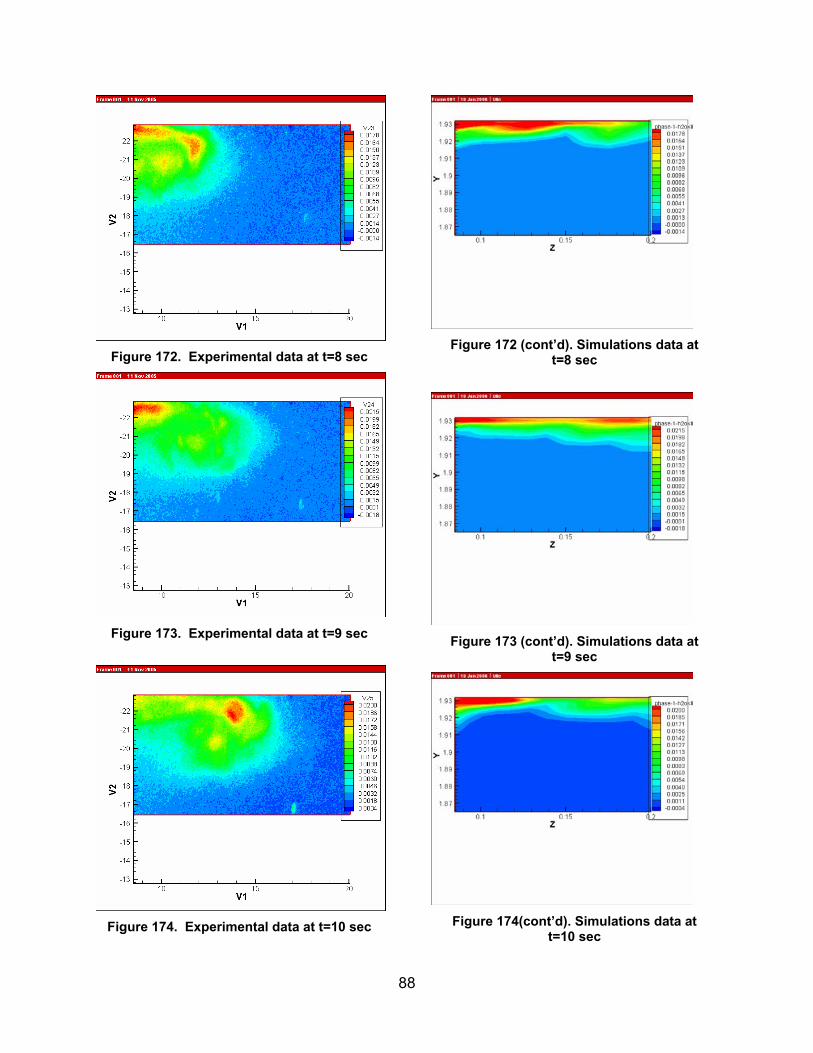
88
Figure 172. Experimental data at t=8 sec
Figure 173. Experimental data at t=9 sec
Figure 174. Experimental data at t=10 sec
Figure 172 (cont’d). Simulations data at
t=8 sec
Figure 173 (cont’d). Simulations data at
t=9 sec
Figure 174(cont’d). Simulations data at
t=10 sec
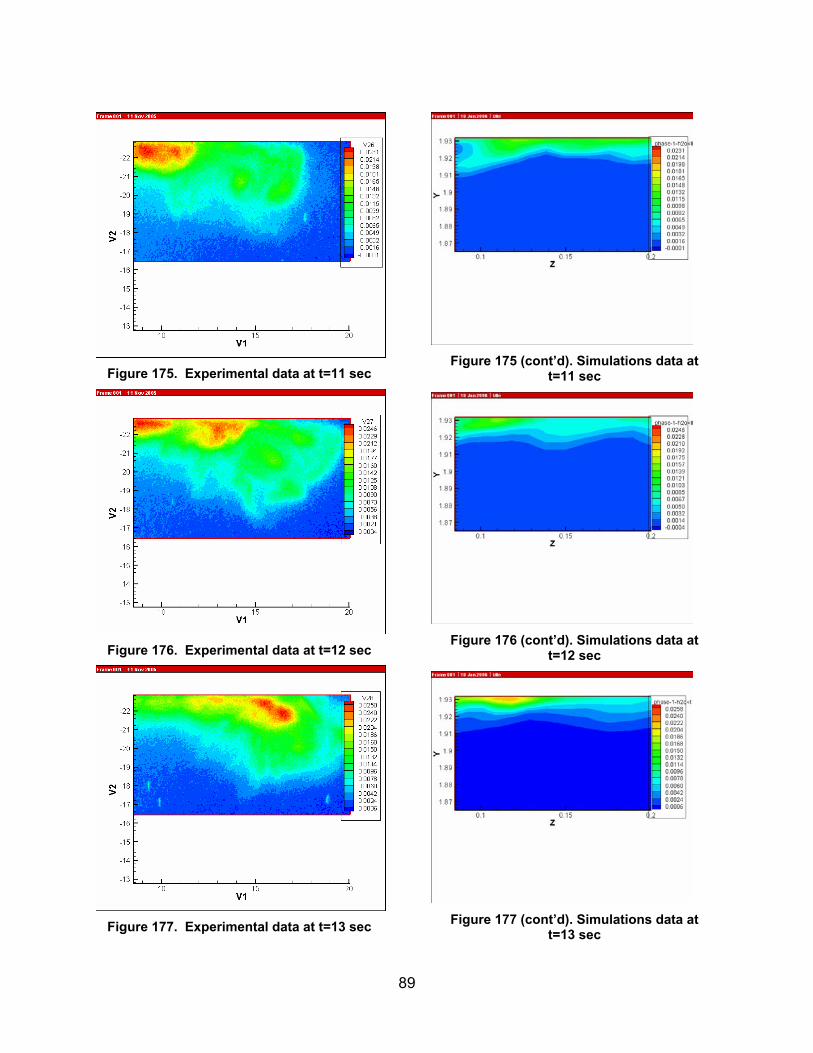
89
Figure 175. Experimental data at t=11 sec
Figure 176. Experimental data at t=12 sec
Figure 177. Experimental data at t=13 sec
Figure 175 (cont’d). Simulations data at
t=11 sec
Figure 176 (cont’d). Simulations data at
t=12 sec
Figure 177 (cont’d). Simulations data at
t=13 sec
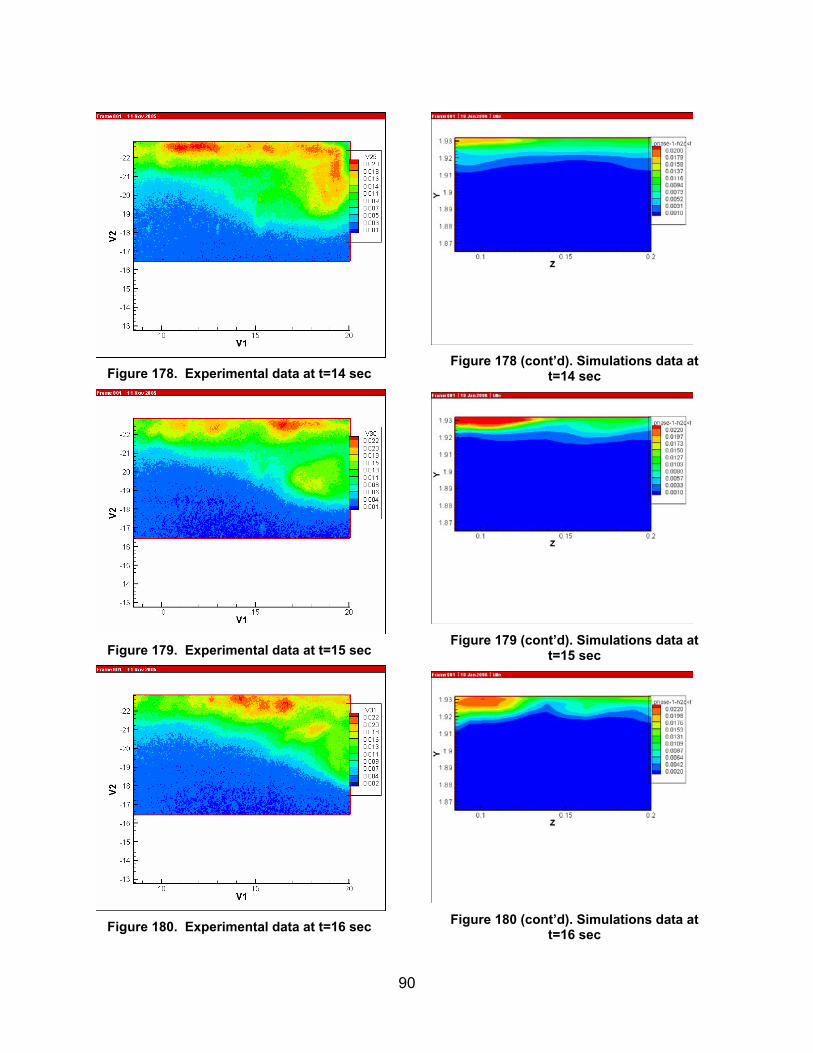
90
Figure 178. Experimental data at t=14 sec
Figure 179. Experimental data at t=15 sec
Figure 180. Experimental data at t=16 sec
Figure 178 (cont’d). Simulations data at
t=14 sec
Figure 179 (cont’d). Simulations data at
t=15 sec
Figure 180 (cont’d). Simulations data at
t=16 sec
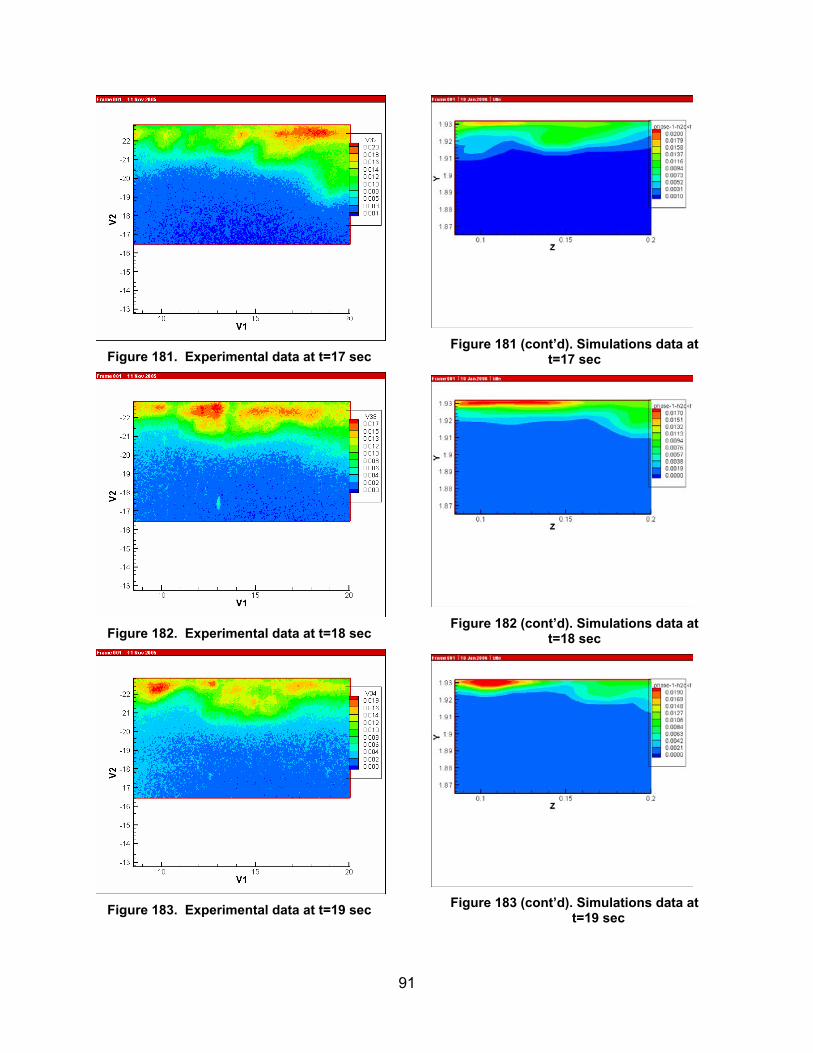
91
Figure 181. Experimental data at t=17 sec
Figure 182. Experimental data at t=18 sec
Figure 183. Experimental data at t=19 sec
Figure 181 (cont’d). Simulations data at
t=17 sec
Figure 182 (cont’d). Simulations data at
t=18 sec
Figure 183 (cont’d). Simulations data at
t=19 sec
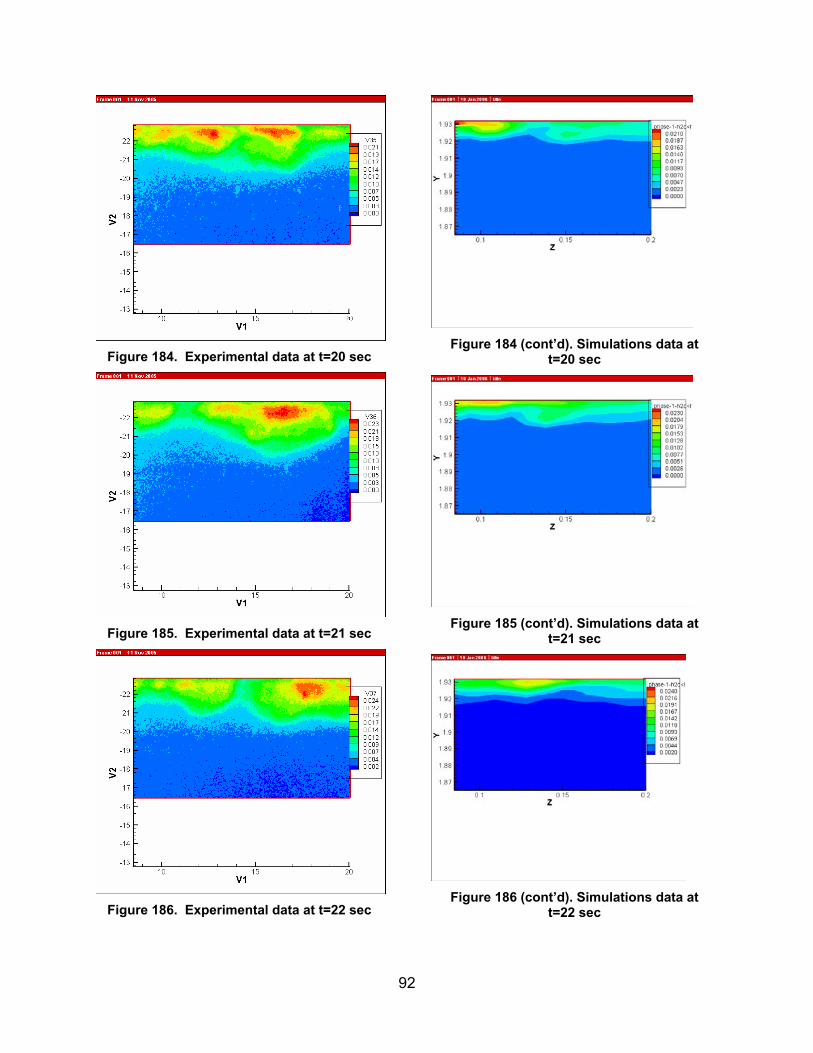
92
Figure 184. Experimental data at t=20 sec
Figure 185. Experimental data at t=21 sec
Figure 186. Experimental data at t=22 sec
Figure 184 (cont’d). Simulations data at
t=20 sec
Figure 185 (cont’d). Simulations data at
t=21 sec
Figure 186 (cont’d). Simulations data at
t=22 sec
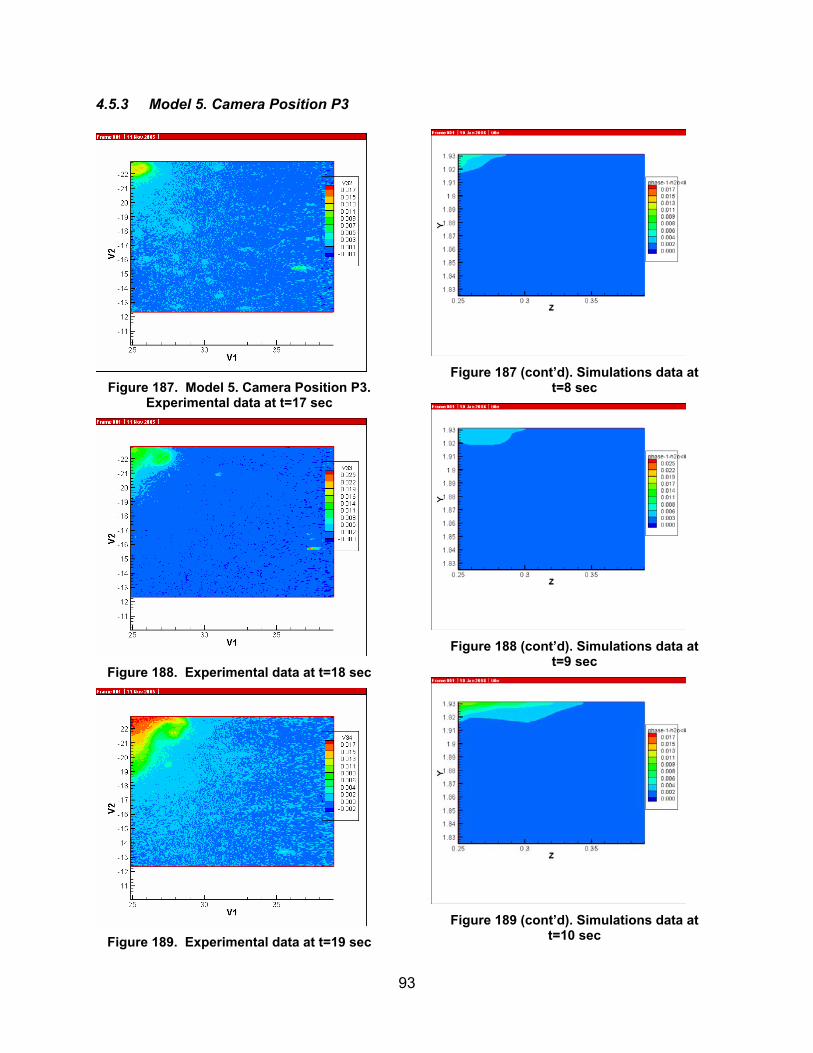
93
4.5.3 Model 5. Camera Position P3
Figure 187. Model 5. Camera Position P3.
Experimental data at t=17 sec
Figure 188. Experimental data at t=18 sec
Figure 189. Experimental data at t=19 sec
Figure 187 (cont’d). Simulations data at
t=8 sec
Figure 188 (cont’d). Simulations data at
t=9 sec
Figure 189 (cont’d). Simulations data at
t=10 sec
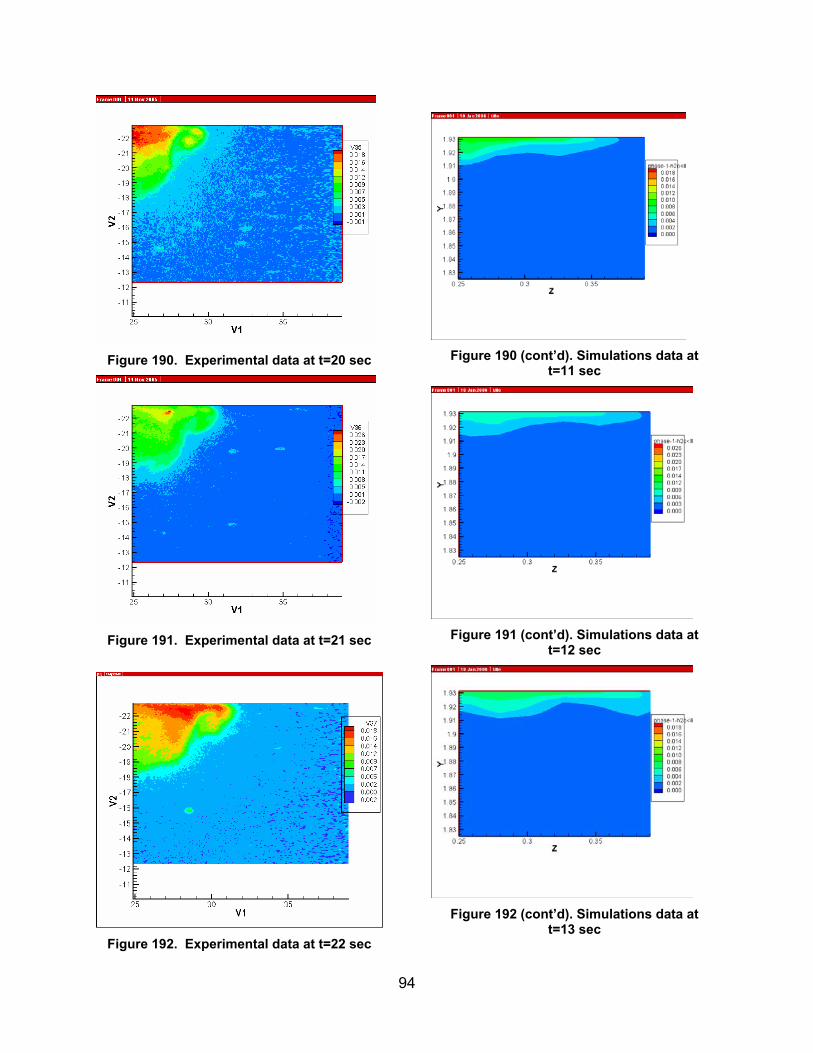
94
Figure 190. Experimental data at t=20 sec
Figure 191. Experimental data at t=21 sec
Figure 192. Experimental data at t=22 sec
Figure 190 (cont’d). Simulations data at
t=11 sec
Figure 191 (cont’d). Simulations data at
t=12 sec
Figure 192 (cont’d). Simulations data at
t=13 sec
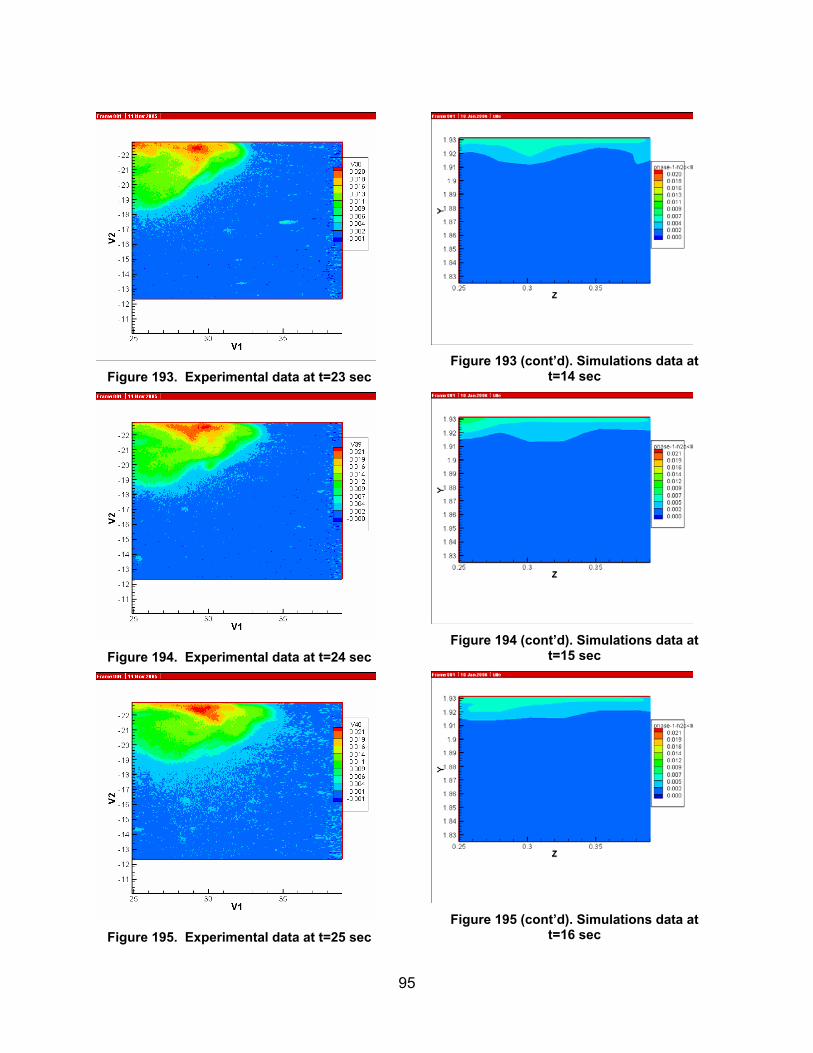
95
Figure 193. Experimental data at t=23 sec
Figure 194. Experimental data at t=24 sec
Figure 195. Experimental data at t=25 sec
Figure 193 (cont’d). Simulations data at
t=14 sec
Figure 194 (cont’d). Simulations data at
t=15 sec
Figure 195 (cont’d). Simulations data at
t=16 sec
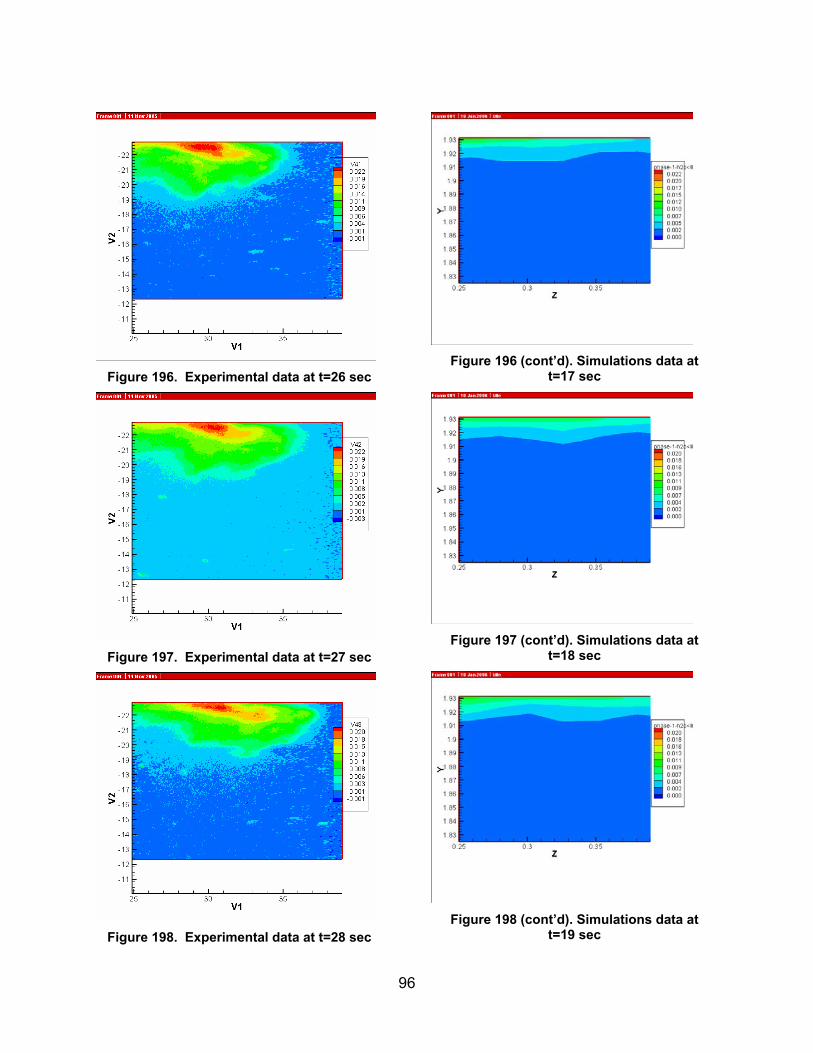
96
Figure 196. Experimental data at t=26 sec
Figure 197. Experimental data at t=27 sec
Figure 198. Experimental data at t=28 sec
Figure 196 (cont’d). Simulations data at
t=17 sec
Figure 197 (cont’d). Simulations data at
t=18 sec
Figure 198 (cont’d). Simulations data at
t=19 sec
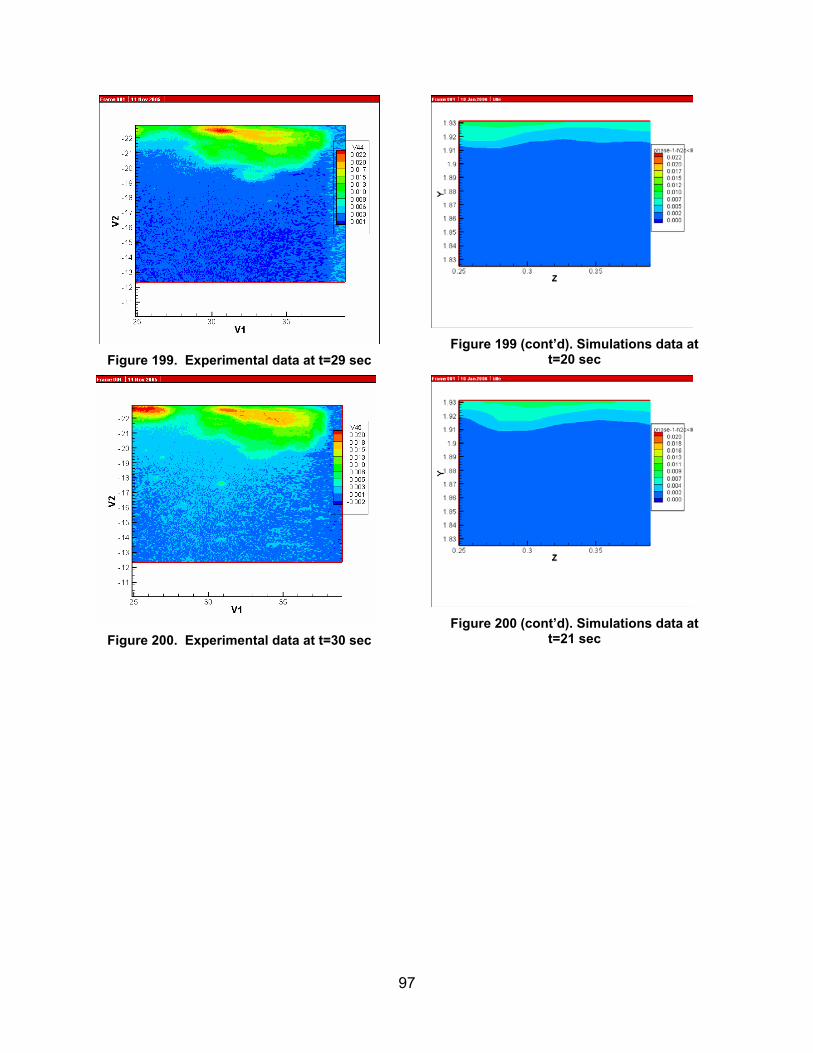
97
Figure 199. Experimental data at t=29 sec
Figure 200. Experimental data at t=30 sec
Figure 199 (cont’d). Simulations data at
t=20 sec
Figure 200 (cont’d). Simulations data at
t=21 sec

98
4.6 Model 6 This is test ID 1_1_3 where the 0.83 inch tube is used for the injection of fresh water and is placed 36 inches deep below the brine-air interface. The equivalent full-scale cavern flow rate is 80,000 bbl/day. The experimental data shown correspond to the test performed on 8/3/2005. Section 4.6.1 shows data-model comparisons for camera position P1 while Section 4.6.2 shows the results for camera position P3. The simulated mixing zone depth compares well with the experiments for both camera position and the speed of the plume compares well with the experimental data. The simulated plume enters frame P3 within 6 seconds of starting the flow while the experimental plume enters the same frame after 4 seconds.
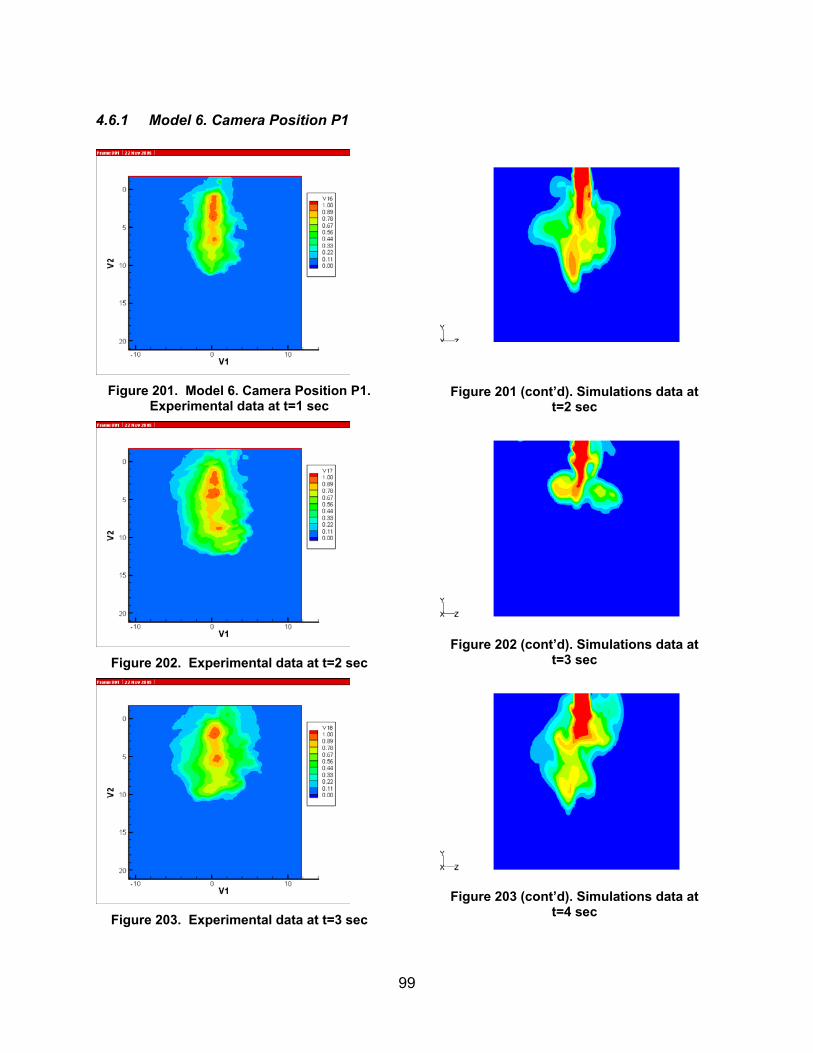
99
4.6.1 Model 6. Camera Position P1
Figure 201. Model 6. Camera Position P1.
Experimental data at t=1 sec
Figure 202. Experimental data at t=2 sec
Figure 203. Experimental data at t=3 sec
Figure 201 (cont’d). Simulations data at t=2 sec
Figure 202 (cont’d). Simulations data at
t=3 sec
Figure 203 (cont’d). Simulations data at
t=4 sec
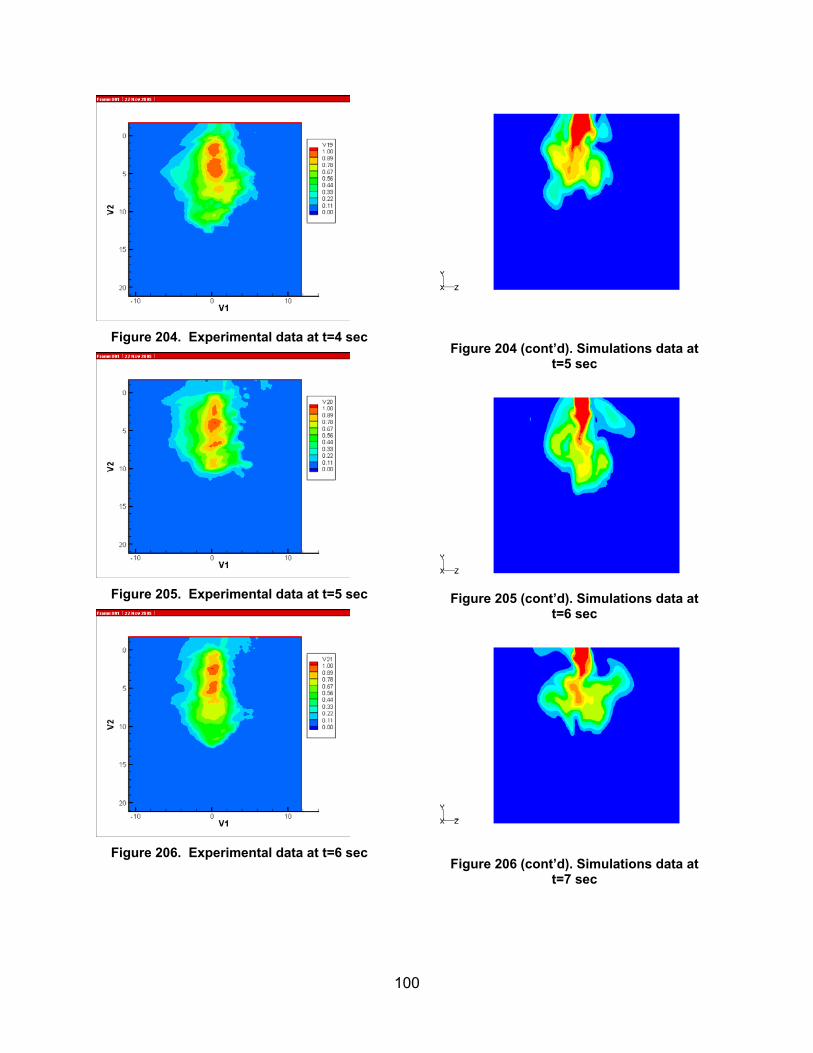
100
Figure 204. Experimental data at t=4 sec
Figure 205. Experimental data at t=5 sec
Figure 206. Experimental data at t=6 sec
Figure 204 (cont’d). Simulations data at t=5 sec
Figure 205 (cont’d). Simulations data at
t=6 sec
Figure 206 (cont’d). Simulations data at t=7 sec
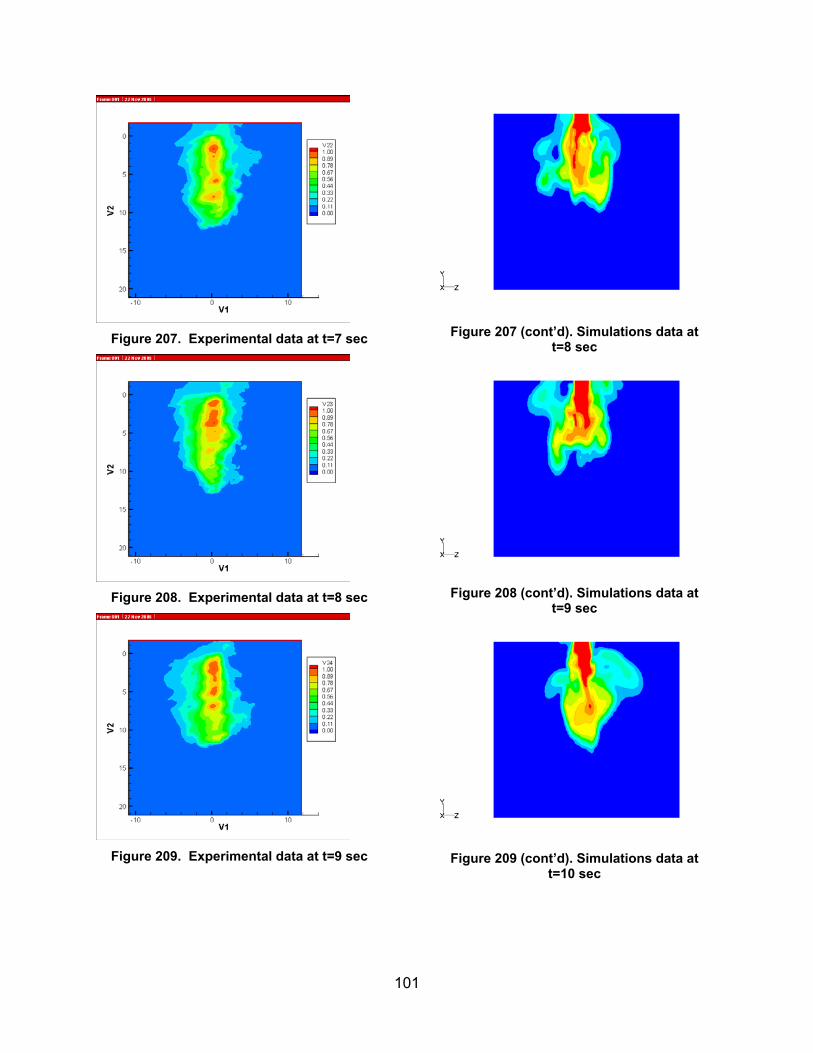
101
Figure 207. Experimental data at t=7 sec
Figure 208. Experimental data at t=8 sec
Figure 209. Experimental data at t=9 sec
Figure 207 (cont’d). Simulations data at t=8 sec
Figure 208 (cont’d). Simulations data at t=9 sec
Figure 209 (cont’d). Simulations data at t=10 sec
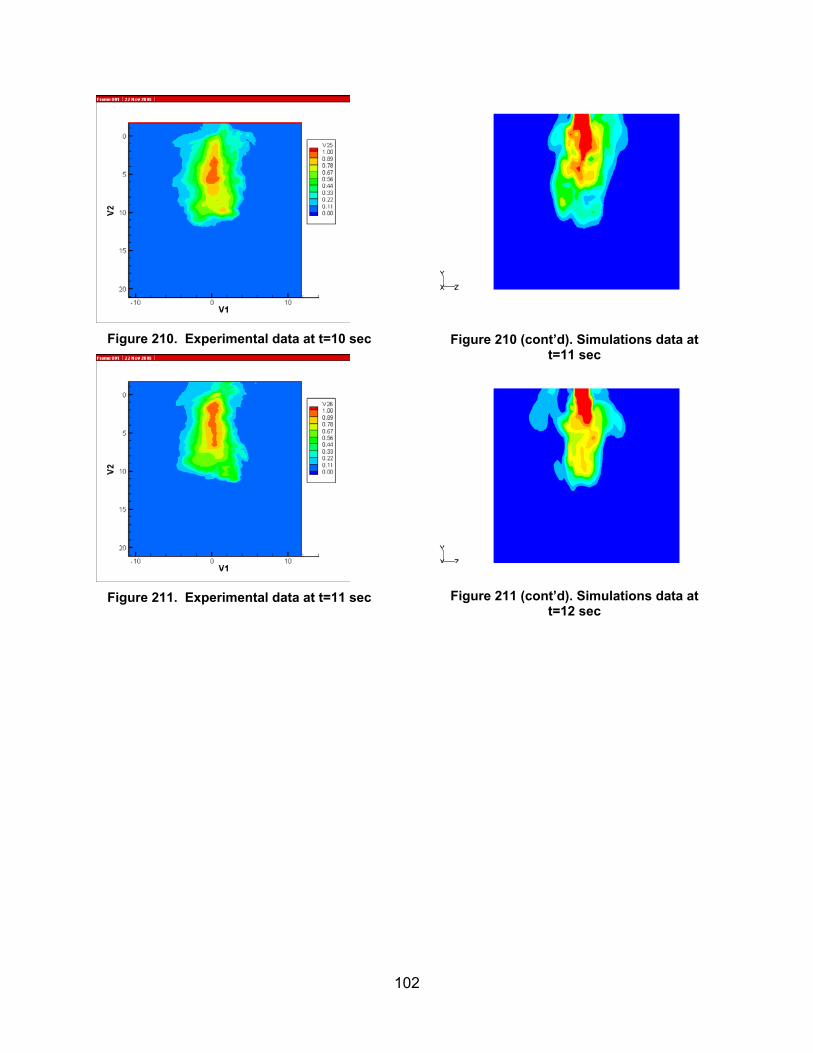
102
Figure 210. Experimental data at t=10 sec
Figure 211. Experimental data at t=11 sec
Figure 210 (cont’d). Simulations data at t=11 sec
Figure 211 (cont’d). Simulations data at t=12 sec
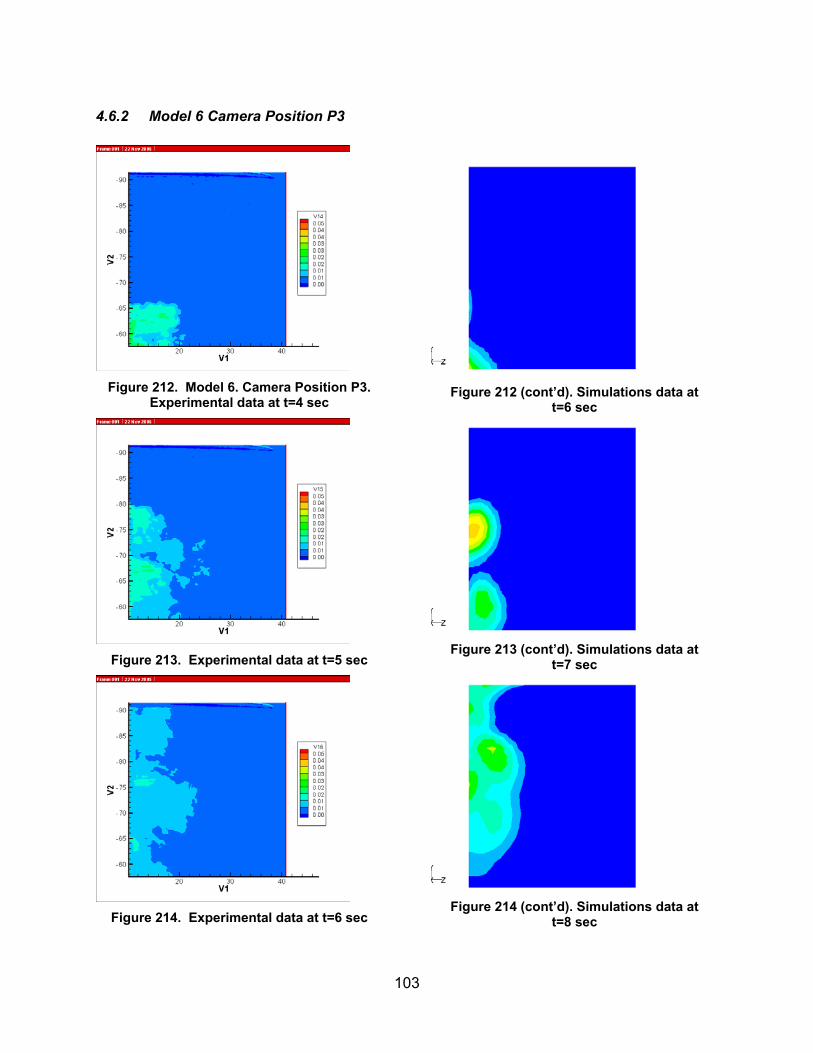
103
4.6.2 Model 6 Camera Position P3
Figure 212. Model 6. Camera Position P3.
Experimental data at t=4 sec
Figure 213. Experimental data at t=5 sec
Figure 214. Experimental data at t=6 sec
Figure 212 (cont’d). Simulations data at
t=6 sec
Figure 213 (cont’d). Simulations data at
t=7 sec
Figure 214 (cont’d). Simulations data at
t=8 sec
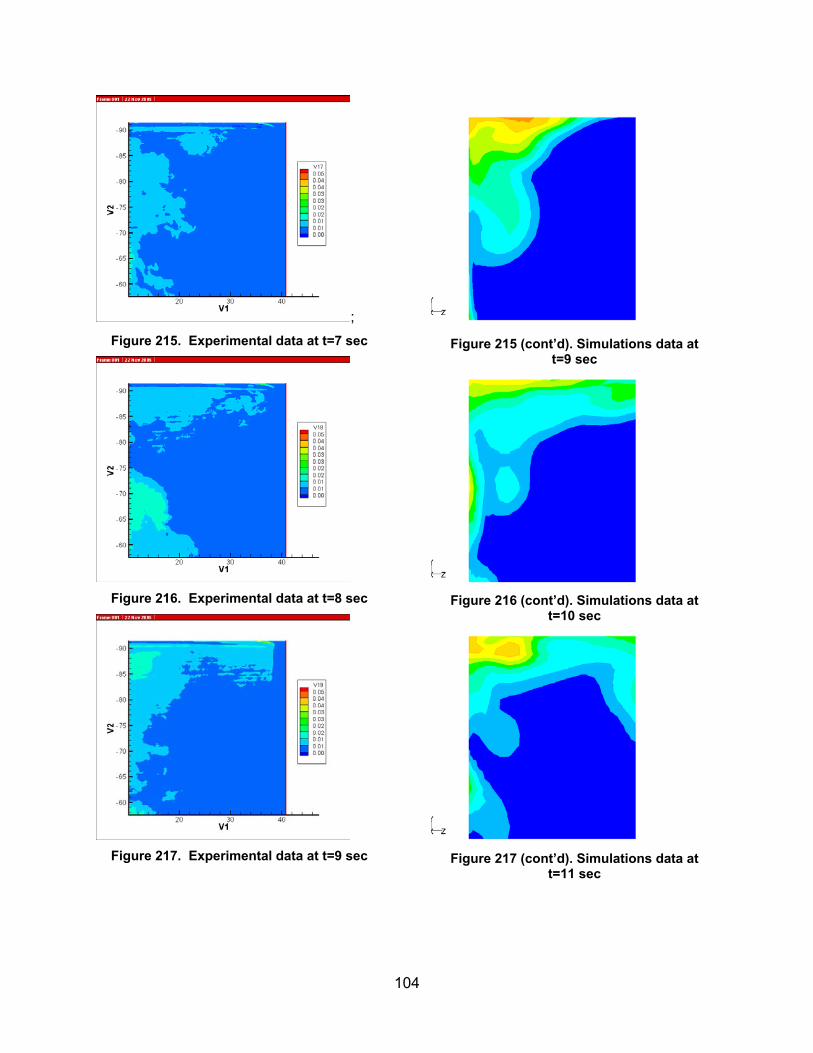
104
; Figure 215. Experimental data at t=7 sec
Figure 216. Experimental data at t=8 sec
Figure 217. Experimental data at t=9 sec
Figure 215 (cont’d). Simulations data at
t=9 sec
Figure 216 (cont’d). Simulations data at
t=10 sec
Figure 217 (cont’d). Simulations data at
t=11 sec
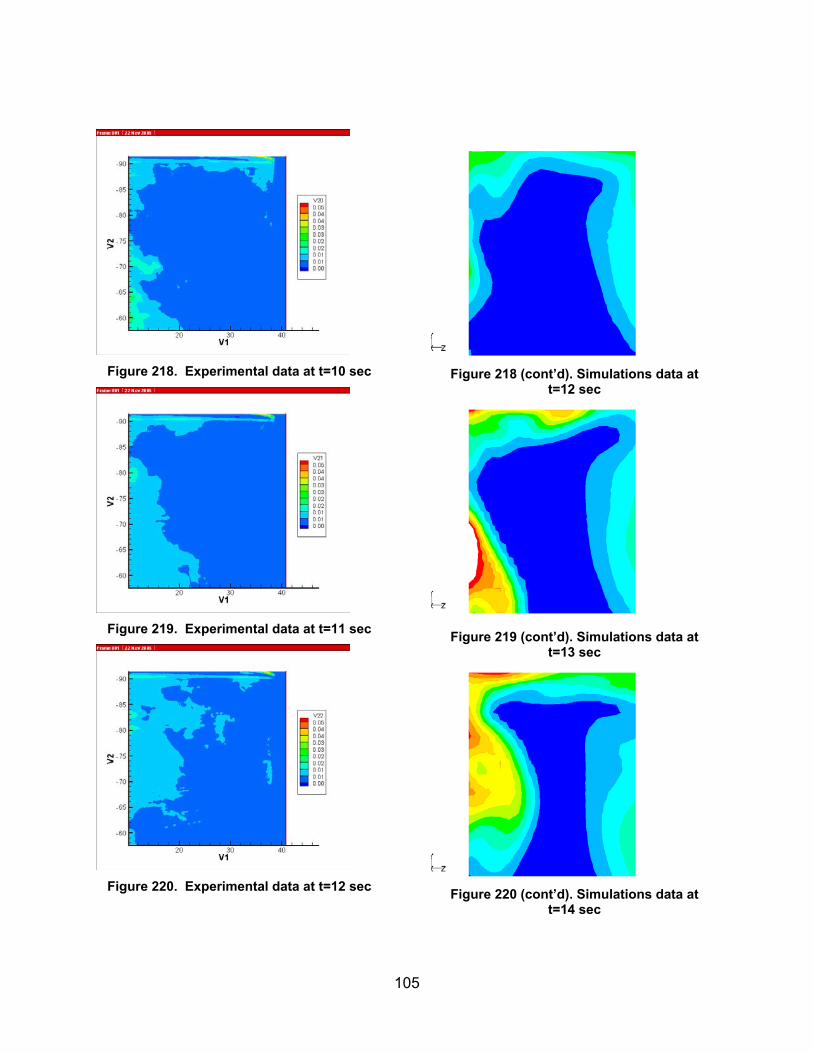
105
Figure 218. Experimental data at t=10 sec
Figure 219. Experimental data at t=11 sec
Figure 220. Experimental data at t=12 sec
Figure 218 (cont’d). Simulations data at
t=12 sec
Figure 219 (cont’d). Simulations data at
t=13 sec
Figure 220 (cont’d). Simulations data at
t=14 sec
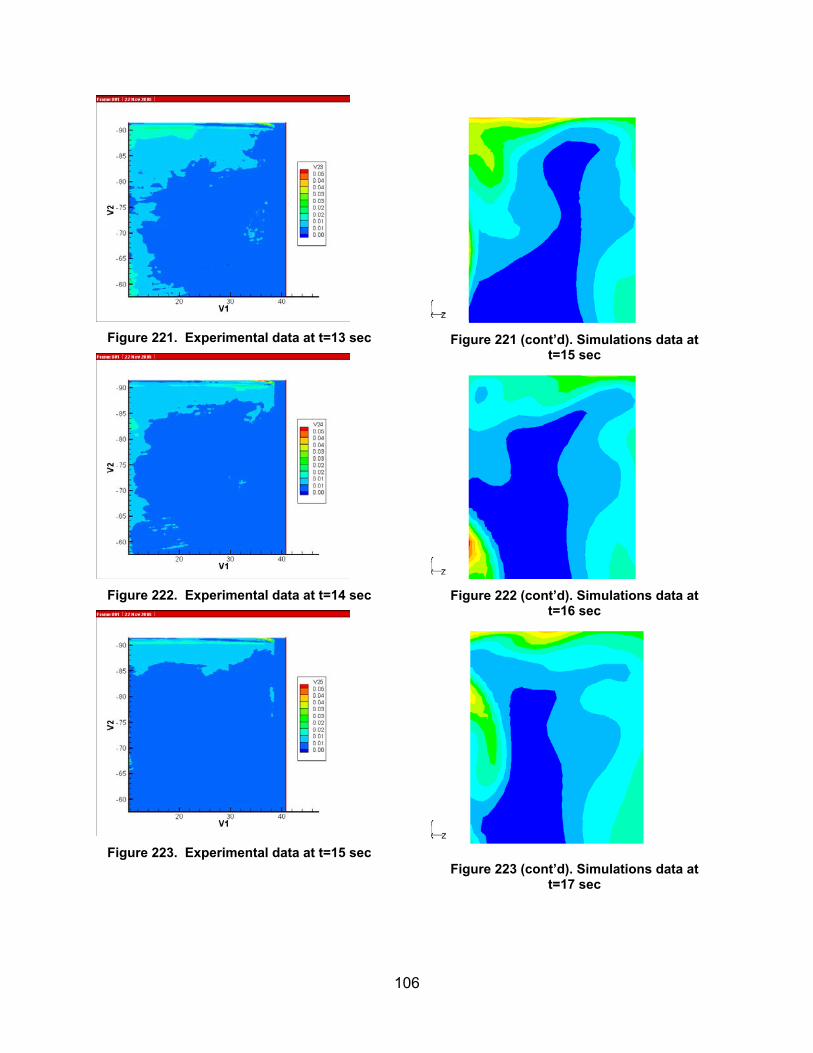
106
Figure 221. Experimental data at t=13 sec
Figure 222. Experimental data at t=14 sec
Figure 223. Experimental data at t=15 sec
Figure 221 (cont’d). Simulations data at
t=15 sec
Figure 222 (cont’d). Simulations data at
t=16 sec
Figure 223 (cont’d). Simulations data at
t=17 sec
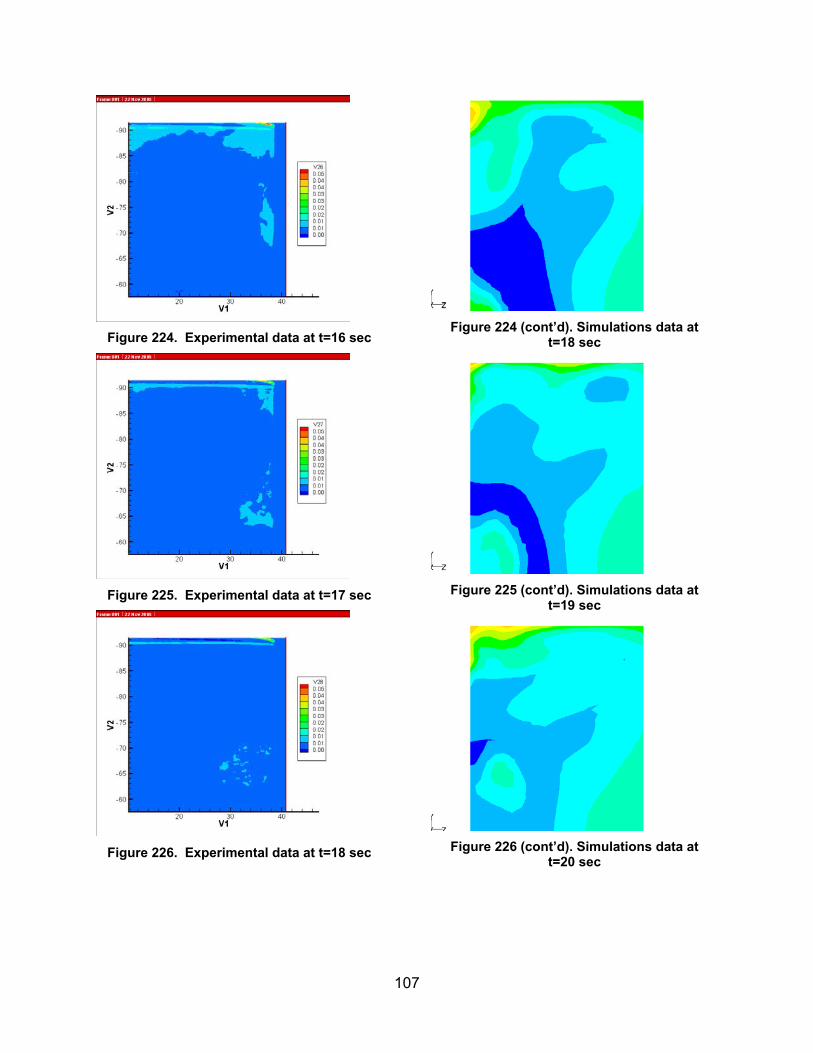
107
Figure 224. Experimental data at t=16 sec
Figure 225. Experimental data at t=17 sec
Figure 226. Experimental data at t=18 sec
Figure 224 (cont’d). Simulations data at
t=18 sec
Figure 225 (cont’d). Simulations data at
t=19 sec
Figure 226 (cont’d). Simulations data at
t=20 sec

108
4.7 Model 7 This is test ID 1_2_3 where the 0.83 inch tube is used for the injection of fresh water and is placed 36 inches deep below the brine-air interface. The equivalent full-scale cavern flow rate is 100,000 bbl/day. The experimental data shown correspond to the test performed on 8/3/2005. Section 4.7.1 shows data-model comparisons for camera position P1 while Section 4.7.2 shows the results for camera position P3. The simulated mixing zone depth compares well with the experiments for both camera position and the speed of the plume compares well with the experimental data. The simulated plume enters frame P3 within 6 seconds of starting the flow while the experimental plume enters the same frame within 5 seconds.
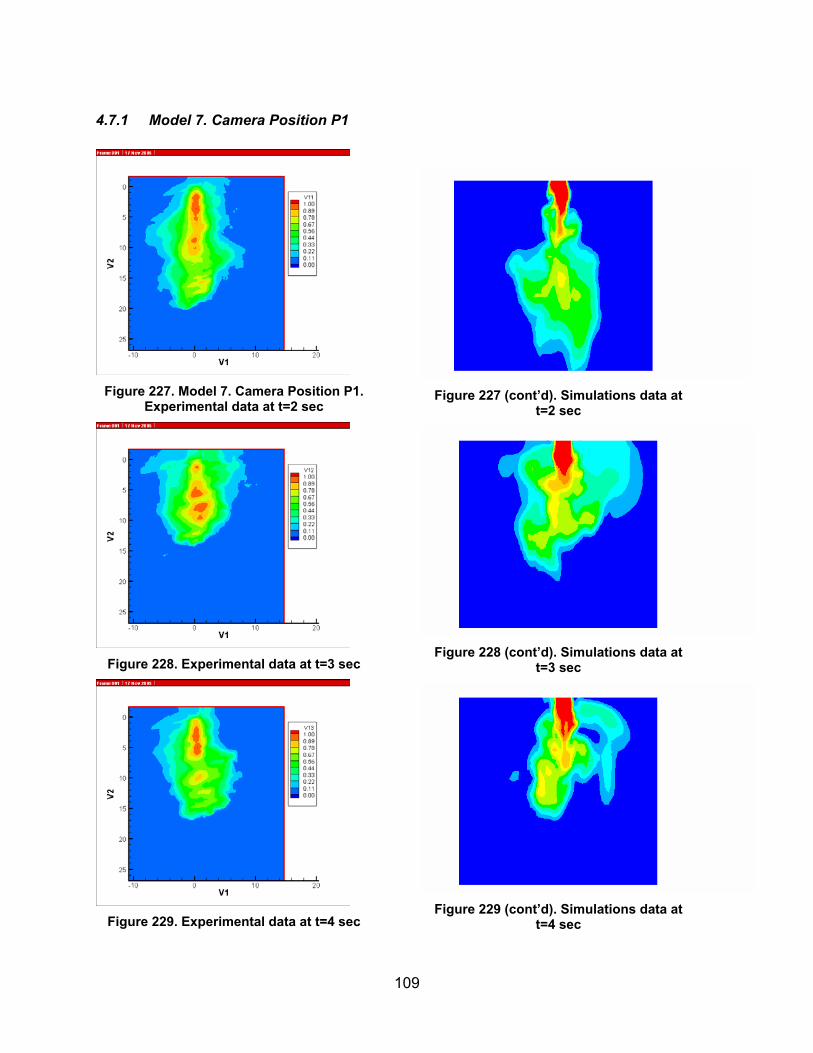
109
4.7.1 Model 7. Camera Position P1
Figure 227. Model 7. Camera Position P1.
Experimental data at t=2 sec
Figure 228. Experimental data at t=3 sec
Figure 229. Experimental data at t=4 sec
Figure 227 (cont’d). Simulations data at
t=2 sec
Figure 228 (cont’d). Simulations data at
t=3 sec
Figure 229 (cont’d). Simulations data at
t=4 sec
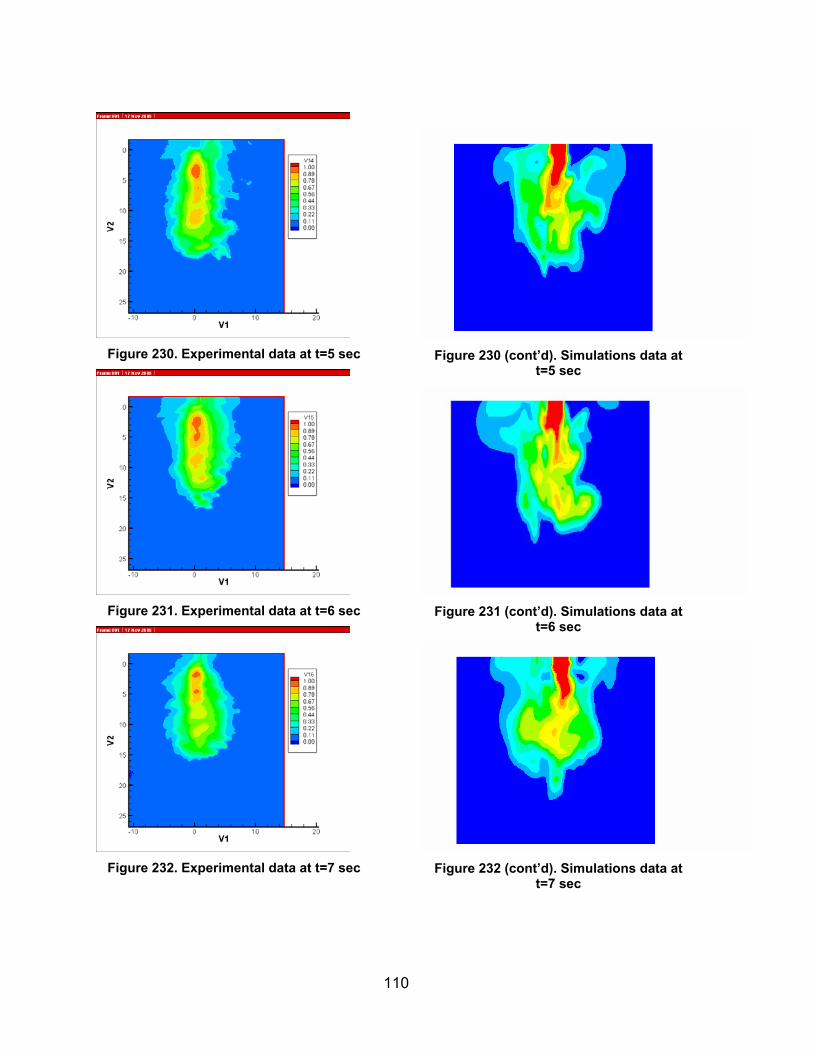
110
Figure 230. Experimental data at t=5 sec
Figure 231. Experimental data at t=6 sec
Figure 232. Experimental data at t=7 sec
Figure 230 (cont’d). Simulations data at
t=5 sec
Figure 231 (cont’d). Simulations data at
t=6 sec
Figure 232 (cont’d). Simulations data at
t=7 sec
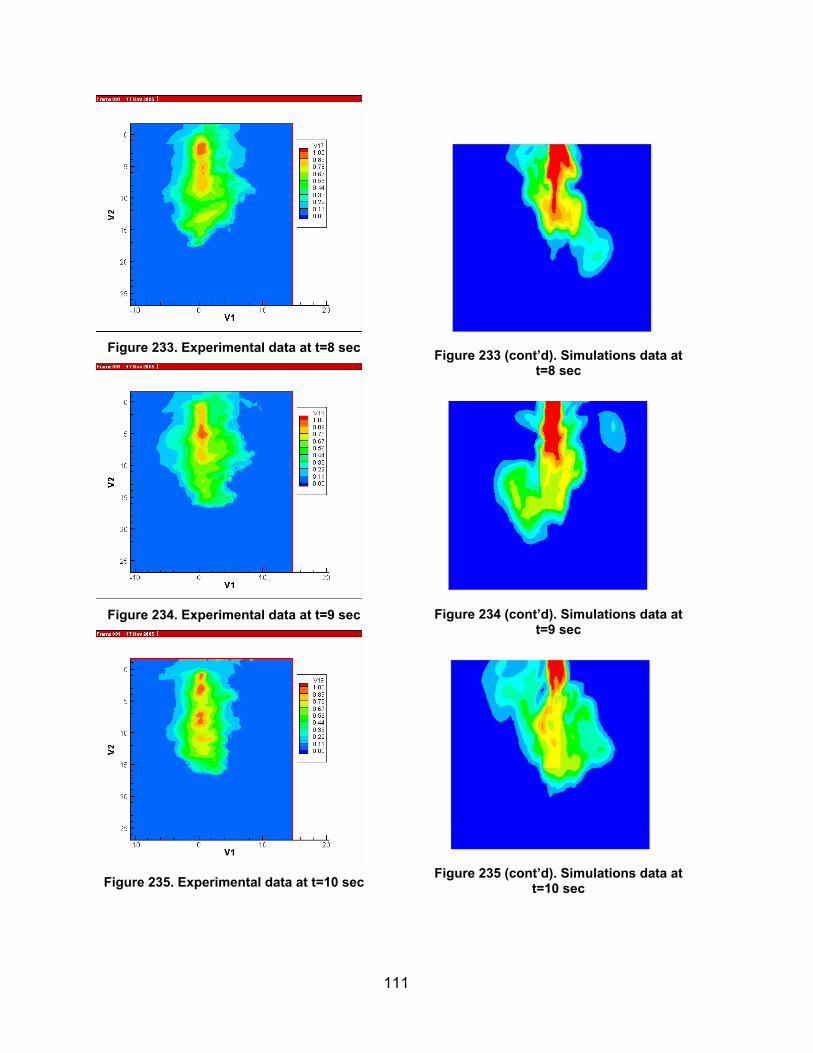
111
Figure 233. Experimental data at t=8 sec
Figure 234. Experimental data at t=9 sec
Figure 235. Experimental data at t=10 sec
Figure 233 (cont’d). Simulations data at
t=8 sec
Figure 234 (cont’d). Simulations data at
t=9 sec
Figure 235 (cont’d). Simulations data at
t=10 sec
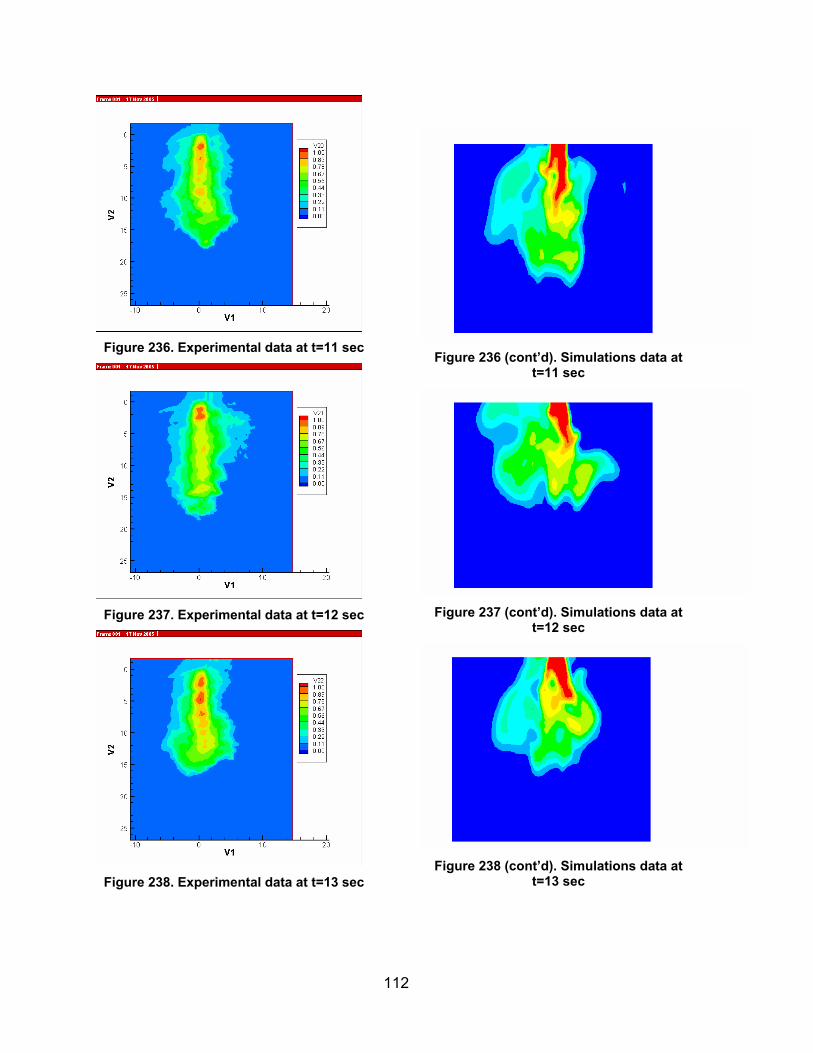
112
Figure 236. Experimental data at t=11 sec
Figure 237. Experimental data at t=12 sec
Figure 238. Experimental data at t=13 sec
Figure 236 (cont’d). Simulations data at
t=11 sec
Figure 237 (cont’d). Simulations data at
t=12 sec
Figure 238 (cont’d). Simulations data at
t=13 sec
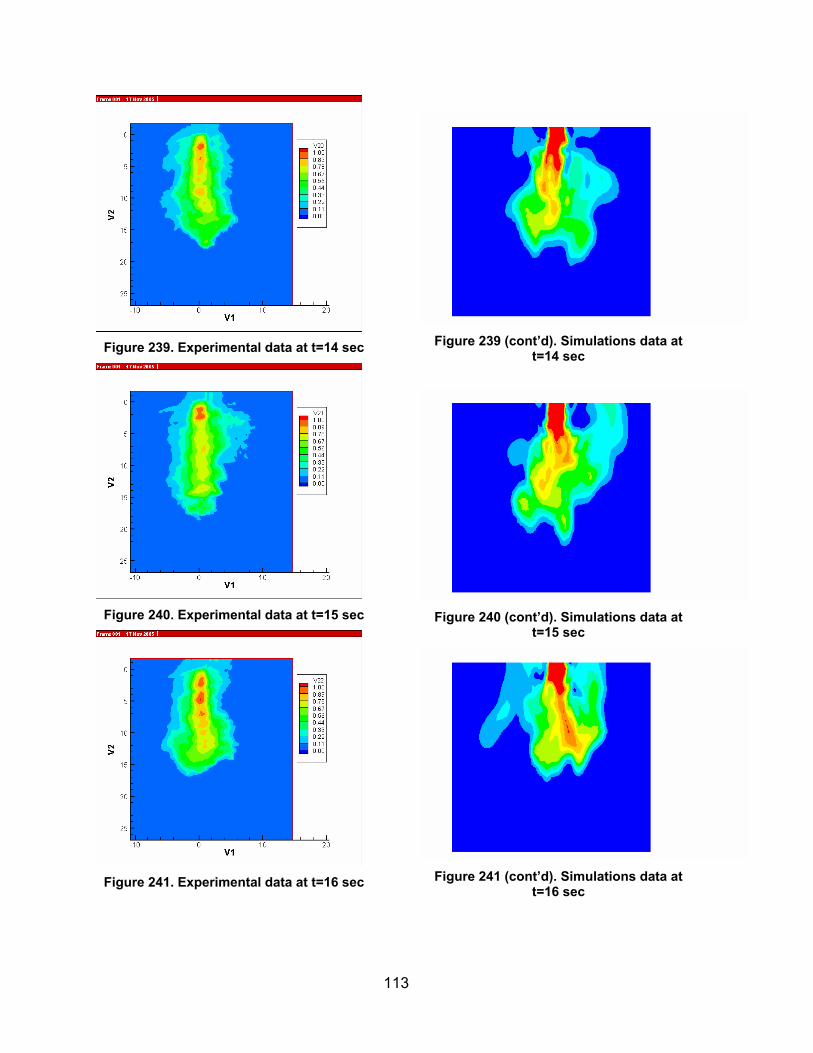
113
Figure 239. Experimental data at t=14 sec
Figure 240. Experimental data at t=15 sec
Figure 241. Experimental data at t=16 sec
Figure 239 (cont’d). Simulations data at
t=14 sec
Figure 240 (cont’d). Simulations data at
t=15 sec
Figure 241 (cont’d). Simulations data at
t=16 sec
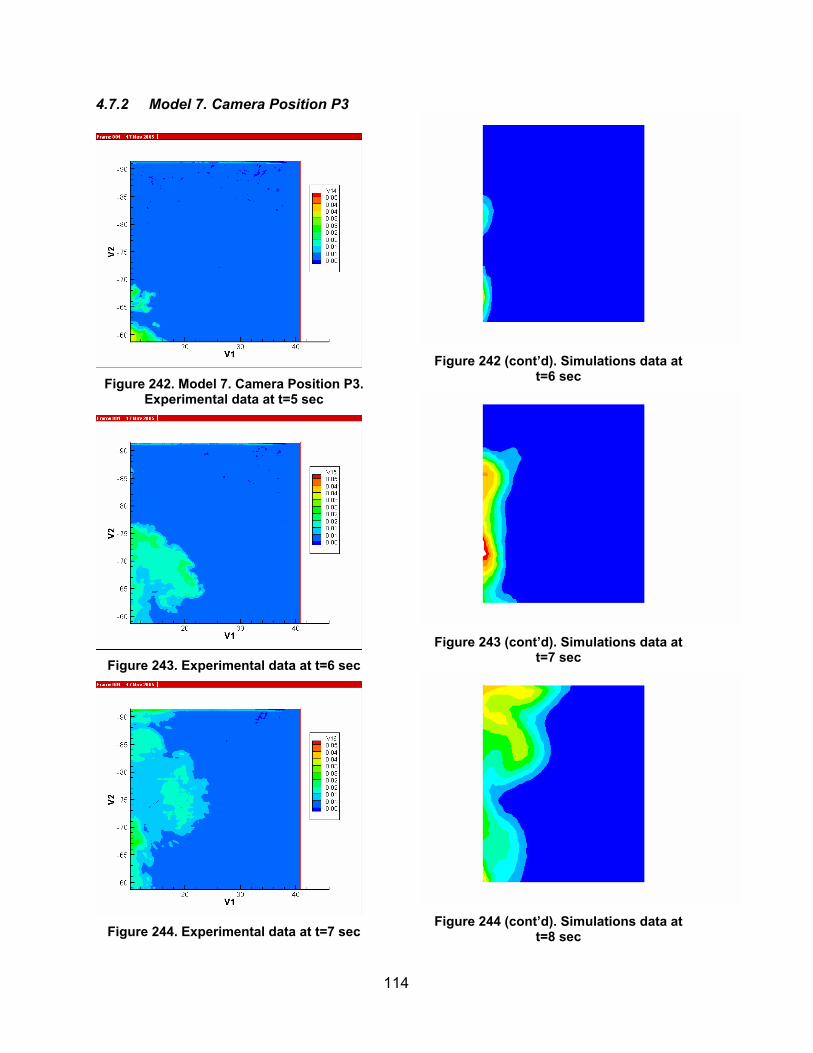
114
4.7.2 Model 7. Camera Position P3
Figure 242. Model 7. Camera Position P3.
Experimental data at t=5 sec
Figure 243. Experimental data at t=6 sec
Figure 244. Experimental data at t=7 sec
Figure 242 (cont’d). Simulations data at
t=6 sec
Figure 243 (cont’d). Simulations data at
t=7 sec
Figure 244 (cont’d). Simulations data at
t=8 sec
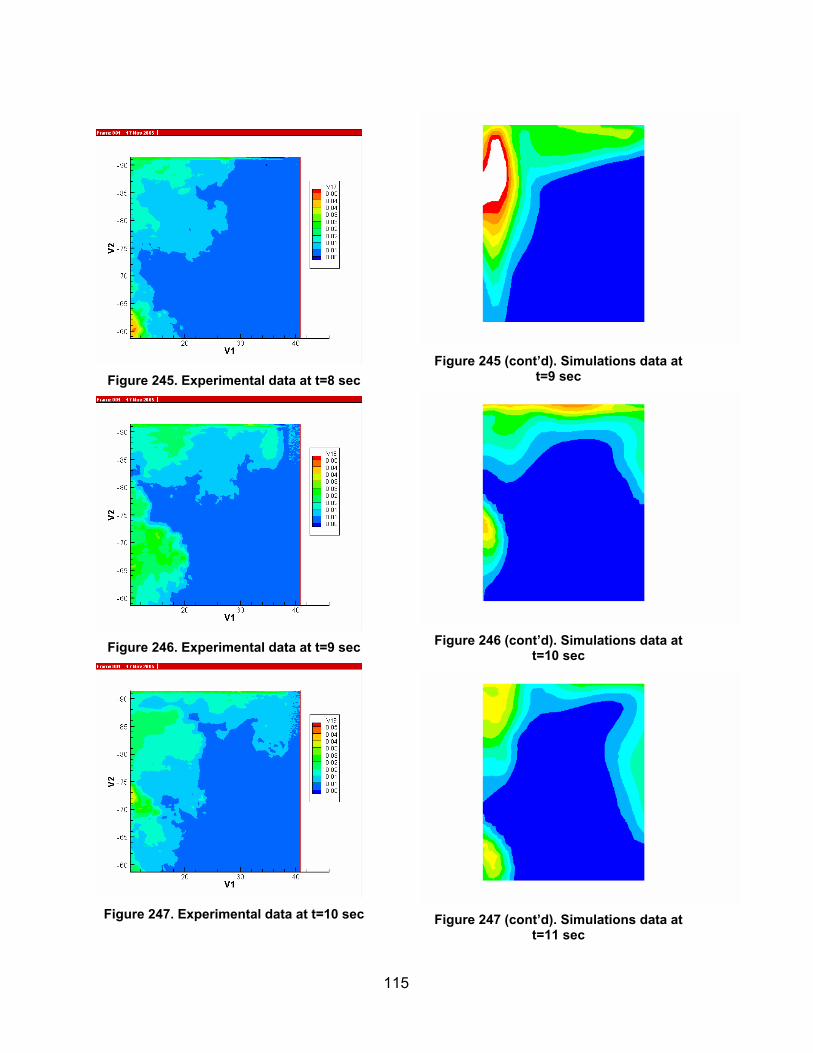
115
Figure 245. Experimental data at t=8 sec
Figure 246. Experimental data at t=9 sec
Figure 247. Experimental data at t=10 sec
Figure 245 (cont’d). Simulations data at
t=9 sec
Figure 246 (cont’d). Simulations data at
t=10 sec
Figure 247 (cont’d). Simulations data at
t=11 sec
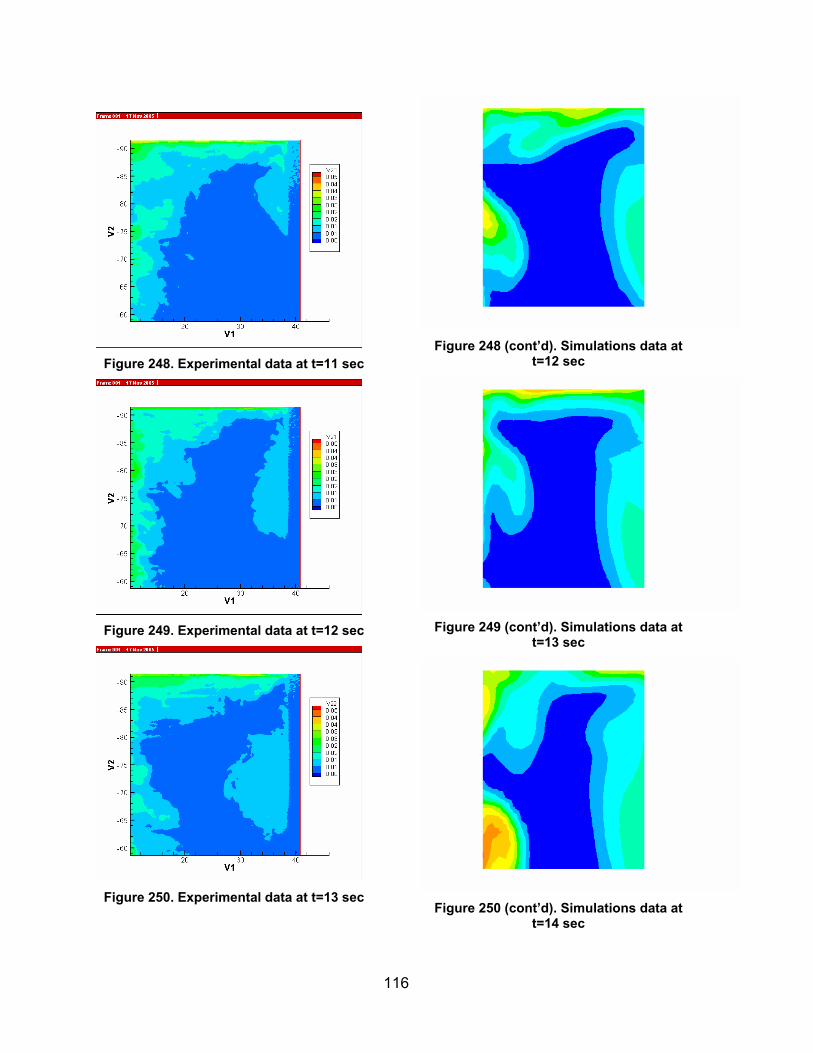
116
Figure 248. Experimental data at t=11 sec
Figure 249. Experimental data at t=12 sec
Figure 250. Experimental data at t=13 sec
Figure 248 (cont’d). Simulations data at
t=12 sec
Figure 249 (cont’d). Simulations data at
t=13 sec
Figure 250 (cont’d). Simulations data at
t=14 sec
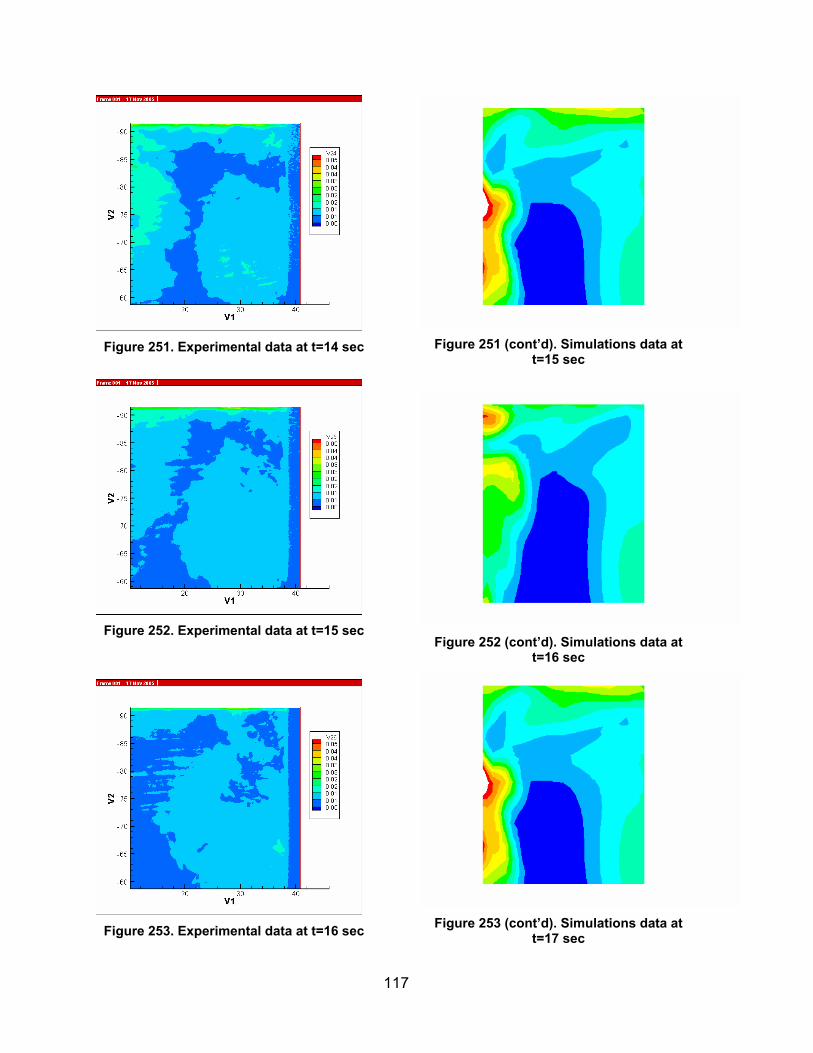
117
Figure 251. Experimental data at t=14 sec
Figure 252. Experimental data at t=15 sec
Figure 253. Experimental data at t=16 sec
Figure 251 (cont’d). Simulations data at
t=15 sec
Figure 252 (cont’d). Simulations data at
t=16 sec
Figure 253 (cont’d). Simulations data at
t=17 sec
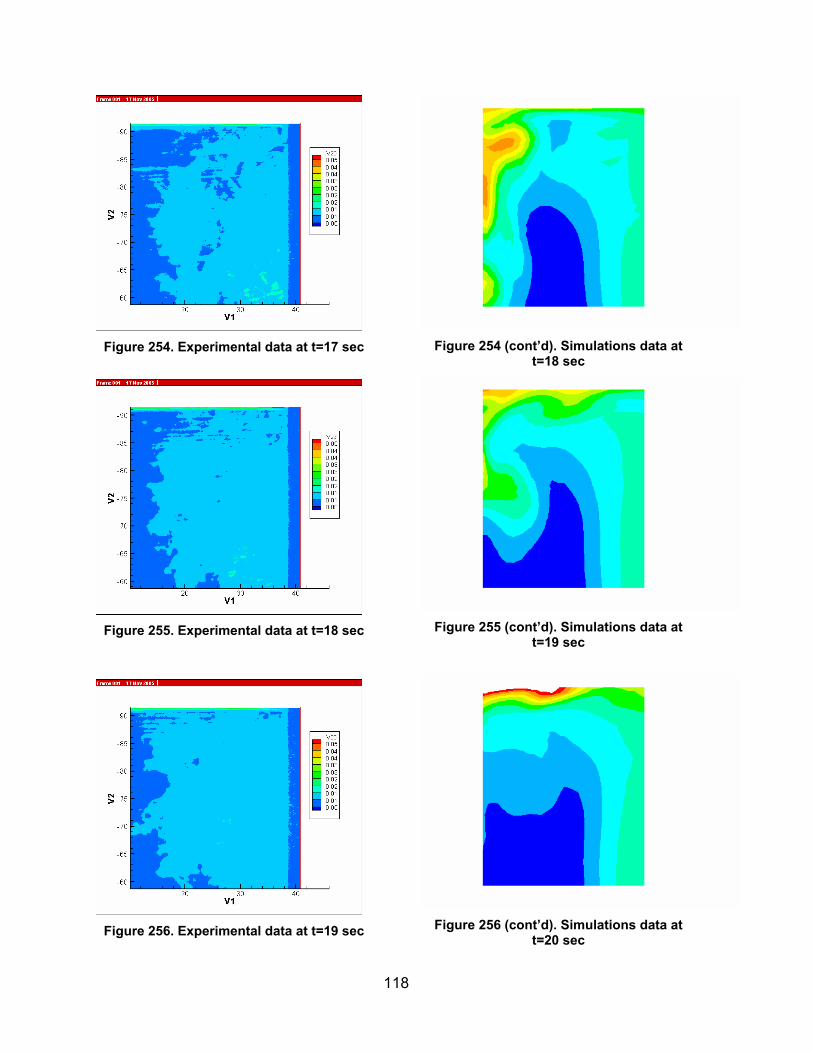
118
Figure 254. Experimental data at t=17 sec
Figure 255. Experimental data at t=18 sec
Figure 256. Experimental data at t=19 sec
Figure 254 (cont’d). Simulations data at
t=18 sec
Figure 255 (cont’d). Simulations data at
t=19 sec
Figure 256 (cont’d). Simulations data at
t=20 sec
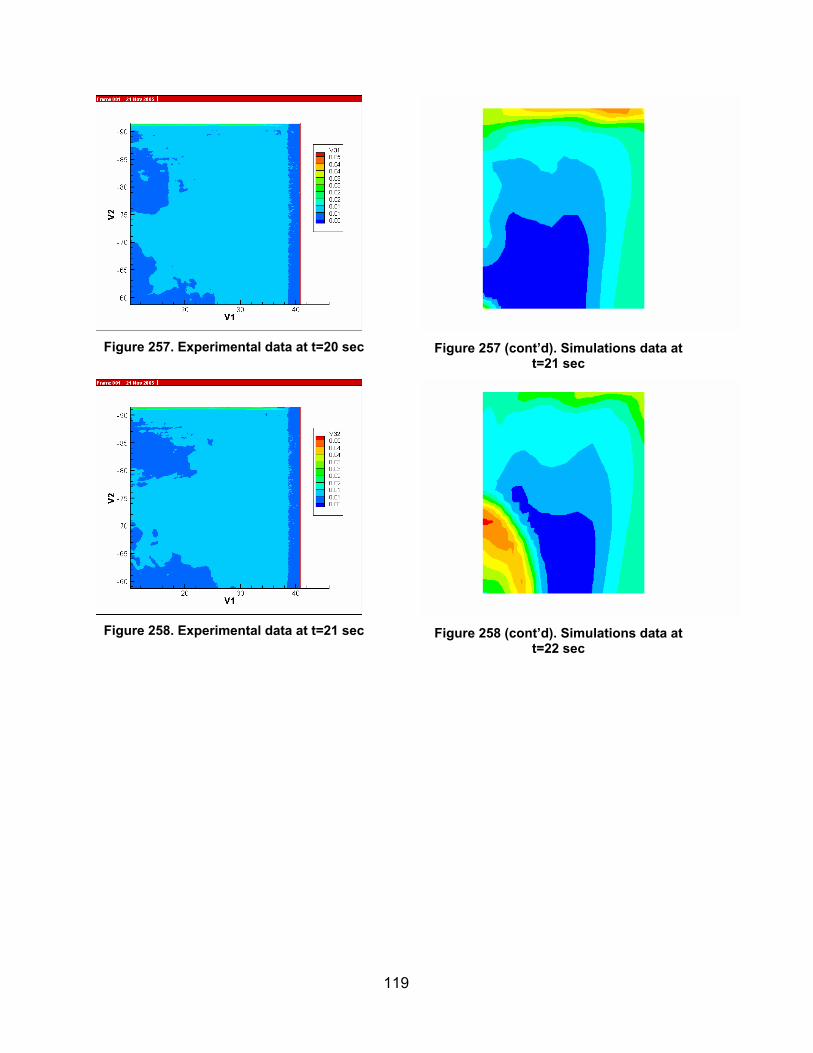
119
Figure 257. Experimental data at t=20 sec
Figure 258. Experimental data at t=21 sec
Figure 257 (cont’d). Simulations data at
t=21 sec
Figure 258 (cont’d). Simulations data at
t=22 sec
120
4.8 Model 8 This is test ID 1_3_3 where the 0.83 inch tube is used for the injection of fresh water and is placed 36 inches deep below the brine-air interface. The equivalent full-scale cavern flow rate is 180,000 bbl/day. The experimental data shown correspond to the test performed on 8/3/2005. Section 4.8.1 shows data-model comparisons for camera position P1 while Section 4.8.2 shows the results for camera position P3. The simulated mixing zone depth compares well with the experiments for both camera position and the speed of the plume compares well with the experimental data. The simulated plume enters frame P3 within 8 seconds of starting the flow while the experimental plume enters the same frame within 10 seconds.
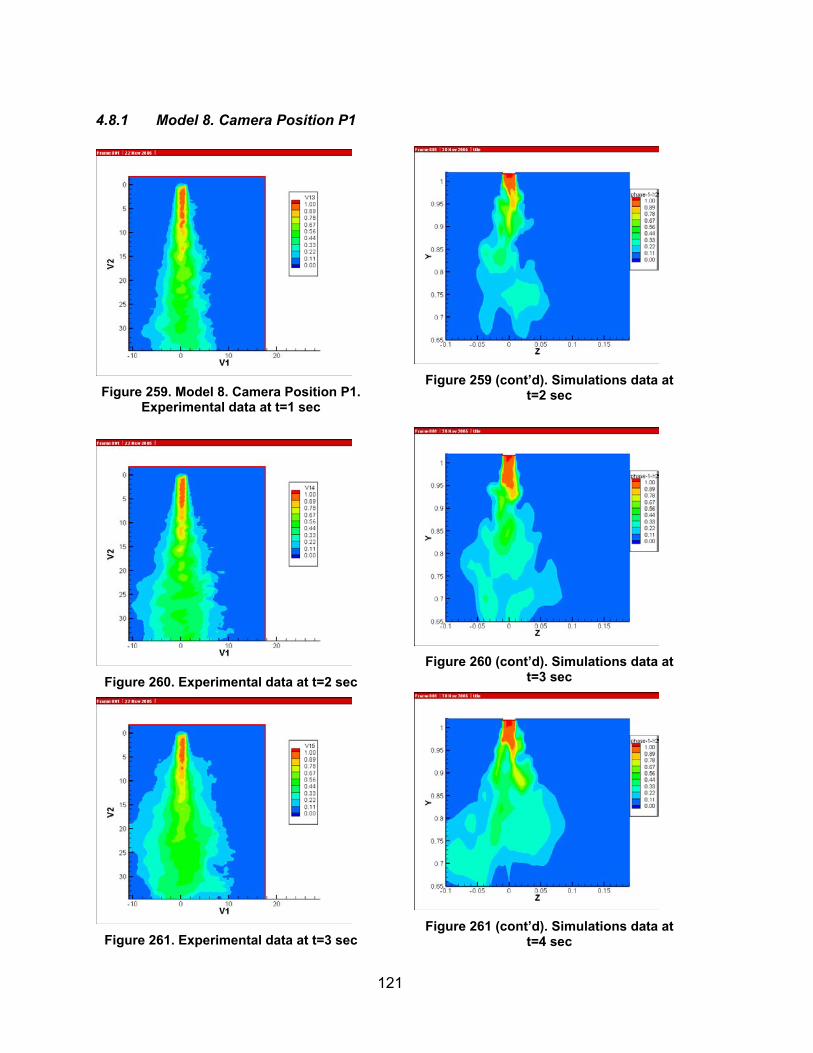
121
4.8.1 Model 8. Camera Position P1
Figure 259. Model 8. Camera Position P1.
Experimental data at t=1 sec
Figure 260. Experimental data at t=2 sec
Figure 261. Experimental data at t=3 sec
Figure 259 (cont’d). Simulations data at
t=2 sec
Figure 260 (cont’d). Simulations data at
t=3 sec
Figure 261 (cont’d). Simulations data at
t=4 sec
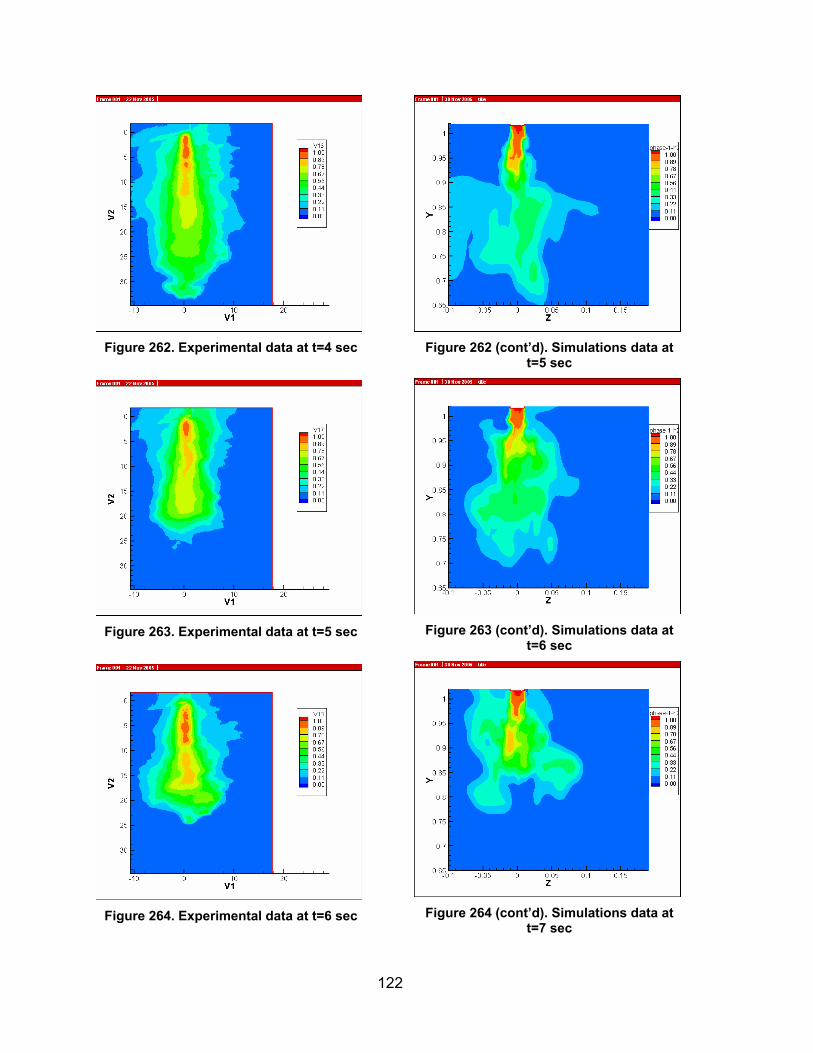
122
Figure 262. Experimental data at t=4 sec
Figure 263. Experimental data at t=5 sec
Figure 264. Experimental data at t=6 sec
Figure 262 (cont’d). Simulations data at
t=5 sec
Figure 263 (cont’d). Simulations data at
t=6 sec
Figure 264 (cont’d). Simulations data at
t=7 sec
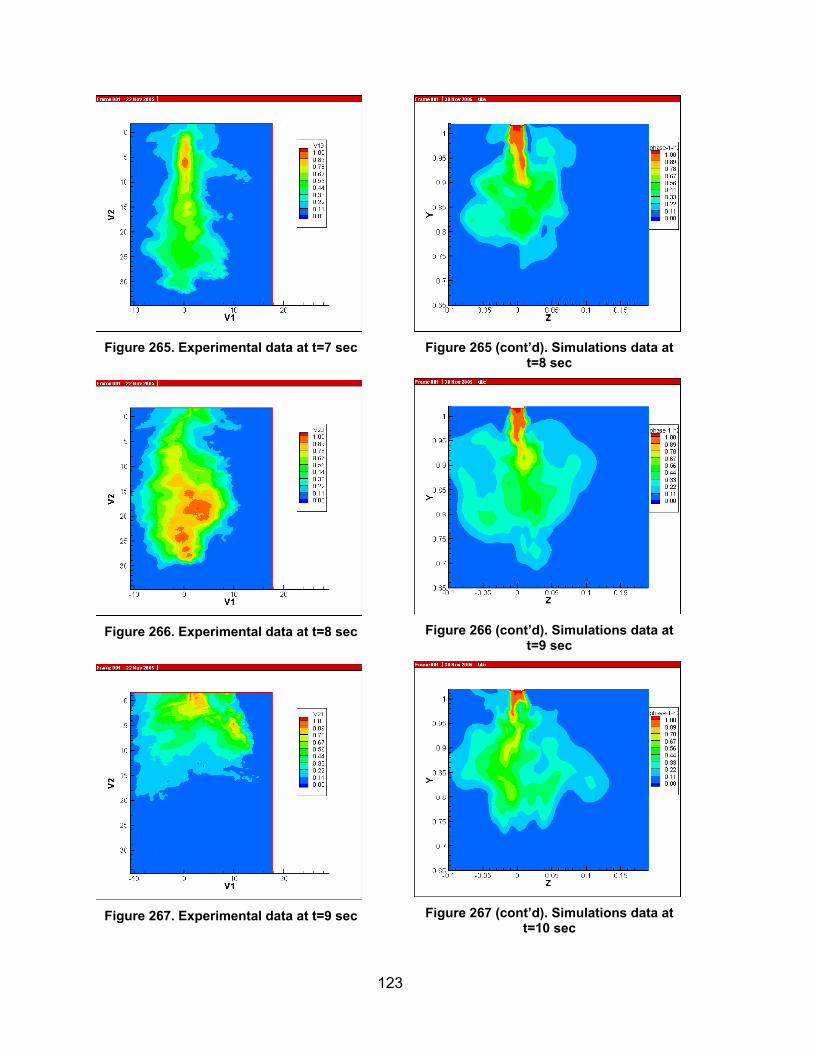
123
Figure 265. Experimental data at t=7 sec
Figure 266. Experimental data at t=8 sec
Figure 267. Experimental data at t=9 sec
Figure 265 (cont’d). Simulations data at
t=8 sec
Figure 266 (cont’d). Simulations data at
t=9 sec
Figure 267 (cont’d). Simulations data at
t=10 sec
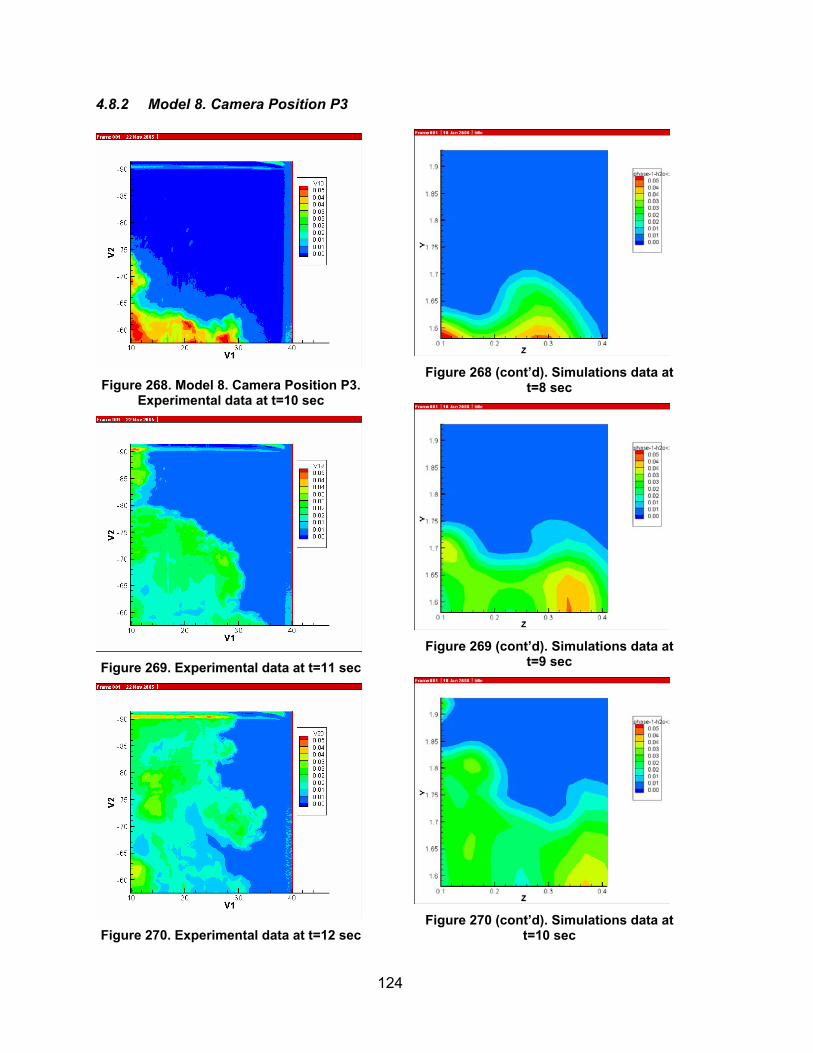
124
4.8.2 Model 8. Camera Position P3
Figure 268. Model 8. Camera Position P3.
Experimental data at t=10 sec
Figure 269. Experimental data at t=11 sec
Figure 270. Experimental data at t=12 sec
Figure 268 (cont’d). Simulations data at
t=8 sec
Figure 269 (cont’d). Simulations data at
t=9 sec
Figure 270 (cont’d). Simulations data at
t=10 sec
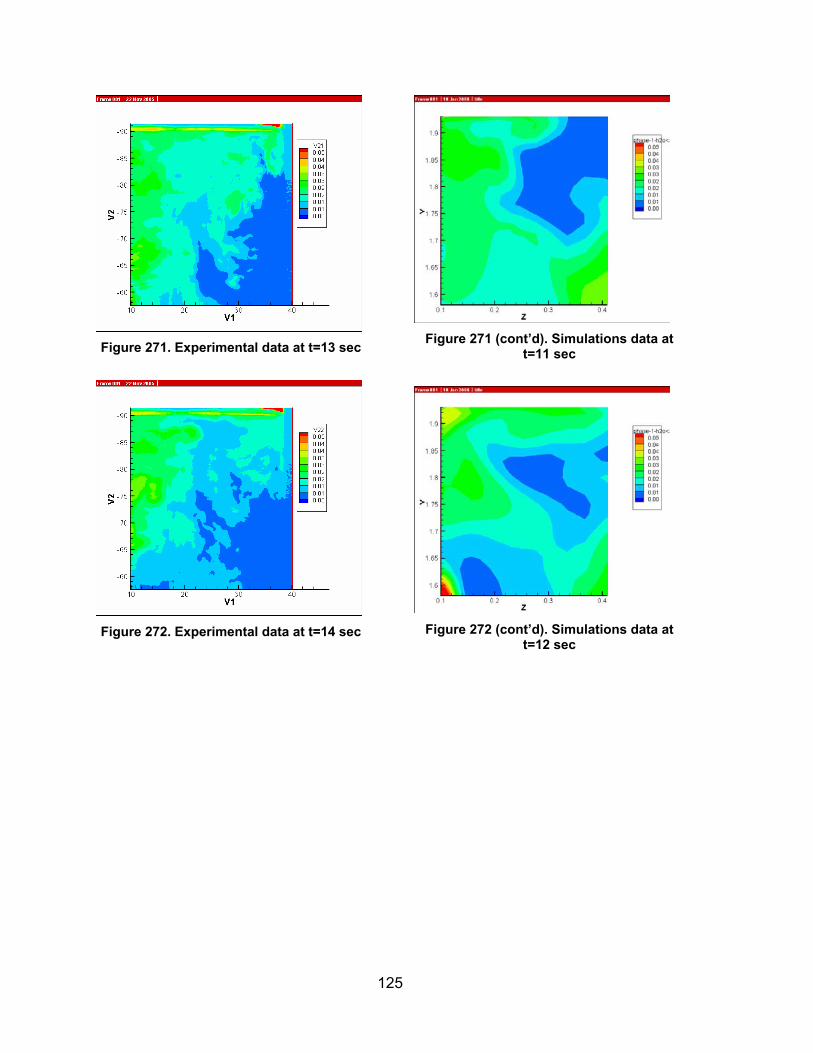
125
Figure 271. Experimental data at t=13 sec
Figure 272. Experimental data at t=14 sec
Figure 271 (cont’d). Simulations data at
t=11 sec
Figure 272 (cont’d). Simulations data at
t=12 sec

126
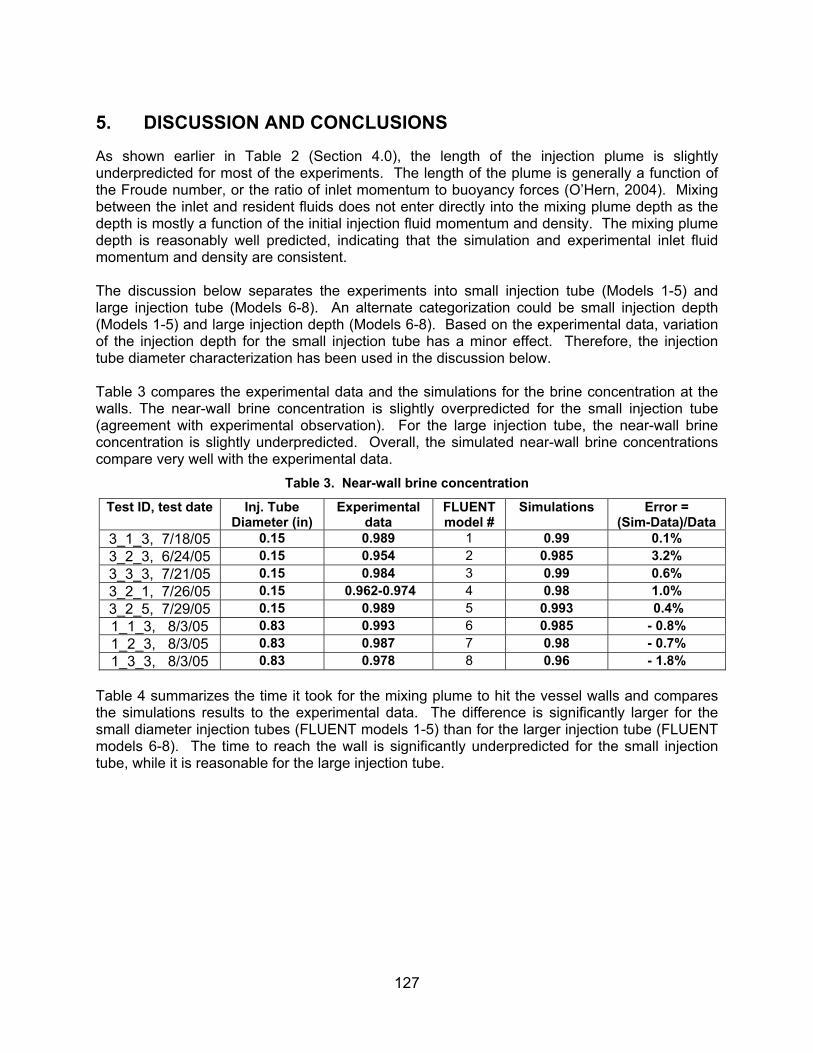
127
5. DISCUSSION AND CONCLUSIONS
As shown earlier in Table 2 (Section 4.0), the length of the injection plume is slightly underpredicted for most of the experiments. The length of the plume is generally a function of the Froude number, or the ratio of inlet momentum to buoyancy forces (O’Hern, 2004). Mixing between the inlet and resident fluids does not enter directly into the mixing plume depth as the depth is mostly a function of the initial injection fluid momentum and density. The mixing plume depth is reasonably well predicted, indicating that the simulation and experimental inlet fluid momentum and density are consistent. The discussion below separates the experiments into small injection tube (Models 1-5) and large injection tube (Models 6-8). An alternate categorization could be small injection depth (Models 1-5) and large injection depth (Models 6-8). Based on the experimental data, variation of the injection depth for the small injection tube has a minor effect. Therefore, the injection tube diameter characterization has been used in the discussion below. Table 3 compares the experimental data and the simulations for the brine concentration at the walls. The near-wall brine concentration is slightly overpredicted for the small injection tube (agreement with experimental observation). For the large injection tube, the near-wall brine concentration is slightly underpredicted. Overall, the simulated near-wall brine concentrations compare very well with the experimental data.
Table 3. Near-wall brine concentration
Test ID, test date Inj. Tube Diameter (in)
Experimental data
FLUENT model #
Simulations
Error = (Sim-Data)/Data
3_1_3, 7/18/05 0.15 0.989 1 0.99 0.1% 3_2_3, 6/24/05 0.15 0.954 2 0.985 3.2% 3_3_3, 7/21/05 0.15 0.984 3 0.99 0.6% 3_2_1, 7/26/05 0.15 0.962-0.974 4 0.98 1.0% 3_2_5, 7/29/05 0.15 0.989 5 0.993 0.4% 1_1_3, 8/3/05 0.83 0.993 6 0.985 - 0.8% 1_2_3, 8/3/05 0.83 0.987 7 0.98 - 0.7% 1_3_3, 8/3/05 0.83 0.978 8 0.96 - 1.8%
Table 4 summarizes the time it took for the mixing plume to hit the vessel walls and compares the simulations results to the experimental data. The difference is significantly larger for the small diameter injection tubes (FLUENT models 1-5) than for the larger injection tube (FLUENT models 6-8). The time to reach the wall is significantly underpredicted for the small injection tube, while it is reasonable for the large injection tube.
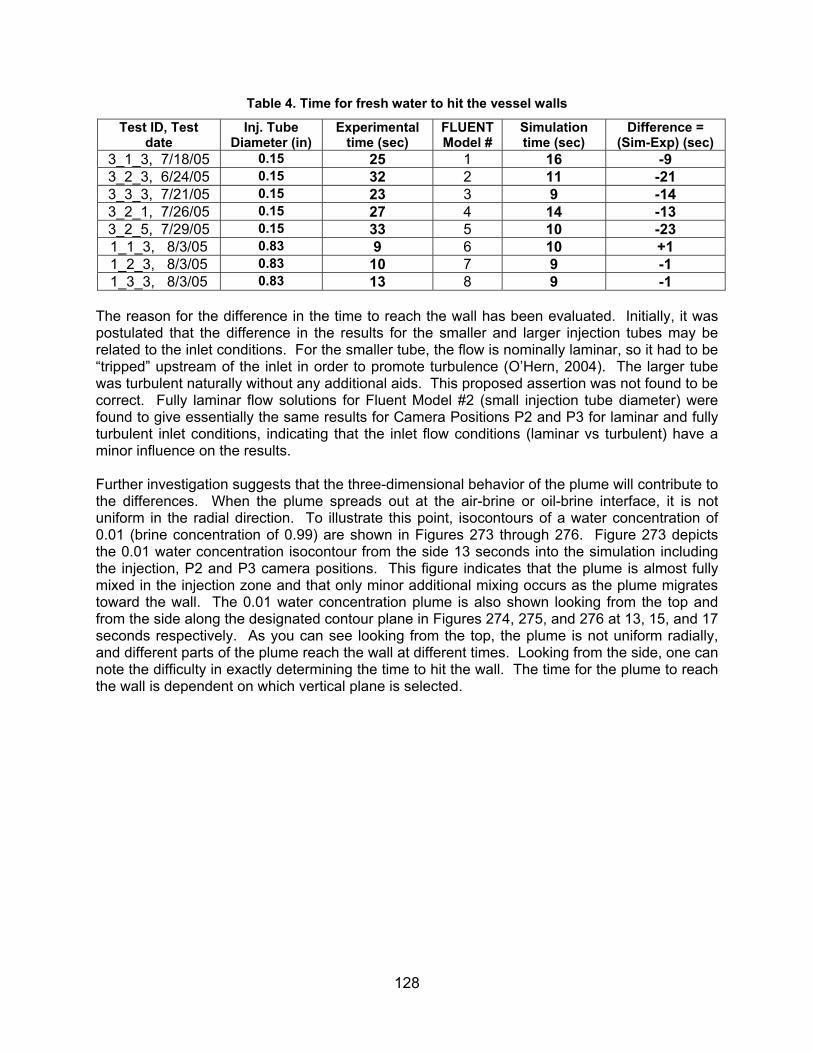
128
Table 4. Time for fresh water to hit the vessel walls
Test ID, Test date
Inj. Tube Diameter (in)
Experimental time (sec)
FLUENT Model #
Simulation time (sec)
Difference = (Sim-Exp) (sec)
3_1_3, 7/18/05 0.15 25 1 16 -9 3_2_3, 6/24/05 0.15 32 2 11 -21 3_3_3, 7/21/05 0.15 23 3 9 -14 3_2_1, 7/26/05 0.15 27 4 14 -13 3_2_5, 7/29/05 0.15 33 5 10 -23 1_1_3, 8/3/05 0.83 9 6 10 +1 1_2_3, 8/3/05 0.83 10 7 9 -1 1_3_3, 8/3/05 0.83 13 8 9 -1
The reason for the difference in the time to reach the wall has been evaluated. Initially, it was postulated that the difference in the results for the smaller and larger injection tubes may be related to the inlet conditions. For the smaller tube, the flow is nominally laminar, so it had to be “tripped” upstream of the inlet in order to promote turbulence (O’Hern, 2004). The larger tube was turbulent naturally without any additional aids. This proposed assertion was not found to be correct. Fully laminar flow solutions for Fluent Model #2 (small injection tube diameter) were found to give essentially the same results for Camera Positions P2 and P3 for laminar and fully turbulent inlet conditions, indicating that the inlet flow conditions (laminar vs turbulent) have a minor influence on the results. Further investigation suggests that the three-dimensional behavior of the plume will contribute to the differences. When the plume spreads out at the air-brine or oil-brine interface, it is not uniform in the radial direction. To illustrate this point, isocontours of a water concentration of 0.01 (brine concentration of 0.99) are shown in Figures 273 through 276. Figure 273 depicts the 0.01 water concentration isocontour from the side 13 seconds into the simulation including the injection, P2 and P3 camera positions. This figure indicates that the plume is almost fully mixed in the injection zone and that only minor additional mixing occurs as the plume migrates toward the wall. The 0.01 water concentration plume is also shown looking from the top and from the side along the designated contour plane in Figures 274, 275, and 276 at 13, 15, and 17 seconds respectively. As you can see looking from the top, the plume is not uniform radially, and different parts of the plume reach the wall at different times. Looking from the side, one can note the difficulty in exactly determining the time to hit the wall. The time for the plume to reach the wall is dependent on which vertical plane is selected.
129
Figure 273. P2, P3 and isocontours of 0.01 water concentration at t=13 sec
130
Figure 274. Isocontours of 0.01 water concentration at t=13 sec
top view
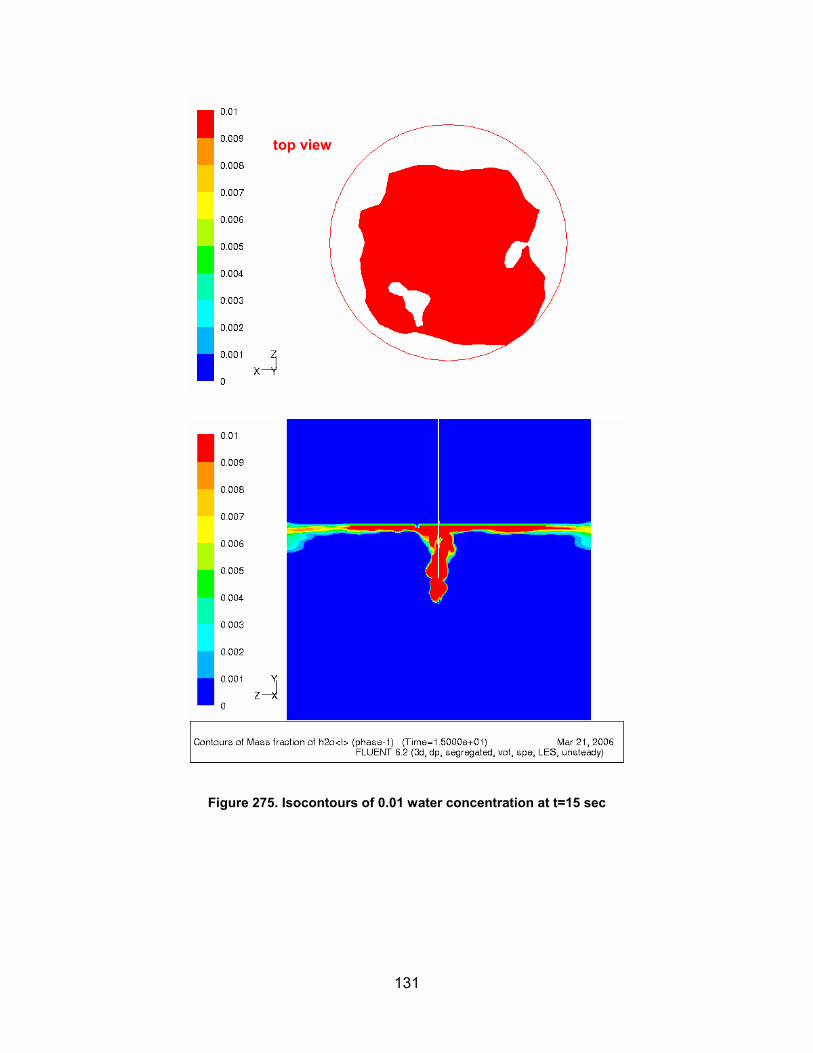
131
Figure 275. Isocontours of 0.01 water concentration at t=15 sec
top view
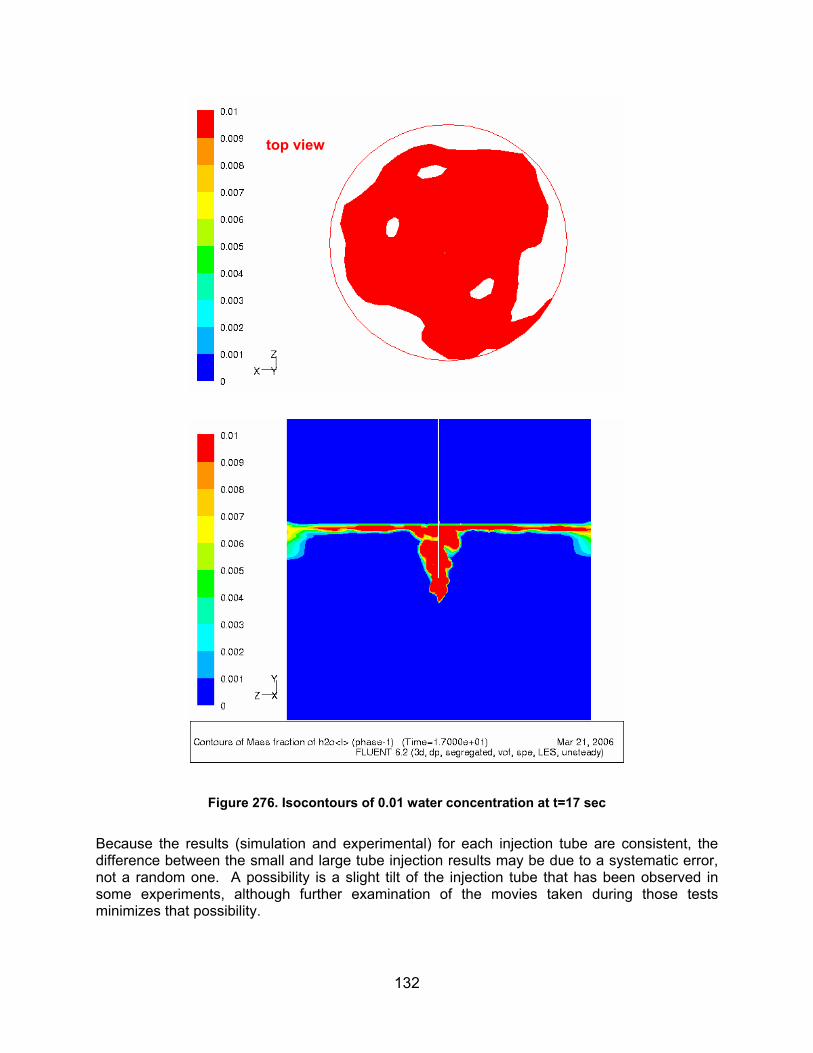
132
Figure 276. Isocontours of 0.01 water concentration at t=17 sec
Because the results (simulation and experimental) for each injection tube are consistent, the difference between the small and large tube injection results may be due to a systematic error, not a random one. A possibility is a slight tilt of the injection tube that has been observed in some experiments, although further examination of the movies taken during those tests minimizes that possibility.
top view
133
The importance of the time to hit the wall is another issue. If the injection dynamics, mixing and plume concentration when it reaches the wall are well predicted, the time to hit the wall is probably not important. In full cavern scenarios, transient plume development is a negligible fraction of the total water injection time, so any temporal difference is insignificant. The concentration of the plume when it hits the wall is much more important because the concentration determines the leaching profile below the oil-brine interface. There are also differences in the plume depth for the small injection tube experiments as it spreads out along the top surface as shown in the P2 and P3 data-model comparisons. The predicted plume depth is less than the measured depth by about a factor of 2. The Smagorinski constant and the turbulent Schmidt number were varied to determine if their values had an influence on the plume depth. No dependence was found for these simulation parameters. The simulation results are in reasonable agreement for the small injection tube except for the interface mixing zone depth and the time to reach the wall. The simulation results are in good agreement for all the large injection tube experiments. There is something different between the small and large injection tube results, possibly a change in flow or mixing regime that is not captured in the current models in FLUENT. These differences are probably not that significant in application to actual SPR caverns because of the larger tube diameter. Additional simulations should be performed using the new version of FLUENT (6.3), which is expected to be released in a few months. This new version is expected to have a number of new features especially relevant to this experiment, such as a dynamic Smagorinski model (dynamic value, not a constant value, of the coefficient), and dynamic calculation of the turbulent Schmidt number. Additional simulations also should be performed using a Reynolds-Averaged Navier Stokes (RANS) k-ε turbulence model instead of the LES turbulence model employed in the present simulations. The use of a RANS k-ε turbulence model would allow for the use of two-dimensional simulations such as employed in the preliminary VOC transport simulations, instead of three-dimensional simulations, which are necessary if the LES turbulence model is used. In conclusion, the FLUENT simulation results predict the plume mixing accurately, especially the water concentration when the mixing plume reaches the wall. This parameter value is the most significant feature of the mixing process because it will determine the amount of enhanced leaching at the oil-brine interface.

134
135
6. REFERENCES
Ballard, S. and B.L. Ehgartner. Caveman Version 3.0: A Software System for SPR Cavern
Pressure Analysis. SAND2000-1751, Sandia National Laboratories, Albuquerque, New Mexico, July, 2000.
DOE. Design Criteria- Level III. US Department of Energy, Strategic Petroleum Reserve, New
Orleans, LA, 2001. O’Hern, T.J., S.W. Webb, and B.L. Ehgartner, 2004, “Experimental Plan for Leaching Plume
Studies in Lab-Scale Vessel,” Sandia National Laboratories memo to Distribution, November 12, 2004.
O’Hern, T.J., J.B. Oelfke, and S.W. Webb, 2005a, “Preliminary Results of and Analysis Plan for
Leaching Plume Studies in Lab-Scale Vessel,” Sandia National Laboratories memo to Distribution, February 28, 2005.
O’Hern, T.J., and J.B. Oelfke, 2005b, “Leaching Plume Studies in Lab-Scale Vessel –
Experiments Completed,” Sandia National Laboratories memo to Distribution, August 4, 2005.
O’Hern, T.J., 2005c, “Leaching Plume Studies in Lab-Scale Vessel – Experimental Analysis
Completed,” Sandia National Laboratories memo to Distribution, October 24, 2005.

136
137
Distribution Internal 1 MS0748 I. Khalil, 6762 5 MS0735 S.W. Webb, 6313 1 MS0706 D.J. Borns, 6312 1 MS0706 B.L. Ehgartner, 6312 1 MS0706 D.L. Lord, 6312 1 MS0706 S.T. Wallace, 6312 1 MS0834 T.J. O’Hern, 1512 1 MS0748 R.O. Gauntt, 6762 2 MS9018 Central Technical Files, 8944 2 MS0899 Technical Library, 04535 External Electronic copy only to Wayne Elias at [email protected] for distribution to DOE and DM

138