numerical reasoning practice test 2 - mathcentre.ac.uk · numerical reasoning practice test 2 many...
TRANSCRIPT
Numerical Reasoning
Practice Test 2 Many employers use psychometric testing in their recruitment process, with numerical
reasoning tests often included.
The questions used in the following test are based on those available on the
www.assessmentday.co.uk and www.graduatesfirst.com websites.
This test comprises 23 questions and you have 25 minutes to complete it.
The main numerical skills required for the test typically relate to percentages, ratios and
reading/interpreting charts and graphs. Often the same data is used for several questions, so it
is advisable get a clear grasp of the context before starting your calculations.
Calculators are allowed, so make sure that you are familiar with yours and are confident in using
it.
© David Faulkner, University of Hertfordshire Reviewer: Dr Kinga Zaczek, Royal Holloway, University of London
www.mathcentre.ac.uk All mccp resources are released under a
Creative Commons licence
www.sigma-network.ac.uk Numerical Reasoning Test 2
1
www.sigma-network.ac.uk Numerical Reasoning Test 2
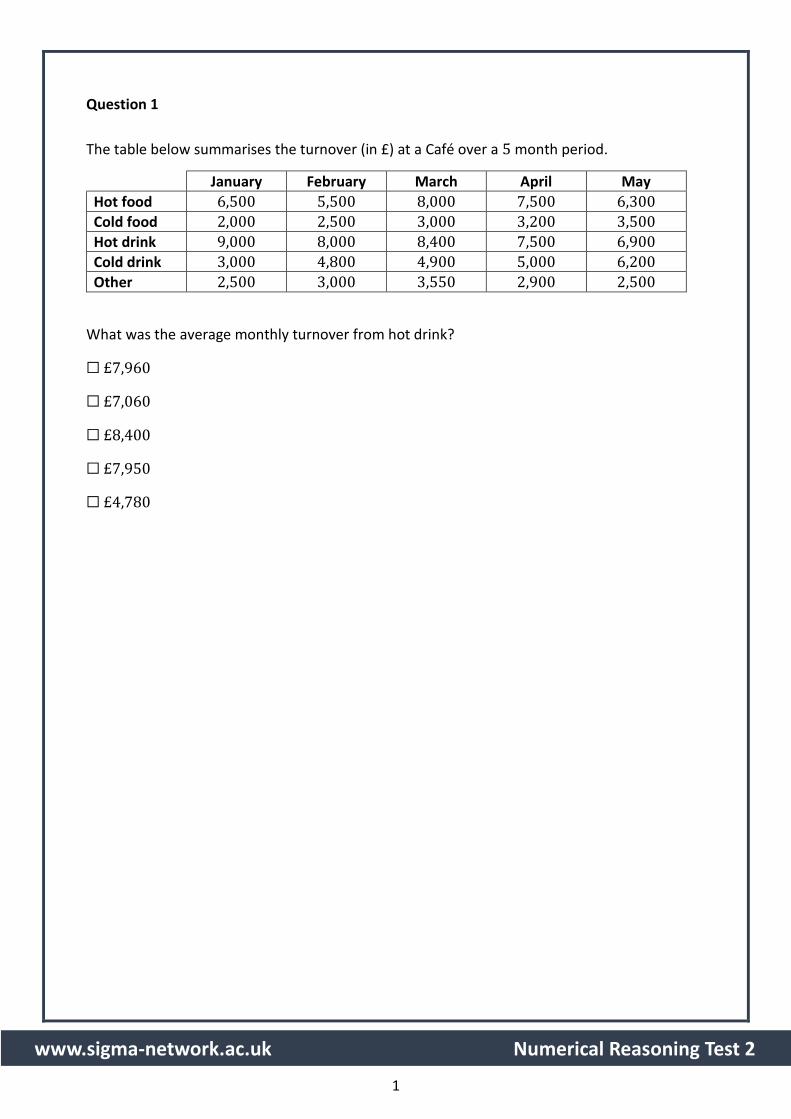
Question 1
The table below summarises the turnover (in £) at a Café over a 5 month period.
January February March April May
Hot food 6,500 5,500 8,000 7,500 6,300
Cold food 2,000 2,500 3,000 3,200 3,500
Hot drink 9,000 8,000 8,400 7,500 6,900
Cold drink 3,000 4,800 4,900 5,000 6,200
Other 2,500 3,000 3,550 2,900 2,500
What was the average monthly turnover from hot drink?
☐ £7,960
☐ £7,060
☐ £8,400
☐ £7,950
☐ £4,780
2
www.sigma-network.ac.uk Numerical Reasoning Test 2
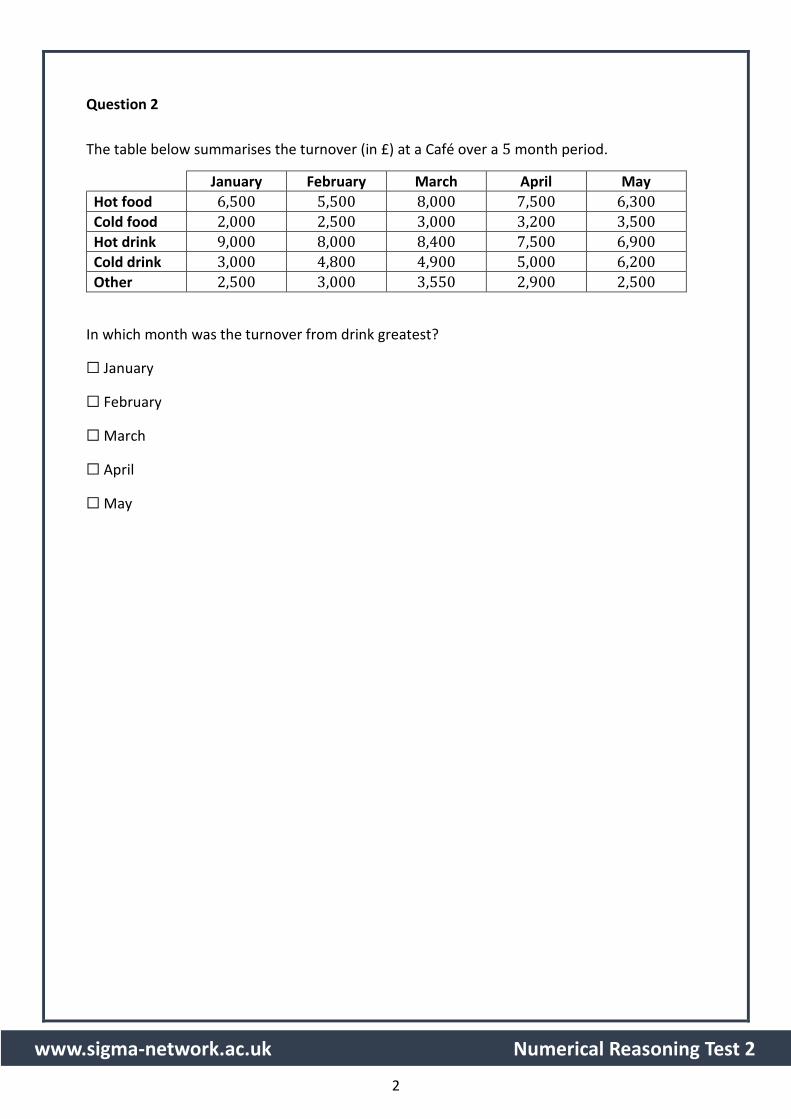
Question 2
The table below summarises the turnover (in £) at a Café over a 5 month period.
January February March April May
Hot food 6,500 5,500 8,000 7,500 6,300
Cold food 2,000 2,500 3,000 3,200 3,500
Hot drink 9,000 8,000 8,400 7,500 6,900
Cold drink 3,000 4,800 4,900 5,000 6,200
Other 2,500 3,000 3,550 2,900 2,500
In which month was the turnover from drink greatest?
☐ January
☐ February
☐ March
☐ April
☐ May
3
www.sigma-network.ac.uk Numerical Reasoning Test 2
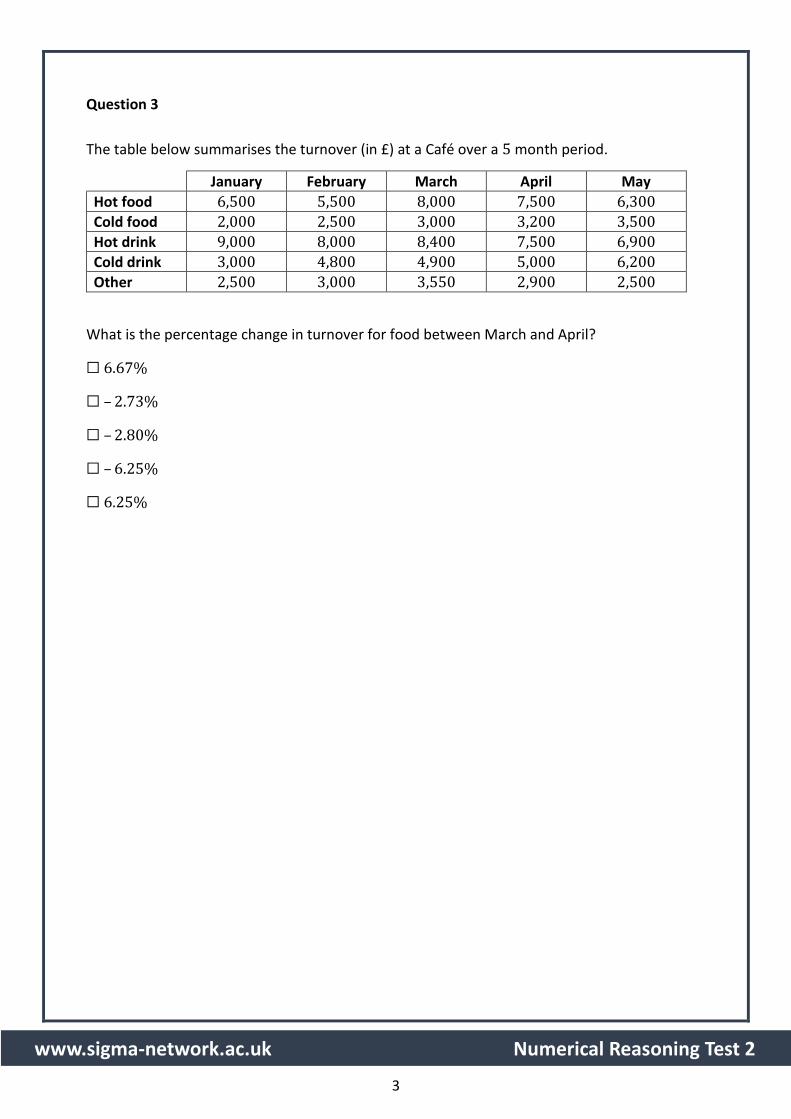
Question 3
The table below summarises the turnover (in £) at a Café over a 5 month period.
January February March April May
Hot food 6,500 5,500 8,000 7,500 6,300
Cold food 2,000 2,500 3,000 3,200 3,500
Hot drink 9,000 8,000 8,400 7,500 6,900
Cold drink 3,000 4,800 4,900 5,000 6,200
Other 2,500 3,000 3,550 2,900 2,500
What is the percentage change in turnover for food between March and April?
☐ 6.67%
☐ – 2.73%
☐ – 2.80%
☐ – 6.25%
☐ 6.25%
4
www.sigma-network.ac.uk Numerical Reasoning Test 2
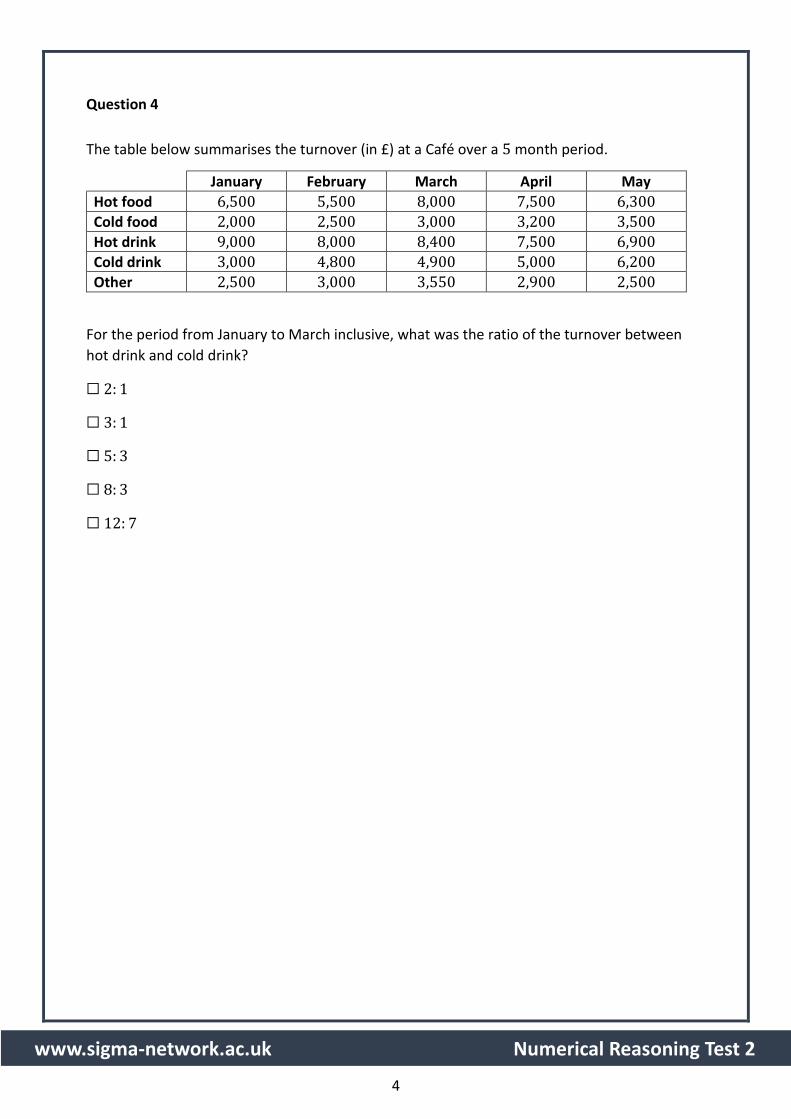
Question 4
The table below summarises the turnover (in £) at a Café over a 5 month period.
January February March April May
Hot food 6,500 5,500 8,000 7,500 6,300
Cold food 2,000 2,500 3,000 3,200 3,500
Hot drink 9,000 8,000 8,400 7,500 6,900
Cold drink 3,000 4,800 4,900 5,000 6,200
Other 2,500 3,000 3,550 2,900 2,500
For the period from January to March inclusive, what was the ratio of the turnover between
hot drink and cold drink?
☐ 2: 1
☐ 3: 1
☐ 5: 3
☐ 8: 3
☐ 12: 7
5
www.sigma-network.ac.uk Numerical Reasoning Test 2
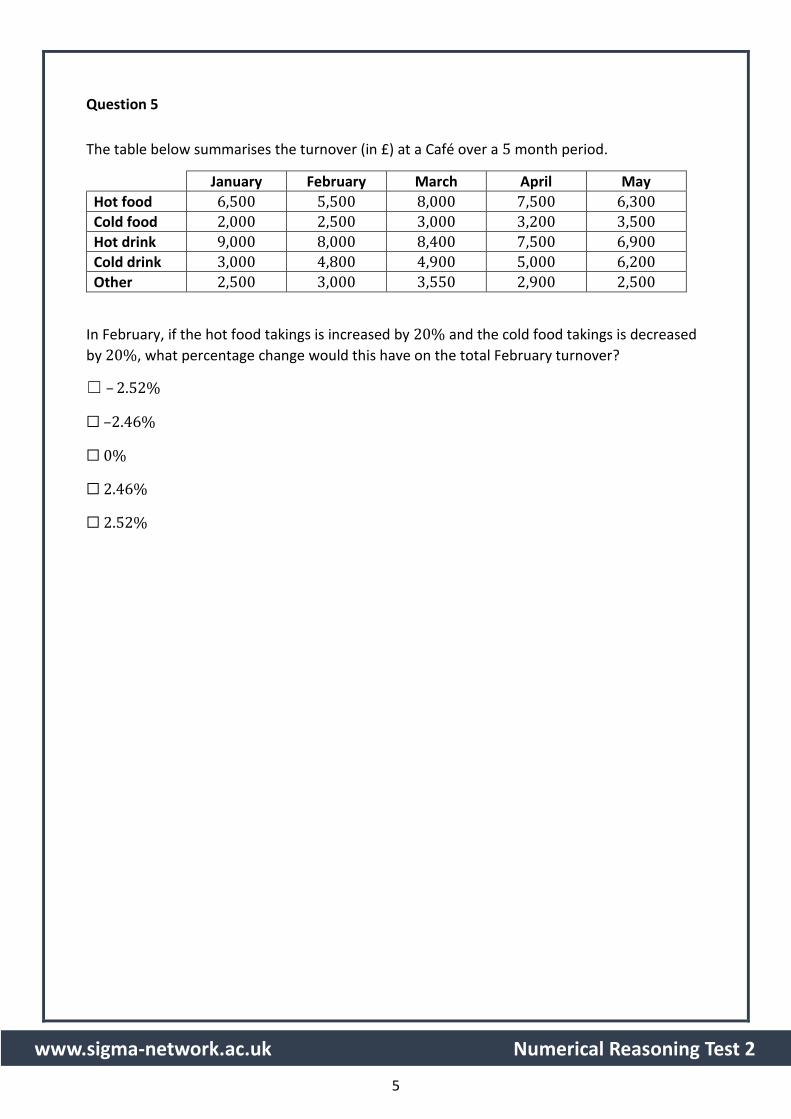
Question 5
The table below summarises the turnover (in £) at a Café over a 5 month period.
January February March April May
Hot food 6,500 5,500 8,000 7,500 6,300
Cold food 2,000 2,500 3,000 3,200 3,500
Hot drink 9,000 8,000 8,400 7,500 6,900
Cold drink 3,000 4,800 4,900 5,000 6,200
Other 2,500 3,000 3,550 2,900 2,500
In February, if the hot food takings is increased by 20% and the cold food takings is decreased
by 20%, what percentage change would this have on the total February turnover?
☐ – 2.52%
☐ –2.46%
☐ 0%
☐ 2.46%
☐ 2.52%
6
www.sigma-network.ac.uk Numerical Reasoning Test 2
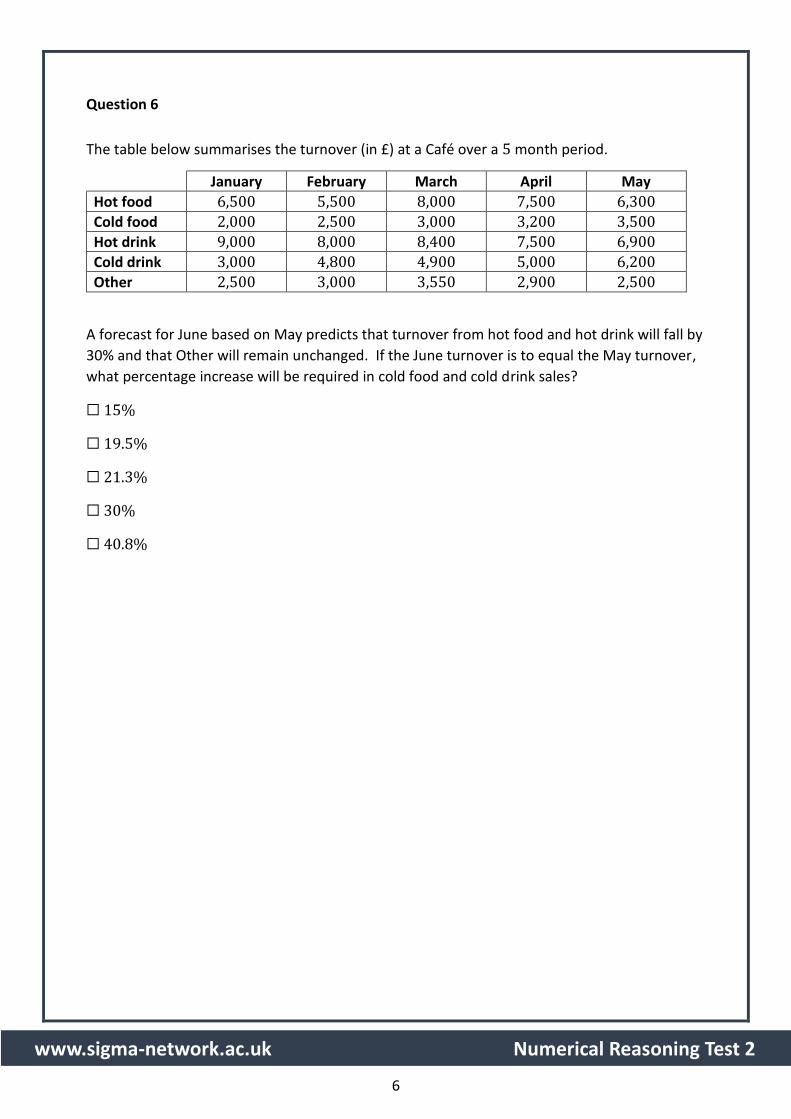
Question 6
The table below summarises the turnover (in £) at a Café over a 5 month period.
January February March April May
Hot food 6,500 5,500 8,000 7,500 6,300
Cold food 2,000 2,500 3,000 3,200 3,500
Hot drink 9,000 8,000 8,400 7,500 6,900
Cold drink 3,000 4,800 4,900 5,000 6,200
Other 2,500 3,000 3,550 2,900 2,500
A forecast for June based on May predicts that turnover from hot food and hot drink will fall by
30% and that Other will remain unchanged. If the June turnover is to equal the May turnover,
what percentage increase will be required in cold food and cold drink sales?
☐ 15%
☐ 19.5%
☐ 21.3%
☐ 30%
☐ 40.8%
7
www.sigma-network.ac.uk Numerical Reasoning Test 2
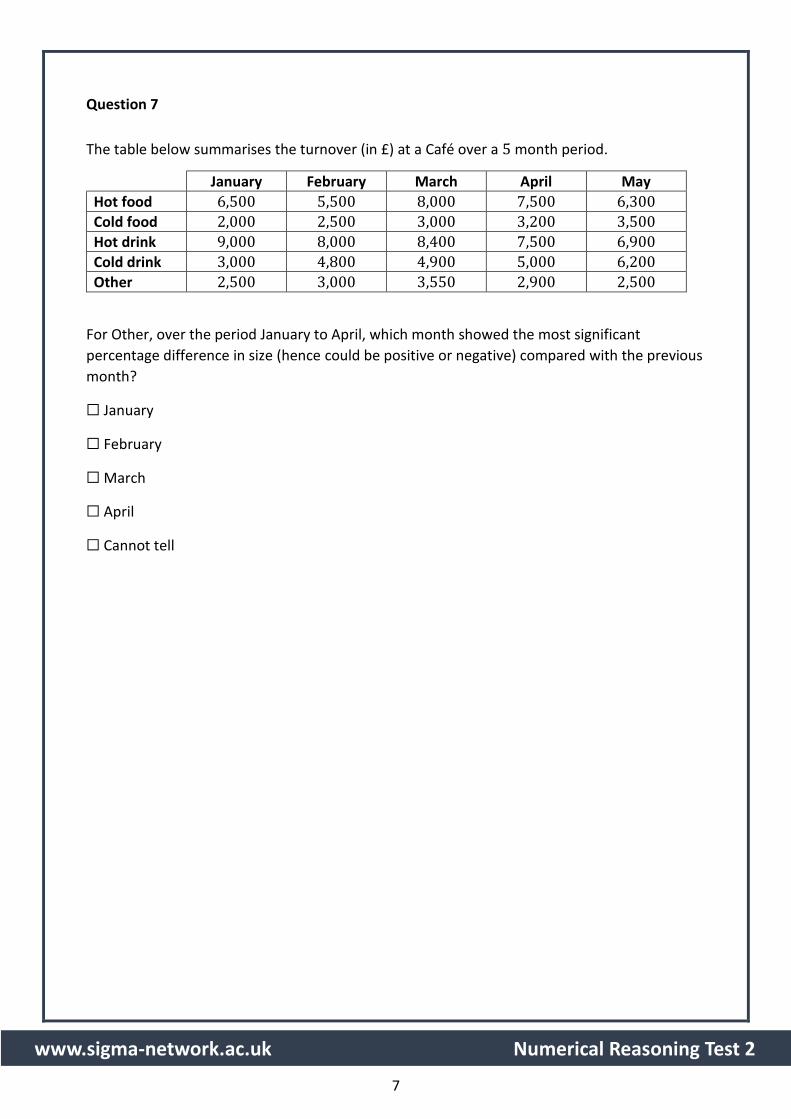
Question 7
The table below summarises the turnover (in £) at a Café over a 5 month period.
January February March April May
Hot food 6,500 5,500 8,000 7,500 6,300
Cold food 2,000 2,500 3,000 3,200 3,500
Hot drink 9,000 8,000 8,400 7,500 6,900
Cold drink 3,000 4,800 4,900 5,000 6,200
Other 2,500 3,000 3,550 2,900 2,500
For Other, over the period January to April, which month showed the most significant
percentage difference in size (hence could be positive or negative) compared with the previous
month?
☐ January
☐ February
☐ March
☐ April
☐ Cannot tell
8
www.sigma-network.ac.uk Numerical Reasoning Test 2
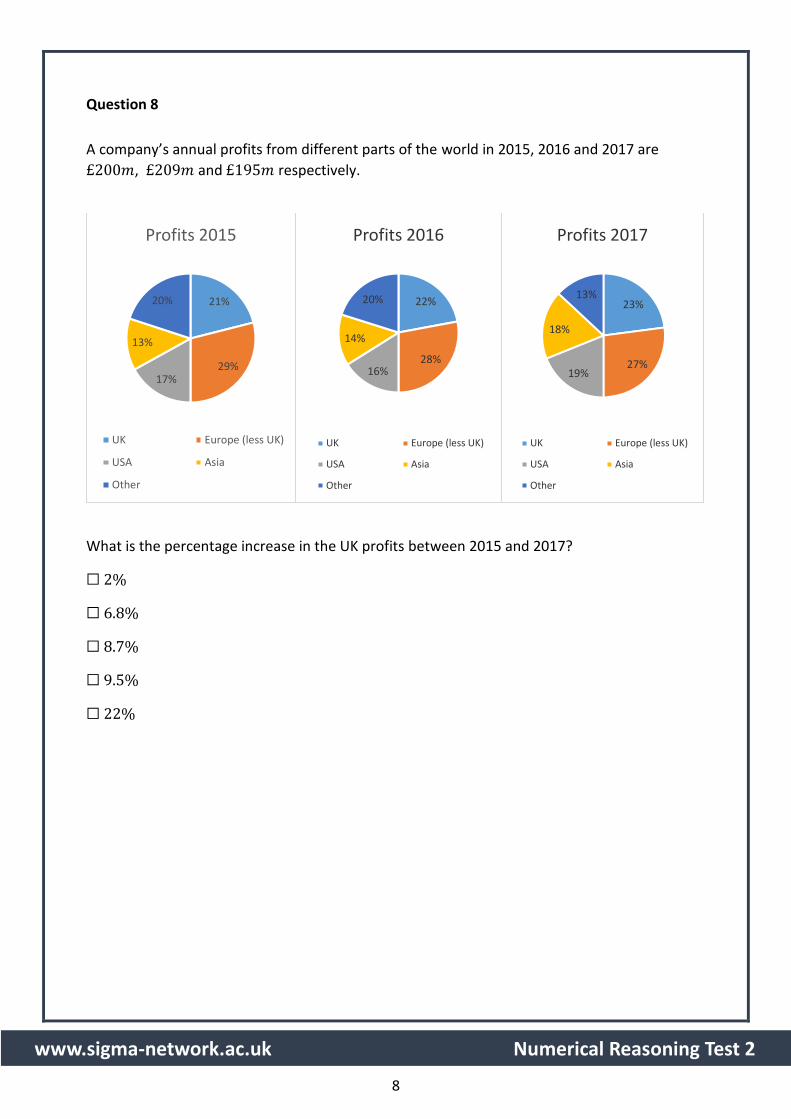
Question 8
A company’s annual profits from different parts of the world in 2015, 2016 and 2017 are
£200𝑚, £209𝑚 and £195𝑚 respectively.
What is the percentage increase in the UK profits between 2015 and 2017?
☐ 2%
☐ 6.8%
☐ 8.7%
☐ 9.5%
☐ 22%
21%
29%17%
13%
20%
Profits 2015
UK Europe (less UK)
USA Asia
Other
22%
28%16%
14%
20%
Profits 2016
UK Europe (less UK)
USA Asia
Other
23%
27%19%
18%
13%
Profits 2017
UK Europe (less UK)
USA Asia
Other
9
www.sigma-network.ac.uk Numerical Reasoning Test 2
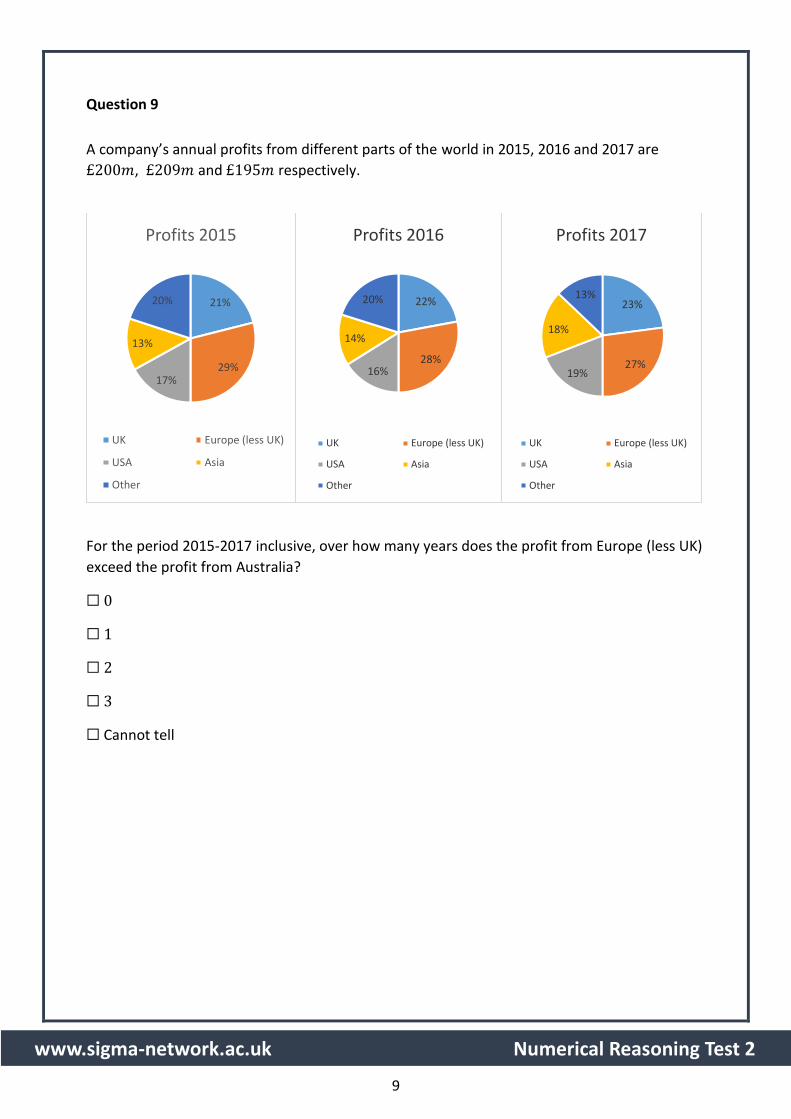
Question 9
A company’s annual profits from different parts of the world in 2015, 2016 and 2017 are
£200𝑚, £209𝑚 and £195𝑚 respectively.
For the period 2015-2017 inclusive, over how many years does the profit from Europe (less UK)
exceed the profit from Australia?
☐ 0
☐ 1
☐ 2
☐ 3
☐ Cannot tell
21%
29%17%
13%
20%
Profits 2015
UK Europe (less UK)
USA Asia
Other
22%
28%16%
14%
20%
Profits 2016
UK Europe (less UK)
USA Asia
Other
23%
27%19%
18%
13%
Profits 2017
UK Europe (less UK)
USA Asia
Other
10
www.sigma-network.ac.uk Numerical Reasoning Test 2
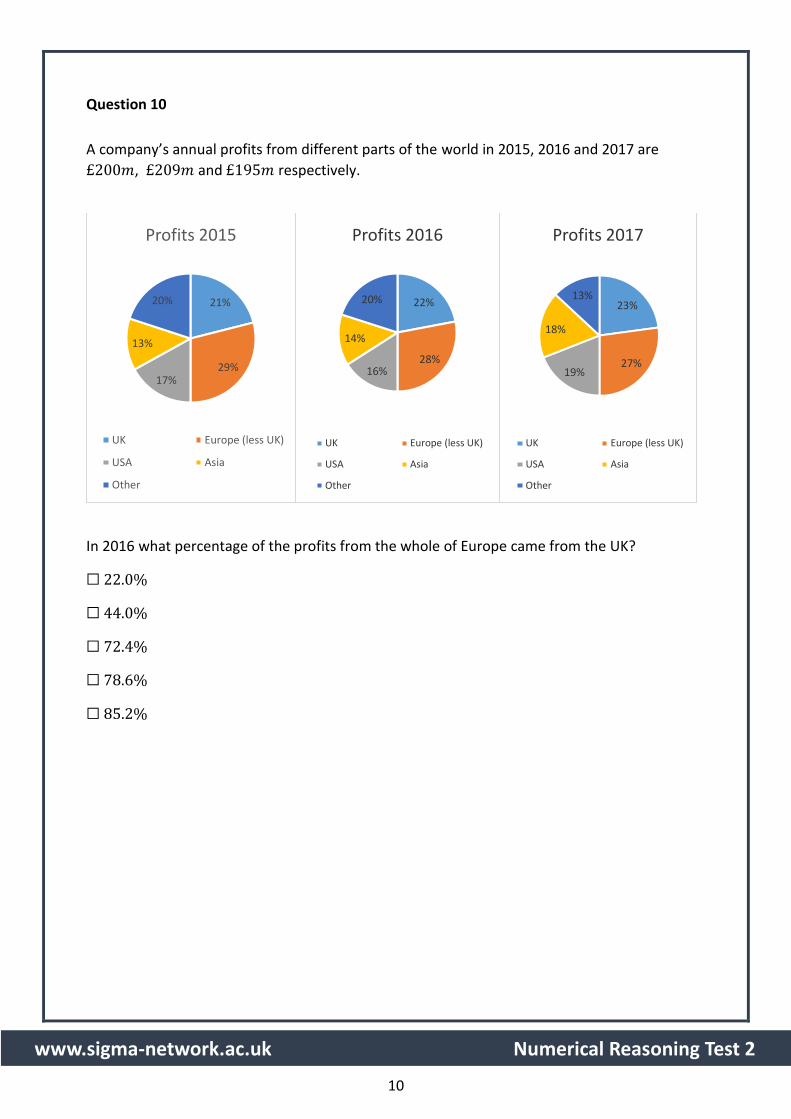
Question 10
A company’s annual profits from different parts of the world in 2015, 2016 and 2017 are
£200𝑚, £209𝑚 and £195𝑚 respectively.
In 2016 what percentage of the profits from the whole of Europe came from the UK?
☐ 22.0%
☐ 44.0%
☐ 72.4%
☐ 78.6%
☐ 85.2%
21%
29%17%
13%
20%
Profits 2015
UK Europe (less UK)
USA Asia
Other
22%
28%16%
14%
20%
Profits 2016
UK Europe (less UK)
USA Asia
Other
23%
27%19%
18%
13%
Profits 2017
UK Europe (less UK)
USA Asia
Other
11
www.sigma-network.ac.uk Numerical Reasoning Test 2
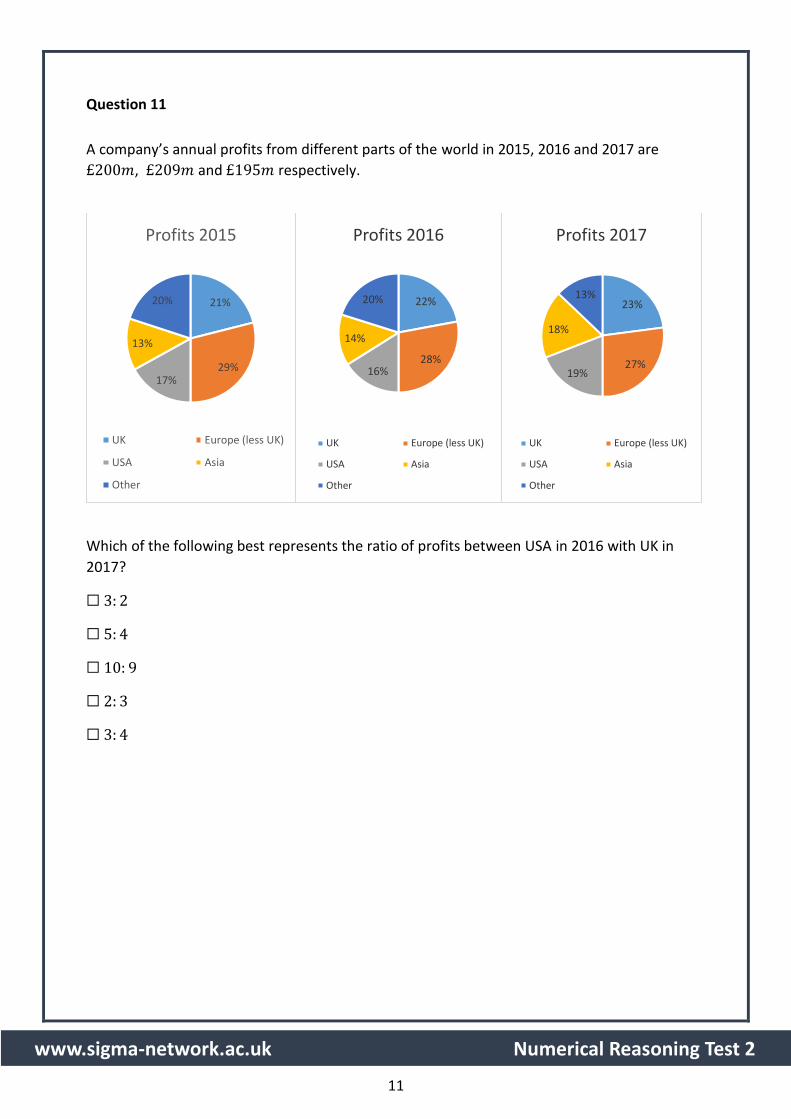
Question 11
A company’s annual profits from different parts of the world in 2015, 2016 and 2017 are
£200𝑚, £209𝑚 and £195𝑚 respectively.
Which of the following best represents the ratio of profits between USA in 2016 with UK in
2017?
☐ 3: 2
☐ 5: 4
☐ 10: 9
☐ 2: 3
☐ 3: 4
21%
29%17%
13%
20%
Profits 2015
UK Europe (less UK)
USA Asia
Other
22%
28%16%
14%
20%
Profits 2016
UK Europe (less UK)
USA Asia
Other
23%
27%19%
18%
13%
Profits 2017
UK Europe (less UK)
USA Asia
Other
12
www.sigma-network.ac.uk Numerical Reasoning Test 2
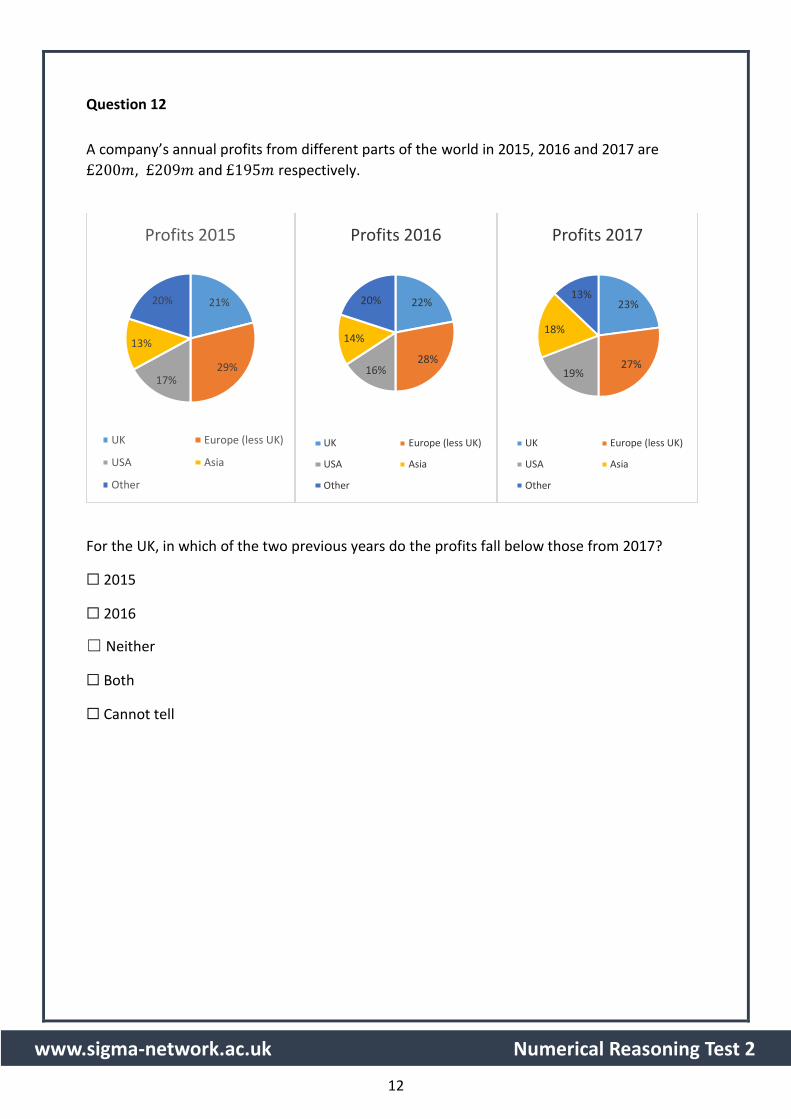
Question 12
A company’s annual profits from different parts of the world in 2015, 2016 and 2017 are
£200𝑚, £209𝑚 and £195𝑚 respectively.
For the UK, in which of the two previous years do the profits fall below those from 2017?
☐ 2015
☐ 2016
☐ Neither
☐ Both
☐ Cannot tell
21%
29%17%
13%
20%
Profits 2015
UK Europe (less UK)
USA Asia
Other
22%
28%16%
14%
20%
Profits 2016
UK Europe (less UK)
USA Asia
Other
23%
27%19%
18%
13%
Profits 2017
UK Europe (less UK)
USA Asia
Other
13
www.sigma-network.ac.uk Numerical Reasoning Test 2
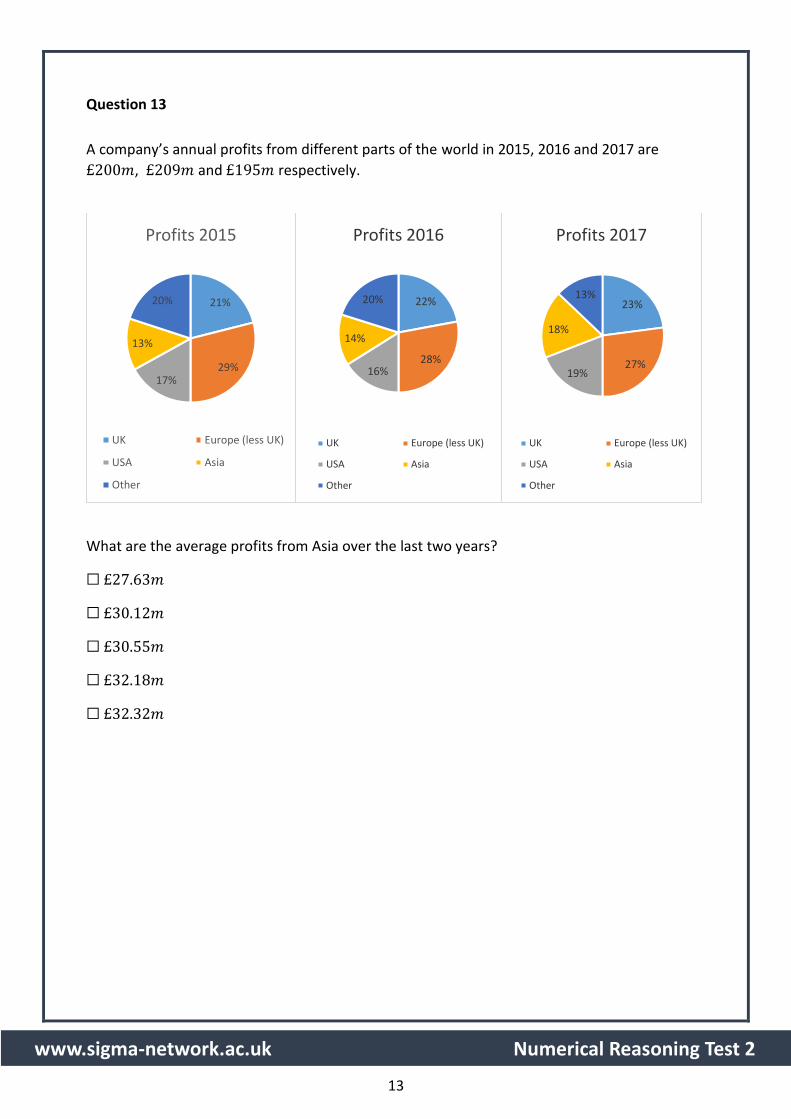
Question 13
A company’s annual profits from different parts of the world in 2015, 2016 and 2017 are
£200𝑚, £209𝑚 and £195𝑚 respectively.
What are the average profits from Asia over the last two years?
☐ £27.63𝑚
☐ £30.12𝑚
☐ £30.55𝑚
☐ £32.18𝑚
☐ £32.32𝑚
21%
29%17%
13%
20%
Profits 2015
UK Europe (less UK)
USA Asia
Other
22%
28%16%
14%
20%
Profits 2016
UK Europe (less UK)
USA Asia
Other
23%
27%19%
18%
13%
Profits 2017
UK Europe (less UK)
USA Asia
Other

14
www.sigma-network.ac.uk Numerical Reasoning Test 2
Question 14
The table below summarises the number of visitors to a museum over a 5 month period.
Adult (at £𝟏𝟎)
Junior (at £𝟕)
Concession (at £𝟒)
Free (at £𝟎)
Total
May 600 400 200 100 1,300
June 700 250 300 100 1,350
July 900 800 350 150 2,200
August 950 900 450 200 2,500
September 600 300 250 100 1,250
What percentage of the fee paying visitors in August are Juniors?
☐ 30.0%
☐ 33.3%
☐ 35.2%
☐ 36.0%
☐ 39.1%
15
www.sigma-network.ac.uk Numerical Reasoning Test 2
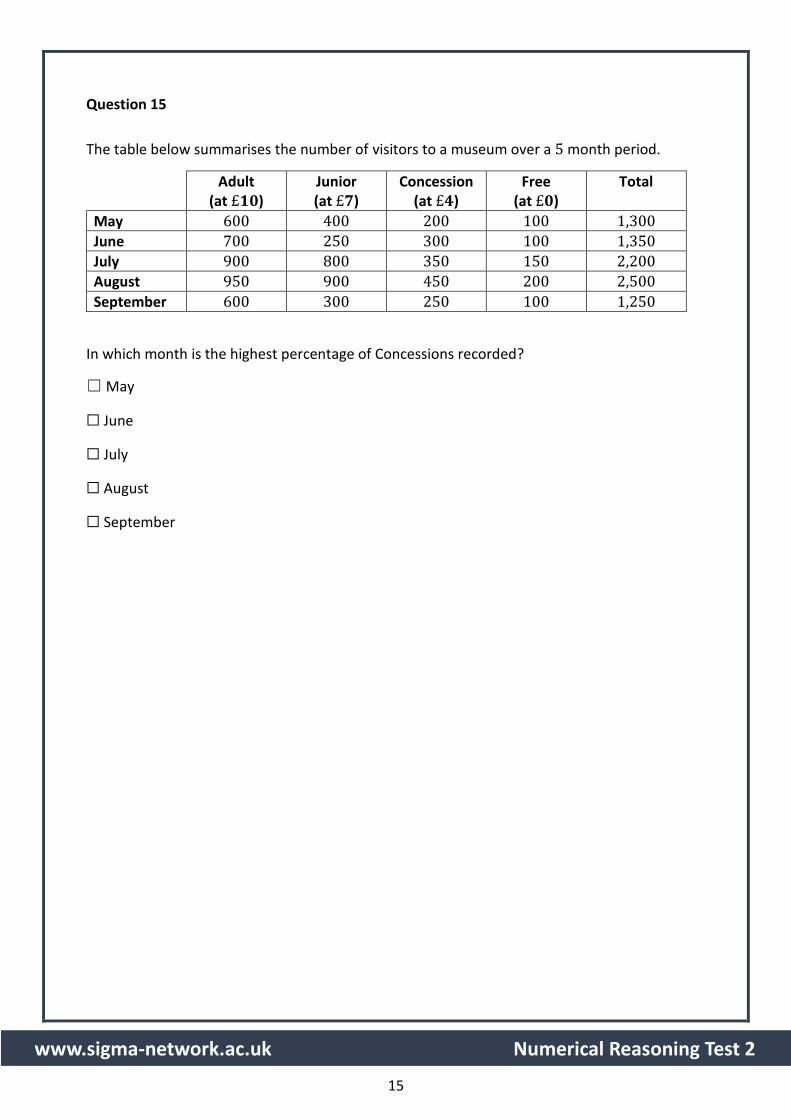
Question 15
The table below summarises the number of visitors to a museum over a 5 month period.
Adult (at £𝟏𝟎)
Junior (at £𝟕)
Concession (at £𝟒)
Free (at £𝟎)
Total
May 600 400 200 100 1,300
June 700 250 300 100 1,350
July 900 800 350 150 2,200
August 950 900 450 200 2,500
September 600 300 250 100 1,250
In which month is the highest percentage of Concessions recorded?
☐ May
☐ June
☐ July
☐ August
☐ September
16
www.sigma-network.ac.uk Numerical Reasoning Test 2
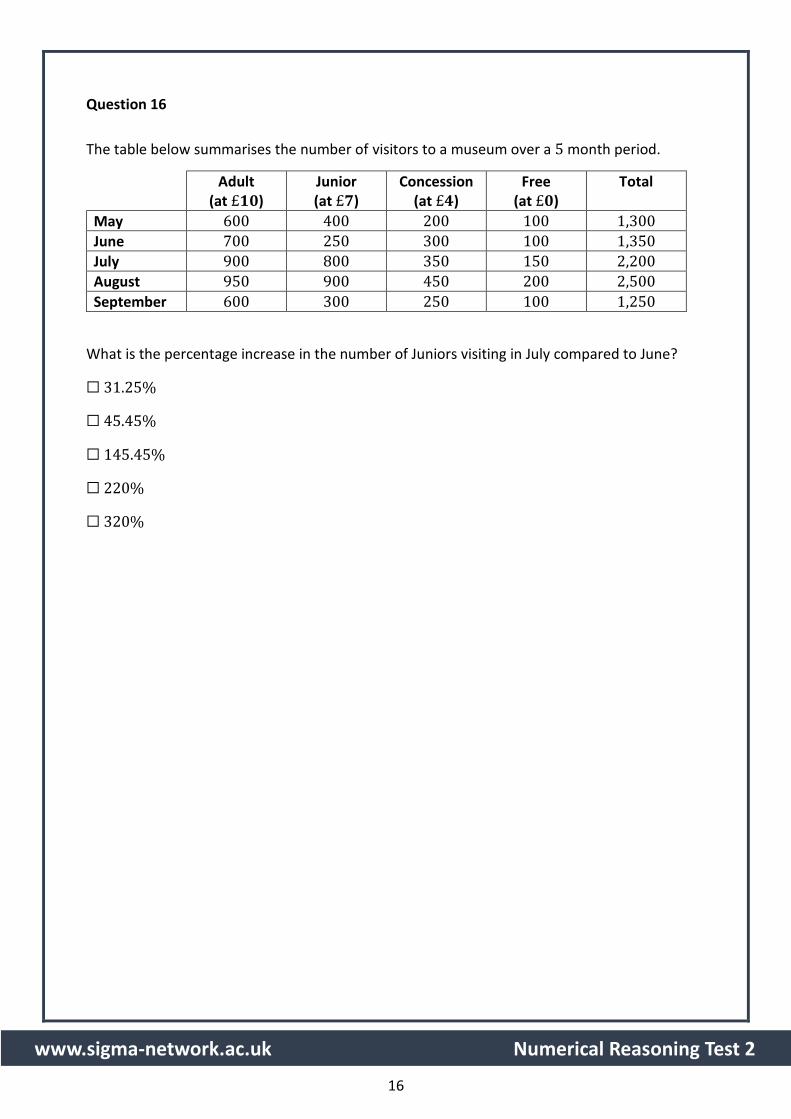
Question 16
The table below summarises the number of visitors to a museum over a 5 month period.
Adult (at £𝟏𝟎)
Junior (at £𝟕)
Concession (at £𝟒)
Free (at £𝟎)
Total
May 600 400 200 100 1,300
June 700 250 300 100 1,350
July 900 800 350 150 2,200
August 950 900 450 200 2,500
September 600 300 250 100 1,250
What is the percentage increase in the number of Juniors visiting in July compared to June?
☐ 31.25%
☐ 45.45%
☐ 145.45%
☐ 220%
☐ 320%
17
www.sigma-network.ac.uk Numerical Reasoning Test 2
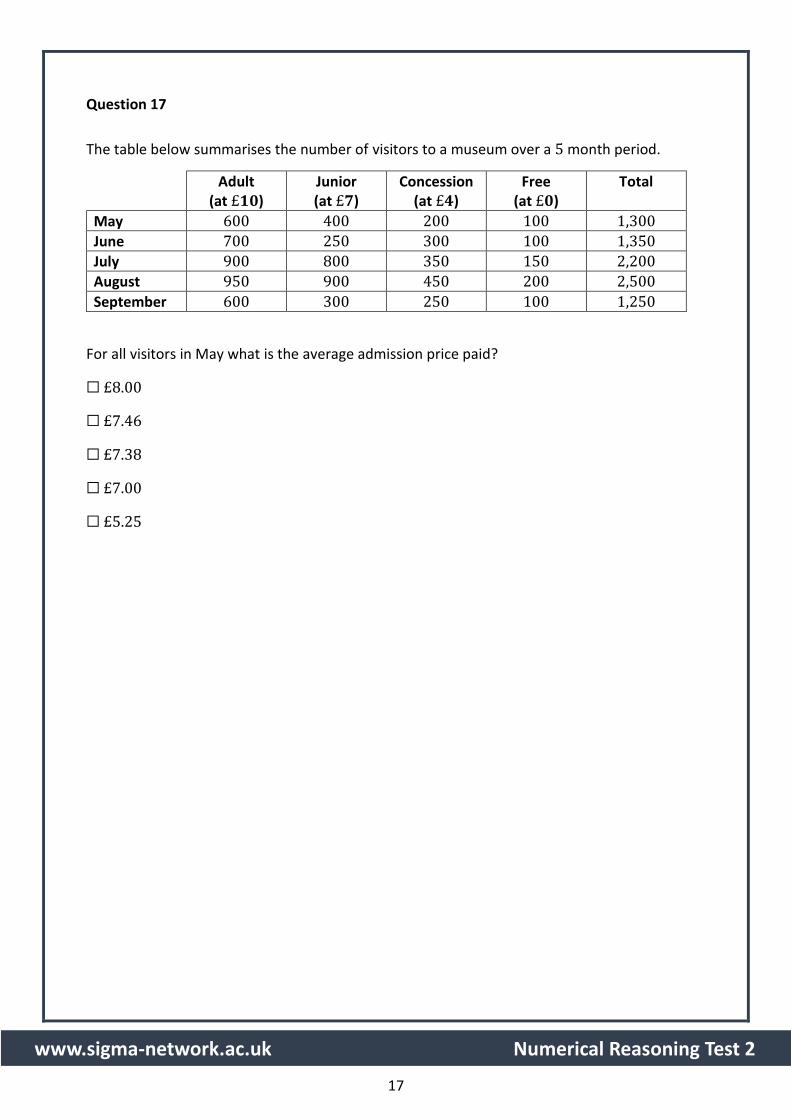
Question 17
The table below summarises the number of visitors to a museum over a 5 month period.
Adult (at £𝟏𝟎)
Junior (at £𝟕)
Concession (at £𝟒)
Free (at £𝟎)
Total
May 600 400 200 100 1,300
June 700 250 300 100 1,350
July 900 800 350 150 2,200
August 950 900 450 200 2,500
September 600 300 250 100 1,250
For all visitors in May what is the average admission price paid?
☐ £8.00
☐ £7.46
☐ £7.38
☐ £7.00
☐ £5.25

18
www.sigma-network.ac.uk Numerical Reasoning Test 2
Question 18
The table below summarises the number of visitors to a museum over a 5 month period.
Adult (at £𝟏𝟎)
Junior (at £𝟕)
Concession (at £𝟒)
Free (at £𝟎)
Total
May 600 400 200 100 1,300
June 700 250 300 100 1,350
July 900 800 350 150 2,200
August 950 900 450 200 2,500
September 600 300 250 100 1,250
In the three months July-September, what is the ratio of the income from Adults to the income
from Juniors?
☐ 7: 4
☐ 10: 7
☐ 11: 7
☐ 7: 11
☐ 4: 11
19
www.sigma-network.ac.uk Numerical Reasoning Test 2
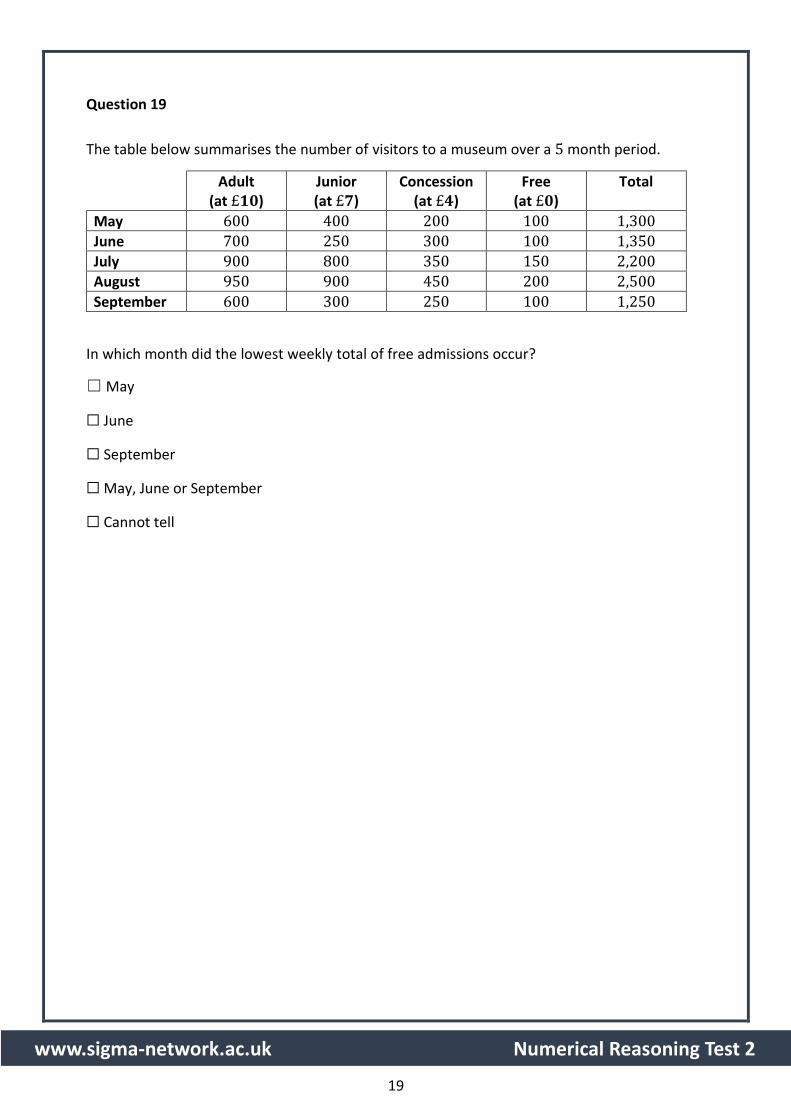
Question 19
The table below summarises the number of visitors to a museum over a 5 month period.
Adult (at £𝟏𝟎)
Junior (at £𝟕)
Concession (at £𝟒)
Free (at £𝟎)
Total
May 600 400 200 100 1,300
June 700 250 300 100 1,350
July 900 800 350 150 2,200
August 950 900 450 200 2,500
September 600 300 250 100 1,250
In which month did the lowest weekly total of free admissions occur?
☐ May
☐ June
☐ September
☐ May, June or September
☐ Cannot tell
20
www.sigma-network.ac.uk Numerical Reasoning Test 2
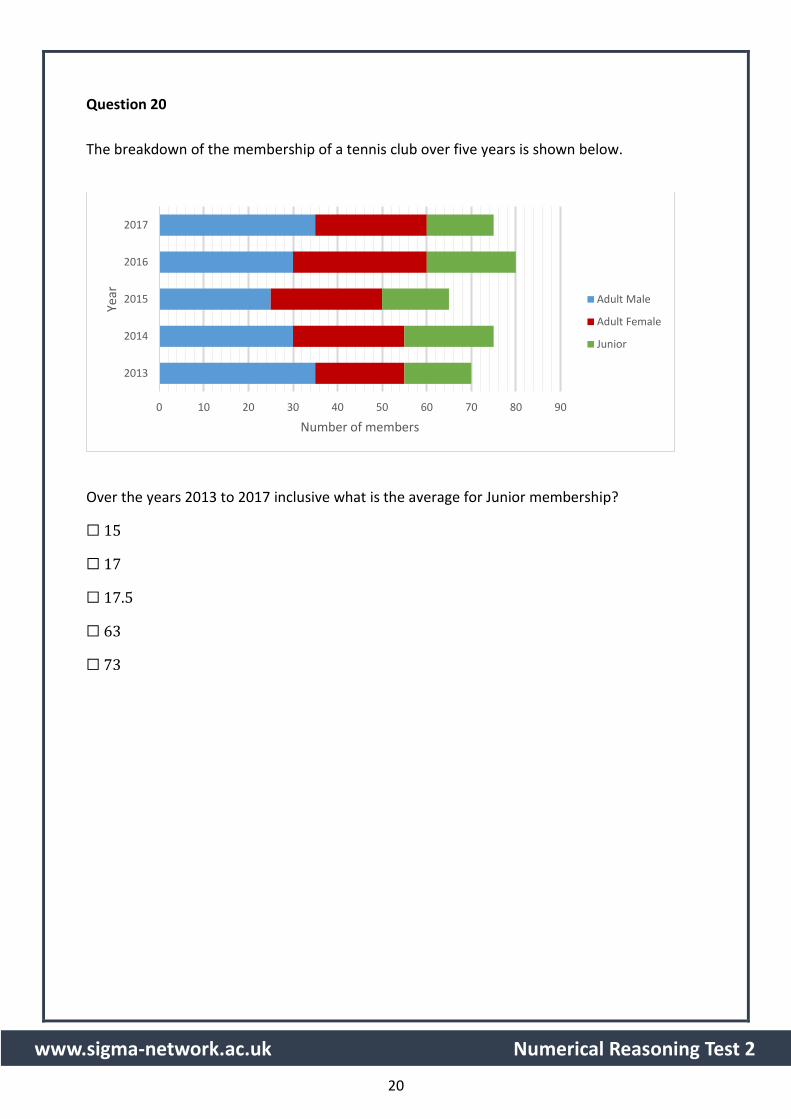
Question 20
The breakdown of the membership of a tennis club over five years is shown below.
Over the years 2013 to 2017 inclusive what is the average for Junior membership?
☐ 15
☐ 17
☐ 17.5
☐ 63
☐ 73
0 10 20 30 40 50 60 70 80 90
2013
2014
2015
2016
2017
Number of members
Year Adult Male
Adult Female
Junior
21
www.sigma-network.ac.uk Numerical Reasoning Test 2
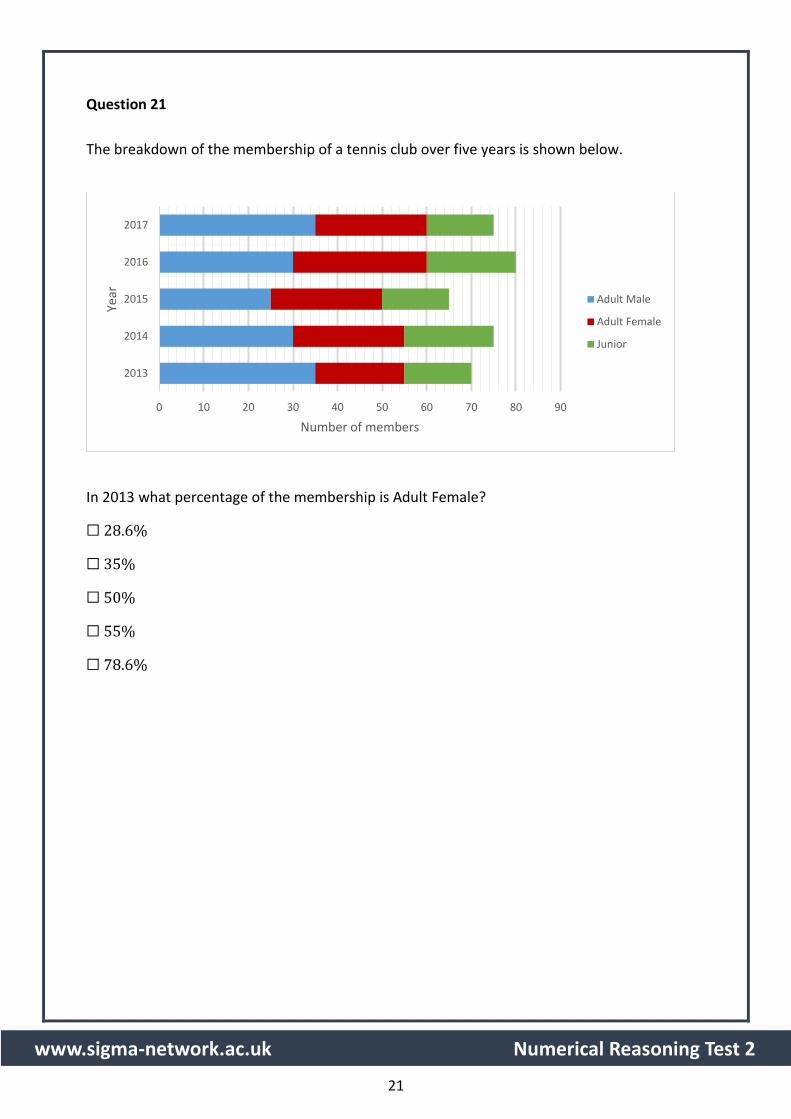
Question 21
The breakdown of the membership of a tennis club over five years is shown below.
In 2013 what percentage of the membership is Adult Female?
☐ 28.6%
☐ 35%
☐ 50%
☐ 55%
☐ 78.6%
0 10 20 30 40 50 60 70 80 90
2013
2014
2015
2016
2017
Number of members
Year Adult Male
Adult Female
Junior
22
www.sigma-network.ac.uk Numerical Reasoning Test 2
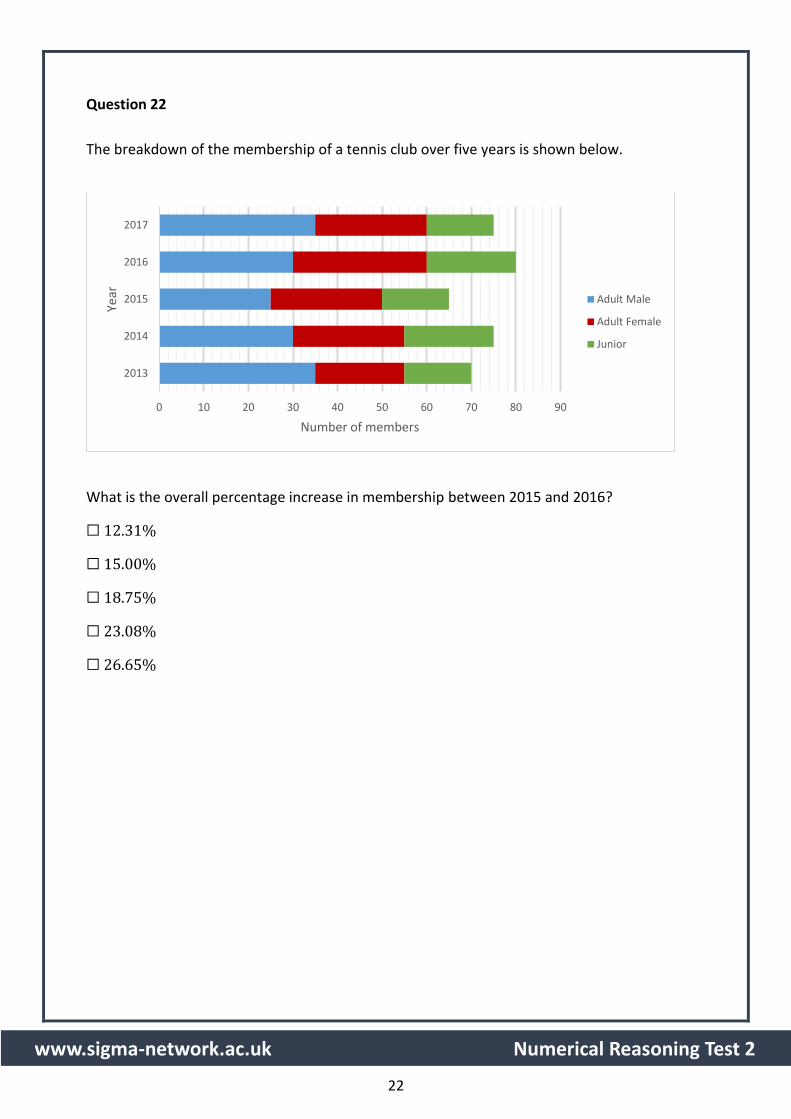
Question 22
The breakdown of the membership of a tennis club over five years is shown below.
What is the overall percentage increase in membership between 2015 and 2016?
☐ 12.31%
☐ 15.00%
☐ 18.75%
☐ 23.08%
☐ 26.65%
0 10 20 30 40 50 60 70 80 90
2013
2014
2015
2016
2017
Number of members
Year Adult Male
Adult Female
Junior

23
www.sigma-network.ac.uk Numerical Reasoning Test 2
Question 23
The breakdown of the membership of a tennis club over five years is shown below.
In which year is the ratio Adult Male to Adult Female to Junior 6: 5: 4?
☐ 2013
☐ 2014
☐ 2015
☐ 2016
☐ 2017
0 10 20 30 40 50 60 70 80 90
2013
2014
2015
2016
2017
Number of members
Year Adult Male
Adult Female
Junior

24
www.sigma-network.ac.uk Numerical Reasoning Test 2
Question 24
The breakdown of the membership of a tennis club over five years is shown below.
In how many years is Adult Male membership less than 35% of the total membership?
☐ 0
☐ 1
☐ 2
☐ 3
☐ 4
0 10 20 30 40 50 60 70 80 90
2013
2014
2015
2016
2017
Number of members
Year Adult Male
Adult Female
Junior
25
www.sigma-network.ac.uk Numerical Reasoning Test 2
END OF TEST
This resource was produced by the sigma Network Employability Special Interest Group whose
members are:
• Dr Kinga Zaczek, Royal Holloway, University of London
• Frances Whalley, University of Hertfordshire
• David Faulkner, University of Hertfordshire
• Laura Hooke, Loughborough University London