numbers of students with disabilities studying in higher ... 2016-17 - online.pdf · numbers of...
TRANSCRIPT

Numbers of Students with Disabilities Studying in Higher Education in Ireland
2016/17


Numbers of Students with Disabilities Studying in Higher Education in Ireland 2016/17
ISBN No: 978-0-9954772-8-5
Researched by Christine HynesEdited by Dara Ryder
Published by:
AHEAD Educational PressEast Hall
UCDCarysfort Avenue
BlackrockCo. Dublin
Tel: (01) 7164396Email: [email protected]
February 2018

Table of ContentsForeword 5Introduction 8
Survey Method 9
Findings 12Participation Rates of Students with Disabilities 12Undergraduate and Postgraduate 13Full time and Part Time Divide 15New Entrant Undergraduates with Disabilities 17Mature Students with Disabilities 18New Registrations 19Nature of the Disability 21Fields of Study of Students with Disabilities 26Fields of Study Breakdown by Disability 29Exam Accommodations 51Inside the Service 57On the Ground 58
Summary 60Recommendations 64Bibliography 68Appendix 72
1.1 Fields of Study 722.1 Number of students with disabilities studying within each responding higher education institution 773.1 Inside the Service Comments 784.1 On the Ground Comments 79
5
ForewordBy Ann Heelan, Executive Director, AHEAD
It is with great pleasure that I announce the results of the AHEAD Survey on the participation rates of students with disabilities in higher education in Ireland for the academic period 2016/17. While survey outcomes represent only a snapshot in time the annual nature of AHEAD surveys offers readers the opportunity to examine the number of students with disabilities entering the higher education system, observe their progress over time and identify emerging patterns and trends. To this end AHEAD surveys are a useful tool to those involved in the delivery and management of our higher education sector.
This year’s survey results, like previous years, confirms that the number of students with disabilities making the transition into higher education continues to grow. While AHEAD views this growing trend as positive, it also acknowledges that it has implications for institutions of higher education and, in particular, for administration, admissions, placement, teaching and learning, the transition to work and indeed engaging in all aspects of college life. As reflected in this year’s survey report, the ratio of students with disabilities allocated to college support staff is also increasing year on year. To meet these challenges AHEAD advocates a universal design approach to building inclusive learning environments that will cater for the growing diversity in the student population as well as supporting college staff whose role it is to manage the corresponding demands.
A summary of the key findings and recommendations are to be found in this document. However, I would like to single out for mentioning two key trends. The first is the growth in students with disabilities undertaking part-time higher education courses and the second is the persistent trend in the increase of students registering with a mental health condition. AHEAD has, for several years, highlighted the prevailing inequity in the system of the provision of supports to students with disabilities in higher education. The undertaking of part-time education is, for some students with disabilities, a more sustainable option than full-time education and for a number of students with disabilities, the only option. The fund for students with disabilities is currently only available to students undertaking full time courses. It is with great promise that AHEAD welcomes the review of this Fund by the Higher Education Authority in 2017 in which it recommends that the fund be extended to include students undertaking part-time course. AHEAD advocates that equity of access to higher education relies on this extension and suggests that the promise of this occurring is maybe related to the observed increase in the uptake of part-time courses in 2016.
The growth in the number of students registering with a mental health condition is significant but of no surprise to AHEAD. In 2016 AHEAD launched ‘Mental Health Matters – Mapping Best Practices in Higher Education’ a report on the findings of its qualitative study on the experiences of students with mental health difficulties in higher education in Ireland. In fact, the research was prompted by the growth in this category of students registering with the disability support offices or seeking support from college counselling services. The report’s recommendations are informed by listening to the experiences of both students and professionals alike along with wide consultation with on-the-ground staff working at the coalface and reflect what they believe is fundamentally required to improve the inclusion of students with mental health difficulties and to develop the provision of appropriate supports. The full report is available at ahead.ie/mentalhealthmatters.
It is very positive to see the leadership and commitment of college personnel to the creation of a more inclusive educational environment that will provide access across the whole campus to all students. The role of the Disability/Access Officer is a crucial one and finding flexible sustainable solutions to include a diverse student population will involve collaboration and dialogue with key staff across campus.

Introduction
IntroductionThe Association for Higher Education Access and Disability (henceforth AHEAD), is an independent, non-profit organisation that work towards the vision of a future where students with disabilities can succeed.
The Department of Justice and Equality stated that ‘people with disabilities have poorer educational participation and outcomes than their peers, thereby reducing their economic prospects’ (DJE, 2017, p. 7) and have made a commitment to encourage more people with disabilities to participate in third level education. AHEAD’s research on students with disabilities in higher education can help inform policy makers and relevant stakeholders in achieving this goal.
The objective of AHEAD’s participation rates surveys are to provide an accurate national measure of the numbers of students with disabilities in higher education, to identify where and in what academic field they are studying, and to give an insight of their progress from one academic year to another. AHEAD have been conducting this research for more than 20 years with higher education institutions nationwide. This work supports AHEAD’s strategic objective (2015) to influence national policy on the inclusion of students with disabilities in higher education by providing a snapshot of the participation rates of this cohort and making recommendations based on emerging trends. In their National Plan for Equity of Access (2015) the Higher Education Authority (HEA) have indicated the importance of using systematically comparable data to inform policy development and to help support national objectives on access and participation of under-represented groups, such as students with disabilities in education.
AHEAD seeks to achieve its mission by pursuing four core strategic themes:
◊ To influence national policy to impact positively on the inclusion of students with disabilities in education and employment
◊ To develop AHEAD’s existing emerging partnerships and build on its successes
◊ To build relationships within the higher education sector to promote the integration of the principles of Universal Design for Learning in education and employment
◊ To sustain and grow the organisation of AHEAD through engagement with key strategic partners
◊

9
Survey MethodThe AHEAD survey on the participation rates of students with disabilities in higher education in Ireland for the academic period 2016/17 was carried out with the support of participating institutions of higher education and, in particular, with the support of Disability/Access Officers therein. A survey questionnaire was sent out to the disability/access office in each of the higher education institutions involved.
Participating institutions were selected on the basis that they are funded by the Higher Education Authority (HEA) and are included in the HEA’s annual statistics on the general student population in higher education in Ireland, with one exception – the National College of Ireland. National College of Ireland, although funded by the Department of Education and Skills, is included in the AHEAD survey because it hosts a large student population and is therefore deemed too significant to omit. AHEAD compares the results of its annual survey on the participation rates of student with disabilities in higher education with that of the HEA’s statistics for the same corresponding period.
27 institutions were approached to partake in the survey. The 25 institutions which responded are listed below*.
Universities (later referred to as)Institutes of Technology and Other Institutions (later referred to as)
University College Cork (UCC)
University College Dublin (UCD)
National University of Ireland, Galway (NUIG)
Trinity College Dublin (TCD)
Maynooth University (MU)
Dublin City University (DCU)
University Limerick (UL)
Mary Immaculate College (MIC)
Marino Institute of Education (MIE)
National College of Art and Design (NCAD)
Royal College of Surgeons Ireland (RCSI)
St. Angela’s College (St. Ang.)
Athlone Institute of Technology (AIT)
Cork Institute of Technology (CIT)
Dublin Institute of Technology (DIT)
Dún Laoghaire Institute of Art, Design and Technology (DLIADT)
Dundalk Institute of Technology (DKIT)
Institute of Technology Blanchardstown (ITB)
Institute of Technology Sligo (ITS)
Institute of Technology, Tallaght (ITT)
Institute of Technology, Tralee (ITTRA)
Letterkenny Institute of Technology (LYIT)
Limerick Institute of Technology (LIT)
National College of Ireland (NCI)
Waterford Institute of Technology (WIT)
*Some institutions were unable to complete all sections of the survey. Where this occurs, information will be provided in the footnotes in each of the relevant sections.

Findings

FindingsParticipation Rates of Students with DisabilitiesThe 25 responding Higher Education Institutions identified 12630 students with disabilities (henceforth SWD) which represent 5.7% of the total student population. This represents a 12% rise in the total number of students with disabilities from 2015/16, when the figure was 11244. Students with disabilities now make up 5.7% of the total student population in the responding institutions, up significantly from last year’s figure of 5.2%. The steady growth rate in the number of students with disabilities in higher education over recent years is illustrated in Figure 1 below.
Figure 1 - Increasing numbers of students with disabilities from AHEAD’s Annual Surveys (1993-2017)
5.7%, 12630
5.2%, 11244
5.1%, 10773
4.7%, 96944.6%, 9082
4.0%, 7957
3.9%, 69323.3%, 6321
3.4%, 4853
3.2%, 3608
1.1%, 1410
0.7%, 990
6.4%, 11619
5.8%, 102135.7%, 9777
5.2%, 87695.0%, 8258
5.1%, 7247
4.8%, 6328
3.7%, 5243
3.8%, 4392
2.5%, 1011
2.6%, 1031
2.5%, 996
2.5%, 925
2.5%, 824
2.5%, 710
2.1%, 604
1.5%, 399
1.8%, 461
0
2000
4000
6000
8000
10000
12000
14000Number of Students with Disabilities in Higher Education (and the % of theTotal Student Population they represent)
Total Students withDisabilitiesUndergrads withDisabilitiesPostgrads withDisabilities
13
The participation rate of students with disabilities in the IT/Other Sector (6.5%) was slightly higher than that in the University Sector (5.2%). There was an increase of 12% in the number of students with disabilities in The University Sector in 2016/17, which rose to 7312 from 6529 in the previous academic year. While the number of students with disabilities in the responding Institutes of Technology/Other Institutions rose 13% to 5318 which is a significant increase from 4715 in 2015/16.
The rate of participation of students with disabilities varied greatly across the responding institutions from 1.5% to 10.2% of the total student population. Dun Laoghaire Institute of Art, Design and Technology recorded the highest rate of participation of students with disabilities at 10.2% followed by the Institute of Technology Tralee at 9.9% overall. Other institutions which were rated highly in relation to participation were Limerick Institute of Technology at 9.1% and the National College of Art and Design at 9.4%. Please review the full table of the responding institutions participation rate in the appendix section 2.1.
Undergraduate and PostgraduateStudents with disabilities in the responding institutions represented 6.4% (11619) of the total undergraduate student population in comparison to 2.6% (1011) of the total postgraduate student population*.
While the number of undergraduates with disabilities grew 14% year on year, the number of postgraduates with disabilities actually fell by 2% in the same period. The lower representation of students with disabilities at a postgraduate level in comparison to undergraduate level has been a feature of the last five years of this study (2015/16; 2014/15; 2013/14; 2011/12).
The student population studying at an undergraduate level represented 82% (181,712) of the total student population, while those studying at a postgraduate level represented 18% (39,955) of the total student population. In comparison, of the total population of students with disabilities, 8% were studying at postgraduate level. This figure also varied significantly across certain categories of disability. For example, The Blind/Visually Impaired category had the highest percentage proportion of students studying at a postgraduate level at 14%, while the lowest percentage proportion at this level were in the DCD-Dyspraxia category at 3%.
While the survey does not allow the capturing of the reasons for the lower representation of students with disabilities at postgraduate level, AHEAD understands that there may be a range of variables which may influence this persistent trend. These include the added costs of living with a disability, students deciding not to continue registering with disability services (and so not showing up in our statistics), pursuing employment etc.
* St. Angela’s College did not have any record of postgraduate students for 2016/17
The participation rate of students with disabilities
enrolled in full time courses was over 4 times higher
than that of students with disabilities enrolled in
part time courses.

15
Full time and Part Time DivideThe responding higher education institutions identified 12,036 students with disabilities enrolled in full time courses in the academic year 2016/17, representing 6.6% of the total full time student population, while 594 students with disabilities were identified as enrolled in part time courses, representing 1.5% of the total part time student population.
In comparison to the previous academic year, the number of students with disabilities in both part time and full time courses increased in 2016/2017. The number of students with disabilities studying full time increased by 12% year on year, while more significantly the number of students with disabilities studying part time increased by 28%.
AHEAD is mindful that the increase in the growth rate of students with disabilities undertaking part time courses occurred against the backdrop of the recent review (2017) by the HEA’s of the Fund for Students with Disabilities, which to date is available only to students undertaking full time study. One of the recommendations of the HEA review is that this Fund for Students with Disabilities be extended to cover students undertaking part time study. If this recommendation is implemented, AHEAD suggests that the growth in the numbers enrolled in part time study is likely to continue into the future.
The graph below illustrates the breakdown of students with disabilities (as a percentage of the total population) studying full and part time courses at postgraduate level, undergraduate level and overall in 2016/17.
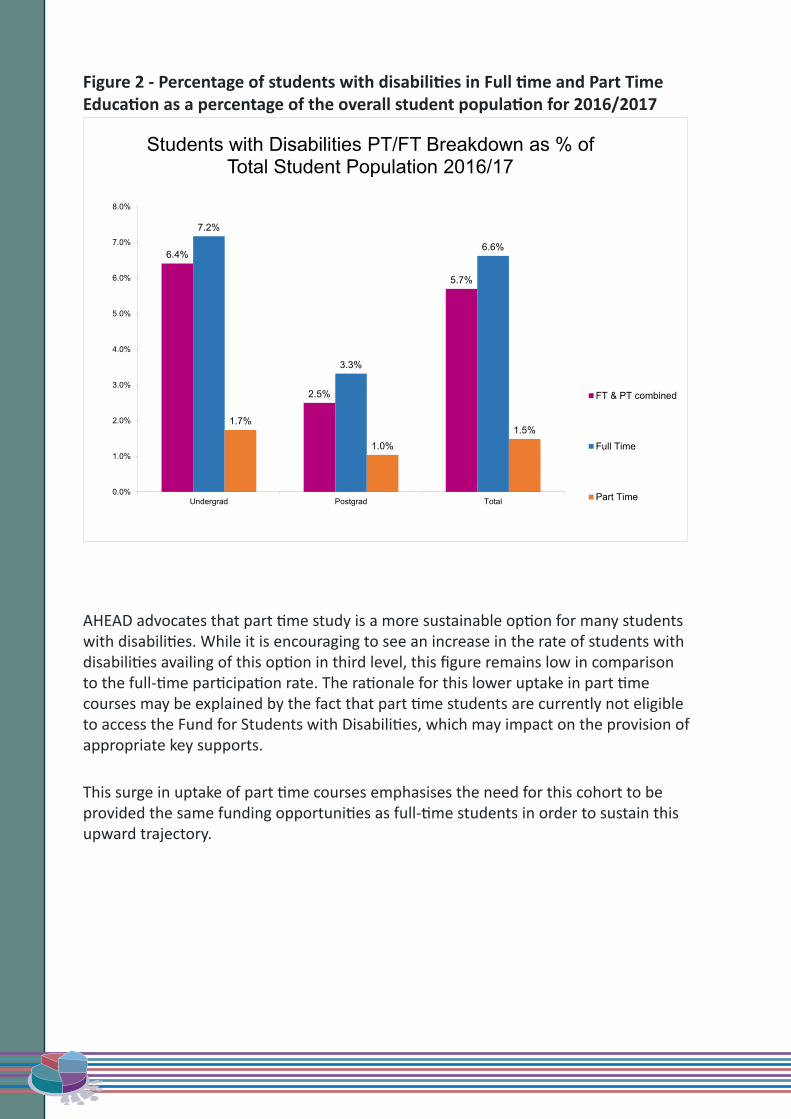
Figure 2 - Percentage of students with disabilities in Full time and Part Time Education as a percentage of the overall student population for 2016/2017
6.4%
2.5%
5.7%
7.2%
3.3%
6.6%
1.7%
1.0%1.5%
0.0%
1.0%
2.0%
3.0%
4.0%
5.0%
6.0%
7.0%
8.0%
Undergrad Postgrad Total
Students with Disabilities PT/FT Breakdown as % of Total Student Population 2016/17
FT & PT combined
Full Time
Part Time
AHEAD advocates that part time study is a more sustainable option for many students with disabilities. While it is encouraging to see an increase in the rate of students with disabilities availing of this option in third level, this figure remains low in comparison to the full-time participation rate. The rationale for this lower uptake in part time courses may be explained by the fact that part time students are currently not eligible to access the Fund for Students with Disabilities, which may impact on the provision of appropriate key supports.
This surge in uptake of part time courses emphasises the need for this cohort to be provided the same funding opportunities as full-time students in order to sustain this upward trajectory.

17
New Entrant Undergraduates with DisabilitiesThe Institutions were surveyed on new entrant undergraduates which are students in the first year of their studies who registered with the disability service within the 2016/’17 academic term. A total number of 3515 new entrants were registered with the disability services of the responding institutions which is an increase of 14% from 2015/’16 (3075). New entrant undergraduates represented 30% of the total number of undergraduate students with a disability (11619).
Mature Students with DisabilitiesThe 25 responding institutions who participated provided details on the number of mature students who registered with a disability in the academic year 2016/’17. 1469 mature students registered with a disability were recorded from the data collected, which is a slight increase from the previous year (1381 in 2015/’16). These mature students represented 12% of the total number of students with disabilities within the responding institutions.
19
New RegistrationsResponding institutions provided information on students newly registered with the disability services including students who are not new entrants in the 2016/17 academic year. By examining new registrations, AHEAD is trying to ascertain how many students go through at least their first year of study without supports before registering with disability services in subsequent years. The responding institutions reported 1161 newly registered students with disabilities who were not new entrants, which represented 9% of the total student population with disabilities in the responding institutions and 25% of all new registrations.
Approximately a quarter of students who registered with a disability in 2016/17 were not in their first year of study. There has been a noted increase in the number of new registrations over the last few years of this study (2015/’16, 2014/2015, 2013/14) which indicates an ever-growing number of students are beginning their studies with no disability support which can have a negative impact on retention rates if not addressed.

Although it still remains the largest category by some distance, the percentage of students
in the Specific Learning Difficulty category has fallen as a percentage of the total
population of students with disabilities every year for the last 6 years, from 60.5% in
2010/11 to 41.1% in the current survey. It is worth noting that a recent Irish Universities Association Report, HEAR/DARE: Facts and
Figures (IUA, 2017) on DARE applicants found that the percentage of applicants with Specific Learning Difficulties has dropped by 25% over the last seven years which tallies
with the downward trend in AHEAD surveys.

21
Nature of the DisabilityFigure 3 - Breakdown of students by Category of Disability 2016/17
5.4%
5.2%1.8%
2.6%
6.1%
13.9%
4.3%
11.2%6.3%
41.4%
1.8%
Breakdown of Students byCategory of Disability 2016/17 Aspergers/Autism
ADD/ADHD
Blind/Visually Impaired
Deaf/Hard of Hearing
DCD - Dyspraxia/Dysgraphia
Mental Health Condition
Neurological/Speech andLanguage
Significant Ongoing Illness
Physical Disability
Specific Learning Difficulty
Other
The categories of the students with disabilities in 2016/17 recorded by the responding institutions (undergraduate and postgraduate) were based on those provided by the HEA as part of the Fund for Students with Disabilities guidelines for higher education institutions, with the addition of the ‘Other’ category which was added to cater for registrations which do not fall within the HEA specified categories. Students were placed in categories based on their primary disability. Therefore, each student is only represented once in the data set, regardless of whether they have one or more disabilities.
Figure 3 above illustrates the largest number of students with disabilities were within the category of Specific Learning Difficulty at 41.4% (5223) with the second highest in the category of Mental Health at 13.9% (1750). 11.2% (1414) of students with a disability were registered with a Significant Ongoing Illness’, 6.3% (793) with a Physical Disability, 6.1% (773) with DCD - Dyspraxia/Dysgraphia, 5.4% (684) with Aspergers/Autism, 4.3% (548) with a Neurological/Speech and Language disability, 5.2% (659) with ADD/ADHD, 2.6% (334) in the Deaf/Hard of Hearing category, 1.8% (229) in the Blind/Visually Impaired category and 1.8% (223) were categorised as Other, because they could not be categorised under the HEA specified categories.

The biggest year on year increases in the number of students with disabilities were in the ADD/ADHD category (up 43% from 461 in 15/16) and Mental Health (up 24% from 1416 in 15/16%) categories. In contrast, there was just a 2% increase in the number of students in the Specific Learning Disability in comparison to the previous year, meaning the numbers in this category are growing at a significantly slower rate than the general population of students with disabilities which grew 12% year on year.

23
New Entrants Disability Breakdown
The total number of new entrants with disabilities recorded by the responding institutions was 3515, which composed of 235 (6.7%) in the Asperger’s/Autism Category, 224 (6.4%) in the ADD/ADHD Category, 61 (1.7%) in the Blind/Visually Impaired category, 89 (2.5%) in the Deaf/Hard of Hearing category, 237 (6.7%) in the DCD Dyspraxia category, 501 (14.3%) in the Mental Health category, 150 (4.3%) in the Neurological/Speech and Language category, 380 (10.8%) in the Significant Ongoing Illness category, 209 (5.9%) in the Physical Disability category, 1386 (39.4%) in the Specific Learning Disability category and 43 (1.2%) in the Other category.
The biggest year on year increases of new entrants with disabilities were in the numbers of students in the ADD/ADHD category (up 70% from 132 in 15/16) and Mental Health (up 46% from 343 15/16%) categories. This percentage increase is significantly higher than the 14% growth rate in the general population of new entrant students with disabilities. A recent report on The DARE Scheme (The Disability Access Route to Education) by The Irish Universities Association found that the number of applicants with mental health difficulties to the scheme increased by 400% over the last six years. According to the report, submissions to DARE in 2016 found that students with a mental health condition met the most educational impact indicators of any category of disability (IUA, 2017). The educational impact indicators are used to review the impact a disability has on a student’s educational experience. An example of one indicator which is reviewed under DARE is School Experience and Well-being. While the DARE report does not give detail on the increase in the number of ADD/ADHD students, AHEAD’s findings indicate that there is a need for further investigation.
Figure 4 - Breakdown of new entrant students with disabilities by category of Disability 2016/17
7%6%
2%3%
7%
14%
4%11%6%
39%
1%
Breakdown of New Entrant Students with disabilities by category 2016/17
Aspergers/Autism
ADD/ADHD
Blind/Visually Impaired
Deaf/Hard of Hearing
DCD - Dyspraxia/Dysgraphia
Mental Health Condition
Neurological/Speech and Language
Significant Ongoing Illness
Physical Disability
Specific Learning Difficulty
Other

Undergraduate Disability Breakdown
Of the 11619 undergraduate students with disabilities identified by the responding institutions, 41.3% (4801) were in the Specific Learning Difficulty representing the largest category of undergraduate students with disabilities. This was followed by Mental Health Condition at 13.9% (1612) and Significant Ongoing Illness at 11.2% (1297). The breakdown of undergraduate students with disabilities was completed by Asperger’s/Autism at 5.6% (645), ADD/ADHD at 5.3% (615), Blind/Visually Impaired at 1.7% (197), Deaf/Hard of Hearing at 2.6% (302), DCD- Dyspraxia at 6.4% (746), Neurological/Speech and Language Difficulties at 4.3% (504), Physical Disability at 5.9% (681) and Other at 1.9% (219).
25
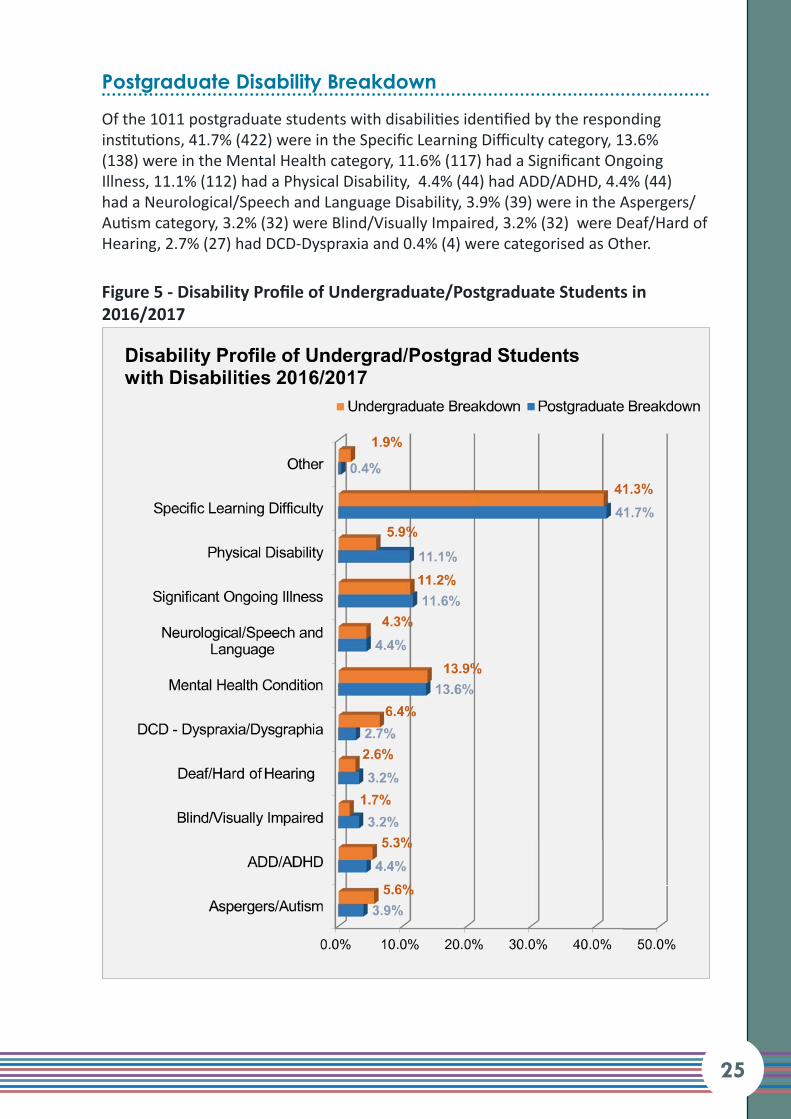
Postgraduate Disability Breakdown
Of the 1011 postgraduate students with disabilities identified by the responding institutions, 41.7% (422) were in the Specific Learning Difficulty category, 13.6% (138) were in the Mental Health category, 11.6% (117) had a Significant Ongoing Illness, 11.1% (112) had a Physical Disability, 4.4% (44) had ADD/ADHD, 4.4% (44) had a Neurological/Speech and Language Disability, 3.9% (39) were in the Aspergers/Autism category, 3.2% (32) were Blind/Visually Impaired, 3.2% (32) were Deaf/Hard of Hearing, 2.7% (27) had DCD-Dyspraxia and 0.4% (4) were categorised as Other.
Figure 5 - Disability Profile of Undergraduate/Postgraduate Students in 2016/2017

Fields of Study of Students with DisabilitiesThe responding institutions provided information on the number of students with disabilities in each field of study in 2016/’17. Each institution was given the subject breakdown in accordance with ISCED classifications, with minor adjustments*. Figure 5 below illustrates the fields of study breakdown of 12,630 students with disabilities in comparison that of the total student population according to HEA statistics**.
* This year’s study has combined ‘Law’ as part of the ‘Business and Administration’ category reflecting the categorisation used by the HEA, with the exception of ‘Nursing’ which AHEAD, unlike the HEA, list as a field in its own right distinct from ‘Health and Welfare’. Due to the change in the ISCED Categories, whereby there is no longer a ‘combined’ category, it has been omitted in this report
** Higher Education Authority, “2016/17 Statistics”, 2017, <www.hea.ie/en/statistics> [accessed Sept 7th 2017]

27
Figure 6 - Breakdown of fields of study of students with disabilities compared with the total student population
0.9%
5.9%
15.5%
5.3%
18.7%
9.6%
6.5%
10.6%
1.6%
16.5%
4.2%
4.7%
0.3%
3.7%
24.3%
7.2%
16.7%
11.9%
6.2%
10.6%
2.4%
8.8%
3.7%
4.2%
0.0% 5.0% 10.0% 15.0% 20.0% 25.0% 30.0%
General Programmes
Education
Humanities and Arts
Social sciences, journalism and information
Business, administration and law
Science & Mathematics
Computing
Engineering, Manufacturing & Construction
Agriculture and Veterinary
Health and Welfare
Nursing
Services
Fields of Study Breakdown of Total Student PopulationVs. Student Population with a Disability
SWD Breakdown Total Student Pop
The Field of ‘Humanities and Arts’ had the highest percentage of students with disabilities once again with 24.3% of students with disabilities studying in this field. This was then followed by ‘Business, Administration and Law’ with 16.7% of students with disabilities and ‘Science, Mathematics and Statistics’ with 11.9% of students with disabilities.
The least common fields of study for students with disabilities were ‘Generic Programmes’ with 0.3% of students with disabilities, followed by ‘Forestry, Fisheries and Veterinary’ with 2.4%, with ‘Nursing’ and ‘Education’ both with 3.7% each.

The most notable differences between the percentage breakdown for fields of study of students with disabilities and the breakdown for the total student population arise in the fields of ‘Health and Welfare’ and ‘Humanities and Arts’. Students with disabilities were just over half as likely (8.8%) to study in the field of ‘Health and Welfare’ as the average student (16.5%).
In contrast, students with disabilities are significantly more likely to study in the field of ‘Humanities and Arts’ at 24.3%, in comparison to their peers in the total student population at 15.5%.

29
Fields of Study Breakdown by DisabilityThe responding institutions* provided a breakdown of the fields of study which students with disabilities were enrolled in within the academic year 2016/17 by disability. AHEAD has analysed each category of disability and identified a number of key points from the findings across the fields of study with the exception of the ‘Generic’ field, which is omitted due to the small number enrolled in this field overall and the generic nature of the subjects within it.
Note the application of the terms ‘underrepresented’ and ‘overrepresented’ in this section are applied to highlight the fields of study that have a concentration or not of students with a particular disability in comparison to the average number of students/ students with disabilities. There is no intention that the use of these terms impart any positive or negative inferences. In the tables which follow, the phrase students with disabilities is shortened to SWDs for brevity.
* IT Sligo could not provide data for this section
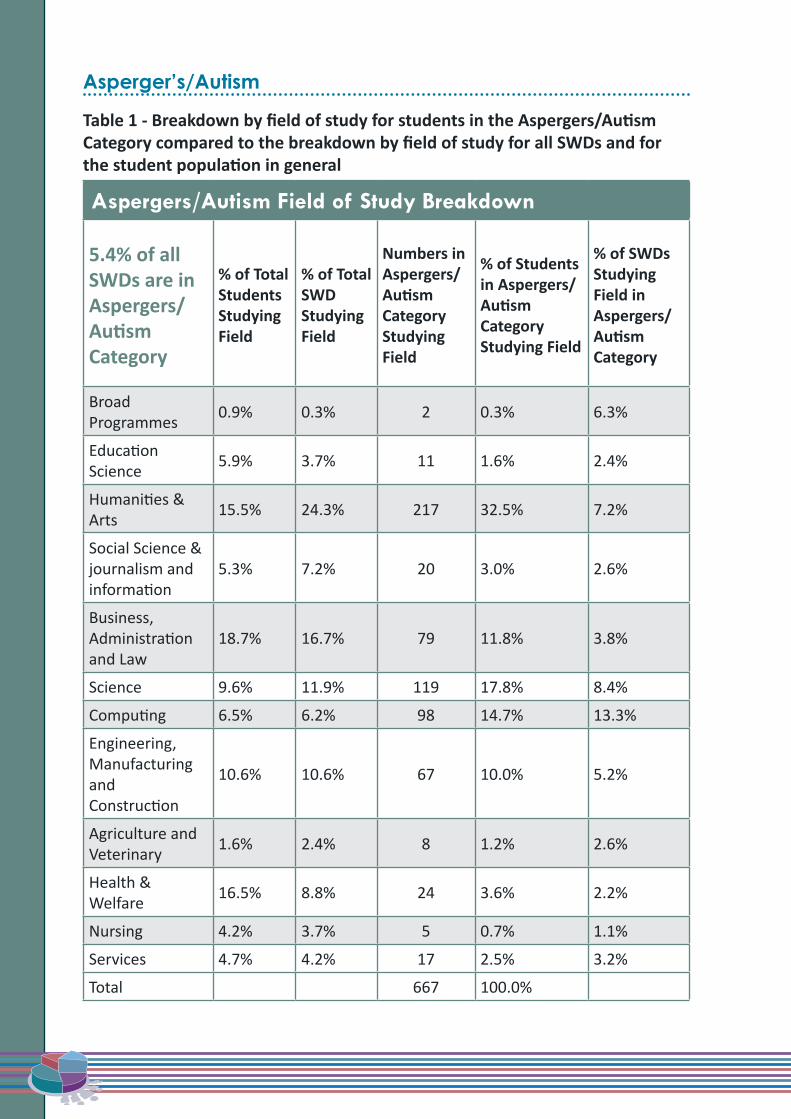
Asperger’s/Autism
Table 1 - Breakdown by field of study for students in the Aspergers/Autism Category compared to the breakdown by field of study for all SWDs and for the student population in general
Aspergers/Autism Field of Study Breakdown
5.4% of all SWDs are in Aspergers/Autism Category
% of Total Students Studying Field
% of Total SWD Studying Field
Numbers in Aspergers/Autism Category Studying Field
% of Students in Aspergers/Autism Category Studying Field
% of SWDs Studying Field in Aspergers/Autism Category
Broad Programmes 0.9% 0.3% 2 0.3% 6.3%
Education Science 5.9% 3.7% 11 1.6% 2.4%
Humanities & Arts 15.5% 24.3% 217 32.5% 7.2%
Social Science & journalism and information
5.3% 7.2% 20 3.0% 2.6%
Business, Administration and Law
18.7% 16.7% 79 11.8% 3.8%
Science 9.6% 11.9% 119 17.8% 8.4%
Computing 6.5% 6.2% 98 14.7% 13.3%
Engineering, Manufacturing and Construction
10.6% 10.6% 67 10.0% 5.2%
Agriculture and Veterinary 1.6% 2.4% 8 1.2% 2.6%
Health & Welfare 16.5% 8.8% 24 3.6% 2.2%
Nursing 4.2% 3.7% 5 0.7% 1.1%
Services 4.7% 4.2% 17 2.5% 3.2%
Total 667 100.0%

31
◊ In comparison to other students with disabilities, those in the Aspergers/Autism category are most underrepresented in the field of Nursing, with only 5 students registered in this field. Average students or students with disabilities are approx. 5 times as likely to study in the ‘Nursing’ field as students in the Asperger’s/Autism Category.
◊ In comparison to other students with disabilities, those in the Aspergers/Autism category are most overrepresented in the fields of Computing & Science.
◊ Students in the Asperger’s/Autism Category are more than twice as likely to study in the ‘Humanities and Arts’ field than the average student.
◊ Students in the Asperger’s/Autism Category are almost twice as likely to study in the field of ‘Science’ as the average student.

ADD/ADHD
Table 2 - Breakdown by field of study for students in the ADD/ADHD Category compared to the breakdown by field of study for all SWDs and for the student population in general
5.2% of all SWDs are in ADD/ADHD Category
% of Total Students Studying Field
% of Total SWD Studying Field
Numbers in ADD/ADHD Category Studying Field
% of Students in ADD/ADHD Category Studying Field
% of SWDs Studying Field in ADD/ADHD Category
Broad Programmes 0.9% 0.3% 1 0.2% 3.1%
Education Science 5.9% 3.7% 8 1.2% 1.7%
Humanities & Arts 15.5% 24.3% 183 28.0% 6.0%
Social Science & journalism and information
5.3% 7.2% 53 8.1% 6.8%
Business, Administration and Law
18.7% 16.7% 128 19.6% 6.2%
Science 9.6% 11.9% 67 10.3% 4.8%
Computing 6.5% 6.2% 40 6.1% 5.4%
Engineering, Manufacturing and Construction
10.6% 10.6% 75 11.5% 5.8%
Agriculture and Veterinary 1.6% 2.4% 11 1.7% 3.6%
Health & Welfare 16.5% 8.8% 59 9.0% 5.3%
Nursing 4.2% 3.7% 10 1.5% 2.1%
Services 4.7% 4.2% 18 2.8% 3.4%
Total 653 100.0%

33
◊ In comparison to other students with disabilities, those in the ADD/ADHD category are most underrepresented in the field of ‘Education Science’, with just 8 students registered. Average students or students with disabilities are approx. 5 times as likely to study in the ‘Education Science’ field as students in the ADD/ADHD category.
◊ In comparison to other students with disabilities, those in the ADD/ADHD category are most overrepresented in the fields of ‘Business, Administration and Law’ and ‘Humanities and Arts’.
◊ Average students or students with disabilities are more than twice as likely to study in the ‘Nursing’ field as students in the ADD/ADHD category.

Blind/Visually Impaired
Table 3 - Breakdown by field of study for students in the Blind/Visually Impaired Category compared to the breakdown by field of study for all SWDs and for the student population in general
1.8% of all SWDs are in Blind/Visually Impaired Category
% of Total Students Studying Field
% of Total SWD Studying Field
Numbers in Blind/Visually Impaired Studying Field
% of Students in Blind/Visually Impaired Category Studying Field
% of SWDs Studying Field in Blind/Visually Impaired Category
Broad Programmes 0.9% 0.3% 0 0.0% 0.0%
Education Science 5.9% 3.7% 7 3.1% 1.5%
Humanities & Arts 15.5% 24.3% 75 33.6% 2.5%
Social Science & journalism and information
5.3% 7.2% 16 7.2% 2.1%
Business, Administration and Law
18.7% 16.7% 45 20.2% 2.2%
Science 9.6% 11.9% 19 8.5% 1.3%
Computing 6.5% 6.2% 21 9.4% 2.8%
Engineering, Manufacturing and Construction
10.6% 10.6% 8 3.6% 0.6%
Agriculture and Veterinary 1.6% 2.4% 2 0.9% 0.7%
Health & Welfare 16.5% 8.8% 22 9.9% 2.0%
Nursing 4.2% 3.7% 2 0.9% 0.4%
Services 4.7% 4.2% 6 2.7% 1.1%
Total 223 100.0%
35
◊ In comparison to other students with disabilities, those in the Blind/Visually Impaired category are most underrepresented in the field of ‘Engineering, Manufacturing and Construction’, with just 8 students registered. Average students or students with disabilities are approx. 3 times as likely to study in this field as students in the Blind/Visually Impaired category.
◊ In comparison to other students with disabilities, those in the Blind/Visually Impaired category are most overrepresented in the fields of ‘Computing’ and ‘Humanities and Arts’.
◊ Average students or students with disabilities are approx. 4 times as likely to study in the field of Nursing as students in the Blind/Visually Impaired category.
Deaf/Hard of Hearing
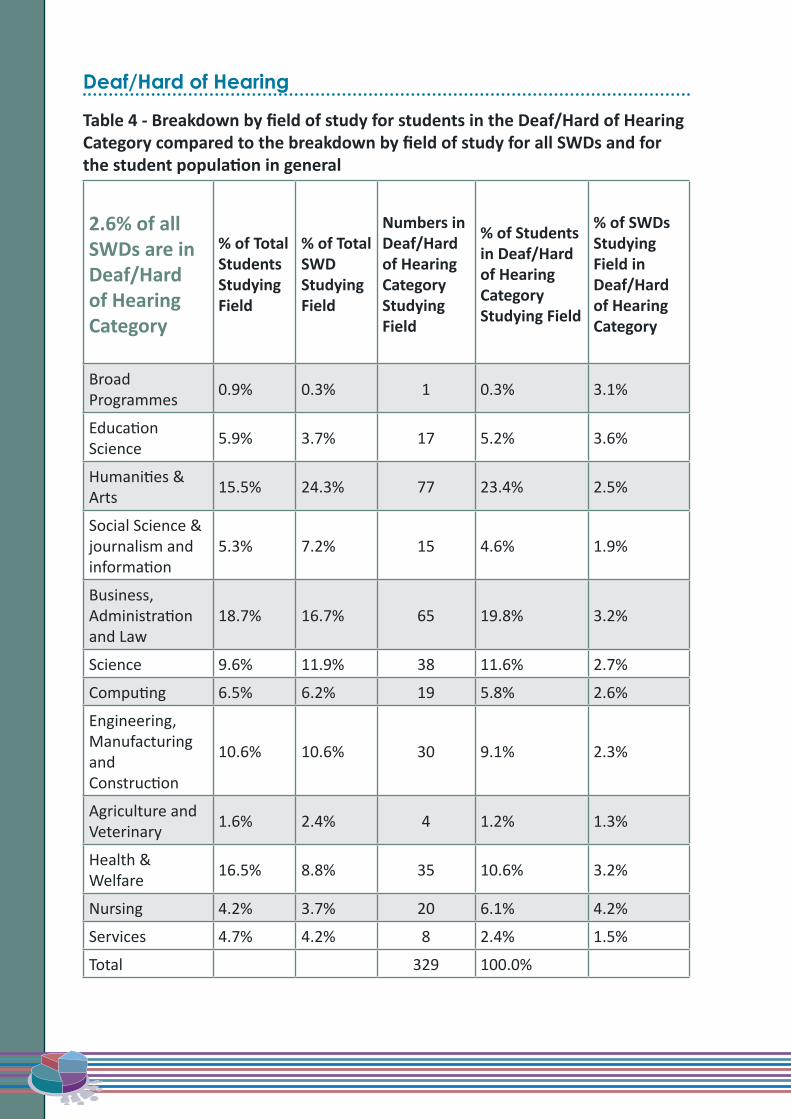
Table 4 - Breakdown by field of study for students in the Deaf/Hard of Hearing Category compared to the breakdown by field of study for all SWDs and for the student population in general
2.6% of all SWDs are in Deaf/Hard of Hearing Category
% of Total Students Studying Field
% of Total SWD Studying Field
Numbers in Deaf/Hard of Hearing Category Studying Field
% of Students in Deaf/Hard of Hearing Category Studying Field
% of SWDs Studying Field in Deaf/Hard of Hearing Category
Broad Programmes 0.9% 0.3% 1 0.3% 3.1%
Education Science 5.9% 3.7% 17 5.2% 3.6%
Humanities & Arts 15.5% 24.3% 77 23.4% 2.5%
Social Science & journalism and information
5.3% 7.2% 15 4.6% 1.9%
Business, Administration and Law
18.7% 16.7% 65 19.8% 3.2%
Science 9.6% 11.9% 38 11.6% 2.7%
Computing 6.5% 6.2% 19 5.8% 2.6%
Engineering, Manufacturing and Construction
10.6% 10.6% 30 9.1% 2.3%
Agriculture and Veterinary 1.6% 2.4% 4 1.2% 1.3%
Health & Welfare 16.5% 8.8% 35 10.6% 3.2%
Nursing 4.2% 3.7% 20 6.1% 4.2%
Services 4.7% 4.2% 8 2.4% 1.5%
Total 329 100.0%

37
◊ In comparison to other students with disabilities, those in the Deaf/Hard of Hearing category are most underrepresented in the field of ‘Agriculture and Veterinary’, with just 4 students registered. Average students with disabilities are approx. twice as likely to study in this field as students in the Deaf/Hard of Hearing category.
◊ In comparison to other students with disabilities, those in the Deaf/Hard of Hearing category are most overrepresented in the fields of ‘Nursing’ and ‘Education science’.
◊ Average students or students with disabilities are approx. twice as likely to study in the field of ‘Services’ as students in the Deaf/Hard of Hearing category.

DCD- Dyspraxia
Table 5 - Breakdown by field of study for students in the DCD – Dyspraxia/ Dysgraphia Category compared to the breakdown by field of study for all SWDs and for the student population in general
6.1% of all SWDs are in DCD - Dyspraxia Category
% of Total Students Studying Field
% of Total SWD Studying Field
Numbers in DCD - Dyspraxia Studying Field
% of Students in DCD - Dyspraxia Category Studying Field
% of SWDs Studying Field in DCD - Dyspraxia Category
Broad Programmes 0.9% 0.3% 0 0.0% 0.0%
Education Science 5.9% 3.7% 17 2.2% 3.6%
Humanities & Arts 15.5% 24.3% 177 23.1% 5.8%
Social Science & journalism and information
5.3% 7.2% 50 6.5% 6.4%
Business, Administration and Law
18.7% 16.7% 156 20.3% 7.6%
Science 9.6% 11.9% 92 12.0% 6.5%
Computing 6.5% 6.2% 76 9.9% 10.3%
Engineering, Manufacturing and Construction
10.6% 10.6% 68 8.9% 5.2%
Agriculture and Veterinary 1.6% 2.4% 18 2.3% 5.9%
Health & Welfare 16.5% 8.8% 52 6.8% 4.7%
Nursing 4.2% 3.7% 18 2.3% 3.8%
Services 4.7% 4.2% 43 5.6% 8.1%
Total 767 100.0%

39
◊ Average students are more than twice as likely to study in the field of ‘Education Science’ as students in the DCD - Dyspraxia category.
◊ In comparison to other students with disabilities, those in the DCD - Dyspraxia category are most overrepresented in the field of ‘Computing’. They are more than one and a half times as likely as the average student or student with a disability to study in this field.
◊ Average students are more than twice as likely to study in the fields of ‘Health and Welfare’ and ‘Education Science’ as students in the DCD - Dyspraxia category.

Mental Health Condition
Table 6 - Breakdown by field of study for students in the Mental Health Condition Category compared to the breakdown by field of study for all SWDs and for the student population in general
13.9% of all SWDs are in Mental Health Condition Category
% of Total Students Studying Field
% of Total SWD Studying Field
Numbers in Mental Health Condition Category Studying Field
% of Students in Mental Health Condition Category Studying Field
% of SWDs Studying Field in Mental Health Condition Category
Broad Programmes 0.9% 0.3% 7 0.4% 21.9%
Education Science 5.9% 3.7% 57 3.3% 12.2%
Humanities & Arts 15.5% 24.3% 624 36.4% 20.6%
Social Science & journalism and information
5.3% 7.2% 150 8.7% 19.2%
Business, Administration and Law
18.7% 16.7% 264 15.4% 12.9%
Science 9.6% 11.9% 199 11.6% 14.1%
Computing 6.5% 6.2% 85 5.0% 11.5%
Engineering, Manufacturing and Construction
10.6% 10.6% 53 3.1% 4.1%
Agriculture and Veterinary 1.6% 2.4% 28 1.6% 9.2%
Health & Welfare 16.5% 8.8% 137 8.0% 12.4%
Nursing 4.2% 3.7% 71 4.1% 15.1%
Services 4.7% 4.2% 40 2.3% 7.5%
Total 1715 100.0%

41
◊ In comparison to other students with disabilities, those in the Mental Health category are most underrepresented in the field of ‘Engineering, Manufacturing and Construction’. Average students and students with disabilities are more than three times as likely to study in this field as students in the Mental Health category.
◊ In comparison to other students with disabilities, those in the Mental Health category are most overrepresented in the field of ‘Humanities and Arts’. They are more than twice as likely as the average student to study in this field.
◊ Average students and students with disabilities are approx. twice as likely to study in the field of ‘Services’ as students in the Mental Health category.
◊
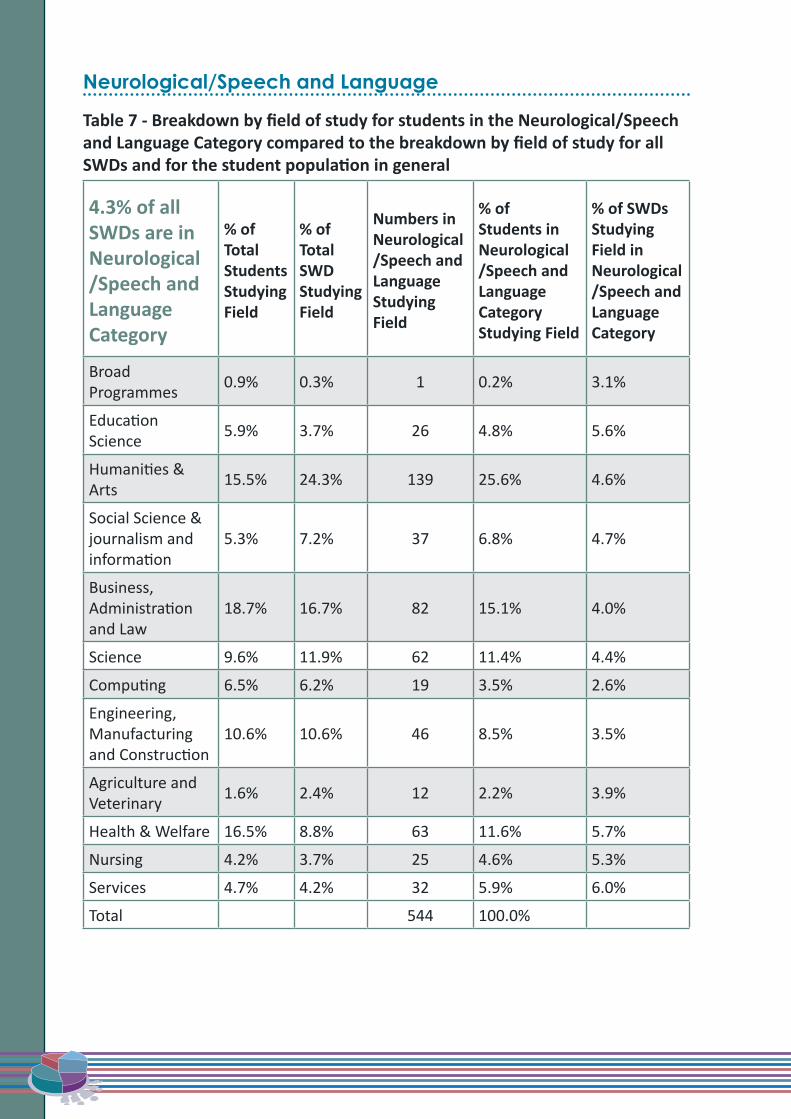
Neurological/Speech and Language
Table 7 - Breakdown by field of study for students in the Neurological/Speech and Language Category compared to the breakdown by field of study for all SWDs and for the student population in general
4.3% of all SWDs are in Neurological /Speech and Language Category
% of Total Students Studying Field
% of Total SWD Studying Field
Numbers in Neurological /Speech and Language Studying Field
% of Students in Neurological /Speech and Language Category Studying Field
% of SWDs Studying Field in Neurological /Speech and Language Category
Broad Programmes 0.9% 0.3% 1 0.2% 3.1%
Education Science 5.9% 3.7% 26 4.8% 5.6%
Humanities & Arts 15.5% 24.3% 139 25.6% 4.6%
Social Science & journalism and information
5.3% 7.2% 37 6.8% 4.7%
Business, Administration and Law
18.7% 16.7% 82 15.1% 4.0%
Science 9.6% 11.9% 62 11.4% 4.4%
Computing 6.5% 6.2% 19 3.5% 2.6%
Engineering, Manufacturing and Construction
10.6% 10.6% 46 8.5% 3.5%
Agriculture and Veterinary 1.6% 2.4% 12 2.2% 3.9%
Health & Welfare 16.5% 8.8% 63 11.6% 5.7%
Nursing 4.2% 3.7% 25 4.6% 5.3%
Services 4.7% 4.2% 32 5.9% 6.0%
Total 544 100.0%
43
◊ In comparison to other students with disabilities, those in the Neurological/Speech and Language category are most underrepresented in the field of ‘Computing’. Average students and students with disabilities are almost twice as likely to study in this field as students in the Neurological/Speech and Language category.
◊ In comparison to other students with disabilities, those in the Neurological/Speech and Language category are most overrepresented in the fields of ‘Education Science’, ‘Health and Welfare’ and ‘Nursing’.

Significant Ongoing Illness
Table 8 - Breakdown by field of study for students in the Significant Ongoing Illness Category compared to the breakdown by field of study for all SWDs and for the student population in general
11.2% of all SWDs are in Significant Ongoing Illness Category
% of Total Students Studying Field
% of Total SWD Studying Field
Numbers in Significant Ongoing Illness Category Studying Field
% of Students in Significant Ongoing Illness Category Studying Field
% of SWDs Studying Field in Significant Ongoing Illness Category
Broad Programmes 0.9% 0.3% 3 0.2% 9.4%
Education Science 5.9% 3.7% 81 5.9% 17.3%
Humanities & Arts 15.5% 24.3% 339 24.6% 11.2%
Social Science & journalism and information
5.3% 7.2% 90 6.5% 11.5%
Business, Administration and Law
18.7% 16.7% 233 16.9% 11.4%
Science 9.6% 11.9% 171 12.4% 12.1%
Computing 6.5% 6.2% 59 4.3% 8.0%
Engineering, Manufacturing and Construction
10.6% 10.6% 89 6.4% 6.9%
Agriculture and Veterinary 1.6% 2.4% 32 2.3% 10.5%
Health & Welfare 16.5% 8.8% 184 13.3% 16.6%
Nursing 4.2% 3.7% 64 4.6% 13.6%
Services 4.7% 4.2% 35 2.5% 6.6%
Total 1380 100.0%

45
◊ In comparison to other students with disabilities, those in the Significant Ongoing Illness category are most underrepresented in the fields of ‘Engineering, Manufacturing and Construction’ and ‘Computing’. Average students and students with disabilities are approx. one and a half times as likely to study in these fields as students in the Significant Ongoing Illness category.
◊ In comparison to other students with disabilities, those in the Significant Ongoing Illness category are most overrepresented in the fields of ‘Education Science’ and ‘Health and Welfare’. They are more than one and a half times as likely as average students with disabilities to study in these fields.
◊

Physical Disability
Table 9 - Breakdown by field of study for students in the Physical Disability Category compared to the breakdown by field of study for all SWDs and for the student population in general
6.3% of all SWDs are in Physical Disability Category
% of Total Students Studying Field
% of Total SWD Studying Field
Numbers in Physical Disability Studying Field
% of Students in Physical Disability Category Studying Field
% of SWDs Studying Field in Physical Disability Category
Broad Programmes 0.9% 0.3% 1 0.1% 3.1%
Education Science 5.9% 3.7% 42 5.4% 9.0%
Humanities & Arts 15.5% 24.3% 211 27.2% 7.0%
Social Science & journalism and information
5.3% 7.2% 61 7.9% 7.8%
Business, Administration and Law
18.7% 16.7% 132 17.0% 6.4%
Science 9.6% 11.9% 96 12.4% 6.8%
Computing 6.5% 6.2% 35 4.5% 4.7%
Engineering, Manufacturing and Construction
10.6% 10.6% 61 7.9% 4.7%
Agriculture and Veterinary 1.6% 2.4% 9 1.2% 3.0%
Health & Welfare 16.5% 8.8% 81 10.4% 7.3%
Nursing 4.2% 3.7% 27 3.5% 5.7%
Services 4.7% 4.2% 20 2.6% 3.8%
Total 776 100.0%

47
◊ In comparison to other students with disabilities, those in the Physical Disability category are most underrepresented in the fields of ‘Agriculture and Veterinary’. Average students with disabilities are more than twice as likely to study in this field as students in the Physical Disability category.
◊ In comparison to other students with disabilities, those in the Physical Disability category are most overrepresented in the field of ‘Education Science’. They are almost one and a half times as likely as average students with disabilities to study in this field.
◊ In comparison to other students with disabilities, those in the Physical Disability category are also significantly underrepresented in the fields of ‘Computing’ and ‘Engineering, Manufacturing and Construction’.
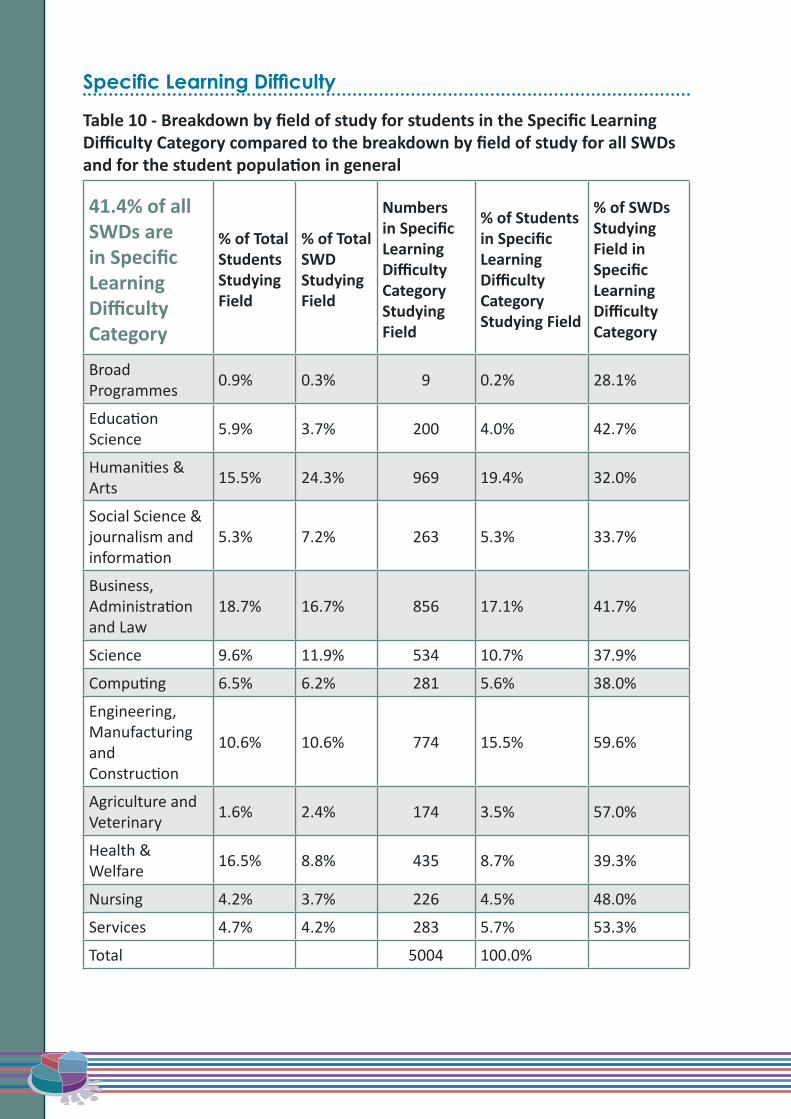
Specific Learning Difficulty
Table 10 - Breakdown by field of study for students in the Specific Learning Difficulty Category compared to the breakdown by field of study for all SWDs and for the student population in general
41.4% of all SWDs are in Specific Learning Difficulty Category
% of Total Students Studying Field
% of Total SWD Studying Field
Numbers in Specific Learning Difficulty Category Studying Field
% of Students in Specific Learning Difficulty Category Studying Field
% of SWDs Studying Field in Specific Learning Difficulty Category
Broad Programmes 0.9% 0.3% 9 0.2% 28.1%
Education Science 5.9% 3.7% 200 4.0% 42.7%
Humanities & Arts 15.5% 24.3% 969 19.4% 32.0%
Social Science & journalism and information
5.3% 7.2% 263 5.3% 33.7%
Business, Administration and Law
18.7% 16.7% 856 17.1% 41.7%
Science 9.6% 11.9% 534 10.7% 37.9%
Computing 6.5% 6.2% 281 5.6% 38.0%
Engineering, Manufacturing and Construction
10.6% 10.6% 774 15.5% 59.6%
Agriculture and Veterinary 1.6% 2.4% 174 3.5% 57.0%
Health & Welfare 16.5% 8.8% 435 8.7% 39.3%
Nursing 4.2% 3.7% 226 4.5% 48.0%
Services 4.7% 4.2% 283 5.7% 53.3%
Total 5004 100.0%
49
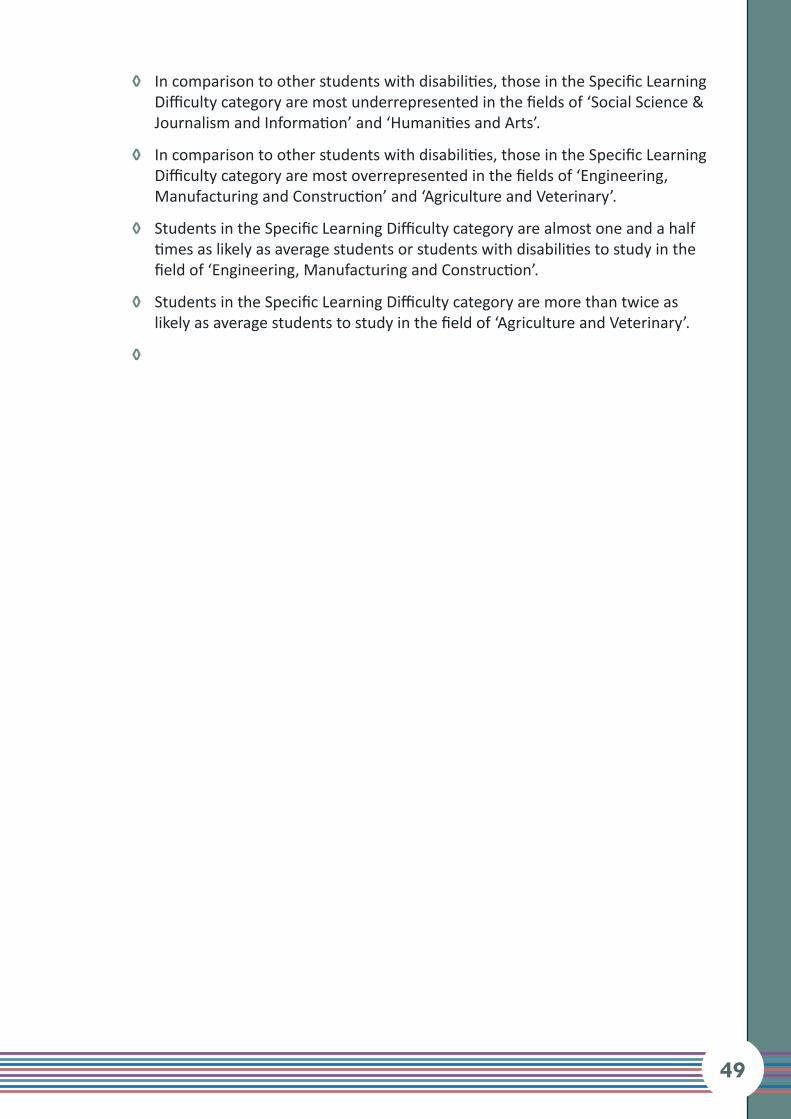
◊ In comparison to other students with disabilities, those in the Specific Learning Difficulty category are most underrepresented in the fields of ‘Social Science & Journalism and Information’ and ‘Humanities and Arts’.
◊ In comparison to other students with disabilities, those in the Specific Learning Difficulty category are most overrepresented in the fields of ‘Engineering, Manufacturing and Construction’ and ‘Agriculture and Veterinary’.
◊ Students in the Specific Learning Difficulty category are almost one and a half times as likely as average students or students with disabilities to study in the field of ‘Engineering, Manufacturing and Construction’.
◊ Students in the Specific Learning Difficulty category are more than twice as likely as average students to study in the field of ‘Agriculture and Veterinary’.
◊
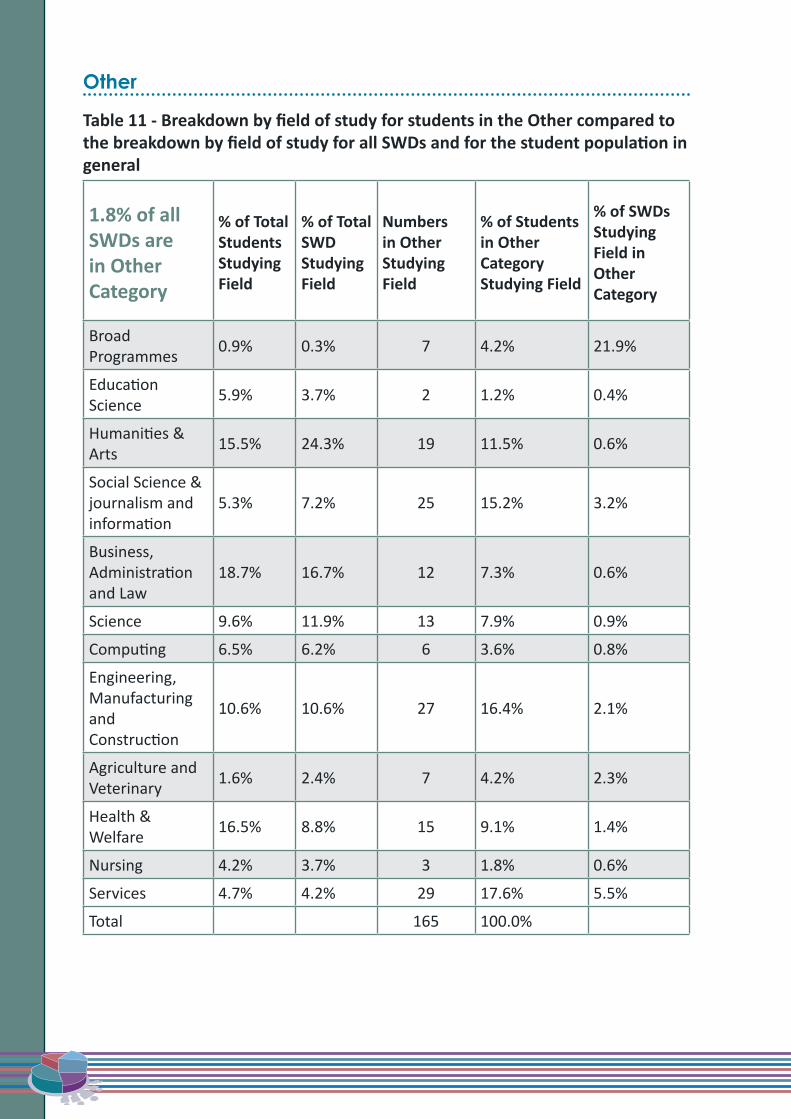
Other
Table 11 - Breakdown by field of study for students in the Other compared to the breakdown by field of study for all SWDs and for the student population in general
1.8% of all SWDs are in Other Category
% of Total Students Studying Field
% of Total SWD Studying Field
Numbers in Other Studying Field
% of Students in Other Category Studying Field
% of SWDs Studying Field in Other Category
Broad Programmes 0.9% 0.3% 7 4.2% 21.9%
Education Science 5.9% 3.7% 2 1.2% 0.4%
Humanities & Arts 15.5% 24.3% 19 11.5% 0.6%
Social Science & journalism and information
5.3% 7.2% 25 15.2% 3.2%
Business, Administration and Law
18.7% 16.7% 12 7.3% 0.6%
Science 9.6% 11.9% 13 7.9% 0.9%
Computing 6.5% 6.2% 6 3.6% 0.8%
Engineering, Manufacturing and Construction
10.6% 10.6% 27 16.4% 2.1%
Agriculture and Veterinary 1.6% 2.4% 7 4.2% 2.3%
Health & Welfare 16.5% 8.8% 15 9.1% 1.4%
Nursing 4.2% 3.7% 3 1.8% 0.6%
Services 4.7% 4.2% 29 17.6% 5.5%
Total 165 100.0%

51
Exam AccommodationsIn the survey, institutions were asked to detail the number of students with disabilities receiving exam accommodations. Responding institutions provided information on the type and number of accommodations students with disabilities received in the academic year 2016/2017. The results found that 10397 students with disabilities received one or more exam accommodations within this term, representing 82% of all students with disabilities in the responding institutions, up from 81% (9121 students) on the previous year.

Exam Accommodations by Disability Category
Of all the categories of disability, the Specific Learning Difficulties category appeared to have the highest proportion of students availing of one or more exam accommodations within 2016/2017, with 90% (4677) of this cohort having received at least one exam accommodation. This is followed by students who are Blind/Visually Impaired, of which 86% (196) received at least one exam accommodation, and those in the ADD/ADHD Category, of which 85% (563) received 1 or more exam accommodation.
The students least likely to have received exam accommodations where those in the Deaf/Hard of Hearing category, of which 67% (225) received one or more exam accommodations). This is followed by the Mental Health category at 69% (1210) and the Significant Ongoing Illness category at 74% (1050). Year on year, the number of exam accommodations provided to students in the Other Category increased by 21%, the highest rise of any category of disability.
Figure 7 - Breakdown of Exam Accommodations received by % of Disability Category received 2016/17
90%86% 85%84%83% 82% 82%
78%74%
69% 67%
0%
10%
20%
30%
40%
50%
60%
70%
80%
90%
100%
Exam Accomodations - % of DisabilityCategory that received Accomodations
2016/17Specific Learning Difficulty
Blind/Visually Impaired
ADD/ADHD
DCD - Dyspraxia/Dysgraphia
Aspergers/Autism
Physical Disability
Other
Neurological/Speech andLanguage
Significant Ongoing Illness
Mental Health Condition
Deaf/Hard of Hearing
53
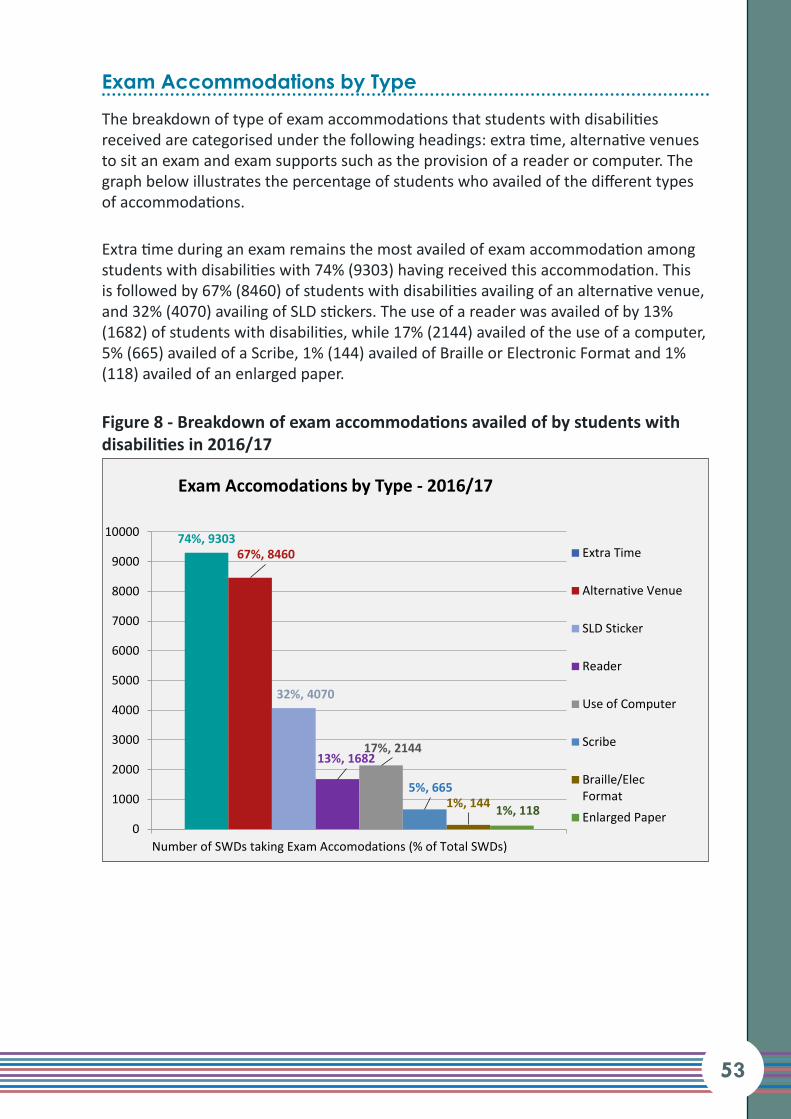
Exam Accommodations by Type
The breakdown of type of exam accommodations that students with disabilities received are categorised under the following headings: extra time, alternative venues to sit an exam and exam supports such as the provision of a reader or computer. The graph below illustrates the percentage of students who availed of the different types of accommodations.
Extra time during an exam remains the most availed of exam accommodation among students with disabilities with 74% (9303) having received this accommodation. This is followed by 67% (8460) of students with disabilities availing of an alternative venue, and 32% (4070) availing of SLD stickers. The use of a reader was availed of by 13% (1682) of students with disabilities, while 17% (2144) availed of the use of a computer, 5% (665) availed of a Scribe, 1% (144) availed of Braille or Electronic Format and 1% (118) availed of an enlarged paper.
Figure 8 - Breakdown of exam accommodations availed of by students with disabilities in 2016/17
74%, 930367%, 8460
32%, 4070
13%, 168217%, 2144
5%, 6651%, 144 1%, 118
0
1000
2000
3000
4000
5000
6000
7000
8000
9000
10000
Number of SWDs taking Exam Accomodations (% of Total SWDs)
Exam Accomodations by Type - 2016/17
Extra Time
Alternative Venue
SLD Sticker
Reader
Use of Computer
Scribe
Braille/ElecFormatEnlarged Paper

In comparison to the previous year, there were a number of significant changes in relation to the type of exam accommodations availed of by students with disabilities. Notably, there was a 25% increase in the number of students with disabilities availing of the use of a computer (1722 in 2015/16) and a 19% increase in the number of students with disabilities availing of an alternative venue (7084 in 2015/16). Meanwhile, there was a decrease of 23% in the number of students with disabilities availing of Braille or an electronic format in comparison to the previous year (188 in 2015/16), and 8% less students availing of readers (1837 in 2015/16).

55
Extra Time Breakdown
Of the 9303 students with disabilities noted as receiving extra time as an exam accommodation, 95% (8867) received an extra 5-10 minutes per hour; 4% (401) received an extra 15 minutes per hour; 0.3% (31) received an extra 20 minutes per hour and 0.04% (4) received more than an extra 20 minutes per hour.
Figure 9 - Number of students with disabilities receiving varying amounts of extra time per hour in examinations 16/17
8867; 95.3%
401; 4.3%31; 0.3%
4; 0.0%
Breakdown of SWDs Receiving Extra Time - % as Total of Those Receiving Extra Time - 2016/17
Extra 5-10 Mins PH
Extra 15 Mins PH
Extra 20 Mins PH
More than Extra 20 MinsPH

Alternative Venue Breakdown
Of the total 8460 students with disabilities who took their examinations in an alternative venue; 4978 (59%) sat their exam in a Large or Low Distraction Venue; 2162 (26%) sat their exam in an individual centre and 1320 (16%) sat their exam in another type of alternative venue.
Figure 10 - Number of students with disabilities who undertook examinations in different types of alternative venue 2016/17
1320, 16%
4978, 59%
2162, 25%
Breakdown of SWDs Taking Exams in Alternative Venues - 2016/17
Individual Centre
Large/Low Distraction
Other

57
Inside the ServiceAHEAD asked responding institutions to provide information about the numbers of staff with responsibility for supporting students with disabilities and the number of learning support staff employed by the responding institutions*. The results indicated that the average number of Students with disabilities per Disability Support Staff was 167; the average number of students per learning support staff member was 475 (an increase of 13 since 15/16); the average students with disabilities per staff member (combined) was 123.
When the breakdown by educational sector is reviewed, respondents from the university sector reported 134 students with disabilities per staff member and the IT sector reported 111 students with disabilities per staff member.
Since the 2011/2012 academic year, AHEAD has found that the overall number of students with a disability per disability officer has increased by 27% (131 in 2011/12 to 167 in 2016/17), while the number of students with a disability per learning support staff member has increased by 49% (319 in 2011/12 to 475 in 2016/17) in the same period.
* Methodology: Responses were delivered as a decimal number where one full time (5 days a week) staff member = 1, and part-time staff members were included as a pro rata fraction of 1. For example, a college with one full time staff member working 5 days a week and one part time staff member working 2 days a week would report 1.4 staff members. Where staff members had shared responsibility over students with disabilities as well as other student groups, they were asked to estimate how much of their remit was dedicated to students with disabilities.
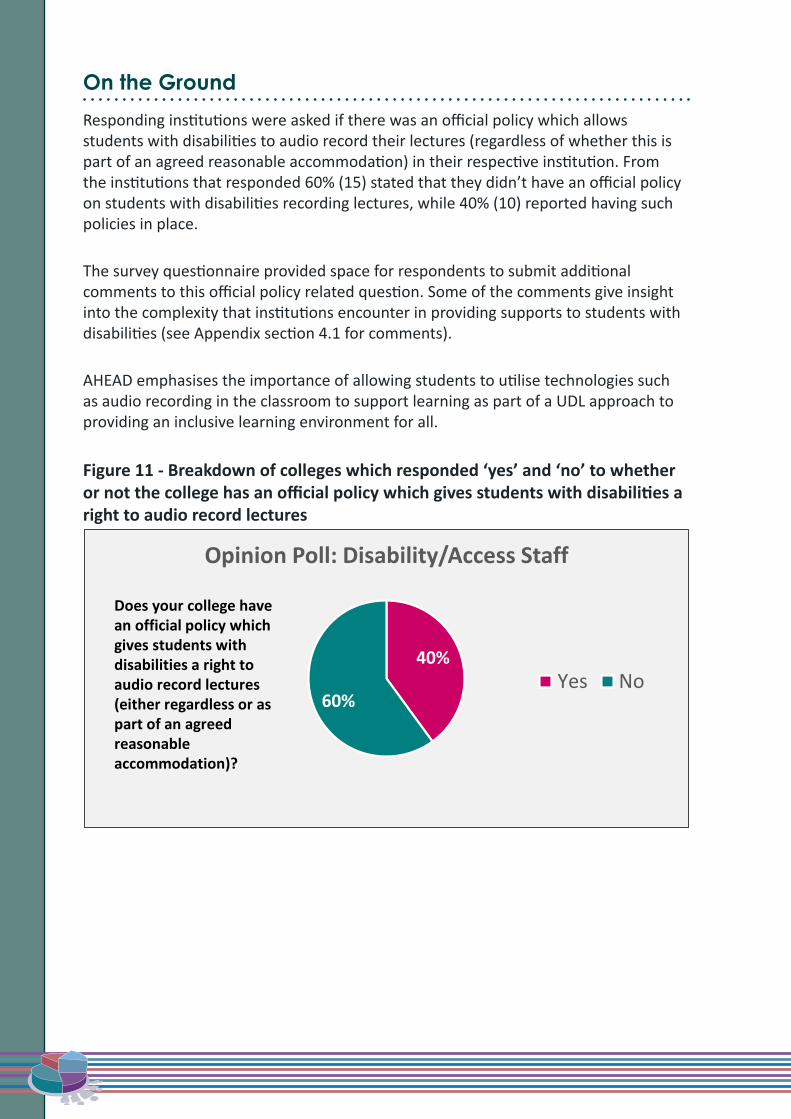
On the GroundResponding institutions were asked if there was an official policy which allows students with disabilities to audio record their lectures (regardless of whether this is part of an agreed reasonable accommodation) in their respective institution. From the institutions that responded 60% (15) stated that they didn’t have an official policy on students with disabilities recording lectures, while 40% (10) reported having such policies in place.
The survey questionnaire provided space for respondents to submit additional comments to this official policy related question. Some of the comments give insight into the complexity that institutions encounter in providing supports to students with disabilities (see Appendix section 4.1 for comments).
AHEAD emphasises the importance of allowing students to utilise technologies such as audio recording in the classroom to support learning as part of a UDL approach to providing an inclusive learning environment for all.
Figure 11 - Breakdown of colleges which responded ‘yes’ and ‘no’ to whether or not the college has an official policy which gives students with disabilities a right to audio record lectures
40%
60%
Opinion Poll: Disability/Access Staff
Yes No
Does your college have an official policy which gives students with disabilities a right to audio record lectures (either regardless or as part of an agreed reasonable accommodation)?

Summary
SummaryAHEAD has identified the following key findings and trends from its review and analysis of the data collected from the responding institutions of higher education on the participation rates of students with disabilities in higher education for the academic year 2016/17.
AN INCREASE IN THE REPRESENTATION OF STUDENTS WITH DISABILITIES
2016/17 marked another year of steady increase in the representation of students with disabilities in higher education. The numbers of students with disabilities in the responding higher education institutions rose 12% year on year to 12,630 and students with disabilities now represent 5.7% of the total student population.
AN UNDER-REPRESENTATION OF STUDENTS WITH DISABILITIES AT POSTGRADUATE LEVEL WHEN COMPARED WITH THEIR PEERS
Over the last five years, our research has shown that students with disabilities are underrepresented at a postgraduate level in higher education in comparison with their peer group. While the number of undergraduates with disabilities grew 14% year on year and represented 5.7% of the total undergraduate population, the number of postgraduates with disabilities actually fell 2% and represented just 2.5% of the total postgraduate sector.
PARTICIPATION ON FULL TIME COURSES SIGNIFICANTLY HIGHER THAN ON PART TIME COURSES
The participation rate of students with disabilities in full time courses (6.6% of the full time student population) was more than 4 times the participation rate in part time courses (1.5%).
SIGNIFICANT INCREASE IN THE NUMBER OF NEW ENTRANTS
3,515 students with disabilities were registered as new entrant undergraduate students, a 14% increase year on year. New entrant undergraduates made up approximately one quarter of the total population of students with disabilities.
61
A QUARTER OF STUDENTS THAT NEWLY REGISTERED WITH THE DISABILITY SERVICES WERE NOT IN THEIR FIRST YEAR OF COLLEGE
25% (1,161) of all new registrations to disability support services were students not in their first year of study.
SIGNIFICANT INCREASE IN NUMBERS OF NEW ENTRANTS WITH ADD/ADHD
The number of new entrants registering in the category of ADD/ADHD was up 70% year on year to 224, representing 6.4% of new entrant students with disabilities.
SIGNIFICANT INCREASE IN THE RATE OF NEW ENTRANTS WITH A WITH A MENTAL HEALTH CONDITION
The number of new entrants registering with disability services as having a mental health condition rose 46% year on year (from 343 to 501). Students in the Mental Health category represented 14.3% of all new entrant students with a disability.
NOTABLE INCREASE IN NUMBER OF STUDENTS WITH DISABILITIES PER STAFF MEMBER SINCE 2011/2012.
There has been a 49% increase in the number of students with disabilities per learning support staff member in the higher education sector since 2011/12. In addition, there was also a 27% increase in the number of students with disabilities per disability support staff member within the same period.
MAJORITY OF COLLEGES HAVE NO OFFICIAL POLICY ON AUDIO RECORDING OF LECTURES
At the time of writing only 40% of participating institutions stated that they had an official policy in place on the recording of lectures by students with disabilities where agreed as a reasonable accommodation. While 60% had no official policy in place, many stated that they operated unwritten practices to facilitate such accommodations.

Recommendations

Recommendations
1. As the population of students with disabilities increases across higher education institutions, it is imperative that these institutions are able to create inclusive environments. In order to accomplish this, it is recommended that HEIs adapt a cross-campus approach to inclusive education and the provision of supports for students with disabilities. The HEA and DES (HEA, 2015) have identified the importance of a holistic approach as part of their principles of the National Access Plan 2015-2019* including making reference to the need for access policies to enhance the quality of learning for all.
2. In order to achieve a holistic approach to the inclusion of students with disabilities, there must be policies and procedures introduced which provide quality learning standards for all students in higher education. AHEAD promotes the framework of Universal Design for Learning (UDL) to help provide educators and policy makers with a blueprint to implement cross-campus initiatives to respond to the ever-diversifying needs of the student populace.
3. Extend the availability of the Fund for Students with Disabilities to students undertaking part-time courses. The Fund for Students with Disabilities recognises the impact disabilities can have on learning and it is imperative that the funding stream be extended to students with disabilities on part-time courses to ensure equality of opportunity. This issue was highlighted in a recent review of the Fund for Students with Disabilities** and it is imperative that the recommendation to extend the fund be implemented without delay.
* National Access Plan (2015-2019, p.16) “the HEA and the DES have drawn on the following fundamental principles in relation to higher education access, participation and completion rates for people in the target groups: (i) Equity of access policies must span the entire education spectrum and take a ‘whole of education’ approach to social inclusion...(viii) Equity of access policies should be mainstreamed into the everyday life of higher education institutions to enhance the quality of the learning experience and progression outcomes for all students” (HEA, 2015).
** Higher Education Authority (2017), Review of the Fund for Students with Disabilities, [Accessed 26th November 2017]

65
4. This report illustrated the high usage of extra time and alternative venues as exam supports for students with disabilities. To help accommodate the growing needs of students with disabilities in their assessments, higher education institutions should consider introducing a broader suite of assessment indicators and instruments as part of periodic review programmes.
5. There has been a noted increase in the number of new entrant students registering with mental health conditions, which warrants further investigation. Other research tallies with the AHEAD research regarding the growing trend of students with a mental health condition participating in higher education. In the interest of ensuring that appropriate provisions are in place to meet this increase, it is imperative that further investigation take place to explore the growth rate and that it is fully understood by the sector. The sharp increase in new entrant numbers in the ADD/ADHD category also warrants further investigation.
6. AHEAD research has found the increasing numbers of students with disabilities over the last 20 years has created escalating demands on student support services, as illustrated by the growing ratio of students per support staff member. In order to best maintain quality of service provision across the higher education sector, AHEAD recommends the professionalisation of the Disability Officer Role.


Bibliography

Bibliography AHEAD (2017), Number of Students with Disabilities Studying in Higher Education in Ireland 2015/16. Dublin: AHEAD Educational Press.
AHEAD (2015), Shaping a Future Where Students with Disabilities Can Succeed - Laying out our Strategy for 2015 – 2018, Dublin: AHEAD Educational Press.
AHEAD (2016), Number of Students with Disabilities Studying in Higher Education in Ireland 2014/15. Dublin: AHEAD Educational Press.
AHEAD (2013), Number of Students with Disabilities Studying in Higher Education in Ireland 2012/13. Dublin: AHEAD Educational Press.
AHEAD (2012), Survey on the Participation Rates of Students with Disabilities in Higher Education in Ireland for the Academic Year 2011/2012. Dublin: AHEAD Educational Press.
AHEAD (2011), Survey on the Participation Rates of Students with Disabilities in Higher Education in Ireland for the Academic Year 2010/2011. Dublin: AHEAD Educational Press.
AHEAD (2010), Survey on the Participation Rates of Students with Disabilities in Higher Education in Ireland for the Academic Year 2009/2010. Dublin: AHEAD Educational Press.
AHEAD (2009), Survey on the Participation Rates of Students with Disabilities in Higher Education in Ireland for the Academic Year 2008/2009. Dublin: AHEAD Educational Press.
AHEAD (2007), Survey on the Participation Rates of Students with Disabilities in Higher Education in Ireland for the Academic Year 2005/2006. Dublin: AHEAD Educational Press.
AHEAD (2004), Survey on the Participation Rates of Students with Disabilities in Higher Education in Ireland for the Academic Year 1998/99. Dublin: AHEAD Educational Press.
AHEAD (1994), Survey on the Participation Rates of Students with Disabilities in Higher Education in Ireland for the Academic Year 1993/94. Dublin: AHEAD Educational Press.
Department of Justice and Equality (2017), National Disability Inclusion Strategy
69
2017-2021, [Accessed 18th October 2017] Available at http://www.justice.ie/en/JELR/Pages/WP17000244
Higher Education Authority (2017), Review of the Fund for Students with Disabilities, [Accessed 26th November 2017] Available at: http://hea.ie/assets/uploads/2017/10/HEA-Review-of-the-Fund-for-Students-with-Disabilities.pdf
Higher Education Authority (2015), National Plan for Equity of Access to Higher Education 2015-2019, [Accessed 18th October 2017] Available at: http://hea.ie/assets/uploads/2017/04/national_plan_for_equity_of_access_to_higher_education_2015-2019_single_page_version_01.pdf
Irish Universities Association (2017), DARE|HEAR: Facts and Figures Report 2017, Dublin.

Appendix
Appendix1.1 Fields of StudyThe fields of study section illustrates a list of subjects which are analysed under each category of disability. This list is sourced from the students statistics provided by the Higher Education Authority and is modified to provide specific insight into numbers studying in key areas such as nursing.
General Programmes
Basic programmes and qualifications
Literacy and numeracy
Personal skills and development
Education
Education not further defined or elsewhere classified
Education science
Training for pre-school teachers
Teacher training without subject specialization
Teacher training with subject specialization
Services
Personal services not further defined or elsewhere classified
Hotel, restaurants and catering
Sports
Travel, tourism and leisure
Occupational health and safety
Military and defence
Protection of persons and property
Transport services

73
Arts and humanities
Arts not further defined or elsewhere classified
Audio-visual techniques and media production
Fashion, interior and industrial design
Fine arts
Handicrafts
Music and performing arts
Humanities (except languages) not further defined or elsewhere classified
Religion and theology
History and archaeology
Philosophy and ethics
Languages not further defined or elsewhere classified
Language acquisition
Literature and linguistics
Interdisciplinary programmes and qualifications involving arts and humanities
Social sciences, journalism and information
Social and behavioural sciences not further defined or elsewhere classified
Economics
Political sciences and civics
Psychology
Sociology and cultural studies
Journalism and information not further defined or elsewhere classified
Journalism and reporting
Library, information and archival studies
Interdisciplinary programmes and qualifications involving social sciences, journalism and information

Business, administration and law
Business and administration not further defined or elsewhere classified
Accounting and taxation
Finance, banking and insurance
Management and administration
Marketing and advertising
Secretarial and office work
Wholesale and retail sales
Work skills
Law
Interdisciplinary programmes and qualifications involving business, administration and law
Natural sciences, mathematics and statistics
Biological and related sciences not further defined or elsewhere classified
Biology
Biochemistry
Environment not further defined or elsewhere classified
Environmental sciences
Natural environments and wildlife
Physical sciences not further defined or elsewhere classified
Chemistry
Earth sciences
Physics
Mathematics and statistics not further defined or elsewhere classified
Mathematics
Statistics
Interdisciplinary programmes and qualifications involving natural sciences, mathematics and statistics
75
Information and Communication Technologies (ICTs)
Information and Communication Technologies (ICTs) not further defined or elsewhere classified
Computer use
Database and network design and administration
Software and applications development and analysis
Interdisciplinary programmes and qualifications involving Information and Communication Technologies (ICTs)
Engineering, manufacturing and construction
Engineering and engineering trades not further defined or elsewhere classified
Chemical engineering and processes
Environmental protection technology
Electricity and energy
Electronics and automation
Mechanics and metal trades
Motor vehicles, ships and aircraft
Manufacturing and processing not further defined or elsewhere classified
Food processing
Materials (glass, paper, plastic and wood)
Textiles (clothes, footwear and leather)
Architecture and construction not further defined or elsewhere classified
Architecture and town planning
Building and civil engineering
Interdisciplinary programmes and qualifications involving engineering, manufacturing and construction
Agriculture, forestry, fisheries and veterinary
Crop and livestock production
Horticulture
Agriculture not further defined or elsewhere classified
Forestry
Veterinary
Interdisciplinary programmes and qualifications involving agriculture, forestry, fisheries and veterinary
Health and welfare
Health not further defined or elsewhere classified
Dental studies
Medicine
Nursing and midwifery
Medical diagnostic and treatment technology
Therapy and rehabilitation
Pharmacy
Traditional and complementary medicine and therapy
Welfare not further defined or elsewhere classified
Care of the elderly and of disabled adults
Child care and youth services
Social work and counselling
Interdisciplinary programmes and qualifications involving health and welfare

77
2.1 Number of students with disabilities studying within each responding higher education institution
Institution Total Students with Disabilities
SWD as a % of total student pop-ulation
UCD 1314 4.57%UCC 1330 6.9%NUIG 762 4.4%TCD 1364 7.7%MU 702 5.7%DCU 753 4.4%UL 700 4.6%MIC 116 2.4%MIE 40 4.7%NCAD 114 9.4%RCSI 70 1.5%St Angela's 47 4.0% AIT 338 7.0%CIT 705 7.8%DIT 1356 6.8%DLIADT 236 10.2%DKIT 254 4.9%ITB 199 5.7%ITS 407 6.7%ITT 167 3.2%ITTRA 299 9.9%LYIT 234 5.9%LIT 484 9.1%NCI 185 3.8%WIT 454 5.5%University Total 7312 5.2%Other Total 5318 6.5%Overall total 12630 5.7%

3.1 Inside the Service CommentsComments from responding institutions relating to the question detailing numbers of disability and learning support staff they have employed in 16’/’17. Any information which may identify a particular institution has been redacted since these comments were agreed to be reproduced anonymously;
-[Responding institution] also has a student learning service which is open to all students including disability students.
-Education support workers - approximately 24 hours per week to support the Access/Disability service. Academic Learning centre - referrals from Access/Disability to this separate support service.
-Access Officer with overall responsibility of Access Service - pre-entry, post entry, disability, outreach etc.
-All staff are available to students five days a week but have other allocated duties.
-The Disability and Learning Support Tutor is employed 17.5 hours weekly - 7 hours learning support and 10.5 hours Disability officer work, 10 months contract. The Student services officer completes the financial returns for the Fund for Students with Disabilities
-‘…Includes 1 disability officer, one AT tutor/Alt Formatter, and one part time AT tutor’
-The DSS has four full time staff members (one is Learning Support) and two Learning Support Tutors that work 10 hours per week.
-Includes 2 x Assistive Technology Officers
-National Learning Network provides learning support for students referred by [Responding Institution].
79
4.1 On the Ground CommentsComments from respondents relating to whether the institution had a policy on the use of recording devices for students with disabilities in lectures. Any information which may identify a particular institution has been redacted since these comments were agreed to be reproduced anonymously;
• In [Institution] if a Reasonable Accommodation is deemed necessary by a Needs Assessment process then it must be provided when requested by the student. Occasionally students contact us when a staff member refuses to provide an accommodation e.g. to provide exam accommodations for a class test, to provide lecture notes or to refuse recording. In all cases to date these cases have been resolved with the student ultimately being granted the accommodation. Sometimes this has required approaching the Head of School. We have occasionally had to seek support from the legal office who have agreed that when an accommodation is recommended by the Disability Service it must be provided and this is not at the discretion of the relevant lecturer. In cases where a lecturer does not want a student to record a lecture we request that they provide an alternative e.g. very detailed notes/transcript of the lecture or a pre-recorded version of the lecture (this can be helpful where there is likely to be class discussion which should not be recorded).
• As part of the needs assessment students will be given recording equipment such as a smart pen/dictaphone. The majority of lectures have no issue with letting the student record in class. In a couple of very individual cases there has been an issue. Currently the Disability Support Service is working … to develop a university policy to address the issue.
• There is no official policy. Students registered with the Disability Office are loaned or approved for the use of recording devices once they agree to adhere to a Responsible Usage Agreement. This agreement requires students to request permission from speakers in lecture situations in advance of recording them. It also requires them to request permission from everyone in a group to record tutorials/labs. And it requires them to retain any multimedia for their own purposes. We have not had many difficulties with lecturing staff refusing permission for their lectures to be recorded.
• No lecturer has ever refused to allow recording in class but there is often a difficulty with tutorials where other students may not want to be recorded, so sometimes a note taker would need to be used. Some module leaders are now allowing all students to record if they wish.
• Recording recommended where identified as part of needs assessment. Recommendation usually complied with by relevant lecturers.

• There has never been an issue for any student that has requested to record a lecture.
• We have no official policy on recording devices as yet, although our students ask the lecturer’s permission to use recording devices in lectures. To date, no lecturer has refused permission to record a lecture.
• [Institution] have had a recording policy in place since 2012. In some instances lecturers may refuse to allow a student to record if sensitive material is being discussed or in some tutorials. They aim to provide an alternative support in these instances, such as additional reading material.
• To date, we have not had many lecturers that have not permitted recording devices in class and if they have it has been for several reasons: they feel it is not appropriate to record the content of the particular module due to students sharing experiences etc., they have offered another reasonable accommodation in its place e.g. notes by email, or they have concerns about where the recorded materials are kept and who has access to them. The [Responding Institution] make it clear as to what the procedures are and students have to sign an agreement, as well as staff. More work needs to be done with HR in the coming year with regard to Intellectual Property and ascertaining whether the lecturers has this or if the college itself has it. Once this has been established we will have more information as to how to proceed with the Recording of Lectures in the future. We do always say to the lecturers that any student could be recording them on any recording device without their knowledge in class, or without their permission, and we are trying to ensure that there are some boundaries and rules around … students and their recordings. Most lecturers to date have not had issue but we have had some enquiries and refusals but in each case another reasonable accommodation was offered, to the best of our knowledge - we do need to ask ourselves if this is good enough or if the student SHOULD have the CHOICE.
• At present, [Institution] does not have a official policy which allows registered students the right to audio record lectures. This is something [Institution] is working towards including for 2017/2018.
• We do not have an official policy. Students who are entitled to record lectures have this stated in their learning agreement which is sent to all academic heads who forward to lecturers. Students sign an agreement with the Disability office with regard to appropriate use of recordings. Each year we encounter problems with a small number of lecturers who refuse to allow students use recording devices in lectures. The lecturers have quoted TUI guidelines as a reason for not allowing recordings.
• Reluctance by some academic staff in relation to recording devices being used
81
in class: Sensitive and confidential Information being discussed in humanities courses. Also other students would be reluctant to take part in discussions if it was felt that the recording may end up on social media.
• Currently working on new policies around the use of recording devices for lectures. The recording of lectures is not welcomed by some lecturing staff.
• In general lecturers are quite open to students using recording devices which are mainly LiveScribe pens. However, some of the lecturers employed for a long period of time are more reluctant to change.
• 1. Identified through needs assessment 2. Included in ILR Document circulated to lecturers. 3. Student signs off on recording policy. 4. Student seeks permission from lecturer in advance of class.
• We do not have an official policy, but recording of lectures is recommended when appropriate for the student’s needs. Generally there is no difficulty. On a few occasions, lecturers have queried why this support is necessary and once they understand the reasoning behind it, they have no issue. Students sign confidentiality agreements for recording which clarify the terms of use.
• Students who receive a recording device from the AT officer sign a agreement re: recording of lectures. Only students who have signed the agreement have permission to record lecturers.
• It is the policy of [The Responding Institution] to provide equal opportunities for all staff and students and accordingly it is fully committed to the principles established in the Equal Status Act 2000-2012 and the Disability Act 2005
• This Policy is adopted to ensure that both staff and students of the Institute are aware of their rights and obligations in respect of recording oral/visual presentations using Institute approved devices i.e. recording devices (as defined below)
• This policy applies to all lecturing staff and students.
• The lecturer or presenter will be informed by the Disability Office in advance that the specific student has been permitted by the Institute to record the specific presentations due to a disability. The lecturer/presenter will not be given details of the specific disability without the student’s permission. In order to respect the right to privacy of other students, the lecturer/presenter will be required to inform the audience attending the specific presentation that it is being recorded, but without disclosing the identity of the student who is recording.
• In order to use the recording device, the student must be officially registered with the Disability Office.
• The student must have read and accepted the Institute’s Code of Practice of the Disability Office before they can be issued with the recording device.
• The student must attend mandatory I.T. evaluation/ training to enable them to access lecture recordings.
• The student should understand and accept that lectures are an irreplaceable part of module delivery and must be present at lectures.
• The student must agree that the recordings of lectures are for their personal use only and must not be reproduced or passed on or made available to anyone else.
• The student should understand that access to the lecture material in alternative format is to create a personal record of the content for revision purposes and is not to be relied upon as the only record of the lecture.
• The student must destroy all recordings at the end of their course.
• The student will be made aware that the technology may fail on rare occasions. If such an event occurs, and there are insufficient notes available on Moodle, it is the student’s responsibility to make alternative arrangements with the lecturer.
• The student must understand that in some cases (such as in smaller classes or tutorials), the recording of classes may be prohibited at the discretion of the lecturer/tutor where the content of the class involves personal discussion and/or self-disclosure. When an objection to record the lesson is made by the lecturer, a substantial, reasonable accommodation must be provided in lieu. For example, lecture notes provided in an electronic format to the approved student.
• The student must inform the lecturer that they have approval from the disability office to use the recording device.
• The student must accept that the content of the lectures, and the delivery thereof, are for the student’s use for learning purposes only and cannot be reproduced outside of [ the responding Institution] for any reason.

83
01 - 7164396 www.ahead.ie @aheadireland /ahead.ie /ahead-ireland-