numbers, facts and trends shaping the … facts and trends shaping the world . 1 ... science...
TRANSCRIPT
FOR RELEASE FEB. 3, 2016
FOR MEDIA OR OTHER INQUIRIES:
Alan Cooperman, Director of Religion Research
Gregory A. Smith, Associate Director, Research
Besheer Mohamed, Senior Researcher
Anna Schiller, Communications Manager
202.419.4372
www.pewresearch.org
RECOMMENDED CITATION: Pew Research Center, Feb. 3, 2016, “Republicans Prefer Blunt Talk About Islamic Extremism, Democrats
Favor Caution”
NUMBERS, FACTS AND TRENDS SHAPING THE WORLD
1
PEW RESEARCH CENTER
www.pewresearch.org
About Pew Research Center
Pew Research Center is a nonpartisan fact tank that informs the public about the issues, attitudes
and trends shaping America and the world. It does not take policy positions. The Center conducts
public opinion polling, demographic research, content analysis and other data-driven social
science research. It studies U.S. politics and policy; journalism and media; internet, science and
technology; religion and public life; Hispanic trends; global attitudes and trends; and U.S. social
and demographic trends. All of the Center’s reports are available at www.pewresearch.org. Pew
Research Center is a subsidiary of The Pew Charitable Trusts, its primary funder.
© Pew Research Center 2016
2
PEW RESEARCH CENTER
www.pewresearch.org
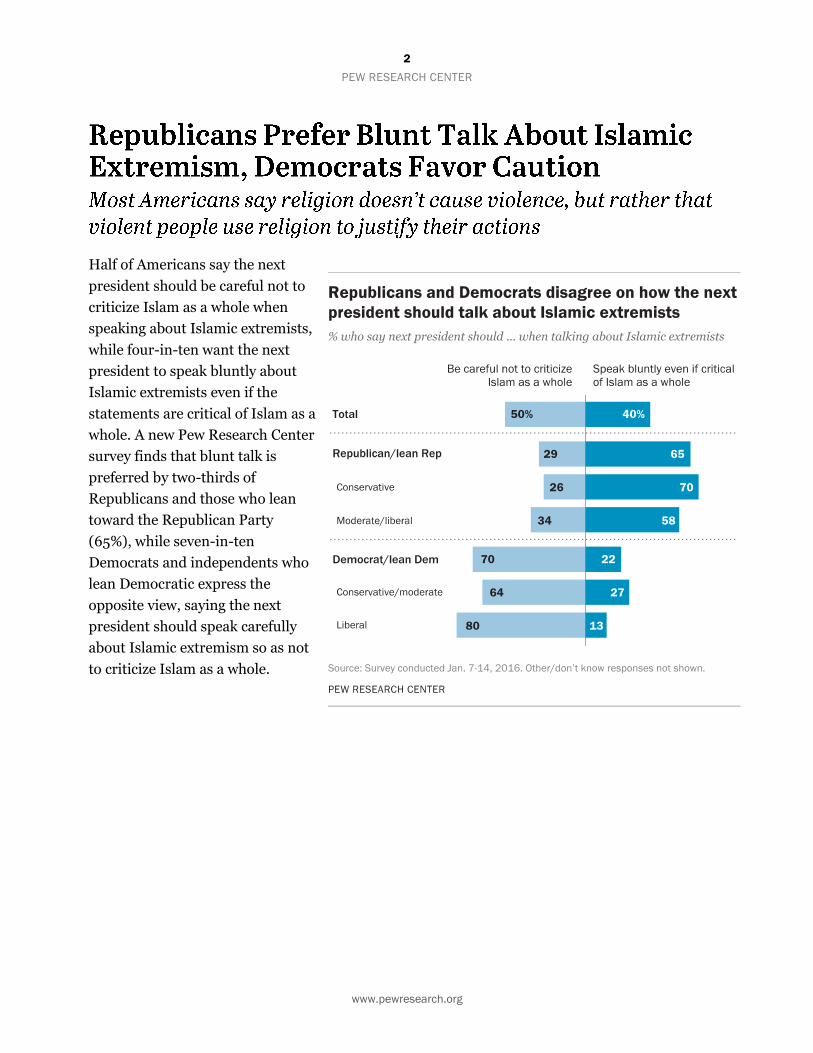
Half of Americans say the next
president should be careful not to
criticize Islam as a whole when
speaking about Islamic extremists,
while four-in-ten want the next
president to speak bluntly about
Islamic extremists even if the
statements are critical of Islam as a
whole. A new Pew Research Center
survey finds that blunt talk is
preferred by two-thirds of
Republicans and those who lean
toward the Republican Party
(65%), while seven-in-ten
Democrats and independents who
lean Democratic express the
opposite view, saying the next
president should speak carefully
about Islamic extremism so as not
to criticize Islam as a whole.
3
PEW RESEARCH CENTER
www.pewresearch.org
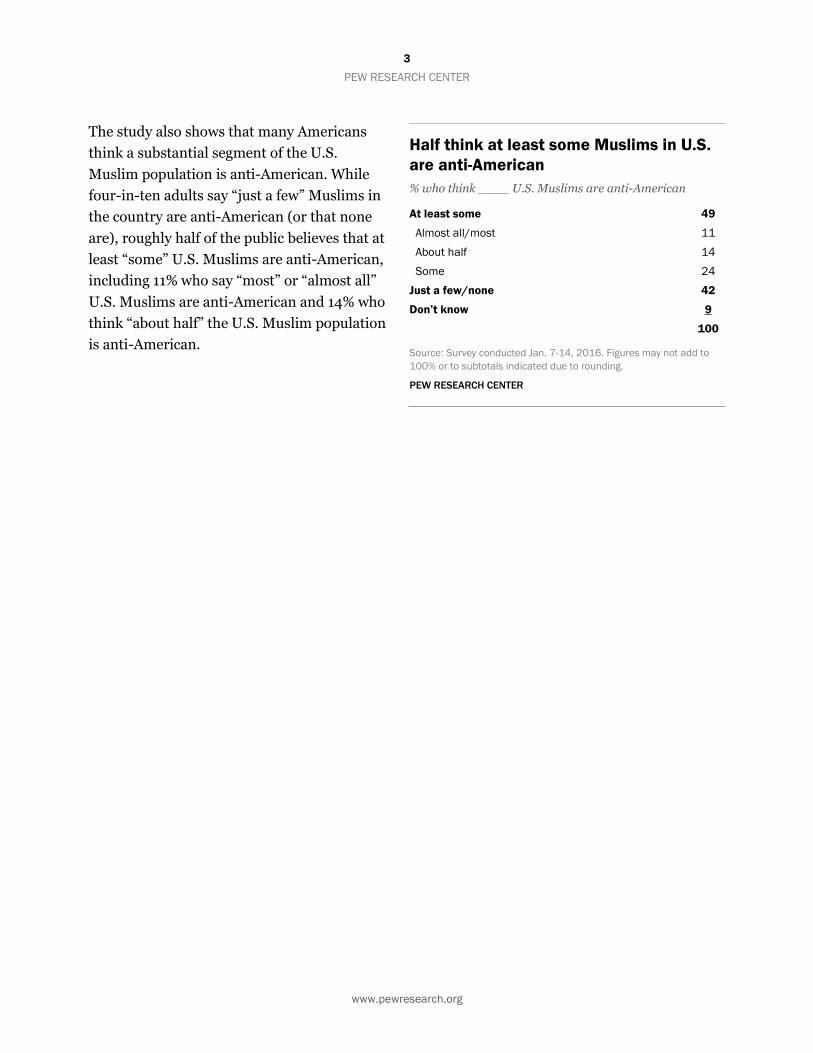
The study also shows that many Americans
think a substantial segment of the U.S.
Muslim population is anti-American. While
four-in-ten adults say “just a few” Muslims in
the country are anti-American (or that none
are), roughly half of the public believes that at
least “some” U.S. Muslims are anti-American,
including 11% who say “most” or “almost all”
U.S. Muslims are anti-American and 14% who
think “about half” the U.S. Muslim population
is anti-American.
Half think at least some Muslims in U.S.
are anti-American
% who think ____ U.S. Muslims are anti-American
At least some 49
Almost all/most 11
About half 14
Some 24
Just a few/none 42
Don’t know 9
100
Source: Survey conducted Jan. 7-14, 2016. Figures may not add to
100% or to subtotals indicated due to rounding.
PEW RESEARCH CENTER
4
PEW RESEARCH CENTER
www.pewresearch.org
The new findings come on the heels of a
separate Pew Research Center survey
conducted in December 2015, which found
that 46% of Americans think Islam is more
likely than other religions to encourage
violence and that a similar share (49%) say
they are “very concerned” about the rise of
Islamic extremism in the U.S.
While many Americans are concerned about
Islamic extremism, the new survey shows that
most people think the problem with violence
committed in the name of religion is people
rather than with religion per se. Indeed, fully
two-thirds of Americans say the bigger
problem is that some violent people use
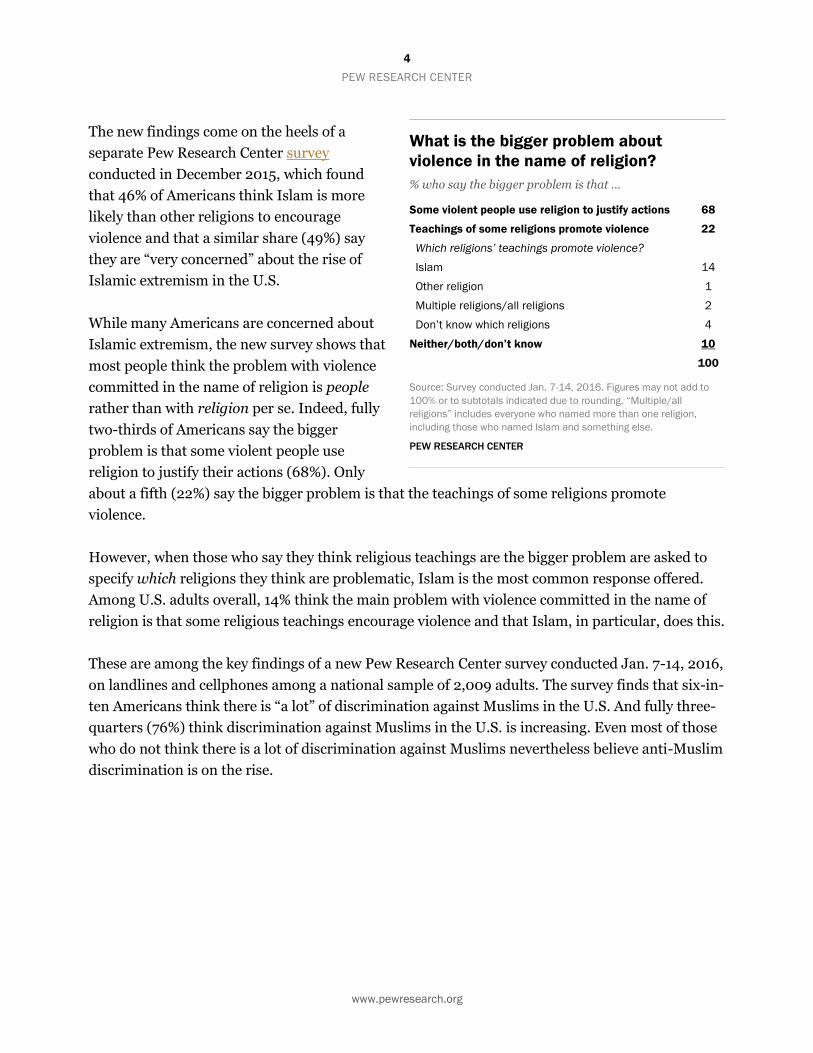
religion to justify their actions (68%). Only
about a fifth (22%) say the bigger problem is that the teachings of some religions promote
violence.
However, when those who say they think religious teachings are the bigger problem are asked to
specify which religions they think are problematic, Islam is the most common response offered.
Among U.S. adults overall, 14% think the main problem with violence committed in the name of
religion is that some religious teachings encourage violence and that Islam, in particular, does this.
These are among the key findings of a new Pew Research Center survey conducted Jan. 7-14, 2016,
on landlines and cellphones among a national sample of 2,009 adults. The survey finds that six-in-
ten Americans think there is “a lot” of discrimination against Muslims in the U.S. And fully three-
quarters (76%) think discrimination against Muslims in the U.S. is increasing. Even most of those
who do not think there is a lot of discrimination against Muslims nevertheless believe anti-Muslim
discrimination is on the rise.
What is the bigger problem about
violence in the name of religion?
% who say the bigger problem is that …
Some violent people use religion to justify actions 68
Teachings of some religions promote violence 22
Which religions’ teachings promote violence?
Islam 14
Other religion 1
Multiple religions/all religions 2
Don’t know which religions 4
Neither/both/don’t know 10
100
Source: Survey conducted Jan. 7-14, 2016. Figures may not add to
100% or to subtotals indicated due to rounding. “Multiple/all
religions” includes everyone who named more than one religion,
including those who named Islam and something else.
PEW RESEARCH CENTER
5
PEW RESEARCH CENTER
www.pewresearch.org
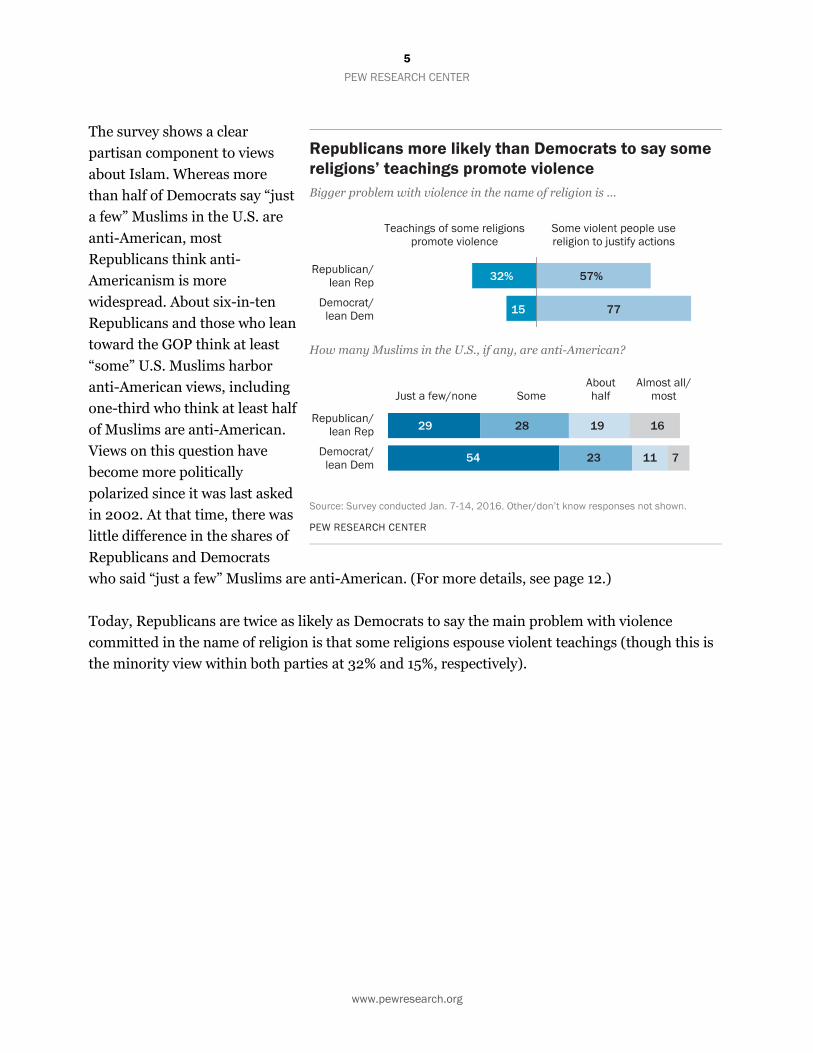
The survey shows a clear
partisan component to views
about Islam. Whereas more
than half of Democrats say “just
a few” Muslims in the U.S. are
anti-American, most
Republicans think anti-
Americanism is more
widespread. About six-in-ten
Republicans and those who lean
toward the GOP think at least
“some” U.S. Muslims harbor
anti-American views, including
one-third who think at least half
of Muslims are anti-American.
Views on this question have
become more politically
polarized since it was last asked
in 2002. At that time, there was
little difference in the shares of
Republicans and Democrats
who said “just a few” Muslims are anti-American. (For more details, see page 12.)
Today, Republicans are twice as likely as Democrats to say the main problem with violence
committed in the name of religion is that some religions espouse violent teachings (though this is
the minority view within both parties at 32% and 15%, respectively).
6
PEW RESEARCH CENTER
www.pewresearch.org
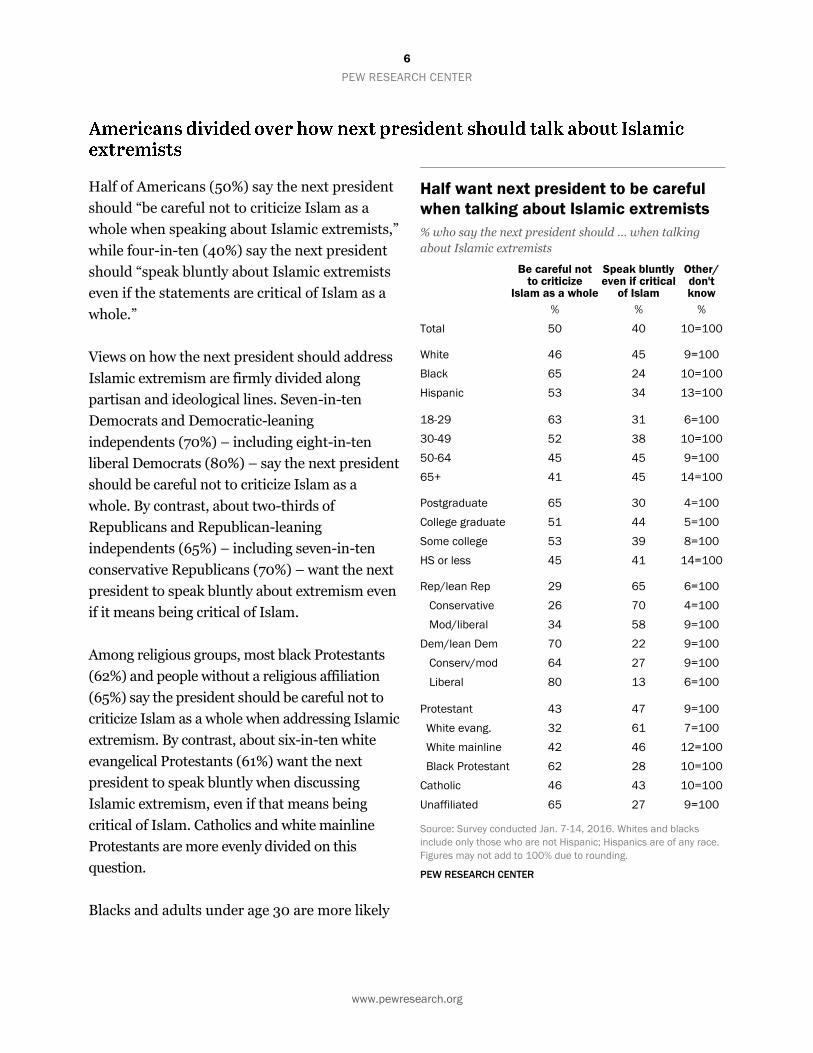
Half of Americans (50%) say the next president
should “be careful not to criticize Islam as a
whole when speaking about Islamic extremists,”
while four-in-ten (40%) say the next president
should “speak bluntly about Islamic extremists
even if the statements are critical of Islam as a
whole.”
Views on how the next president should address
Islamic extremism are firmly divided along
partisan and ideological lines. Seven-in-ten
Democrats and Democratic-leaning
independents (70%) – including eight-in-ten
liberal Democrats (80%) – say the next president
should be careful not to criticize Islam as a
whole. By contrast, about two-thirds of
Republicans and Republican-leaning
independents (65%) – including seven-in-ten
conservative Republicans (70%) – want the next
president to speak bluntly about extremism even
if it means being critical of Islam.
Among religious groups, most black Protestants
(62%) and people without a religious affiliation
(65%) say the president should be careful not to
criticize Islam as a whole when addressing Islamic
extremism. By contrast, about six-in-ten white
evangelical Protestants (61%) want the next
president to speak bluntly when discussing
Islamic extremism, even if that means being
critical of Islam. Catholics and white mainline
Protestants are more evenly divided on this
question.
Blacks and adults under age 30 are more likely
Half want next president to be careful
when talking about Islamic extremists
% who say the next president should … when talking
about Islamic extremists
Be careful not to criticize
Islam as a whole
Speak bluntly even if critical
of Islam
Other/ don't know
% % %
Total 50 40 10=100
White 46 45 9=100
Black 65 24 10=100
Hispanic 53 34 13=100
18-29 63 31 6=100
30-49 52 38 10=100
50-64 45 45 9=100
65+ 41 45 14=100
Postgraduate 65 30 4=100
College graduate 51 44 5=100
Some college 53 39 8=100
HS or less 45 41 14=100
Rep/lean Rep 29 65 6=100
Conservative 26 70 4=100
Mod/liberal 34 58 9=100
Dem/lean Dem 70 22 9=100
Conserv/mod 64 27 9=100
Liberal 80 13 6=100
Protestant 43 47 9=100
White evang. 32 61 7=100
White mainline 42 46 12=100
Black Protestant 62 28 10=100
Catholic 46 43 10=100
Unaffiliated 65 27 9=100
Source: Survey conducted Jan. 7-14, 2016. Whites and blacks
include only those who are not Hispanic; Hispanics are of any race.
Figures may not add to 100% due to rounding.
PEW RESEARCH CENTER
7
PEW RESEARCH CENTER
www.pewresearch.org
than whites and older adults to prefer the next president take care not to criticize Islam as a whole.
The survey also finds that roughly two-thirds of Americans with a post-graduate degree want the
next president to be careful not to criticize Islam as a whole when discussing Islamic extremism;
fewer Americans with less education share this perspective.
In addition to addressing how the next president should approach Islamic extremism, the survey
asked Americans what kind of president several of the leading candidates would make if elected –
great, good, average, poor or terrible. (For a complete analysis, see “Voters Skeptical That 2016
Candidates Would Make Good Presidents.”) The data show that among Republican voters who
want the next president to speak bluntly about Islamic extremism even if it means being critical of
Islam (69% of all Republican voters), a solid majority thinks that both Donald Trump (63%) and
Ted Cruz (61%) would be good or great presidents. The possibility of Marco Rubio and Ben Carson
becoming president also is viewed more positively than negatively by Republican voters who
prefer a blunt approach to discussing Islamic extremism. About half say that Carson (47%) or
Rubio (46%) would make either a good or great president.
Among Republican voters, most who favor blunt talk about extremists say Trump,
Cruz would make ‘good’ or ‘great’ presidents
Among Republican and Republican-leaning registered voters who say the next president should … when talking about
Islamic extremists, % who say each candidate would make a ____ president
… speak bluntly even if critical of Islam as a whole (69% of Rep/Rep-leaning voters)
… be careful not to criticize Islam as a whole (26% of Rep/Rep-leaning voters)
NET Great/good Average
NET Terrible/poor
NET Great/good Average
NET Terrible/poor
% % % % % %
Donald Trump 63 18 15 41 15 40
Ted Cruz 61 22 12 38 35 15
Ben Carson 47 31 16 37 27 26
Marco Rubio 46 29 18 42 32 17
Chris Christie 32 36 24 33 29 27
Jeb Bush 25 32 40 28 42 25
John Kasich 18 31 28 15 31 17
Source: Survey conducted Jan. 7-14, 2016. Don’t know/never heard of responses not shown. Based on Republican/Republican-leaning
registered voters.
PEW RESEARCH CENTER
8
PEW RESEARCH CENTER
www.pewresearch.org
Among the much smaller group of GOP voters who would like the next president to be careful not
to criticize Islam when discussing extremism – 26% of all GOP voters – about as many say Donald
Trump would make a poor or terrible president (40%) as say he would make a good or great one
(41%). For Ted Cruz, attitudes among this group of Republican voters are mostly positive (38%
good or great) or average (35%).
Views on whether some other Republican candidates (Chris Christie, Jeb Bush and John Kasich)
would be successful presidents are for the most part mixed regardless of whether blunt talk or
careful speech about Islamic extremism is preferred.
9
PEW RESEARCH CENTER
www.pewresearch.org
When asked their view about violence committed in the name of religion, most Americans (68%)
say the bigger problem is that “some violent people use religion to justify their actions.” Only
about one-in-five (22%) say the bigger problem is that “the teachings of some religions promote
violence.”
The latter group was asked an open ended follow-up question about which religion or religions
promote violence. Islam is the most commonly offered answer; 14% of Americans believe Islam, in
particular, has teachings that promote violence. Far fewer people name Christianity or another
religion (1%). About 2% say that multiple religions (or all religions) encourage violence.
Across major religious groups, half or more say the bigger problem with violence committed in the
name of religion is that some violent people use religion to justify their actions; 55% of white
evangelical Protestants and fully three-quarters of the religiously unaffiliated (76%) express this
view.
Majorities of most partisan and ideological groups say the greater problem with religious violence
is people who use religion to justify it. Among conservative Republicans, however, the balance of
opinion is more divided. While about half (48%) say the bigger problem is violent people using
religion to justify their actions, 39% say some religions have teachings that encourage violence.
This latter group includes fully a third of all conservative Republicans who name Islam as a
religion with teachings that encourage violence.
The survey also shows that younger people and those with higher levels of educational attainment
are more likely than older and less highly educated people to attribute religious violence to
individuals who use religion to justify violent acts.
10
PEW RESEARCH CENTER
www.pewresearch.org
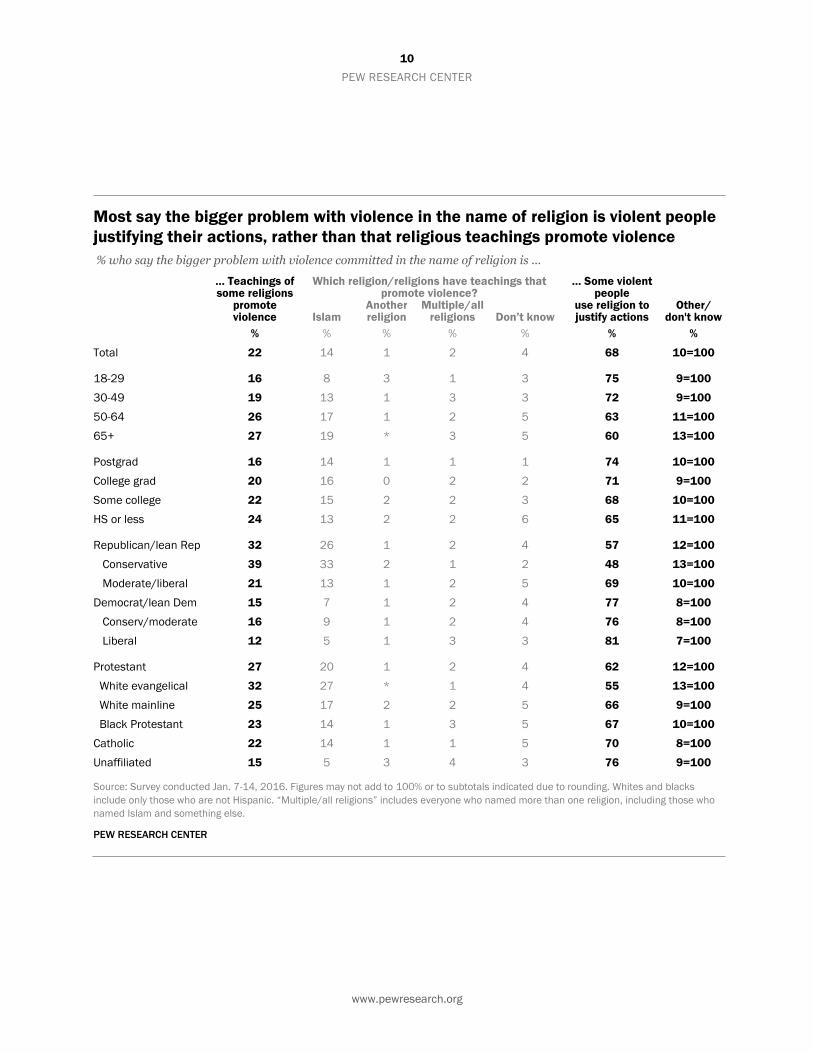
Most say the bigger problem with violence in the name of religion is violent people
justifying their actions, rather than that religious teachings promote violence
% who say the bigger problem with violence committed in the name of religion is ...
… Teachings of some religions
promote violence
Which religion/religions have teachings that promote violence?
… Some violent people
use religion to justify actions
Other/ don't know Islam
Another religion
Multiple/all religions Don’t know
% % % % % % %
Total 22 14 1 2 4 68 10=100
18-29 16 8 3 1 3 75 9=100
30-49 19 13 1 3 3 72 9=100
50-64 26 17 1 2 5 63 11=100
65+ 27 19 * 3 5 60 13=100
Postgrad 16 14 1 1 1 74 10=100
College grad 20 16 0 2 2 71 9=100
Some college 22 15 2 2 3 68 10=100
HS or less 24 13 2 2 6 65 11=100
Republican/lean Rep 32 26 1 2 4 57 12=100
Conservative 39 33 2 1 2 48 13=100
Moderate/liberal 21 13 1 2 5 69 10=100
Democrat/lean Dem 15 7 1 2 4 77 8=100
Conserv/moderate 16 9 1 2 4 76 8=100
Liberal 12 5 1 3 3 81 7=100
Protestant 27 20 1 2 4 62 12=100
White evangelical 32 27 * 1 4 55 13=100
White mainline 25 17 2 2 5 66 9=100
Black Protestant 23 14 1 3 5 67 10=100
Catholic 22 14 1 1 5 70 8=100
Unaffiliated 15 5 3 4 3 76 9=100
Source: Survey conducted Jan. 7-14, 2016. Figures may not add to 100% or to subtotals indicated due to rounding. Whites and blacks
include only those who are not Hispanic. “Multiple/all religions” includes everyone who named more than one religion, including those who
named Islam and something else.
PEW RESEARCH CENTER
11
PEW RESEARCH CENTER
www.pewresearch.org
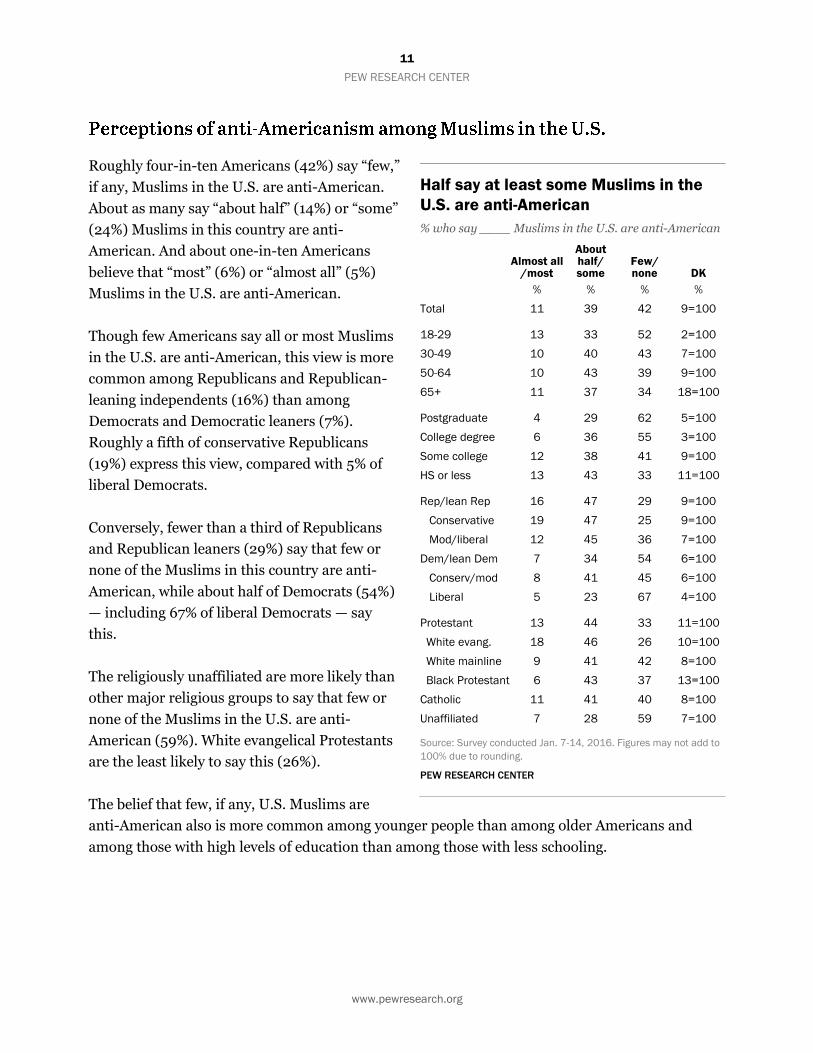
Roughly four-in-ten Americans (42%) say “few,”
if any, Muslims in the U.S. are anti-American.
About as many say “about half” (14%) or “some”
(24%) Muslims in this country are anti-
American. And about one-in-ten Americans
believe that “most” (6%) or “almost all” (5%)
Muslims in the U.S. are anti-American.
Though few Americans say all or most Muslims
in the U.S. are anti-American, this view is more
common among Republicans and Republican-
leaning independents (16%) than among
Democrats and Democratic leaners (7%).
Roughly a fifth of conservative Republicans
(19%) express this view, compared with 5% of
liberal Democrats.
Conversely, fewer than a third of Republicans
and Republican leaners (29%) say that few or
none of the Muslims in this country are anti-
American, while about half of Democrats (54%)
— including 67% of liberal Democrats — say
this.
The religiously unaffiliated are more likely than
other major religious groups to say that few or
none of the Muslims in the U.S. are anti-
American (59%). White evangelical Protestants
are the least likely to say this (26%).
The belief that few, if any, U.S. Muslims are
anti-American also is more common among younger people than among older Americans and
among those with high levels of education than among those with less schooling.
Half say at least some Muslims in the
U.S. are anti-American
% who say ____ Muslims in the U.S. are anti-American
Almost all
/most
About half/ some
Few/ none
DK
% % % %
Total 11 39 42 9=100
18-29 13 33 52 2=100
30-49 10 40 43 7=100
50-64 10 43 39 9=100
65+ 11 37 34 18=100
Postgraduate 4 29 62 5=100
College degree 6 36 55 3=100
Some college 12 38 41 9=100
HS or less 13 43 33 11=100
Rep/lean Rep 16 47 29 9=100
Conservative 19 47 25 9=100
Mod/liberal 12 45 36 7=100
Dem/lean Dem 7 34 54 6=100
Conserv/mod 8 41 45 6=100
Liberal 5 23 67 4=100
Protestant 13 44 33 11=100
White evang. 18 46 26 10=100
White mainline 9 41 42 8=100
Black Protestant 6 43 37 13=100
Catholic 11 41 40 8=100
Unaffiliated 7 28 59 7=100
Source: Survey conducted Jan. 7-14, 2016. Figures may not add to
100% due to rounding.
PEW RESEARCH CENTER
12
PEW RESEARCH CENTER
www.pewresearch.org
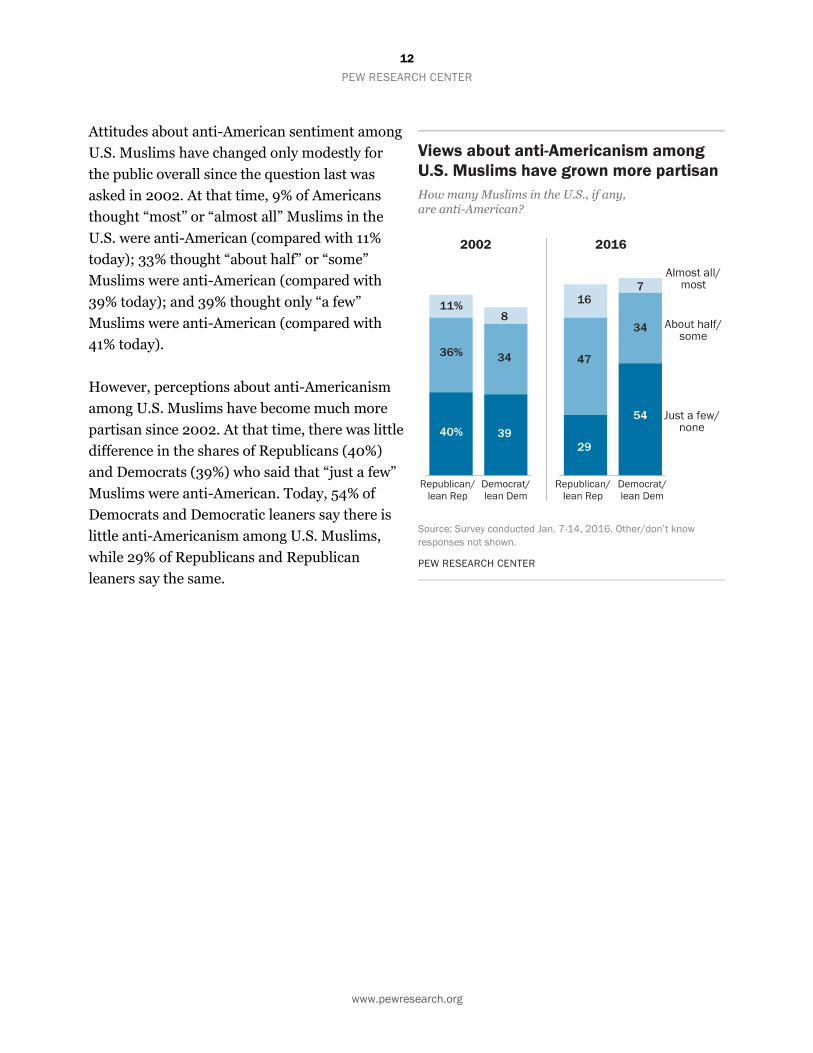
Attitudes about anti-American sentiment among
U.S. Muslims have changed only modestly for
the public overall since the question last was
asked in 2002. At that time, 9% of Americans
thought “most” or “almost all” Muslims in the
U.S. were anti-American (compared with 11%
today); 33% thought “about half” or “some”
Muslims were anti-American (compared with
39% today); and 39% thought only “a few”
Muslims were anti-American (compared with
41% today).
However, perceptions about anti-Americanism
among U.S. Muslims have become much more
partisan since 2002. At that time, there was little
difference in the shares of Republicans (40%)
and Democrats (39%) who said that “just a few”
Muslims were anti-American. Today, 54% of
Democrats and Democratic leaners say there is
little anti-Americanism among U.S. Muslims,
while 29% of Republicans and Republican
leaners say the same.
13
PEW RESEARCH CENTER
www.pewresearch.org
35%
39
27
27
20
35
43
42
52
62
38
22
24
18
42
49
44
28
34
23
59%
55
68
68
79
59
52
48
42
32
58
74
72
78
52
44
50
67
61
73
Total
White
Black
Hispanic
18-29
30-49
50-64
65+
Rep/lean Rep
Conservative
Mod/Liberal
Dem/lean Dem
Conserv/Mod
Liberal
Protestant
White evangelical
White mainline
Black Protestant
Catholic
Unaffiliated
No Yes
Mod/liberal
Conservative
White evangelical
Conserv/mod
Liberal
White mainline
Black Protestant
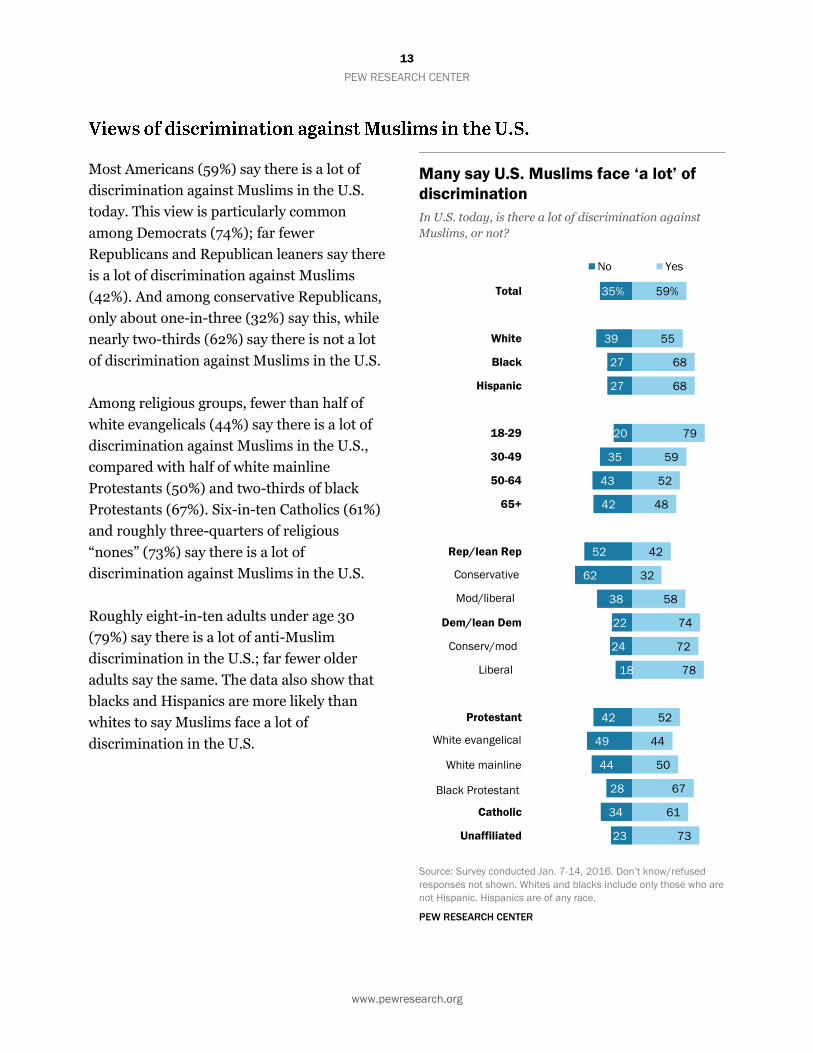
Most Americans (59%) say there is a lot of
discrimination against Muslims in the U.S.
today. This view is particularly common
among Democrats (74%); far fewer
Republicans and Republican leaners say there
is a lot of discrimination against Muslims
(42%). And among conservative Republicans,
only about one-in-three (32%) say this, while
nearly two-thirds (62%) say there is not a lot
of discrimination against Muslims in the U.S.
Among religious groups, fewer than half of
white evangelicals (44%) say there is a lot of
discrimination against Muslims in the U.S.,
compared with half of white mainline
Protestants (50%) and two-thirds of black
Protestants (67%). Six-in-ten Catholics (61%)
and roughly three-quarters of religious
“nones” (73%) say there is a lot of
discrimination against Muslims in the U.S.
Roughly eight-in-ten adults under age 30
(79%) say there is a lot of anti-Muslim
discrimination in the U.S.; far fewer older
adults say the same. The data also show that
blacks and Hispanics are more likely than
whites to say Muslims face a lot of
discrimination in the U.S.
Many say U.S. Muslims face ‘a lot’ of
discrimination
In U.S. today, is there a lot of discrimination against
Muslims, or not?
Source: Survey conducted Jan. 7-14, 2016. Don’t know/refused
responses not shown. Whites and blacks include only those who are
not Hispanic. Hispanics are of any race.
PEW RESEARCH CENTER
14
PEW RESEARCH CENTER
www.pewresearch.org
19%
20
22
15
15
20
23
19
26
30
20
13
15
10
21
21
23
21
20
13
7
40
76%
77
75
78
84
76
74
73
70
66
77
84
83
88
75
75
75
75
75
84
91
56
Total
White
Black
Hispanic
18-29
30-49
50-64
65+
Rep/lean Rep
Conservative
Mod/Liberal
Dem/lean Dem
Conserv/Mod
Liberal
Protestant
White evangelical
White mainline
Black Protestant
Catholic
Unaffiliated
A lot of discrimination
Not a lot
No Yes
Mod/liberal
Conservative
White evangelical
Conserv/mod
Liberal
White mainline
Black Protestant
A lot of discrimination
Not a lot
Muslims face ...
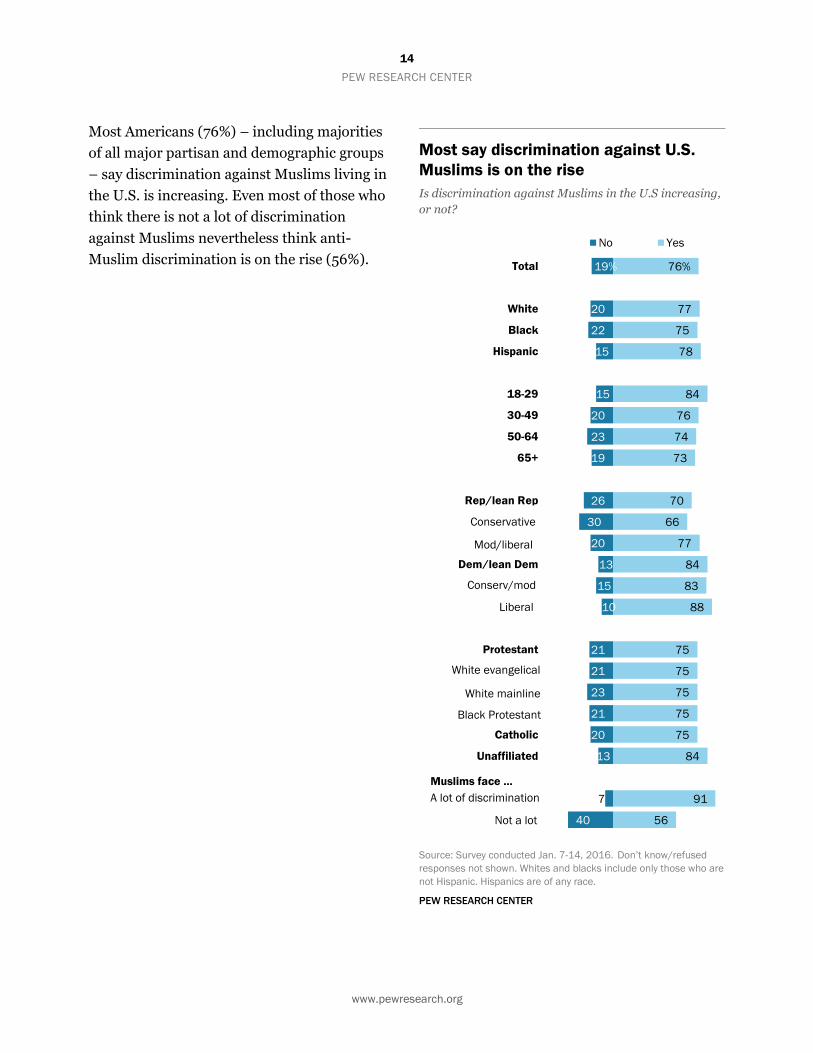
Most Americans (76%) – including majorities
of all major partisan and demographic groups
– say discrimination against Muslims living in
the U.S. is increasing. Even most of those who
think there is not a lot of discrimination
against Muslims nevertheless think anti-
Muslim discrimination is on the rise (56%).
Most say discrimination against U.S.
Muslims is on the rise
Is discrimination against Muslims in the U.S increasing,
or not?
Source: Survey conducted Jan. 7-14, 2016. Don’t know/refused
responses not shown. Whites and blacks include only those who are
not Hispanic. Hispanics are of any race.
PEW RESEARCH CENTER
15
PEW RESEARCH CENTER
www.pewresearch.org
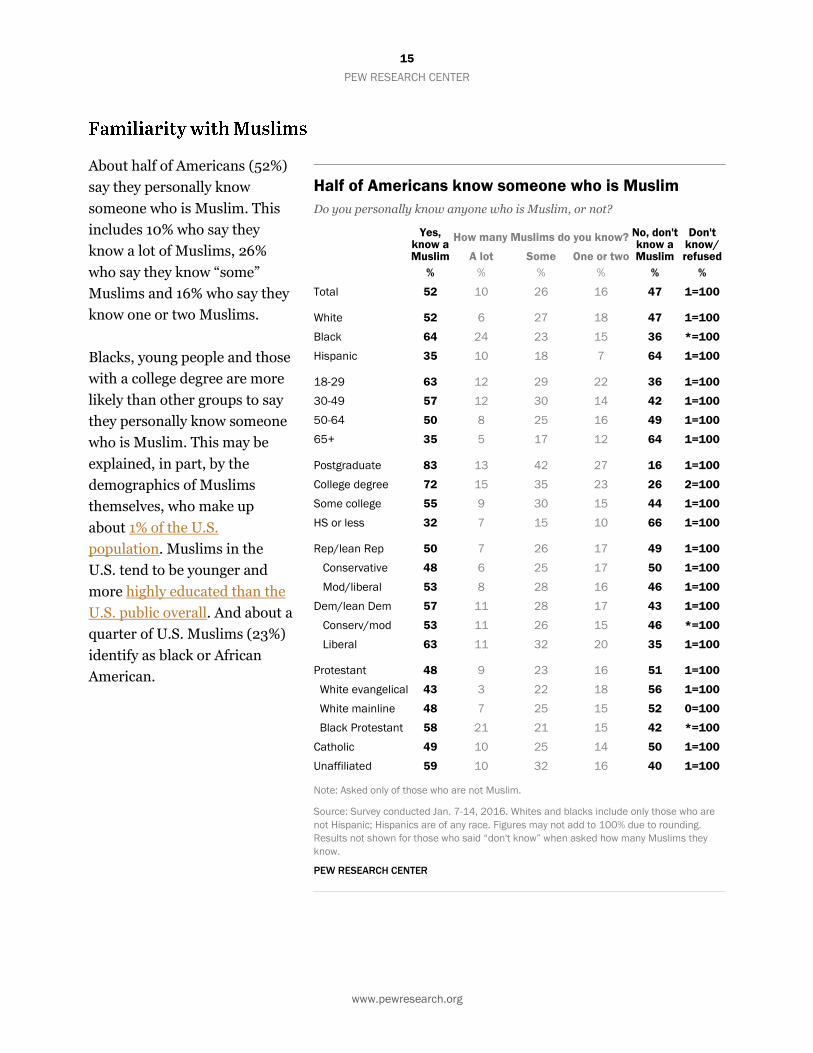
About half of Americans (52%)
say they personally know
someone who is Muslim. This
includes 10% who say they
know a lot of Muslims, 26%
who say they know “some”
Muslims and 16% who say they
know one or two Muslims.
Blacks, young people and those
with a college degree are more
likely than other groups to say
they personally know someone
who is Muslim. This may be
explained, in part, by the
demographics of Muslims
themselves, who make up
about 1% of the U.S.
population. Muslims in the
U.S. tend to be younger and
more highly educated than the
U.S. public overall. And about a
quarter of U.S. Muslims (23%)
identify as black or African
American.
Half of Americans know someone who is Muslim
Do you personally know anyone who is Muslim, or not?
Yes, know a Muslim
How many Muslims do you know? No, don't know a Muslim
Don't know/ refused A lot Some One or two
% % % % % %
Total 52 10 26 16 47 1=100
White 52 6 27 18 47 1=100
Black 64 24 23 15 36 *=100
Hispanic 35 10 18 7 64 1=100
18-29 63 12 29 22 36 1=100
30-49 57 12 30 14 42 1=100
50-64 50 8 25 16 49 1=100
65+ 35 5 17 12 64 1=100
Postgraduate 83 13 42 27 16 1=100
College degree 72 15 35 23 26 2=100
Some college 55 9 30 15 44 1=100
HS or less 32 7 15 10 66 1=100
Rep/lean Rep 50 7 26 17 49 1=100
Conservative 48 6 25 17 50 1=100
Mod/liberal 53 8 28 16 46 1=100
Dem/lean Dem 57 11 28 17 43 1=100
Conserv/mod 53 11 26 15 46 *=100
Liberal 63 11 32 20 35 1=100
Protestant 48 9 23 16 51 1=100
White evangelical 43 3 22 18 56 1=100
White mainline 48 7 25 15 52 0=100
Black Protestant 58 21 21 15 42 *=100
Catholic 49 10 25 14 50 1=100
Unaffiliated 59 10 32 16 40 1=100
Note: Asked only of those who are not Muslim.
Source: Survey conducted Jan. 7-14, 2016. Whites and blacks include only those who are
not Hispanic; Hispanics are of any race. Figures may not add to 100% due to rounding.
Results not shown for those who said “don't know” when asked how many Muslims they
know.
PEW RESEARCH CENTER
16
PEW RESEARCH CENTER
www.pewresearch.org
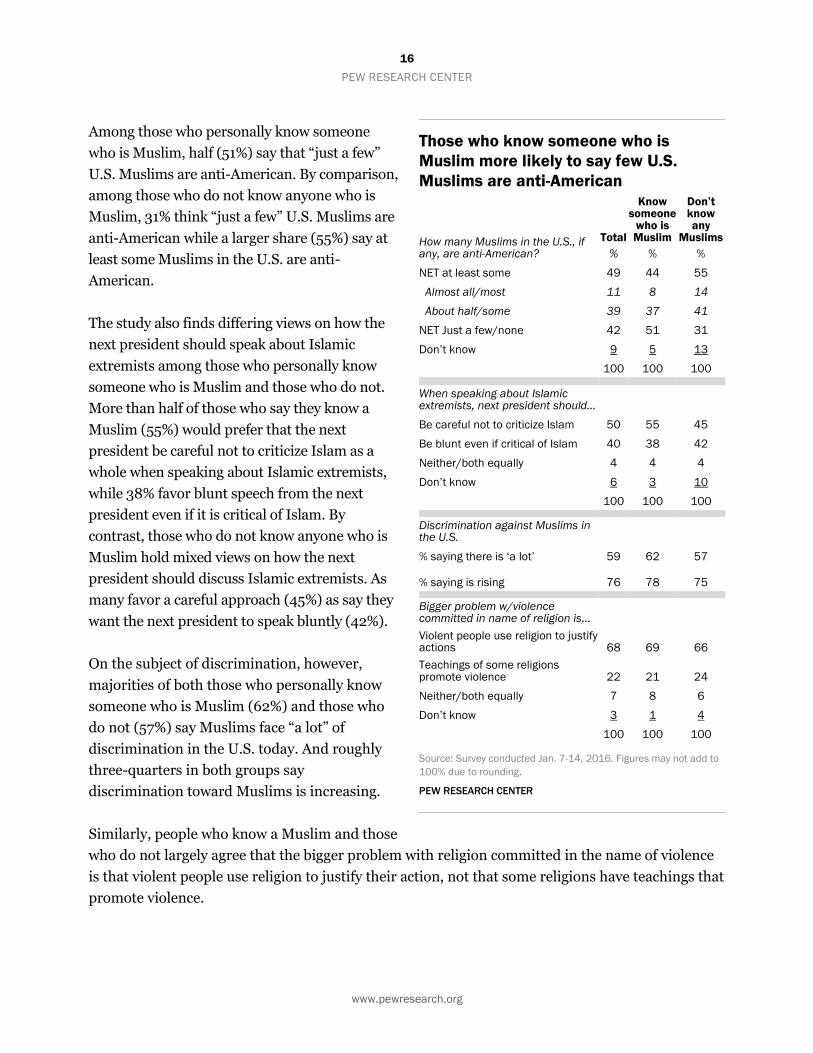
Among those who personally know someone
who is Muslim, half (51%) say that “just a few”
U.S. Muslims are anti-American. By comparison,
among those who do not know anyone who is
Muslim, 31% think “just a few” U.S. Muslims are
anti-American while a larger share (55%) say at
least some Muslims in the U.S. are anti-
American.
The study also finds differing views on how the
next president should speak about Islamic
extremists among those who personally know
someone who is Muslim and those who do not.
More than half of those who say they know a
Muslim (55%) would prefer that the next
president be careful not to criticize Islam as a
whole when speaking about Islamic extremists,
while 38% favor blunt speech from the next
president even if it is critical of Islam. By
contrast, those who do not know anyone who is
Muslim hold mixed views on how the next
president should discuss Islamic extremists. As
many favor a careful approach (45%) as say they
want the next president to speak bluntly (42%).
On the subject of discrimination, however,
majorities of both those who personally know
someone who is Muslim (62%) and those who
do not (57%) say Muslims face “a lot” of
discrimination in the U.S. today. And roughly
three-quarters in both groups say
discrimination toward Muslims is increasing.
Similarly, people who know a Muslim and those
who do not largely agree that the bigger problem with religion committed in the name of violence
is that violent people use religion to justify their action, not that some religions have teachings that
promote violence.
Those who know someone who is
Muslim more likely to say few U.S.
Muslims are anti-American
How many Muslims in the U.S., if any, are anti-American?
Total
Know someone
who is Muslim
Don’t know any
Muslims
% % %
NET at least some 49 44 55
Almost all/most 11 8 14
About half/some 39 37 41
NET Just a few/none 42 51 31
Don’t know 9 5 13
100 100 100
When speaking about Islamic extremists, next president should…
Be careful not to criticize Islam 50 55 45
Be blunt even if critical of Islam 40 38 42
Neither/both equally 4 4 4
Don’t know 6 3 10
100 100 100
Discrimination against Muslims in the U.S.
% saying there is ‘a lot’ 59 62 57
% saying is rising 76 78 75
Bigger problem w/violence committed in name of religion is…
Violent people use religion to justify actions 68 69 66
Teachings of some religions promote violence 22 21 24
Neither/both equally 7 8 6
Don’t know 3 1 4
100 100 100
Source: Survey conducted Jan. 7-14, 2016. Figures may not add to
100% due to rounding.
PEW RESEARCH CENTER
17
PEW RESEARCH CENTER
www.pewresearch.org
Acknowledgments
This report is a collaborative effort based on the input and analysis of the following individuals.
Michael Dimock, President
Claudia Deane, Vice President, Research
Alan Cooperman, Director of Religion Research
Carroll Doherty, Director of Political Research
Gregory A. Smith, Associate Director, Research
Jocelyn Kiley, Associate Director, Research
Besheer Mohamed, Senior Researcher
Jessica Hamar Martínez, Senior Researcher
Alec Tyson, Senior Researcher
Elizabeth Podrebarac Sciupac, Research Associate
Becka A. Alper, Research Associate
Robert Suls, Research Associate
Baxter Oliphant, Research Associate
Claire Gecewicz, Research Assistant
Samantha Smith, Research Assistant
Shiva Maniam, Research Assistant
Hannah Fingerhut, Research Assistant
Meredith Dost, Research Assistant
Sandra Stencel, Associate Director, Editorial
Michael Lipka, Editor
Aleksandra Sandstrom, Copy Editor
Bill Webster, Information Graphics Designer
Peter Bell, Information Graphics Designer
Anna Schiller, Communications Manager
Stefan S. Cornibert, Communications Associate
Travis Mitchell, Digital Producer
18
PEW RESEARCH CENTER
www.pewresearch.org
Methodology
The analysis in this report is based on telephone interviews conducted Jan. 7-14, 2016 among a
national sample of 2,009 adults, 18 years of age or older, living in all 50 U.S. states and the District
of Columbia (504 respondents were interviewed on a landline telephone and 1,505 were
interviewed on a cellphone, including 867 who had no landline telephone). The survey was
conducted under the direction of Abt SRBI. A combination of landline and cellphone random digit
dial samples were used; both samples were provided by Survey Sampling International. Interviews
were conducted in English and Spanish. Respondents in the landline sample were selected by
randomly asking for the youngest adult male or female who is now at home. Interviews in the cell
sample were conducted with the person who answered the phone, if that person was an adult 18
years of age or older. For detailed information about our survey methodology, see
http://www.pewresearch.org/methodology/u-s-survey-research/.
The combined landline and cellphone sample is weighted using an iterative technique that
matches gender, age, education, race, Hispanic origin and nativity and region to parameters from
the Census Bureau’s 2014 American Community Survey and population density to parameters
from the Decennial Census. The sample also is weighted to match current patterns of telephone
status (landline only, cellphone only, or both landline and cellphone), based on extrapolations
from the 2015 National Health Interview Survey. The weighting procedure also accounts for the
fact that respondents with both landline and cellphones have a greater probability of being
included in the combined sample and adjusts for household size among respondents with a
landline phone. The margins of error reported and statistical tests of significance are adjusted to
account for the survey’s design effect, a measure of how much efficiency is lost from the weighting
procedures.
19
PEW RESEARCH CENTER
www.pewresearch.org
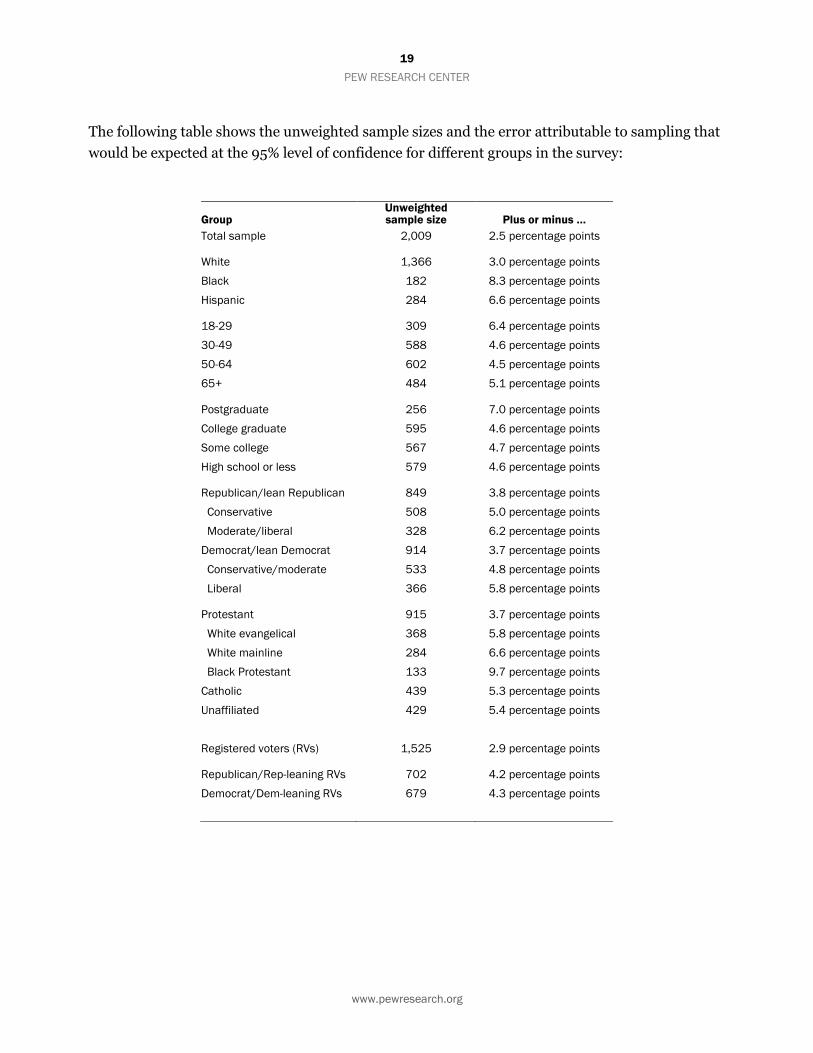
The following table shows the unweighted sample sizes and the error attributable to sampling that
would be expected at the 95% level of confidence for different groups in the survey:
Group Unweighted sample size Plus or minus …
Total sample 2,009 2.5 percentage points
White 1,366 3.0 percentage points
Black 182 8.3 percentage points
Hispanic 284 6.6 percentage points
18-29 309 6.4 percentage points
30-49 588 4.6 percentage points
50-64 602 4.5 percentage points
65+ 484 5.1 percentage points
Postgraduate 256 7.0 percentage points
College graduate 595 4.6 percentage points
Some college 567 4.7 percentage points
High school or less 579 4.6 percentage points
Republican/lean Republican 849 3.8 percentage points
Conservative 508 5.0 percentage points
Moderate/liberal 328 6.2 percentage points
Democrat/lean Democrat 914 3.7 percentage points
Conservative/moderate 533 4.8 percentage points
Liberal 366 5.8 percentage points
Protestant 915 3.7 percentage points
White evangelical 368 5.8 percentage points
White mainline 284 6.6 percentage points
Black Protestant 133 9.7 percentage points
Catholic 439 5.3 percentage points
Unaffiliated 429 5.4 percentage points
Registered voters (RVs) 1,525 2.9 percentage points
Republican/Rep-leaning RVs 702 4.2 percentage points
Democrat/Dem-leaning RVs 679 4.3 percentage points
20
PEW RESEARCH CENTER
www.pewresearch.org
Sample sizes and sampling errors for other subgroups are available upon request.
In addition to sampling error, one should bear in mind that question wording and practical
difficulties in conducting surveys can introduce error or bias into the findings of opinion polls.
Pew Research Center is a nonprofit, tax-exempt 501(c)(3) organization and a subsidiary of The
Pew Charitable Trusts, its primary funder.
© Pew Research Center, 2016
21
PEW RESEARCH CENTER
www.pewresearch.org
PEW RESEARCH CENTER JANUARY 2016 RELIGION AND POLITICS SURVEY
FINAL TOPLINE JANUARY 7-14, 2016
N=2,009 QUESTIONS 1-3, 8-9, 19-22, 25-28, 31-32, PREVIOUSLY RELEASED NO QUESTIONS 4-7, 10-18, 23-24, 29-30, 33
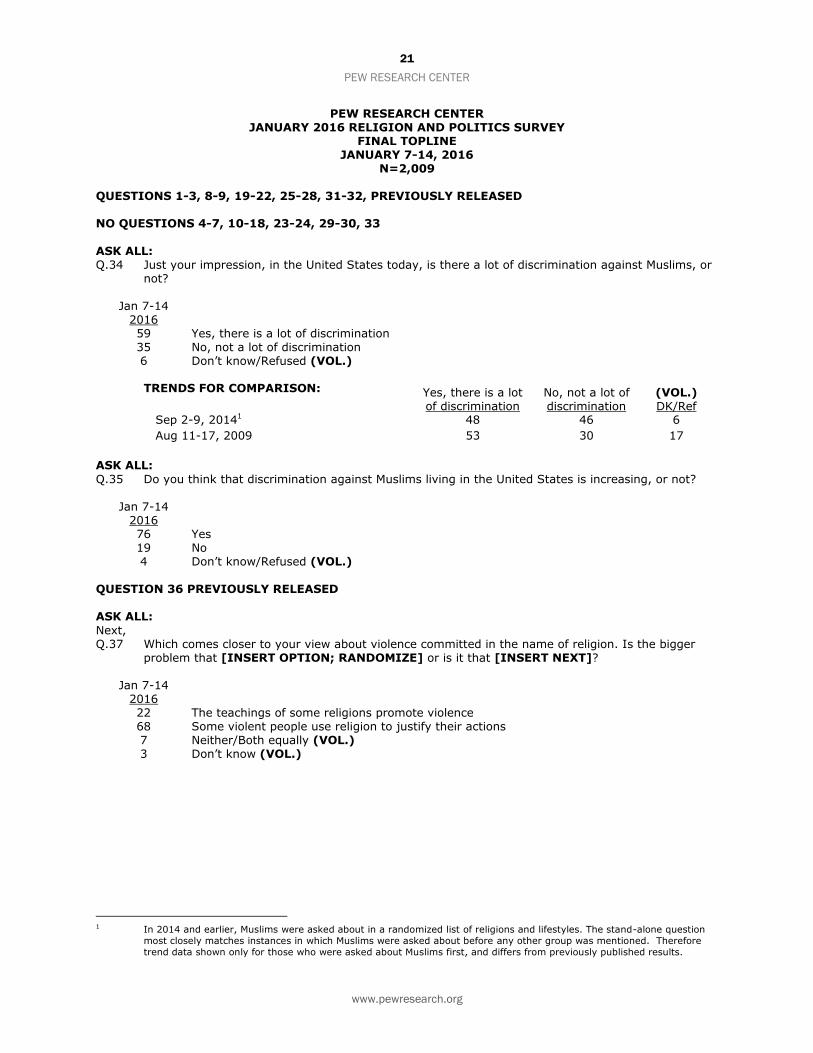
ASK ALL: Q.34 Just your impression, in the United States today, is there a lot of discrimination against Muslims, or
not? Jan 7-14 2016 59 Yes, there is a lot of discrimination 35 No, not a lot of discrimination 6 Don’t know/Refused (VOL.)
TRENDS FOR COMPARISON:
Yes, there is a lot of discrimination
No, not a lot of discrimination
(VOL.) DK/Ref
Sep 2-9, 20141 48 46 6
Aug 11-17, 2009 53 30 17
ASK ALL:
Q.35 Do you think that discrimination against Muslims living in the United States is increasing, or not? Jan 7-14 2016 76 Yes 19 No 4 Don’t know/Refused (VOL.) QUESTION 36 PREVIOUSLY RELEASED ASK ALL:
Next, Q.37 Which comes closer to your view about violence committed in the name of religion. Is the bigger
problem that [INSERT OPTION; RANDOMIZE] or is it that [INSERT NEXT]? Jan 7-14 2016 22 The teachings of some religions promote violence 68 Some violent people use religion to justify their actions 7 Neither/Both equally (VOL.) 3 Don’t know (VOL.)
1 In 2014 and earlier, Muslims were asked about in a randomized list of religions and lifestyles. The stand-alone question
most closely matches instances in which Muslims were asked about before any other group was mentioned. Therefore
trend data shown only for those who were asked about Muslims first, and differs from previously published results.
22
PEW RESEARCH CENTER
www.pewresearch.org
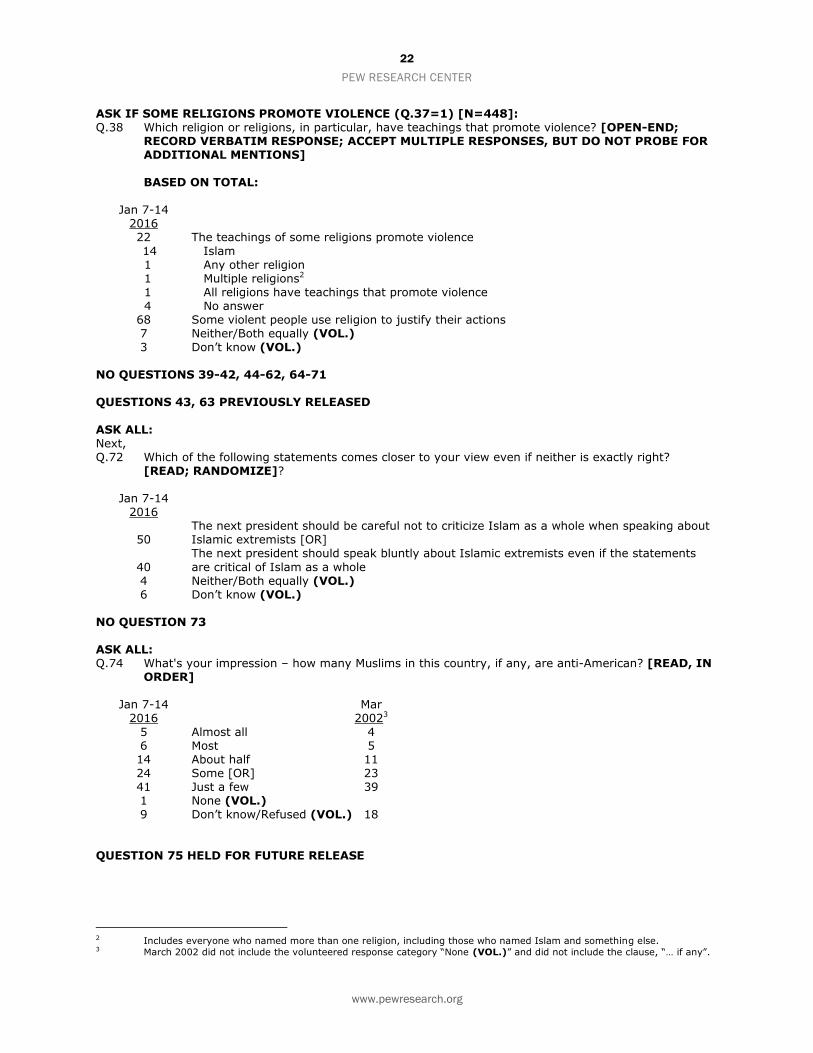
ASK IF SOME RELIGIONS PROMOTE VIOLENCE (Q.37=1) [N=448]: Q.38 Which religion or religions, in particular, have teachings that promote violence? [OPEN-END;
RECORD VERBATIM RESPONSE; ACCEPT MULTIPLE RESPONSES, BUT DO NOT PROBE FOR ADDITIONAL MENTIONS]
BASED ON TOTAL: Jan 7-14 2016 22 The teachings of some religions promote violence
14 Islam 1 Any other religion 1 Multiple religions2 1 All religions have teachings that promote violence 4 No answer 68 Some violent people use religion to justify their actions 7 Neither/Both equally (VOL.) 3 Don’t know (VOL.) NO QUESTIONS 39-42, 44-62, 64-71 QUESTIONS 43, 63 PREVIOUSLY RELEASED
ASK ALL: Next, Q.72 Which of the following statements comes closer to your view even if neither is exactly right?
[READ; RANDOMIZE]? Jan 7-14 2016 The next president should be careful not to criticize Islam as a whole when speaking about 50 Islamic extremists [OR]
The next president should speak bluntly about Islamic extremists even if the statements
40 are critical of Islam as a whole 4 Neither/Both equally (VOL.) 6 Don’t know (VOL.) NO QUESTION 73 ASK ALL: Q.74 What's your impression – how many Muslims in this country, if any, are anti-American? [READ, IN
ORDER] Jan 7-14 Mar 2016 20023
5 Almost all 4 6 Most 5 14 About half 11 24 Some [OR] 23 41 Just a few 39 1 None (VOL.) 9 Don’t know/Refused (VOL.) 18 QUESTION 75 HELD FOR FUTURE RELEASE
2 Includes everyone who named more than one religion, including those who named Islam and something else. 3 March 2002 did not include the volunteered response category “None (VOL.)” and did not include the clause, “… if any”.
23
PEW RESEARCH CENTER
www.pewresearch.org
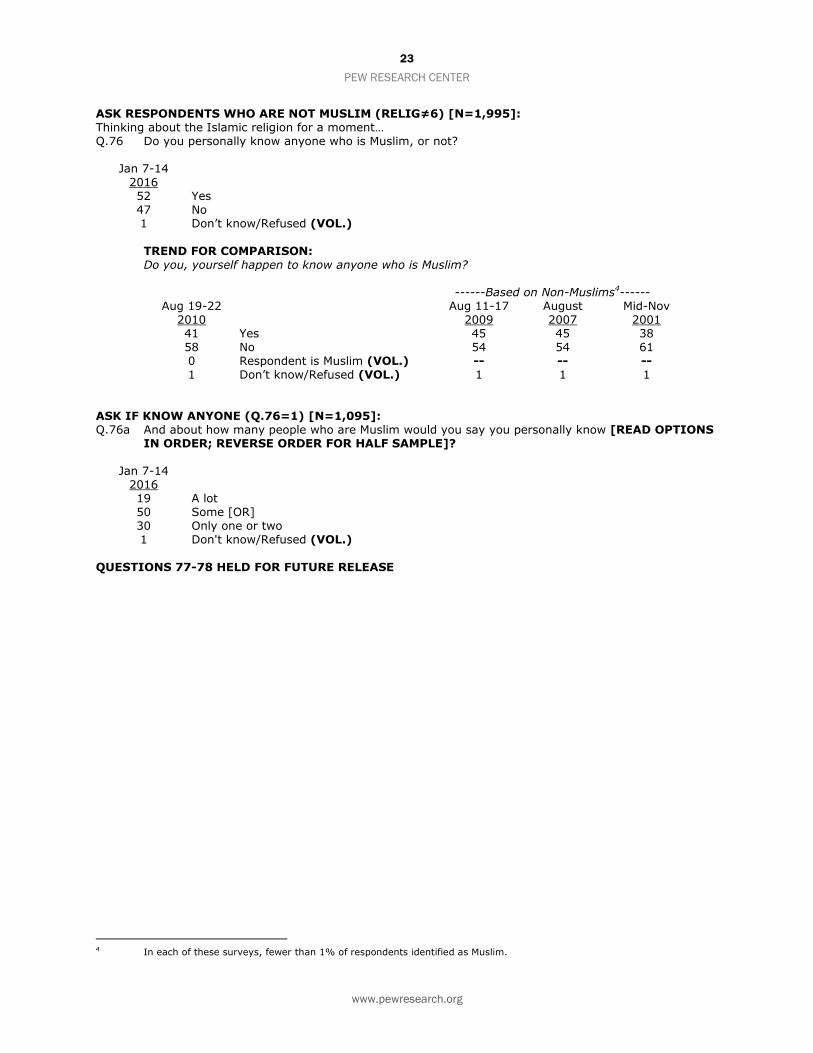
ASK RESPONDENTS WHO ARE NOT MUSLIM (RELIG≠6) [N=1,995]: Thinking about the Islamic religion for a moment… Q.76 Do you personally know anyone who is Muslim, or not? Jan 7-14 2016 52 Yes 47 No 1 Don’t know/Refused (VOL.)
TREND FOR COMPARISON: Do you, yourself happen to know anyone who is Muslim? ------Based on Non-Muslims4------ Aug 19-22 Aug 11-17 August Mid-Nov 2010 2009 2007 2001 41 Yes 45 45 38 58 No 54 54 61 0 Respondent is Muslim (VOL.) -- -- -- 1 Don’t know/Refused (VOL.) 1 1 1
ASK IF KNOW ANYONE (Q.76=1) [N=1,095]: Q.76a And about how many people who are Muslim would you say you personally know [READ OPTIONS
IN ORDER; REVERSE ORDER FOR HALF SAMPLE]? Jan 7-14 2016 19 A lot 50 Some [OR] 30 Only one or two 1 Don't know/Refused (VOL.)
QUESTIONS 77-78 HELD FOR FUTURE RELEASE
4 In each of these surveys, fewer than 1% of respondents identified as Muslim.