november 2014 hermosa beach real estate market trends update
TRANSCRIPT


Table of
Contents
Key Statistics for November
Sales 2014 Residential Sales Stats Year-to-Year Total Sales by Map Area Median 2014 Median Sales Stats Year-to-Year Median Sales by Map Area Listings 2014 Active Listings by Map Area 2014 Total Active Listings vs. Total Sales Year-to-Year Active Listings by Map Area Inventory 2014 Months of Inventory by Map Area Year-to-Year Months of Inventory
Outlook for December
About Hady Chahine Contact Information

Key Statistics for November
Back to Table of Contents
= trending positive = trending positive
= trending negative = trending negative
Month-to-Month Comparison Oct 2014 Nov 2014 Delta (qty) Delta (%) Increase Decrease
Total Sales 16 12 -4 -25.00%
Median Sales Price 1,267,500 1,437,000 169,500 13.37%
Median Days to Sell 27 39 12 44.44%
Listings 45 46 1 2.22%
Sales/Listing Ratio 35.6% 26.1% -9.5% -26.69%
Months of Inventory 2.8 3.8 1 35.71%
Monthly Comparison Year-to-Year Nov 2013 Nov 2014 Delta Delta Increase Decrease
Total Sales 20 12 -8 -40.00%
Median Sales Price 1,113,500 1,437,000 323,500 29.05%
Median Days to Sell 48 39 -9 -18.75%
Listings 40 46 6 15.00%
Months of Inventory 2.1 3.8 1.7 80.95%

Back to Table of Contents
Total Sales Month-to-Month by Map Area Sep Oct Nov
Hermosa Bch Sand 6 7 6
Hermosa Bch Valley 2 4 4
Hermosa Bch East 11 5 2
Total Sales 19 16 12
0
2
4
6
8
10
12
14
16
18
20
Sep Oct Nov
2014 Total Sales Month-to-Month by Map Area
Hermosa Bch Sand
Hermosa Bch Valley
Hermosa Bch East
Total Sales

Back to Table of Contents
Total Sales Year-to-Year by Map Area 2012 2013 2014
Hermosa Bch Sand 8 9 6
Hermosa Bch Valley 4 5 4
Hermosa Bch East 5 6 2
Total Sales 17 20 12
0
2
4
6
8
10
12
14
16
18
20
2012 2013 2014
Total Sales Year-to-Year by Map Area: November
Hermosa Bch Sand
Hermosa Bch Valley
Hermosa Bch East
Total Sales

Back to Table of Contents
Median Sales Price Month-to-Month by Map Area Sep Oct Nov
Hermosa Bch Sand 1,517,500 1,499,000 1,615,500
Hermosa Bch Valley 1,535,500 718,000 1,374,500
Hermosa Bch East 865,000 1,350,000 946,250
Market Median Sales Price 1,095,000 1,267,500 1,437,000
-
200,000
400,000
600,000
800,000
1,000,000
1,200,000
1,400,000
1,600,000
1,800,000
Sep Oct Nov
2014 Median Sales Price Month-to-Month by Map Area
Hermosa Bch Sand
Hermosa Bch Valley
Hermosa Bch East
Market Median Sales Price

Back to Table of Contents
Median Sales Price Year-to-Year by Map Area 2012 2013 2014
Hermosa Bch Sand 817,098 1,599,000 1,615,500
Hermosa Bch Valley 912,500 965,000 1,374,500
Hermosa Bch East 890,000 757,000 946,250
Market Median Sales Price 890,000 1,113,500 1,437,000
-
200,000
400,000
600,000
800,000
1,000,000
1,200,000
1,400,000
1,600,000
1,800,000
2012 2013 2014
Median Sales Price Year-to-Year by Map Area: November
Hermosa Bch Sand
Hermosa Bch Valley
Hermosa Bch East
Market Median Sales Price

Back to Table of Contents
Active Listings vs. Total Sales by Map Area Jan Feb Mar Apr May Jun Jul Aug Sep Oct Nov Dec
Hermosa Bch Sand 14 16 23 21 23 23 18 16 18 24 27
Hermosa Bch Valley 11 10 9 11 10 6 8 5 10 11 11
Hermosa Bch East 8 12 18 16 16 24 15 15 9 10 8
Total Active Listings 33 38 50 48 49 53 41 36 37 45 46
-
5
10
15
20
25
30
Jan Feb Mar Apr May Jun Jul Aug Sep Oct Nov Dec
2014 Active Listings by Map Area
Hermosa Bch Sand
Hermosa Bch Valley
Hermosa Bch East
Back to Table of Contents
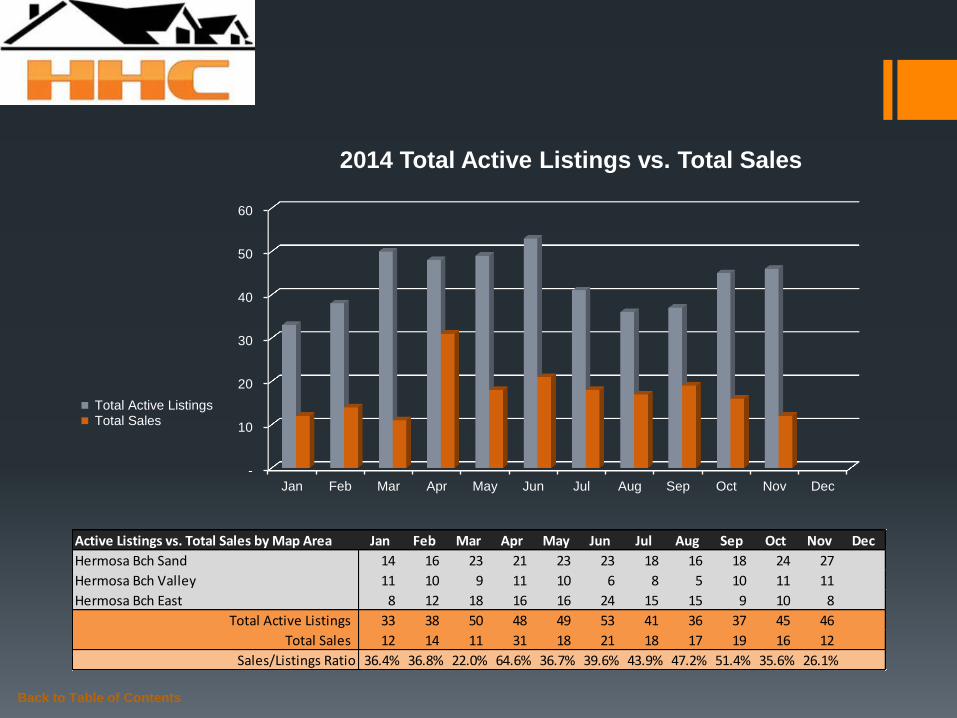
Active Listings vs. Total Sales by Map Area Jan Feb Mar Apr May Jun Jul Aug Sep Oct Nov Dec
Hermosa Bch Sand 14 16 23 21 23 23 18 16 18 24 27
Hermosa Bch Valley 11 10 9 11 10 6 8 5 10 11 11
Hermosa Bch East 8 12 18 16 16 24 15 15 9 10 8
Total Active Listings 33 38 50 48 49 53 41 36 37 45 46
Total Sales 12 14 11 31 18 21 18 17 19 16 12
Sales/Listings Ratio 36.4% 36.8% 22.0% 64.6% 36.7% 39.6% 43.9% 47.2% 51.4% 35.6% 26.1%
-
10
20
30
40
50
60
Jan Feb Mar Apr May Jun Jul Aug Sep Oct Nov Dec
2014 Total Active Listings vs. Total Sales
Total Active Listings Total Sales

Back to Table of Contents
Active Listings Year-to-Year by Map Area 2012 2013 2014
Hermosa Bch Sand 28 12 27
Hermosa Bch Valley 13 11 11
Hermosa Bch East 12 17 8
Total Active Listings 53 40 46
0
10
20
30
40
50
60
2012 2013 2014
Active Listings Year-to-Year by Map Area: November
Hermosa Bch Sand
Hermosa Bch Valley
Hermosa Bch East
Total Active Listings

Back to Table of Contents
Months of Inventory by Map Area Jan Feb Mar Apr May Jun Jul Aug Sep Oct Nov Dec
Hermosa Bch Sand 4.7 2.7 7.7 1.0 4.6 2.3 3.0 1.8 3.0 3.4 4.5
Hermosa Bch Valley 2.2 2.5 2.3 2.2 2.5 1.2 2.7 1.7 5.0 2.8 2.8
Hermosa Bch East 2.0 3.0 4.5 3.2 1.8 4.0 1.7 3.0 0.8 2.0 4.0
-
1.0
2.0
3.0
4.0
5.0
6.0
7.0
8.0
Jan Feb Mar Apr May Jun Jul Aug Sep Oct Nov Dec
2014 Months of Inventory by Map Area
Hermosa Bch Sand
Hermosa Bch Valley
Hermosa Bch East

Back to Table of Contents
Months of Inventory Year-to-Year Jan Feb Mar Apr May Jun Jul Aug Sep Oct Nov Dec
2012 5.9 4.4 3.3 5.1 3.7 4.5 3.8 4.0 3.2 4.1 3.1 1.8
2013 5.9 4.3 3.7 3.5 2.4 2.9 1.7 1.6 3.6 2.3 2.1 1.8
2014 2.8 2.7 4.6 1.6 2.7 2.5 2.3 2.1 2.0 2.8 3.8
-
1.0
2.0
3.0
4.0
5.0
6.0
Jan Feb Mar Apr May Jun Jul Aug Sep Oct Nov Dec
Months of Inventory Year-to-Year
2012
2013
2014

Outlook for December
Although trending slighting off pace with respect to last month Hermosa Beach real estate activity in
November did produce a 13.37% increase in the market median sales price. As expected, though, other
performance indicators affirm consumers could be distracted with the holiday season. That said I suspect
the MLS to produce similar results in December as compared to November. Do keep in mind, however,
that mortgage money remains relatively inexpensive given the Fed’s posture on postponing interest rate
hikes, a policy which is likely to change sometime next year.
See http://www.reuters.com/article/2014/12/05/us-usa-fed-mester-idUSKCN0JJ24620141205.
Thus, buyers actively in pursuit of securing the home of their dreams should act sooner than later and
homeowners contemplating listing their home should heed the same advice. Questions? Please give me
a call anytime, I would love to talk to you!
Your recap…
Back to Table of Contents
Month-to-Month Comparison Oct 2014 Nov 2014 Delta (qty) Delta (%) Increase Decrease
Total Sales 16 12 -4 -25.00%
Median Sales Price 1,267,500 1,437,000 169,500 13.37%
Median Days to Sell 27 39 12 44.44%
Listings 45 46 1 2.22%
Sales/Listing Ratio 35.6% 26.1% -9.5% -26.69%
Months of Inventory 2.8 3.8 1 35.71%

About
Hady Chahine…
Serving South Bay Home Buyers and Sellers Since 2001
RE/MAX Top 4 Team in California – 2012
RE/MAX 100% Club - 2011
Shorewood Realtors Top 5% in Overall Sales 2001-2006, 2008-2010
Back to Table of Contents

The information being provided by CARETS (CLAW, CRISNet MLS, DAMLS, CRMLS, i-Tech MLS, and/or VCRDS) is for the visitor’s personal, non-commercial use and may not be used for
any purpose other than to identify prospective properties visitor may be interested in purchasing. Any information relating to a property referenced on this web site comes from the Internet
Data Exchange (IDX) program of CARETS. This web site may reference real estate listing(s) held by a brokerage firm other than the broker and/or agent who owns this web site. The accuracy
of all information, regardless of source, including but not limited to square footages and lot sizes, is deemed reliable but not guaranteed and should be personally verified through personal
inspection by and/or with the appropriate professionals.
Hady Chahine
• 310-404-5361
Back to Table of Contents
Listings MLS BLOG Website