novel digital tissue phenotypic signatures of distant ... · novel digital tissue phenotypic...
TRANSCRIPT

Novel digital tissue phenotypic signatures of distantmetastasis in colorectal cancerKorsuk Sirinukunwattana1,*, David Snead2, David Epstein3, Zia Aftab4, Imaad Mujeeb4,Yee Wah Tsang2, Ian Cree5, and Nasir Rajpoot6
1Institute of Biomedical Engineering, University of Oxford, UK2Department of Pathology, University Hospitals Coventry and Warwickshire, Coventry, UK3Mathematics Institute, University of Warwick, Coventry, UK4Hamad Medical Corporation, Doha, Qatar5International Association for Cancer Research, France6Department of Computer Science, University of Warwick, Coventry, UK*To whom correspondence should be addressed. Email: [email protected], [email protected]
ABSTRACT
Distant metastasis is the major cause of death in colorectal cancer (CRC). Patients at high risk of developing distant metastasiscould benefit from appropriate adjuvant and follow-up treatments if stratified accurately at an early stage of the disease. Studieshave increasingly recognized the role of diverse cellular components within the tumor microenvironment in the developmentand progression of CRC tumors. In this paper, we show that a new method of automated analysis of digitized images fromcolorectal cancer tissue slides can provide important estimates of distant metastasis-free survival (DMFS, the time beforemetastasis is first observed) on the basis of details of the microenvironment. Specifically, we determine what cell types arefound in the vicinity of other cell types, and in what numbers, rather than concentrating exclusively on the cancerous cells. Wethen extract novel tissue phenotypic signatures using statistical measurements about tissue composition. Such signatures canunderpin clinical decisions about the advisability of various types of adjuvant therapy.
IntroductionCell function and behavior cannot be fully understood without the context of their microenvironment. Communication betweencells and their surroundings allows the functional organization of cells into tissues and organs. It also plays a vital role inmaintaining tissue homeostasis by generating signals that suppress and revert malignant phenotypes1. Experiments in animaland cell culture models have demonstrated that certain conditions of the microenvironment can cause potent cancerous cells torevert to an almost normal phenotype2, 3. Although the normal tissue microenvironment is known to be resilient to tumorigenesis,false signals in the microenvironment can disrupt tissue homeostasis and subsequently initiate tumors. The microenvironmentin which tumor exists is both complex and heterogeneous, inhabited by a multitude of cellular and non-cellular componentsincluding tumor cells, extracellular matrix, tumor stroma, blood vessels, inflammatory cells, signaling molecules4–6. Studiesover the last decade have increasingly recognized the role of these different components in the development and progression oftumors5. This paper adds to this evidence, and shows how its quantification may be automated.
Metastasis is the major cause of morbidity and death in colorectal cancer (CRC). The 5-year survival rate in CRC patientswith distant metastasis is approximately 10%, considerably smaller than 70% with regional metastasis and 90% withoutmetastasis7. Patients at high risk of developing distant metastasis could benefit from appropriate adjuvant and follow-uptreatments if stratified accurately. The literature reports several histopathological features carrying prognostic value for CRCprogression. Each of the features reflects competing cellular stimuli that influence tumor progression or suppression within themicroenvironment. Type, density, and relative locations of different tissue components in the tumor microenvironment arecrucial in determining progression and patient survival in CRC. For instance, the number of cytotoxic and memory T cells inthe tumor center and the invasive margin have been linked to an improved prognosis of CRC8. Similarly, numerous studieshave reported cancer-associated fibroblasts (CAFs) and desmoplasia to be important histopathological features associated withan unfavorable prognosis for CRC and an increased mortality rate9–13. Analogous to a wound that never heals14, 15, tumorsstimulate many associated responses, wherein normal fibroblasts have been reported to acquire a cancer-associated phenotype(5,16). Furthermore, the extent of necrosis in CRC has been reported to correlate strongly with cancer progression and patientsurvival13, 16, 17. The link between necrosis and tumor progression is possibly due to the hypoxic nature of tumors, which drivestumor infiltrating inflammatory cells, namely phagocytic macrophages and granulocytes, to secrete pro-inflammatory cytokineswhich in turn promote cell proliferation4.
arX
iv:1
801.
0745
1v1
[cs
.CV
] 2
3 Ja
n 20
18
In this study, we investigate the significance of tissue phenotypic and morphometric features, exploring in particular cellularheterogeneity in tumor microenvironments, in determining metastatic potential in CRC patients diagnosed with advancedprimary tumors. Based on the AJUCC/UICC-TNM staging system18, this group of patients have a primary tumor that hasgrown through the outer lining of colon wall (T3/T4), have no lymph nodes that are affected by cancer cells (N0), and may ormay not have distant metastasis at the time of diagnosis (M0/M1). Detailed quantitative analysis was performed on whole slideimages (WSIs) of CRC histology slides, stained with routine Hematoxylin & Eosin (H&E) dyes in a fully quantitative manner,using bespoke image analysis methods to provide an objective and reproducible assessment. Quantitative analysis of varioustypes of cell population reveals novel tissue phenotypic features, derived from both cell-cell connection frequencies and tissueappearance, with significant association with metastasis incidence and distant metastasis-free survival (DMFS) in the advancedprimary CRC tumors.
Results
Quantifying tissue phenotypic signatures of CRC tumorsIn this study, WSIs of Hematoxylin and Eosin (H&E)-stained histological sections from 108 patients with advanced nodenegative primary CRC tumors (T3/T4, N0, M0/M1) were acquired from two independent cohorts from two different institutes:University Hospitals Coventry and Warwickshire (UHCW, 78 patients) and Hamad General Hospital (HGH, 30 patients).Summary details of the cohorts and clinical information are given in Table 1.
CRC, like other solid tumors, is a disease of substantial heterogeneity19, 20. Different parts of the same tumor can exhibitdifferent features including cellular morphology, gene expression, metabolism, motility, angiogenic, proliferative, immunogenic,and metastatic potential21. The tumor microenvironment is composed of diverse cell types; each plays a different role intumor development and progression — some support and promote tumor progression while others play host protective roles5.The biological functions of cells are not only determined by their type but are also greatly influenced by their surroundingcontext. It follows that tissue morphometric signatures measuring tumor heterogeneity could be computed from the analysis ofdistributions and relative locations of cellular populations in the tumor microenvironment.
Here, we outline the quantification of digital tissue phenotypic signatures (see Methods for details). We divided each tumorhistology image (i.e., each WSI) into small square regions or sub-images (Fig. 1a) and analyzed the small sub-images toobtain local characteristics that were then summarized to characterize the entire tumor section. We first applied our artificialintelligence (AI) based algorithm22, which was recently shown to be the state-of-the-art in detecting and distinguishing betweenfour types of cells based on their morphology and context, to each sub-image. The four types of cells were: malignant epithelialcells, spindle-shaped cells (normal fibroblasts, cancer-associated fibroblasts and smooth muscle cells), inflammatory cells(eosinophils, lymphocytes and neutrophils), and necrotic debris (Fig. 1b). This allowed us to do quantification of tissuemorphological characteristics associated with tumor, based on both distributions and relative spatial locations of diverse celltypes. For each small tissue region (sub-image) in the large WSI, we then constructed a cell network (Fig. 1c). Each vertex ofthe network represents a cell of a certain type, and an edge denotes a cell-cell connection between immediately neighboringcells. Based on the distribution of cell-cell connections in the network (Fig. 1d), we then grouped the local tissue regionsinto different phenotypes using an unsupervised learning approach. The six resulting connection frequency (CF) based tissuephenotypes were visually discernible with each phenotype corresponding mainly to local areas of smooth muscle, inflammation,tumor-stroma interface, tumor, stroma, or necrosis (Fig. 1e). Finally, we used the ratio of the area of each CF tissue phenotypeto the total tissue area to give digital tissue phenotypic signature of each tumor sample (Methods).
To further examine the extent to which the aforementioned automatically derived cell-cell CF tissue phenotypes correlatewith known tissue types, we also quantified the tissue types by means of appearance based (AP) tissue segmentation. Thetissue content of each WSI was automatically segmented into the following eight categories: tumor, stroma, loose connectivetissue, normal/hyperplastic mucosa, smooth muscle, necrosis, fat, and inflammation (Fig. S1). We then investigated correlationbetween the CF and AP based tissue phenotypes. These are smooth muscle, inflammation, tumor, stroma, and necrosis. TheSpearman correlation coefficients for individual pairs of CF and AP features range from 0.427 to 0.698 (Fig. S2), indicatingmoderate correspondence between the automatically-derived phenotypes and the underlying tissue types.
In addition to the phenotypic and standard clinical features, we considered the following automatically-derived features:Morisita index23, stroma-tumor ratio9, 11, 12, and necrosis-tumor ratio13, 16, 17. These features have previously been identified ashaving prognostic significance for CRC or other malignancies. Morisita index measures the spatial coexistence of inflammatorycell and malignant epithelial cells23. Stroma-tumor ratio is defined as the proportion of the total area of stroma to the total areaof combined stroma and tumor in the tissue. Necrosis-tumor ratio is defined in the similar manner as that of stroma-tumor ratio(Methods). It is worth noting that in the above studies, the stroma-tumor ratio and necrosis-tumor ratio were semi-quantitativelyassessed on manually selected small regions of histological slides. In contrast, we measured these quantities with greaterprecision and using all regions of our WSIs, thus avoiding subjective bias.
2/16
Association between phenotypic and clinical featuresHere, we determined the strength of association between the CF tissue phenotypic features and standard clinical featuresnormally used in routine prognostication of colon cancer (Table 2). The clinical features included tumor differentiation, tumorhistological type, and primary tumor (T) stage. For example, to check whether there is association between the CF inflamationratio and the T stage, we test if the distribution of CF inflammation ratio of the group of samples that are annotated as pT3 stageis significantly different from the distribution of samples that are annotated as pT4 stage using Mann-Whitney U test (alsoknown as Wilcoxon rank-sum test).
We found statistically significant association between CF inflammation ratio and T stage (p-value = 0.002) and betweenCF tumor ratio and tumor differentiation (p-value = 0.033). Nonetheless, the relatively small values of the coefficients ofdetermination (CF inflammation ratio vs. T stage: r2 = 0.092; CF tumor ratio vs. differentiation: r2 = 0.042) indicate thatCF inflammation ratio and CF tumor ratio are only weakly associated with T stage and tumor differentiation, respectively.There is no statistically significant association between other pairs of the CF phenotypic features and the standard clinicalfeatures. Altogether, these results suggest that the CF tissue phenotypic features are not strongly associated with standardclinical features and, therefore, are potentially new features whose prognostic significance is worth further investigation.
Logistic regression analysisTo assess the significance of each phenotypic feature in identifying a patient’s risk of having distant metastasis at the time ofdiagnosis or future progression, we carried out logistic regression analysis. Odds ratio factor and 95% confidence interval (CI)estimates were obtained for each feature to quantify the risk of distant metastasis incidence associated with the phenotypicfeatures (Methods).
The results show that CF smooth muscle and inflammation ratios are statistically significant (p-value < 0.05) in univariateanalysis (Table 3). Moreover, when adjusted for the effects of the standard clinical parameters in multivariate analysis, CFsmooth muscle and inflammation ratios are statistically significant features (p-value < 0.05), independent of other standardclinical features (Table 3 and Table S1). The interquartile change in CF smooth muscle ratio increases the odds of distantmetastasis by a factor of 2.258 (95% CI: 1.117 - 4.565) in univariate analysis and by 2.350 (95%CI: 1.132 - 4.876) in multivariateanalysis. The interquartile change in CF inflammation ratio, on the other hand, decreases the odds by a factor of 0.279 (95%CI: 0.119 - 0.656) in the univariate analysis and 0.307 (95%CI: 0.126 - 0.749). Despite the fact that CF smooth muscleand inflammation ratios are separately shown to be statistically significant in both the univariate and multivariate analyses,when considered together in the multivariate model (Table S1), their joint contribution towards the prediction of metastasisdevelopment becomes less clear. This is likely due to a moderate degree of correlation (ρ=-0.652) between the features. Thus,when one is used, the other should probably be disregarded.
Next, we investigated if the above statistical results could be achieved by means of the AP smooth muscle ratio and APinflammation ratio features. Only the AP inflammation ratio is shown to be statistically significant in the univariate analysis(p-value = 0.027, Table 3) and marginally significant in the multivariate analysis (p-value = 0.056, Table 3).
Distant metastasis-free survival analysisNext, we investigated the prognostic significance of various features, using DMFS as a criterion. The analysis was carried outon all cases from the UHCW cohort (78 cases), for which survival data were available. In our multivariate analysis, the effect ofindividual features was adjusted for the effect of standard clinical features.
The tissue CF phenotypic features (smooth muscle, inflammation, and stroma ratios) and the AP phenotypic feature(inflammation ratio) were shown to be influencing features in determining the DMFS probability of the patients under Coxproportional hazards models (p < 0.05, Table 4, and Table S2). In particular, the effect of the interquartile change in CF smoothmuscle ratio is to increase the hazard by 2.138 times (95% CI: 0.188 – 0.388) in the univariate analysis and by 2.467 times (95%CI: 1.062 – 5.73) in the multivariate analysis. The interquartile change in AP inflammation ratio affects the DMFS probabilityby reducing the hazard by a factor of 0.401 (95% CI: 0.026 - 0.075) in the univariate analysis and by a factor of 0.431 (95% CI:0.224 - 0.832) in the multivariate analysis. In addition, when CF smooth muscle and AP inflammation are compared together inthe same multivariate model, the effects of AP inflammation ratios on the DMFS probability vanishes (Table S2). This is likelydue to the correlation between these features (ρ = -0.252).
The interquartile change in CF inflammation ratio influences the survival probability by decreasing the hazard by a factor of0.412 (95% CI: 0.204 - 0.934) in the univariate analysis and by a factor of 0.413 (95% CI: 0.201 – 0.849) in the multivariateanalysis. However, the effect of CF inflammation ratio is only marginally significant (p-value = 0.051) when adjusted by thestandard clinical parameters in the multivariate analysis. Interestingly, CF stroma ratio also shows up as statistically significantin the univariate analysis (p-value = 0.032, hazard ratio factor = 0.475, 95% CI: 0.252 - 0.896).
We found that lower values of CF smooth muscle ratio and higher values of CF inflammation, CF stroma, and APinflammation ratios were associated with low 5-year survival probabilities (Fig. 2 left and Fig. S3d left). Furthermore, there arestatistically significant differences between the survival distributions of cases when stratified by CF smooth muscle, CF stroma,
3/16
and AP inflammation ratios (p-value < 0.05, Table 4, Fig. 2 right). Stratification by other features does not yield statisticallysignificant results (Fig. S3).
In summary, CF smooth muscle and AP inflammation ratios are consistently shown to be important prognostic factors forDMFS across three different types of survival analyses, including univariate Cox regression analysis, multivariate Cox analysis,and log-rank test. Nonetheless, they are not shown to be independent of each other and therefore when one is used, the othershould probably be disregarded.
DiscussionThe goal of this study was to investigate the prognostic significance of novel image-based quantitative morphometric featuresderived from diverse cellular populations that constitute the tumor microenvironment of CRC with advanced primary tumors(T3/T4, N0, M0/M1).
Digital Phenotypic Features vs Histological Features. To fully explore the rich microscopic level information available ina tissue section, we have developed an automated system to provide quantitative measurements and avoid bias due to observervariability. The analysis was conducted on WSIs of H&E-stained formalin-fixed paraffin-embedded (FFPE) histologicalsections. Unlike previous works that identify diverse cellular components in a tumor section24, 25, our morphometric featuresare not limited to tumor cells, lymphocytes, and stromal cells, but also include other types of inflammatory cells, spindle-shapedcells, and necrotic debris. In addition, we explored the relationship between these cellular components through a cell-cellnetwork in order to characterize the morphological and tissue phenotypic heterogeneity of tumor. Our system did not adopta commonly used approach26, 27 that calculates a large number of features followed by feature selection methods to select ahandful of features suitable for the objectives of the analysis. Although such an exploratory approach has proved successfulin some applications26, 27, the resulting features may not be easily interpretable in clinical terms. Moreover, if sufficientlymany features are tried, it is likely that one of them will turn out to be “statistically significant” and so this approach requiresfollow-up tests of reproducibility. Instead, we investigated a small set of meaningful quantitative features, automatically foundthrough unsupervised phenotyping and segmentation.
Our systematic analysis shows that (a) the CF smooth muscle and CF inflammation ratios are potentially independentmarkers predicting the occurrence of distance metastasis (binary logistic regression analysis) and (b) the CF smooth muscle andAP inflammation ratios are potential prognostic markers affecting 5-year DMFS for CRC patients diagnosed with advancedprimary tumor (Cox proportional hazards regression analysis). CF smooth muscle ratio essentially measures the amount ofthe smooth muscle that is part of the colon wall. It quantifies the extent of spread and potential advancement of the tumors— the concept is related (but not similar) to other measures such as T stage, tumor-stroma ratio9, 11, 12, and tumor borderconfiguration28, 29. Low CF smooth muscle ratio is strongly associated with favorable prognosis. CF inflammation and APinflammation ratios largely measure the amount of inflammation within the tumor tissue. High inflammation ratio is stronglyassociated with favorable prognosis, which supports the host-protective role of inflammatory cells in CRC that has beendescribed by several studies8, 30, 31. From this observation, one may hypothesize about the biological relevance of each of ourautomatically derived tissue phenotypes for tumor development and progression.
The prognostic value of stroma-tumor ratio9, 11, 12 and necrosis-tumor ratio13, 16, 17 could not be confirmed in this study. Itshould be emphasized that, in those studies, both the ratios were semi-quantitatively measured in manually selected tumor-richareas and were inevitably prone to observer bias. By contrast, our study measured these quantities in a fully automated andquantitative manner from all regions of the tumor section and therefore can be considered to be more objective and reproducible.
Uncertainty found in our analysis pertaining to the prognostic impact of standard clinical factors has also been confirmedin existing literature32–37. Despite the fact that tumor differentiation has been consistently shown to be a prognostic featureindependent of stage38–42, the conventional grading process is subjective by its very nature and can exhibit a substantial degreeof observer variability32, 33. Inconsistency in grading is likely to occur in this study since samples from different cohortswere graded by different pathologists (UHCW: DS, HGH: IM). It is also worth noting that according to the revised WHOcriteria43, only poorly differentiated tumor histology without mismatch repair protein deficiency is considered a high-riskfactor. Presence of the mucinous histologic type in general is not an independent prognostic factor, given that available resultsare contradictory34, 35. Recent data have demonstrated the primary tumor extent (T4 stage) to be a likely prognostic factorfor recurrence/metastasis44–46. Nevertheless, like other semi-quantitative features, there have been reports of variability inassessment of the degree of tumor extent36, 37. Results from our analysis also indicate that T4 tumors have adverse DMFSoutcome compared to T3 tumors, though the difference is not statistically significant (p-value = 0.156).
The majority of samples in this study come from patients diagnosed with stage II (Dukes stage B) CRC. This is characterizedby advanced primary tumor with neither lymph node nor distant metastasis involvement (T3/T4, N0, M0). Stage II CRC consistsof a heterogeneous population; some subgroups appear more likely to develop distant metastasis than others. Although adjuvantchemotherapy treatment is effective in other stages of the disease, there is a limited incremental benefit that stage II CRC
4/16
patients could derive from this type of treatment in general47–49. Due to the high financial cost and morbidity of the treatmentcoupled with uncertainty over which patients will relapse, there has long been a debate as to whether adjuvant chemotherapytreatment should be given to the patients, since a majority of the patients will already have been cured by surgical resectionalone. In the absence of molecular or genetic predictive markers for chemotherapy response44, 50, 51, improved prognosticationaccuracy seems to be the only key to better identify candidates who could potentially benefit the most from systemic therapiesand thereby avoid unnecessary overtreatment as well as provide more efficient use of healthcare resources.
Even though several histological features have been demonstrated to be potential prognostic markers for recurrence ordistant metastasis in stage II CRC, their prognostic significance is less clear and needs further validation. Primary tumor (T)stage and the number of lymph nodes examined have been recommended as risk factors by the National Comprehensive CancerNetwork52. However, the results from our analysis do not support the T stage as a risk factor. Moreover, there is a controversyas to whether examining more lymph nodes can, in fact, reduce tumor staging error and in turn result in improved stage IIpatient survival53, 54. High-frequency microsatellite instability has been associated with improved disease-free survival in onestudy51 while in another study the effect was the opposite50. Gene expression profile is another factor that has shown promisefor prediction of recurrence44, 45.
Study Limitations. Based on the makeup of our dataset and the results from our analysis, we hypothesize that high CFsmooth muscle ratio and low CF or AP inflammation ratios are potential risk factors for distant metastasis in stage II CRC.There are nevertheless some limitations of this study as described below.
Firstly, although our cell detection and classification approach22 was developed to be robust to a certain degree of variationof images arising from factors such as stain inconstancy, batch effects, failed autofocus, and artefacts in the tissue preparationprocess, it remains to be tested if the degree of variation is excessive. Good image quality is therefore critical if the system is toproduce accurate results. This issue can be addressed by careful tissue preparation and slide scanning.
Secondly, due to the nature of the H&E stain and cellular morphology, our system is capable of identifying only a limitednumber of cell categories that are somewhat coarse. IHC stains could provide an effective means of identifying more specificcell types, such as different types of immune cells and fibroblasts (normal fibroblasts or CAFs), at the additional costs of IHCslide preparation and associated antibodies.
Thirdly, the phenotyping proposed in this work was done on the basis of local cell-cell connection frequencies and also onthe basis of appearance and other important contextual information such as tissue textures. This, on the one hand, can be seenas a limitation of the proposed quantitative tissue phenotyping approach, as it relies on local cell populations to generate globalstatistics. On the other hand, a number of studies have reported that normal cells of various types undergo transformationwhen coming into contact with tumor cells, thus resulting in some of the previously normal cells exhibiting new biologicalfunctions different from the original ones. The proposed approach focuses on cellular morphology and cellular context andavoids influences from other possibly misleading contextual information.
Finally, our analysis was based on a single dataset consisting of two independent cohorts from different institutes. To furtherconfirm the reproducibility of the results and generalizability of our automated histologic quantification system, large-scalevalidation using independent cohorts from multiple institutes is required. To be translated into clinical practice, these limitationswill need to be carefully addressed.
The Outlook. With the increasing uptake of digital slide scanning technology in histopathology laboratories, digitized WSIswill gradually replace glass slides in routine pathology workflow55. This presents an opportunity to advance image analyticaltechniques and computational algorithms for quantitative analysis of tissue morphology and consequently to provide an accurateand reproducible means for the diagnosis and prognostication of cancers. This is the first step towards effective treatment,decision-making, and personalized medicine with computational support. In this work, we have demonstrated the usefulnessof such morphometric tools to reveal prognostic features in CRC. Our morphometric analysis is not restricted to images ofFFPE CRC tissues but is also applicable to frozen tissue images as well as to images from different types of cancers. Thismorphometric approach was not designed to replace pathologists, but rather to provide additional information to assist in theirdiagnostic decision-making and risk stratification. Another potentially important direction would be to investigate potentialassociations between genomic alterations and digital tissue phenotypic signatures reflecting measurable aspects of in the tumormicroenvironment.
Methods
Experimental DesignThe main objective of this study was to assess the significance of tissue phenotypic features for determining distant metastasisin advanced primary CRC. Specifically, we asked what quantitative tissue phenotypic features are biologically meaningfuland important in predicting the concurrence at the time of diagnosis or subsequent development of distant metastasis and the
5/16
distant-metastasis-free survival. Based on results from our statistical analyses, we have shown that digital tissue phenotypicfeatures are independent prognostic factors for distant metastatic potential in CRC patients with advanced primary tumors(T3/T4, N0, M0/M1). The sample size for logistic and Cox proportional hazards regression analyses was calculated basedon the concept of events per variable56–58 which indicates that a minimum of 30 metastatic subjects would be sufficient tocontrol for a type I error rate at 7%, 95% CI coverage of 93% , and a relative bias of 7% of the estimate in the Wald test. Weretrospectively recruited CRC subjects with advanced primary tumors. Cases without a 5-year distant metastasis status wereexcluded and the enrollment was stopped when the calculated sample size was reached. Our analyses were conducted onH&E-stained WSIs of tumor sections. After reviewing the WSIs, we further excluded outlier cases whose tissue section had notumor. In view of the limited number of cases, randomization was not used in any experiments.
Patient and clinical informationThis study involved two independent cohorts of CRC patients from two institutes. The first cohort consisted of 78 patientsinitially admitted for CRC treatment during the years 2006 to 2010 at University Hospitals Coventry and Warwickshire(UHCW), Coventry, UK. The second cohort comprised 30 patients admitted during the years 2007 to 2012 at Hamad GeneralHospital (HGH), Doha, Qatar. For each case, clinical data included tumor histological type, differentiation, stage of the primarytumor (T), lymph node metastasis (N), and distant metastasis (M). The 5-year DMFS data were available only for UHCW cases.All CRC patients were diagnosed with locally advanced tumors (T3/T4) and negative lymph node (N0). Some patients appearedto have distant metastatic tumors at the time of diagnosis (M1), but the majority did not (M0). The TNM classification wasreviewed and conducted according to the AJUCC/UICC-TNM staging system18. Summary details of the clinical informationare given in Table 1.
The data used for this study including the WSIs and clinical information was provided after de-identification and informedpatient consent was obtained from all subjects. Ethics approval for this study was obtained from the National Research EthicsService North West (REC reference 15/NW/0843). All the experiments were carried out in accordance with approved guidelinesand regulations.
Histological samples and ImagingFor each case, tissue sections were prepared from an FFPE tumor tissue block and were then stained with H&E. Each tissuesection was prepared in the pathology laboratory of the UHCW hospital. Histological slides were digitally scanned using theOmnyx VL120 Scanner (GE Omnyx, LLC) with an ×40 setting (equivalent to 0.275 µm/pixel). The scanned images weremanually reviewed to control for failed autofocus. The tumor slides of all the cases were reviewed by the pathologists (DS, YT,and IM) and the slides showing the deepest invasion into the bowel wall and/or the worst differentiated parts of the tumor, wereselected for analysis.
Detection and classification of cells based on nuclear appearanceTwo separate convolutional neural networks (CNNs) were trained, one for detection and another for classification of cells22. Aspatially-constrained CNN produced a probability map assigning to each pixel the probability of being the center of a cell.Subsequently, the locations of cells were estimated by the local maxima of the probability map. To classify a detected cell,multiple small sub-images in the neighborhood of the detected cell were extracted and then fed to the neighboring ensemblepredictor (NEP). The NEP was trained to classify 4 cell types: malignant epithelial cells, inflammatory cells (includingeosinophils, lymphocytes, and neutrophils), spindle-shaped cells (including normal fibroblasts, CAFs, and smooth musclecells), and necrotic debris.
The training and validation of the two algorithms were carried out on a dataset consisting of more than 20,000 cells,annotated by an experienced pathologist and a trained observer. The pixel resolution of images in the dataset was reduced to0.55 µm (equivalent to using a ×20 microscope objective). This dataset consisted of certain H&E-stained WSIs from cases thatwere initially excluded from the study. Based on a 2-fold cross-validation, the cell detection algorithm achieved an F1-scoreof 0.802 and the cell classification algorithm a multiclass AUC score59 of 0.917. For more details of the cell detection andclassification method, see Sirinukunwattana et al.22.
Quantifying local tissue characteristicWe first split a WSI into small non-overlapping image tiles of size 200×200 µm2 (Fig. 1a), which was within the limit ofeffective intercellular communication distance60. For each image tile, a cell network (in computational terms, a graph) wasconstructed based on cell detection and classification results (Fig. 1b). The vertices of the network represent cells of differenttypes. The network itself is the associated Delaunay triangulation (Fig. 1c), so that an edge represents a connection between apair of neighboring cells. The edges connecting cells in one tile with cells in an adjacent tile were not considered. Since thereare 4 cell classes, there are 10 possible pairs of cell-cell connections in the network. We then used the distribution of differentcell-cell connection types (Fig. 1d) to characterize a given image tile.
6/16
Tissue phenotyping using cell-cell connection frequenciesIn order to group image tiles into different phenotypes, we first calculate a feature vector based on cell-cell connectionfrequencies. We consider the 4-element set A = {M, I,S,N}, where M denotes the malignant epithelial type, I the inflammatorytype, S the spindle-shaped type, and N the necrotic debris type. We also identify A with 1,2,3,4 and define an indexing setQ = {(i, j)|i≥ j}. Let h =
[h(i, j)|(i, j) ∈ Q
]∈ R10 be the ten-dimensional cell-cell connection frequency vector representing
the frequencies of all cell-cell connections, where h(i, j) ∈ [0,1] denotes the proportion of connection frequencies between cellsof types i and j. We calculated this vector for every image tile extracted from every WSI in the dataset.
Next, we performed k-medoid clustering on all frequency vectors, calculated as above, for all tiles in all WSIs in thedataset in order to group image tiles into different phenotypes. This unsupervised algorithm (we used the k-medoid algorithmimplemented in Matlab 2016b) automatically finds a set of medoids — representative frequency vectors for tile phenotypeswithin the data — and assigns a phenotype label to each tile according to its nearest medoid. We employed the Chi-squareddistance between a frequency vector h and a medoid m given by:
d(h,m) = ∑k∈Q
(hk−mk)2
hk +mk
We initialized the medoids randomly and ran the clustering algorithm 100 times for each trial. We then used the results from thereplicate that yielded the smallest total sum of distances between the frequency vectors and their corresponding medoids. Thecriteria used to determine the number of phenotypes k were the similarity between the phenotypes and the correlation betweentissue morphometric features derived from the phenotypes (described below). The similarity between a pair of phenotypes wasmeasured in terms of the Chi-squared distance between the pair of medoids representing the phenotypes. Correlation between apair of features was measured by the Spearman correlation coefficient. In order to find a suitable number of distinct phenotypesk, we chose the maximum number of phenotypes that produced relatively high values of Chi-squared distance and relatively lowvalues of correlation between distinct features. A distance value less than 0.2 and a correlation coefficient value greater than 0.8were considered undesirable. We found that k=6 is the maximum number of phenotypes that satisfies both criteria (Fig S4).
Examples of image tiles from different tissue phenotypes discovered using cell-cell connection frequencies are shown inFig. 1e. As can be observed in Fig. 1e, the six connection frequency (CF) based phenotypes found automatically correspondedwell with the following distinct tissue phenotypes: smooth muscle, inflammation, tumor-stroma interface, tumor, stroma, andnecrosis.
Tissue phenotyping based on appearanceWe also trained a deep learning based CNN for patch-based tissue phenotyping, in which the following 9 categories of imagepatches were explicitly considered: normal, non-tissue background, loose connective tissue (submucosa), fat (adipose), stroma(desmoplasia), inflammation, necrosis, smooth muscle, and tumor. Each image patch was of size 32×32 pixels with a pixelresolution of 2.2 µm/pixels ( 5× objective). The architecture of the CNN was a simplified version of that proposed by Simonyanet al.61.
In developing this appearance (AP) based approach to tissue phenotyping, we used a dataset consisting of 193 sub-images,each of size 1,346×982 pixels. These images were extracted from WSIs of cases that were initially excluded from the study.A trained observer (KS) annotated all images. We randomly split the images into three parts with 52.5% for training, 17.5%for validation, and 30% for testing. Each WSI contributed images to only one part of the split. For training and validation,we extracted multiple patches of size 32×32 pixels from the training and validation images. We selected the version of thealgorithm that yielded the best performance on the validation part. In testing, for each test image, we extracted patches in asliding-window fashion and classified each of them separately before merging the results together to obtain a segmentationresult for the whole image. The correct classification accuracies for the 9 tissue phenotypes were as follows: normal 98.9%,non-tissue background 99.9%, loose connective tissue (submucosa) 98.4%, fat (adipose) 97.9%, stroma (desmoplasia) 90.4%,inflammation 99.3%, necrosis 98.2%, smooth muscle 97.5%, and tumor 96.0%.
We ran the trained segmentation algorithm on the 108 H&E-stained WSI images, used in the analyses. Examples of thesegmentation results can be seen in Fig. S1. Furthermore, as a quality control, segmentation results of 10 images (out of 108images) were randomly selected and then reviewed by expert pathologists (DS, IC).
Automatically-derived tissue phenotypic featuresThe CF and AP based tissue phenotypic features were calculated as follows:
phenotype ratio =area of the tissue phenotype
total tissue area
7/16
Here, the tissue area was computed from all tissue types excluding the normal and fat regions. The other tissue phenotypicfeatures were quantified as follows:
stroma-tumor ratio =stroma area
stroma area+ tumor area
necrosis-tumor ratio =necrosis area
necrosis area+ tumor areawhere stroma, tumor, and necrosis areas were obtained from the AP based phenotyping results.
Statistical analysesOur analysis did not distinguish well differentiated from moderately differentiated tumors—as recommended by Compton etal.62, 63, this helps to avoid contradictory labelling by two different observers, or even by a single observer, looking at the samesample on two different occasions. Missing data were filled in with 100 imputed values using the multiple imputation methodimplemented in the R ‘mice’ library64. Analyses were performed on every imputed dataset and the results were combined toyield an overall estimate65. The significance level was set to 0.05 for all the tests described below.
Association between the tissue phenotypic and standard clinical features was tested by the Mann-Whitney test and thestrength of association was determined through coefficients of determination (r2) of the test66, 67. The median p-value and r2
were reported for a variable with multiple imputed values. We used the ‘rms’ library in R68 to fit logistic regression models, tocalculate the area under the receiver operating characteristic curve (AUC), and to perform survival and bootstrap analyses.
Logistic regression analysis was performed to assess the predictive power of each phenotypic feature in identifying patientswith concurrent distant metastasis at the time of diagnosis or a propensity for distant metastasis development. Effects of theautomatically-derived features were gauged after adjusting for the standard clinical variables in multivariate logistic regressionmodels. A total of 108 cases (78 UHCW and 30 HGH) were used in the analysis. The 5-year metastasis status was treatedas a binary outcome and features were treated as predictors in regression models. Estimated odds ratio and its 95% CI wereobtained for each feature to quantify the risk of distant metastasis development associated with the feature. We reported thefactor of change in odds ratio when the value of a feature changes from the baseline value to the new value. For a continuousfeature, the baseline and the changed values were set to the 1st and 3rd quartiles of the feature. Furthermore, likelihood ratiop-values were computed to assess goodness of fit of predictive models contributed by various features.
Survival analysis was performed to determine the prognostic value for DMFS associated with each feature. Univariateand multivariate Cox proportional hazards regression analyses were conducted on 78 cases from the UHCW cohort for whichDMFS data were available. The former was used to evaluate the prognostic impact of each feature separately while the latterwas used to assess the prognostic value of image-based tissue phenotypic features while adjusting for the effects of the clinicalfeatures. Rao’s score test and Wald test were employed in the univariate and multivariate analyses, respectively, to test whetherthe regression coefficient corresponding to a particular feature in the Cox proportional hazards model was nonzero. Note thatthe score test is equivalent to the log-rank test when only a single categorical feature is considered in the model69. Hazard ratioand 95% CI estimates were obtained for each feature. To internally validate the performance of each fitted Cox proportionalhazards model in predicting the survival probability, a bootstrap routine70 with 100 resampling replicates was employed toestimate the AUC. The statistical significance difference between survival stratifications was determined through the log-ranktest using the R ‘survival’ library71. The cutoff with minimum p-value was used for stratification, and the p-value was adjustedaccording to Altman’s correction72 in case of a continuous feature.
Data AvailabilityThe datasets generated during and/or analyzed during the current study are available from the corresponding author onreasonable request. Extracted image features and codes to perform statistical analyses will be included in the SupplementaryInformation files once the manuscript has been accepted for publication.
References1. Bissell, M. J. & Hines, W. C. Why don’t we get more cancer? A proposed role of the microenvironment in restraining
cancer progression. Nat. medicine 17, 320–329 (2011).
2. Stoker, A. W., Hatier, C. & Bissell, M. J. The embryonic environment strongly attenuates v-src oncogenesis in mesenchymaland epithelial tissues, but not in endothelia. The J. cell biology 111, 217–228 (1990).
3. Weaver, V. M. et al. Reversion of the malignant phenotype of human breast cells in three-dimensional culture and in vivoby integrin blocking antibodies. The J. cell biology 137, 231–245 (1997).
4. Whiteside, T. The tumor microenvironment and its role in promoting tumor growth. Oncogene 27, 5904 (2008).
8/16
5. Hanahan, D. & Weinberg, R. A. Hallmarks of cancer: the next generation. cell 144, 646–674 (2011).
6. Quail, D. F. & Joyce, J. A. Microenvironmental regulation of tumor progression and metastasis. Nat. medicine 19,1423–1437 (2013).
7. Siegel, Rebecca L and Miller, Kimberly D and Jemal, Ahmedin. Cancer statistics, 2016. CA: a cancer journal for clinicians66, 7–30 (2016).
8. Galon, J. et al. Type, density, and location of immune cells within human colorectal tumors predict clinical outcome. Sci.313, 1960–1964 (2006).
9. Mesker, W. E. et al. The carcinoma–stromal ratio of colon carcinoma is an independent factor for survival compared tolymph node status and tumor stage. Anal. Cell. Pathol. 29, 387–398 (2007).
10. Crispino, P. et al. Role of desmoplasia in recurrence of stage II colorectal cancer within five years after surgery andtherapeutic implication. Cancer investigation 26, 419–425 (2008).
11. West, N. et al. The proportion of tumour cells is an independent predictor for survival in colorectal cancer patients. Br.journal cancer 102, 1519 (2010).
12. Huijbers, A. et al. The proportion of tumor-stroma as a strong prognosticator for stage II and III colon cancer patients:validation in the VICTOR trial. Annals Oncol. 24, 179–185 (2012).
13. Jayasinghe, C., Simiantonaki, N. & Kirkpatrick, C. J. Histopathological features predict metastatic potential in locallyadvanced colon carcinomas. BMC cancer 15, 14 (2015).
14. Dvorak, H. F. Tumors: wounds that do not heal. New Engl. J. Medicine 315, 1650–1659 (1986).
15. Schafer, M. & Werner, S. Cancer as an overhealing wound: an old hypothesis revisited. Nat. reviews Mol. cell biology 9,628–638 (2008).
16. Pollheimer, M. J. et al. Tumor necrosis is a new promising prognostic factor in colorectal cancer. Hum. pathology 41,1749–1757 (2010).
17. Richards, C. et al. Prognostic value of tumour necrosis and host inflammatory responses in colorectal cancer. Br. J. Surg.99, 287–294 (2012).
18. Edge, S. B. & Compton, C. C. The American Joint Committee on Cancer: the 7th edition of the AJCC cancer stagingmanual and the future of TNM. Annals surgical oncology 17, 1471–1474 (2010).
19. Punt, C., Koopman, M. & Vermeulen, L. From tumour heterogeneity to advances in precision treatment of colorectalcancer. Nat. Rev. Clin. Oncol 14, 235–246 (2017).
20. Dalerba, P. et al. Single-cell dissection of transcriptional heterogeneity in human colon tumors. Nat. biotechnology 29,1120–1127 (2011).
21. Marusyk, A. & Polyak, K. Tumor heterogeneity: causes and consequences. Biochimica et Biophys. Acta (BBA)-Reviewson Cancer 1805, 105–117 (2010).
22. Sirinukunwattana, K. et al. Locality sensitive deep learning for detection and classification of nuclei in routine coloncancer histology images. IEEE transactions on medical imaging 35, 1196–1206 (2016).
23. Maley, C. C., Koelble, K., Natrajan, R., Aktipis, A. & Yuan, Y. An ecological measure of immune-cancer colocalization asa prognostic factor for breast cancer. Breast Cancer Res. 17, 131 (2015).
24. Yuan, Y. et al. Quantitative image analysis of cellular heterogeneity in breast tumors complements genomic profiling. Sci.translational medicine 4, 157ra143–157ra143 (2012).
25. Nawaz, S., Heindl, A., Koelble, K. & Yuan, Y. Beyond immune density: critical role of spatial heterogeneity in estrogenreceptor-negative breast cancer. Mod. Pathol. 28, 766 (2015).
26. Beck, A. H. et al. Systematic analysis of breast cancer morphology uncovers stromal features associated with survival. Sci.translational medicine 3, 108ra113–108ra113 (2011).
27. Yu, K.-H. et al. Predicting non-small cell lung cancer prognosis by fully automated microscopic pathology image features.Nat. communications 7 (2016).
28. Koelzer, V. H. & Lugli, A. The tumor border configuration of colorectal cancer as a histomorphological prognosticindicator. Front. oncology 4 (2014).
29. Karamitopoulou, E. et al. Tumour border configuration in colorectal cancer: proposal for an alternative scoring systembased on the percentage of infiltrating margin. Histopathol. 67, 464–473 (2015).
9/16
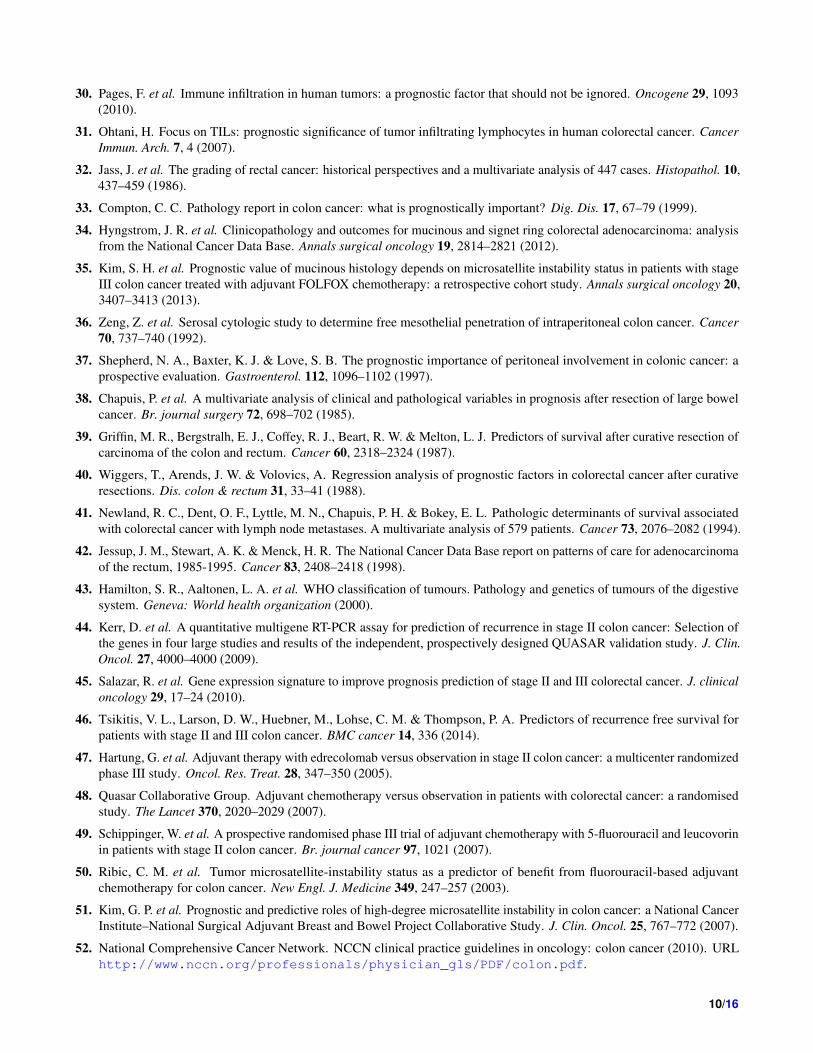
30. Pages, F. et al. Immune infiltration in human tumors: a prognostic factor that should not be ignored. Oncogene 29, 1093(2010).
31. Ohtani, H. Focus on TILs: prognostic significance of tumor infiltrating lymphocytes in human colorectal cancer. CancerImmun. Arch. 7, 4 (2007).
32. Jass, J. et al. The grading of rectal cancer: historical perspectives and a multivariate analysis of 447 cases. Histopathol. 10,437–459 (1986).
33. Compton, C. C. Pathology report in colon cancer: what is prognostically important? Dig. Dis. 17, 67–79 (1999).
34. Hyngstrom, J. R. et al. Clinicopathology and outcomes for mucinous and signet ring colorectal adenocarcinoma: analysisfrom the National Cancer Data Base. Annals surgical oncology 19, 2814–2821 (2012).
35. Kim, S. H. et al. Prognostic value of mucinous histology depends on microsatellite instability status in patients with stageIII colon cancer treated with adjuvant FOLFOX chemotherapy: a retrospective cohort study. Annals surgical oncology 20,3407–3413 (2013).
36. Zeng, Z. et al. Serosal cytologic study to determine free mesothelial penetration of intraperitoneal colon cancer. Cancer70, 737–740 (1992).
37. Shepherd, N. A., Baxter, K. J. & Love, S. B. The prognostic importance of peritoneal involvement in colonic cancer: aprospective evaluation. Gastroenterol. 112, 1096–1102 (1997).
38. Chapuis, P. et al. A multivariate analysis of clinical and pathological variables in prognosis after resection of large bowelcancer. Br. journal surgery 72, 698–702 (1985).
39. Griffin, M. R., Bergstralh, E. J., Coffey, R. J., Beart, R. W. & Melton, L. J. Predictors of survival after curative resection ofcarcinoma of the colon and rectum. Cancer 60, 2318–2324 (1987).
40. Wiggers, T., Arends, J. W. & Volovics, A. Regression analysis of prognostic factors in colorectal cancer after curativeresections. Dis. colon & rectum 31, 33–41 (1988).
41. Newland, R. C., Dent, O. F., Lyttle, M. N., Chapuis, P. H. & Bokey, E. L. Pathologic determinants of survival associatedwith colorectal cancer with lymph node metastases. A multivariate analysis of 579 patients. Cancer 73, 2076–2082 (1994).
42. Jessup, J. M., Stewart, A. K. & Menck, H. R. The National Cancer Data Base report on patterns of care for adenocarcinomaof the rectum, 1985-1995. Cancer 83, 2408–2418 (1998).
43. Hamilton, S. R., Aaltonen, L. A. et al. WHO classification of tumours. Pathology and genetics of tumours of the digestivesystem. Geneva: World health organization (2000).
44. Kerr, D. et al. A quantitative multigene RT-PCR assay for prediction of recurrence in stage II colon cancer: Selection ofthe genes in four large studies and results of the independent, prospectively designed QUASAR validation study. J. Clin.Oncol. 27, 4000–4000 (2009).
45. Salazar, R. et al. Gene expression signature to improve prognosis prediction of stage II and III colorectal cancer. J. clinicaloncology 29, 17–24 (2010).
46. Tsikitis, V. L., Larson, D. W., Huebner, M., Lohse, C. M. & Thompson, P. A. Predictors of recurrence free survival forpatients with stage II and III colon cancer. BMC cancer 14, 336 (2014).
47. Hartung, G. et al. Adjuvant therapy with edrecolomab versus observation in stage II colon cancer: a multicenter randomizedphase III study. Oncol. Res. Treat. 28, 347–350 (2005).
48. Quasar Collaborative Group. Adjuvant chemotherapy versus observation in patients with colorectal cancer: a randomisedstudy. The Lancet 370, 2020–2029 (2007).
49. Schippinger, W. et al. A prospective randomised phase III trial of adjuvant chemotherapy with 5-fluorouracil and leucovorinin patients with stage II colon cancer. Br. journal cancer 97, 1021 (2007).
50. Ribic, C. M. et al. Tumor microsatellite-instability status as a predictor of benefit from fluorouracil-based adjuvantchemotherapy for colon cancer. New Engl. J. Medicine 349, 247–257 (2003).
51. Kim, G. P. et al. Prognostic and predictive roles of high-degree microsatellite instability in colon cancer: a National CancerInstitute–National Surgical Adjuvant Breast and Bowel Project Collaborative Study. J. Clin. Oncol. 25, 767–772 (2007).
52. National Comprehensive Cancer Network. NCCN clinical practice guidelines in oncology: colon cancer (2010). URLhttp://www.nccn.org/professionals/physician_gls/PDF/colon.pdf.
10/16
53. Wong, S. L. et al. Hospital lymph node examination rates and survival after resection for colon cancer. Jama 298,2149–2154 (2007).
54. Moore, J., Hyman, N., Callas, P. & Littenberg, B. Staging error does not explain the relationship between the number oflymph nodes in a colon cancer specimen and survival. Surg. 147, 358–365 (2010).
55. Snead, D. R. et al. Validation of digital pathology imaging for primary histopathological diagnosis. Histopathol. 68,1063–1072 (2016).
56. Concato, J., Peduzzi, P., Holford, T. R. & Feinstein, A. R. Importance of events per independent variable in proportionalhazards analysis I. Background, goals, and general strategy. J. clinical epidemiology 48, 1495–1501 (1995).
57. Peduzzi, P., Concato, J., Feinstein, A. R. & Holford, T. R. Importance of events per independent variable in proportionalhazards regression analysis II. Accuracy and precision of regression estimates. J. clinical epidemiology 48, 1503–1510(1995).
58. Peduzzi, P., Concato, J., Kemper, E., Holford, T. R. & Feinstein, A. R. A simulation study of the number of events pervariable in logistic regression analysis. J. clinical epidemiology 49, 1373–1379 (1996).
59. Hand, D. J. & Till, R. J. A simple generalisation of the area under the ROC curve for multiple class classification problems.Mach. learning 45, 171–186 (2001).
60. Francis, K. & Palsson, B. O. Effective intercellular communication distances are determined by the relative time constantsfor cyto/chemokine secretion and diffusion. Proc. Natl. Acad. Sci. 94, 12258–12262 (1997).
61. Simonyan, K. & Zisserman, A. Very deep convolutional networks for large-scale image recognition. arXiv preprintarXiv:1409.1556 (2014).
62. Compton, C. C. et al. Prognostic factors in colorectal cancer: College of American Pathologists consensus statement 1999.Arch. pathology & laboratory medicine 124, 979–994 (2000).
63. Compton, C. C. Updated protocol for the examination of specimens from patients with carcinomas of the colon and rectum,excluding carcinoid tumors, lymphomas, sarcomas, and tumors of the vermiform appendix: a basis for checklists. Arch.pathology & laboratory medicine 124, 1016–1025 (2000).
64. Buuren, S. & Groothuis-Oudshoorn, K. mice: Multivariate imputation by chained equations in R. J. statistical software 45(2011).
65. Rubin, D. B. Multiple imputation for nonresponse in surveys, vol. 81 (John Wiley & Sons, 2004).
66. Cohen, B. H. Explaining psychological statistics (John Wiley & Sons, 2008).
67. Fritz, C. O., Morris, P. E. & Richler, J. J. Effect size estimates: current use, calculations, and interpretation. J. experimentalpsychology: Gen. 141, 2 (2012).
68. Harrell Jr, F. rms: Regression Modeling Strategies. R package version 4.5-0, 2016 (2016).
69. Therneau, T. & Grambsch, P. Modeling Survival Data: Extending the Cox Model. Statistics for Biology and Health(Springer, 2000). URL https://books.google.co.th/books?id=9kY4XRuUMUsC.
70. Harrell, F. Regression modeling strategies: with applications to linear models, logistic and ordinal regression, and survivalanalysis (Springer, 2015).
71. Therneau, T. A package for survival analysis in S. R package version 2.38, 2015 (2015).
72. Altman, D. G., Lausen, B., Sauerbrei, W. & Schumacher, M. Dangers of using optimal cutpoints in the evaluation ofprognostic factors. JNCI: J. Natl. Cancer Inst. 86, 829–835 (1994).
AcknowledgementsThis paper was made possible by NPRP grant number NPRP5-1345-1-228 from the Qatar National Research Fund (a memberof Qatar Foundation). The statements made herein are solely the responsibility of the authors. The authors would like toacknowledge the contribution by Sean James, Kayleigh Patterson, Dr. Aisha Meskiri, and Dr. Asha Rupani who involved in thepreparation, staining, and scanning of histology slides of the CRC samples used in this study.
11/16
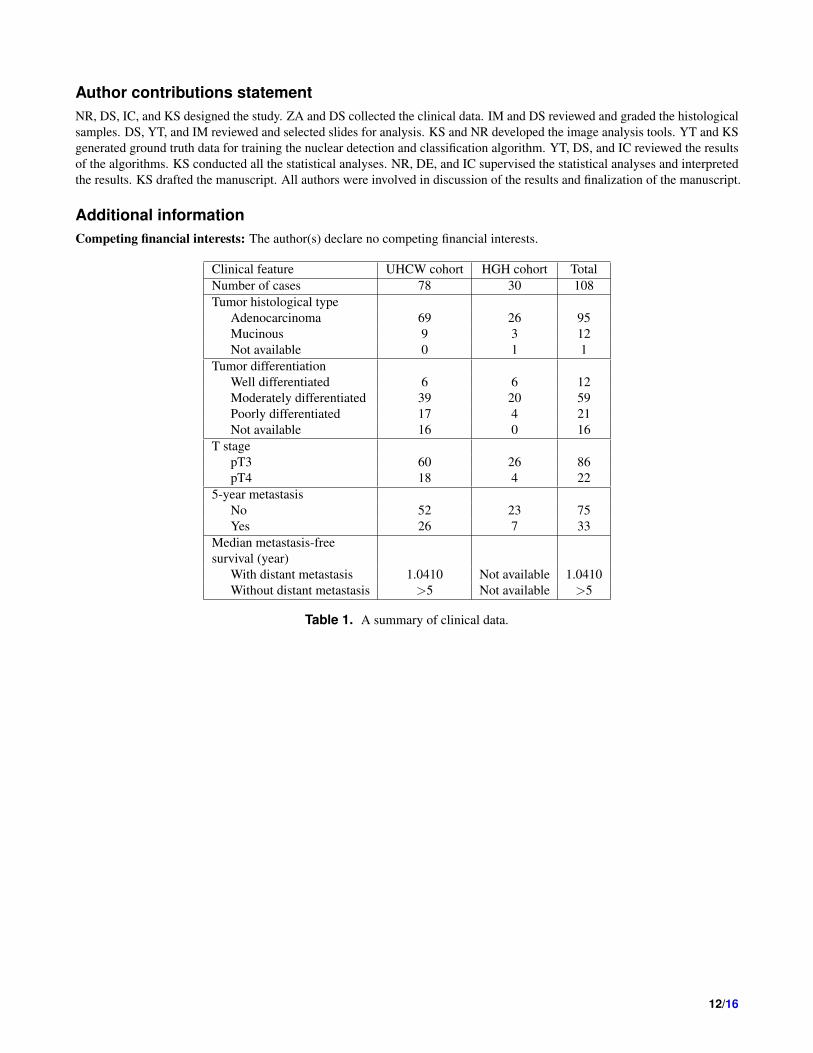
Author contributions statementNR, DS, IC, and KS designed the study. ZA and DS collected the clinical data. IM and DS reviewed and graded the histologicalsamples. DS, YT, and IM reviewed and selected slides for analysis. KS and NR developed the image analysis tools. YT and KSgenerated ground truth data for training the nuclear detection and classification algorithm. YT, DS, and IC reviewed the resultsof the algorithms. KS conducted all the statistical analyses. NR, DE, and IC supervised the statistical analyses and interpretedthe results. KS drafted the manuscript. All authors were involved in discussion of the results and finalization of the manuscript.
Additional informationCompeting financial interests: The author(s) declare no competing financial interests.
Clinical feature UHCW cohort HGH cohort TotalNumber of cases 78 30 108Tumor histological type
Adenocarcinoma 69 26 95Mucinous 9 3 12Not available 0 1 1
Tumor differentiationWell differentiated 6 6 12Moderately differentiated 39 20 59Poorly differentiated 17 4 21Not available 16 0 16
T stagepT3 60 26 86pT4 18 4 22
5-year metastasisNo 52 23 75Yes 26 7 33
Median metastasis-freesurvival (year)
With distant metastasis 1.0410 Not available 1.0410Without distant metastasis >5 Not available >5
Table 1. A summary of clinical data.
12/16
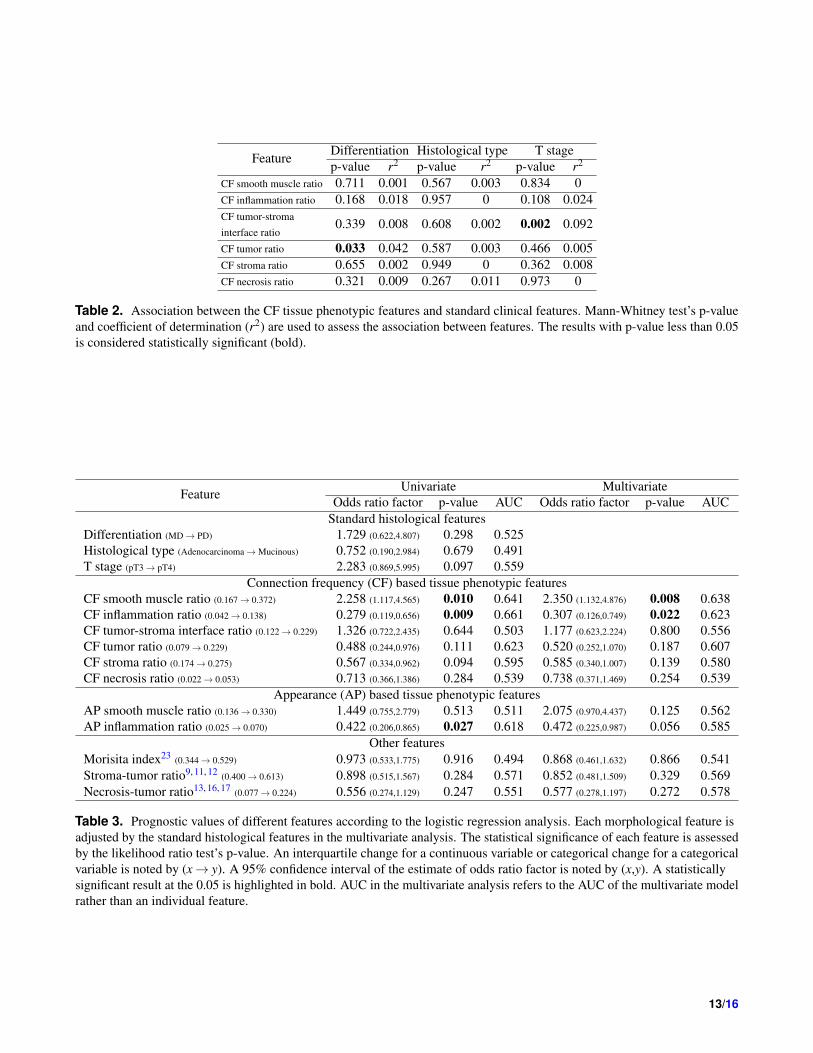
Feature Differentiation Histological type T stagep-value r2 p-value r2 p-value r2
CF smooth muscle ratio 0.711 0.001 0.567 0.003 0.834 0CF inflammation ratio 0.168 0.018 0.957 0 0.108 0.024CF tumor-stromainterface ratio
0.339 0.008 0.608 0.002 0.002 0.092
CF tumor ratio 0.033 0.042 0.587 0.003 0.466 0.005CF stroma ratio 0.655 0.002 0.949 0 0.362 0.008CF necrosis ratio 0.321 0.009 0.267 0.011 0.973 0
Table 2. Association between the CF tissue phenotypic features and standard clinical features. Mann-Whitney test’s p-valueand coefficient of determination (r2) are used to assess the association between features. The results with p-value less than 0.05is considered statistically significant (bold).
Feature Univariate MultivariateOdds ratio factor p-value AUC Odds ratio factor p-value AUC
Standard histological featuresDifferentiation (MD→ PD) 1.729 (0.622,4.807) 0.298 0.525Histological type (Adenocarcinoma→Mucinous) 0.752 (0.190,2.984) 0.679 0.491T stage (pT3→ pT4) 2.283 (0.869,5.995) 0.097 0.559
Connection frequency (CF) based tissue phenotypic featuresCF smooth muscle ratio (0.167→ 0.372) 2.258 (1.117,4.565) 0.010 0.641 2.350 (1.132,4.876) 0.008 0.638CF inflammation ratio (0.042→ 0.138) 0.279 (0.119,0.656) 0.009 0.661 0.307 (0.126,0.749) 0.022 0.623CF tumor-stroma interface ratio (0.122→ 0.229) 1.326 (0.722,2.435) 0.644 0.503 1.177 (0.623,2.224) 0.800 0.556CF tumor ratio (0.079→ 0.229) 0.488 (0.244,0.976) 0.111 0.623 0.520 (0.252,1.070) 0.187 0.607CF stroma ratio (0.174→ 0.275) 0.567 (0.334,0.962) 0.094 0.595 0.585 (0.340,1.007) 0.139 0.580CF necrosis ratio (0.022→ 0.053) 0.713 (0.366,1.386) 0.284 0.539 0.738 (0.371,1.469) 0.254 0.539
Appearance (AP) based tissue phenotypic featuresAP smooth muscle ratio (0.136→ 0.330) 1.449 (0.755,2.779) 0.513 0.511 2.075 (0.970,4.437) 0.125 0.562AP inflammation ratio (0.025→ 0.070) 0.422 (0.206,0.865) 0.027 0.618 0.472 (0.225,0.987) 0.056 0.585
Other featuresMorisita index23 (0.344→ 0.529) 0.973 (0.533,1.775) 0.916 0.494 0.868 (0.461,1.632) 0.866 0.541Stroma-tumor ratio9, 11, 12 (0.400→ 0.613) 0.898 (0.515,1.567) 0.284 0.571 0.852 (0.481,1.509) 0.329 0.569Necrosis-tumor ratio13, 16, 17 (0.077→ 0.224) 0.556 (0.274,1.129) 0.247 0.551 0.577 (0.278,1.197) 0.272 0.578
Table 3. Prognostic values of different features according to the logistic regression analysis. Each morphological feature isadjusted by the standard histological features in the multivariate analysis. The statistical significance of each feature is assessedby the likelihood ratio test’s p-value. An interquartile change for a continuous variable or categorical change for a categoricalvariable is noted by (x→ y). A 95% confidence interval of the estimate of odds ratio factor is noted by (x,y). A statisticallysignificant result at the 0.05 is highlighted in bold. AUC in the multivariate analysis refers to the AUC of the multivariate modelrather than an individual feature.
13/16
Feature Univariate MultivariateHazard ratio
factorScore testp-value
Log-rank testp-value AUC
Hazard ratiofactor
Wald testp-value AUC
Standard histological featuresDifferentiation (MD→ PD) 1.275 (0.496,3.281) 0.539 0.539 0.496Histological type (Adenocarcinoma→Mucinous) 0.580 (0.137,2.449) 0.450 0.450 0.512T stage (pT3→ pT4) 1.814 (0.787,4.181) 0.156 0.156 0.542
Connection frequency (CF) based tissue phenotypic featuresCF smooth muscle ratio (0.167→ 0.372) 2.138 (0.922,4.955) 0.016 0.036 0.633 2.467 (1.062,5.730) 0.008 0.623CF inflammation ratio (0.042→ 0.138) 0.412 (0.204,0.834) 0.039 0.258 0.608 0.413 (0.201,0.849) 0.051 0.582CF tumor-stroma interface ratio (0.122→ 0.229) 1.120 (0.619,2.029) 0.931 0.445 0.462 1.054 (0.575,1.934) 0.968 0.530CF tumor ratio (0.079→ 0.229) 0.584 (0.303,1.125) 0.174 0.399 0.584 0.520 (0.304,1.184) 0.276 0.566CF stroma ratio (0.174→ 0.275) 0.475 (0.252,0.896) 0.032 0.047 0.627 0.469 (0.245,0.895) 0.062 0.616CF necrosis ratio (0.022→ 0.053) 0.689 (0.343,1.386) 0.233 0.595 0.535 0.619 (0.302,1.267) 0.202 0.552
Appearance (AP) based tissue phenotypic featuresAP smooth muscle ratio (0.136→ 0.330) 1.515 (0.762,3.010) 0.467 0.759 0.514 2.086 (1.025,4.247) 0.127 0.563AP inflammation ratio (0.025→ 0.070) 0.401 (0.216,0.742) 0.001 0.003 0.654 0.431 (0.224,0.832) 0.009 0.625
Other featuresMorisita index23 (0.344→ 0.529) 0.844 (0.458,1.556) 0.861 0.795 0.507 0.742 (0.397,1.387) 0.646 0.502Stroma-tumor ratio9, 11, 12 (0.400→ 0.613) 0.880 (0.517,1.498) 0.607 0.529 0.519 0.813 (0.464,1.424) 0.583 0.515Necrosis-tumor ratio13, 16, 17 (0.077→ 0.224) 0.647 (0.328,1.275) 0.281 0.370 0.554 0.652 (0.331,1.286) 0.216 0.575
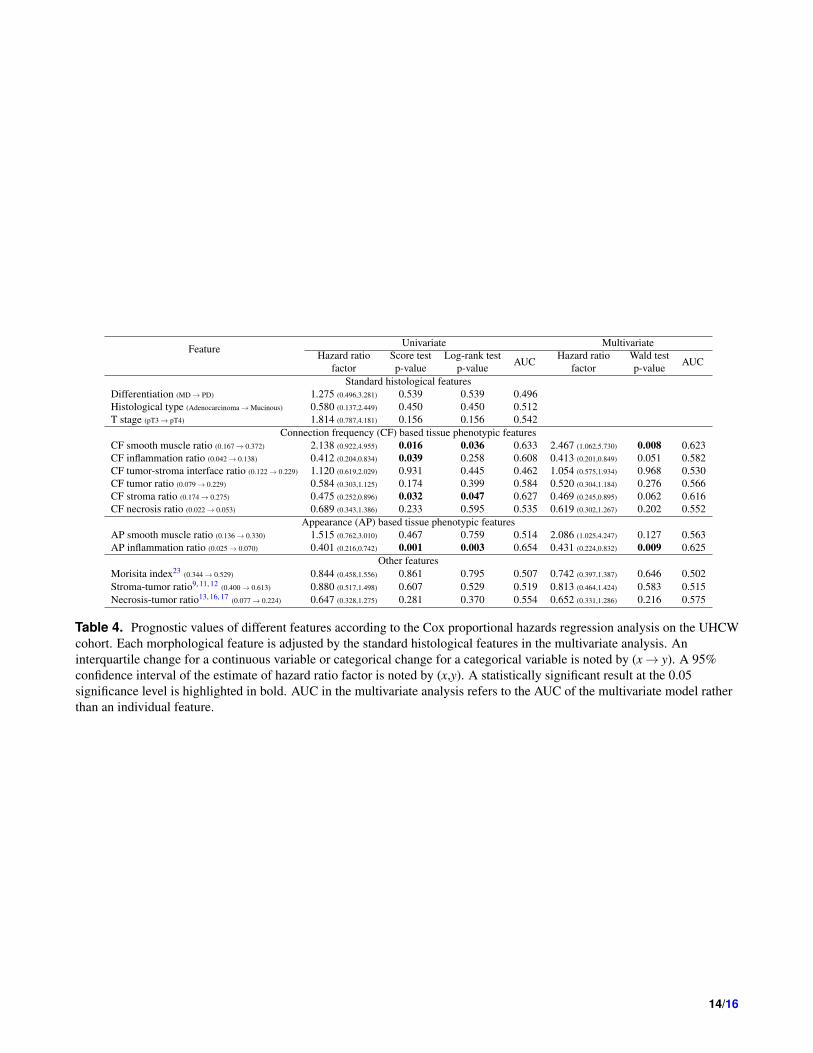
Table 4. Prognostic values of different features according to the Cox proportional hazards regression analysis on the UHCWcohort. Each morphological feature is adjusted by the standard histological features in the multivariate analysis. Aninterquartile change for a continuous variable or categorical change for a categorical variable is noted by (x→ y). A 95%confidence interval of the estimate of hazard ratio factor is noted by (x,y). A statistically significant result at the 0.05significance level is highlighted in bold. AUC in the multivariate analysis refers to the AUC of the multivariate model ratherthan an individual feature.
14/16
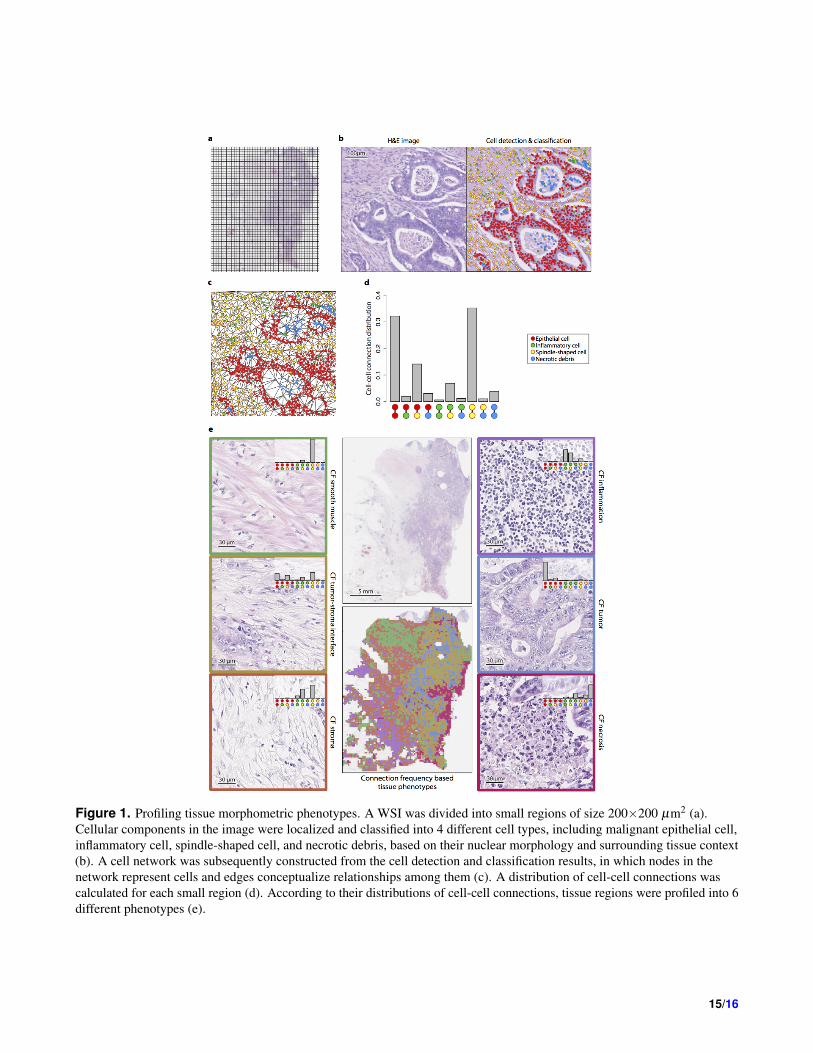
Figure 1. Profiling tissue morphometric phenotypes. A WSI was divided into small regions of size 200×200 µm2 (a).Cellular components in the image were localized and classified into 4 different cell types, including malignant epithelial cell,inflammatory cell, spindle-shaped cell, and necrotic debris, based on their nuclear morphology and surrounding tissue context(b). A cell network was subsequently constructed from the cell detection and classification results, in which nodes in thenetwork represent cells and edges conceptualize relationships among them (c). A distribution of cell-cell connections wascalculated for each small region (d). According to their distributions of cell-cell connections, tissue regions were profiled into 6different phenotypes (e).
15/16
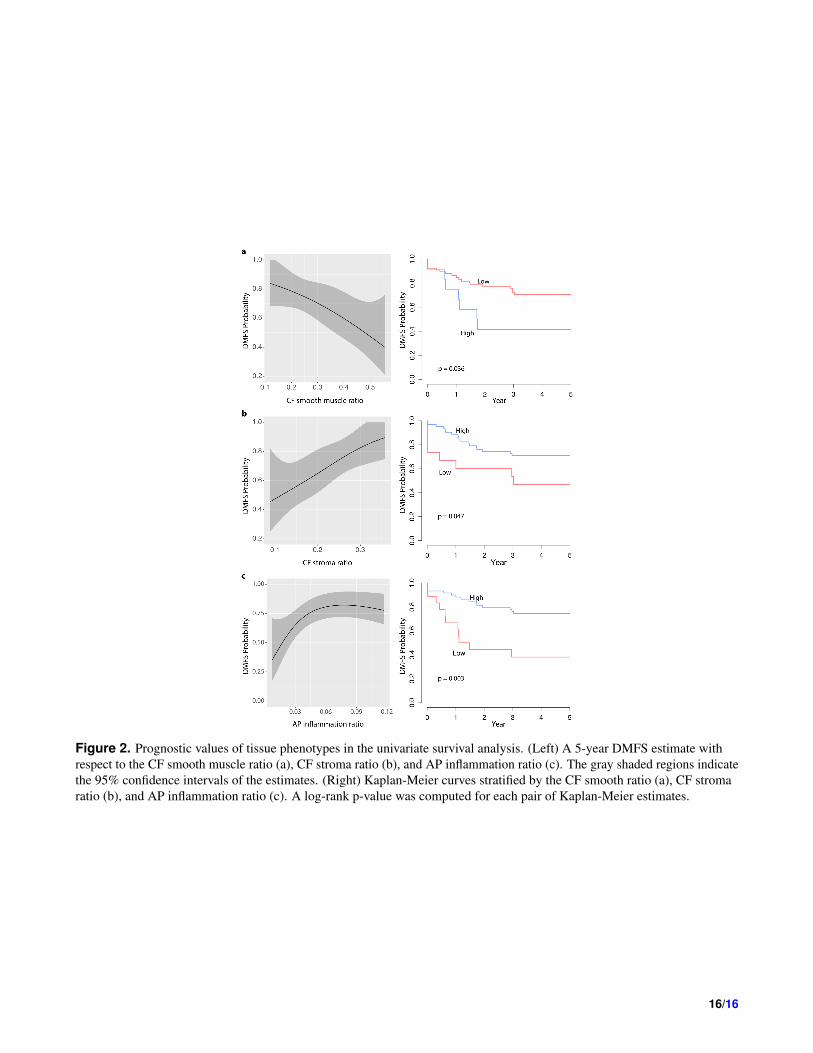
Figure 2. Prognostic values of tissue phenotypes in the univariate survival analysis. (Left) A 5-year DMFS estimate withrespect to the CF smooth muscle ratio (a), CF stroma ratio (b), and AP inflammation ratio (c). The gray shaded regions indicatethe 95% confidence intervals of the estimates. (Right) Kaplan-Meier curves stratified by the CF smooth ratio (a), CF stromaratio (b), and AP inflammation ratio (c). A log-rank p-value was computed for each pair of Kaplan-Meier estimates.
16/16