notes on fy 2011 army inventory of contract services… · notes on fy 2011 army inventory of...
TRANSCRIPT

Notes on FY 2011 Army Inventory of Contract Services:1. The Contractor Manpower Report (CMR) contains full-time equivalent (FTE) data for contractors. Contractor full-time equivalent (CFTE) data are derived from direct labor hours reported by contractors and sub-contractors for the Fiscal Year 2011 period of performance (1 October 2010 through 30 September 2011). The number of CFTEs is calculated using the rate of 2,088 direct labor hours per CFTE. By its nature, CFTE data will be different from, and less than, "head count" data that counts the number of contractor employees supporting the Department of Defense on a full- or part-time basis on any given day. 2. "Invoiced Amount," "Direct Non-Labor Costs," "Direct Labor Dollars," and "Direct Labor Hours" are reported by contractors in CMRA. The "Direct Labor Dollars" category does not include leave. CFTEs are calculated from the number of Direct Labor Hours reported by contractors.3. "Invoiced Fully Burdened Cost" is the total amount invoiced by the contractors minus the reported "Direct Non-Labor Cost."
4. Rates are calculated based on the Invoiced Fully Burdened Cost divided by the Contractor FTEs.
a. Invoiced Fully Burdened Cost (*) = Total Invoice Amount - Direct Non-Labor Cost; b. Indirect Cost = Total Invoice Amount - (Direct Non-Labor Cost + Direct Labor Cost);c. Contractor FTE Rate = Invoiced Fully Burdened Cost / Contractor FTEs; d. Contractor FTE Rate per Hour = Invoiced Fully Burdened Cost / Direct Labor Hours;
(*) Invoiced Fully Burdened Cost apportion to FTEs based on percentage of direct labor dollars
5. Indirect Cost (from FAR Part 31.2): indirect cost is any cost not directly identified with a single, final cost objective, but is identified with two or more final cost objectives or an intermediate cost objective. This includes costs which are frequently referred to as overhead expenses (for example, rent and utilities), as well as general and administrative expenses (for example, officers' salaries, accounting department costs and personnel department costs; management fees, fringe benefits, and profit).
6. Contractors' "Invoiced Fully Burdened Cost" includes only what the contractor is charging the government. The value of government furnished tools, office space, and equipment are not reflected in the data reported by the contractors (even though this is a cost borne by the government and attributable to the cost of contract performance).
7. Small business is entered by the KO in FPDS-NG, or by the Contracting Officer's Representative (COR). This is the Contracting Officer's determination of whether the contractor meets the small business size standard for the NAICS code that is applicable to the contract.

9. Data outliers that produced rates less than or equal to $10,440/CFTE, or rates greater than or equal to $750,000/CFTE, were removed to avoid skewing the overall rate calculations.
10. Outlier Data:
a. Exclude Fully Burdened Contractor FTE Rates > $750K/CFTE; b. Exclude Fully Burdened Contractor FTE Rates < $25K/CFTE (for services not provided in theater). There is no lower bound rate for contract services provided in theater. c. Exclude Location Records with FTE < 0.16 (2 Months)

Cost Factors Not In Theater by Portfolio
Contract Service PortfolioInvoiced Fully
Burdened Cost [**]
Number of Records in
Portfolio
Contractor Full-Time Equivalent
(CFTE)
Direct Labor Hours
Average Rate per (CFTE)
Average Rate per (Hour)
Minimum Rate per (CFTE)
Maximum Rate per (CFTE)
Median Rate per (CFTE)
Median Rate per (Hour)
Invoiced Fully Burdend Cost
[**] CFTE
Invoiced Fully Burdend Cost
[**] CFTE
Invoiced Fully Burdend Cost
[**] CFTE1. Research and Development $3,143,490,199 2,517 13,446.97 28,077,306 $243,017 $116 $25,459 $731,035 $85,663 $105 $1,057,740,733 6,161 $1,082,939,696 5,929 $393,151,022 1,9852. Knowledge Based Services $7,234,565,707 7,704 43,719.22 91,285,649 $174,861 $84 $25,096 $747,455 $92,028 $67 $4,347,668,079 28,730 $5,568,743,057 35,482 $1,467,284,776 10,4923. Logistics Management Services $938,326,950 673 8,249.64 17,225,235 $135,639 $65 $26,868 $741,446 $123,395 $51 $634,417,677 6,177 $769,552,250 7,186 $181,631,584 1,8064. Equipment Related Services $3,020,715,881 961 17,688.07 36,932,646 $182,538 $87 $26,795 $737,997 $97,478 $58 $2,429,043,571 15,245 $1,676,977,723 13,370 $112,271,055 1,5585. Electronic & Communication Services $1,529,353,793 1,119 8,757.02 18,284,619 $198,056 $95 $29,764 $731,390 $166,772 $81 $1,172,337,297 6,562 $1,204,414,035 7,236 $234,588,969 1,7136. Medical Services $352,480,735 892 2,376.11 4,961,280 $196,337 $94 $27,381 $633,381 $137,420 $77 $266,813,627 1,820 $273,615,150 1,825 $203,511,473 1,3987. Transportation Services $130,371,730 196 1,054.63 2,202,069 $115,611 $55 $25,903 $652,482 $38,803 $38 $57,640,960 473 $85,546,843 687 $77,037,791 6048. Facility Related Services $2,750,882,975 2,955 27,370.59 57,149,788 $145,257 $70 $25,013 $746,518 $63,720 $51 $1,580,993,192 17,070 $2,149,145,054 23,831 $769,003,021 8,1649. Construction Services $495,283,529 79 902.99 1,885,444 $294,776 $141 $27,212 $747,532 $55,000 $90 $7,958,915 47 $262,311,137 412 $5,761,651 30Not Assigned $14,430,451 23 51.27 107,050 $254,702 $122 $62,405 $654,526 $69,202 $93 $3,066,907 27 $9,434,856 38 $2,780,736 26Grand Total $19,609,901,948 17,119 123,616.50 258,111,086 $11,557,680,958 82,312 $13,082,679,802 95,997 $3,447,022,078 27,776
Govt Provided Tools and Equip
At Govt Location Small Business
[**] Contractor's Invoiced Fully Burdened Costs include only what the contractor is charging the government The value of government furnished tools, office space and equipment are not reflected in the data reported by the contractors even though this is a cost born by the government and attributable to the cost of contract performance.
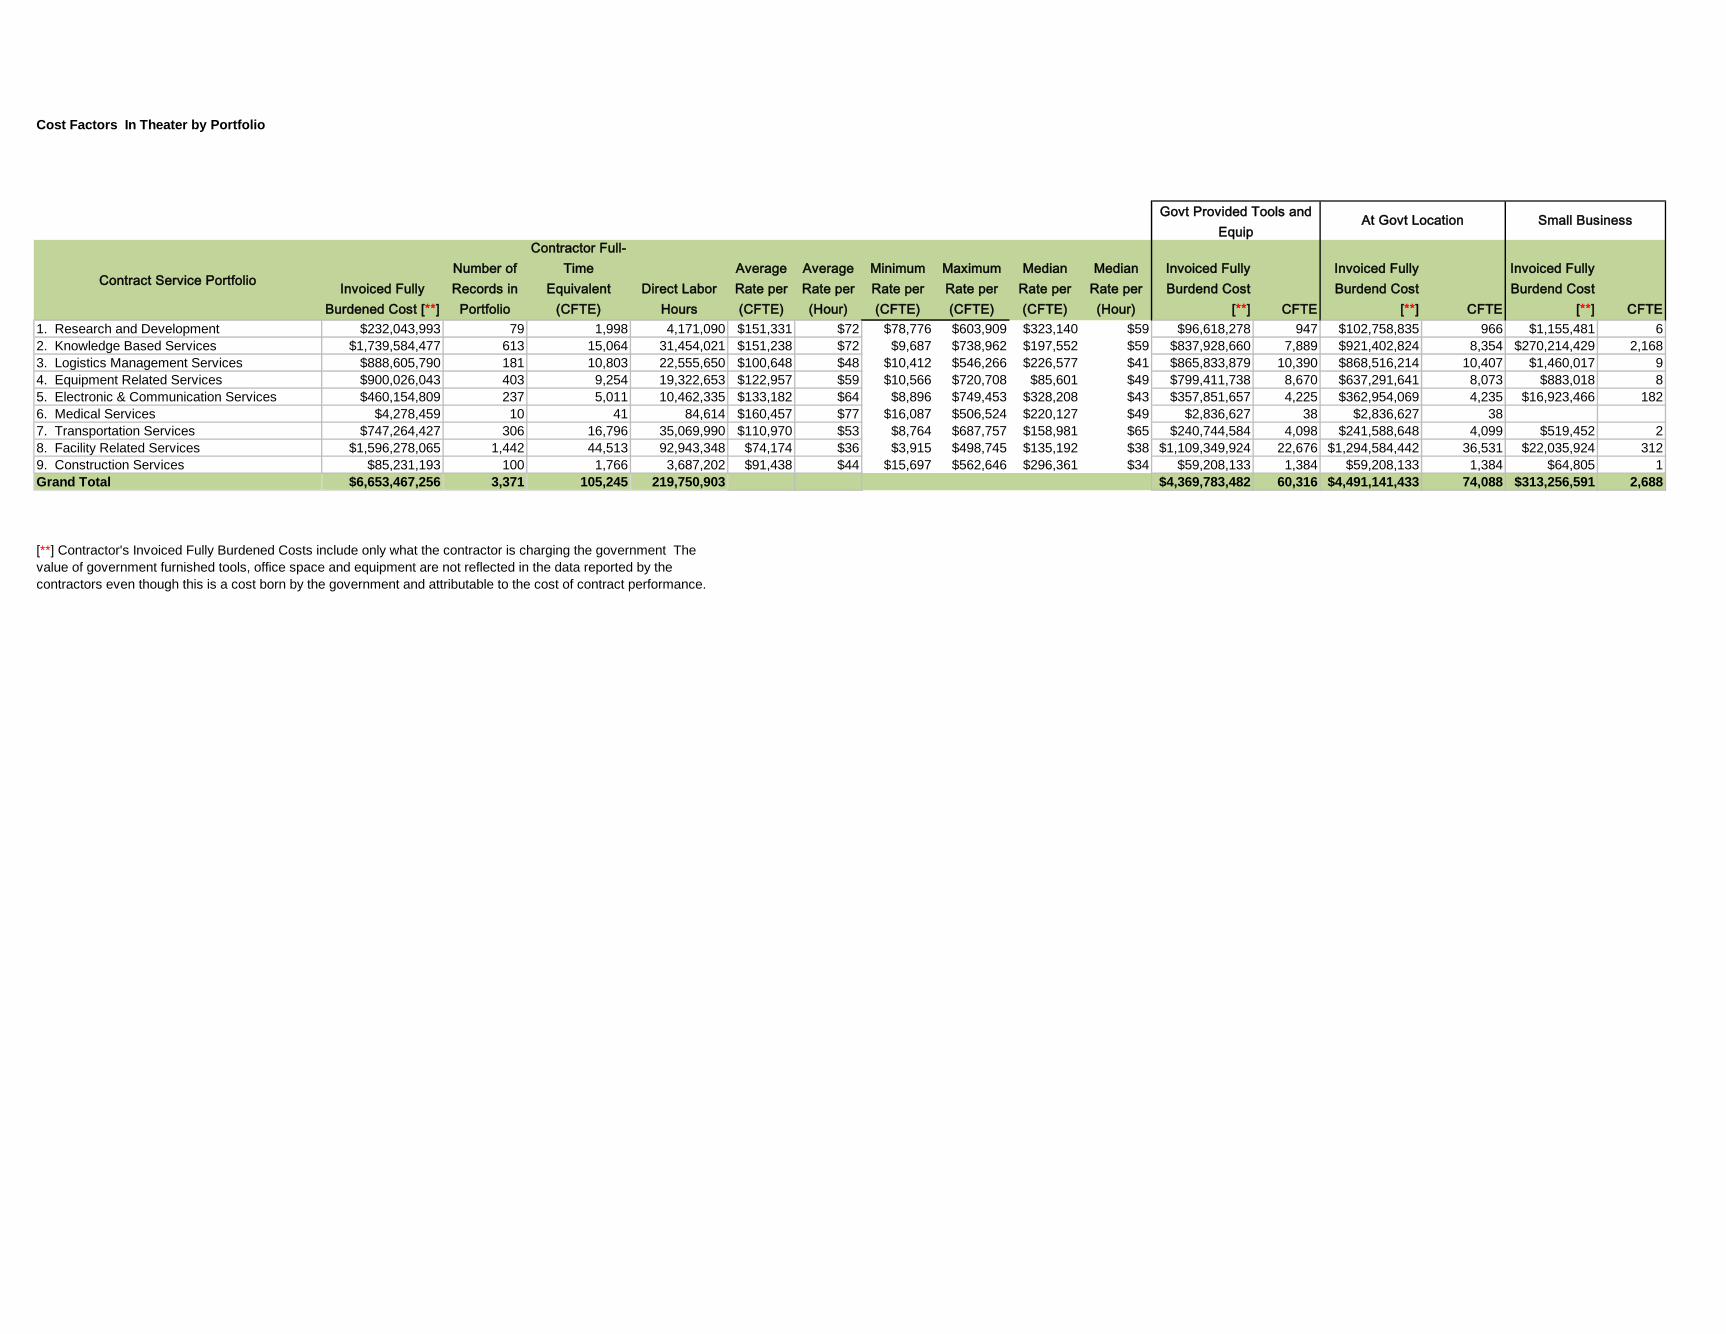
Cost Factors In Theater by Portfolio
Contract Service Portfolio Invoiced Fully Burdened Cost [**]
Number of Records in
Portfolio
Contractor Full-Time
Equivalent (CFTE)
Direct Labor Hours
Average Rate per (CFTE)
Average Rate per (Hour)
Minimum Rate per (CFTE)
Maximum Rate per (CFTE)
Median Rate per (CFTE)
Median Rate per (Hour)
Invoiced Fully Burdend Cost
[**] CFTE
Invoiced Fully Burdend Cost
[**] CFTE
Invoiced Fully Burdend Cost
[**] CFTE1. Research and Development $232,043,993 79 1,998 4,171,090 $151,331 $72 $78,776 $603,909 $323,140 $59 $96,618,278 947 $102,758,835 966 $1,155,481 62. Knowledge Based Services $1,739,584,477 613 15,064 31,454,021 $151,238 $72 $9,687 $738,962 $197,552 $59 $837,928,660 7,889 $921,402,824 8,354 $270,214,429 2,1683. Logistics Management Services $888,605,790 181 10,803 22,555,650 $100,648 $48 $10,412 $546,266 $226,577 $41 $865,833,879 10,390 $868,516,214 10,407 $1,460,017 94. Equipment Related Services $900,026,043 403 9,254 19,322,653 $122,957 $59 $10,566 $720,708 $85,601 $49 $799,411,738 8,670 $637,291,641 8,073 $883,018 85. Electronic & Communication Services $460,154,809 237 5,011 10,462,335 $133,182 $64 $8,896 $749,453 $328,208 $43 $357,851,657 4,225 $362,954,069 4,235 $16,923,466 1826. Medical Services $4,278,459 10 41 84,614 $160,457 $77 $16,087 $506,524 $220,127 $49 $2,836,627 38 $2,836,627 387. Transportation Services $747,264,427 306 16,796 35,069,990 $110,970 $53 $8,764 $687,757 $158,981 $65 $240,744,584 4,098 $241,588,648 4,099 $519,452 28. Facility Related Services $1,596,278,065 1,442 44,513 92,943,348 $74,174 $36 $3,915 $498,745 $135,192 $38 $1,109,349,924 22,676 $1,294,584,442 36,531 $22,035,924 3129. Construction Services $85,231,193 100 1,766 3,687,202 $91,438 $44 $15,697 $562,646 $296,361 $34 $59,208,133 1,384 $59,208,133 1,384 $64,805 1Grand Total $6,653,467,256 3,371 105,245 219,750,903 $4,369,783,482 60,316 $4,491,141,433 74,088 $313,256,591 2,688
Govt Provided Tools and Equip
At Govt Location Small Business
[**] Contractor's Invoiced Fully Burdened Costs include only what the contractor is charging the government The value of government furnished tools, office space and equipment are not reflected in the data reported by the contractors even though this is a cost born by the government and attributable to the cost of contract performance.

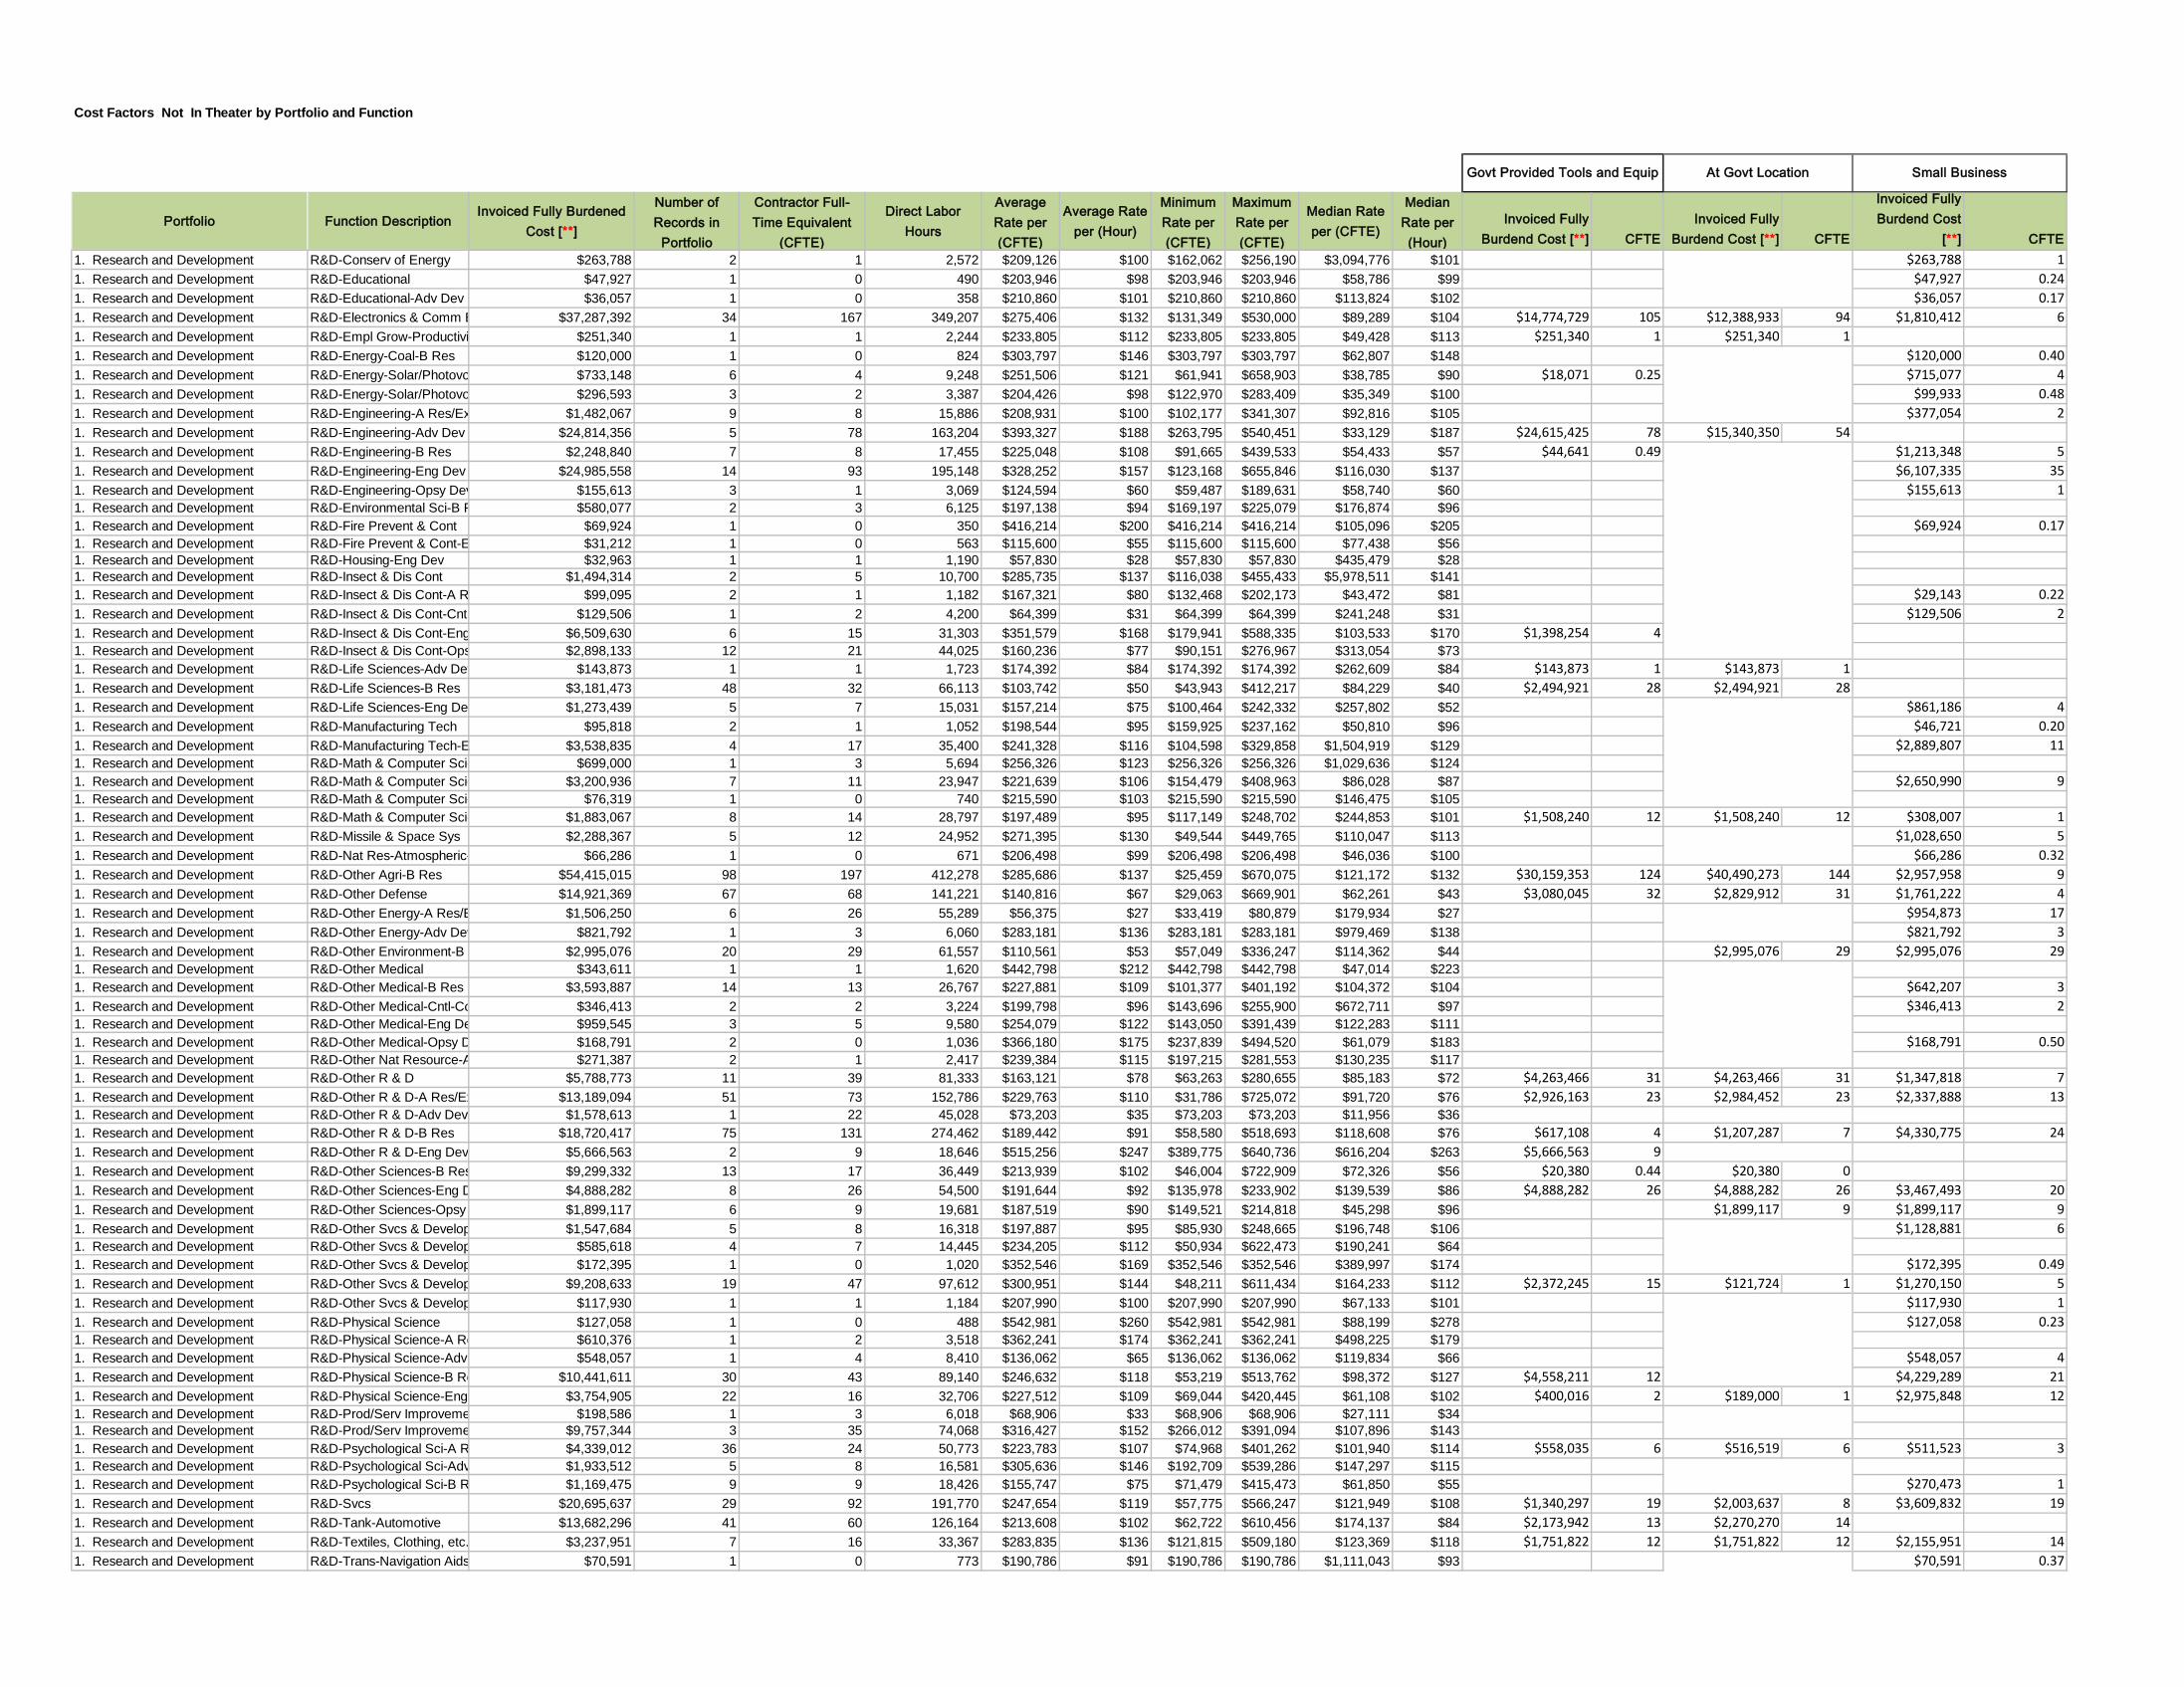
Cost Factors Not In Theater by Portfolio and Function
Portfolio Function DescriptionInvoiced Fully Burdened
Cost [**]
Number of Records in
Portfolio
Contractor Full-Time Equivalent
(CFTE)
Direct Labor Hours
Average Rate per (CFTE)
Average Rate per (Hour)
Minimum Rate per (CFTE)
Maximum Rate per (CFTE)
Median Rate per (CFTE)
Median Rate per (Hour)
Invoiced Fully Burdend Cost [**] CFTE
Invoiced Fully Burdend Cost [**] CFTE
Invoiced Fully Burdend Cost
[**] CFTE1. Research and Development R & D/Aircraft-Adv Tech De $28,961,818 14 231 483,244 $314,104 $150 $91,641 $645,199 $257,571 $165 $21,402,107 210 $19,610,945 204 $16,063,524 1551. Research and Development R & D/Aircraft-Applied Rese $7,729,940 30 24 49,222 $299,582 $143 $70,638 $588,624 $66,029 $145 $4,730,294 161. Research and Development R & D/Aircraft-Basic Resea $545,377 2 2 3,794 $314,656 $151 $255,170 $374,141 $98,825 $151 $545,377 21. Research and Development R & D/Aircraft-Demo/Valid $31,447,027 19 175 365,131 $258,452 $124 $113,528 $490,579 $139,732 $108 $21,411,068 133 $3,832,810 151. Research and Development R & D/Aircraft-Eng/Manuf D $368,558,925 23 1,095 2,286,095 $315,941 $151 $75,292 $639,170 $105,431 $138 $93,406,035 284 $183,290,967 559 $194,667 11. Research and Development R & D/Aircraft-Operational S $333,950 1 1 3,028 $230,310 $110 $230,310 $230,310 $162,864 $1101. Research and Development R & D/Ammunition-Adv Tec $62,999 1 0 700 $188,057 $90 $188,057 $188,057 $151,205 $90 $62,999 0.341. Research and Development R & D/Ammunition-Applied $1,291,002 6 8 17,692 $235,324 $113 $48,403 $338,453 $116,247 $123 $497,870 6 $64,983 0 $542,901 21. Research and Development R & D/Ammunition-Basic Re $103,816,430 14 1,257 2,624,412 $221,650 $106 $79,629 $415,340 $145,403 $106 $101,720,592 1,249 $101,720,592 1,2491. Research and Development R & D/Ammunition-Demo/V $46,011 1 0 496 $193,324 $93 $193,324 $193,324 $220,781 $93 $46,011 0.241. Research and Development R & D/Ammunition-Eng/Man $9,650,150 12 25 52,596 $288,133 $138 $81,751 $665,333 $92,938 $113 $3,913,236 14 $3,913,236 14 $92,082 11. Research and Development R & D/Construction-Applied $305,825 1 1 3,120 $204,702 $98 $204,702 $204,702 $95,778 $98 $305,825 11. Research and Development R & D/Construction-Basic R $1,804,287 8 5 10,885 $386,036 $185 $158,600 $731,035 $333,092 $174 $731,001 2 $521,940 21. Research and Development R & D/Construction-Eng/Ma $1,746,246 1 7 13,734 $265,468 $127 $265,468 $265,468 $178,028 $127 $1,746,246 71. Research and Development R & D/Electronics & Comm $188,594,234 94 894 1,867,704 $240,896 $115 $45,044 $574,140 $112,562 $101 $124,300,131 594 $114,860,646 559 $2,920,599 81. Research and Development R & D/Electronics & Comm $24,110,441 40 77 159,944 $270,285 $129 $47,659 $628,156 $103,381 $120 $16,077,325 47 $14,144,320 34 $2,139,247 81. Research and Development R & D/Electronics & Comm $15,385,535 40 68 142,158 $296,481 $142 $106,024 $728,346 $107,035 $116 $6,864,311 37 $7,055,187 37 $11,796,475 571. Research and Development R & D/Electronics & Comm $255,360,153 23 827 1,726,684 $284,968 $136 $145,024 $441,233 $83,046 $134 $25,248,474 117 $25,248,474 117 $723,245 51. Research and Development R & D/Electronics & Comm $51,525,631 15 170 354,514 $297,460 $142 $175,891 $517,607 $80,670 $129 $43,138,596 137 $8,413,974 391. Research and Development R & D/Electronics & Comm $181,698,294 47 647 1,350,934 $279,867 $134 $173,762 $351,511 $185,790 $139 $731,563 3 $121,657,605 4321. Research and Development R & D/Misc Hard Goods-Ad $17,188,108 2 204 425,094 $170,296 $82 $83,399 $257,192 $197,119 $82 $16,878,963 202 $16,878,963 2021. Research and Development R & D/Misc Hard Goods-Ap $448,543 3 4 9,327 $109,379 $52 $98,718 $130,533 $27,303 $47 $251,434 31. Research and Development R & D/Misc Hard Goods-Ba $232,406 2 1 2,594 $152,048 $73 $79,334 $224,762 $810,571 $73 $232,406 11. Research and Development R & D/Misc Hard Goods-Op $1,192,732 2 7 15,647 $145,617 $70 $79,975 $211,258 $591,757 $70 $1,192,732 7 $954,885 5 $1,192,732 71. Research and Development R & D/Missile and Space Sy $199,783,377 60 632 1,319,774 $283,435 $136 $74,206 $685,133 $95,779 $123 $38,903,583 126 $34,819,136 112 $17,921,920 851. Research and Development R & D/Missile and Space Sy $33,295,602 56 114 237,497 $304,154 $146 $101,132 $595,758 $89,361 $143 $1,300,356 13 $1,300,356 13 $17,791,379 531. Research and Development R & D/Missile and Space Sy $89,601,515 41 495 1,033,486 $234,592 $112 $67,458 $568,170 $49,841 $105 $28,781,774 212 $85,736,751 480 $78,664,944 4231. Research and Development R & D/Missile and Space Sy $33,813,299 7 115 239,955 $264,806 $127 $85,177 $433,879 $49,092 $139 $23,356,287 811. Research and Development R & D/Missile and Space Sy $50,136,567 25 138 287,156 $362,472 $174 $103,275 $479,153 $135,476 $171 $435,412 2 $2,664,263 10 $5,196,365 211. Research and Development R & D/Missile and Space Sy $29,176,289 10 102 213,745 $232,132 $111 $137,414 $354,373 $102,333 $116 $156,585 0.48 $28,796,476 100 $29,019,704 1021. Research and Development R & D/Other Defense-Adv T $10,400,802 22 48 100,320 $251,031 $120 $100,527 $600,108 $100,504 $105 $712,847 3 $1,092,892 5 $2,835,512 121. Research and Development R & D/Other Defense-Applie $87,858,890 200 504 1,052,571 $197,314 $95 $31,097 $601,760 $114,790 $80 $68,874,738 414 $47,873,315 337 $9,099,886 431. Research and Development R & D/Other Defense-Demo $2,597,818 9 11 23,534 $295,232 $141 $98,187 $454,973 $58,560 $116 $1,237,312 31. Research and Development R & D/Other Defense-Eng/M $2,605,397 19 9 19,032 $281,740 $135 $62,774 $430,086 $136,186 $132 $1,390,032 61. Research and Development R & D/Other Defense-Opera $23,988,999 89 117 245,064 $237,224 $114 $51,250 $706,944 $88,901 $90 $7,852,524 40 $7,852,524 401. Research and Development R & D/Services-Adv Tech D $50,527,371 58 239 498,602 $236,478 $113 $57,808 $712,405 $150,127 $101 $6,642,960 32 $8,863,640 40 $5,641,400 251. Research and Development R & D/Services-Applied Res $79,641,030 214 390 813,484 $265,070 $127 $32,696 $714,089 $121,470 $121 $18,562,782 132 $21,806,541 160 $31,928,571 1641. Research and Development R & D/Services-Basic Rese $71,379,446 152 398 830,414 $194,312 $93 $34,055 $667,271 $104,662 $82 $39,384,704 249 $38,155,814 236 $47,473,224 2741. Research and Development R & D/Services-Demo/Valid $7,371,271 20 30 61,763 $233,457 $112 $131,101 $471,494 $116,342 $99 $3,205,897 11 $3,757,349 14 $674,795 31. Research and Development R & D/Services-Eng/Manuf $59,655,690 30 185 387,211 $302,690 $145 $84,476 $617,268 $95,399 $141 $37,723,335 113 $15,722,760 56 $8,020,625 271. Research and Development R & D/Services-Operationa $88,832,031 10 282 589,071 $209,819 $100 $109,697 $345,244 $166,418 $92 $88,731,850 282 $8,532,791 45 $1,878,822 101. Research and Development R & D/Subsistence-Adv Tec $414,454 1 2 3,162 $273,748 $131 $273,748 $273,748 $175,242 $1321. Research and Development R & D/Subsistence-Applied $132,924 1 1 1,092 $254,157 $122 $254,157 $254,157 $23,892 $1221. Research and Development R & D/Subsistence-Demo/V $372,683 1 1 3,066 $253,871 $122 $253,871 $253,871 $6,195,069 $1221. Research and Development R & D/Tank - Automotive-A $1,086,289 3 9 19,067 $201,058 $96 $41,571 $416,751 $129,000 $701. Research and Development R & D/Tank - Automotive-A $8,043,409 21 32 66,286 $300,771 $144 $126,371 $722,518 $117,101 $91 $231,231 1 $889,035 5 $2,916,901 161. Research and Development R & D/Tank - Automotive-B $183,779,160 25 456 953,165 $278,896 $134 $88,679 $488,125 $118,143 $130 $11,897,114 36 $4,304,251 171. Research and Development R & D/Tank - Automotive-D $753,809 1 1 2,221 $708,467 $339 $708,467 $708,467 $232,913 $3521. Research and Development R & D/Tank - Automotive-E $48,871,918 20 258 538,430 $231,997 $111 $46,012 $425,403 $100,939 $115 $5,572,112 22 $45,496 01. Research and Development R & D/Textiles, Clothing, Eq $839,908 2 8 16,758 $115,225 $55 $97,816 $132,633 $99,376 $56 $839,908 81. Research and Development R & D/Textiles, Clothing, Eq $762,202 8 5 10,227 $176,318 $84 $58,960 $331,385 $66,450 $83 $636,199 31. Research and Development R & D/Textiles, Clothing, Eq $2,248,222 13 9 19,233 $269,270 $129 $130,481 $728,311 $95,515 $91 $309,105 2 $1,590,679 81. Research and Development R & D/Textiles, Clothing, Eq $10,015,706 10 30 62,472 $375,766 $180 $241,337 $531,180 $60,612 $1811. Research and Development R & D/Weapons-Adv Tech $10,100,489 6 41 86,026 $271,456 $130 $86,086 $569,242 $154,145 $107 $133,920 1 $133,920 1 $216,960 11. Research and Development R & D/Weapons-Applied Re $23,685,954 32 93 194,202 $257,364 $123 $46,281 $618,812 $102,204 $104 $8,388,037 52 $11,007,085 63 $8,979,472 551. Research and Development R & D/Weapons-Basic Res $3,284,144 13 13 27,472 $240,199 $115 $143,185 $374,378 $151,186 $113 $550,883 2 $550,883 2 $449,507 21. Research and Development R & D/Weapons-Demo/Vali $14,659,744 5 24 50,630 $493,461 $236 $347,094 $631,675 $58,560 $226 $1,976,023 4 $1,976,023 4 $2,042,665 41. Research and Development R & D/Weapons-Eng/Manu $188,528,170 71 1,069 2,232,308 $306,161 $147 $46,353 $664,903 $115,671 $125 $102,414,361 856 $1,568,401 8 $678,831 31. Research and Development R & D/Weapons-Operationa $399,994 1 2 3,610 $231,344 $111 $231,344 $231,344 $329,551 $1121. Research and Development R&D-Aero & Space Tech $3,970,462 4 22 46,293 $161,320 $77 $88,868 $274,671 $64,938 $68 $2,781,939 17 $3,970,462 221. Research and Development R&D-Aero & Space Tech-A $328,947 1 1 1,508 $455,605 $218 $455,605 $455,605 $42,469 $224 $328,947 11. Research and Development R&D-Agri Marketing $369,316 2 2 3,581 $225,129 $108 $207,776 $242,482 $815,058 $1081. Research and Development R&D-Agri Marketing-B Res $607,397 3 8 16,715 $77,420 $37 $75,056 $81,153 $62,394 $37 $129,141 2 $78,718 11. Research and Development R&D-Aircraft $7,913,880 10 27 55,904 $288,013 $138 $154,984 $349,899 $123,187 $146 $1,513,917 6 $1,612,689 61. Research and Development R&D-Ammunition $738,642 1 4 8,464 $182,201 $87 $182,201 $182,201 $297,080 $88 $738,642 4 $738,642 4 $738,642 41. Research and Development R&D-Biomedical $642,878 4 4 7,567 $124,874 $60 $40,454 $239,135 $427,743 $53 $93,637 1 $93,637 1 $105,045 11. Research and Development R&D-Biomedical-A Res/Exp $590,359 8 3 6,636 $173,614 $83 $86,718 $297,323 $69,969 $81 $48,637 0.291. Research and Development R&D-Biomedical-Adv Dev $68,814,189 17 203 423,303 $335,362 $161 $268,102 $339,763 $69,489 $1651. Research and Development R&D-Biomedical-B Res $953,383 3 2 3,947 $376,714 $181 $167,401 $568,060 $412,550 $193 $848,682 1 $848,682 1 $66,701 0.171. Research and Development R&D-Biomedical-Eng Dev $544,990 2 2 4,585 $159,856 $77 $42,881 $276,832 $27,238 $78 $533,455 2
Govt Provided Tools and Equip At Govt Location Small Business
Cost Factors Not In Theater by Portfolio and Function
Portfolio Function DescriptionInvoiced Fully Burdened
Cost [**]
Number of Records in
Portfolio
Contractor Full-Time Equivalent
(CFTE)
Direct Labor Hours
Average Rate per (CFTE)
Average Rate per (Hour)
Minimum Rate per (CFTE)
Maximum Rate per (CFTE)
Median Rate per (CFTE)
Median Rate per (Hour)
Invoiced Fully Burdend Cost [**] CFTE
Invoiced Fully Burdend Cost [**] CFTE
Invoiced Fully Burdend Cost
[**] CFTE
Govt Provided Tools and Equip At Govt Location Small Business
1. Research and Development R&D-Conserv of Energy $263,788 2 1 2,572 $209,126 $100 $162,062 $256,190 $3,094,776 $101 $263,788 11. Research and Development R&D-Educational $47,927 1 0 490 $203,946 $98 $203,946 $203,946 $58,786 $99 $47,927 0.241. Research and Development R&D-Educational-Adv Dev $36,057 1 0 358 $210,860 $101 $210,860 $210,860 $113,824 $102 $36,057 0.171. Research and Development R&D-Electronics & Comm E $37,287,392 34 167 349,207 $275,406 $132 $131,349 $530,000 $89,289 $104 $14,774,729 105 $12,388,933 94 $1,810,412 61. Research and Development R&D-Empl Grow-Productivi $251,340 1 1 2,244 $233,805 $112 $233,805 $233,805 $49,428 $113 $251,340 1 $251,340 11. Research and Development R&D-Energy-Coal-B Res $120,000 1 0 824 $303,797 $146 $303,797 $303,797 $62,807 $148 $120,000 0.401. Research and Development R&D-Energy-Solar/Photovo $733,148 6 4 9,248 $251,506 $121 $61,941 $658,903 $38,785 $90 $18,071 0.25 $715,077 41. Research and Development R&D-Energy-Solar/Photovo $296,593 3 2 3,387 $204,426 $98 $122,970 $283,409 $35,349 $100 $99,933 0.481. Research and Development R&D-Engineering-A Res/Ex $1,482,067 9 8 15,886 $208,931 $100 $102,177 $341,307 $92,816 $105 $377,054 21. Research and Development R&D-Engineering-Adv Dev $24,814,356 5 78 163,204 $393,327 $188 $263,795 $540,451 $33,129 $187 $24,615,425 78 $15,340,350 541. Research and Development R&D-Engineering-B Res $2,248,840 7 8 17,455 $225,048 $108 $91,665 $439,533 $54,433 $57 $44,641 0.49 $1,213,348 51. Research and Development R&D-Engineering-Eng Dev $24,985,558 14 93 195,148 $328,252 $157 $123,168 $655,846 $116,030 $137 $6,107,335 351. Research and Development R&D-Engineering-Opsy Dev $155,613 3 1 3,069 $124,594 $60 $59,487 $189,631 $58,740 $60 $155,613 11. Research and Development R&D-Environmental Sci-B R $580,077 2 3 6,125 $197,138 $94 $169,197 $225,079 $176,874 $961. Research and Development R&D-Fire Prevent & Cont $69,924 1 0 350 $416,214 $200 $416,214 $416,214 $105,096 $205 $69,924 0.171. Research and Development R&D-Fire Prevent & Cont-E $31,212 1 0 563 $115,600 $55 $115,600 $115,600 $77,438 $561. Research and Development R&D-Housing-Eng Dev $32,963 1 1 1,190 $57,830 $28 $57,830 $57,830 $435,479 $281. Research and Development R&D-Insect & Dis Cont $1,494,314 2 5 10,700 $285,735 $137 $116,038 $455,433 $5,978,511 $1411. Research and Development R&D-Insect & Dis Cont-A R $99,095 2 1 1,182 $167,321 $80 $132,468 $202,173 $43,472 $81 $29,143 0.221. Research and Development R&D-Insect & Dis Cont-Cntl $129,506 1 2 4,200 $64,399 $31 $64,399 $64,399 $241,248 $31 $129,506 21. Research and Development R&D-Insect & Dis Cont-Eng $6,509,630 6 15 31,303 $351,579 $168 $179,941 $588,335 $103,533 $170 $1,398,254 41. Research and Development R&D-Insect & Dis Cont-Ops $2,898,133 12 21 44,025 $160,236 $77 $90,151 $276,967 $313,054 $731. Research and Development R&D-Life Sciences-Adv Dev $143,873 1 1 1,723 $174,392 $84 $174,392 $174,392 $262,609 $84 $143,873 1 $143,873 11. Research and Development R&D-Life Sciences-B Res $3,181,473 48 32 66,113 $103,742 $50 $43,943 $412,217 $84,229 $40 $2,494,921 28 $2,494,921 281. Research and Development R&D-Life Sciences-Eng De $1,273,439 5 7 15,031 $157,214 $75 $100,464 $242,332 $257,802 $52 $861,186 41. Research and Development R&D-Manufacturing Tech $95,818 2 1 1,052 $198,544 $95 $159,925 $237,162 $50,810 $96 $46,721 0.201. Research and Development R&D-Manufacturing Tech-E $3,538,835 4 17 35,400 $241,328 $116 $104,598 $329,858 $1,504,919 $129 $2,889,807 111. Research and Development R&D-Math & Computer Sci- $699,000 1 3 5,694 $256,326 $123 $256,326 $256,326 $1,029,636 $1241. Research and Development R&D-Math & Computer Sci- $3,200,936 7 11 23,947 $221,639 $106 $154,479 $408,963 $86,028 $87 $2,650,990 91. Research and Development R&D-Math & Computer Sci- $76,319 1 0 740 $215,590 $103 $215,590 $215,590 $146,475 $1051. Research and Development R&D-Math & Computer Sci- $1,883,067 8 14 28,797 $197,489 $95 $117,149 $248,702 $244,853 $101 $1,508,240 12 $1,508,240 12 $308,007 11. Research and Development R&D-Missile & Space Sys $2,288,367 5 12 24,952 $271,395 $130 $49,544 $449,765 $110,047 $113 $1,028,650 51. Research and Development R&D-Nat Res-Atmospheric- $66,286 1 0 671 $206,498 $99 $206,498 $206,498 $46,036 $100 $66,286 0.321. Research and Development R&D-Other Agri-B Res $54,415,015 98 197 412,278 $285,686 $137 $25,459 $670,075 $121,172 $132 $30,159,353 124 $40,490,273 144 $2,957,958 91. Research and Development R&D-Other Defense $14,921,369 67 68 141,221 $140,816 $67 $29,063 $669,901 $62,261 $43 $3,080,045 32 $2,829,912 31 $1,761,222 41. Research and Development R&D-Other Energy-A Res/E $1,506,250 6 26 55,289 $56,375 $27 $33,419 $80,879 $179,934 $27 $954,873 171. Research and Development R&D-Other Energy-Adv Dev $821,792 1 3 6,060 $283,181 $136 $283,181 $283,181 $979,469 $138 $821,792 31. Research and Development R&D-Other Environment-B $2,995,076 20 29 61,557 $110,561 $53 $57,049 $336,247 $114,362 $44 $2,995,076 29 $2,995,076 291. Research and Development R&D-Other Medical $343,611 1 1 1,620 $442,798 $212 $442,798 $442,798 $47,014 $2231. Research and Development R&D-Other Medical-B Res $3,593,887 14 13 26,767 $227,881 $109 $101,377 $401,192 $104,372 $104 $642,207 31. Research and Development R&D-Other Medical-Cntl-Co $346,413 2 2 3,224 $199,798 $96 $143,696 $255,900 $672,711 $97 $346,413 21. Research and Development R&D-Other Medical-Eng De $959,545 3 5 9,580 $254,079 $122 $143,050 $391,439 $122,283 $1111. Research and Development R&D-Other Medical-Opsy D $168,791 2 0 1,036 $366,180 $175 $237,839 $494,520 $61,079 $183 $168,791 0.501. Research and Development R&D-Other Nat Resource-A $271,387 2 1 2,417 $239,384 $115 $197,215 $281,553 $130,235 $1171. Research and Development R&D-Other R & D $5,788,773 11 39 81,333 $163,121 $78 $63,263 $280,655 $85,183 $72 $4,263,466 31 $4,263,466 31 $1,347,818 71. Research and Development R&D-Other R & D-A Res/Ex $13,189,094 51 73 152,786 $229,763 $110 $31,786 $725,072 $91,720 $76 $2,926,163 23 $2,984,452 23 $2,337,888 131. Research and Development R&D-Other R & D-Adv Dev $1,578,613 1 22 45,028 $73,203 $35 $73,203 $73,203 $11,956 $361. Research and Development R&D-Other R & D-B Res $18,720,417 75 131 274,462 $189,442 $91 $58,580 $518,693 $118,608 $76 $617,108 4 $1,207,287 7 $4,330,775 241. Research and Development R&D-Other R & D-Eng Dev $5,666,563 2 9 18,646 $515,256 $247 $389,775 $640,736 $616,204 $263 $5,666,563 91. Research and Development R&D-Other Sciences-B Res $9,299,332 13 17 36,449 $213,939 $102 $46,004 $722,909 $72,326 $56 $20,380 0.44 $20,380 01. Research and Development R&D-Other Sciences-Eng D $4,888,282 8 26 54,500 $191,644 $92 $135,978 $233,902 $139,539 $86 $4,888,282 26 $4,888,282 26 $3,467,493 201. Research and Development R&D-Other Sciences-Opsy $1,899,117 6 9 19,681 $187,519 $90 $149,521 $214,818 $45,298 $96 $1,899,117 9 $1,899,117 91. Research and Development R&D-Other Svcs & Develop $1,547,684 5 8 16,318 $197,887 $95 $85,930 $248,665 $196,748 $106 $1,128,881 61. Research and Development R&D-Other Svcs & Develop $585,618 4 7 14,445 $234,205 $112 $50,934 $622,473 $190,241 $641. Research and Development R&D-Other Svcs & Develop $172,395 1 0 1,020 $352,546 $169 $352,546 $352,546 $389,997 $174 $172,395 0.491. Research and Development R&D-Other Svcs & Develop $9,208,633 19 47 97,612 $300,951 $144 $48,211 $611,434 $164,233 $112 $2,372,245 15 $121,724 1 $1,270,150 51. Research and Development R&D-Other Svcs & Develop $117,930 1 1 1,184 $207,990 $100 $207,990 $207,990 $67,133 $101 $117,930 11. Research and Development R&D-Physical Science $127,058 1 0 488 $542,981 $260 $542,981 $542,981 $88,199 $278 $127,058 0.231. Research and Development R&D-Physical Science-A Re $610,376 1 2 3,518 $362,241 $174 $362,241 $362,241 $498,225 $1791. Research and Development R&D-Physical Science-Adv $548,057 1 4 8,410 $136,062 $65 $136,062 $136,062 $119,834 $66 $548,057 41. Research and Development R&D-Physical Science-B Re $10,441,611 30 43 89,140 $246,632 $118 $53,219 $513,762 $98,372 $127 $4,558,211 12 $4,229,289 211. Research and Development R&D-Physical Science-Eng $3,754,905 22 16 32,706 $227,512 $109 $69,044 $420,445 $61,108 $102 $400,016 2 $189,000 1 $2,975,848 121. Research and Development R&D-Prod/Serv Improveme $198,586 1 3 6,018 $68,906 $33 $68,906 $68,906 $27,111 $341. Research and Development R&D-Prod/Serv Improveme $9,757,344 3 35 74,068 $316,427 $152 $266,012 $391,094 $107,896 $1431. Research and Development R&D-Psychological Sci-A R $4,339,012 36 24 50,773 $223,783 $107 $74,968 $401,262 $101,940 $114 $558,035 6 $516,519 6 $511,523 31. Research and Development R&D-Psychological Sci-Adv $1,933,512 5 8 16,581 $305,636 $146 $192,709 $539,286 $147,297 $1151. Research and Development R&D-Psychological Sci-B R $1,169,475 9 9 18,426 $155,747 $75 $71,479 $415,473 $61,850 $55 $270,473 11. Research and Development R&D-Svcs $20,695,637 29 92 191,770 $247,654 $119 $57,775 $566,247 $121,949 $108 $1,340,297 19 $2,003,637 8 $3,609,832 191. Research and Development R&D-Tank-Automotive $13,682,296 41 60 126,164 $213,608 $102 $62,722 $610,456 $174,137 $84 $2,173,942 13 $2,270,270 141. Research and Development R&D-Textiles, Clothing, etc. $3,237,951 7 16 33,367 $283,835 $136 $121,815 $509,180 $123,369 $118 $1,751,822 12 $1,751,822 12 $2,155,951 141. Research and Development R&D-Trans-Navigation Aids $70,591 1 0 773 $190,786 $91 $190,786 $190,786 $1,111,043 $93 $70,591 0.37
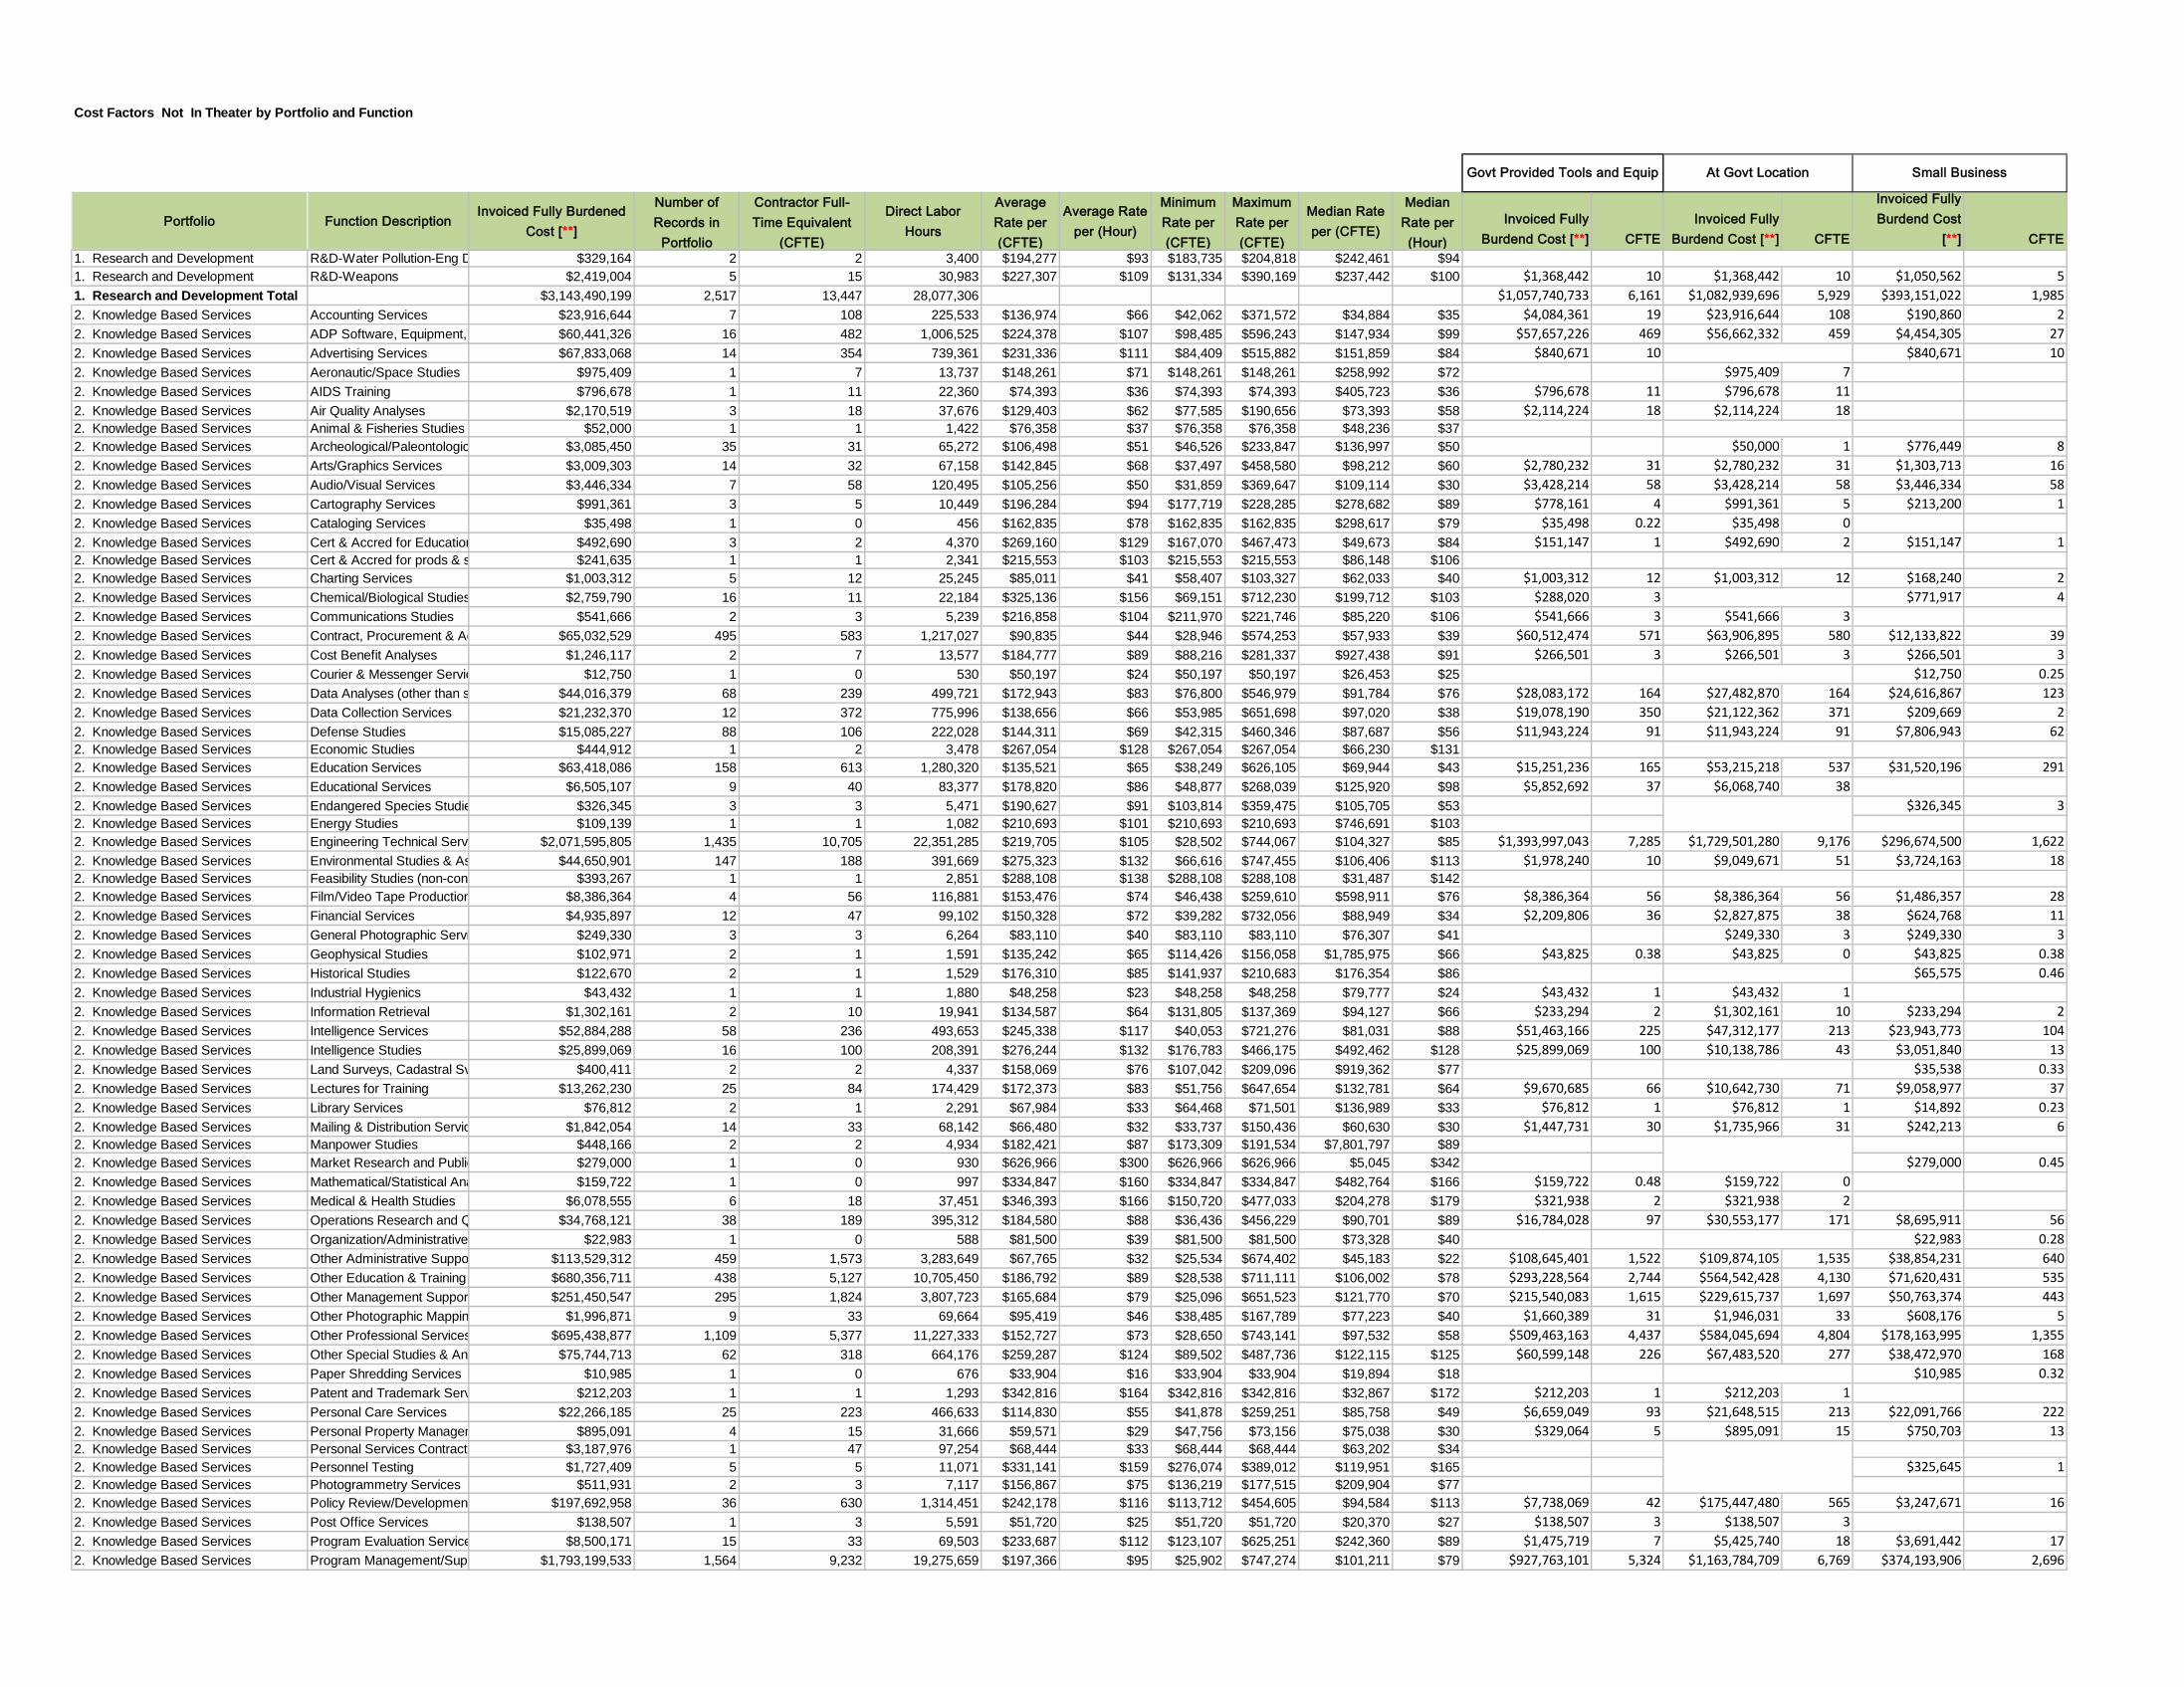
Cost Factors Not In Theater by Portfolio and Function
Portfolio Function DescriptionInvoiced Fully Burdened
Cost [**]
Number of Records in
Portfolio
Contractor Full-Time Equivalent
(CFTE)
Direct Labor Hours
Average Rate per (CFTE)
Average Rate per (Hour)
Minimum Rate per (CFTE)
Maximum Rate per (CFTE)
Median Rate per (CFTE)
Median Rate per (Hour)
Invoiced Fully Burdend Cost [**] CFTE
Invoiced Fully Burdend Cost [**] CFTE
Invoiced Fully Burdend Cost
[**] CFTE
Govt Provided Tools and Equip At Govt Location Small Business
1. Research and Development R&D-Water Pollution-Eng D $329,164 2 2 3,400 $194,277 $93 $183,735 $204,818 $242,461 $941. Research and Development R&D-Weapons $2,419,004 5 15 30,983 $227,307 $109 $131,334 $390,169 $237,442 $100 $1,368,442 10 $1,368,442 10 $1,050,562 51. Research and Development Total $3,143,490,199 2,517 13,447 28,077,306 $1,057,740,733 6,161 $1,082,939,696 5,929 $393,151,022 1,9852. Knowledge Based Services Accounting Services $23,916,644 7 108 225,533 $136,974 $66 $42,062 $371,572 $34,884 $35 $4,084,361 19 $23,916,644 108 $190,860 22. Knowledge Based Services ADP Software, Equipment, $60,441,326 16 482 1,006,525 $224,378 $107 $98,485 $596,243 $147,934 $99 $57,657,226 469 $56,662,332 459 $4,454,305 272. Knowledge Based Services Advertising Services $67,833,068 14 354 739,361 $231,336 $111 $84,409 $515,882 $151,859 $84 $840,671 10 $840,671 102. Knowledge Based Services Aeronautic/Space Studies $975,409 1 7 13,737 $148,261 $71 $148,261 $148,261 $258,992 $72 $975,409 72. Knowledge Based Services AIDS Training $796,678 1 11 22,360 $74,393 $36 $74,393 $74,393 $405,723 $36 $796,678 11 $796,678 112. Knowledge Based Services Air Quality Analyses $2,170,519 3 18 37,676 $129,403 $62 $77,585 $190,656 $73,393 $58 $2,114,224 18 $2,114,224 182. Knowledge Based Services Animal & Fisheries Studies $52,000 1 1 1,422 $76,358 $37 $76,358 $76,358 $48,236 $372. Knowledge Based Services Archeological/Paleontologic $3,085,450 35 31 65,272 $106,498 $51 $46,526 $233,847 $136,997 $50 $50,000 1 $776,449 82. Knowledge Based Services Arts/Graphics Services $3,009,303 14 32 67,158 $142,845 $68 $37,497 $458,580 $98,212 $60 $2,780,232 31 $2,780,232 31 $1,303,713 162. Knowledge Based Services Audio/Visual Services $3,446,334 7 58 120,495 $105,256 $50 $31,859 $369,647 $109,114 $30 $3,428,214 58 $3,428,214 58 $3,446,334 582. Knowledge Based Services Cartography Services $991,361 3 5 10,449 $196,284 $94 $177,719 $228,285 $278,682 $89 $778,161 4 $991,361 5 $213,200 12. Knowledge Based Services Cataloging Services $35,498 1 0 456 $162,835 $78 $162,835 $162,835 $298,617 $79 $35,498 0.22 $35,498 02. Knowledge Based Services Cert & Accred for Education $492,690 3 2 4,370 $269,160 $129 $167,070 $467,473 $49,673 $84 $151,147 1 $492,690 2 $151,147 12. Knowledge Based Services Cert & Accred for prods & s $241,635 1 1 2,341 $215,553 $103 $215,553 $215,553 $86,148 $1062. Knowledge Based Services Charting Services $1,003,312 5 12 25,245 $85,011 $41 $58,407 $103,327 $62,033 $40 $1,003,312 12 $1,003,312 12 $168,240 22. Knowledge Based Services Chemical/Biological Studies $2,759,790 16 11 22,184 $325,136 $156 $69,151 $712,230 $199,712 $103 $288,020 3 $771,917 42. Knowledge Based Services Communications Studies $541,666 2 3 5,239 $216,858 $104 $211,970 $221,746 $85,220 $106 $541,666 3 $541,666 32. Knowledge Based Services Contract, Procurement & Ac $65,032,529 495 583 1,217,027 $90,835 $44 $28,946 $574,253 $57,933 $39 $60,512,474 571 $63,906,895 580 $12,133,822 392. Knowledge Based Services Cost Benefit Analyses $1,246,117 2 7 13,577 $184,777 $89 $88,216 $281,337 $927,438 $91 $266,501 3 $266,501 3 $266,501 32. Knowledge Based Services Courier & Messenger Servic $12,750 1 0 530 $50,197 $24 $50,197 $50,197 $26,453 $25 $12,750 0.252. Knowledge Based Services Data Analyses (other than s $44,016,379 68 239 499,721 $172,943 $83 $76,800 $546,979 $91,784 $76 $28,083,172 164 $27,482,870 164 $24,616,867 1232. Knowledge Based Services Data Collection Services $21,232,370 12 372 775,996 $138,656 $66 $53,985 $651,698 $97,020 $38 $19,078,190 350 $21,122,362 371 $209,669 22. Knowledge Based Services Defense Studies $15,085,227 88 106 222,028 $144,311 $69 $42,315 $460,346 $87,687 $56 $11,943,224 91 $11,943,224 91 $7,806,943 622. Knowledge Based Services Economic Studies $444,912 1 2 3,478 $267,054 $128 $267,054 $267,054 $66,230 $1312. Knowledge Based Services Education Services $63,418,086 158 613 1,280,320 $135,521 $65 $38,249 $626,105 $69,944 $43 $15,251,236 165 $53,215,218 537 $31,520,196 2912. Knowledge Based Services Educational Services $6,505,107 9 40 83,377 $178,820 $86 $48,877 $268,039 $125,920 $98 $5,852,692 37 $6,068,740 382. Knowledge Based Services Endangered Species Studie $326,345 3 3 5,471 $190,627 $91 $103,814 $359,475 $105,705 $53 $326,345 32. Knowledge Based Services Energy Studies $109,139 1 1 1,082 $210,693 $101 $210,693 $210,693 $746,691 $1032. Knowledge Based Services Engineering Technical Serv $2,071,595,805 1,435 10,705 22,351,285 $219,705 $105 $28,502 $744,067 $104,327 $85 $1,393,997,043 7,285 $1,729,501,280 9,176 $296,674,500 1,6222. Knowledge Based Services Environmental Studies & As $44,650,901 147 188 391,669 $275,323 $132 $66,616 $747,455 $106,406 $113 $1,978,240 10 $9,049,671 51 $3,724,163 182. Knowledge Based Services Feasibility Studies (non-con $393,267 1 1 2,851 $288,108 $138 $288,108 $288,108 $31,487 $1422. Knowledge Based Services Film/Video Tape Production $8,386,364 4 56 116,881 $153,476 $74 $46,438 $259,610 $598,911 $76 $8,386,364 56 $8,386,364 56 $1,486,357 282. Knowledge Based Services Financial Services $4,935,897 12 47 99,102 $150,328 $72 $39,282 $732,056 $88,949 $34 $2,209,806 36 $2,827,875 38 $624,768 112. Knowledge Based Services General Photographic Servi $249,330 3 3 6,264 $83,110 $40 $83,110 $83,110 $76,307 $41 $249,330 3 $249,330 32. Knowledge Based Services Geophysical Studies $102,971 2 1 1,591 $135,242 $65 $114,426 $156,058 $1,785,975 $66 $43,825 0.38 $43,825 0 $43,825 0.382. Knowledge Based Services Historical Studies $122,670 2 1 1,529 $176,310 $85 $141,937 $210,683 $176,354 $86 $65,575 0.462. Knowledge Based Services Industrial Hygienics $43,432 1 1 1,880 $48,258 $23 $48,258 $48,258 $79,777 $24 $43,432 1 $43,432 12. Knowledge Based Services Information Retrieval $1,302,161 2 10 19,941 $134,587 $64 $131,805 $137,369 $94,127 $66 $233,294 2 $1,302,161 10 $233,294 22. Knowledge Based Services Intelligence Services $52,884,288 58 236 493,653 $245,338 $117 $40,053 $721,276 $81,031 $88 $51,463,166 225 $47,312,177 213 $23,943,773 1042. Knowledge Based Services Intelligence Studies $25,899,069 16 100 208,391 $276,244 $132 $176,783 $466,175 $492,462 $128 $25,899,069 100 $10,138,786 43 $3,051,840 132. Knowledge Based Services Land Surveys, Cadastral Sv $400,411 2 2 4,337 $158,069 $76 $107,042 $209,096 $919,362 $77 $35,538 0.332. Knowledge Based Services Lectures for Training $13,262,230 25 84 174,429 $172,373 $83 $51,756 $647,654 $132,781 $64 $9,670,685 66 $10,642,730 71 $9,058,977 372. Knowledge Based Services Library Services $76,812 2 1 2,291 $67,984 $33 $64,468 $71,501 $136,989 $33 $76,812 1 $76,812 1 $14,892 0.232. Knowledge Based Services Mailing & Distribution Servic $1,842,054 14 33 68,142 $66,480 $32 $33,737 $150,436 $60,630 $30 $1,447,731 30 $1,735,966 31 $242,213 62. Knowledge Based Services Manpower Studies $448,166 2 2 4,934 $182,421 $87 $173,309 $191,534 $7,801,797 $892. Knowledge Based Services Market Research and Public $279,000 1 0 930 $626,966 $300 $626,966 $626,966 $5,045 $342 $279,000 0.452. Knowledge Based Services Mathematical/Statistical Ana $159,722 1 0 997 $334,847 $160 $334,847 $334,847 $482,764 $166 $159,722 0.48 $159,722 02. Knowledge Based Services Medical & Health Studies $6,078,555 6 18 37,451 $346,393 $166 $150,720 $477,033 $204,278 $179 $321,938 2 $321,938 22. Knowledge Based Services Operations Research and Q $34,768,121 38 189 395,312 $184,580 $88 $36,436 $456,229 $90,701 $89 $16,784,028 97 $30,553,177 171 $8,695,911 562. Knowledge Based Services Organization/Administrative $22,983 1 0 588 $81,500 $39 $81,500 $81,500 $73,328 $40 $22,983 0.282. Knowledge Based Services Other Administrative Suppo $113,529,312 459 1,573 3,283,649 $67,765 $32 $25,534 $674,402 $45,183 $22 $108,645,401 1,522 $109,874,105 1,535 $38,854,231 6402. Knowledge Based Services Other Education & Training $680,356,711 438 5,127 10,705,450 $186,792 $89 $28,538 $711,111 $106,002 $78 $293,228,564 2,744 $564,542,428 4,130 $71,620,431 5352. Knowledge Based Services Other Management Suppor $251,450,547 295 1,824 3,807,723 $165,684 $79 $25,096 $651,523 $121,770 $70 $215,540,083 1,615 $229,615,737 1,697 $50,763,374 4432. Knowledge Based Services Other Photographic Mappin $1,996,871 9 33 69,664 $95,419 $46 $38,485 $167,789 $77,223 $40 $1,660,389 31 $1,946,031 33 $608,176 52. Knowledge Based Services Other Professional Services $695,438,877 1,109 5,377 11,227,333 $152,727 $73 $28,650 $743,141 $97,532 $58 $509,463,163 4,437 $584,045,694 4,804 $178,163,995 1,3552. Knowledge Based Services Other Special Studies & An $75,744,713 62 318 664,176 $259,287 $124 $89,502 $487,736 $122,115 $125 $60,599,148 226 $67,483,520 277 $38,472,970 1682. Knowledge Based Services Paper Shredding Services $10,985 1 0 676 $33,904 $16 $33,904 $33,904 $19,894 $18 $10,985 0.322. Knowledge Based Services Patent and Trademark Serv $212,203 1 1 1,293 $342,816 $164 $342,816 $342,816 $32,867 $172 $212,203 1 $212,203 12. Knowledge Based Services Personal Care Services $22,266,185 25 223 466,633 $114,830 $55 $41,878 $259,251 $85,758 $49 $6,659,049 93 $21,648,515 213 $22,091,766 2222. Knowledge Based Services Personal Property Managem $895,091 4 15 31,666 $59,571 $29 $47,756 $73,156 $75,038 $30 $329,064 5 $895,091 15 $750,703 132. Knowledge Based Services Personal Services Contracts $3,187,976 1 47 97,254 $68,444 $33 $68,444 $68,444 $63,202 $342. Knowledge Based Services Personnel Testing $1,727,409 5 5 11,071 $331,141 $159 $276,074 $389,012 $119,951 $165 $325,645 12. Knowledge Based Services Photogrammetry Services $511,931 2 3 7,117 $156,867 $75 $136,219 $177,515 $209,904 $772. Knowledge Based Services Policy Review/Development $197,692,958 36 630 1,314,451 $242,178 $116 $113,712 $454,605 $94,584 $113 $7,738,069 42 $175,447,480 565 $3,247,671 162. Knowledge Based Services Post Office Services $138,507 1 3 5,591 $51,720 $25 $51,720 $51,720 $20,370 $27 $138,507 3 $138,507 32. Knowledge Based Services Program Evaluation Service $8,500,171 15 33 69,503 $233,687 $112 $123,107 $625,251 $242,360 $89 $1,475,719 7 $5,425,740 18 $3,691,442 172. Knowledge Based Services Program Management/Sup $1,793,199,533 1,564 9,232 19,275,659 $197,366 $95 $25,902 $747,274 $101,211 $79 $927,763,101 5,324 $1,163,784,709 6,769 $374,193,906 2,696
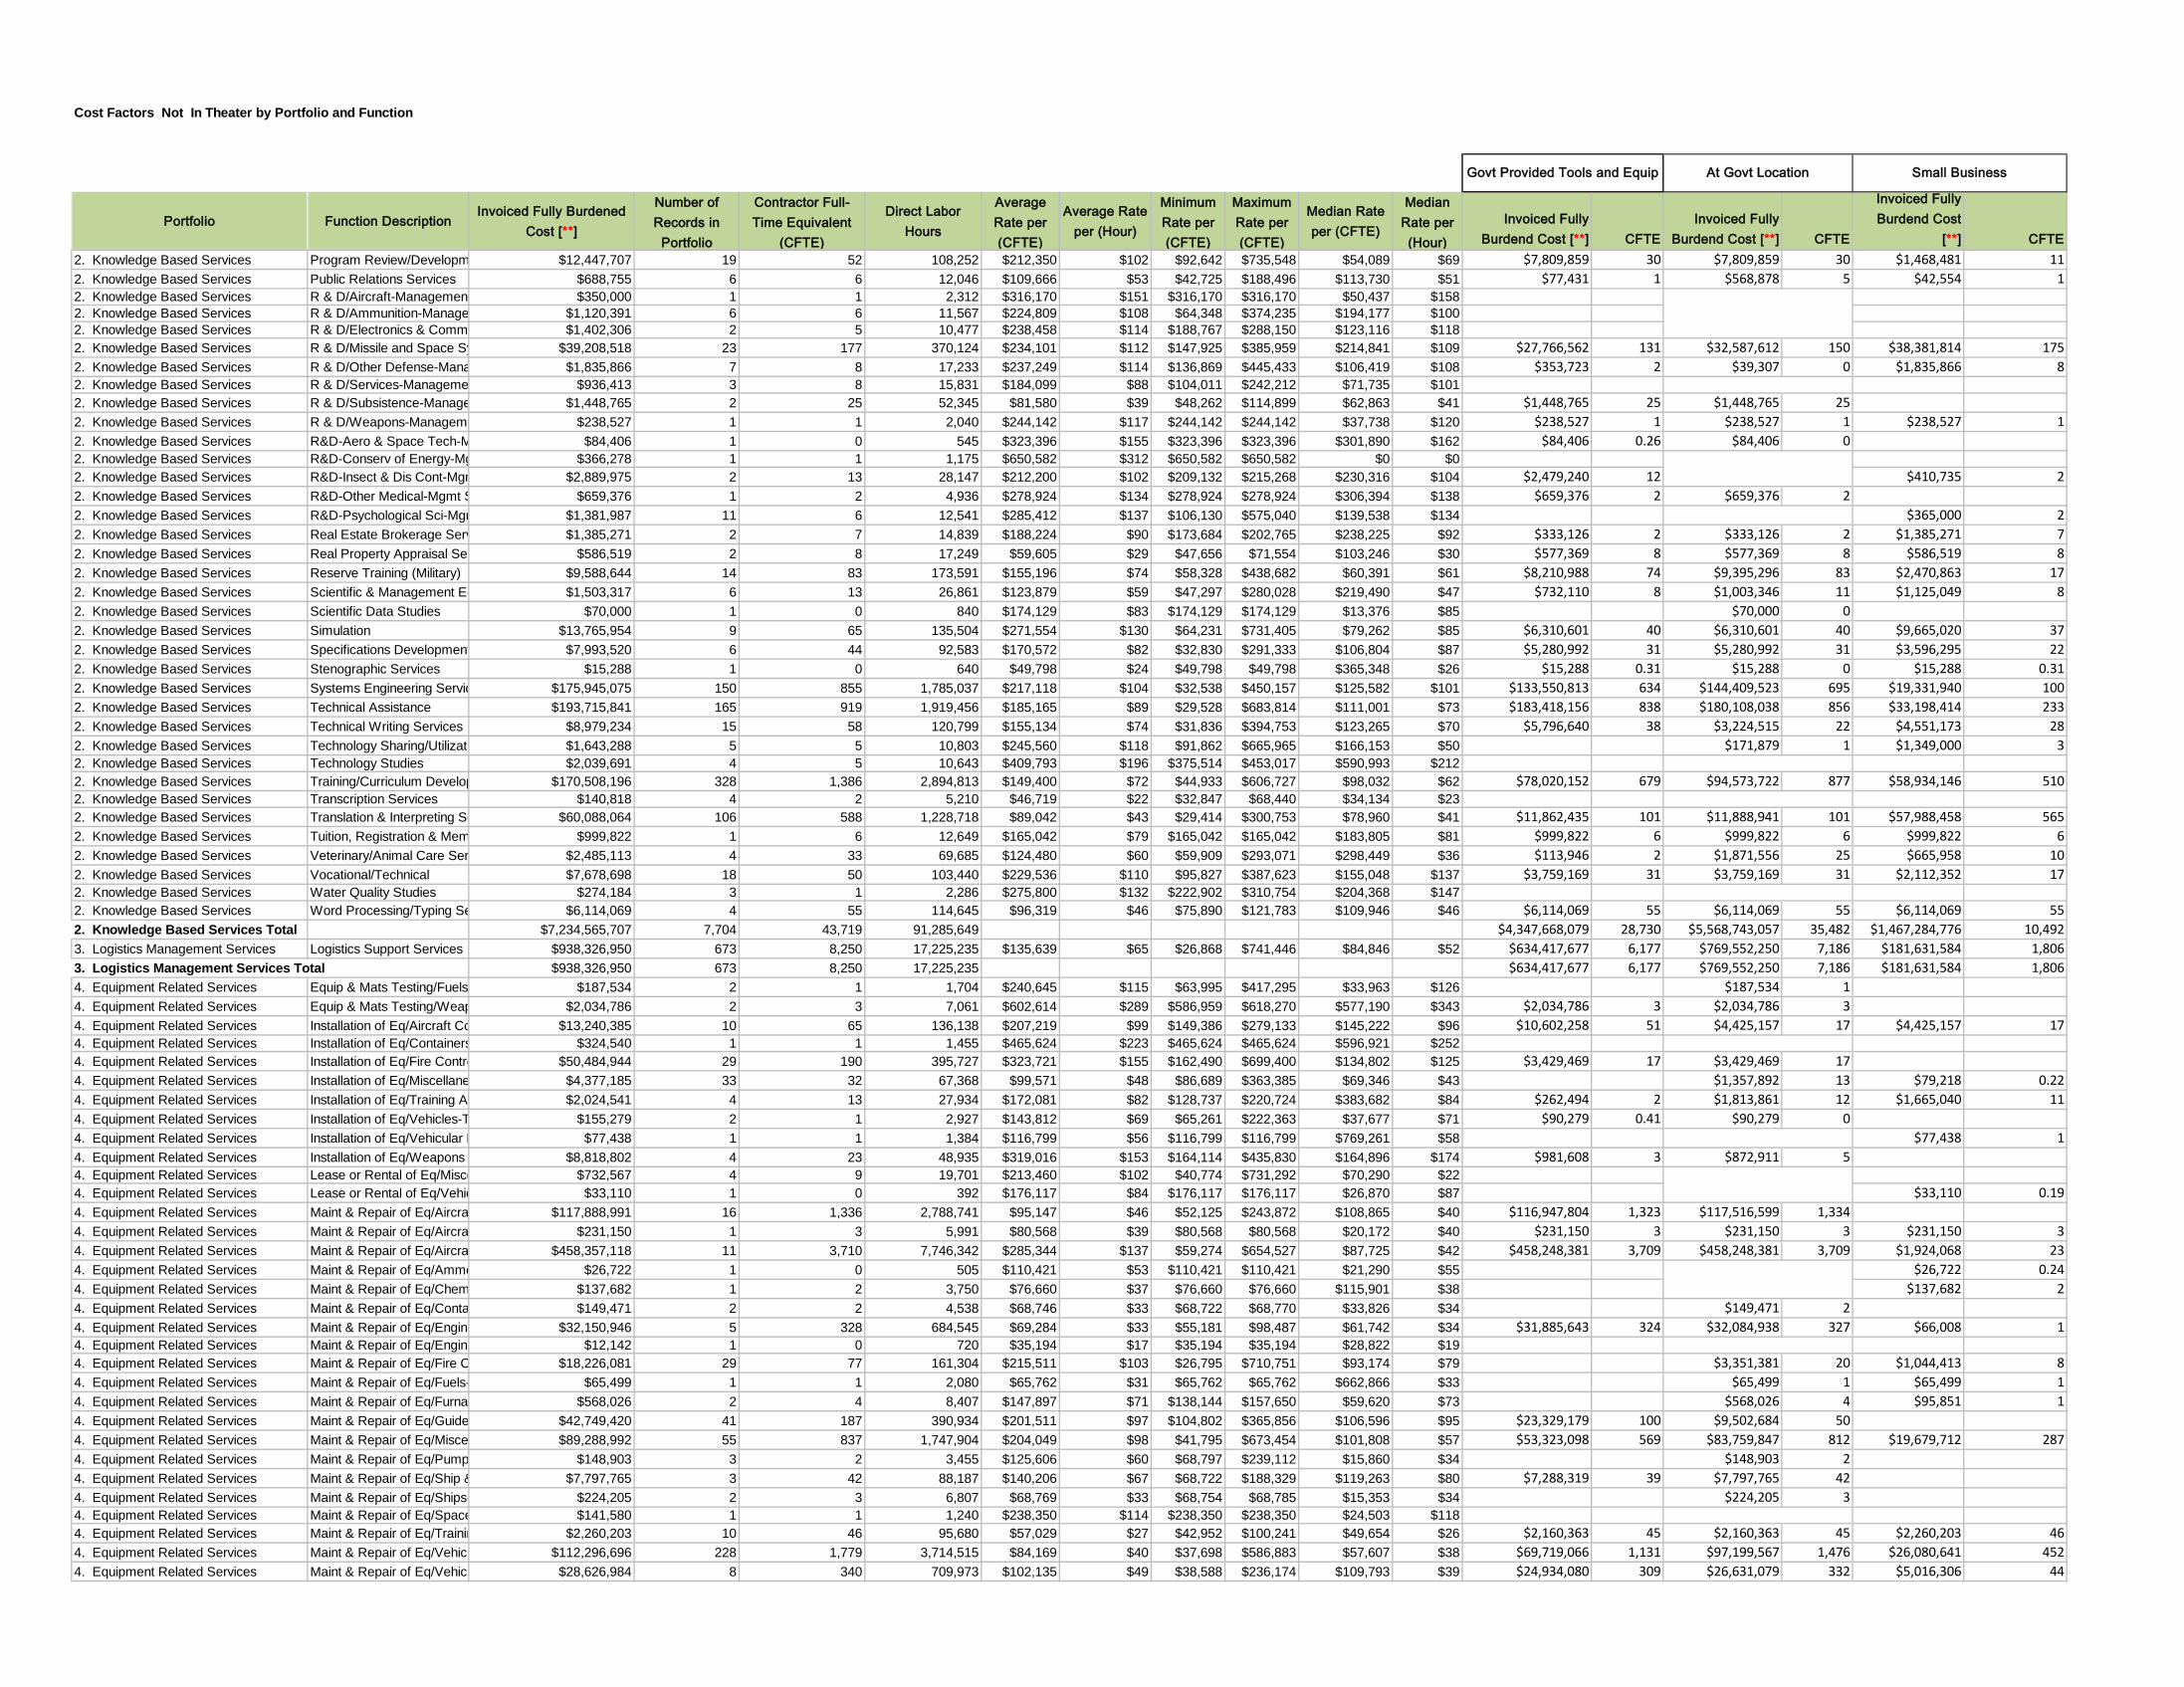
Cost Factors Not In Theater by Portfolio and Function
Portfolio Function DescriptionInvoiced Fully Burdened
Cost [**]
Number of Records in
Portfolio
Contractor Full-Time Equivalent
(CFTE)
Direct Labor Hours
Average Rate per (CFTE)
Average Rate per (Hour)
Minimum Rate per (CFTE)
Maximum Rate per (CFTE)
Median Rate per (CFTE)
Median Rate per (Hour)
Invoiced Fully Burdend Cost [**] CFTE
Invoiced Fully Burdend Cost [**] CFTE
Invoiced Fully Burdend Cost
[**] CFTE
Govt Provided Tools and Equip At Govt Location Small Business
2. Knowledge Based Services Program Review/Developm $12,447,707 19 52 108,252 $212,350 $102 $92,642 $735,548 $54,089 $69 $7,809,859 30 $7,809,859 30 $1,468,481 112. Knowledge Based Services Public Relations Services $688,755 6 6 12,046 $109,666 $53 $42,725 $188,496 $113,730 $51 $77,431 1 $568,878 5 $42,554 12. Knowledge Based Services R & D/Aircraft-Management $350,000 1 1 2,312 $316,170 $151 $316,170 $316,170 $50,437 $1582. Knowledge Based Services R & D/Ammunition-Manage $1,120,391 6 6 11,567 $224,809 $108 $64,348 $374,235 $194,177 $1002. Knowledge Based Services R & D/Electronics & Comm $1,402,306 2 5 10,477 $238,458 $114 $188,767 $288,150 $123,116 $1182. Knowledge Based Services R & D/Missile and Space Sy $39,208,518 23 177 370,124 $234,101 $112 $147,925 $385,959 $214,841 $109 $27,766,562 131 $32,587,612 150 $38,381,814 1752. Knowledge Based Services R & D/Other Defense-Mana $1,835,866 7 8 17,233 $237,249 $114 $136,869 $445,433 $106,419 $108 $353,723 2 $39,307 0 $1,835,866 82. Knowledge Based Services R & D/Services-Manageme $936,413 3 8 15,831 $184,099 $88 $104,011 $242,212 $71,735 $1012. Knowledge Based Services R & D/Subsistence-Manage $1,448,765 2 25 52,345 $81,580 $39 $48,262 $114,899 $62,863 $41 $1,448,765 25 $1,448,765 252. Knowledge Based Services R & D/Weapons-Manageme $238,527 1 1 2,040 $244,142 $117 $244,142 $244,142 $37,738 $120 $238,527 1 $238,527 1 $238,527 12. Knowledge Based Services R&D-Aero & Space Tech-M $84,406 1 0 545 $323,396 $155 $323,396 $323,396 $301,890 $162 $84,406 0.26 $84,406 02. Knowledge Based Services R&D-Conserv of Energy-Mg $366,278 1 1 1,175 $650,582 $312 $650,582 $650,582 $0 $02. Knowledge Based Services R&D-Insect & Dis Cont-Mgm $2,889,975 2 13 28,147 $212,200 $102 $209,132 $215,268 $230,316 $104 $2,479,240 12 $410,735 22. Knowledge Based Services R&D-Other Medical-Mgmt S $659,376 1 2 4,936 $278,924 $134 $278,924 $278,924 $306,394 $138 $659,376 2 $659,376 22. Knowledge Based Services R&D-Psychological Sci-Mgm $1,381,987 11 6 12,541 $285,412 $137 $106,130 $575,040 $139,538 $134 $365,000 22. Knowledge Based Services Real Estate Brokerage Serv $1,385,271 2 7 14,839 $188,224 $90 $173,684 $202,765 $238,225 $92 $333,126 2 $333,126 2 $1,385,271 72. Knowledge Based Services Real Property Appraisal Se $586,519 2 8 17,249 $59,605 $29 $47,656 $71,554 $103,246 $30 $577,369 8 $577,369 8 $586,519 82. Knowledge Based Services Reserve Training (Military) $9,588,644 14 83 173,591 $155,196 $74 $58,328 $438,682 $60,391 $61 $8,210,988 74 $9,395,296 83 $2,470,863 172. Knowledge Based Services Scientific & Management Ed $1,503,317 6 13 26,861 $123,879 $59 $47,297 $280,028 $219,490 $47 $732,110 8 $1,003,346 11 $1,125,049 82. Knowledge Based Services Scientific Data Studies $70,000 1 0 840 $174,129 $83 $174,129 $174,129 $13,376 $85 $70,000 02. Knowledge Based Services Simulation $13,765,954 9 65 135,504 $271,554 $130 $64,231 $731,405 $79,262 $85 $6,310,601 40 $6,310,601 40 $9,665,020 372. Knowledge Based Services Specifications Development $7,993,520 6 44 92,583 $170,572 $82 $32,830 $291,333 $106,804 $87 $5,280,992 31 $5,280,992 31 $3,596,295 222. Knowledge Based Services Stenographic Services $15,288 1 0 640 $49,798 $24 $49,798 $49,798 $365,348 $26 $15,288 0.31 $15,288 0 $15,288 0.312. Knowledge Based Services Systems Engineering Servic $175,945,075 150 855 1,785,037 $217,118 $104 $32,538 $450,157 $125,582 $101 $133,550,813 634 $144,409,523 695 $19,331,940 1002. Knowledge Based Services Technical Assistance $193,715,841 165 919 1,919,456 $185,165 $89 $29,528 $683,814 $111,001 $73 $183,418,156 838 $180,108,038 856 $33,198,414 2332. Knowledge Based Services Technical Writing Services $8,979,234 15 58 120,799 $155,134 $74 $31,836 $394,753 $123,265 $70 $5,796,640 38 $3,224,515 22 $4,551,173 282. Knowledge Based Services Technology Sharing/Utilizati $1,643,288 5 5 10,803 $245,560 $118 $91,862 $665,965 $166,153 $50 $171,879 1 $1,349,000 32. Knowledge Based Services Technology Studies $2,039,691 4 5 10,643 $409,793 $196 $375,514 $453,017 $590,993 $2122. Knowledge Based Services Training/Curriculum Develop $170,508,196 328 1,386 2,894,813 $149,400 $72 $44,933 $606,727 $98,032 $62 $78,020,152 679 $94,573,722 877 $58,934,146 5102. Knowledge Based Services Transcription Services $140,818 4 2 5,210 $46,719 $22 $32,847 $68,440 $34,134 $232. Knowledge Based Services Translation & Interpreting Se $60,088,064 106 588 1,228,718 $89,042 $43 $29,414 $300,753 $78,960 $41 $11,862,435 101 $11,888,941 101 $57,988,458 5652. Knowledge Based Services Tuition, Registration & Mem $999,822 1 6 12,649 $165,042 $79 $165,042 $165,042 $183,805 $81 $999,822 6 $999,822 6 $999,822 62. Knowledge Based Services Veterinary/Animal Care Ser $2,485,113 4 33 69,685 $124,480 $60 $59,909 $293,071 $298,449 $36 $113,946 2 $1,871,556 25 $665,958 102. Knowledge Based Services Vocational/Technical $7,678,698 18 50 103,440 $229,536 $110 $95,827 $387,623 $155,048 $137 $3,759,169 31 $3,759,169 31 $2,112,352 172. Knowledge Based Services Water Quality Studies $274,184 3 1 2,286 $275,800 $132 $222,902 $310,754 $204,368 $1472. Knowledge Based Services Word Processing/Typing Se $6,114,069 4 55 114,645 $96,319 $46 $75,890 $121,783 $109,946 $46 $6,114,069 55 $6,114,069 55 $6,114,069 552. Knowledge Based Services Total $7,234,565,707 7,704 43,719 91,285,649 $4,347,668,079 28,730 $5,568,743,057 35,482 $1,467,284,776 10,4923. Logistics Management Services Logistics Support Services $938,326,950 673 8,250 17,225,235 $135,639 $65 $26,868 $741,446 $84,846 $52 $634,417,677 6,177 $769,552,250 7,186 $181,631,584 1,8063. Logistics Management Services Total $938,326,950 673 8,250 17,225,235 $634,417,677 6,177 $769,552,250 7,186 $181,631,584 1,8064. Equipment Related Services Equip & Mats Testing/Fuels $187,534 2 1 1,704 $240,645 $115 $63,995 $417,295 $33,963 $126 $187,534 14. Equipment Related Services Equip & Mats Testing/Weap $2,034,786 2 3 7,061 $602,614 $289 $586,959 $618,270 $577,190 $343 $2,034,786 3 $2,034,786 34. Equipment Related Services Installation of Eq/Aircraft Co $13,240,385 10 65 136,138 $207,219 $99 $149,386 $279,133 $145,222 $96 $10,602,258 51 $4,425,157 17 $4,425,157 174. Equipment Related Services Installation of Eq/Containers $324,540 1 1 1,455 $465,624 $223 $465,624 $465,624 $596,921 $2524. Equipment Related Services Installation of Eq/Fire Contro $50,484,944 29 190 395,727 $323,721 $155 $162,490 $699,400 $134,802 $125 $3,429,469 17 $3,429,469 174. Equipment Related Services Installation of Eq/Miscellane $4,377,185 33 32 67,368 $99,571 $48 $86,689 $363,385 $69,346 $43 $1,357,892 13 $79,218 0.224. Equipment Related Services Installation of Eq/Training A $2,024,541 4 13 27,934 $172,081 $82 $128,737 $220,724 $383,682 $84 $262,494 2 $1,813,861 12 $1,665,040 114. Equipment Related Services Installation of Eq/Vehicles-T $155,279 2 1 2,927 $143,812 $69 $65,261 $222,363 $37,677 $71 $90,279 0.41 $90,279 04. Equipment Related Services Installation of Eq/Vehicular E $77,438 1 1 1,384 $116,799 $56 $116,799 $116,799 $769,261 $58 $77,438 14. Equipment Related Services Installation of Eq/Weapons $8,818,802 4 23 48,935 $319,016 $153 $164,114 $435,830 $164,896 $174 $981,608 3 $872,911 54. Equipment Related Services Lease or Rental of Eq/Misce $732,567 4 9 19,701 $213,460 $102 $40,774 $731,292 $70,290 $224. Equipment Related Services Lease or Rental of Eq/Vehic $33,110 1 0 392 $176,117 $84 $176,117 $176,117 $26,870 $87 $33,110 0.194. Equipment Related Services Maint & Repair of Eq/Aircra $117,888,991 16 1,336 2,788,741 $95,147 $46 $52,125 $243,872 $108,865 $40 $116,947,804 1,323 $117,516,599 1,3344. Equipment Related Services Maint & Repair of Eq/Aircra $231,150 1 3 5,991 $80,568 $39 $80,568 $80,568 $20,172 $40 $231,150 3 $231,150 3 $231,150 34. Equipment Related Services Maint & Repair of Eq/Aircra $458,357,118 11 3,710 7,746,342 $285,344 $137 $59,274 $654,527 $87,725 $42 $458,248,381 3,709 $458,248,381 3,709 $1,924,068 234. Equipment Related Services Maint & Repair of Eq/Ammo $26,722 1 0 505 $110,421 $53 $110,421 $110,421 $21,290 $55 $26,722 0.244. Equipment Related Services Maint & Repair of Eq/Chem $137,682 1 2 3,750 $76,660 $37 $76,660 $76,660 $115,901 $38 $137,682 24. Equipment Related Services Maint & Repair of Eq/Conta $149,471 2 2 4,538 $68,746 $33 $68,722 $68,770 $33,826 $34 $149,471 24. Equipment Related Services Maint & Repair of Eq/Engine $32,150,946 5 328 684,545 $69,284 $33 $55,181 $98,487 $61,742 $34 $31,885,643 324 $32,084,938 327 $66,008 14. Equipment Related Services Maint & Repair of Eq/Engine $12,142 1 0 720 $35,194 $17 $35,194 $35,194 $28,822 $194. Equipment Related Services Maint & Repair of Eq/Fire C $18,226,081 29 77 161,304 $215,511 $103 $26,795 $710,751 $93,174 $79 $3,351,381 20 $1,044,413 84. Equipment Related Services Maint & Repair of Eq/Fuels- $65,499 1 1 2,080 $65,762 $31 $65,762 $65,762 $662,866 $33 $65,499 1 $65,499 14. Equipment Related Services Maint & Repair of Eq/Furna $568,026 2 4 8,407 $147,897 $71 $138,144 $157,650 $59,620 $73 $568,026 4 $95,851 14. Equipment Related Services Maint & Repair of Eq/Guide $42,749,420 41 187 390,934 $201,511 $97 $104,802 $365,856 $106,596 $95 $23,329,179 100 $9,502,684 504. Equipment Related Services Maint & Repair of Eq/Misce $89,288,992 55 837 1,747,904 $204,049 $98 $41,795 $673,454 $101,808 $57 $53,323,098 569 $83,759,847 812 $19,679,712 2874. Equipment Related Services Maint & Repair of Eq/Pump $148,903 3 2 3,455 $125,606 $60 $68,797 $239,112 $15,860 $34 $148,903 24. Equipment Related Services Maint & Repair of Eq/Ship & $7,797,765 3 42 88,187 $140,206 $67 $68,722 $188,329 $119,263 $80 $7,288,319 39 $7,797,765 424. Equipment Related Services Maint & Repair of Eq/Ships- $224,205 2 3 6,807 $68,769 $33 $68,754 $68,785 $15,353 $34 $224,205 34. Equipment Related Services Maint & Repair of Eq/Space $141,580 1 1 1,240 $238,350 $114 $238,350 $238,350 $24,503 $1184. Equipment Related Services Maint & Repair of Eq/Trainin $2,260,203 10 46 95,680 $57,029 $27 $42,952 $100,241 $49,654 $26 $2,160,363 45 $2,160,363 45 $2,260,203 464. Equipment Related Services Maint & Repair of Eq/Vehicl $112,296,696 228 1,779 3,714,515 $84,169 $40 $37,698 $586,883 $57,607 $38 $69,719,066 1,131 $97,199,567 1,476 $26,080,641 4524. Equipment Related Services Maint & Repair of Eq/Vehicu $28,626,984 8 340 709,973 $102,135 $49 $38,588 $236,174 $109,793 $39 $24,934,080 309 $26,631,079 332 $5,016,306 44
Cost Factors Not In Theater by Portfolio and Function
Portfolio Function DescriptionInvoiced Fully Burdened
Cost [**]
Number of Records in
Portfolio
Contractor Full-Time Equivalent
(CFTE)
Direct Labor Hours
Average Rate per (CFTE)
Average Rate per (Hour)
Minimum Rate per (CFTE)
Maximum Rate per (CFTE)
Median Rate per (CFTE)
Median Rate per (Hour)
Invoiced Fully Burdend Cost [**] CFTE
Invoiced Fully Burdend Cost [**] CFTE
Invoiced Fully Burdend Cost
[**] CFTE
Govt Provided Tools and Equip At Govt Location Small Business
4. Equipment Related Services Maint & Repair of Eq/Weap $1,648,997,017 235 6,320 13,195,737 $253,809 $122 $46,581 $737,997 $86,349 $68 $1,301,327,082 5,634 $567,506,787 3,491 $35,899,668 5084. Equipment Related Services Modification of Eq/Aircraft C $3,726,363 2 24 49,104 $254,999 $122 $91,410 $418,587 $112,981 $135 $3,726,363 244. Equipment Related Services Modification of Eq/Miscellan $18,772 1 0 706 $55,538 $27 $55,538 $55,538 $26,640 $294. Equipment Related Services Modification of Eq/Vehicles- $1,711,345 3 12 24,723 $350,040 $167 $132,292 $714,212 $207,651 $66 $216,971 14. Equipment Related Services Modification of Eq/Weapons $473,715 1 5 11,428 $86,555 $41 $86,555 $86,555 $300,325 $43 $473,715 5 $473,715 54. Equipment Related Services Non-nuclear Ship Repair (W $50,842 1 1 2,080 $51,046 $24 $51,046 $51,046 $694,717 $27 $50,842 14. Equipment Related Services Other Quality Cntl Svcs/Fue $2,857,184 4 15 31,742 $188,344 $90 $181,247 $194,757 $58,513 $93 $2,857,184 15 $2,857,184 154. Equipment Related Services Other Quality Cntl, Testing & $996,741 8 5 11,105 $218,567 $105 $104,334 $411,706 $291,831 $100 $303,616 2 $349,546 2 $303,616 24. Equipment Related Services Other Salvage Services $6,497,167 19 89 186,334 $121,602 $58 $50,591 $304,918 $51,498 $35 $4,488,018 66 $4,938,428 68 $6,497,167 894. Equipment Related Services Quality Control Svcs/Aircraf $771,687 1 10 21,329 $75,544 $36 $75,544 $75,544 $48,236 $374. Equipment Related Services Quality Control Svcs/Aircraf $485,043 1 2 4,095 $247,345 $118 $247,345 $247,345 $33,812 $123 $485,043 2 $485,043 2 $485,043 24. Equipment Related Services Quality Control Svcs/Ammo $998,011 1 2 3,586 $581,253 $278 $581,253 $581,253 $78,198 $339 $998,011 24. Equipment Related Services Quality Control Svcs/Chemi $23,561 1 0 360 $136,983 $65 $136,983 $136,983 $155,444 $68 $23,561 04. Equipment Related Services Quality Control Svcs/Fire Co $787,037 7 9 19,353 $100,242 $48 $28,185 $310,008 $79,908 $28 $5,681 0 $36,825 14. Equipment Related Services Quality Control Svcs/Vehicu $115,233 1 0 608 $395,990 $190 $395,990 $395,990 $399,771 $2104. Equipment Related Services Quality Control Svcs/Water $49,665 1 1 2,000 $51,842 $25 $51,842 $51,842 $14,777 $274. Equipment Related Services Quality Control Svcs/Weapo $49,670,135 10 624 1,302,051 $88,514 $42 $57,694 $143,008 $64,040 $41 $49,585,683 623 $49,585,683 6234. Equipment Related Services Tech Rep Svcs/Aircraft Com $81,001,232 22 401 837,663 $253,709 $122 $123,794 $528,847 $184,098 $124 $78,822,356 394 $28,552,612 116 $46,329 0.314. Equipment Related Services Tech Rep Svcs/Aircraft Stru $242,000 1 1 2,080 $242,972 $116 $242,972 $242,972 $16,039 $121 $242,000 1 $242,000 14. Equipment Related Services Tech Rep Svcs/Ammo & Ex $134,824 2 2 4,195 $91,345 $44 $61,123 $121,568 $8,098,208 $46 $134,824 2 $134,824 2 $134,824 24. Equipment Related Services Tech Rep Svcs/Bearings $468,296 1 2 3,882 $251,907 $121 $251,907 $251,907 $2,248,148 $125 $468,296 2 $468,296 24. Equipment Related Services Tech Rep Svcs/Engines, Tu $19,317,402 11 105 220,024 $182,126 $87 $71,571 $333,579 $125,111 $94 $17,655,033 96 $886,023 74. Equipment Related Services Tech Rep Svcs/Fire Control $28,158,387 1 45 93,138 $631,269 $302 $631,269 $631,269 $0 $0 $28,158,387 45 $28,158,387 454. Equipment Related Services Tech Rep Svcs/Miscellaneo $9,944,255 22 49 103,135 $161,185 $77 $65,404 $386,173 $83,146 $79 $7,532,568 32 $7,814,837 36 $240,645 34. Equipment Related Services Tech Rep Svcs/Space Vehi $12,708,540 2 69 143,257 $236,327 $113 $184,546 $288,107 $1,480,539 $119 $12,708,540 69 $12,708,540 694. Equipment Related Services Tech Rep Svcs/Training Aid $16,841,838 1 134 280,631 $125,309 $60 $125,309 $125,309 $208,763 $62 $16,841,838 1344. Equipment Related Services Tech Rep Svcs/Vehicular E $231,033 1 1 1,680 $286,998 $138 $286,998 $286,998 $578,967 $145 $231,033 1 $231,033 14. Equipment Related Services Tech Rep Svcs/Weapons $139,598,868 86 719 1,500,276 $223,440 $107 $60,933 $699,005 $72,041 $94 $114,325,013 604 $99,863,946 519 $5,501,749 544. Equipment Related Services Total $3,020,715,881 961 17,688 36,932,646 $2,429,043,571 15,245 $1,676,977,723 13,370 $112,271,055 1,5585. Electronic & Communication ServicesADP Backup & Security Se $271,263 2 2 3,424 $217,828 $104 $134,680 $300,976 $27,838 $110 $271,263 2 $271,263 2 $91,196 0.305. Electronic & Communication ServicesADP Data Conversion Serv $480,609 2 9 19,344 $52,529 $25 $49,659 $55,398 $15,949 $28 $282,560 6 $480,609 9 $198,049 45. Electronic & Communication ServicesADP Data Entry Services $2,680,358 9 36 75,306 $86,509 $41 $58,596 $190,543 $116,108 $33 $2,320,386 30 $2,511,064 33 $359,972 65. Electronic & Communication ServicesADP Facility Operation & M $124,275,271 89 782 1,632,414 $171,782 $82 $67,186 $700,389 $90,854 $73 $105,804,553 650 $116,713,209 753 $39,056,250 3065. Electronic & Communication ServicesADP System Acquisition Su $604,806 1 9 18,362 $68,775 $33 $68,775 $68,775 $3,131,958 $34 $604,806 95. Electronic & Communication ServicesADP Systems Analysis Serv $5,299,155 7 31 65,092 $225,765 $108 $85,080 $655,441 $38,890 $70 $5,299,155 31 $3,181,933 21 $2,075,778 145. Electronic & Communication ServicesADP Systems Developmen $69,778,472 71 372 776,973 $179,079 $86 $29,764 $513,226 $96,611 $89 $60,740,102 295 $53,074,713 261 $17,504,289 1155. Electronic & Communication ServicesADP Telecommunications & $57,177,141 40 430 897,575 $143,430 $69 $50,673 $313,872 $104,491 $64 $30,352,615 191 $44,823,241 327 $10,607,168 1165. Electronic & Communication ServicesAutomated Info System Des $380,492,705 158 1,939 4,048,204 $212,047 $102 $37,092 $680,831 $174,625 $94 $317,460,042 1,512 $327,882,933 1,700 $39,530,223 1755. Electronic & Communication ServicesAutomated News Svcs, Dat $9,868,146 24 45 93,085 $320,649 $154 $113,294 $724,972 $65,474 $105 $9,178,429 42 $9,178,429 42 $3,880,623 265. Electronic & Communication ServicesCommunications Services $2,342,037 11 21 44,391 $145,285 $70 $41,767 $334,360 $233,100 $52 $1,756,977 19 $1,756,977 19 $1,150,283 145. Electronic & Communication ServicesDigitizing Services $6,170,379 2 42 88,326 $131,075 $63 $115,114 $147,037 $31,487 $65 $6,170,379 42 $6,170,379 425. Electronic & Communication ServicesInfo & Data Broadcasting or $51,173,431 47 344 718,514 $147,959 $71 $75,927 $602,578 $123,216 $69 $50,889,310 343 $50,889,310 3435. Electronic & Communication ServicesInspection Services/Electric $831,613 5 5 10,590 $169,550 $81 $121,811 $223,541 $517,513 $94 $831,613 5 $391,717 35. Electronic & Communication ServicesInstallation of Eq/Alarm & S $7,286,399 12 35 73,259 $284,795 $136 $73,154 $550,707 $77,411 $121 $826,398 3 $4,081,250 255. Electronic & Communication ServicesInstallation of Eq/Communic $54,791,813 80 222 463,240 $238,891 $114 $95,147 $656,170 $106,703 $87 $492,952 3 $2,105,111 12 $59,761 0.475. Electronic & Communication ServicesInstallation of Eq/Electrical & $102,783 1 0 788 $272,634 $130 $272,634 $272,634 $80,587 $137 $102,783 0.385. Electronic & Communication ServicesInstallation of Eq/Fiber Optic $750,380 2 8 15,794 $118,703 $57 $97,783 $139,623 $743,620 $59 $750,380 8 $35,883 0.265. Electronic & Communication ServicesMaint & Repair of Eq/Alarm $5,274,786 22 30 61,866 $185,084 $89 $126,770 $361,568 $124,355 $84 $892,126 5 $3,033,205 165. Electronic & Communication ServicesMaint & Repair of Eq/Comm $131,840,259 78 637 1,330,615 $271,755 $130 $68,770 $725,715 $73,294 $105 $100,531,064 561 $22,065,879 175 $30,680 0.225. Electronic & Communication ServicesMaint & Repair of Eq/Electr $5,465,385 24 26 53,866 $277,424 $133 $43,458 $614,907 $120,805 $131 $560,250 6 $825,664 9 $874,228 75. Electronic & Communication ServicesMaint & Repair of Eq/Lightin $29,127 1 0 548 $111,172 $53 $111,172 $111,172 $373,076 $56 $29,127 05. Electronic & Communication ServicesMaint & Repair of Eq/Powe $521,914 8 5 10,599 $98,416 $47 $68,797 $157,333 $38,100 $48 $277,836 3 $377,482 4 $144,432 15. Electronic & Communication ServicesModification of Eq/Commun $128,305,327 1 558 1,165,724 $229,816 $110 $229,816 $229,816 $35,503 $114 $128,305,327 558 $128,305,327 5585. Electronic & Communication ServicesOther ADP & Telecommuni $336,919,842 282 2,293 4,788,709 $164,108 $79 $31,329 $662,314 $105,911 $70 $258,926,501 1,715 $313,912,820 2,124 $63,650,042 5255. Electronic & Communication ServicesProgramming Services $45,923,086 61 206 430,730 $233,861 $112 $82,098 $680,069 $104,052 $110 $32,299,408 152 $24,642,267 123 $17,169,340 845. Electronic & Communication ServicesQuality Control Svcs/Comm $418,089 2 2 4,342 $131,629 $63 $36,042 $227,216 $78,194 $66 $407,853 2 $407,853 2 $418,089 25. Electronic & Communication ServicesTech Rep Svcs/ADP Equip $787,854 1 3 5,873 $280,076 $134 $280,076 $280,076 $31,487 $142 $787,854 35. Electronic & Communication ServicesTech Rep Svcs/Communica $1,481,742 6 6 11,492 $293,935 $141 $192,736 $568,369 $397,025 $120 $916,554 35. Electronic & Communication ServicesTelecommunication Networ $89,889,268 66 578 1,207,555 $220,833 $106 $49,100 $731,390 $175,530 $72 $57,985,596 391 $81,994,915 564 $23,131,561 1965. Electronic & Communication ServicesTelephone and/or Commun $8,120,352 4 80 168,019 $133,702 $64 $78,925 $250,721 $153,444 $51 $1,108,185 4 $8,120,352 80 $7,012,167 765. Electronic & Communication Services Total $1,529,353,793 1,119 8,757 18,284,619 $1,172,337,297 6,562 $1,204,414,035 7,236 $234,588,969 1,7136. Medical Services Anesthesiology Services $11,084,040 22 39 82,088 $305,372 $146 $51,033 $501,305 $97,036 $131 $9,902,104 36 $9,653,324 36 $6,141,099 186. Medical Services Cardio-Vascular Services $3,331,470 12 26 55,175 $195,271 $94 $53,622 $453,286 $81,237 $81 $1,651,064 9 $1,553,848 7 $2,593,220 216. Medical Services Dentistry Services $35,857,160 117 293 612,522 $229,122 $110 $49,076 $578,947 $95,070 $115 $29,175,810 269 $35,788,912 293 $25,613,257 1896. Medical Services Dermatology Services $890,458 5 3 6,312 $335,453 $161 $82,131 $491,556 $54,161 $202 $890,458 3 $890,458 3 $404,935 26. Medical Services Evaluation & Screening $1,321,388 4 16 32,366 $262,035 $126 $42,724 $451,084 $317,707 $146 $1,321,388 16 $788,105 3 $788,105 36. Medical Services Gastroenterology Services $1,305,324 5 4 8,826 $340,800 $163 $134,116 $443,542 $101,063 $242 $1,305,324 4 $1,305,324 4 $336,392 16. Medical Services General Health Care Servic $42,108,840 148 248 517,371 $213,385 $102 $35,140 $501,988 $105,082 $105 $36,536,756 212 $39,689,504 223 $20,073,442 1186. Medical Services Gynecology $4,237,495 12 14 29,133 $289,498 $139 $129,617 $430,970 $97,578 $152 $4,122,784 13 $4,122,784 13 $1,164,737 46. Medical Services Hematology Services $60,066 1 1 1,781 $70,417 $34 $70,417 $70,417 $29,818 $35 $60,066 1 $60,066 1
Cost Factors Not In Theater by Portfolio and Function
Portfolio Function DescriptionInvoiced Fully Burdened
Cost [**]
Number of Records in
Portfolio
Contractor Full-Time Equivalent
(CFTE)
Direct Labor Hours
Average Rate per (CFTE)
Average Rate per (Hour)
Minimum Rate per (CFTE)
Maximum Rate per (CFTE)
Median Rate per (CFTE)
Median Rate per (Hour)
Invoiced Fully Burdend Cost [**] CFTE
Invoiced Fully Burdend Cost [**] CFTE
Invoiced Fully Burdend Cost
[**] CFTE
Govt Provided Tools and Equip At Govt Location Small Business
6. Medical Services Internal Medicine Services $4,722,201 20 18 37,904 $254,173 $122 $65,892 $570,212 $106,174 $128 $3,952,966 16 $3,658,460 14 $3,543,824 136. Medical Services Laboratory Testing Services $6,824,062 13 20 41,636 $238,898 $114 $38,545 $621,283 $33,640 $29 $537,268 9 $537,268 9 $5,921,262 166. Medical Services Medical/Psychiatric Consult $1,652,128 9 14 29,676 $115,319 $55 $72,885 $232,903 $52,136 $51 $1,583,184 13 $1,583,184 13 $120,939 16. Medical Services Neurology Services $3,531,575 15 14 29,573 $276,007 $132 $112,760 $602,140 $124,334 $89 $3,531,575 14 $3,379,509 13 $1,884,851 66. Medical Services Nuclear Medicine $224,635 2 2 4,680 $100,685 $48 $98,572 $102,798 $29,313 $51 $224,635 2 $224,635 2 $133,762 16. Medical Services Nursing Services $68,130,543 127 527 1,099,842 $124,226 $59 $38,009 $322,013 $81,110 $62 $66,333,665 504 $64,639,172 494 $32,267,430 2646. Medical Services Ophthalmology Services $1,852,443 3 15 31,445 $174,410 $84 $101,993 $299,506 $22,985 $61 $1,852,443 156. Medical Services Optometry Services $1,028,626 8 9 18,281 $145,906 $70 $60,021 $210,823 $340,772 $80 $805,150 8 $805,150 8 $1,028,626 96. Medical Services Orthopedic Services $1,216,918 6 4 8,078 $368,744 $177 $100,976 $538,124 $46,463 $254 $1,216,918 4 $991,803 2 $298,177 16. Medical Services Other Medical Services $89,469,908 160 696 1,453,227 $151,826 $73 $27,381 $633,381 $81,920 $55 $40,175,079 343 $41,029,210 353 $60,821,071 4986. Medical Services Otolaryngology Services $423,018 4 2 4,122 $253,744 $121 $49,247 $478,970 $61,733 $137 $423,018 2 $423,018 2 $210,834 26. Medical Services Pediatric Services $7,579,514 21 40 82,840 $220,576 $106 $121,374 $404,900 $175,004 $101 $6,190,240 36 $6,190,240 36 $5,352,120 276. Medical Services Pharmacology Services $5,615,995 16 46 96,793 $157,649 $76 $49,192 $340,085 $70,521 $81 $5,438,288 46 $5,615,995 46 $2,404,315 206. Medical Services Physical Medicine & Rehab $11,321,157 52 86 179,200 $157,301 $75 $58,992 $474,029 $100,051 $63 $6,769,572 50 $6,637,330 49 $6,545,393 486. Medical Services Podiatry Services $504,504 4 3 5,527 $194,645 $93 $159,502 $230,233 $83,803 $97 $504,504 3 $504,504 3 $105,907 0.466. Medical Services Psychiatry Services $31,715,603 61 154 321,859 $222,788 $107 $32,716 $578,040 $111,355 $101 $29,357,326 144 $29,459,639 144 $14,142,782 786. Medical Services Pulmonary Services $1,462,817 5 8 17,212 $226,599 $109 $99,278 $365,487 $83,724 $98 $1,462,817 8 $1,329,873 8 $549,316 56. Medical Services Radiology Services $11,633,988 28 43 89,325 $276,936 $133 $62,839 $622,811 $73,952 $92 $11,501,276 41 $11,501,276 41 $6,572,839 196. Medical Services Surgery Services $2,924,178 10 29 61,318 $194,262 $93 $57,170 $408,939 $158,563 $71 $1,389,712 13 $801,879 5 $2,189,712 196. Medical Services Thoracic Services $225,883 1 1 1,920 $245,525 $118 $245,525 $245,525 $202,549 $123 $225,883 1 $225,883 1 $225,883 16. Medical Services Urology Services $224,800 1 1 1,248 $375,920 $180 $375,920 $375,920 $94,881 $202 $224,800 1 $224,800 1 $224,800 16. Medical Services Total $352,480,735 892 2,376 4,961,280 $266,813,627 1,820 $273,615,150 1,825 $203,511,473 1,3987. Transportation Services Air Freight $19,061 1 0 579 $68,813 $33 $68,813 $68,813 $107,072 $35 $19,061 07. Transportation Services Air Passenger Service $89,481 2 1 2,717 $68,668 $33 $68,587 $68,750 $120,418 $34 $89,481 17. Transportation Services Ambulance Service $3,140,182 5 59 123,199 $64,704 $31 $34,809 $158,210 $105,526 $21 $2,078,118 52 $3,140,182 59 $1,518,201 157. Transportation Services Lodging - Hotel/Motel $551,140 8 8 16,313 $161,513 $77 $37,603 $369,538 $176,430 $51 $417,422 77. Transportation Services Motor Charter for Things $110,165 2 1 1,733 $134,654 $64 $121,339 $147,969 $52,097 $67 $110,165 17. Transportation Services Motor Freight $3,080,777 16 30 63,115 $61,370 $29 $41,808 $114,930 $117,075 $28 $2,753,719 24 $40,190 0.497. Transportation Services Motor Passenger Service $748,769 5 5 10,042 $135,063 $65 $78,841 $223,598 $69,322 $56 $647,334 47. Transportation Services Motor Pool Operations $29,087,550 13 302 630,444 $98,586 $47 $37,634 $556,872 $38,546 $29 $25,797,875 244 $29,075,620 302 $25,809,805 2447. Transportation Services Other Cargo & Freight Serv $20,403,645 4 94 196,096 $124,149 $59 $48,574 $221,908 $294,413 $58 $37,402 1 $1,107,588 7 $19,333,459 887. Transportation Services Other Transportation Travel $15,165,985 55 118 246,913 $92,419 $44 $25,903 $317,717 $108,361 $38 $1,011,798 18 $9,197,582 48 $1,341,338 247. Transportation Services Other Vehicle Charter for Tr $14,129,651 2 66 137,951 $223,290 $107 $213,678 $232,902 $197,561 $112 $14,129,651 66 $14,129,651 66 $14,129,651 667. Transportation Services Packing/Crating Services $8,541,454 37 122 254,441 $123,177 $59 $27,841 $652,482 $58,450 $41 $910,461 10 $2,048,860 27 $6,557,811 977. Transportation Services Passenger Air Charter Serv $2,791,581 2 10 21,275 $300,757 $144 $213,002 $388,511 $59,677 $160 $2,791,581 107. Transportation Services Passenger Motor Charter S $61,203 2 1 1,713 $82,437 $40 $68,743 $96,132 $55,038 $41 $44,476 17. Transportation Services Rail Freight $460,921 1 1 2,080 $462,772 $222 $462,772 $462,772 $29,531 $2697. Transportation Services Relocation Services $5,516,038 17 61 127,871 $81,278 $39 $35,772 $177,458 $30,324 $35 $1,632,710 20 $2,285,209 267. Transportation Services Stevedoring $25,780,594 23 171 356,411 $185,977 $89 $38,283 $467,927 $98,869 $77 $12,982,123 77 $18,822,799 117 $4,153,674 287. Transportation Services Vessel Freight $693,532 1 4 9,176 $157,800 $76 $157,800 $157,800 $27,533 $79 $693,532 4 $693,532 4 $693,532 47. Transportation Services Total $130,371,730 196 1,055 2,202,069 $57,640,960 473 $85,546,843 687 $77,037,791 6048. Facility Related Services A&E Inspection Services (N $236,116 1 1 1,900 $259,468 $124 $259,468 $259,468 $464,515 $1318. Facility Related Services A&E Management Enginee $37,374,600 65 189 395,467 $128,571 $62 $48,533 $470,775 $77,716 $58 $36,073,577 182 $36,132,488 182 $6,069,852 458. Facility Related Services A&E Production Engineering $10,333,744 28 49 101,487 $224,716 $108 $150,893 $563,863 $121,097 $101 $9,171,221 44 $10,159,740 48 $10,333,744 498. Facility Related Services Administrative & Service Bu $28,992,221 61 165 343,853 $180,485 $86 $89,055 $345,652 $187,576 $85 $5,851,686 39 $6,424,498 42 $19,949,264 1008. Facility Related Services Air Quality Support Services $1,127,795 9 4 9,335 $220,398 $106 $91,704 $610,778 $28,874 $68 $126,099 1 $597,009 2 $284,456 28. Facility Related Services Airfield, Communication & M $9,111,503 6 20 41,955 $282,703 $135 $72,183 $627,593 $289,693 $65 $8,587,642 16 $116,185 18. Facility Related Services Architect-Engineering Servic $280,309,927 241 1,808 3,775,625 $229,619 $110 $50,782 $746,518 $104,793 $99 $101,992,732 798 $150,400,461 1,139 $26,392,687 1448. Facility Related Services Carpet Laying & Cleaning S $118,665 3 1 1,754 $142,340 $68 $46,078 $208,431 $358,048 $86 $44,255 0.488. Facility Related Services Chaplain Services $3,248,478 44 75 155,692 $56,005 $27 $25,050 $179,012 $41,605 $24 $3,179,362 73 $3,142,592 72 $1,047,944 168. Facility Related Services Conservation & Developme $8,972,794 33 38 79,169 $189,869 $91 $79,594 $388,963 $91,834 $81 $5,061,961 16 $1,595,513 9 $5,293,909 168. Facility Related Services Custodial - Janitorial Service $136,185,401 242 2,287 4,774,790 $58,220 $28 $25,475 $234,723 $55,227 $29 $24,516,757 427 $111,265,567 1,794 $68,421,460 1,0848. Facility Related Services Demolition of Buildings $1,689,924 6 13 27,531 $141,068 $68 $67,246 $307,035 $156,267 $49 $1,493,510 128. Facility Related Services Dev of Environ Impact State $2,814,462 17 14 30,244 $230,865 $111 $89,661 $575,983 $296,044 $86 $307,733 3 $1,080,880 5 $2,251,310 98. Facility Related Services Direct Aid to Tribal Governm $120,916 3 3 6,240 $40,467 $19 $28,806 $63,691 $9,513 $19 $120,916 3 $120,916 3 $120,916 38. Facility Related Services Educational Buildings $1,493,061 6 11 22,573 $234,950 $113 $113,827 $651,394 $90,562 $778. Facility Related Services Electric Services $14,013 1 0 360 $81,473 $39 $81,473 $81,473 $200,050 $41 $14,013 0.178. Facility Related Services Engineering Drafting Servic $1,795,451 8 17 35,781 $144,001 $69 $65,672 $276,694 $101,520 $61 $860,627 10 $860,627 10 $996,884 88. Facility Related Services Equip & Mats Testing/Clothi $931,561 2 2 4,990 $422,739 $202 $359,610 $485,867 $2,478,985 $2428. Facility Related Services Equip & Mats Testing/Instru $54,110 1 1 1,683 $67,134 $32 $67,134 $67,134 $24,571 $348. Facility Related Services Facilities Operations Suppo $110,033,802 28 1,659 3,464,372 $81,721 $39 $25,729 $202,470 $92,702 $35 $104,606,094 1,577 $109,802,206 1,653 $91,505,953 1,1918. Facility Related Services Fire Protection Services $877,717 7 8 17,680 $140,095 $67 $40,643 $464,245 $391,535 $25 $684,843 68. Facility Related Services Fisheries Resources Manag $152,390 1 3 6,240 $50,984 $24 $50,984 $50,984 $29,271 $28 $152,390 3 $152,390 38. Facility Related Services Food Services $38,897,923 59 888 1,854,286 $62,675 $30 $25,157 $253,845 $55,320 $26 $32,146,858 767 $38,383,260 878 $9,186,451 2178. Facility Related Services Forest Tree Planting $294,179 4 4 8,159 $88,383 $42 $37,049 $135,870 $64,874 $46 $102,156 1 $125,540 28. Facility Related Services Forest/Range Fire Suppress $276,823 2 2 4,700 $108,466 $52 $71,885 $145,046 $455,492 $55 $276,823 2 $276,823 28. Facility Related Services Fueling & Other Petroleum S $5,310,554 3 110 229,348 $61,542 $29 $47,071 $68,780 $41,939 $35 $5,310,554 1108. Facility Related Services Gas Services $30,660 1 0 1,022 $62,699 $30 $62,699 $62,699 $832,458 $32 $30,660 0.498. Facility Related Services Guard Services $219,073,527 102 2,809 5,864,778 $120,497 $58 $36,869 $491,230 $74,392 $37 $30,854,255 274 $203,090,457 2,687 $52,070,054 6438. Facility Related Services Hazardous Substance Rem $24,866,467 104 177 370,517 $130,180 $62 $66,880 $493,755 $70,600 $47 $10,414,892 101 $12,594,138 113 $23,712,885 173

Cost Factors Not In Theater by Portfolio and Function
Portfolio Function DescriptionInvoiced Fully Burdened
Cost [**]
Number of Records in
Portfolio
Contractor Full-Time Equivalent
(CFTE)
Direct Labor Hours
Average Rate per (CFTE)
Average Rate per (Hour)
Minimum Rate per (CFTE)
Maximum Rate per (CFTE)
Median Rate per (CFTE)
Median Rate per (Hour)
Invoiced Fully Burdend Cost [**] CFTE
Invoiced Fully Burdend Cost [**] CFTE
Invoiced Fully Burdend Cost
[**] CFTE
Govt Provided Tools and Equip At Govt Location Small Business
8. Facility Related Services Highways, Roads, Streets, B $1,857,996 8 7 13,858 $263,995 $126 $104,760 $383,093 $412,795 $1348. Facility Related Services Hospital Buildings $4,774,690 3 9 19,328 $400,833 $192 $73,144 $718,798 $38,633 $37 $200,633 3 $4,630,585 98. Facility Related Services Industrial Buildings $393,580 4 1 2,963 $328,686 $157 $93,966 $720,623 $95,767 $868. Facility Related Services Insect & Rodent Control Se $1,487,897 11 12 24,764 $149,494 $72 $63,026 $377,339 $81,110 $63 $667,965 7 $969,456 98. Facility Related Services Inspection Services/Fire, Re $273,562 1 2 4,174 $136,849 $66 $136,849 $136,849 $158,550 $69 $273,562 28. Facility Related Services Inspection Services/Rope, C $120,338 1 0 356 $707,871 $338 $707,871 $707,871 $0 $08. Facility Related Services Installation of Eq/Cleaning E $392,060 1 1 2,651 $308,709 $148 $308,709 $308,709 $36,171 $1618. Facility Related Services Installation of Eq/Constructio $800,000 1 6 12,706 $131,471 $63 $131,471 $131,471 $327,816 $66 $800,000 68. Facility Related Services Installation of Eq/Furniture $646,457 2 2 5,136 $368,923 $177 $223,995 $513,852 $42,932 $214 $646,457 28. Facility Related Services Installation of Eq/Instrument $144,261 1 0 419 $717,716 $344 $717,716 $717,716 $0 $08. Facility Related Services Installation of Eq/Materials H $1,110,690 3 13 27,944 $122,411 $59 $64,414 $238,404 $6,910 $33 $770,010 128. Facility Related Services Land Treatment Practices ( $372,317 4 4 8,140 $169,458 $81 $50,094 $491,571 $154,062 $34 $129,996 2 $232,796 3 $11,221 0.228. Facility Related Services Landscaping/Groundskeepi $19,853,752 82 207 432,209 $105,327 $50 $33,398 $477,803 $91,463 $50 $3,921,781 32 $9,183,807 80 $8,860,594 1048. Facility Related Services Laundry & Dry Cleaning Ser $28,632,604 112 434 905,170 $102,639 $49 $26,262 $647,933 $79,837 $45 $9,075,761 169 $20,016,808 298 $17,254,664 3018. Facility Related Services Leaking Underground Stora $187,094 3 1 2,754 $156,088 $75 $118,751 $225,553 $14,092 $62 $131,608 18. Facility Related Services Lease or Rental of Eq/Hous $254,816 1 2 3,952 $134,610 $64 $134,610 $134,610 $104,206 $688. Facility Related Services Lease or Rental of Eq/Medi $854,646 2 1 2,732 $626,301 $300 $560,730 $691,872 $0 $0 $636,522 1 $636,522 18. Facility Related Services Lease or Rental of Eq/Plum $1,079,725 2 7 15,050 $146,968 $70 $127,182 $166,754 $96,693 $74 $1,079,725 78. Facility Related Services Lease or Rental of Eq/Servi $215,448 2 3 5,824 $212,216 $102 $40,412 $384,020 $215,729 $118 $114,822 0.30 $114,822 0.308. Facility Related Services Lease or Rental of Eq/Spec $54,200 1 1 1,408 $80,415 $38 $80,415 $80,415 $76,307 $418. Facility Related Services Lease or Rental of Eq/Toile $802,970 6 11 22,815 $62,070 $30 $34,782 $123,004 $84,095 $24 $515,132 5 $537,132 58. Facility Related Services Lease/All Other Non-Buildin $53,081 1 0 957 $115,897 $55 $115,897 $115,897 $18,414 $588. Facility Related Services Lease/Conference Space & $200,978 2 2 3,432 $112,893 $54 $90,072 $135,714 $1,510,004 $57 $157,293 18. Facility Related Services Lease/Office Buildings $92,108 1 0 400 $479,729 $230 $479,729 $479,729 $47,036 $2938. Facility Related Services Lease/Other Educational Bu $55,159 1 0 500 $230,791 $110 $230,791 $230,791 $310,158 $1178. Facility Related Services Lease/Penal Facilities $36,103 1 0 457 $164,854 $79 $164,854 $164,854 $71,256 $838. Facility Related Services Lease/Sewage & Waste Fa $678,879 2 6 12,171 $115,891 $56 $111,480 $120,302 $4,638,828 $59 $678,879 68. Facility Related Services Lease/Troop Housing Facilit $2,627,854 6 36 76,079 $75,155 $36 $70,606 $86,451 $77,057 $368. Facility Related Services Maint & Repair of Eq/Clean $391,909 4 5 10,046 $96,783 $46 $61,812 $140,561 $31,088 $47 $33,594 08. Facility Related Services Maint & Repair of Eq/Clothi $99,646 2 1 3,025 $68,854 $33 $68,797 $68,910 $75,590 $35 $99,646 18. Facility Related Services Maint & Repair of Eq/Const $2,122,080 12 14 29,296 $183,251 $88 $68,769 $252,461 $68,997 $100 $398,589 68. Facility Related Services Maint & Repair of Eq/Fire, R $596,094 6 5 9,803 $123,737 $59 $62,646 $198,796 $41,530 $62 $29,694 0.47 $463,612 3 $74,855 18. Facility Related Services Maint & Repair of Eq/Food $9,601,640 52 66 138,704 $131,552 $63 $63,059 $280,923 $72,894 $75 $503,590 4 $917,180 98. Facility Related Services Maint & Repair of Eq/Furnitu $363,325 3 12 24,200 $36,843 $18 $28,600 $52,198 $28,558 $19 $57,000 18. Facility Related Services Maint & Repair of Eq/Hand $99,646 2 1 3,025 $68,854 $33 $68,797 $68,910 $15,991 $35 $99,646 18. Facility Related Services Maint & Repair of Eq/House $944,459 9 8 17,265 $77,339 $37 $28,464 $181,174 $67,443 $36 $609,288 3 $679,180 48. Facility Related Services Maint & Repair of Eq/Instrum $1,338,451 5 6 11,925 $245,635 $118 $108,048 $488,389 $489,301 $90 $193,508 1 $405,541 38. Facility Related Services Maint & Repair of Eq/Mainte $722,209 6 4 9,345 $203,975 $98 $105,284 $482,461 $108,392 $71 $345,175 3 $345,175 3 $249,052 28. Facility Related Services Maint & Repair of Eq/Mater $1,171,720 7 11 23,783 $224,012 $107 $68,769 $641,701 $23,387 $48 $139,102 1 $802,215 10 $98,662 18. Facility Related Services Maint & Repair of Eq/Medic $524,811 3 5 9,902 $401,086 $192 $50,585 $600,116 $0 $0 $98,419 0.168. Facility Related Services Maint & Repair of Eq/Metalw $1,106,640 4 13 26,183 $175,999 $84 $68,769 $477,450 $40,990 $40 $298,941 4 $711,254 88. Facility Related Services Maint & Repair of Eq/Office $395,192 2 2 3,898 $210,533 $101 $202,256 $218,810 $442,275 $106 $395,192 2 $395,192 2 $395,192 28. Facility Related Services Maint & Repair of Eq/Photo $102,433 1 2 4,160 $51,422 $25 $51,422 $51,422 $59,032 $298. Facility Related Services Maint & Repair of Eq/Plumb $7,890,669 15 56 116,605 $150,979 $72 $28,170 $402,095 $238,923 $70 $2,181,887 20 $7,431,022 52 $4,442,715 288. Facility Related Services Maint & Repair of Eq/Prefab $11,014,656 9 77 161,612 $232,736 $111 $89,602 $634,119 $64,432 $93 $4,214,681 47 $4,214,681 47 $41,741 0.458. Facility Related Services Maint & Repair of Eq/Recre $55,985 1 0 1,031 $113,330 $54 $113,330 $113,330 $4,304,305 $588. Facility Related Services Maint & Repair of Eq/Refrig $2,200,944 15 21 43,223 $119,306 $57 $68,600 $231,112 $125,805 $52 $767,840 4 $484,927 48. Facility Related Services Maint & Repair of Eq/Rope, $99,646 2 1 3,025 $68,854 $33 $68,797 $68,910 $20,991 $35 $99,646 18. Facility Related Services Maint & Repair of Eq/Servic $2,684,333 5 16 33,151 $146,206 $70 $68,779 $231,401 $266,127 $73 $2,384,783 148. Facility Related Services Maint & Repair of Eq/Specia $553,660 4 4 8,682 $187,673 $90 $58,604 $324,148 $180,188 $93 $201,438 1 $201,438 1 $220,612 38. Facility Related Services Maint & Repair of Eq/Wood $74,736 2 1 2,269 $68,770 $33 $68,722 $68,817 $58,164 $35 $74,736 18. Facility Related Services Maint/All Other Non-Building $3,643,255 27 46 97,090 $99,516 $48 $37,745 $333,029 $71,616 $36 $1,244,468 18 $1,368,349 19 $3,067,060 408. Facility Related Services Maint/Ammunition Facilities $204,000 1 5 11,182 $38,095 $18 $38,095 $38,095 $70,000 $22 $204,000 58. Facility Related Services Maint/Dining Facilities $365,424 7 5 11,483 $66,126 $32 $52,157 $120,029 $48,029 $29 $310,811 58. Facility Related Services Maint/Electronic & Commun $249,215 4 2 4,813 $118,068 $57 $80,019 $204,220 $705,291 $48 $73,485 1 $249,215 28. Facility Related Services Maint/Family Housing Facilit $15,695,366 13 85 176,659 $172,796 $83 $62,599 $379,354 $106,052 $58 $2,243,248 23 $5,015,396 208. Facility Related Services Maint/Government-Owned G $358,104 1 1 2,560 $292,091 $140 $292,091 $292,091 $75,342 $153 $358,104 18. Facility Related Services Maint/Heating & Cooling Pla $2,218,022 7 8 16,487 $257,355 $123 $65,479 $464,115 $95,864 $90 $1,766,242 5 $111,532 18. Facility Related Services Maint/Highways, Roads, Str $191,387 2 1 1,272 $302,878 $145 $104,760 $500,997 $69,283 $1848. Facility Related Services Maint/Hospitals & Infirmarie $25,310,388 28 315 658,055 $160,821 $77 $40,291 $471,760 $69,326 $62 $25,310,388 3158. Facility Related Services Maint/Maintenance Building $10,019,855 11 124 258,072 $166,451 $80 $52,106 $421,099 $59,542 $71 $9,512,415 121 $1,421,912 148. Facility Related Services Maint/Office Buildings $29,152,385 40 314 655,082 $104,391 $50 $31,466 $366,341 $41,230 $40 $18,269,864 207 $26,968,575 295 $26,520,594 2898. Facility Related Services Maint/Other Administrative & $68,840,427 35 708 1,477,980 $99,936 $48 $39,901 $594,811 $59,898 $37 $51,774,963 507 $61,202,011 624 $60,479,979 6008. Facility Related Services Maint/Other Educational Bu $193,025 2 5 11,000 $49,081 $23 $35,400 $62,762 $34,157 $27 $15,000 0.248. Facility Related Services Maint/Other Hospital Buildin $12,338 1 0 474 $54,352 $26 $54,352 $54,352 $48,605 $308. Facility Related Services Maint/Other Miscellaneous B $6,107,477 11 30 61,718 $121,095 $58 $39,901 $302,674 $111,087 $47 $1,286,852 7 $6,013,439 28 $5,919,602 278. Facility Related Services Maint/Other Utilities $398,608 3 2 3,914 $194,551 $93 $75,458 $412,266 $29,268 $49 $337,980 18. Facility Related Services Maint/Other Warehouse Bu $120,125 1 0 421 $594,678 $285 $594,678 $594,678 $0 $0 $120,125 0.208. Facility Related Services Maint/Pollution Abatement & $201,284 3 1 3,067 $108,443 $52 $72,098 $178,828 $17,400 $38 $201,284 18. Facility Related Services Maint/Recreation Facilities ( $80,183 2 0 842 $200,181 $96 $36,882 $363,480 $267,831 $111 $7,487 0.208. Facility Related Services Maint/Restoration Activities $48,144,676 3 378 789,690 $113,299 $54 $87,662 $136,787 $66,150 $59 $48,113,030 378 $48,113,030 378
Cost Factors Not In Theater by Portfolio and Function
Portfolio Function DescriptionInvoiced Fully Burdened
Cost [**]
Number of Records in
Portfolio
Contractor Full-Time Equivalent
(CFTE)
Direct Labor Hours
Average Rate per (CFTE)
Average Rate per (Hour)
Minimum Rate per (CFTE)
Maximum Rate per (CFTE)
Median Rate per (CFTE)
Median Rate per (Hour)
Invoiced Fully Burdend Cost [**] CFTE
Invoiced Fully Burdend Cost [**] CFTE
Invoiced Fully Burdend Cost
[**] CFTE
Govt Provided Tools and Equip At Govt Location Small Business
8. Facility Related Services Maint/Schools $656,928 8 12 24,612 $94,188 $45 $32,707 $322,065 $46,796 $26 $517,799 11 $88,890 0.288. Facility Related Services Maint/Sewage & Waste Fac $411,800 4 2 3,530 $291,091 $139 $141,815 $674,433 $334,654 $80 $411,800 2 $166,684 18. Facility Related Services Maint/Unimproved Real Pro $2,580,567 18 22 45,472 $152,852 $73 $66,832 $674,132 $54,406 $63 $2,396,529 22 $2,396,529 22 $1,670,839 158. Facility Related Services Maint/Water Supply Facilitie $146,041 5 1 2,730 $115,437 $55 $60,103 $202,188 $95,115 $52 $44,130 0 $11,660 0.198. Facility Related Services Modification of Eq/Metalwor $4,528,519 3 40 83,015 $113,821 $55 $111,891 $116,557 $92,405 $58 $4,528,519 40 $4,528,519 40 $4,528,519 408. Facility Related Services Oil Spill Cleanup, Removal, $112,950 2 1 2,592 $74,568 $36 $52,071 $97,064 $122,695 $39 $104,150 1 $104,150 1 $112,950 18. Facility Related Services Operation/Air Traffic Contro $4,671,528 8 34 71,878 $146,014 $70 $75,118 $202,909 $148,173 $82 $3,933,946 25 $4,671,528 34 $891,300 118. Facility Related Services Operation/All Other Non-Bu $25,337,601 9 504 1,051,650 $159,614 $76 $44,287 $395,531 $139,711 $78 $25,261,659 503 $25,337,601 504 $15,821,137 3198. Facility Related Services Operation/Ammunition Faci $629,916 1 8 16,633 $79,076 $38 $79,076 $79,076 $132,851 $41 $629,916 8 $629,916 8 $629,916 88. Facility Related Services Operation/Conference Spac $4,182,581 9 32 65,828 $127,908 $61 $50,806 $296,798 $97,478 $59 $3,295,666 18 $4,182,581 32 $4,182,581 328. Facility Related Services Operation/Dining Facilities $257,314,870 113 5,036 10,514,524 $63,884 $31 $31,174 $197,826 $75,711 $31 $238,594,486 4,667 $257,314,870 5,036 $36,093,588 6448. Facility Related Services Operation/Electronic & Com $7,492,654 6 54 113,242 $196,185 $94 $36,327 $548,659 $133,953 $60 $5,066,569 47 $7,492,654 54 $1,120,867 138. Facility Related Services Operation/EPG - Petroleum $58,080 1 2 3,795 $31,947 $15 $31,947 $31,947 $30,230 $20 $58,080 2 $58,080 2 $58,080 28. Facility Related Services Operation/Family Housing F $286,833 13 3 5,231 $114,470 $55 $107,184 $125,772 $89,454 $598. Facility Related Services Operation/Fuel Storage Bui $400,769 5 3 6,839 $117,771 $56 $107,116 $133,162 $159,074 $58 $400,769 3 $400,769 38. Facility Related Services Operation/Fuel Supply Facil $439,467 2 6 12,676 $99,845 $48 $67,090 $132,600 $136,829 $51 $374,360 6 $374,360 6 $374,360 68. Facility Related Services Operation/Govt-Owned Con $18,516,592 2 206 430,175 $97,899 $47 $88,525 $107,273 $56,736 $50 $16,923,694 191 $18,516,592 2068. Facility Related Services Operation/Govt-Owned Gov $388,485 1 1 3,054 $265,540 $127 $265,540 $265,540 $150,255 $137 $388,485 1 $388,485 1 $388,485 18. Facility Related Services Operation/Hospitals & Infirm $26,834,245 25 183 381,310 $147,085 $70 $45,501 $469,321 $137,907 $58 $1,737,966 8 $26,834,245 183 $7,756,111 478. Facility Related Services Operation/Maintenance Buil $38,126,317 22 257 536,894 $173,911 $83 $63,637 $434,282 $146,755 $74 $12,274,711 79 $38,126,317 257 $12,284,191 758. Facility Related Services Operation/Missile System F $2,613,429 2 16 32,460 $226,956 $109 $154,956 $298,957 $117,371 $118 $2,188,911 14 $2,613,429 16 $424,518 18. Facility Related Services Operation/Office Buildings $16,829,276 5 175 365,238 $116,063 $56 $62,780 $189,864 $558,869 $51 $15,645,881 156 $16,829,276 175 $1,649,073 228. Facility Related Services Operation/Other Administra $45,456,954 8 357 745,655 $90,076 $43 $27,108 $149,071 $41,677 $50 $45,421,512 357 $45,449,481 357 $45,099,403 3538. Facility Related Services Operation/Other Educationa $2,205,901 2 28 58,508 $81,796 $39 $75,877 $87,716 $40,359 $42 $2,205,901 28 $2,205,901 288. Facility Related Services Operation/Other Hospital Bu $1,682,395 1 23 47,289 $74,284 $36 $74,284 $74,284 $69,650 $38 $1,682,395 23 $1,682,395 238. Facility Related Services Operation/Other Industrial B $126,838,341 3 1,202 2,508,792 $136,585 $65 $86,908 $215,122 $28,937 $55 $126,591,166 1,200 $126,591,166 1,200 $247,175 18. Facility Related Services Operation/Other Miscellaneo $25,606,326 3 244 508,721 $98,780 $47 $84,378 $108,269 $84,284 $53 $25,606,326 244 $25,606,326 244 $25,606,326 2448. Facility Related Services Operation/Other Warehouse $1,383,075 11 21 43,517 $83,365 $40 $49,695 $116,066 $42,263 $43 $1,079,146 18 $1,079,146 18 $805,424 128. Facility Related Services Operation/Pollution Abatem $568,569 1 6 12,520 $94,825 $45 $94,825 $94,825 $17,945 $49 $568,569 6 $568,569 68. Facility Related Services Operation/Production Buildi $957,543 1 13 27,040 $73,942 $35 $73,942 $73,942 $730,387 $37 $957,543 13 $957,543 13 $957,543 138. Facility Related Services Operation/Recreation Facilit $29,005,141 8 278 579,972 $75,185 $36 $32,229 $117,303 $44,584 $42 $26,700,350 254 $28,998,953 278 $28,469,547 2708. Facility Related Services Operation/Sewage & Waste $11,448,890 4 22 46,618 $291,486 $140 $37,568 $610,231 $971,838 $34 $11,357,199 21 $3,170,491 98. Facility Related Services Operation/Troop Housing Fa $8,711,186 11 138 288,841 $59,912 $29 $36,986 $81,861 $45,924 $33 $6,695,175 88 $8,711,186 138 $1,278,308 198. Facility Related Services Operation/Tunnels & Subsu $511,040 1 5 10,349 $103,115 $49 $103,115 $103,115 $121,511 $53 $511,040 5 $511,040 5 $511,040 58. Facility Related Services Operation/Unimproved Rea $93,964 2 1 1,783 $111,487 $53 $92,604 $130,371 $61,099 $57 $93,964 1 $93,964 1 $93,964 18. Facility Related Services Operation/Waste Treatmen $321,235,113 8 2,293 4,787,443 $251,372 $120 $84,707 $448,569 $397,809 $114 $321,169,827 2,293 $321,092,541 2,2928. Facility Related Services Other Architect & Engineeri $294,162,181 194 1,123 2,344,177 $260,120 $125 $62,342 $746,063 $95,284 $114 $73,087,630 396 $100,090,557 568 $31,237,973 1438. Facility Related Services Other Buildings $64,940,012 41 295 616,185 $234,751 $112 $88,729 $584,652 $90,189 $114 $51,496,300 229 $52,659,330 240 $457,676 28. Facility Related Services Other Environ Svcs, Studies $36,431,715 116 256 534,910 $166,291 $80 $39,223 $686,782 $94,727 $70 $13,888,007 121 $22,080,625 177 $22,747,829 1698. Facility Related Services Other Housekeeping Servic $5,606,499 22 73 152,350 $90,771 $43 $38,298 $354,821 $96,409 $38 $1,789,375 23 $4,342,266 54 $1,654,368 178. Facility Related Services Other Natural Resources & $10,760,228 48 82 171,586 $157,660 $76 $53,868 $671,331 $78,852 $61 $7,609,344 59 $8,211,238 67 $5,679,935 408. Facility Related Services Other Non-Building Structur $139,144 2 1 2,819 $154,127 $74 $79,120 $229,135 $156,685 $798. Facility Related Services Other Quality Cntl Svcs/Con $475,372 4 4 8,080 $116,555 $56 $61,704 $155,074 $194,509 $64 $475,372 4 $475,372 4 $475,372 48. Facility Related Services Other Quality Cntl Svcs/Con $445,075 1 2 3,465 $268,279 $128 $268,279 $268,279 $19,549 $1398. Facility Related Services Other Quality Cntl Svcs/Ser $26,746 1 0 702 $79,601 $38 $79,601 $79,601 $102,384 $41 $26,746 0 $26,746 0.348. Facility Related Services Other Range/Forest Improv $396,092 2 3 7,074 $108,888 $52 $97,486 $120,289 $287,706 $56 $48,938 1 $48,938 1 $347,154 38. Facility Related Services Other Social Services $10,028,995 46 90 188,844 $122,650 $59 $34,989 $230,412 $64,906 $52 $5,238,125 63 $8,851,294 81 $5,577,596 618. Facility Related Services Other Utilities $3,192,861 21 32 66,791 $163,198 $78 $25,013 $326,400 $53,823 $46 $1,816,823 6 $807,494 58. Facility Related Services Other Wildlife Management $1,129,211 9 12 25,083 $92,559 $44 $61,501 $143,645 $72,763 $48 $1,027,776 11 $788,033 8 $991,315 108. Facility Related Services Pesticides Support Services $189,038 7 2 3,358 $120,404 $58 $38,536 $266,443 $44,836 $35 $65,012 0 $139,021 18. Facility Related Services Quality Control Svcs/Constr $78,110 1 0 641 $254,430 $122 $254,430 $254,430 $63,213 $1318. Facility Related Services Quality Control Svcs/Constr $71,045 1 0 701 $211,443 $101 $211,443 $211,443 $191,195 $1088. Facility Related Services Quality Control Svcs/Fire, R $11,769 1 0 472 $52,075 $25 $52,075 $52,075 $55,784 $298. Facility Related Services Quality Control Svcs/Food P $166,840 2 2 3,810 $153,378 $73 $62,896 $243,861 $276,002 $79 $166,840 2 $166,840 2 $166,840 28. Facility Related Services Quality Control Svcs/Instrum $784,340 6 6 13,364 $127,541 $61 $96,571 $161,125 $161,090 $63 $175,277 2 $175,277 2 $175,277 28. Facility Related Services Quality Control Svcs/Plumb $106,148 2 2 4,984 $54,649 $26 $42,346 $66,951 $52,521 $308. Facility Related Services Recreation Site Maintenanc $66,899 1 2 4,400 $31,751 $15 $31,751 $31,751 $8,899 $20 $66,899 28. Facility Related Services Recreational Services $31,198 1 0 651 $99,994 $48 $99,994 $99,994 $24,415 $528. Facility Related Services Research & Development F $20,577,837 59 90 187,361 $252,422 $121 $58,253 $611,962 $123,204 $99 $10,221,305 40 $7,781,554 34 $10,506,490 478. Facility Related Services Residential Buildings $1,362,455 6 5 11,022 $269,632 $129 $114,139 $386,300 $125,327 $1408. Facility Related Services Restoration $1,513,022 9 7 15,504 $227,556 $109 $120,209 $350,985 $228,698 $122 $630,662 3 $714,207 48. Facility Related Services Restoration Activities $683,277 1 2 5,120 $278,661 $133 $278,661 $278,661 $620,000 $147 $683,277 28. Facility Related Services Site Preparation $1,596,588 5 14 30,096 $139,727 $67 $92,546 $205,417 $40,655 $76 $1,127,838 11 $1,127,838 11 $1,596,588 148. Facility Related Services Snow Removal/Salt Service $1,054,384 9 9 19,058 $205,327 $98 $33,419 $575,644 $66,014 $67 $577,457 88. Facility Related Services Social Rehabilitation Service $157,882 2 2 5,166 $70,912 $34 $54,867 $86,957 $577,828 $38 $60,000 1 $157,882 2 $60,000 18. Facility Related Services Surveillance Services $109,749 1 1 1,920 $119,292 $57 $119,292 $119,292 $31,602 $61 $109,749 1 $109,749 1 $109,749 18. Facility Related Services Tech Rep Svcs/Fire, Rescu $106,692 1 1 2,146 $103,786 $50 $103,786 $103,786 $60,598 $53 $106,692 1 $106,692 18. Facility Related Services Tech Rep Svcs/Special Indu $305,438 2 2 3,676 $146,310 $70 $112,728 $179,891 $982,854 $758. Facility Related Services Tech Rep Svcs/Subsistence $29,600 1 0 800 $77,285 $37 $77,285 $77,285 $38,856 $40 $29,600 0.38 $29,600 0 $29,600 0.388. Facility Related Services Trash/Garbage Collection S $32,713,776 181 340 709,257 $91,439 $44 $25,464 $612,557 $59,143 $26 $352,184 8 $11,807,846 93 $16,988,616 142

Cost Factors Not In Theater by Portfolio and Function
Portfolio Function DescriptionInvoiced Fully Burdened
Cost [**]
Number of Records in
Portfolio
Contractor Full-Time Equivalent
(CFTE)
Direct Labor Hours
Average Rate per (CFTE)
Average Rate per (Hour)
Minimum Rate per (CFTE)
Maximum Rate per (CFTE)
Median Rate per (CFTE)
Median Rate per (Hour)
Invoiced Fully Burdend Cost [**] CFTE
Invoiced Fully Burdend Cost [**] CFTE
Invoiced Fully Burdend Cost
[**] CFTE
Govt Provided Tools and Equip At Govt Location Small Business
8. Facility Related Services Tree Thinning Services $330,179 8 5 9,505 $79,911 $38 $33,394 $139,491 $47,836 $47 $87,075 1 $188,956 38. Facility Related Services Utilities $481,914 4 3 6,205 $226,065 $108 $132,027 $321,480 $73,368 $119 $296,400 28. Facility Related Services Warehousing & Storage Se $11,608,264 45 127 264,369 $113,983 $55 $49,032 $442,264 $75,067 $42 $3,281,587 52 $7,537,215 107 $1,090,192 148. Facility Related Services Waste Treatment & Storage $7,157,102 22 24 49,220 $207,418 $99 $51,222 $721,964 $33,969 $80 $235,642 1 $683,887 8 $877,064 58. Facility Related Services Water Quality Support Serv $277,738 5 2 3,238 $167,917 $80 $38,694 $271,540 $86,196 $91 $78,065 0.448. Facility Related Services Water Services $4,790,607 10 26 53,273 $134,483 $64 $40,351 $260,696 $90,314 $52 $2,673,316 17 $2,673,316 17 $3,211,019 188. Facility Related Services Wildhorse/Burro Control Se $70,590 1 1 2,080 $70,873 $34 $70,873 $70,873 $938,676 $368. Facility Related Services Total $2,750,882,975 2,955 27,371 57,149,788 $1,580,993,192 17,070 $2,149,145,054 23,831 $769,003,021 8,1649. Construction Services All Other Non-Building Facil $1,378,708 2 4 9,058 $409,551 $196 $254,475 $564,628 $21,580 $669. Construction Services Conference Space & Facilit $341,425 4 2 3,840 $220,514 $106 $153,873 $273,864 $84,911 $116 $341,425 29. Construction Services Dams $49,241 1 0 549 $187,228 $90 $187,228 $187,228 $32,410 $969. Construction Services Electronic & Communication $1,156,332 11 8 16,431 $91,948 $44 $27,212 $216,685 $44,936 $31 $940,318 5 $44,917 0.229. Construction Services Family Housing Facilities $57,759 1 0 400 $300,828 $144 $300,828 $300,828 $36,171 $1619. Construction Services Government-Owned Contra $231,946,891 19 460 960,488 $568,934 $272 $329,644 $743,141 $0 $0 $3,109,205 9 $3,109,205 99. Construction Services Hospitals & Infirmaries $1,022,229 4 6 13,400 $150,645 $72 $121,306 $179,253 $27,466 $77 $646,280 4 $646,280 4 $646,280 49. Construction Services Missile System Facilities $628,302 1 5 11,120 $117,969 $57 $117,969 $117,969 $33,853 $60 $628,302 5 $628,302 5 $628,302 59. Construction Services Office Buildings $2,764,003 7 9 19,506 $268,520 $129 $127,782 $565,431 $62,938 $92 $2,375,393 7 $2,375,393 79. Construction Services Other Administrative & Serv $1,637,540 3 15 30,330 $106,589 $51 $32,755 $165,609 $19,104 $62 $1,549,560 12 $1,549,560 12 $1,549,560 129. Construction Services Other Hospital Buildings $56,719 1 1 2,688 $44,071 $21 $44,071 $44,071 $99,011 $269. Construction Services Other Miscellaneous Buildin $2,381,802 7 18 38,313 $131,444 $63 $116,936 $188,883 $106,030 $62 $2,025,569 16 $2,381,802 189. Construction Services Other Utilities $914,491 3 16 33,318 $279,836 $134 $35,488 $720,474 $77,506 $469. Construction Services Parking Facilities Constructi $175,774 1 0 1,030 $356,539 $171 $356,539 $356,539 $13,416 $202 $175,774 0 $175,774 0.499. Construction Services Pollution Abatement & Cont $33,580 1 1 1,584 $44,242 $21 $44,242 $44,242 $46,693 $26 $33,580 19. Construction Services Sewage & Waste Facilities $164,880 6 5 10,958 $35,383 $17 $27,842 $39,821 $24,587 $229. Construction Services Waste Treatment & Storage $250,470,923 5 350 731,440 $699,342 $335 $648,420 $747,532 $0 $0 $250,470,923 3509. Construction Services Water Supply Facilities $102,930 2 0 991 $221,753 $106 $195,919 $247,586 $191,186 $1149. Construction Services Total $495,283,529 79 903 1,885,444 $7,958,915 47 $262,311,137 412 $5,761,651 30Not Assigned Combat or Security Related $1,472,425 1 6 13,057 $235,475 $113 $235,475 $235,475 $629,632 $121 $1,472,425 6 $1,472,425 6Not Assigned Private Security Contractors $2,017,576 6 20 41,671 $170,667 $82 $68,619 $379,929 $51,098 $77 $1,215,484 17 $1,918,512 19 $1,471,618 19Not Assigned R&D-Engineering $7,152,309 7 13 27,777 $320,737 $154 $108,401 $654,526 $63,439 $59 $5,664,921 9 $930,120 4Not Assigned R&D-Environmental Sci $198,252 2 1 1,399 $265,119 $127 $169,646 $360,591 $246,418 $146Not Assigned R&D-Math & Computer Sci $3,589,889 7 11 23,146 $260,466 $125 $62,405 $455,901 $93,733 $203 $378,998 4 $378,998 4 $378,998 4Not Assigned Total $14,430,451 23 51 107,050 $3,066,907 27 $9,434,856 38 $2,780,736 26Grand Total $19,609,901,948 17,119 123,616 258,111,086 $11,557,680,958 82,312 $13,082,679,802 95,997 $3,447,022,078 27,776
Please click on the '+' to expand the portfolio to the functions
[**] Contractor's Invoiced Fully Burdened Costs include only what the contractor is charging the government The value of government furnished tools, office space and equipment are not reflected in the data reported by the contractors even though this is a cost born by the government and attributable to the cost of contract performance.

Cost Factors Not In Theater by Portfolio and Function
Portfolio Function DescriptionInvoiced Fully Burdened Cost
[**]
Number of
Records in
Portfolio
Contractor Full-Time
Equivalent (CFTE)
Direct Labor Hours
Average Rate per (CFTE)
Average Rate per (Hour)
Minimum Rate per (CFTE)
Maximum Rate per (CFTE)
Median Rate per (CFTE)
Median Rate per (Hour) Invoiced Fully
Burdend Cost [**] CFTEInvoiced Fully
Burdend Cost [**] CFTE
Invoiced Fully
Burdend Cost [**] CFTE
1. Research and Development R & D/Aircraft-Eng/Manuf Develop $900,000 1 4 7,749 $242,522 $116 $242,522 $242,522 $900,000 $1161. Research and Development R & D/Construction-Basic Researc $711,597 4 6 11,975 $124,096 $59 $124,034 $124,171 $195,436 $591. Research and Development R & D/Electronics & Communicatio $264,340 1 2 4,448 $124,103 $59 $124,103 $124,103 $264,340 $591. Research and Development R & D/Electronics & Communicatio $1,092,881 2 6 12,032 $189,607 $91 $181,619 $197,594 $169,762 $91 $1,092,881 6 $1,092,881 6 $1,092,881 61. Research and Development R & D/Other Defense-Operational S $178,738 1 1 2,815 $132,595 $63 $132,595 $132,595 $91,927 $63 $178,738 1 $178,738 11. Research and Development R & D/Services-Basic Research $17,051,146 16 137 286,931 $124,116 $59 $123,812 $124,354 $31,721 $59 $62,600 11. Research and Development R & D/Services-Demo/Valid $1,766,265 4 9 19,109 $187,596 $90 $124,050 $253,682 $313,496 $89 $1,252,968 51. Research and Development R & D/Services-Eng/Manuf Develo $106,795,263 30 859 1,792,557 $125,538 $60 $124,064 $145,552 $2,597,705 $59 $649,779 5 $649,779 51. Research and Development R & D/Weapons-Eng/Manuf Develo $1,202,463 1 5 10,434 $240,637 $115 $240,637 $240,637 $410,413 $115 $1,202,463 5 $1,202,463 51. Research and Development R & D/Weapons-Operational Syste $72,470,498 2 811 1,694,002 $86,862 $42 $78,776 $94,947 $24,358,411 $42 $72,470,498 811 $72,470,498 8111. Research and Development R&D-Agri Marketing $205,933 1 0 712 $603,909 $289 $603,909 $603,909 $20,593 $289 $205,933 0.341. Research and Development R&D-Electronics & Comm Eq $2,993,930 1 11 23,942 $261,114 $125 $261,114 $261,114 $1,181,928 $125 $2,993,930 11 $2,993,930 111. Research and Development R&D-Engineering-Eng Dev $29,566 1 0 498 $123,705 $59 $123,705 $123,705 $29,565 $591. Research and Development R&D-Insect & Dis Cont-Opsy Dev $13,607,901 2 94 195,317 $128,918 $62 $108,458 $149,378 $4,742,091 $62 $13,607,901 94 $13,607,901 941. Research and Development R&D-Other Agri-B Res $9,103,745 4 27 57,417 $335,256 $161 $322,244 $354,849 $637,737 $159 $4,422,089 13 $9,103,745 271. Research and Development R&D-Other Income Security-Eng D $60,230 1 0 1,014 $123,930 $59 $123,930 $123,930 $60,230 $591. Research and Development R&D-Other R & D-B Res $855,403 1 7 14,394 $124,079 $59 $124,079 $124,079 $855,403 $591. Research and Development R&D-Rural Svcs & Develop-Cntl-Co $403,531 3 3 6,791 $124,061 $59 $124,008 $124,094 $57,697 $591. Research and Development R&D-Svcs $1,720,324 1 9 18,848 $190,575 $91 $190,575 $190,575 $560,597 $911. Research and Development R&D-Trans-Roads-Bridges-Cntl-Co $630,238 2 5 10,105 $132,630 $64 $124,072 $141,188 $315,119 $641. Research and Development Total $232,043,993 79 1,998 4,171,090 $96,618,278 947 $102,758,835 966 $1,155,481 62. Knowledge Based Services Accounting Services $12,592,566 2 22 46,215 $568,332 $272 $543,333 $593,331 $2,554,606 $272 $12,592,566 22 $12,592,566 22 $5,870,717 112. Knowledge Based Services ADP Software, Equipment, and Te $827,903 2 1 2,522 $685,257 $328 $685,087 $685,428 $413,952 $3282. Knowledge Based Services Advertising Services $148,365 3 2 4,795 $64,617 $31 $64,589 $64,647 $29,996 $312. Knowledge Based Services Arts/Graphics Services $2,296,854 7 24 49,642 $96,667 $46 $96,604 $96,805 $129,352 $462. Knowledge Based Services Audio/Visual Services $20,961,314 22 217 453,043 $96,622 $46 $96,503 $96,881 $92,187 $462. Knowledge Based Services Contract, Procurement & Acquisitio $17,413,686 17 200 416,716 $79,357 $38 $16,901 $115,439 $88,752 $47 $17,413,686 200 $17,413,686 2002. Knowledge Based Services Courier & Messenger Services $1,022,961 4 16 33,058 $64,611 $31 $64,542 $64,731 $40,926 $312. Knowledge Based Services Data Analyses (other than scientific $9,287,872 5 17 36,466 $505,352 $242 $347,979 $576,597 $821,409 $276 $2,379,287 5 $2,379,287 5 $1,546,814 32. Knowledge Based Services Data Collection Services $2,165,029 7 24 49,143 $88,061 $42 $62,807 $121,536 $57,588 $34 $2,141,985 232. Knowledge Based Services Education Services $604,440 2 1 1,841 $685,308 $328 $685,298 $685,318 $302,220 $3282. Knowledge Based Services Educational Services $18,665,610 78 289 603,196 $64,603 $31 $64,460 $64,745 $91,616 $312. Knowledge Based Services Educational Studies & Analyses $1,994,980 1 8 15,955 $261,089 $125 $261,089 $261,089 $1,994,980 $1252. Knowledge Based Services Engineering Technical Services $89,638,438 56 263 548,581 $277,007 $133 $59,683 $626,295 $136,524 $122 $55,251,500 158 $65,509,297 1982. Knowledge Based Services Expert Witness $22,035 1 0 712 $64,619 $31 $64,619 $64,619 $22,035 $312. Knowledge Based Services Film/Video Tape Production Servic $14,378,409 6 149 310,765 $96,605 $46 $96,594 $96,608 $2,466,192 $462. Knowledge Based Services Financial Services $1,254,081 1 19 40,527 $64,613 $31 $64,613 $64,613 $1,254,081 $312. Knowledge Based Services Foreign Policy/National Security Po $618,369 2 2 4,945 $261,141 $125 $261,102 $261,180 $309,185 $125 $265,098 12. Knowledge Based Services Industrial Hygienics $39,000 1 1 1,260 $64,677 $31 $64,677 $64,677 $39,000 $312. Knowledge Based Services Intelligence Services $16,250,452 6 149 310,370 $99,375 $48 $70,201 $133,410 $1,795,026 $47 $13,722,646 116 $13,722,646 116 $2,057,311 152. Knowledge Based Services Intelligence Studies $3,268,536 1 10 21,000 $325,001 $156 $325,001 $325,001 $1,044,296 $156 $3,268,536 10 $3,268,536 102. Knowledge Based Services Legal Services $146,247 4 2 4,726 $64,583 $31 $64,527 $64,673 $32,044 $312. Knowledge Based Services Mailing & Distribution Services $37,869,743 18 480 1,001,319 $76,190 $36 $13,107 $84,434 $1,029,148 $38 $37,869,743 480 $37,869,743 4802. Knowledge Based Services Market Research and Public Opinio $12,929,856 10 200 417,840 $64,614 $31 $64,610 $64,624 $406,772 $312. Knowledge Based Services Operations Research and Quantita $13,328,215 3 111 231,904 $321,821 $154 $110,959 $738,962 $135,529 $55 $12,645,261 105 $13,328,215 111 $682,954 62. Knowledge Based Services Organization/Administrative/Person $1,460,891 1 6 11,684 $261,060 $125 $261,060 $261,060 $1,460,890 $1252. Knowledge Based Services Other Administrative Support Servi $3,744,245 6 58 121,000 $64,604 $31 $64,591 $64,613 $140,236 $312. Knowledge Based Services Other Education & Training Service $65,720,710 34 661 1,379,460 $188,741 $90 $9,687 $388,997 $197,659 $89 $13,590,977 342 $65,520,947 659 $585,113 32. Knowledge Based Services Other Management Support Servic $260,672,023 34 2,936 6,130,389 $116,399 $56 $15,881 $346,293 $875,188 $57 $156,856,014 1,837 $168,716,562 1,8712. Knowledge Based Services Other Photographic Mapping, Print $17,145 1 0 371 $96,322 $46 $96,322 $96,322 $17,145 $462. Knowledge Based Services Other Professional Services $442,067,406 134 3,049 6,367,327 $160,002 $77 $48,755 $213,264 $144,188 $78 $91,838,820 886 $97,386,655 923 $10,928,931 672. Knowledge Based Services Other Special Studies & Analyses $40,427,338 10 116 242,535 $356,812 $171 $311,543 $419,167 $3,078,634 $177 $40,427,338 116 $40,427,338 116 $18,322,516 472. Knowledge Based Services Personal Care Services $763,170 1 9 18,024 $88,412 $42 $88,412 $88,412 $442,396 $42 $763,170 9 $763,170 92. Knowledge Based Services Personal Services Contracts $5,052,169 3 182 380,463 $40,513 $19 $27,163 $64,499 $1,033,108 $14 $5,037,076 182 $5,037,076 1822. Knowledge Based Services Print/Binding Services $6,302,603 11 65 136,221 $96,560 $46 $96,372 $96,713 $46,751 $46 $976,705 102. Knowledge Based Services Program Management/Support Ser $325,655,462 46 3,099 6,471,256 $168,825 $81 $11,436 $424,566 $470,417 $55 $321,218,559 3,043 $322,022,870 3,049 $1,867,428 122. Knowledge Based Services Public Relations Services $9,087,358 8 141 293,666 $64,623 $31 $64,571 $64,707 $169,026 $312. Knowledge Based Services R & D/Services-Management Supp $52,049,558 5 419 875,872 $124,085 $59 $124,079 $124,094 $1,011,080 $592. Knowledge Based Services R&D-Other Medical-Mgmt Sup $42,682 1 0 718 $124,076 $59 $124,076 $124,076 $42,682 $592. Knowledge Based Services Reproduction Services $26,012 1 0 562 $96,701 $46 $96,701 $96,701 $26,012 $462. Knowledge Based Services Technical Assistance $12,283,690 15 49 101,998 $179,326 $86 $171,835 $261,968 $47,112 $82 $11,649,783 45 $11,649,783 45 $92,302 12. Knowledge Based Services Training/Curriculum Development $5,406,166 12 31 65,658 $175,159 $84 $137,945 $263,361 $75,882 $83 $5,022,593 29 $5,271,357 312. Knowledge Based Services Transcription Services $416,869 2 6 13,471 $64,607 $31 $64,601 $64,613 $208,434 $312. Knowledge Based Services Translation & Interpreting Services $230,664,015 29 2,029 4,236,805 $116,141 $56 $36,560 $365,090 $273,633 $55 $36,381,105 304 $36,381,105 304 $227,018,540 1,991
Govt Provided Tools and Equip
At Govt Location Small Business
Cost Factors Not In Theater by Portfolio and Function
Portfolio Function DescriptionInvoiced Fully Burdened Cost
[**]
Number of
Records in
Portfolio
Contractor Full-Time
Equivalent (CFTE)
Direct Labor Hours
Average Rate per (CFTE)
Average Rate per (Hour)
Minimum Rate per (CFTE)
Maximum Rate per (CFTE)
Median Rate per (CFTE)
Median Rate per (Hour) Invoiced Fully
Burdend Cost [**] CFTEInvoiced Fully
Burdend Cost [**] CFTE
Invoiced Fully
Burdend Cost [**] CFTE
Govt Provided Tools and Equip
At Govt Location Small Business
2. Knowledge Based Services Total $1,739,584,477 613 15,064 31,454,021 $837,928,660 7,889 $921,402,824 8,354 $270,214,429 2,1683. Logistics Management Services Logistics Support Services $888,605,790 181 10,803 22,555,650 $100,648 $48 $10,412 $546,266 $475,866 $41 $865,833,879 10,390 $868,516,214 10,407 $1,460,017 93. Logistics Management Services Total $888,605,790 181 10,803 22,555,650 $865,833,879 10,390 $868,516,214 10,407 $1,460,017 94. Equipment Related Services Inspection Services/Miscellaneous $50,500 3 1 1,140 $92,320 $44 $92,222 $92,474 $16,607 $444. Equipment Related Services Installation of Eq/Fire Control Equip $56,071,050 4 150 312,775 $349,416 $167 $292,423 $435,713 $4,913,567 $160 $56,071,050 150 $56,071,050 1504. Equipment Related Services Installation of Eq/Miscellaneous Eq $97,216 1 0 431 $471,922 $226 $471,922 $471,922 $97,216 $2264. Equipment Related Services Installation of Eq/Weapons $124,881 1 0 752 $346,892 $166 $346,892 $346,892 $40,836 $166 $124,881 0.36 $124,881 0.364. Equipment Related Services Lease or Rental of Eq/Miscellaneou $1,950,058 6 19 40,162 $101,418 $49 $101,375 $101,580 $132,858 $49 $17,441 0.174. Equipment Related Services Lease or Rental of Eq/Pipe-Tubing $62,804 1 1 1,293 $101,460 $49 $101,460 $101,460 $62,804 $494. Equipment Related Services Lease or Rental of Eq/Tractors $21,006 1 0 433 $101,478 $49 $101,478 $101,478 $21,006 $494. Equipment Related Services Lease or Rental of Eq/Vehicles-Tra $6,739,453 103 66 138,797 $101,395 $49 $100,971 $101,719 $36,224 $494. Equipment Related Services Lease or Rental of Eq/Vehicular Eq $9,530,003 89 94 196,265 $101,399 $49 $101,040 $101,729 $48,225 $494. Equipment Related Services Lease or Rental of Eq/Weapons $787,369 4 4 9,344 $193,637 $93 $98,860 $371,889 $72,700 $73 $787,369 4 $386,629 34. Equipment Related Services Maint & Repair of Eq/Aircraft Struct $5,997,275 4 178 371,307 $63,328 $30 $23,182 $156,971 $1,338,785 $18 $4,064,892 1624. Equipment Related Services Maint & Repair of Eq/Containers-P $1,789,240 8 19 40,378 $88,314 $42 $75,877 $98,730 $67,221 $43 $1,732,408 19 $1,732,408 194. Equipment Related Services Maint & Repair of Eq/Engines, Turb $127,709 3 1 2,998 $88,940 $43 $88,909 $88,987 $39,660 $434. Equipment Related Services Maint & Repair of Eq/Fire Control E $3,159,602 3 10 21,135 $383,176 $184 $233,083 $651,571 $245,359 $127 $3,159,602 104. Equipment Related Services Maint & Repair of Eq/Guided Missil $834,261 3 4 7,886 $224,892 $108 $211,335 $238,098 $67,542 $108 $834,261 4 $834,261 44. Equipment Related Services Maint & Repair of Eq/Mech Power $455,120 1 5 10,683 $88,960 $43 $88,960 $88,960 $455,119 $434. Equipment Related Services Maint & Repair of Eq/Miscellaneou $176,147,662 83 2,458 5,133,305 $87,661 $42 $10,566 $631,460 $362,696 $36 $170,765,421 2,429 $175,487,572 2,451 $319,023 44. Equipment Related Services Maint & Repair of Eq/Pumps & Com $139,073 1 2 3,264 $88,979 $43 $88,979 $88,979 $139,072 $434. Equipment Related Services Maint & Repair of Eq/Tractors $63,276 1 1 1,485 $88,996 $43 $88,996 $88,996 $63,276 $434. Equipment Related Services Maint & Repair of Eq/Vehicles-Trai $153,561,428 14 3,878 8,097,951 $121,110 $58 $27,633 $368,367 $471,856 $25 $101,593,838 3,676 $104,721,208 3,695 $35,044 14. Equipment Related Services Maint & Repair of Eq/Vehicular Equ $22,282,679 16 243 507,869 $90,004 $43 $78,969 $113,443 $659,885 $41 $15,852,107 187 $15,852,107 1874. Equipment Related Services Maint & Repair of Eq/Water Purifica $1,540,483 2 17 36,160 $88,953 $43 $88,951 $88,954 $770,241 $434. Equipment Related Services Maint & Repair of Eq/Weapons $241,998,682 24 922 1,924,194 $262,819 $126 $24,686 $720,708 $756,518 $79 $237,680,626 911 $67,743,377 4214. Equipment Related Services Modification of Eq/Containers-Pack $1,943,979 2 38 78,767 $51,533 $25 $51,533 $51,533 $971,989 $254. Equipment Related Services Modification of Eq/Weapons $21,188,859 3 227 474,745 $88,248 $42 $84,327 $93,722 $357,206 $42 $21,188,859 227 $21,188,859 2274. Equipment Related Services Quality Control Svcs/Aircraft Struct $37,528 1 0 847 $92,433 $44 $92,433 $92,433 $37,527 $444. Equipment Related Services Tech Rep Svcs/Aircraft Comps & A $67,471,172 3 236 492,501 $229,404 $110 $115,028 $287,422 $5,465,501 $137 $67,338,085 235 $67,471,172 2364. Equipment Related Services Tech Rep Svcs/Aircraft Structural C $2,958,580 1 6 12,058 $512,308 $245 $512,308 $512,308 $2,958,580 $2454. Equipment Related Services Tech Rep Svcs/Ammo & Explosive $1,250,222 1 8 16,924 $154,253 $74 $154,253 $154,253 $826,947 $74 $1,250,222 8 $1,250,222 84. Equipment Related Services Tech Rep Svcs/Miscellaneous Equ $1,502,921 2 5 10,392 $396,887 $190 $230,025 $563,750 $500,569 $190 $898,018 4 $1,502,921 54. Equipment Related Services Tech Rep Svcs/Weapons $120,141,953 14 659 1,376,412 $227,173 $109 $94,486 $489,921 $703,162 $99 $120,141,953 659 $119,364,633 6564. Equipment Related Services Total $900,026,043 403 9,254 19,322,653 $799,411,738 8,670 $637,291,641 8,073 $883,018 85. Electronic & Communication ServicesADP Telecommunications & Trans $16,596,710 11 40 83,332 $460,059 $220 $198,007 $647,909 $347,675 $220 $323,296 15. Electronic & Communication ServicesAutomated Info System Design & In $2,079,717 3 10 20,655 $174,709 $84 $98,324 $308,893 $218,352 $56 $514,558 5 $514,558 55. Electronic & Communication ServicesAutomated News Svcs, Data Svcs, $6,236,340 1 41 84,749 $153,646 $74 $153,646 $153,646 $6,236,339 $745. Electronic & Communication ServicesCommunications Services $4,356,663 20 67 140,790 $64,610 $31 $64,545 $64,656 $97,880 $315. Electronic & Communication ServicesInfo & Data Broadcasting or Data D $21,306,909 11 147 306,658 $129,771 $62 $8,896 $180,024 $366,681 $69 $21,125,183 144 $21,125,183 1445. Electronic & Communication ServicesInspection Services/Communicatio $76,245 1 1 1,721 $92,530 $44 $92,530 $92,530 $76,244 $44 $76,245 15. Electronic & Communication ServicesInstallation of Eq/Communication E $82,002 1 0 1,000 $171,194 $82 $171,194 $171,194 $82,002 $825. Electronic & Communication ServicesInstallation of Eq/Electrical & Elct E $6,376,870 9 23 47,004 $223,573 $107 $170,992 $420,530 $109,598 $82 $4,384,150 11 $4,384,150 115. Electronic & Communication ServicesInstallation of Eq/Power Distribution $448,381 2 3 5,471 $171,144 $82 $171,135 $171,154 $224,191 $825. Electronic & Communication ServicesLease or Rental of Eq/Power Distri $2,262,860 3 4 8,760 $539,547 $258 $177,156 $749,453 $483,730 $331 $2,262,860 4 $2,262,860 45. Electronic & Communication ServicesMaint & Repair of Eq/Communicati $18,510,803 5 78 163,278 $234,433 $112 $165,106 $328,484 $547,199 $113 $18,510,803 78 $17,021,855 715. Electronic & Communication ServicesMaint & Repair of Eq/Electrical & E $2,865,725 5 32 67,267 $88,941 $43 $88,820 $89,001 $93,166 $435. Electronic & Communication ServicesMaint & Repair of Eq/Power Distrib $57,305,186 54 1,361 2,841,816 $48,051 $23 $11,315 $75,288 $290,539 $29 $56,475,045 1,350 $56,475,045 1,350 $30,231 0.415. Electronic & Communication ServicesOther ADP & Telecommunication S $81,204,766 65 880 1,836,839 $106,268 $51 $16,128 $249,734 $204,760 $48 $72,447,431 751 $72,447,431 751 $6,823,007 1165. Electronic & Communication ServicesProgramming Services $8,361,334 3 39 80,883 $220,028 $105 $192,414 $241,762 $1,446,994 $108 $8,361,334 39 $8,361,334 395. Electronic & Communication ServicesTech Rep Svcs/ADP Equip & Supp $2,839,650 2 6 11,574 $512,057 $245 $511,767 $512,348 $1,419,825 $245 $2,579,672 55. Electronic & Communication ServicesTech Rep Svcs/Communication Eq $5,106,158 6 18 36,550 $389,666 $187 $172,972 $645,433 $388,830 $141 $615,260 4 $4,943,759 17 $615,260 45. Electronic & Communication ServicesTelecommunication Network Mana $218,198,767 19 2,190 4,572,701 $127,172 $61 $65,721 $218,671 $1,197,721 $60 $175,417,893 1,843 $175,417,893 1,8435. Electronic & Communication ServicesTelephone and/or Communications $5,939,724 16 72 151,287 $81,980 $39 $81,865 $82,119 $123,040 $39 $4,212,895 515. Electronic & Communication Services Total $460,154,809 237 5,011 10,462,335 $357,851,657 4,225 $362,954,069 4,235 $16,923,466 1826. Medical Services Evaluation & Screening $260,618 1 1 1,358 $400,951 $192 $400,951 $400,951 $260,618 $1926. Medical Services General Health Care Services $1,793,259 3 18 37,003 $123,724 $59 $88,394 $142,520 $177,381 $67 $1,793,259 18 $1,793,259 186. Medical Services Other Medical Services $2,224,582 6 22 46,253 $138,742 $66 $16,087 $506,524 $135,578 $45 $1,043,368 20 $1,043,368 206. Medical Services Total $4,278,459 10 41 84,614 $2,836,627 38 $2,836,627 38 $0 0.007. Transportation Services Air Freight $75,436,438 20 1,702 3,552,910 $51,199 $25 $36,713 $88,758 $25,140 $18 $22,602,038 265 $22,602,038 2657. Transportation Services Air Passenger Service $66,994,133 146 491 1,024,565 $136,523 $65 $136,217 $136,891 $93,277 $657. Transportation Services Motor Charter for Things $57,735 1 0 883 $136,490 $65 $136,490 $136,490 $57,735 $657. Transportation Services Motor Freight $415,748,230 56 11,166 23,314,590 $43,003 $21 $17,717 $88,773 $4,991,051 $17 $38,625,969 462 $38,625,969 462 $18,378 1

Cost Factors Not In Theater by Portfolio and Function
Portfolio Function DescriptionInvoiced Fully Burdened Cost
[**]
Number of
Records in
Portfolio
Contractor Full-Time
Equivalent (CFTE)
Direct Labor Hours
Average Rate per (CFTE)
Average Rate per (Hour)
Minimum Rate per (CFTE)
Maximum Rate per (CFTE)
Median Rate per (CFTE)
Median Rate per (Hour) Invoiced Fully
Burdend Cost [**] CFTEInvoiced Fully
Burdend Cost [**] CFTE
Invoiced Fully
Burdend Cost [**] CFTE
Govt Provided Tools and Equip
At Govt Location Small Business
7. Transportation Services Motor Passenger Service $4,124,309 2 30 63,074 $136,666 $65 $136,532 $136,800 $2,062,155 $657. Transportation Services Motor Pool Operations $583,101 1 4 8,918 $136,526 $65 $136,526 $136,526 $583,101 $657. Transportation Services Other Cargo & Freight Services $21,757,552 20 521 1,087,164 $104,302 $50 $15,961 $380,780 $162,149 $40 $21,183,904 519 $21,183,904 519 $501,075 17. Transportation Services Other Transportation Travel & Relo $158,332,674 47 2,851 5,953,836 $125,865 $60 $8,764 $687,757 $905,271 $40 $158,332,674 2,851 $158,332,674 2,8517. Transportation Services Other Vehicle Charter for Transpor $1,323,551 9 10 20,240 $136,517 $65 $136,418 $136,590 $75,751 $657. Transportation Services Packing/Crating Services $929,637 1 7 14,217 $136,531 $65 $136,531 $136,531 $929,636 $657. Transportation Services Passenger Motor Charter Service $611,880 1 4 9,358 $136,519 $65 $136,519 $136,519 $611,880 $657. Transportation Services Stevedoring $1,365,186 2 10 20,235 $271,331 $130 $65,790 $476,872 $289,892 $130 $844,064 27. Transportation Services Total $747,264,427 306 16,796 35,069,990 $240,744,584 4,098 $241,588,648 4,099 $519,452 28. Facility Related Services A&E Inspection Services (Non-con $11,695,104 1 74 155,520 $157,017 $75 $157,017 $157,017 $11,695,104 $75 $11,695,104 74 $11,695,104 748. Facility Related Services Administrative & Service Buildings $2,808,676 2 6 11,842 $496,316 $238 $493,887 $498,745 $348,447 $238 $804,975 28. Facility Related Services Architect-Engineering Services $33,505,958 8 178 371,099 $220,589 $106 $146,252 $288,172 $834,316 $105 $33,101,571 175 $33,101,571 1758. Facility Related Services Chaplain Services $59,161 2 1 1,377 $89,774 $43 $89,773 $89,776 $29,581 $438. Facility Related Services Conservation & Development $854,890 1 9 17,864 $99,917 $48 $99,917 $99,917 $350,000 $48 $854,890 98. Facility Related Services Custodial - Janitorial Services $7,020,556 59 155 324,461 $52,316 $25 $3,915 $54,219 $26,671 $26 $115,685 28 $187,056 38. Facility Related Services Electric Services $6,707,136 6 82 170,831 $81,982 $39 $81,955 $82,022 $1,008,675 $398. Facility Related Services Facilities Operations Support Servi $52,169,196 157 841 1,755,107 $108,651 $52 $10,515 $129,496 $76,709 $62 $26,320,707 640 $26,320,707 640 $6,532,006 518. Facility Related Services Fire Protection Services $30,969,583 4 240 501,511 $97,329 $47 $20,067 $203,474 $3,580,165 $40 $12,448,601 149 $12,448,601 1498. Facility Related Services Food Services $79,864,516 83 964 2,013,304 $85,046 $41 $11,875 $138,308 $316,237 $40 $51,937,458 762 $51,937,458 762 $318,048 28. Facility Related Services Gas Services $28,187 1 0 718 $81,938 $39 $81,938 $81,938 $28,186 $398. Facility Related Services Guard Services $260,601,875 48 17,510 36,559,873 $49,076 $24 $4,617 $121,424 $1,473,205 $39 $108,917 1 $173,156,887 13,931 $108,917 18. Facility Related Services Hazardous Substance Removal/Cle $36,095,289 37 1,004 2,095,681 $81,466 $39 $10,052 $236,305 $140,318 $47 $30,727,588 959 $36,054,172 1,004 $11,009,378 2108. Facility Related Services Installation of Eq/Cleaning Equipme $92,239 1 1 1,125 $171,130 $82 $171,130 $171,130 $92,239 $828. Facility Related Services Installation of Eq/Plumbing & Heati $58,421 1 0 713 $171,321 $82 $171,321 $171,321 $58,420 $828. Facility Related Services Landscaping/Groundskeeping Serv $14,002 1 0 357 $81,884 $39 $81,884 $81,884 $14,002 $398. Facility Related Services Laundry & Dry Cleaning Services $39,355,851 61 1,633 3,409,063 $49,288 $24 $9,905 $85,670 $242,756 $29 $37,762,157 1,606 $37,762,157 1,606 $297,051 58. Facility Related Services Lease or Rental of Eq/Construction $11,272,332 17 111 232,155 $101,396 $49 $101,243 $101,747 $200,745 $49 $221,343 28. Facility Related Services Lease or Rental of Eq/Materials Ha $18,301,520 124 175 364,415 $117,574 $56 $44,455 $468,021 $66,357 $49 $1,423,807 8 $491,791 38. Facility Related Services Lease or Rental of Eq/Office Mach $107,138 2 1 2,207 $101,399 $49 $101,314 $101,484 $53,569 $498. Facility Related Services Lease or Rental of Eq/Special Indu $291,984 4 3 6,014 $101,471 $49 $101,361 $101,658 $52,420 $498. Facility Related Services Lease or Rental of Eq/Toiletries $631,108 5 6 12,997 $101,426 $49 $101,340 $101,546 $50,264 $498. Facility Related Services Lease/Other Miscellaneous Buildin $168,326 2 2 3,467 $101,408 $49 $101,389 $101,427 $84,163 $498. Facility Related Services Lease/Other Utilities $463,622 1 5 9,548 $101,382 $49 $101,382 $101,382 $463,622 $498. Facility Related Services Lease/Troop Housing Facilities $89,879 4 1 1,851 $101,331 $49 $101,164 $101,692 $21,909 $498. Facility Related Services Maint & Repair of Eq/Construction $3,036,773 10 17 36,459 $164,258 $79 $145,971 $218,138 $168,049 $70 $2,258,592 12 $2,258,592 128. Facility Related Services Maint & Repair of Eq/Construction $30,355 1 0 713 $89,016 $43 $89,016 $89,016 $30,354 $438. Facility Related Services Maint & Repair of Eq/Maintenance $17,581,085 3 635 1,326,081 $27,544 $13 $21,491 $33,390 $2,388,903 $13 $17,581,085 635 $17,581,085 6358. Facility Related Services Maint & Repair of Eq/Materials Han $63,805,714 89 1,141 2,382,602 $56,953 $27 $9,529 $266,943 $190,503 $35 $57,591,321 1,106 $63,564,489 1,1408. Facility Related Services Maint & Repair of Eq/Medical & De $90,005 1 1 2,113 $88,938 $43 $88,938 $88,938 $90,004 $438. Facility Related Services Maint & Repair of Eq/Office Machin $36,800 1 0 864 $88,889 $43 $88,889 $88,889 $36,800 $43 $36,800 0.418. Facility Related Services Maint & Repair of Eq/Plumbing & H $97,062 1 1 2,278 $88,966 $43 $88,966 $88,966 $97,061 $438. Facility Related Services Maint & Repair of Eq/Prefab Struct $3,893,340 1 44 91,389 $88,952 $43 $88,952 $88,952 $3,893,339 $438. Facility Related Services Maint & Repair of Eq/Recreational $29,282 1 0 687 $89,004 $43 $89,004 $89,004 $29,282 $438. Facility Related Services Maint & Repair of Eq/Refrigeration, $265,097 6 3 6,223 $88,953 $43 $88,841 $89,034 $40,726 $438. Facility Related Services Maint & Repair of Eq/Service & Tra $222,212 4 2 5,215 $88,974 $43 $88,916 $89,018 $30,917 $438. Facility Related Services Maint & Repair of Eq/Special Indus $518,053 6 6 12,159 $88,912 $43 $88,795 $88,962 $69,639 $438. Facility Related Services Maint & Repair of Eq/Textiles-Leath $635,360 1 7 14,914 $88,949 $43 $88,949 $88,949 $635,359 $438. Facility Related Services Maint & Repair of Eq/Toiletries $65,666 3 1 1,541 $88,982 $43 $88,952 $89,013 $23,580 $438. Facility Related Services Maint/Airport Runways $113,700 1 6 11,888 $19,972 $10 $19,972 $19,972 $113,700 $108. Facility Related Services Maint/All Other Non-Building Facilit $61,439 1 3 6,424 $19,967 $10 $19,967 $19,967 $61,438 $108. Facility Related Services Maint/Highways, Roads, Streets, & $262,503 1 11 22,054 $24,854 $12 $24,854 $24,854 $146,839 $12 $262,503 11 $262,503 118. Facility Related Services Maint/Office Buildings $35,125,146 34 2,406 5,024,772 $28,064 $13 $5,407 $316,765 $80,045 $6 $2,372,528 1998. Facility Related Services Maint/Other Administrative & Servi $243,017,968 58 7,450 15,556,463 $46,273 $22 $7,904 $99,483 $1,332,701 $21 $243,017,968 7,450 $243,017,968 7,4508. Facility Related Services Maint/Other Miscellaneous Building $346,546 2 17 36,234 $19,971 $10 $19,969 $19,972 $173,272 $108. Facility Related Services Maint/Restoration Activities $717,662 1 36 75,037 $19,970 $10 $19,970 $19,970 $717,661 $108. Facility Related Services Maint/Sewage & Waste Facilities $21,980 1 1 2,298 $19,964 $10 $19,964 $19,964 $21,979 $108. Facility Related Services Non-Government Insurance Progra $3,252,738 11 36 75,672 $89,750 $43 $89,656 $89,802 $59,671 $43 $100,115 18. Facility Related Services Operation/All Other Non-Building F $367,554 2 1 2,697 $290,582 $139 $254,280 $326,883 $148,579 $139 $367,554 1 $367,554 18. Facility Related Services Operation/Electronic & Communica $1,050,274 10 15 31,272 $58,357 $28 $52,252 $100,527 $36,550 $25 $1,050,274 15 $1,050,274 158. Facility Related Services Operation/Food or Grain Storage B $5,715,626 18 98 203,592 $51,791 $25 $13,473 $99,701 $72,651 $24 $5,715,626 98 $5,715,626 988. Facility Related Services Operation/Fuel Storage Buildings $86,290,714 70 1,841 3,844,197 $51,149 $24 $9,974 $91,872 $361,570 $37 $86,290,714 1,841 $86,290,714 1,8418. Facility Related Services Operation/Fuel Supply Facilities $3,538,332 3 188 391,535 $32,349 $15 $15,824 $61,076 $875,707 $10 $3,289,996 183 $3,289,996 1838. Facility Related Services Operation/Maintenance Buildings $1,428,366 1 19 39,616 $75,284 $36 $75,284 $75,284 $474,946 $36 $1,428,366 19 $1,428,366 19 $1,428,366 198. Facility Related Services Operation/Other Administrative & S $59,709,841 14 633 1,322,599 $90,368 $43 $40,203 $153,386 $762,897 $46 $59,071,080 618 $59,071,080 618

Cost Factors Not In Theater by Portfolio and Function
Portfolio Function DescriptionInvoiced Fully Burdened Cost
[**]
Number of
Records in
Portfolio
Contractor Full-Time
Equivalent (CFTE)
Direct Labor Hours
Average Rate per (CFTE)
Average Rate per (Hour)
Minimum Rate per (CFTE)
Maximum Rate per (CFTE)
Median Rate per (CFTE)
Median Rate per (Hour) Invoiced Fully
Burdend Cost [**] CFTEInvoiced Fully
Burdend Cost [**] CFTE
Invoiced Fully
Burdend Cost [**] CFTE
Govt Provided Tools and Equip
At Govt Location Small Business
8. Facility Related Services Operation/Other Industrial Building $574,255 1 6 12,136 $98,805 $47 $98,805 $98,805 $574,255 $478. Facility Related Services Operation/Other Miscellaneous Bui $241,838,888 2 1,423 2,972,247 $144,437 $69 $28,671 $260,203 $27,067,802 $69 $241,838,888 1,423 $241,838,888 1,4238. Facility Related Services Operation/Other Warehouse Buildi $26,184,168 5 382 798,227 $107,285 $51 $24,043 $184,258 $1,239,779 $63 $26,184,168 382 $26,184,168 3828. Facility Related Services Operation/Recreational Buildings $68,435 1 1 1,446 $98,752 $47 $98,752 $98,752 $68,434 $47 $68,435 18. Facility Related Services Operation/Sewage & Waste Faciliti $291,112 1 3 6,152 $98,816 $47 $98,816 $98,816 $291,112 $478. Facility Related Services Operation/Water Supply Facilities $174,977 2 2 3,698 $98,783 $47 $98,752 $98,814 $87,488 $478. Facility Related Services Other Architect & Engineering Serv $6,756,475 1 16 33,230 $424,535 $203 $424,535 $424,535 $1,782,864 $203 $6,756,475 16 $6,756,475 168. Facility Related Services Other Environ Svcs, Studies, & Ana $50,771 1 0 678 $156,218 $75 $156,218 $156,218 $50,771 $758. Facility Related Services Other Government Insurance Prog $181,956 1 2 4,233 $89,766 $43 $89,766 $89,766 $181,955 $438. Facility Related Services Other Housekeeping Services $2,022,207 25 25 51,504 $81,980 $39 $81,846 $82,155 $57,565 $398. Facility Related Services Other Social Services $404,025 1 5 9,399 $89,763 $43 $89,763 $89,763 $404,024 $438. Facility Related Services Other Utilities $1,100,128 12 13 28,020 $81,975 $39 $81,924 $82,086 $74,403 $398. Facility Related Services Pesticides Support Services $8,072,478 33 115 240,971 $70,153 $34 $12,412 $101,023 $106,908 $43 $8,072,478 115 $8,072,478 1158. Facility Related Services Quality Control Svcs/Food Prep & S $930,676 2 10 21,005 $92,513 $44 $92,511 $92,515 $465,337 $448. Facility Related Services Quality Control Svcs/Hand Tools $1,114,243 1 12 25,147 $92,514 $44 $92,514 $92,514 $406,502 $44 $1,114,243 12 $1,114,243 12 $1,114,243 128. Facility Related Services Recreational Services $38,997,018 45 1,041 2,172,716 $46,374 $22 $9,222 $80,333 $347,230 $33 $38,997,018 1,041 $38,997,018 1,0418. Facility Related Services Surveillance Services $9,787,242 6 119 249,281 $82,003 $39 $81,966 $82,117 $544,733 $398. Facility Related Services Toxic Substances Support Service $364,044 2 2 4,862 $156,309 $75 $156,308 $156,310 $182,022 $758. Facility Related Services Trash/Garbage Collection Srvcs-In $2,333,051 25 28 59,422 $81,988 $39 $81,823 $82,092 $63,806 $39 $23,391 0.298. Facility Related Services Warehousing & Storage Services $4,786,406 2 58 121,910 $81,979 $39 $81,977 $81,980 $2,393,203 $398. Facility Related Services Waste Treatment & Storage $77,785,945 200 2,462 5,140,797 $45,524 $22 $9,586 $89,419 $83,957 $22 $56,579,455 1,991 $56,579,455 1,9918. Facility Related Services Water Services $47,651,710 83 1,164 2,430,185 $65,655 $31 $10,965 $89,274 $141,084 $38 $45,407,488 1,139 $45,467,455 1,139 $98,983 18. Facility Related Services Well Drilling/Exploratory Services $254,114 2 2 3,394 $156,250 $75 $156,182 $156,318 $127,057 $758. Facility Related Services Total $1,596,278,065 1,442 44,513 92,943,348 $1,109,349,924 22,676 $1,294,584,442 36,531 $22,035,924 3129. Construction Services All Other Non-Building Facilities $2,568,832 10 65 135,416 $39,666 $19 $28,622 $40,917 $141,591 $209. Construction Services Office Buildings $1,326,646 6 3 5,760 $508,063 $243 $236,926 $562,646 $109,411 $2699. Construction Services Other Airfield Structures $70,783 1 1 2,099 $70,431 $34 $70,431 $70,431 $70,783 $349. Construction Services Other Industrial Buildings $125,349 1 2 3,717 $70,421 $34 $70,421 $70,421 $125,349 $349. Construction Services Other Miscellaneous Buildings $61,658,766 54 1,419 2,962,565 $66,411 $32 $15,697 $107,805 $212,806 $38 $59,208,133 1,384 $59,208,133 1,384 $64,805 19. Construction Services Other Residential Buildings $1,691,192 1 24 50,147 $70,416 $34 $70,416 $70,416 $1,691,192 $349. Construction Services Recreation Facilities (non-building) $912,511 1 13 27,058 $70,415 $34 $70,415 $70,415 $912,511 $349. Construction Services Restoration Activities $6,933,520 19 98 205,591 $70,421 $34 $70,375 $70,516 $180,657 $349. Construction Services Troop Housing Facilities $1,650,457 3 23 48,939 $70,417 $34 $70,414 $70,419 $638,202 $349. Construction Services Unimproved Real Property (land) $8,293,136 4 118 245,910 $70,417 $34 $70,416 $70,418 $2,341,645 $349. Construction Services Total $85,231,193 100 1,766 3,687,202 $59,208,133 1,384 $59,208,133 1,384 $64,805 1Grand Total $6,653,467,256 3,371 105,245 219,750,903 $4,369,783,482 60,316 $4,491,141,433 74,088 $313,256,591 2,688
Please click on the '+' to expand the portfolio to the functions
[**] Contractor's Invoiced Fully Burdened Costs include only what the contractor is charging the government The value of government furnished tools, office space and equipment are not reflected in the data reported by the contractors even though this is a cost born by the government and attributable to the cost of contract performance.

Contract Type: Not In Theater
Contract TypeInvoiced Fully
Burdened Cost [**]
Number of Records in
Portfolio
Contractor Full-Time
Equivalent (CFTE)
Direct Labor Hours
Average Rate per (CFTE)
Average Rate per (Hour)
Minimum Rate per (CFTE)
Maximum Rate per (CFTE)
Median Rate per (CFTE)
Median Rate per (Hour)
Invoiced Fully Burdend Cost
[**]CFTE
Invoiced Fully Burdend Cost
[**]CFTE
Invoiced Fully Burdend Cost
[**]CFTE
COMBINATION (APPLIES TO AWARDS WH $91,628,577 12 313 652,878 $187,902 $90 $92,642 $419,572 $161,991 $78 $91,499,080 312 $91,499,080 311.856 $4,583,549 48Cost $947,839,494 357 7,557 15,778,947 $175,685 $84 $31,097 $722,909 $140,811 $67 $653,849,590 6,132 $811,042,824 6,925 $61,325,221 409COST NO FEE $15,007,536 49 118 246,624 $172,725 $83 $31,786 $518,693 $128,892 $62 $2,090,052 27 $1,001,724 11Cost Plus Award Fee $1,233,569,915 307 12,821 26,770,218 $97,759 $47 $26,868 $631,675 $79,293 $38 $1,094,473,188 11,635 $1,152,806,196 12,174 $325,084,617 3,830Cost Plus Fixed Fee $4,512,631,462 2,997 21,360 44,598,905 $222,571 $107 $25,459 $747,532 $193,279 $93 $2,731,322,402 14,409 $2,513,649,359 13,623 $416,519,936 2,626Cost Plus Incentive Fee $734,222,617 70 1,909 3,985,921 $406,803 $195 $31,859 $743,141 $379,430 $182 $44,083,395 192 $105,536,974 289 $2,454,076 32Cost Sharing $5,698,881 3 22 45,920 $302,310 $145 $249,531 $385,795 $272,635 $131Firm Fixed Price $5,668,235,891 9,160 45,104 94,177,460 $153,942 $74 $25,013 $747,274 $120,583 $58 $3,255,555,717 28,030 $4,069,222,315 36,934 $1,875,452,635 16,170Fixed Price Award Fee $47,362,411 23 281 585,773 $213,127 $102 $50,984 $623,587 $112,788 $54 $10,303,362 104 $12,498,005 122 $45,559,199 261Fixed Price Incentive $11,350,556 1 131 272,704 $86,908 $42 $86,908 $86,908 $87,632 $42 $11,350,556 131 $11,350,556 131FIXED PRICE LEVEL OF EFFORT $540,959,776 311 2,218 4,630,633 $236,099 $113 $43,209 $729,475 $216,095 $103 $149,815,847 807 $257,580,042 1,325 $153,924,602 774FIXED PRICE REDETERMINATION $49,659,348 46 256 535,539 $207,839 $100 $71,115 $468,467 $203,658 $98 $33,835,890 172 $45,388,658 234Fixed Price with Economic Price Adjustment $1,935,107 4 35 72,951 $78,674 $38 $54,067 $93,828 $92,516 $44 $1,808,742 33Fixed Price with Prospective Price Redetermin $10,340,243 2 21 44,840 $435,464 $209 $260,696 $610,231 $468,083 $224 $8,278,399 14 $2,061,844 8Labor Hours $282,948,768 414 1,875 3,914,521 $147,248 $71 $32,917 $662,314 $118,830 $57 $177,733,143 1,211 $234,679,927 1,563 $101,264,339 650Not Assigned $1,130,958,267 1,042 5,366 11,204,795 $218,323 $105 $25,668 $732,056 $183,601 $88 $478,141,444 3,095 $529,035,337 3,179 $61,171,001 433Time and Materials $4,325,553,099 2,321 24,230 50,592,457 $222,193 $106 $31,583 $744,067 $188,089 $90 $2,823,627,293 16,056 $3,237,301,663 19,128 $397,621,059 2,535Grand Total $19,609,901,948 17,119 123,616 258,111,086 $11,557,680,958 82,312 $13,082,679,802 95,997 $3,447,022,078 27,776
Govt Provided Tools and Equip
At Govt Location Small Business
[**] Contractor's Invoiced Fully Burdened Costs include only what the contractor is charging the government The value of government furnished tools, office space and equipment are not reflected in the data reported by the contractors even though this is a cost born by the government and attributable to the cost of contract performance.

Contract Type: In Theater
Contract TypeInvoiced Fully Burdened Cost
[**]
Number of Records in
Portfolio
Contractor Full-Time Equivalent
(CFTE)Direct Labor
Hours
Average Rate per (CFTE)
Average Rate per (Hour)
Minimum Rate per (CFTE)
Maximum Rate per (CFTE)
Median Rate per (CFTE)
Median Rate per (Hour)
Invoiced Fully Burdend Cost
[**] CFTE
Invoiced Fully Burdend Cost
[**] CFTEInvoiced Fully
Burdend Cost [**] CFTECost $23,484,340 6 95 198,375 $346,588 $166 $104,330 $419,167 $388,398 $186 $18,322,516 47 $23,223,722 94 $18,322,516 47Cost Plus Award Fee $469,203,974 28 3,404 7,107,953 $140,718 $67 $28,671 $498,745 $119,982 $57 $274,704,276 1,693 $275,509,251 1,695 $226,560,111 1,979Cost Plus Fixed Fee $1,531,959,149 386 18,048 37,685,277 $111,186 $53 $8,764 $720,708 $85,033 $41 $1,437,491,673 17,406 $1,322,275,324 17,090Firm Fixed Price $3,473,748,218 2,418 75,361 157,353,326 $91,825 $44 $3,915 $749,453 $81,978 $39 $1,914,523,241 35,718 $2,109,319,617 49,565 $59,939,753 591FIXED PRICE LEVEL OF EFFO $23,506,907 4 65 136,016 $187,696 $90 $89,347 $376,902 $143,454 $68 $142,955 2 $142,955 2Labor Hours $16,771,236 6 139 289,332 $201,565 $97 $114,581 $511,767 $141,275 $67 $16,254,785 137 $16,511,259 138Not Assigned $541,869,388 391 3,350 6,994,484 $132,583 $63 $19,969 $685,428 $101,413 $49 $179,354,793 767 $178,953,816 766 $951,630 13Time and Materials $572,924,045 132 4,783 9,986,140 $234,028 $112 $11,436 $738,962 $199,317 $93 $528,989,243 4,546 $565,205,490 4,739 $7,482,582 57Grand Total $6,653,467,256 3,371 105,245 219,750,903 $4,369,783,482 60,316 $4,491,141,433 74,088 $313,256,591 2,688
Govt Provided Tools and Equip
At Govt Location Small Business
[**] Contractor's Invoiced Fully Burdened Costs include only what the contractor is charging the government The value of government furnished tools, office space and equipment are not reflected in the data reported by the contractors even though this is a cost born by the government and attributable to the cost of contract performance.

Contract Action:Not In Theater
Contract ActionInvoiced Fully Burdened Cost
[**]
Number of Records in
Portfolio
Contractor Full-Time Equivalent
(CFTE)
Direct Labor Hours
Average Rate per (CFTE)
Average Rate per (Hour)
Minimum Rate per (CFTE)
Maximum Rate per (CFTE)
Median Rate per (CFTE)
Median Rate per (Hour)
Invoiced Fully Burdend Cost
[**] CFTE
Invoiced Fully Burdend Cost
[**] CFTE
Invoiced Fully Burdend Cost
[**] CFTEBPA CALL $37,433,463 128 198 3,232 $247,854 $119 $33,398 $682,705 $239,789 $115 $28,025,058 153 $34,563,597 180 $26,923,342 137BPA Order under Federal Schedule $266,292,612 209 1,490 14,889 $210,720 $101 $25,902 $575,356 $193,313 $93 $166,789,490 996 $203,755,822 1,215 $133,629,377 688BPAs and BPA Calls $536,383,406 134 2,587 40,313 $209,543 $100 $28,464 $731,292 $202,823 $97 $490,745,806 2,302 $511,686,109 2,421 $13,699,259 74Definitive Contract $4,794,763,458 3,040 30,891 21,218 $203,365 $97 $25,534 $743,141 $165,339 $79 $2,661,972,766 21,655 $2,999,637,301 24,930 $1,196,148,407 10,863Definitive Contract (IDC) $109,179,466 387 1,133 6,112 $82,579 $40 $27,179 $637,844 $42,622 $20 $58,389,910 823 $79,095,331 956 $76,819,032 885Definitive Contract (Non IDC) $109,557,155 37 561 31,648 $155,190 $74 $26,021 $616,545 $137,835 $66 $60,025,668 267 $67,428,455 353 $33,885,624 187DELIVERY ORDER $8,324,284,188 8,581 54,474 13,255 $172,950 $83 $25,157 $747,532 $138,118 $66 $5,018,034,784 34,247 $5,676,386,900 40,991 $1,335,242,285 10,226IDC $66,628,909 182 518 5,942 $138,742 $66 $28,170 $652,482 $90,680 $43 $25,775,848 166 $40,696,830 289 $19,866,898 206Not Assigned $2,637,925,601 1,411 14,788 21,883 $205,940 $99 $25,129 $732,056 $175,901 $84 $1,422,307,549 10,696 $1,505,561,356 10,931 $104,846,745 753Order under Indefinite Delivery Contract $2,541,578,446 2,183 15,344 14,677 $193,616 $93 $28,502 $741,446 $157,728 $76 $1,500,193,082 9,885 $1,814,397,084 12,413 $379,822,813 2,729OTHER TRANSACTION AGREEMENT $199,431 2 2 2,080 $100,116 $48 $93,754 $106,478 $100,116 $48 $199,431 2 $199,431 2PURCHASE ORDER $185,675,814 825 1,630 4,126 $146,366 $70 $25,013 $723,697 $112,651 $54 $125,221,567 1,120 $149,271,587 1,316 $126,138,297 1,028Grand Total $19,609,901,948 17,119 123,616 15,077 $11,557,680,958 82,312 $13,082,679,802 95,997 $3,447,022,078 27,776
Govt Provided Tools and Equip
At Govt Location Small Business
[**] Contractor's Invoiced Fully Burdened Costs include only what the contractor is charging the government The value of government furnished tools, office space and equipment are not reflected in the data reported by the contractors even though this is a cost born by the government and attributable to the cost of contract performance.

Contract Action: In Theater
Contract Service ActionInvoiced Fully
Burdened Cost [**]
Number of Records
in Portfolio
Contractor Full-Time
Equivalent (CFTE)
Direct Labor Hours
Average Rate per (CFTE)
Average Rate per (Hour)
Minimum Rate per (CFTE)
Maximum Rate per (CFTE)
Median Rate per (CFTE)
Median Rate per (Hour)
Invoiced Fully Burdend Cost
[**]CFTE
Invoiced Fully Burdend Cost
[**]CFTE
Invoiced Fully Burdend Cost
[**]CFTE
BPA CALL $39,876,967 257 355 740,236 $108,925 $52 $35,212 $512,308 $101,576 $49 $108,917 1 $108,917 1 $108,917 1BPA Order under Federal Sc $3,695,486 4 18 37,294 $212,175 $102 $158,471 $268,681 $210,774 $101 $3,695,486 18 $3,695,486 18BPAs and BPA Calls $2,003,828 20 10 21,012 $240,055 $115 $44,455 $603,909 $182,209 $87 $2,003,828 10 $202,984 0Definitive Contract $995,233,008 255 8,923 18,631,035 $136,161 $65 $9,687 $645,433 $107,295 $51 $672,685,282 6,033 $684,912,748 5,965 $29,566,103 205Definitive Contract (IDC) $90,637,089 8 1,123 2,343,835 $145,115 $69 $65,721 $266,943 $129,324 $62 $84,663,921 1,089 $90,637,089 1,123DELIVERY ORDER $4,257,432,407 1,682 83,702 174,769,934 $91,040 $44 $4,693 $738,962 $79,027 $38 $2,926,141,786 47,619 $2,955,631,117 60,284 $275,992,582 2,427IDC $4,383,499 6 29 60,820 $142,951 $68 $101,399 $151,278 $151,269 $72Not Assigned $773,672,861 425 6,545 13,665,088 $129,940 $62 $4,617 $685,428 $101,408 $49 $376,524,272 3,476 $408,171,595 3,939 $951,630 13Order under Indefinite Delive $354,063,034 90 2,418 5,049,574 $253,026 $121 $8,896 $749,453 $209,949 $101 $305,963,817 2,081 $341,091,185 2,227 $3,355,741 10PURCHASE ORDER $132,469,077 624 2,123 4,432,075 $86,783 $42 $3,915 $576,570 $81,983 $39 $4,889,468 522 $3,078,635 31Grand Total $6,653,467,256 3,371 105,245 219,750,903 $4,369,783,482 60,316 $4,491,141,433 74,088 $313,256,591 2,688
Govt Provided Tools and Equip
At Govt Location Small Business
[**] Contractor's Invoiced Fully Burdened Costs include only what the contractor is charging the government The value of government furnished tools, office space and equipment are not reflected in the data reported by the contractors even though this is a cost born by the government and attributable to the cost of contract performance.
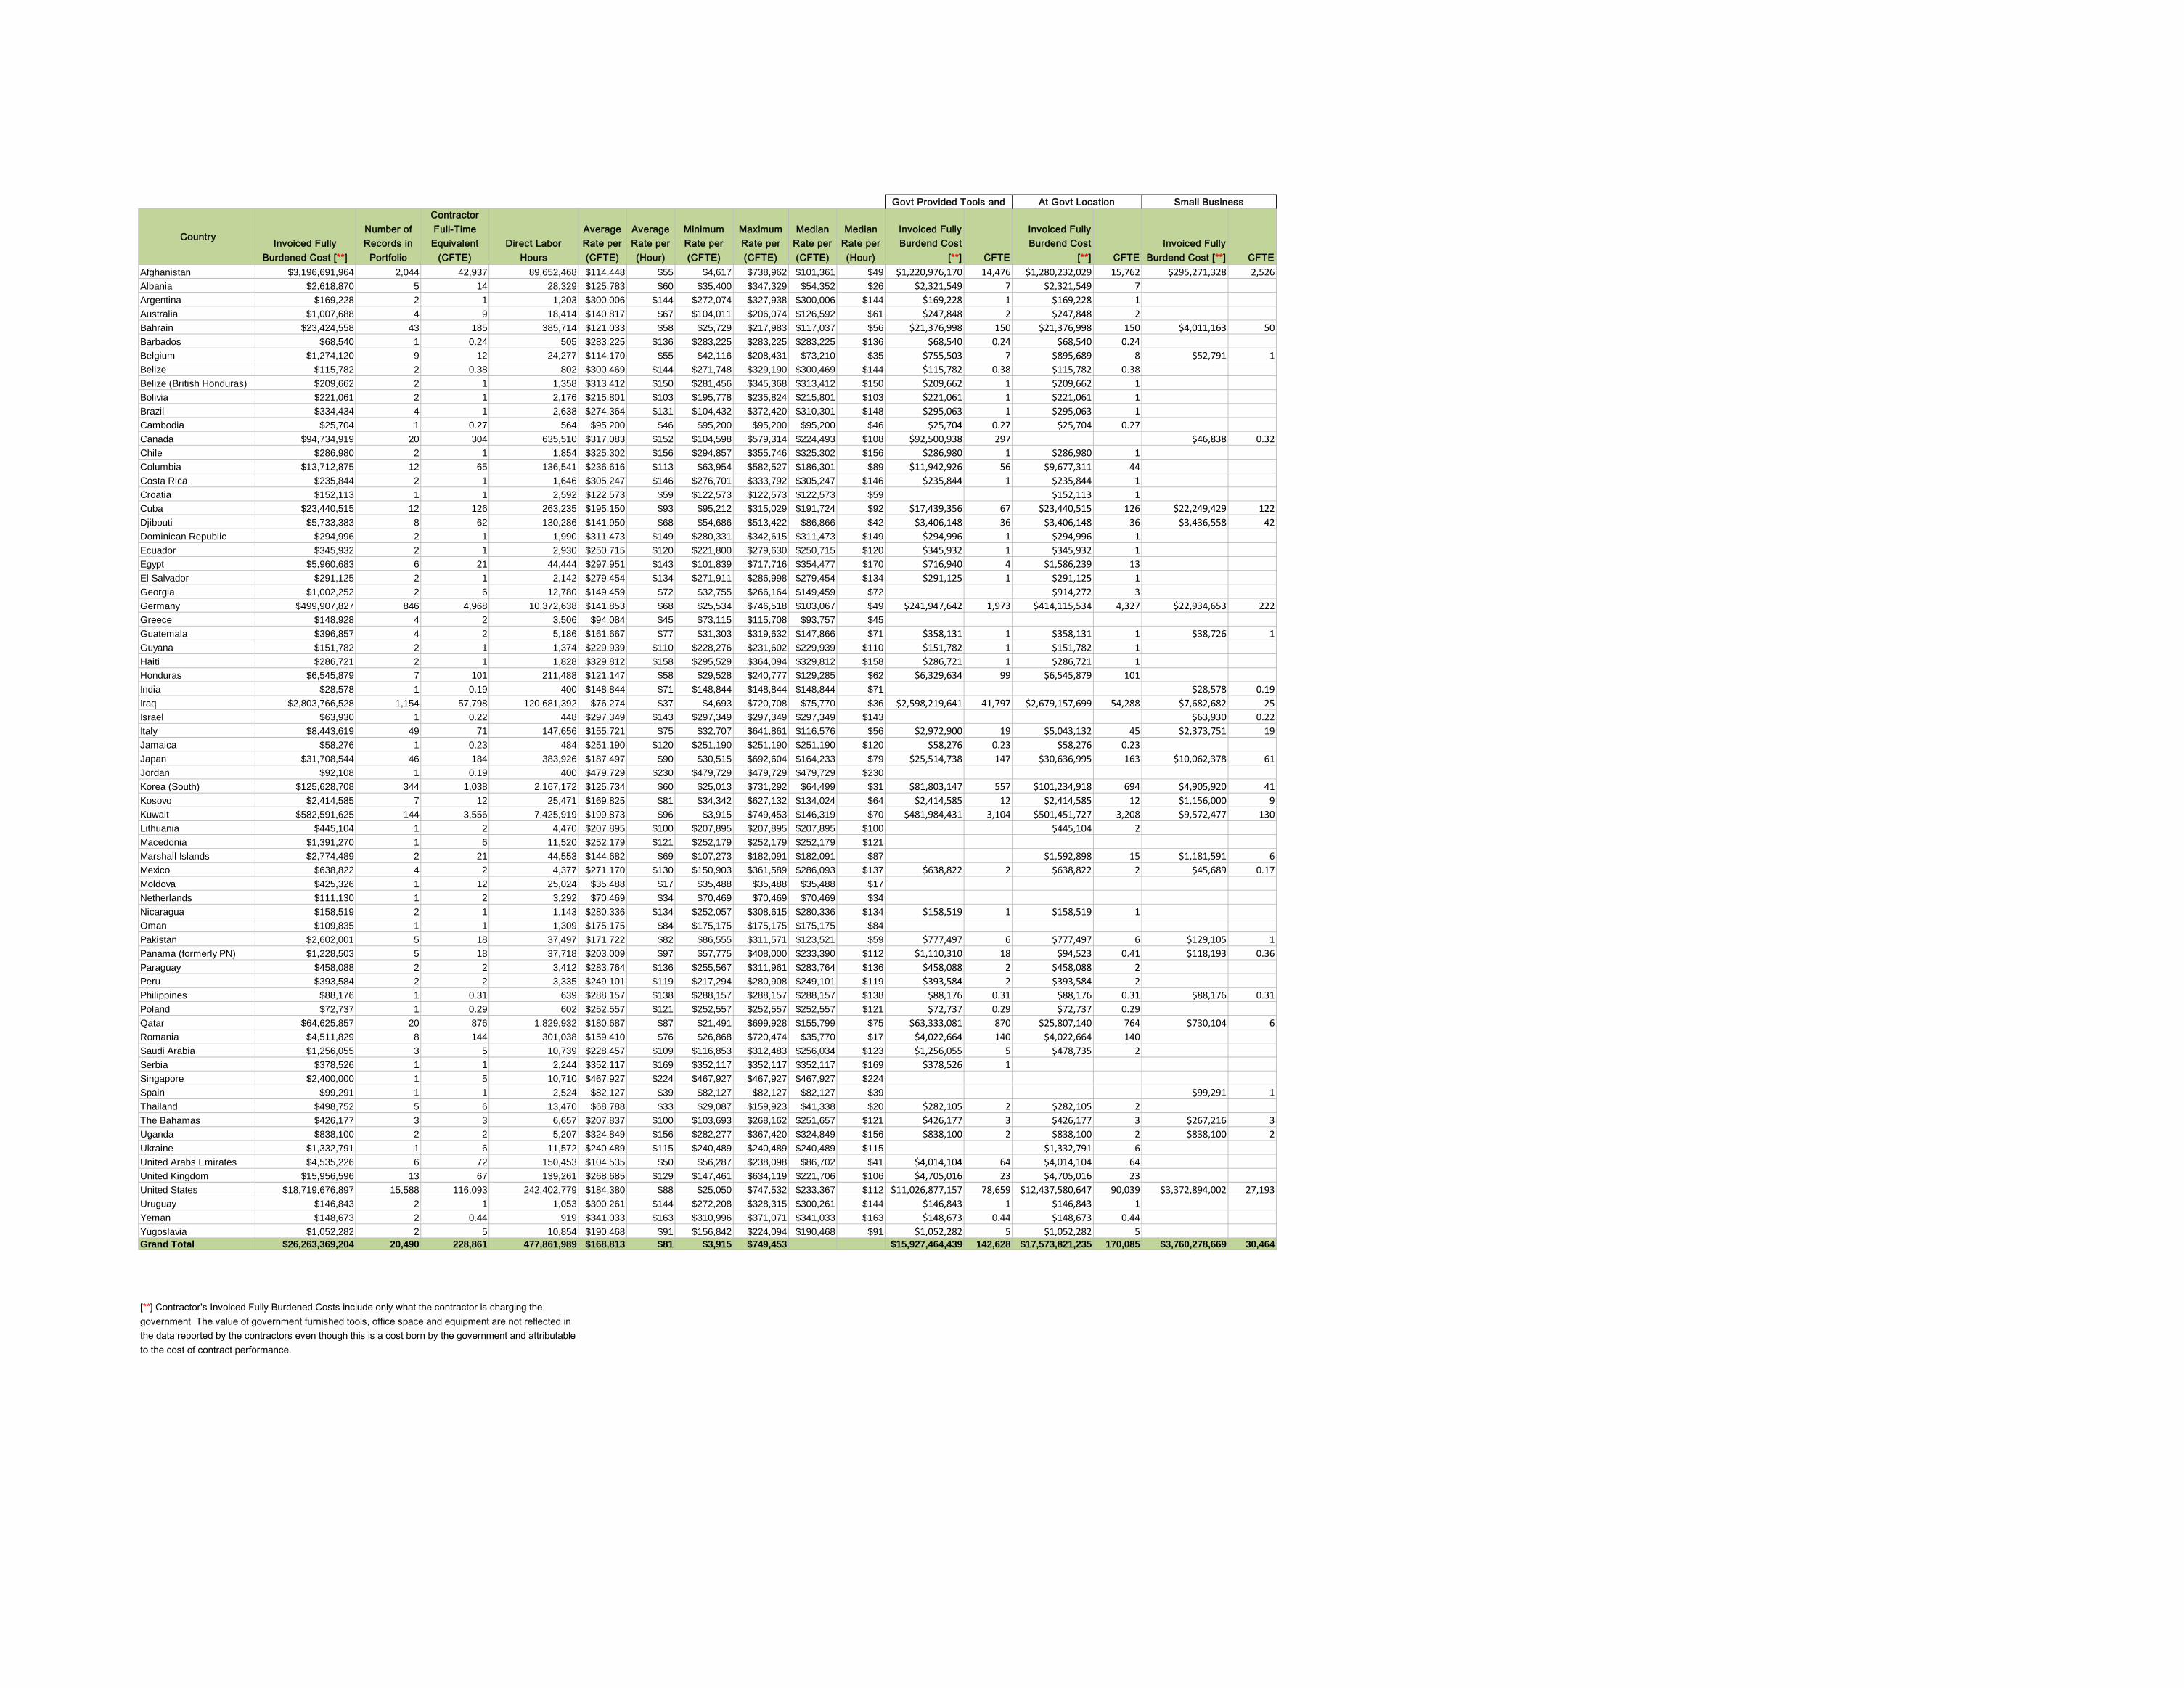
Country Invoiced Fully Burdened Cost [**]
Number of Records in
Portfolio
Contractor Full-Time Equivalent
(CFTE)Direct Labor
Hours
Average Rate per (CFTE)
Average Rate per (Hour)
Minimum Rate per (CFTE)
Maximum Rate per (CFTE)
Median Rate per (CFTE)
Median Rate per (Hour)
Invoiced Fully Burdend Cost
[**] CFTE
Invoiced Fully Burdend Cost
[**] CFTEInvoiced Fully
Burdend Cost [**] CFTEAfghanistan $3,196,691,964 2,044 42,937 89,652,468 $114,448 $55 $4,617 $738,962 $101,361 $49 $1,220,976,170 14,476 $1,280,232,029 15,762 $295,271,328 2,526Albania $2,618,870 5 14 28,329 $125,783 $60 $35,400 $347,329 $54,352 $26 $2,321,549 7 $2,321,549 7Argentina $169,228 2 1 1,203 $300,006 $144 $272,074 $327,938 $300,006 $144 $169,228 1 $169,228 1Australia $1,007,688 4 9 18,414 $140,817 $67 $104,011 $206,074 $126,592 $61 $247,848 2 $247,848 2Bahrain $23,424,558 43 185 385,714 $121,033 $58 $25,729 $217,983 $117,037 $56 $21,376,998 150 $21,376,998 150 $4,011,163 50Barbados $68,540 1 0.24 505 $283,225 $136 $283,225 $283,225 $283,225 $136 $68,540 0.24 $68,540 0.24Belgium $1,274,120 9 12 24,277 $114,170 $55 $42,116 $208,431 $73,210 $35 $755,503 7 $895,689 8 $52,791 1Belize $115,782 2 0.38 802 $300,469 $144 $271,748 $329,190 $300,469 $144 $115,782 0.38 $115,782 0.38Belize (British Honduras) $209,662 2 1 1,358 $313,412 $150 $281,456 $345,368 $313,412 $150 $209,662 1 $209,662 1Bolivia $221,061 2 1 2,176 $215,801 $103 $195,778 $235,824 $215,801 $103 $221,061 1 $221,061 1Brazil $334,434 4 1 2,638 $274,364 $131 $104,432 $372,420 $310,301 $148 $295,063 1 $295,063 1Cambodia $25,704 1 0.27 564 $95,200 $46 $95,200 $95,200 $95,200 $46 $25,704 0.27 $25,704 0.27Canada $94,734,919 20 304 635,510 $317,083 $152 $104,598 $579,314 $224,493 $108 $92,500,938 297 $46,838 0.32Chile $286,980 2 1 1,854 $325,302 $156 $294,857 $355,746 $325,302 $156 $286,980 1 $286,980 1Columbia $13,712,875 12 65 136,541 $236,616 $113 $63,954 $582,527 $186,301 $89 $11,942,926 56 $9,677,311 44Costa Rica $235,844 2 1 1,646 $305,247 $146 $276,701 $333,792 $305,247 $146 $235,844 1 $235,844 1Croatia $152,113 1 1 2,592 $122,573 $59 $122,573 $122,573 $122,573 $59 $152,113 1Cuba $23,440,515 12 126 263,235 $195,150 $93 $95,212 $315,029 $191,724 $92 $17,439,356 67 $23,440,515 126 $22,249,429 122Djibouti $5,733,383 8 62 130,286 $141,950 $68 $54,686 $513,422 $86,866 $42 $3,406,148 36 $3,406,148 36 $3,436,558 42Dominican Republic $294,996 2 1 1,990 $311,473 $149 $280,331 $342,615 $311,473 $149 $294,996 1 $294,996 1Ecuador $345,932 2 1 2,930 $250,715 $120 $221,800 $279,630 $250,715 $120 $345,932 1 $345,932 1Egypt $5,960,683 6 21 44,444 $297,951 $143 $101,839 $717,716 $354,477 $170 $716,940 4 $1,586,239 13El Salvador $291,125 2 1 2,142 $279,454 $134 $271,911 $286,998 $279,454 $134 $291,125 1 $291,125 1Georgia $1,002,252 2 6 12,780 $149,459 $72 $32,755 $266,164 $149,459 $72 $914,272 3Germany $499,907,827 846 4,968 10,372,638 $141,853 $68 $25,534 $746,518 $103,067 $49 $241,947,642 1,973 $414,115,534 4,327 $22,934,653 222Greece $148,928 4 2 3,506 $94,084 $45 $73,115 $115,708 $93,757 $45Guatemala $396,857 4 2 5,186 $161,667 $77 $31,303 $319,632 $147,866 $71 $358,131 1 $358,131 1 $38,726 1Guyana $151,782 2 1 1,374 $229,939 $110 $228,276 $231,602 $229,939 $110 $151,782 1 $151,782 1Haiti $286,721 2 1 1,828 $329,812 $158 $295,529 $364,094 $329,812 $158 $286,721 1 $286,721 1Honduras $6,545,879 7 101 211,488 $121,147 $58 $29,528 $240,777 $129,285 $62 $6,329,634 99 $6,545,879 101India $28,578 1 0.19 400 $148,844 $71 $148,844 $148,844 $148,844 $71 $28,578 0.19Iraq $2,803,766,528 1,154 57,798 120,681,392 $76,274 $37 $4,693 $720,708 $75,770 $36 $2,598,219,641 41,797 $2,679,157,699 54,288 $7,682,682 25Israel $63,930 1 0.22 448 $297,349 $143 $297,349 $297,349 $297,349 $143 $63,930 0.22Italy $8,443,619 49 71 147,656 $155,721 $75 $32,707 $641,861 $116,576 $56 $2,972,900 19 $5,043,132 45 $2,373,751 19Jamaica $58,276 1 0.23 484 $251,190 $120 $251,190 $251,190 $251,190 $120 $58,276 0.23 $58,276 0.23Japan $31,708,544 46 184 383,926 $187,497 $90 $30,515 $692,604 $164,233 $79 $25,514,738 147 $30,636,995 163 $10,062,378 61Jordan $92,108 1 0.19 400 $479,729 $230 $479,729 $479,729 $479,729 $230Korea (South) $125,628,708 344 1,038 2,167,172 $125,734 $60 $25,013 $731,292 $64,499 $31 $81,803,147 557 $101,234,918 694 $4,905,920 41Kosovo $2,414,585 7 12 25,471 $169,825 $81 $34,342 $627,132 $134,024 $64 $2,414,585 12 $2,414,585 12 $1,156,000 9Kuwait $582,591,625 144 3,556 7,425,919 $199,873 $96 $3,915 $749,453 $146,319 $70 $481,984,431 3,104 $501,451,727 3,208 $9,572,477 130Lithuania $445,104 1 2 4,470 $207,895 $100 $207,895 $207,895 $207,895 $100 $445,104 2Macedonia $1,391,270 1 6 11,520 $252,179 $121 $252,179 $252,179 $252,179 $121Marshall Islands $2,774,489 2 21 44,553 $144,682 $69 $107,273 $182,091 $182,091 $87 $1,592,898 15 $1,181,591 6Mexico $638,822 4 2 4,377 $271,170 $130 $150,903 $361,589 $286,093 $137 $638,822 2 $638,822 2 $45,689 0.17Moldova $425,326 1 12 25,024 $35,488 $17 $35,488 $35,488 $35,488 $17Netherlands $111,130 1 2 3,292 $70,469 $34 $70,469 $70,469 $70,469 $34Nicaragua $158,519 2 1 1,143 $280,336 $134 $252,057 $308,615 $280,336 $134 $158,519 1 $158,519 1Oman $109,835 1 1 1,309 $175,175 $84 $175,175 $175,175 $175,175 $84Pakistan $2,602,001 5 18 37,497 $171,722 $82 $86,555 $311,571 $123,521 $59 $777,497 6 $777,497 6 $129,105 1Panama (formerly PN) $1,228,503 5 18 37,718 $203,009 $97 $57,775 $408,000 $233,390 $112 $1,110,310 18 $94,523 0.41 $118,193 0.36Paraguay $458,088 2 2 3,412 $283,764 $136 $255,567 $311,961 $283,764 $136 $458,088 2 $458,088 2Peru $393,584 2 2 3,335 $249,101 $119 $217,294 $280,908 $249,101 $119 $393,584 2 $393,584 2Philippines $88,176 1 0.31 639 $288,157 $138 $288,157 $288,157 $288,157 $138 $88,176 0.31 $88,176 0.31 $88,176 0.31Poland $72,737 1 0.29 602 $252,557 $121 $252,557 $252,557 $252,557 $121 $72,737 0.29 $72,737 0.29Qatar $64,625,857 20 876 1,829,932 $180,687 $87 $21,491 $699,928 $155,799 $75 $63,333,081 870 $25,807,140 764 $730,104 6Romania $4,511,829 8 144 301,038 $159,410 $76 $26,868 $720,474 $35,770 $17 $4,022,664 140 $4,022,664 140Saudi Arabia $1,256,055 3 5 10,739 $228,457 $109 $116,853 $312,483 $256,034 $123 $1,256,055 5 $478,735 2Serbia $378,526 1 1 2,244 $352,117 $169 $352,117 $352,117 $352,117 $169 $378,526 1Singapore $2,400,000 1 5 10,710 $467,927 $224 $467,927 $467,927 $467,927 $224Spain $99,291 1 1 2,524 $82,127 $39 $82,127 $82,127 $82,127 $39 $99,291 1Thailand $498,752 5 6 13,470 $68,788 $33 $29,087 $159,923 $41,338 $20 $282,105 2 $282,105 2The Bahamas $426,177 3 3 6,657 $207,837 $100 $103,693 $268,162 $251,657 $121 $426,177 3 $426,177 3 $267,216 3Uganda $838,100 2 2 5,207 $324,849 $156 $282,277 $367,420 $324,849 $156 $838,100 2 $838,100 2 $838,100 2Ukraine $1,332,791 1 6 11,572 $240,489 $115 $240,489 $240,489 $240,489 $115 $1,332,791 6United Arabs Emirates $4,535,226 6 72 150,453 $104,535 $50 $56,287 $238,098 $86,702 $41 $4,014,104 64 $4,014,104 64United Kingdom $15,956,596 13 67 139,261 $268,685 $129 $147,461 $634,119 $221,706 $106 $4,705,016 23 $4,705,016 23United States $18,719,676,897 15,588 116,093 242,402,779 $184,380 $88 $25,050 $747,532 $233,367 $112 $11,026,877,157 78,659 $12,437,580,647 90,039 $3,372,894,002 27,193Uruguay $146,843 2 1 1,053 $300,261 $144 $272,208 $328,315 $300,261 $144 $146,843 1 $146,843 1Yeman $148,673 2 0.44 919 $341,033 $163 $310,996 $371,071 $341,033 $163 $148,673 0.44 $148,673 0.44Yugoslavia $1,052,282 2 5 10,854 $190,468 $91 $156,842 $224,094 $190,468 $91 $1,052,282 5 $1,052,282 5Grand Total $26,263,369,204 20,490 228,861 477,861,989 $168,813 $81 $3,915 $749,453 $15,927,464,439 142,628 $17,573,821,235 170,085 $3,760,278,669 30,464
Govt Provided Tools and At Govt Location Small Business
[**] Contractor's Invoiced Fully Burdened Costs include only what the contractor is charging the government The value of government furnished tools, office space and equipment are not reflected in the data reported by the contractors even though this is a cost born by the government and attributable to the cost of contract performance.

StateInvoiced Fully
Burdened Cost [**]
Number of Records in
Portfolio
Contractor Full-Time
Equivalent (CFTE)
Direct Labor Hours
Average Rate per (CFTE)
Average Rate per (Hour)
Minimum Rate per (CFTE)
Maximum Rate per (CFTE)
Median Rate per (CFTE)
Median Rate per (Hour)
Invoiced Fully Burdend Cost
[**]CFTE
Invoiced Fully Burdend Cost
[**]CFTE
Invoiced Fully Burdend Cost
[**]CFTE
Alabama $3,047,458,777 1,364 16,971 35,435,740 $195,160 $93 $25,050 $743,141 $175,079 $84 $2,174,917,421 12,704 $2,294,584,229 14,012 $595,553,545 3,530Alaska $49,588,108 113 323 674,912 $192,835 $92 $48,878 $567,889 $166,677 $80 $27,808,581 218 $36,624,754 264 $22,906,868 139AMERICAN SAMOA $11,564 1 0.18 373 $64,603 $31 $64,603 $64,603 $64,603 $31Arizona $848,418,704 422 4,842 10,110,156 $199,803 $96 $32,830 $702,896 $174,094 $83 $507,151,881 3,275 $487,847,263 3,623 $95,340,945 695Arkansas $187,499,304 95 856 1,786,878 $129,315 $62 $31,282 $466,820 $91,930 $44 $176,701,158 753 $169,946,872 749 $7,891,360 76California $997,356,152 657 4,850 10,125,748 $224,106 $107 $25,459 $746,063 $181,481 $87 $294,703,400 2,241 $500,749,670 3,195 $86,020,227 643Colorado $472,331,698 357 2,260 4,718,246 $176,147 $84 $28,638 $747,532 $134,102 $64 $163,625,780 1,493 $445,455,055 2,093 $97,684,551 913Connecticut $12,189,545 41 60 124,382 $189,400 $91 $48,351 $665,965 $94,825 $45 $4,503,403 33 $2,879,782 34 $2,835,211 11Delaware $7,224,525 32 44 91,002 $146,251 $70 $40,909 $389,386 $117,722 $56 $1,834,788 17 $2,098,116 19 $1,654,038 11District of Columbia $242,099,615 192 1,344 2,805,966 $248,273 $119 $49,769 $716,602 $209,277 $100 $186,468,667 1,100 $215,198,524 1,230 $56,058,334 339Florida $738,448,856 446 2,977 6,216,848 $206,780 $99 $32,847 $734,794 $167,475 $80 $339,169,357 2,008 $271,918,092 1,878 $89,409,490 567Georgia $675,922,096 844 6,749 14,091,373 $178,211 $85 $25,902 $741,446 $143,130 $69 $463,630,965 4,793 $568,179,201 6,039 $303,650,040 2,866GUAM $781,140 8 7 15,536 $107,300 $51 $60,679 $233,835 $80,214 $38 $732,826 7 $472,868 6 $45,813 1Hawaii $166,872,191 324 1,310 2,735,721 $156,155 $75 $27,550 $694,201 $121,582 $58 $73,147,408 605 $139,532,169 1,104 $45,130,526 397Idaho $1,857,492 20 16 33,525 $133,401 $64 $34,903 $352,039 $93,313 $45 $979,518 12 $871,219 11 $589,079 4Illinois $214,801,309 271 1,309 2,733,031 $172,300 $83 $26,099 $635,675 $147,475 $71 $59,439,560 350 $143,274,427 926 $83,184,822 509Indiana $103,211,057 189 668 1,393,895 $148,558 $71 $36,413 $725,715 $88,260 $42 $43,593,012 504 $45,478,834 518 $37,854,314 422Iowa $8,467,605 48 77 161,246 $111,833 $54 $36,341 $378,744 $82,669 $40 $3,211,753 37 $3,518,403 39 $1,847,746 17Kansas $286,013,851 372 2,200 4,593,159 $155,209 $74 $30,118 $735,548 $126,132 $60 $193,854,015 1,794 $253,160,646 2,008 $62,811,178 677Kentucky $605,011,438 435 4,889 10,208,800 $157,971 $76 $26,978 $743,141 $112,918 $54 $343,499,602 3,784 $388,818,385 4,244 $104,381,249 1,221Louisiana $228,507,355 195 2,411 5,035,135 $141,172 $68 $31,802 $407,701 $115,977 $56 $161,232,439 1,903 $218,281,361 2,372 $10,400,054 99Maine $5,822,539 24 27 55,429 $198,238 $95 $38,245 $527,644 $180,452 $86 $1,003,578 7 $1,449,005 9 $2,574,243 12MARSHALL ISLANDS $5,293,892 2 104 216,722 $129,859 $62 $50,742 $208,977 $129,859 $62 $5,257,948 104 $5,293,892 104 $5,257,948 104Maryland $1,432,721,405 1,226 7,815 16,318,469 $196,627 $94 $32,663 $744,067 $169,221 $81 $843,516,686 4,997 $935,080,012 5,486 $212,729,213 1,431Massachusetts $556,248,044 359 1,738 3,629,746 $258,406 $124 $28,946 $731,458 $235,973 $113 $110,601,168 440 $15,525,804 126 $27,994,153 148Michigan $468,896,250 372 2,483 5,184,605 $196,575 $94 $33,419 $735,463 $165,010 $79 $325,950,207 1,669 $104,060,338 674 $33,933,739 249Minnesota $46,922,014 75 198 413,377 $159,005 $76 $36,034 $631,675 $98,954 $47 $10,050,671 103 $11,196,260 118 $8,568,482 71Mississippi $47,051,269 156 522 1,088,969 $130,870 $63 $28,307 $731,035 $91,726 $44 $30,951,356 396 $35,946,310 448 $26,724,977 314Missouri $150,613,355 285 1,703 3,555,844 $165,714 $79 $25,343 $698,039 $127,858 $61 $71,571,587 1,215 $88,475,921 1,383 $34,694,745 395Montana $1,136,404 14 12 25,011 $143,974 $69 $32,603 $530,222 $78,809 $38 $632,049 9 $560,827 8 $290,508 5Nebraska $1,853,241 21 17 36,045 $111,022 $53 $39,151 $393,093 $77,050 $37 $1,233,281 12 $1,479,885 15 $518,565 5Nevada $5,183,143 21 47 97,569 $119,511 $57 $40,431 $287,598 $96,091 $46 $1,055,798 12 $3,664,470 37 $836,921 6New Hampshire $163,076,714 94 476 994,231 $254,191 $122 $46,170 $685,819 $251,627 $121 $9,978,336 58 $8,299,146 50 $4,736,714 20New Jersey $984,677,707 391 4,757 9,932,283 $219,847 $105 $32,696 $714,029 $204,088 $98 $626,995,847 3,317 $850,462,891 4,189 $117,115,388 887New Mexico $157,739,012 132 1,139 2,379,244 $171,027 $82 $34,809 $722,518 $146,116 $70 $115,876,799 903 $126,861,784 1,019 $49,089,790 453New York $172,939,363 372 1,321 2,758,616 $164,701 $79 $25,475 $747,455 $134,711 $65 $56,645,492 627 $63,301,432 724 $50,670,382 490North Carolina $333,205,475 427 2,722 5,682,793 $156,460 $75 $27,841 $714,089 $117,203 $56 $170,178,885 1,674 $275,081,501 2,367 $88,192,880 1,093North Dakota $1,985,528 22 21 44,300 $116,402 $56 $59,838 $714,212 $77,477 $37 $1,023,917 15 $1,048,817 15 $594,947 3Ohio $69,907,247 156 306 639,895 $228,136 $109 $34,996 $735,573 $171,668 $82 $17,365,418 94 $8,070,689 69 $8,460,018 59Oklahoma $206,660,952 243 2,197 4,587,010 $141,419 $68 $31,386 $731,390 $122,469 $59 $129,410,042 1,570 $162,346,189 1,877 $50,683,393 642Oregon $107,097,306 30 946 1,974,948 $194,464 $93 $37,353 $648,442 $165,321 $79 $97,109,628 897 $96,437,725 893 $3,662,491 21Pennsylvania $179,429,952 352 1,191 2,487,690 $206,669 $99 $34,055 $731,198 $164,616 $79 $73,890,855 669 $70,768,520 672 $28,761,851 203PUERTO RICO $5,338,909 22 63 131,264 $117,501 $56 $39,259 $425,539 $85,670 $41 $1,260,907 15 $3,732,221 47 $3,662,615 46Rhode Island $7,759,625 17 35 72,055 $174,448 $84 $40,222 $478,932 $123,384 $59 $664,026 7 $1,089,400 9 $242,520 3South Carolina $125,186,386 164 1,686 3,521,150 $151,717 $73 $26,262 $586,883 $126,643 $61 $96,160,360 1,379 $111,705,011 1,559 $21,489,331 255South Dakota $1,717,475 19 20 41,809 $84,404 $40 $43,170 $152,820 $81,516 $39 $628,650 9 $679,917 9 $396,618 5Tennessee $25,867,549 79 119 248,578 $165,982 $80 $32,993 $651,394 $120,612 $58 $2,411,583 34 $3,914,588 47 $4,433,873 36Texas $1,218,950,504 1,429 10,812 22,574,912 $152,958 $73 $25,903 $747,274 $117,826 $56 $878,322,581 7,959 $1,014,891,269 9,575 $288,538,718 2,925Utah $199,844,367 149 1,698 3,544,761 $126,791 $61 $34,202 $558,156 $96,088 $46 $164,249,601 1,537 $167,859,977 1,567 $11,104,189 87Vermont $7,901,319 47 58 120,986 $105,209 $50 $35,052 $253,436 $91,544 $44 $3,016,245 35 $3,239,855 36 $1,448,323 9VIRGIN ISLANDS $1,074,184 4 6 13,123 $124,900 $60 $61,500 $278,849 $79,624 $38 $209,173 3 $241,540 3 $132,974 2Virginia $2,588,878,199 1,860 14,177 29,602,532 $210,994 $101 $25,157 $738,068 $190,257 $91 $1,543,458,653 8,585 $1,863,052,974 10,375 $474,913,338 2,894Washington $422,044,729 398 2,414 5,040,626 $169,252 $81 $25,096 $714,794 $124,679 $60 $315,353,216 1,721 $118,205,677 1,181 $40,773,700 426West Virginia $43,078,865 43 206 429,971 $167,523 $80 $34,460 $665,333 $160,623 $77 $36,866,638 192 $24,871,145 135 $3,498,287 29Wisconsin $78,395,631 145 880 1,838,174 $153,419 $73 $35,605 $712,405 $107,500 $52 $62,733,172 754 $68,758,520 836 $60,589,233 725Wyoming $1,105,960 12 14 28,370 $85,288 $41 $36,216 $150,974 $78,918 $38 $1,037,267 13 $1,037,267 13 $329,542 4Grand Total $18,719,676,897 15,588 116,093 242,402,779 $11,026,877,157 78,659 $12,437,580,647 90,039 $3,372,894,002 27,193
Govt Provided Tools and At Govt Location Small Business
[**] Contractor's Invoiced Fully Burdened Costs include only what the contractor is charging the government The value of government furnished tools, office space and equipment are not reflected in the data reported by the contractors even though this is a cost born by the government and attributable to the cost of contract performance.