northern freight & logistics report technical appendices · northern freight & logistics...
TRANSCRIPT

Northern Freight & Logistics Report: Technical Appendices | 1
One Agenda. One Economy. One North.
Northern Freight & Logistics Report Technical Appendices

2 | Northern Freight & Logistics Report: Technical Appendices | 3
Contents
1 Technical Appendices 5
1.1 Overview 5
1.2 Structure of Appendices 5
Appendix A. Methodologies 7
A.1 Establishing the Baseline 7
A.2 Stakeholder Engagement 7
A.3 Scenario Development 10
A.4 Freight Modelling 20
A.5 Appraisal 35
Appendix B. Scenario Testing 47
B.1 Introduction 47
B.2 Scenario Modelling 47
B.3 Road and Rail Freight Kilometres 47
B.4 Transport Network Impact 51
B.5 Port Impacts 59
B.6 User Costs 62
B.7 Non-User Costs 64
B.8 Environment 65
B.9 Summary 79
Appendix C. Appraisal of Preferred Recommendations 81
C.1 Identification of the Preferred Recommendations – a discussion of results from the tested scenarios 81
C.2 Preferred Recommendations 82
C.3 Appraisal Results 82
C.4 High Growth Scenario Sensitivity Test 92
Appendix D. Recommendations Details 97
D.1 Full Recommended Measures List 97
D.2 Rail Freight Path Proposals 102
D.3 Anticipated Private Sector Response: Multimodal Distribution Parks 102
D.4 Application of Stakeholder Consultation in Recommendation Development 105
Appendix E. Supporting Policy and Commercial Context 111
E.1 Introduction 111
E.2 Port Sector 112
E.3 Rail Freight Sector 115
E.4 Developing a Market for Distribution Centre Developers 118
E.5 Developing a Market for Distribution Centre Occupiers 128
E.6 Modelling Competition between Distribution Centre Locations 140
E.7 Urban Freight Issues and Objectives 150

4 | Northern Freight & Logistics Report: Technical Appendices | 5
1 Technical Appendices
1.1 Overview
This document provides the Technical Appendices to the Transport for the North (TfN) Northern Freight and Logistics Report. Together these form the Phase 2/3 Technical Report jointly prepared by Mott MacDonald and MDS Transmodal. Alone, the Report Document presents the preferred recommendations in a concise format designed to be read and understood by the ‘non-technical’ reader. Those who wish to delve further into the the recommendation development methodology, testing and appraisal and the proposed measures will find a greater level of technical depth in this document. References are provided in the Rreport Document to signpost the reader to the appropriate section of this Technical Appendices document. An overview of this Technical Appendices document is provided in Section 1.2; supported by cross-references throughout.
1.2 Structure of Appendices
This document is structured into five main parts:
n Appendix A: Methodologies;
n Appendix B: Scenario Testing;
n Appendix C: Appraisal of Preferred Recommendations;
n Appendix D: Recommendations Details; and
n Appendix E: Supporting Policy and Commercial Context.
The content of each part is discussed in greater detail in the following sections.
1.2.1 Appendix A: Methodologies
Appendix A details the methodologies employed during Phases 1, 2 and 3 of the study. Phase 1 focused on the development of a comprehensive baseline understanding of the existing freight and logistics industry, including learning from international best practice and stakeholder feedback and developing an assessment of existing and future strengths and weaknesses.
Phase 2 involved the development of a Preliminary Central scenario and four alternative ‘Do Something’ scenarios for testing in order to support identification of the preferred recommendations. For this the Great Britain Freight Model (GBFM) was used to understand the performance of these scenarios against a ‘Do Minimum’ scenario.
Phase 3, which focused on further development and refinement of the preferred recommendations, utilised standard WebTAG compliant transport appraisal techniques, supported by additional bespoke appraisal to understand the environmental impacts and wider economic benefits in order to assess its overall performance.
1.2.2 Appendix B: Scenario Testing
Appendix B details the results of the scenario testing undertaken for the Preliminary Central scenario and four alternative scenarios (Road; Rail; Water and Environment) for the forecast year of 2033.

6 | Northern Freight & Logistics Report: Technical Appendices | 7
1.2.3 Appendix C: Appraisal of Preferred Recommendations
Appendix C provides commentary on how the results of the scenario testing were interpreted alongside industry knowledge and stakeholder feedback to identify the preferred recommendations. Details of the results of the transport, environmental and wider economic appraisal exercises are provided, with the results presented in an Appraisal Summary Table (AST) accompanied by supporting commentary. Wider contextual information is also provided on the potential industry response to the implementation of the public sector measures contained within the preferred recommendations. Finally, details of the high economic growth sensitivity test that was performed on the preferred recommendations are provided, alongside analysis of the results.
1.2.4 Appendix D: Recommendations Details
Appendix D presents the full list of public sector measures contained in the preferred recommendations, alongside supporting rationale for their inclusion. In particular, rail freight path proposals are set out in more detail. One of the key private sector responses anticipated as a result of the implementation of the preferred recommendations is the development of additional Multimodal Distribution Parks (MDPs) in the North of England and wider UK; and this section provides a list of suitable sites that have the potential for rail and/or water connections to support this type of activity.
1.2.5 Appendix E: Supporting Policy and Commercial Context
Appendix E provides wider contextual information that enables greater understanding of the industry context in which the report has been developed, including:
n The port sector;
n The rail freight sector;
n Supplementary information submitted to the consultancy team as follows:
– Developing a market for distribution centre developers
– Developing a market for distribution centre occupiers
n Modelling competition between distribution centre locations; and
n Urban freight transport issues and objectives.
Appendix A. Methodologies
This Appendix presents the methodologies used at each of the key project stages; namely establishing the baseline, stakeholder engagement, scenario development, freight modelling and appraisal.
A.1 Establishing the Baseline
Phase 1 of the programme required the team to develop an agreed and comprehensive baseline, using a combination of research, professional expertise, modelling and stakeholder engagement. More specifically, it included:
n A review of International, European and National level agreements as they relate to freight transport and logistics, and the resultant environmental, employment, planning and transportation considerations;
n A best practice review of freight modelling, and the development of case studies to review a sample of existing European and international freight and logistics strategies;
n Use of the Great Britain Freight Model (hereafter referred to as GBFM) to develop ‘present day’ and ‘do-minimum future’ scenarios for freight and logistics in the UK; and
n A baseline stakeholder conference, including workshops (reported in Appendix A.2 in further detail).
The TfN Northern Freight and Logistics Report Baseline Report includes full details of the above.
A.2 Stakeholder Engagement
A.2.1 Overview
In order to ensure that stakeholder expertise, experience and vision for the freight and logistics sector informed the recommendations development process, a programme of engagement was undertaken as outlined in Table A.1. Engagement activities were tailored to the different stakeholder groups activated by the three phases of the recommendations development process. The diagram presented in Figure A.1 provides an overview of each stakeholder group.

8 | Northern Freight & Logistics Report: Technical Appendices | 9
Figure A.1: Stakeholder Groups
Table A.1: Stakeholder Engagement Programme
Project Phase Engagement Activity Date
Phase 1: Establishing a baseline
Interviews with trade associations September 2015
Recommendation Development Conference, Mann Island, Liverpool
1st October 2015
Online stakeholder survey 1st October – 25th October 2015
Gap analysis September – November 2015
Phase 2: Forecasting
Feedback from the Steering Group (SG) and Private Sector Reference Group (PSRG) on the selection of scenarios to be modelled and appraised
November 2015
Feedback from the SG and PSRG on the outputs from the modelling
2nd December 2015
Phase 3: Recommendation DevelopmentDraft recommendations and action planning Conference, Leeds City Museum
14th January 2016
The following sections provide a description of the stakeholder activities associated with each phase of the report development process.
A.2.2 Phase 1 – Establishing the Baseline
Stakeholder engagement was an integral component of Phase 1 and several different consultation activities were undertaken to inform the development of the recommendation baseline. In addition to the individual engagement activities, both the SG and the PSRG provided ongoing direction, guidance and insight as part of formal progress meetings.
Following project inception, interviews with trade association representatives were undertaken, which were used to gather intelligence on their members’ key issues and priorities. The interviews also provided an opportunity to secure trade association support for promoting the recommendation development conference and to explore topics for discussion at the event.
The recommendation development conference was held on 1st October 2015 in Liverpool and over 50 delegates attended from across the freight and logistics sector. Following a series of presentations which provided context and background to the recommendations, stakeholders were asked to give their views on the current strengths and opportunities; constraints and issues; and changes and developments required for the sector to realise its potential, as part of facilitated workshop sessions.
Stakeholders were also given the opportunity to provide further comment in an online survey which was designed to capture additional insights to inform the Phase 1 baseline. All conference delegates were asked to complete the survey and a link to the survey was disseminated by the trade associations to their members. A total of 41 responses to the online survey were received.
The findings from the conference and the online survey were reviewed by the project team and used to develop and inform the TfN Freight and Logistics Baseline Report.
To conclude the engagement activities undertaken in Phase 1, a gap analysis was undertaken to identify if any sectors were under represented. The analysis identified that the e-commerce sector was not sufficiently represented and a representative of Interactive Media in Retail Group (IMRG), the industry association for online retail, was invited to attend future engagement activities.
A.2.3 Phase 2 – Forecasting the Future
Members of the SG and the PSRG were invited to comment on the Phase 2 methodology, which was summarised in a Technical Note that presented six scenarios containing a series of proposed ‘bundles’ of interventions, packaged into the following scenarios:
n Preliminary Central scenario;
n High Growth scenario;
n Environment scenario;
n Road scenario;
n Rail scenario; and
n Water scenario.
Further information on the scenario development process is provided in Appendix A.3.
In addition to the Technical Note, stakeholders were provided with a feedback form to record responses to a series of questions designed to explore initial thoughts on the ‘bundles’ of interventions for each scenario. A total of 10 stakeholders provided feedback, of which six were from the SG and four were from the PSRG.
The final engagement activity in Phase 2 was a joint SG and PSRG workshop held on December 2nd 2015 at Transport for Greater Manchester’s (TfGM’s) offices. The objective of the workshop was to obtain feedback on the initial modelling outputs for the Preliminary Central scenario.
The feedback from both engagement exercises was reviewed by the project team and where appropriate, changes were made to the bundles of measures within each scenario to incorporate recommendations or comments.
10 | Northern Freight & Logistics Report: Technical Appendices | 11
A.2.4 Phase 3 – Recommendations Development
To conclude the engagement activities, a conference was held on January 14th 2016 at Leeds City Museum to explore stakeholder perceptions of the draft recommendations. Members of the SG and the PSRG were asked to disseminate the conference invite to their contacts and a total of 91 delegates attended the event.
Delegates included SG and PSRG members and representatives from multinational and national logistic companies, industry including the manufacturing and mining sectors, transport operators, the public sector and academia.
Delegates were asked to reflect upon a series of presentations which set out the proposed interventions and the modelling outputs of the proposed recommendations. Following this, conference participants took part in facilitated workshop discussions to provide comment on the draft recommendations and were asked a series of questions to explore support for the report's vision, objectives and measures and to identify delivery mechanisms and channels for stakeholder involvement going forward.
Feedback from the conference, including delegates’ questions and workshop findings, were reviewed by the project team and were used to inform the development of the final Report Document and Action Plan contained therein.
A.3 Scenario Development
This section describes the ‘logic chain’ approach used to identify scenarios for testing to arrive at the preferred recommendations. It provides information on how a variety of different variables (including interventions such as infrastructure improvements, policy changes and exogenous factors causing market changes) were combined into one ‘Preliminary Central’ scenario and four alternative scenarios for testing. It also details the package of public sector measures and anticipated private sector responses contained within each scenario.
A.3.1 Approach
In developing a Freight and Logistics Report for the North of England, the development process was based on the identification of variables (such as capital investment in infrastructure, changes to the planning system, policy support actions etc) packaged for assessment and appraisal in a series of scheme scenarios. By understanding the performance of different variables within those scenarios, and understanding the performance of each overall scenario, the recommendations were developed on the basis of understanding the benefits of individual variables and the added value gained when variables are delivered together.
A.3.2 Study Development Logic Chain
In adopting the above approach (assessing the merits of differing interventions as part of a wider scenario) a linear, step-by-step approach to assessment was used. Logic chains provide a simple method of communicating the process we have undertaken to gather the data needed to drive assessment, the appraisal undertaken for each scenario and how the outputs gained have been used to shape and develop the preferred recommendations.
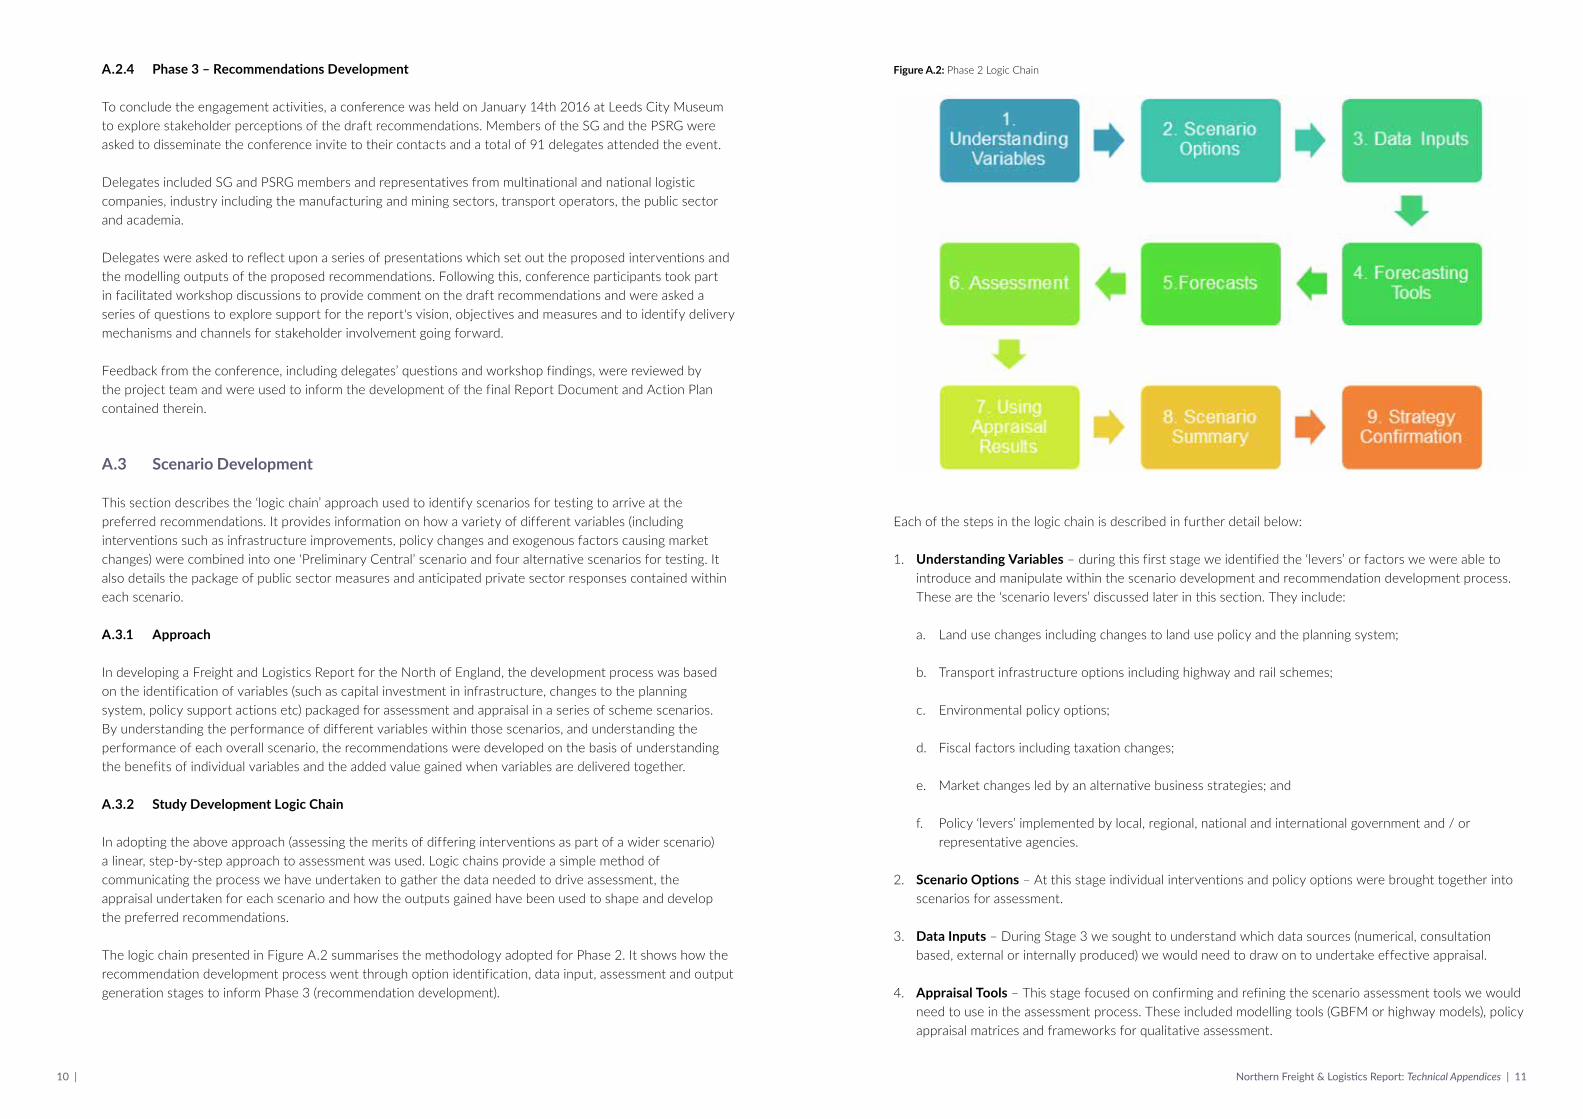
The logic chain presented in Figure A.2 summarises the methodology adopted for Phase 2. It shows how the recommendation development process went through option identification, data input, assessment and output generation stages to inform Phase 3 (recommendation development).
Figure A.2: Phase 2 Logic Chain
Each of the steps in the logic chain is described in further detail below:
1. Understanding Variables – during this first stage we identified the ‘levers’ or factors we were able to introduce and manipulate within the scenario development and recommendation development process. These are the ‘scenario levers’ discussed later in this section. They include:
a. Land use changes including changes to land use policy and the planning system;
b. Transport infrastructure options including highway and rail schemes;
c. Environmental policy options;
d. Fiscal factors including taxation changes;
e. Market changes led by an alternative business strategies; and
f. Policy ‘levers’ implemented by local, regional, national and international government and / or representative agencies.
2. Scenario Options – At this stage individual interventions and policy options were brought together into scenarios for assessment.
3. Data Inputs – During Stage 3 we sought to understand which data sources (numerical, consultation based, external or internally produced) we would need to draw on to undertake effective appraisal.
4. Appraisal Tools – This stage focused on confirming and refining the scenario assessment tools we would need to use in the assessment process. These included modelling tools (GBFM or highway models), policy appraisal matrices and frameworks for qualitative assessment.
12 | Northern Freight & Logistics Report: Technical Appendices | 13
5. Appraisal Processes – We then used the tools available to appraise the scenarios developed.
6. Assessment Outputs – Once the assessment process was complete we were then able to use the outputs and data created to carry out wider appraisal and testing of the success of the scenarios.
7. Using Appraisal Results – The appraisal results produced allowed us to undertake an iterative appraisal process to reconfigure the scenarios for further assessment where appropriate.
8. Scenario Summary – Once the above stages were complete we were then able to present easily understood information on the wider costs and benefits of different scenarios.
9. Recommendations Confirmation – Understanding the costs and benefits of interventions enabled us to introduce scenario options into the final report (Phase 3).
A.3.3 Potential Variables / Interventions
The project team developed a list of potential interventions; namely public sector measures and schemes that could be employed to contribute to the delivery of the report aims, address the constraints, and maximise the strengths identified, based on an anticipated complementary private sector response. This was then complemented with further measures identified by stakeholders at a stakeholder conference on 1st October 2015 and through an online stakeholder survey as reported in Appendix A.2. The long list included measures for all modes, both public and private sector actions and both physical infrastructure improvements and policy interventions.
Interventions in the long list were categorised as follows:
n Public, private and policy interventions across:
– Road;
– Rail;
– Water;
– Air;
– Distribution;
– Infrastructure and networks; and
– Markets, manufacturing and demand.
n Broader policy, planning and regulation
n Collaboration (public-private and within the sector)
n Hi-tech solutions
n Education, skills and training
n Other
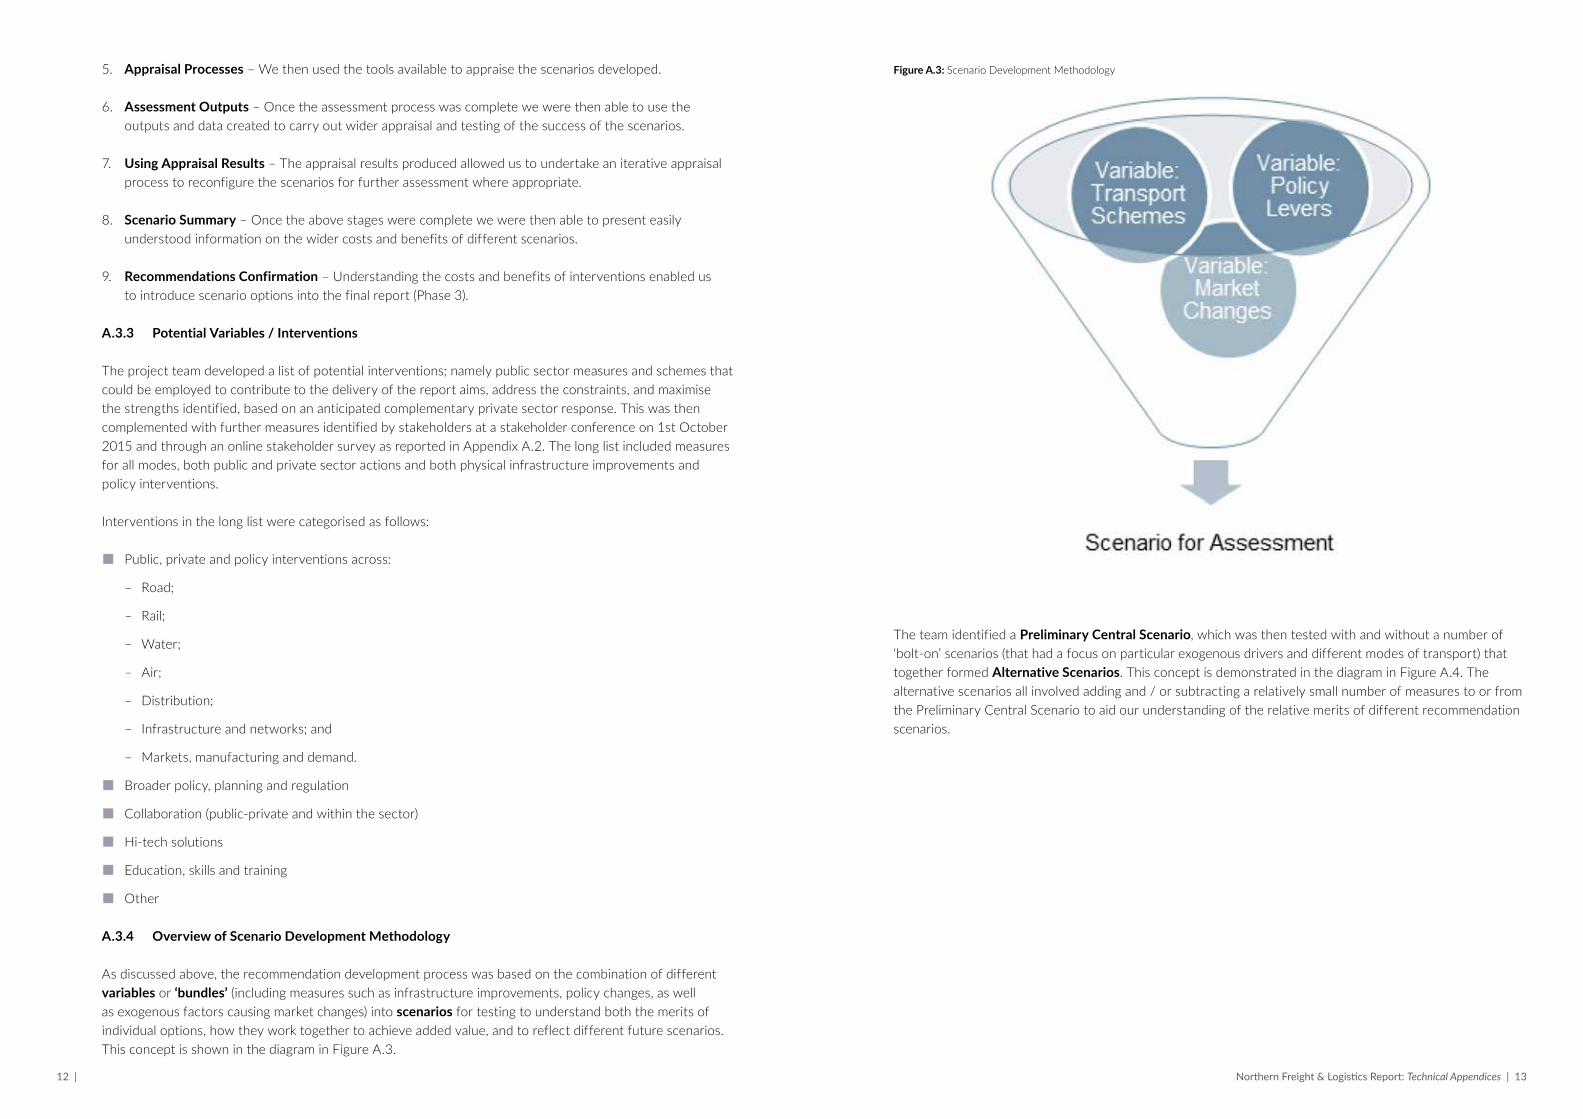
A.3.4 Overview of Scenario Development Methodology
As discussed above, the recommendation development process was based on the combination of different variables or ‘bundles’ (including measures such as infrastructure improvements, policy changes, as well as exogenous factors causing market changes) into scenarios for testing to understand both the merits of individual options, how they work together to achieve added value, and to reflect different future scenarios. This concept is shown in the diagram in Figure A.3.
Figure A.3: Scenario Development Methodology
The team identified a Preliminary Central Scenario, which was then tested with and without a number of ‘bolt-on’ scenarios (that had a focus on particular exogenous drivers and different modes of transport) that together formed Alternative Scenarios. This concept is demonstrated in the diagram in Figure A.4. The alternative scenarios all involved adding and / or subtracting a relatively small number of measures to or from the Preliminary Central Scenario to aid our understanding of the relative merits of different recommendation scenarios.

14 | Northern Freight & Logistics Report: Technical Appendices | 15
Figure A.4: Preliminary Central and Alternative Scenarios for Assessment
The diagram presented in Figure A.4 demonstrates the concept of the bundling and scenario testing methodology. Further details of the range and content of the bundles are provided in Section A.3.5.
A.3.5 Packages of Measures for Testing
Six scenarios were developed to package ‘bundles’ of measures according to a theme or rationale. These were as follows:
Preliminary Central Scenario (comprised of the Central Bundle): A package of infrastructure and policy measures that would transform the connectivity of the North for freight and logistics by all modes, with a particular emphasis on reducing the unit cost of transporting goods to, and from and across the North and encouraging private sector investment in rail- and water-connected distribution parks in competitive locations. This bundle of infrastructure measures includes investments in the road, rail and inland waterway networks by the public sector, while also developing policies that create a business environment within which the private sector would be encouraged to invest in new distribution facilities and new freight and logistics services.
The alternative scenarios all involve adding and / or subtracting a relatively small number of interventions to or from the Central Bundle to aid our understanding of the relative merits of different recommendation scenarios. These are described below. After the following narrative which describes the alternative scenarios, a series of tables are provided which outline in more detail the content of each of the six scenarios in terms of the measures that they contain.
Focus on Road Scenario (Central Bundle + Road Bundle): A scenario that considers the impact on freight and logistics in the North of additional public sector measures to further improve the cost-effectiveness of the road freight sector.
Focus on Rail Scenario (Central Bundle + Rail Bundle): A scenario that considers the impact on freight and logistics in the North of additional public sector measures to further improve the cost-effectiveness of the rail freight sector.
Focus on Waterborne Freight Scenario (Central Bundle and Waterborne Freight Bundle): A scenario that considers the impact on freight and logistics in the North of additional public sector measures to further improve the cost-effectiveness of the waterborne freight (ports and inland waterways) sector.
Focus on Environment Scenario (Central Bundle + Environment Bundle): A scenario that considers, in addition to the Preliminary Central Scenario, the impact on freight and logistics in the North of two exogenous environmental factors, namely: (1) the need to meet EU air quality standards; and (2) the need to meet international agreements on carbon reductions.
Focus on High Growth Scenario (Central Bundle + High Economic Growth Bundle): A scenario that considers, in addition to the Preliminary Central Scenario, the impact on freight and logistics in the North of population and Gross Value Added (GVA) growth in line with the TfN Independent Economic Review (IER) Transformed North scenario. This sixth scenario formed a sensitivity test to the preferred recommendations; further details of which are provided in Appendix C.4.
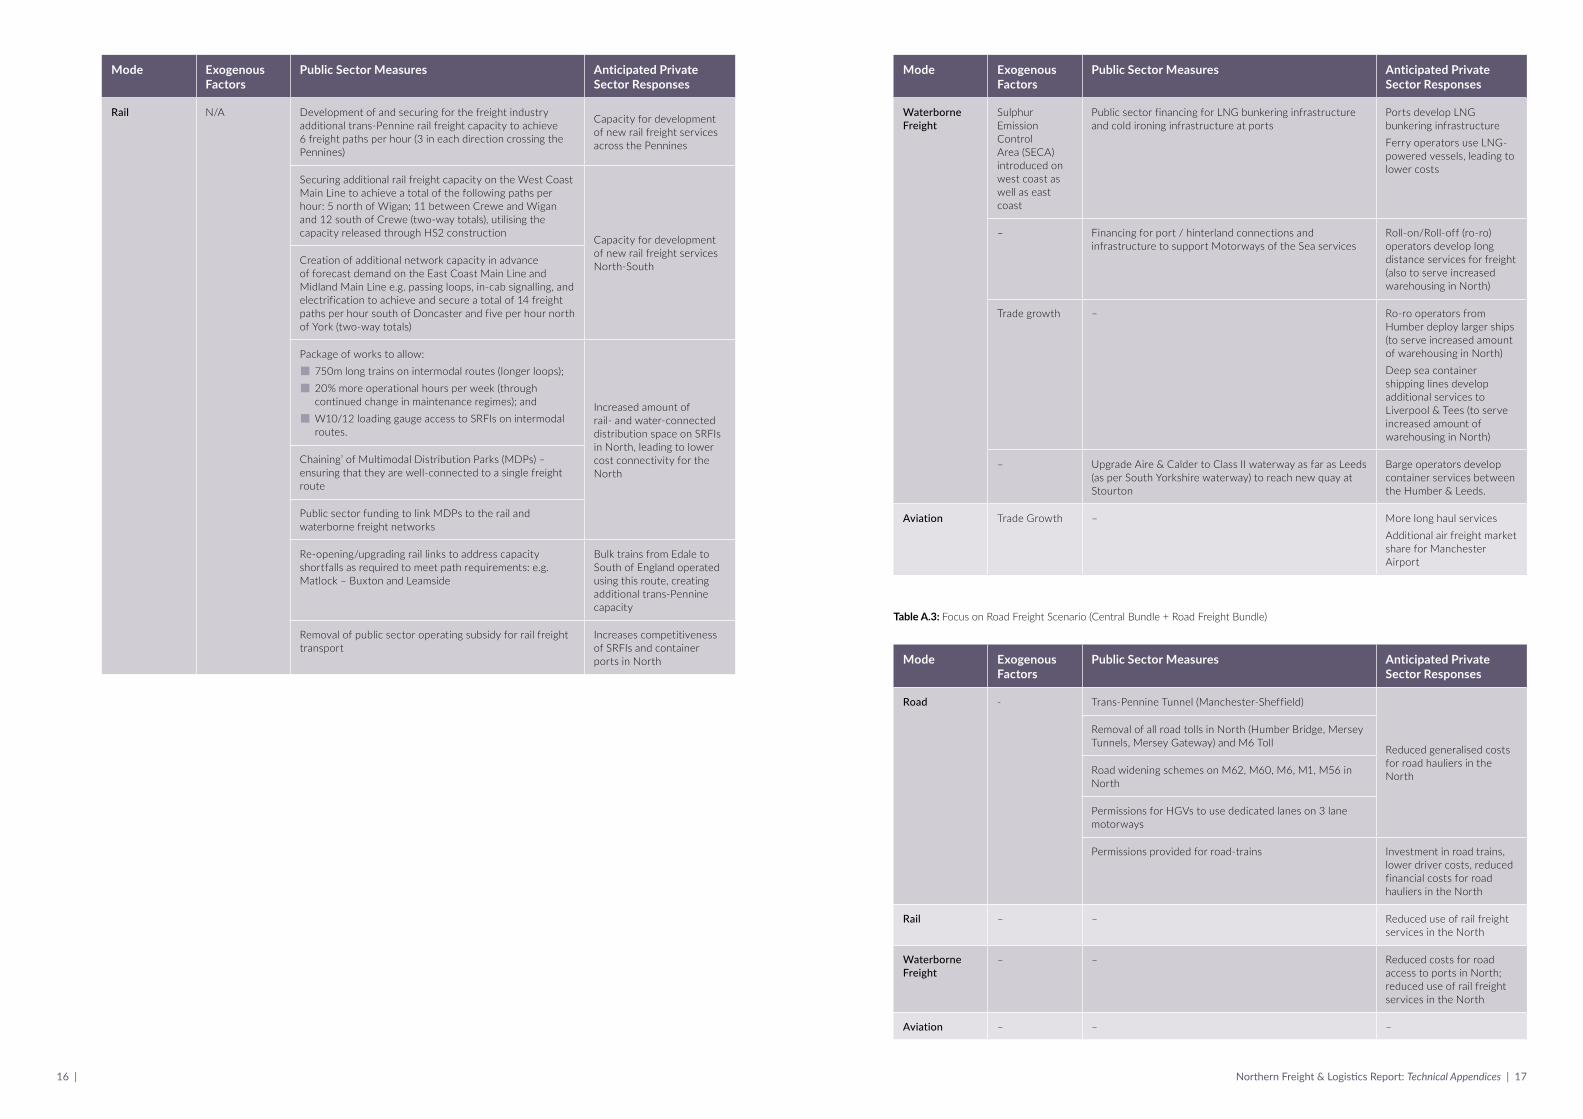
Each of the six bundles is described in Table A.2 to Table A.7, which set out exogenous drivers for change (where relevant), proposed public sector measures (both related to infrastructure and to policy) and anticipated responses from the private sector.
Table A.2: Preliminary Central Scenario (Central Bundle)
Mode Exogenous Factors
Public Sector Measures Anticipated Private Sector Responses
Road N/A TfN Northern Trans-Pennine improvements (A66/A69)
Reduced costs passed on as efficiency gains to wider economy
TfN Manchester North West Quadrant improvements (M60)
Existing A road and motorway capacity upgrades, interchange improvement schemes and link / relief road schemes (in addition to schemes included in the ‘Do Minimum’ scenario)
Development of a network of secure HGV parking facilities e.g. at rail connected warehousing sites
Investment and support for freight-focused training / apprenticeship programmes and qualifications at all levels
Investment into ‘last mile’ distribution solutions and impact mitigation
Use of new technologies and supply chains for ‘last mile’ distribution
Delivery of improvements to land side access to ports (e.g. Liverpool and Hull port access)
Increased use of Northern ports
16 | Northern Freight & Logistics Report: Technical Appendices | 17
Mode Exogenous Factors
Public Sector Measures Anticipated Private Sector Responses
Rail N/A Development of and securing for the freight industry additional trans-Pennine rail freight capacity to achieve 6 freight paths per hour (3 in each direction crossing the Pennines)
Capacity for development of new rail freight services across the Pennines
Securing additional rail freight capacity on the West Coast Main Line to achieve a total of the following paths per hour: 5 north of Wigan; 11 between Crewe and Wigan and 12 south of Crewe (two-way totals), utilising the capacity released through HS2 construction
Capacity for development of new rail freight services North-SouthCreation of additional network capacity in advance
of forecast demand on the East Coast Main Line and Midland Main Line e.g. passing loops, in-cab signalling, and electrification to achieve and secure a total of 14 freight paths per hour south of Doncaster and five per hour north of York (two-way totals)
Package of works to allow:
n 750m long trains on intermodal routes (longer loops);
n 20% more operational hours per week (through continued change in maintenance regimes); and
n W10/12 loading gauge access to SRFIs on intermodal routes.
Increased amount of rail- and water-connected distribution space on SRFIs in North, leading to lower cost connectivity for the North
Chaining’ of Multimodal Distribution Parks (MDPs) – ensuring that they are well-connected to a single freight route
Public sector funding to link MDPs to the rail and waterborne freight networks
Re-opening/upgrading rail links to address capacity shortfalls as required to meet path requirements: e.g. Matlock – Buxton and Leamside
Bulk trains from Edale to South of England operated using this route, creating additional trans-Pennine capacity
Removal of public sector operating subsidy for rail freight transport
Increases competitiveness of SRFIs and container ports in North
Mode Exogenous Factors
Public Sector Measures Anticipated Private Sector Responses
Waterborne Freight
Sulphur Emission Control Area (SECA) introduced on west coast as well as east coast
Public sector financing for LNG bunkering infrastructure and cold ironing infrastructure at ports
Ports develop LNG bunkering infrastructureFerry operators use LNG-powered vessels, leading to lower costs
– Financing for port / hinterland connections and infrastructure to support Motorways of the Sea services
Roll-on/Roll-off (ro-ro) operators develop long distance services for freight (also to serve increased warehousing in North)
Trade growth – Ro-ro operators from Humber deploy larger ships (to serve increased amount of warehousing in North)Deep sea container shipping lines develop additional services to Liverpool & Tees (to serve increased amount of warehousing in North)
– Upgrade Aire & Calder to Class II waterway as far as Leeds (as per South Yorkshire waterway) to reach new quay at Stourton
Barge operators develop container services between the Humber & Leeds.
Aviation Trade Growth – More long haul servicesAdditional air freight market share for Manchester Airport
Table A.3: Focus on Road Freight Scenario (Central Bundle + Road Freight Bundle)
Mode Exogenous Factors
Public Sector Measures Anticipated Private Sector Responses
Road - Trans-Pennine Tunnel (Manchester-Sheffield)
Reduced generalised costs for road hauliers in the North
Removal of all road tolls in North (Humber Bridge, Mersey Tunnels, Mersey Gateway) and M6 Toll
Road widening schemes on M62, M60, M6, M1, M56 in North
Permissions for HGVs to use dedicated lanes on 3 lane motorways
Permissions provided for road-trains Investment in road trains, lower driver costs, reduced financial costs for road hauliers in the North
Rail – – Reduced use of rail freight services in the North
Waterborne Freight
– – Reduced costs for road access to ports in North; reduced use of rail freight services in the North
Aviation – – –

18 | Northern Freight & Logistics Report: Technical Appendices | 19
Table A.4: Focus on Rail Freight Scenario (Central Bundle + Rail Freight Bundle)
Mode Exogenous Factors
Public Sector Measures Anticipated Private Sector Responses
Road - – Reduced use of road freight across and to/from the North
Rail – Piggyback (trucks on trains) service route across Pennines Use of piggyback rail freight services to cross Pennines by road hauliers
National rail freight operating grant, based on net external costs of road freight
Increased use of rail freight services in the North. Additional development of rail freight distribution parks in the North
1,500 metre long passing loops and reception sidings on core intermodal routes with associated permissions from rail infrastructure provider
Reduced cost of operating intermodal rail freight services
Waterborne Freight
– – Increased use of rail freight services for inland distribution to/from ports in the North. Increased use of rail to/from deep sea container ports in the South of England
Aviation – – –
Table A.5: Focus on Waterborne Freight Scenario (Central Bundle + Waterborne Freight Bundle)
Mode Exogenous Factors
Public Sector Measures Anticipated Private Sector Responses
Road - – Reduced use of road freight across and to/from the North
Rail – – Reduced use of rail freight services across and to/from the North
Waterborne Freight
– Waterborne & coastal freight operating grant scheme, based on net external costs of road freight
Increased coastal shipping and inland waterway movements, including to regional and local ports in North. Additional development of distribution space in ports and adjacent to inland waterways in North
Trans-Pennine Super Canal Increased use of inland waterway services across the Pennines
Waterborne & coastal freight operating grant scheme, based on net external costs of road freight
Increased use of inland waterways, including to regional and local ports Additional development of distribution space adjacent to waterways
Aviation – – –
Table A.6: Focus on Environment Scenario (Central Bundle + Environment Bundle)
Mode Exogenous Factors
Public Sector Measures Anticipated Private Sector Responses
RoadAir quality regulations & carbon emissions targets
Introduction of Low Emission Zones in the main conurbations in the North and/or packages of measures to encourage sustainable ‘last mile’ deliveries Investment in ULCs, electric
LGVs & hybrid HGVs for last mile deliveries in the NorthNetwork of Urban Logistics Centres (ULCs), with rail
connections for inbound & consolidation of loads for outbound last mile deliveries
Rail – – Increased use of rail freight services in the NorthAdditional development of rail freight distribution parks in the North
Waterborne Freight
– Waterborne & coastal freight operating grant scheme, based on net external costs of road freight
Increased use of rail freight and inland waterway services for inland distribution to/from ports in the NorthIncreased use of ro-ro ports in the North for import/export movements to/from European continental mainland and IrelandIncreased use of coastal shipping services to/from regional and local ports in the NorthAdditional development of port-centric distribution in ports in the North
Aviation – – Increased use of air freight services via Manchester Airport (rather than London Airports)
The High Economic Growth Scenario detailed in Table A.7 forms a sensitivity test for the preferred recommendations. Further information on this test is provided in Appendix C.4.

20 | Northern Freight & Logistics Report: Technical Appendices | 21
Table A.7: High Economic Growth Scenario (Central Bundle + High Economic Growth Bundle)
Mode Exogenous Factors
Public Sector Measures Anticipated Private Sector Responses
Road Incorporating DfT / TfN high Northern Growth scenario
– Increased demand for road freight transport in the North
Rail Incorporating DfT / TfN high Northern Growth scenario
– –
Waterborne Freight
Incorporating DfT / TfN high Northern Growth scenario; Implementation of TTIP, leading to increased transatlantic trade.
– Increased demand for imports, leading to increased traffic through ports in NorthMore traffic handled by the Port of Liverpool and more freight distributed inland by road, rail and on the Manchester Ship Canal
Incorporating DfT / TfN high Northern Growth scenario
Increased demand for waterborne freight transport in the North
Aviation Incorporating DfT / TfN high Northern Growth scenario
– –
A.4 Freight Modelling
A.4.1 Introduction
This Appendix describes the modelling methodology that was adopted by the consultancy consortium to determine the impact of the interventions included in the Freight and Logistics Report, the likely private sector response and to produce key outputs including changes in financial costs for the industry (User costs) and in environmental costs for society (one of the main Non-User costs).
This Appendix has been written mainly for a public sector audience that wishes to understand the overall methodology that lies behind the modelling and some of the key assumptions that were made.
The approach to the development of the recommendations required the use of a strategic freight transport model to test measures that might be incorporated into the Freight and Logistics Report. The model needed to be ‘strategic’ so it could assess the impact on both domestic and international freight flows of interventions in the North of England and beyond. This means the geographic scope of the model needed to cover not just the North of England, but also the rest of Great Britain and its connections by sea, air and via the Channel Tunnel to the rest of the world. The model also had to be able to produce forecasts of freight demand and produce future scenarios up to 2043.
The modelling work for this study involved:
n Developing a 2014 Baseline using the GBFM (in Phase 1 of the study);
n Developing a 2033 Do Minimum scenario (Phase 1), which was subsequently subject to marginal amendments in Phase 2 to ensure that it was consistent with assumptions made for the 2033 Preferred scenario;
n Developing a 2033 Preferred Scenario, while taking into account the results of a range of alternative scenarios; and
n Producing outputs for the Do Minimum and Preferred Scenario for 2023, 2033 and 2043.
Figure A.5 illustrates the freight modelling process.
Figure A.5: Freight Modelling Methodology

22 | Northern Freight & Logistics Report: Technical Appendices | 23
A.4.2 The Great Britain Freight Model (GBFM)
This section provides background information on GBFM, which was the main tool used to carry out the modelling for this study.
GBFM is a four stage freight transport model developed and maintained by MDS Transmodal, which forms the freight model component of the Department for Transport’s (DfT’s) National Transport Model (NTM). Over the last ten years, GBFM has been used by a wide variety of ports and warehouse developers, as well as public sector bodies at a regional and national level. GBFM also incorporates a process whereby available datasets produced by a range of different authorities are assembled and collated to produce an estimated origin, destination, mode, commodity and gateway port database that can then be applied to projects.
GBFM uses the available official freight transport statistics to develop a multi-modal base year matrix for 2014 for this study. It then explains the observed freight transport movements in terms of generalised costs, reflecting how the freight transport industry determines the choice of mode and allowing future market and policy-based scenarios to be developed for any future year where these scenarios affect the generalised cost of freight transport. GBFM includes a demand forecasting module, allowing demand to be forecast up to 2043 and includes origins and destinations for both domestic and short sea international movements so that both domestic and international movements by ferry can be modelled.
A.4.3 Developing the Base Year
The baseline data for 2014 (that was included in the Phase 1 report) was collated from a number of sources, namely:
n DfT road freight, maritime and waterborne freight data;
n Network Rail for rail freight demand data;
n Civil Aviation Authority air freight demand data;
n Valuation Office Agency data on warehousing supply; and
n MDS Transmodal port infrastructure, container shipping and ferry deployment data.
While the rail freight demand data is based on Network Rail’s billing data for rail freight, with terminal to terminal flows, the road freight data was collated by developing an origin-destination matrix based on the existing matrix within GBFM. Within the time constraints of the study it was not possible to fully recalibrate the origin-destination matrix for 2014; however data from the DfT’s Continuing Survey of Road Goods Transport and Port Freight Statistics were used to scale GBFM’s results to represent totals for the base year and to establish a split between domestic and international freight. The result is a 2014 base year road traffic origin-destination matrix, assigned to the road network, with a split available between domestic and international road freight.
A.4.4 The 2033 Do Minimum Scenario
The 2033 Do Minimum Scenario was originally developed and modelled during Phase 1 of the study to provide a counterfactual scenario (i.e. what would happen anyway without any public sector intervention and a private sector response as a result of a pro-active plan for Freight and Logistics and was designed to allow comparisons of the net impact of ‘Do Something’ scenarios included in the final report.
In order to carry out the modelling of the 2033 Do Minimum scenario using GBFM a number of assumptions were made regarding:
n Infrastructure enhancements on the road and rail networks that are committed to be implemented by the relevant public infrastructure providers, as well as their impact on road and rail freight flows;
n Expected structural changes in economic sectors (e.g. reductions in coal traffic due to the closure of coal-fired power stations);
n Forecast macro-economic trends (e.g. forecast population growth, Gross Domestic Product (GDP) growth), which have been inferred from assumptions used by the DfT to develop road freight forecasts in 2015;
n Trade growth, which affects both port traffic and inland movements to and from ports and the Channel Tunnel;
n New rail freight services that have been contracted for; and
n Expected changes in relative transport costs up to 2033.
More detail on the modelling assumptions can be found in Chapter 5 of the Phase 1 Baseline Report available from TfN.
A.4.5 The 2033 Do Something Scenarios
A.4.5.1 Introduction
The project team then selected various ‘Do Something’ scenarios that were then tested, including the Preliminary Central scenario and various alternative scenarios that incorporated different bundles of measures, which were all variants built on the Preliminary Central scenario. As a result of this process, the consultancy team produced a Preferred Scenario, the results of which provide evidence for the impacts of the TfN Freight and Logistics Report, while taking into account the results of the modelling of the alternative bundles (refer to Appendix B and Appendix C for further detail on how the preferred recommendations were identified).
The ideal approach would have been to use one all-encompassing model to represent all the assumptions in a consistent way that would allow all levels of results to respond to every change in assumptions. For example, improvements to the rail network in conjunction with changes to shipping speed on deep sea shipping routes are likely to influence the choice of port by shipping lines in Great Britain for deep sea containers because these changes affect their freight transport costs on a door-to-door basis. However GBFM is not able to meaningfully represent responses to all the above assumptions on its own because deep sea container traffic at particular ports is regarded in the model as a given. Therefore several other models and techniques have been linked together with GBFM in a hierarchical way to represent more of the assumptions, to arrive at the overall modelled results.
There were several ‘softer’ measures within the recommendations that were not explicitly modelled in our transport modelling results (such as the potential impact of freight operator recognition schemes) because the transport benefits of these measures are difficult to quantify.
In order to produce consistent comparative results between the 2033 Do Minimum scenario and the other scenarios, elements of the Do Minimum scenario were re-modelled in Phase 2 of the study using the set of modelling techniques applied to the ‘Do Something’ scenarios. Overall, this did not change the 2033 Do Minimum results significantly from those in the Phase 1 Baseline Report. The methodology for modelling the revised 2033 Do Minimum and the Do Something scenarios is described below.

24 | Northern Freight & Logistics Report: Technical Appendices | 25
The structure of the modelling methodology description below initially focuses on the modelling of the Do Minimum scenario versus the Preferred Scenario for 2033:
n Deep sea Lift-On/Lift-Off (LoLo) shipping – using MDS Transmodal’s End-to-End Container Cost Model (E2ECCM);
n Road network – adding road improvements to GBFM’s road network;
n European non-bulk shipping – using GBFM;
n Intermodal rail & Multimodal Distribution Parks (MDPs) – using MDS Transmodal’s Multimodal Distribution Park Demand (MDPM) model;
n Bulk traffics;
n Road and rail assignment;
n User (financial) cost modelling; and
n Representing the alternative bundles.
Deep Sea LoLo Shipping
This progression of modelling methodology starts at the highest level: modelling worldwide container shipping using MDST’s E2ECCM. In summary the E2ECCM estimates the cost of operating a particular shipping service schedule (e.g. a typical weekly service from the Far East to Northern Europe with a list of defined ports of call, ship sizes and number of ships on the service), and calculates the overall cost of the service on a quay to quay basis. Each service is drawn from MDS Transmodal’s database of all container services which is updated on a monthly basis. Operating costs are based on the specific ports of call. Changing the ports of call or service frequency implies a change in the number of ships employed, capacity and speed, and therefore charter costs, port charges and bunker consumption. Such a change can then be compared with the volume of containers involved for the cargo exchange at the port involved so that a cost per container for such an incremental change can be determined. In this way the maritime cost of a call at a south east container port as compared with Liverpool or Tees for example, can be determined. The comparative inland costs of reaching the British inland hinterland (as defined by warehousing distribution) from alternative ports can then be added so that the overall change in the cost of transporting a deep sea container from its maritime origin to its inland destination in Great Britain via alternative ports can be determined.
The shipping service can be altered by switching or adding a port, and repeating the operating cost calculation.
Starting from a suitable real example service (operated by MSC), if instead of calling at Felixstowe to serve Great Britain, the service calls at Liverpool, there is an additional shipping cost to divert to and from Liverpool. However, Liverpool is closer to the inland market; therefore a saving on inland transport costs will be made. Overall there is a slight net reduction in the costs of calling at Liverpool instead of at Felixstowe.
However, the realisation of this benefit relies upon transport links inland from Liverpool being comparable to the large deep sea container ports in the South East of England, with rail services being operated efficiently to a wide range of inland destinations.
A deep sea vessel calling instead at Teesport will face a shorter deviation (around 200 miles less than a call in Liverpool), but a smaller reduction in the inland distance covered. Lines will select the option which best suits the mix of cargo carried and the proportion for the UK (typically around 20% for ships also calling at North Continent ports).
The potential shift of a proportion of the warehousing stock towards the North (described in Appendix E.6) is not incorporated into the E2ECCM. This warehousing shift brings the inland hinterland nearer to Liverpool
and Tees and helps bolster the case for ports in the North of England attracting large deep sea shipping services.
In the Preliminary Central scenario, we made the assumption that the port of Liverpool invests in sufficient rail facilities at the port to complement Liverpool2 and the inland networks are able to cope with the extra demand. In conjunction with the hinterland moving nearer to Liverpool, this will attract a deep sea container service with large ships (around 13,000 TEU) to Liverpool making good use of the capacity available. Using typical container port productivity assumptions per metre of deep-water quay, we concluded that Liverpool would handle 1,655,000 TEU in 2033 (up from 666,000 TEU in 2014).
Note that the costs of the two shipping scenarios are an output of the model. However the response of a deep sea shipping company choosing to re-direct their large ships to Liverpool is a judgement based on the costs and other elements of the recommendations i.e. it is not a modelled response.
In the 2033 Do Minimum scenario, we assumed that there would be no major changes to services at Liverpool and that traffic would grow in line with trade growth (from 666,000 TEU in 2014 to 1,014,000 TEU in 2033). There would continue to be some American and Mediterranean services, and feeder services from the major North West European container ports, which could all take advantage of the availability of capacity at Liverpool2, but would not use it to its full capability to handle larger container ships.
For Teesport, a similar approach was taken whereby an existing example deep sea LoLo service was costed and then the calling pattern adjusted to incorporate a call at Teesport. The most appropriate deep sea services to divert to the Tees are likely to be those that already call at Scandinavian ports because less diversion from the existing route is required to serve, in addition, the Tees. Teesport is less suited to serving the whole country than Liverpool. Therefore instead of calling at Teesport instead of a South Eastern port to serve the whole country, we added a Teesport call to an existing (G6 Alliance) shipping service that already calls at Southampton. The shipping cost for incorporating this extra call is significantly higher. However by serving the North and Midlands from Teesport and the South from Southampton instead of the whole country from Southampton, inland cost savings could be made. Incorporating the benefit of being able to transport non-urgent containers from Scandinavia to the North could result in a small overall net benefit.
These large ships calling at Teesport would be dependent on it having the appropriate capacity and facilities to handle them. It is understood that Teesport is currently considering the purchase of cranes large enough to accommodate such ships. In order for Teesport to realise these savings, there would also be a need for efficient rail services to/from Teesport. The shift of warehousing to the North would help to encourage a shipping line to make the switch to using Teesport for its Northern and Midlands traffic. In the Preliminary Central scenario, we have assumed that a deep sea shipping line would call at Teesport, boosting its traffic to from 304,000 to 700,000 LoLo TEU between 2014 and 2033 (4.5% per annum compound growth).
As in the case of Liverpool, in our 2033 Do Minimum scenario, we have assumed that there would be no major changes to service patterns at Teesport and that traffic grows in line with trade growth (from 304,000 TEU in 2014 to 463,000 TEU in 2033).
It should be noted that the E2ECCM does not incorporate the impact of rail-connected warehousing. For example, if Port Salford were to be rail-connected, for journeys from Felixstowe (where rail would likely be the preferred mode), removing the need for a local road haul between rail terminal and warehouse reduces the cost significantly. However this would have little impact on the transport costs from Liverpool, because the default mode without rail-connection would have been road. Therefore rail-connecting inland sites in the North benefits Felixstowe more than Northern ports. The preferred recommendations assume rail-connected warehousing sites are built across the country. For those more distant from Liverpool, where rail may be considered anyway, rail-connecting the sites would favour Liverpool or Teesport. For example, if the rail-connected destination was Milton Keynes, which is closer to Felixstowe than Liverpool, there would be greater savings by rail via Liverpool if a rail service was available.

26 | Northern Freight & Logistics Report: Technical Appendices | 27
Large deep sea LoLo ships require large ports with deep water quays. Forecast growth to 2033 will require further port capacity unless productivity rates (containers handled per quay metre) can improve significantly. Even in the Preliminary Central scenario, with Teesport and Liverpool attracting deep sea shipping services, there is still a need for additional traffic in 2033 to be handled by the large deep sea container ports located in South East England.
Road Network
GBFM incorporates a road network with speeds on each link intended to represent the average HGV speed in 2014. GBFM then assigns HGV traffic along its calculated lowest generalised cost route from each origin to each destination (2,600 zones in Britain). This simple All or Nothing (AON) approach is a pragmatic approach to avoid excessive data requirements and computing time. However, as GBFM does not include passenger traffic or time-of-day variation, it is not well suited to representing congestion, and how it might vary with capacity enhancements such as smart motorways.
For the future, several road schemes were assumed to be brought on stream in the North and, where necessary, new roads were added to the network. Upgrades to a road specification (e.g. single to dual carriageway) were represented as improvements to average speeds.
For future years, congestion was assumed to worsen in line with DfT forecasts1 by road type and region. This was represented in the model as reduced average speeds.
We represented significant capacity improvements as a non-worsening of congestion from 2014. This is a relatively simple way of representing capacity enhancements – which in most cases is probably a conservative estimate of the congestion-reducing benefits of the schemes.
A more robust evaluation of the congestion-reducing benefits to HGVs of each road scheme would require separate studies incorporating passenger traffic and time of day.
The schemes included in the recommendations are listed in Appendix D.1 along with the rationale for inclusion.
The approach of taking on board general increased congestion (by road type and region) and incorporating new roads and enhancements goes some way to relating increased demand to limited capacity. However, for example, our Preferred Scenario resulted in more traffic in 2033 across the M62 which should ideally have a modelled feedback loop to worsen congestion.
An alternative view of our modelling philosophy is to consider the HGV results in the Preferred Scenario as representative of the HGV traffic that needs to be accommodated. This is helped through implementing the specific schemes we have included in the recommendations. The only way capacity enhancements would not be required would be if the extra HGV capacity required could be delivered through outcomes such as:
n HGVs being given higher priority over passenger traffic;
n Lower passenger car demand; and
n Technological advance (e.g. autonomous driving) resulting in better utilisation of the existing network.
In the absence of these outcomes, in the Preferred scenario it is likely that further road schemes beyond those identified in the recommendations would also be required to cater for increased traffic (freight and passenger together) elsewhere on the network too.
1 www.gov.uk/government/publications/road-traffic-forecasts-2015
European Non-Bulk Shipping – Using GBFM
GBFM is well suited to modelling the competition between international services carrying European trade (e.g. cross-Channel ferries and the Channel Tunnel). For trade between each European region and British zone, the costs of using each route is calculated, and the traffic is then typically allocated mostly to the cheapest routes, while ensuring (through calibration) that route totals match observed volumes in the base year.
For the Do Minimum scenario, the only change in shipping services from the base year (2014) is assumed to be the introduction of Sulphur Emission Control Areas (SECAs). This has already been introduced in the North Sea and the English Channel at the beginning of 2015. In the 2033 Do Minimum scenario, we assumed that the market response would be to fit Heavy Fuel Oil (HFO) scrubbers to remove the sulphur from the exhaust and this adds some operational cost. These operational costs are likely to increase more in absolute terms (£ per unit carried) on the longer distance routes (typically via Northern ports) as compared to shorter distance routes (e.g. Dover Straits). Current low fuel prices and disruption on the Dover Straits have shielded Northern ports from these extra costs, but if fuel prices return to more ‘normal’ levels (in line with WebTAG assumptions) and the disruption for the Dover Straits services is resolved (implicitly assumed in our forecasts), then the Northern ports may experience reduced traffic volumes as a result of the higher costs associated with SECA. We assumed in the 2033 Do Minimum scenario that this would discourage private sector investment in port facilities and larger ships generally would not be deployed on routes to and from Northern ports.
In both the 2033 Do Minimum and the 2033 Preferred Scenario we assumed a SECA will be introduced on the Irish Sea by 2033.
In the 2033 Preferred Scenario, we have assumed:
n All routes switch to Liquid Natural Gas (LNG);
n Significantly larger ships are deployed on routes to and from the Humber ro-ro ports; and
n Introduction of a Motorway of the Sea service between North West England, Western France and Iberia.
All routes switch to Liquid Natural Gas (LNG)
Once the initial port investment hurdles are overcome (which may need some public sector support), the operational costs are typically lower if the ships use LNG as a bunker fuel rather than heavy fuel oil (with scrubber technology). This assumes that fuel prices return to more ‘normal’ levels, with fuel costs for LNG being 60% of HFO operations, but 20% higher ship-chartering costs and £2 per unit extra port charges for LNG operation.
Significantly larger ships at the Humber ro-ro ports
Larger ships can be justified with larger traffic volumes. The resultant economies of scale of operating large ships combined with the lower-operational cost of LNG, and the shift of inland destinations further North was assumed to encourage shipping lines to invest in these larger ships (of the order of 8,000 lane metres, around double current ship sizes) thus reducing costs and attracting more traffic to the Humber ports. Operating larger ships typically means unloading and loading times increase. Timings for most Continent-Humber ro-ro services are currently quite flexible because the crossing distance involved is too far for round trips in 24 hours whereas a 48 hour round trip, even at slow (fuel efficient) speeds, still allows around 10 hours on the berth. This allows plenty of extra time for this extra unloading and loading time, which makes Humber ro-ro services particularly suited to significantly larger ships.

28 | Northern Freight & Logistics Report: Technical Appendices | 29
Introduction of a Motorways-of-the-Sea supported service between the North West, Western France and Iberia
The low operational costs (compared to driving through France and Southern Britain) and potential traffic would justify such a service. However the market has failed to provide a service along this route, partly because of the difficulty of tackling inertia and encouraging the market to adjust to the option of using such a service. Support through assisting ports in infrastructure development through the Motorways of the Sea programme is one way to give ports an interest in helping such a service to be established and subsequently continue to operate without subsidy. The shift of warehousing (inland destinations) to the North would further encourage the use of this service instead of driving through France and Southern Britain.
Intermodal Rail & Multimodal Distribution Park Demand Model (MDPDM)
Multimodal Distribution Parks (MDPs) are sites that include:
n Distribution warehousing;
n An intermodal terminal for the transfer of intermodal container units between modes (road, rail and/or water and on-site transfers); and
n Good road and rail access (and, for sites in suitable locations, access to a waterway).
Warehousing located on such a site is able to receive and distribute goods by road. For suitable (typically long distance) cargo there is the option of receiving / distributing directly by rail or water instead of road. By building the warehousing on the same site as the rail/water terminal, for goods bound for on-site distribution centres there is no need for a local road haul to get to/from the rail/water terminal, thus reducing door to door costs substantially. An MDP also operates as a standard intermodal rail (or water) terminal for off-site traffic. This means that traffic that does not have an origin or destination in a warehouse on the MDP itself can be loaded or unloaded at the intermodal terminal and then transported from or to its origin or destination by road.
There are a few successful examples of MDPs in the North such as Ditton, Wakefield and Selby. In the Midlands DIRFT and Hams Hall are good existing examples, with DIRFT, for example, planning to expand significantly over the coming years as part of its DIRFT III project.
Total costs for operating a warehouse include land costs, labour costs and transport costs to and from the site. Compared to the rest of Britain, the North typically has relatively low land and labour costs but transport costs for a National Distribution Centre (NDC) are typically higher than if locating in much of the Midlands. If transport costs are reduced through rail-connecting sites and reducing the costs of rail, the North (with its longer journey distances) benefits more than the Midlands and therefore becomes a relatively more attractive place to locate an NDC. Appendix E.6 describes the logic and further modelling behind this effect and concludes that developers would be likely to invest in an extra 2 million square metres of NDC new build warehousing in the North as a result of the measures that reduce the transport costs in the Preferred scenario, as compared to the Do Minimum scenario where the North is assumed to only retain its existing market share of large warehousing. Note that the costs of locating a warehouse in each county under each scenario are an output of the model. However the response of developers choosing to build in the North is a judgement based on the costs and other factors in the report i.e. it is not a modelled response.
The modelling of the traffic to and from these sites is explained below.
A series of suitable sites of defined land area were chosen for the forecast year. The main objectives when selecting these sites were:
n A reasonable geographical spread across the country – broadly in line with existing large warehousing (warehouses larger than 9,000 m2) distribution.
n A realistic proportion of likely total warehousing new-build. Large warehousing new-build is approximately 1 to 1.5 million square metres per year across the country. For our Preferred Scenario, we assumed that approximately 35%-40% of this new build capacity can realistically be expected to be on MDP sites.
n Being guided where possible by the market – using proposals for new sites or expansion of existing sites, with good road and rail/water access.
The likely traffic generation for each warehousing site was then estimated based on its land area and national / regional distribution split. The distribution of the origins and destinations for this traffic was based on existing similar traffic as sourced from GBFM.
GBFM forecasts the equivalent of this traffic with assumptions on overall traffic growth from the base year; therefore the equivalent traffic to/from these warehousing sites must be netted off GBFM’s traffic.
Once an overall origin–destination matrix incorporating the warehousing traffic and the netted off GBFM forecasts was established, the traffic was split into road and rail shares using mode share functions similar to that in GBFM based on transport costs, whilst also taking into account the economies of scale associated with high-volume rail traffic operations. The key impact of increasing the rail mode share was the removal of the need for a local road haul for rail traffic to/from warehousing at MDPs. Other important factors boosting the rail mode share were:
n An increase in fuel prices and drivers’ wages (based on WebTAG assumptions); and
n A 20% increase in train lengths and operational days per week by 2033 in the Preferred Scenario.
The above approach arrived at unconstrained rail freight demand forecasts. By basing the mode share calculations on operational cost reductions and ignoring capacity, the result could therefore be high volumes of demand for rail traffic. In some locations, this may exceed the available capacity.
For the 2033 Preferred Scenario we assumed that rail capacity would be made available to cater for this forecast demand, and that confidence in the ability of the rail network operator to deliver this capacity would ensure that developers are prepared to invest in these MDPs. Currently many potential MDP developers lack the confidence that there will be sufficient rail capacity and are therefore discouraged from investing.
Our report therefore endorses various schemes that could increase the capacity available for freight services on the rail network. In representing this extra rail freight capacity within the modelling process, we have not been prescriptive in how this extra capacity should be made available.
By comparison, our 2033 Do Minimum scenario took a less optimistic view of the capacity that would be made available to rail freight and assumed that potential intermodal rail traffic would be suppressed such that it would only maintain its market share versus road – i.e. it would grow in line with forecast trade growth (+52% to 2033). In some areas this may be achievable without capacity enhancement. For currently-constrained routes, such as the Felixstowe branch line, to achieve the 52% growth in our Do Minimum scenario would probably require either:

30 | Northern Freight & Logistics Report: Technical Appendices | 31
n A modest capacity infrastructure enhancement scheme (e.g. extension of existing passing loop);
n Freight being given a higher priority over passenger trains;
n Joining trains departing from Felixstowe together; or
n Shuttling containers by road from Felixstowe to a rail terminal at Ipswich.
Bulk Traffics
Bulk traffics (e.g. construction materials, fuels etc.) tend to be more difficult to represent in a generalised way in transport models than unitised cargo. We have attempted to consider some bulks in detail for the rail forecasts in the 2033 Do Minimum scenario. However the differences between the Do Minimum and the Preferred Scenarios are relatively modest.
The differences between our Do Minimum scenario and Preferred Scenario for bulk rail traffics are:
n Average timetabled origin-to-destination speeds increased on cross Pennine routes – to be in line with typical speeds on the rest of the network – thus reducing rail costs.
n The Buxton – Matlock line is re-instated – to allow a more direct route towards the South East from the Peak District quarries, which also facilitates faster passenger trains on the Hope Valley route (modelled but from a practical point of view this could be an alternative equivalent solution).
n An additional 1 million tonnes of construction materials from the Peak District quarries serving the South East markets, building on the small traffic volumes that are already transported to this market.
Bulk road traffics were assumed to enjoy the cost reductions associated with the road network improvements of the 2033 Preferred Scenario.
Road Assignment
GBFM’s road assignment function was used to assign all the HGV traffic emerging from the various models to the road network described above. HGVs travelling from each origin to destination were assigned to the lowest generalised cost route. The outputs were:
n Road assignment to the road network (number of HGVs on each road link);
n Road distance for each OD; and
n Road HGV travel time for each OD.
Rail Assignment
Base year traffics (origins, destinations and routings) were taken directly from Network Rail data. For established traffics forecast to continue into the future, current routings on the network were assumed to continue.
For new traffics in the 2033 Preferred scenario (intermodal containers and construction materials from the Peak District to the South East), a realistic route was assumed, adhering, in the case of intermodal traffic, to a route with sufficiently high bridges to allow large standard containers on standard wagons (W10 loading gauge or above) to be transported.
The Buxton – Matlock route was assumed to be re-instated and aggregates trains from the Derbyshire quarries were switched manually to the route (modelled but from a practical point of view this could be an alternative equivalent solution).
User Financial Costs
A measure of the benefits to industry of the 2033 Preferred Scenario versus the 2033 Do Minimum scenario is a calculation of the difference between the total user financial costs in each scenario. The financial costs can be considered as the haulage rates that a company would have to pay for their haulage (road, rail, shipping and waterway) requirements to be carried out. Operating cost savings as a result of the switch of some warehousing to the North (lower land and labour costs) were also added.
The costs were calculated using freight transport cost models for each mode or sector:
n Road: Based on HGV distance and time for each origin to destination through the network
n Rail: Based on distance estimates for each origin to destination and typical timetabled speeds across the network
n Deep sea LoLo: Relative costs taken from the End to End model.
n Extra waterways traffic (Aire and Calder to Leeds): Costs estimated on the basis of the size of barge that can be accommodated and achievable utilisation.
n European unitised shipping costs: ferry cost models based on charter rates, crewing costs, ship size, fuel prices, distance and frequency
n European inland costs based on a road cost model combined with rail cost model for longer distances
n Warehousing: based on typical land and labour costs by county
The total user financial costs for the 2033 Do Minimum and 2033 Preferred scenarios were calculated so that the impact of the recommendations in terms of financial costs could be determined. To represent the costs experienced by British industry, all costs associated with overseas traffic were halved (road and rail to/from ports, deep sea LoLo, European unitised shipping and associated European inland costs).
A.4.6 Modelling to Represent the Alternative Scenario Bundles in 2033
As described in Section A.4.5 above, each bundle was based on the Preliminary Central scenario but had a set of alternative assumptions that needed to be represented in the modelling for 2033 and to allow an assessment of whether they should be included in the 2033 Preferred scenario. The following sections describe how these alternative bundles were modelled.
A.4.6.1 Roads Bundle Part 1: The New Manchester – Sheffield Trans-Pennine Road Route
The report recommendations are not dependent on the proposed new Manchester – Sheffield Trans-Pennine road route, but this is a high profile scheme for which the consultancy team wanted a separate test in order to evaluate the freight benefits separately. We therefore ran a separate scenario based on the Preliminary Central scenario, but with the proposed new Manchester – Sheffield Trans-Pennine road route added to the road network for road assignment in GBFM.
The road was added as a motorway standard road (with typical HGV motorway average speeds) linking the M67 to the M1 junction 35A in line with the potential alignment suggested by the study team dedicated to evaluating this road.
The modelling suggested that the road would attract a significant volume of traffic, relieving the M62, A628, A50 and M6, but increasing traffic on its feeder routes (including the south and west sections of the M60 and the M1 and M18).

32 | Northern Freight & Logistics Report: Technical Appendices | 33
The user benefits of the diverted traffic were estimated in the modelling by calculating the reduced generalised cost (based on journey distance and time) for traffic that used the route, without changing the average HGV speeds on other links. One of the significant benefits that the freight modelling was therefore unable to capture satisfactorily is the congestion-reducing effects on the relieved roads (e.g. the M62). In reality the M62 would be more free-flowing, with resultant lower haulage costs for the remaining traffic. However in contrast, the feeder routes would be likely to be more congested. Overall our modelled freight user cost benefits of building the new road (£37m per year in 2033 in 2014 prices) are likely to be a conservative estimate of the true value to freight of the new road link.
A.4.6.2 Roads Bundle Part 2: Road Trains
This scenario built on the Roads Part 1 scenario and incorporated a representation of road trains on Northern motorways and other key A roads including those to access ports (A66, A1, A69, A19, A174 Tees, A194 Newcastle, A180 Immingham, A63 Hull, A5036 Liverpool, A463 Heysham).
Road trains were represented as three HGVs running nose-to-tail with just one driver, so the benefit in user cost terms was only having to pay for one driver instead of three along those sections of the route. This would require:
n The technology to do this (involving an extra cost, but probably not excessive per vehicle if introduced on a wide scale);
n Parking areas with driver facilities to join and separate vehicles;
n Drivers to be appropriately trained;
n Organising such joining - with appropriate vehicles ‘finding’ each other. This would probably be done electronically as vehicles arrived; and
n Organising splitting - with appropriate drivers being in the right place at the right time.
The above would all create challenges that would increase costs, and not all HGV movements would be appropriate for road-train movements. We represented these costs as an extra 20 minutes of HGV time in order to join the road-train ‘network’, such that for all origin to destination journeys, the lowest cost solution was chosen:
n Standard HGVs with standard costs, or
n Lower road-train costs for the portion of the journey that is on the road-train network PLUS 20 minutes of HGV time.
Therefore it only became worthwhile using the road-train network if the savings were worth more than 20 minutes of HGV time.
The true costs may, in reality, be more than 20 minutes, but if there were dedicated HGV lanes (as described in the roads bundle), potentially more than 3 HGVs could join together, and also fuel costs would be lower for following vehicles due to slip-streaming to reduce costs further.
We modelled a relatively simple representation of road train costs - with driver wage costs per HGV scaled down to 5/12 of their 2033 levels along these routes
A.4.6.3 Roads Bundle Part 3: Removal of Road Tolls in the North of England
This scenario built on the Roads Part 2 scenario and incorporated the removal of road tolls on major routes in Northern England. This involved removing the tolls on the Mersey tunnels, the Mersey Gateway (once the new bridge is open), the Humber Bridge and the Tyne tunnels.
The user benefits were simply calculated by multiplying the assigned HGVs using these tolled links by the road tolls paid resulting in £27m per year spent in HGV tolls in 2033 in current prices.
A.4.6.4 Rail Bundle
The modelled assumptions included over-and-above the Preliminary Central scenario were:
n Piggyback (unaccompanied trucks on trains) services between Immingham and West Manchester. As far as the user is concerned, within GBFM these are effectively extensions of Immingham’s existing unaccompanied ferry services with a six times a day service frequency in each direction.
n Up to 1500 metre intermodal trains. This effectively doubles the length of intermodal trains in the Preliminary Central scenario.
The piggyback services were assigned to the rail network along the shortest existing route. This implicitly assumed that this route would be upgraded to have sufficiently high bridges / tunnels to accommodate the piggyback traffic. If piggyback services were to be developed, the most sensible option might be to use a new tunnel through the Pennines, perhaps for use by passenger services as well as piggyback freight services.
The double-length intermodal trains would require either two locomotives or a very powerful single locomotive. They have a reduced cost per container (largely due to halving the number of drivers required). This results in more traffic being transported by means of intermodal rail freight services rather than by road. However in terms of network capacity, the more significant result is that far fewer trains are required because only half as many trains are needed for a given number of containers. Each of these long-train timetabled paths uses slightly more capacity than a standard train path, particularly at low speed. Accommodating these very-long trains would require significant network upgrade in terms of longer passing loops and reception sidings.
A.4.6.5 Water Bundle
The modelled assumption included over-and-above the Preliminary Central scenario was that all unitised services carrying European trade to/from Northern ports (i.e. short sea LoLo & ro-ro services, excluding deep sea feeder services) are subsidised to the value of £50 per unit.
In GBFM these reduced user costs generated extra traffic at Northern ports which justified correspondingly larger ships (which would have lower costs per unit due to economies of scale) which would generate yet more traffic.
Following iterations within the modelling, 30% more traffic justified ships that were 30% larger, which approximately related to 10% lower costs per unit based on our ferry cost models (approximately £20 further reduction in ferry costs per unit). Therefore the £50 subsidy resulted in a £70 reduction in user costs per unit.
A.4.6.6 Environmental Bundle
The components of the environmental bundle were:
n The introduction of Low Emission Zones (LEZs) in the main conurbations in the North and/or packages of measures to encourage sustainable ‘last mile’ deliveries.
n A network of Urban Logistics Centres (ULCs), with rail connections for inbound loads and consolidation of loads for outbound ‘last mile’ deliveries in urban centres.
In order to carry out the modelling of this bundle we assumed that the origins, destinations and routes of HGVs remained the same as for the Preliminary Central scenario, but that any HGV entering a LEZ had to

34 | Northern Freight & Logistics Report: Technical Appendices | 35
switch traction (from diesel to electric or other very-low-emission propulsion) as it enters the zone. This could be achieved in a number of ways:
n Hybrid HGVs switching to electric (or other ultra-low-emission fuels) upon entering the LEZ; or
n Articulated lorries arriving at a parking area on the boundary and switching to ultra-low-emission tractor units.
The local emissions component of environmental costs related to the freight deliveries within the LEZs can then be removed.
For the purposes of the modelling, we have defined the LEZs as the city centre areas of Liverpool, Manchester, Sheffield, Leeds, Hull and Newcastle, where the city centres are typically defined by a ring road. For example, the Liverpool LEZ was bounded by the A5058.
Along with the beneficial environmental impact (reduced local pollution), there would be extra operational costs. We have assumed in the modelling that some public sector intervention would be required so that, as far as the user is concerned, the extra costs could be represented as an extra 30 minutes per vehicle to transport freight to or from an LEZ. This would assume that, for example, the electric vehicles would be subsidised by the public sector to avoid increasing user costs beyond the 30 minutes required to switch traction (or the equivalent extra cost for running a hybrid) and that the land areas provided for this switch would be provided by the public sector.
An alternative response that the distribution and road haulage industry may make to this policy could be to build Urban Consolidation Centres on the edge of LEZs. We assume that the additional operational costs would be broadly equivalent to the 30 minutes per vehicle for the traction-switch.
A.4.7 Approach to Producing Outputs for 2023
The main focus of the modelling for the Preferred Scenario has been on 2033. It was assumed in the modelling for 2033 that all the interventions by the public sector would have been implemented by 2033 and in knowledge and expectation of these measures, the market would have adjusted so that, for example, private sector ports would have invested in infrastructure and private sector developers would have invested in MDPs.
However by 2023, some of these measures would be in place, while others would not as we would not expect the market to have fully adjusted. To fully model a preferred scenario for 2023 would require a judgement to be made on which investments would have happened and which would not (for example which ports had invested in LNG facilities or which MDP sites had been built).
Our approach has been to assume that the market responds steadily up to 2033, such that each MDP is partly built by 2023 and each port accommodates some LNG vessels and some HFO (standard fuel) vessels. While this may not be a completely realistic representation of 2023 (because some MDPs will be fully developed and some will not have started), we believe this approach allows results to be arrived at that represent a realistic 2023 in aggregate and assuming partial development by 2023 avoids the need to pick short term ‘winners’.
A more realistic 2023 Do Minimum scenario (as described in the TfN Freight and Logistics Baseline Report) is simpler to define because no decisions were required to pick ‘winners’. Taking the above into account, our approach to representing the Preferred scenario for 2023 is to assume that the impact of the recommendations felt in 2033 steadily comes into effect with 2017 being the first year that any impact is felt. Mathematically the results were represented as:
2023 Preferred Scenario = 2023 Do Minimum + 7/17 x (2033 Preferred Scenario - 2033 Do Minimum Scenario)
A.5 Appraisal
The diagram presented in Figure A.6 summarises the key stages of the modelling and appraisal process; namely, inputs to the modelling and assessment methods provided outputs which were then used for wider appraisal of possible future scenarios.
Figure A.6: Appraisal Process
The process produced the outputs listed in Table A.8 to facilitate appraisal.
36 | Northern Freight & Logistics Report: Technical Appendices | 37
Table A.8: Data and Modelling Outputs Used in Appraisal
Rail Freight Road Freight / HGV
Origin-Destination (OD) Matrix:
n Origin (terminal name and (old) county name)
n Destination (terminal name and (old) county name)
n Tonnes
n Number of trains run
n Number of hourly paths required
n Distance
n Time
n User cost per tonne
Assignment map
Origin-Destination (OD) Matrix:
n Origin postcode district (PCD)
n Destination PCD
n Indicator as to whether related to port traffic (import / export) or domestic
n If port traffic, whether it is European unitised (mostly ferry) traffic
n HGV type
n Tonnes
n Distance
n Time
n User costs per tonne within GB. However for European unitised (mostly ferry) traffic, this will include the continental haulage and ferry costs, so that user benefits of switching from Dover Straits to a North Sea ferry route can be captured.
n Environmental cost2
Assignment map
Ports Waterways
Origin-Destination (OD) Matrix:
n Port
n Direction (in or out)
n Cargo type
n Tonnes
n Units (if unitised)
Deep sea container shippingAssuming the L2 berth allows Liverpool to attract more deep sea services to/from America, there may be changes to shipping costs as well as inland costs.
Origin-Destination (OD) Matrix:
n Origin terminal
n Destination terminal
n Tonnes
n Tonnes per vessel
n User costs per tonne
Warehousing These Outputs will be Created for:
Private sector’s demand for space – square metres of medium / large (>9,000 m2) warehousing, mapped by county boundaries.
n The base year (2014)
n Do-minimum 2033
n Preferred bundle 2033
2
A.5.1 Scope of Appraisal
The scope of appraisal that has been adopted to test the six scenarios identified is summarised below, in three categories:
1. Application of appropriate Department for Transport WebTAG (Web-based Transport Analysis Guidance) appraisal categories;
2. Detailed environmental appraisal using the Mode Shift Revenue Support (MSRS) environmental benefits method (April 2015), Mode Shift Benefit (MSB) Values (April 2014) and WebTAG: TAG Unit A3
2 As per Mode Shift Benefit values - Table 2 of: https://www.gov.uk/government/uploads/system/uploads/attachment_data/file/389725/mode-shift-benefit-values-refresh.pdf
Environmental Impact Appraisal (November 2014); and
3. Wider economic assessment using Mott MacDonald’s Transparent Economic Assessment Model (TEAM), which has been designed in-line with HM Treasury Green Book and HCA Additionality Guide principles.
The sections below provide further comment on our approach to appraisal for each category.
A.5.1.1 (1) WebTAG: An Overview of Transport Appraisal
WebTAG consists of software tools and guidance on transport modelling and appraisal methods that are applicable for highways and public transport interventions. These facilitate the appraisal and development of transport interventions, enabling analysts to build evidence to support business case development and ultimately to inform investment funding decisions. Development of analysis using WebTAG guidance is a requirement for all interventions that require Government approval. For interventions that do not require government approval this guidance serves as a best practice guide 3.
To demonstrate application of standard transport appraisal practice against the preferred recommendations, the use of categories in the WebTAG process is demonstrated in Table A.9.
3 Transport analysis guidance: An overview of transport appraisal, January 2014 (Department for Transport)

38 | Northern Freight & Logistics Report: Technical Appendices | 39
Table A.9: Application of WebTAG in Appraisal
WebTAG Category of Impacts
Sub-Impacts Applicability (Y/Indirect/N)
Comment Appraised? (Y/N)
Economy
Business users & transport providers Y Subject to quantitative
appraisal Y
Reliability impact on Business users Y Subject to qualitative
appraisal Y
RegenerationY
Subject to quantitative appraisal (see Appendix C.3.2)
Y
Wider ImpactsY
Subject to quantitative appraisal (see Appendix C.3.2)
Y
Environment
Noise Indirect Core theme – appraisal undertaken Y
Air Quality Y Core theme – appraisal undertaken Y
Greenhouse gases Y Core theme – appraisal undertaken Y
Landscape
Indirect
Initial assessment undertaken to determine whether variable is within scope for assessment
Y
Townscape
Indirect
Initial assessment undertaken to determine whether variable is within scope for assessment
Y
Heritage of Historic resources Indirect
Initial assessment undertaken to determine whether variable is within scope for assessment
Y
Biodiversity
Indirect
Initial assessment undertaken to determine whether variable is within scope for assessment
Y
Water Environment
Indirect
Initial assessment undertaken to determine whether variable is within scope for assessment
Y
WebTAG Category of Impacts
Sub-Impacts Applicability (Y/Indirect/N)
Comment Appraised? (Y/N)
Social
Commuting and Other users Indirect Subject to quantitative
appraisal Y
Reliability impact on Commuting and Other users Indirect
Not covered by study objectives – therefore deemed to be beyond scope for appraisal
N
Physical activity
N
Not covered by study objectives – therefore deemed to be beyond scope for appraisal
N
Journey quality
Indirect
Not covered by study objectives – therefore deemed to be beyond scope for appraisal
N
Accidents N Subject to quantitative appraisal Y
Security
Indirect
Not covered by study objectives – therefore deemed to be beyond scope for appraisal
N
Access to services
Indirect
Not covered by study objectives – therefore deemed to be beyond scope for appraisal
N
Affordability
N
Not covered by study objectives – therefore deemed to be beyond scope for appraisal
N
Severance
Indirect
Not covered by study objectives – therefore deemed to be beyond scope for appraisal
N
Option values
N
Not covered by study objectives – therefore deemed to be beyond scope for appraisal
N
Public Accounts
Cost to Broad Transport Budget Y Subject to quantitative
appraisal Y
Indirect Tax Revenues Y Subject to quantitative appraisal Y
Transport Economic Appraisal
The requirements of WebTAG for transport economic appraisal including cost benefit analysis are set out in a series of units. The units of particular relevance to the appraisal of the Freight and Logistics Report are:
n TAG unit A1-1 cost-benefit analysis, November 2014;
n TAG unit A1-2 scheme costs, November 2014; and
n TAG unit A1-3 user and provider impacts, November 2014.

40 | Northern Freight & Logistics Report: Technical Appendices | 41
If WebTAG is followed the outcome of a transport economic appraisal is a series of standard proforma, which present key costs and benefits of the recommendations or scheme being appraised. Key outputs are:
n User Benefits – travel time, vehicle operating costs and user charges presented by purpose and mode.
n Private Sector Provider Impacts – including revenue, operating costs, investment costs and grant/subsidy.
n Impact on Public Accounts – revenue, operating costs, investment costs, developer and other contributions, grant/subsidy payments and the impact of Indirect tax revenues, presented for local and central government.
n The overall impacts – Present Value of Benefits (PVB), cost to broad transport budget, Present Value of Costs (PVC), Net Present Value (NPV) and Benefit to Cost Ratio (BCR).
Results are presented for an appraisal period, usually 60 years, with all costs given in a consistent price base and discounted to a present value year.
The measures developed as part of the Freight and Logistics Report recommendations have been modelled using GBFM, as described in Appendix A.4. Outputs from the model have been used to calculate the benefits of the report's recommendations measures. The early stage of development of the recommendations, where many of the schemes are conceptual and have limited costs information associated with them or potential opening dates precludes the calculation of a full transport cost benefits analysis in line with WebTAG guidance. However, the outputs from GBFM allow some key economic metrics to be presented.
Detailed guidance on the application of GBFM to the current study is provided in Appendix A.4. In summary, using outputs from GBFM, freight transport costs have been calculated for each origin and destination on a commodity and mode basis. These are based on unit costs of freight transport, which are available by commodity and mode, and reflect industry costs. This calculation has been undertaken for both the Do Minimum and Do Something scenarios. The overall benefits have been calculated by summing up the costs across all origins and destination, and modes and commodities in both scenarios and comparing the differences. As there is no change in overall freight demands between each origin-destination pair, the change in freight industry costs equate to user benefits.
The freight industry costs include all operating costs (vehicle operating costs for rail, road and sea, manpower, intermodal transport costs, labour, track access costs etc.) and investment costs (i.e. additional HGVs, railway wagons etc.).
Therefore from GBFM, freight user costs and private sector provider impacts have been quantified.
Marginal external costs (MECs) have been derived by applying ‘Mode Shift Benefit’ values (or MSB values) to the change in HGV kilometres with the report recommendations in place. The MSB values were derived from a study undertaken by the Department for Transport in 2009 (‘Mode Shift Benefit Values – Technical Report’ - Department for Transport, April 2009) and refreshed in 2014 (‘Mode Shift Benefit Values Refresh’ - Department for Transport, December 2014). The methodology is also explained in the Department for Transport’s document ‘Guide to Mode Shift Revenue Support (MSRS) Scheme’, which is discussed further in Appendix A.5.1.2 which details the environmental appraisal undertaken for the report.
The MSB values reflect the following external elements:
n Congestion;
n Accidents;
n Noise;
n Pollution;
n Climate Change;
n Infrastructure;
n Other Road Costs;
n Taxation; and
n Rail or Water costs.
The congestion benefits derived from the MECs are therefore a proxy for the user benefits for commuters and other users.
It is not possible for the appraisal to quantify the full impact on the public accounts, as there is no information on the cost to government of the schemes. It has been possible to provide partial information on the impact from the non-user benefit analysis on indirect taxation revenues (based on the MSB approach).
A stream of benefits for the preferred recommendations has been calculated over a 60 year appraisal period (2017 to 2076), converted into market prices at a consistent price base and discounted to the present value year (2010) in line with WebTAG.
Two forecast years have been adopted and explicitly modelled: 2033 and 2043, with the approach to calculating benefits defined as follows:
n Opening Year (assumed to be 2017) to 2033 - benefits linearly interpolated;
n 2033 to 2043 – benefits linearly interpolated; and
n 2043 to 2076 – benefits held constant at 2043 levels.
A.5.1.2 (2) Environmental Appraisal
This section details the method for the environmental appraisal of the six scenarios proposed, which includes:
n Review of the environmental context identified in Phase 1 (Baseline Report);
n Method:
– Overview of the Mode Shift Revenue Support (MSRS) environmental benefits method (April 2015)
– Overview of the proposed WebTAG: TAG Unit A3 Environmental Impact Appraisal (November 2014); and
n Summary.
The methodology adopted for the high level environmental appraisal of the report takes a lead from two guidance documents produced by the Department for Transport as follows:
n Guide to Mode Shift Revenue Support (MSRS Scheme) (April 2015); and
n WebTAG: TAG Unit A3 Environmental Impact Appraisal (November 2014).
A short summary of each guidance document is provided below.
Mode Shift Revenue Support
The MSRS scheme assists companies with the operating costs associated with running rail or inland water freight transport instead of road, where rail or inland waterway transport is more expensive.
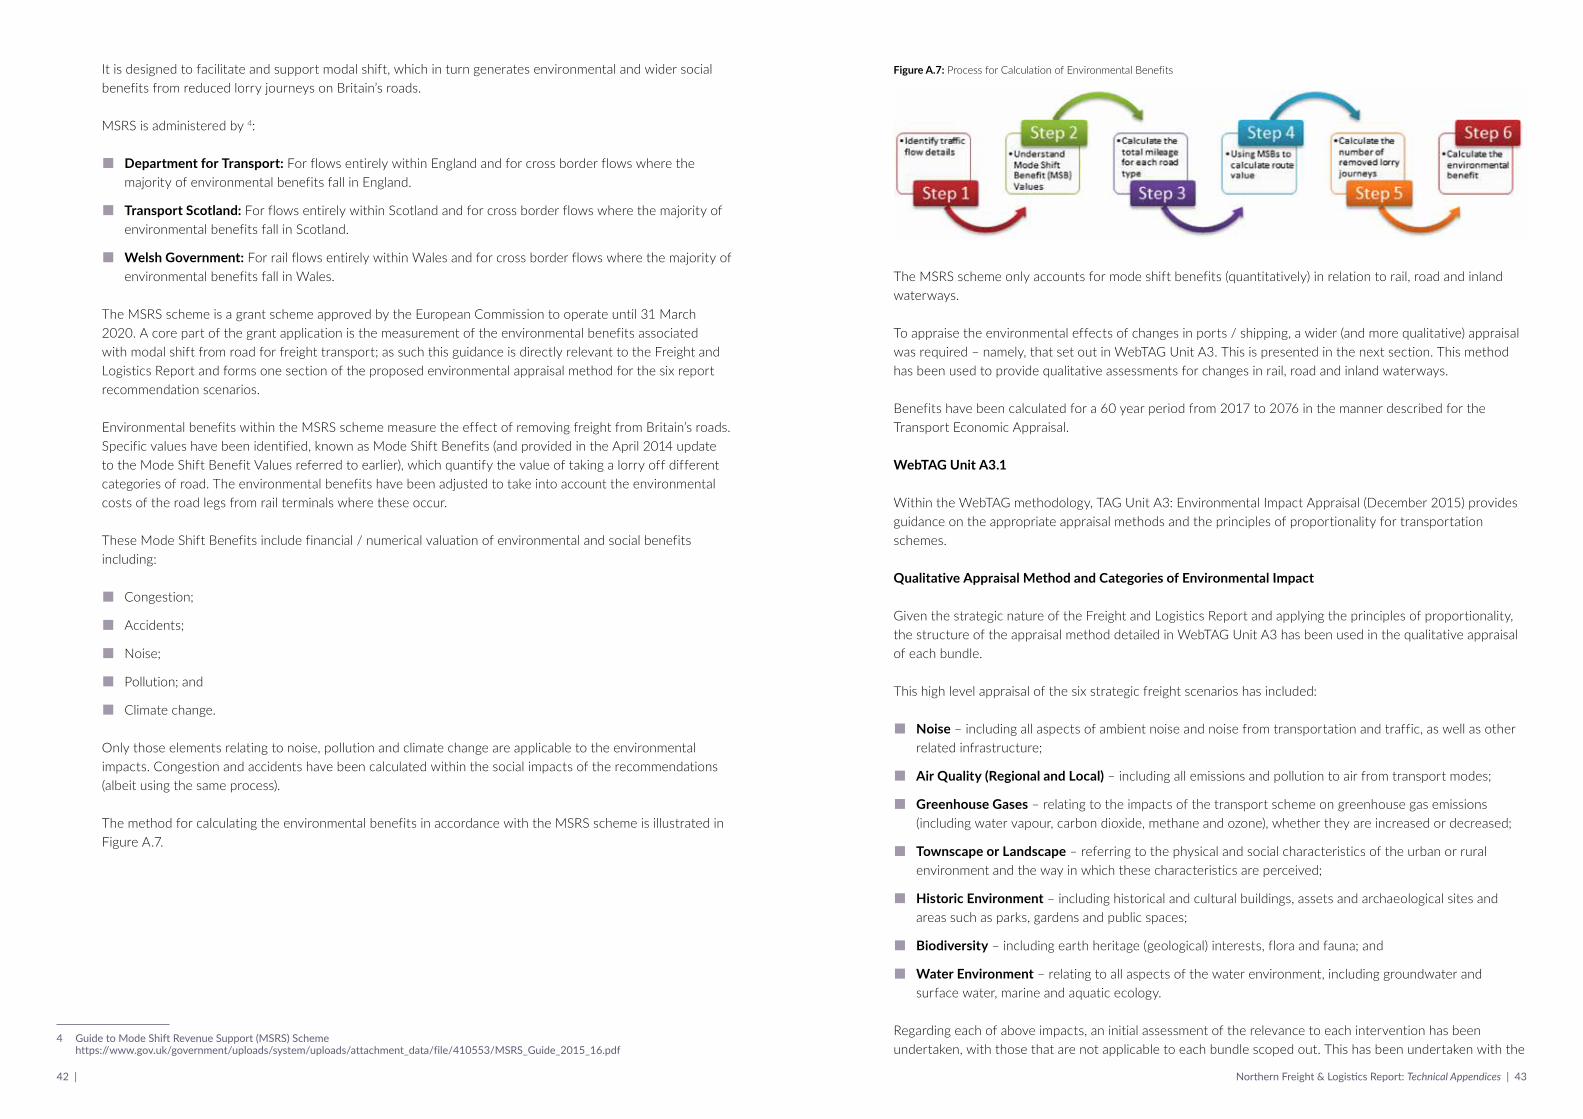
42 | Northern Freight & Logistics Report: Technical Appendices | 43
It is designed to facilitate and support modal shift, which in turn generates environmental and wider social benefits from reduced lorry journeys on Britain’s roads.
MSRS is administered by 4:
n Department for Transport: For flows entirely within England and for cross border flows where the majority of environmental benefits fall in England.
n Transport Scotland: For flows entirely within Scotland and for cross border flows where the majority of environmental benefits fall in Scotland.
n Welsh Government: For rail flows entirely within Wales and for cross border flows where the majority of environmental benefits fall in Wales.
The MSRS scheme is a grant scheme approved by the European Commission to operate until 31 March 2020. A core part of the grant application is the measurement of the environmental benefits associated with modal shift from road for freight transport; as such this guidance is directly relevant to the Freight and Logistics Report and forms one section of the proposed environmental appraisal method for the six report recommendation scenarios.
Environmental benefits within the MSRS scheme measure the effect of removing freight from Britain’s roads. Specific values have been identified, known as Mode Shift Benefits (and provided in the April 2014 update to the Mode Shift Benefit Values referred to earlier), which quantify the value of taking a lorry off different categories of road. The environmental benefits have been adjusted to take into account the environmental costs of the road legs from rail terminals where these occur.
These Mode Shift Benefits include financial / numerical valuation of environmental and social benefits including:
n Congestion;
n Accidents;
n Noise;
n Pollution; and
n Climate change.
Only those elements relating to noise, pollution and climate change are applicable to the environmental impacts. Congestion and accidents have been calculated within the social impacts of the recommendations (albeit using the same process).
The method for calculating the environmental benefits in accordance with the MSRS scheme is illustrated in Figure A.7.
4 Guide to Mode Shift Revenue Support (MSRS) Scheme https://www.gov.uk/government/uploads/system/uploads/attachment_data/file/410553/MSRS_Guide_2015_16.pdf
Figure A.7: Process for Calculation of Environmental Benefits
The MSRS scheme only accounts for mode shift benefits (quantitatively) in relation to rail, road and inland waterways.
To appraise the environmental effects of changes in ports / shipping, a wider (and more qualitative) appraisal was required – namely, that set out in WebTAG Unit A3. This is presented in the next section. This method has been used to provide qualitative assessments for changes in rail, road and inland waterways.
Benefits have been calculated for a 60 year period from 2017 to 2076 in the manner described for the Transport Economic Appraisal.
WebTAG Unit A3.1
Within the WebTAG methodology, TAG Unit A3: Environmental Impact Appraisal (December 2015) provides guidance on the appropriate appraisal methods and the principles of proportionality for transportation schemes.
Qualitative Appraisal Method and Categories of Environmental Impact
Given the strategic nature of the Freight and Logistics Report and applying the principles of proportionality, the structure of the appraisal method detailed in WebTAG Unit A3 has been used in the qualitative appraisal of each bundle.
This high level appraisal of the six strategic freight scenarios has included:
n Noise – including all aspects of ambient noise and noise from transportation and traffic, as well as other related infrastructure;
n Air Quality (Regional and Local) – including all emissions and pollution to air from transport modes;
n Greenhouse Gases – relating to the impacts of the transport scheme on greenhouse gas emissions (including water vapour, carbon dioxide, methane and ozone), whether they are increased or decreased;
n Townscape or Landscape – referring to the physical and social characteristics of the urban or rural environment and the way in which these characteristics are perceived;
n Historic Environment – including historical and cultural buildings, assets and archaeological sites and areas such as parks, gardens and public spaces;
n Biodiversity – including earth heritage (geological) interests, flora and fauna; and
n Water Environment – relating to all aspects of the water environment, including groundwater and surface water, marine and aquatic ecology.
Regarding each of above impacts, an initial assessment of the relevance to each intervention has been undertaken, with those that are not applicable to each bundle scoped out. This has been undertaken with the

44 | Northern Freight & Logistics Report: Technical Appendices | 45
exception of the three core themes of Noise, Air Quality and Greenhouse Gases, which have been considered for each scenario as a matter of course. The analysis has been presented using a seven-point scale of beneficial, neutral or adverse in the same manner as WebTAG. This allows the positives of the interventions to be clearly demonstrated while also providing a framework for mitigating any negative impacts.
At this stage, it is not considered appropriate to consider environmental impacts during, or as a result, of construction due to the short temporal nature of the construction impacts compared to those associated with operational effects. Therefore, the environmental appraisal has only analysed the operational environmental effects of the Freight and Logistics Report recommendations.
Summary
The environmental appraisal of the six different scenarios for the Freight and Logistics Report recommendations has considered the potential environmental effects using the methodology described above. The environmental appraisal has been undertaken in a manner compliant to the MSRS scheme (April 2015) (and therefore with overlap to the transport appraisal also described in this Appendix) and WebTAG Unit A3.1 Environmental Impact Appraisal (December 2015) to provide a combined quantitative and qualitative appraisal of the bundles to illustrate the likely environmental effects and to inform the wider decision making process.
A.5.1.3 (3) Wider Economic Assessment
The forecasting process outlined in Appendix C.3.2 produces a series of demand forecasts linked to the optimal location for future freight and logistics activity. This is expressed in terms of demand for B8 warehousing and logistics floor space in medium to large scale units in excess of 9,000m². The geographical unit for this demand is at Regional level. The increased demand for land and premises is triggered in the forecasting work by the interventions set out in the bundle scenarios. The demand for land and premises was then translated into economic benefits expressed in terms of job numbers (Full-Timed Equivalent (FTE)) and Gross Value Added (GVA). This was done using Mott MacDonald’s Transparent Economic Assessment Model (TEAM).
TEAM has been designed in-line with HM Treasury Green Book and Homes and Communities Agency (HCA) Additionality Guide principles. It also aligns to emerging thinking on how non-welfare wider economic benefits should be considered. TEAM has been operational for three years and used on numerous assessments of transport-related work in that time 5. The diagram presented in Figure A.8 shows how TEAM models direct, indirect and induced benefits arising from an intervention; in this instance the interventions proposed in the Freight and Logistics Report recommendations that lead to a change in demand for land and premises.
Figure A.8: TEAM Modelling Process
5 For example: in support of MSBCs for transport schemes (including Knowsley Industrial Park, North Liverpool Corridors, Maghull North passenger rail station, Newton le Willows Interchange, Chester Interchange), economic case for rail schemes (High Speed Rail to Hastings and Bexhill, March-Wisbech Rail Reopening), highway schemes for Highways England (M49 Avonmouth, M20 J10a Ashford, A27 Chichester, M6 J22 St Helens) and link road studies such as the FARRRS scheme in South Yorkshire (Phases 1 and 2). It has also been used to support schemes through the planning process including Public Inquiries for the successful DCO application for Norwich Northern Distributor Road and the Postwick Hub Scheme (where the data from TEAM assisted in transforming a previously negative BCR into a positive one).
n The key outputs from this assessment are jobs and GVA set out as follows: Direct benefits – jobs and GVA linked to the volume of floor space identified by Region; this is jobs on site calculated through the application of floor space and employment density levels for B8 warehousing and logistics uses.
n Indirect benefits – jobs and GVA in the supply chain serving the businesses located in the new premises; this is calculated through applying a multiplier value to the direct benefits which represents the value of successive rounds of spending in the supply chain from the additional direct benefits.
n Induced effects – the consumption effects of additional people employed directly and indirectly and spending their disposable incomes; this is again calculated through a multiplier value to represent successive rounds of consumption expenditure that may not otherwise occur.
TEAM is set up to deliver a default analysis based on the data already held within it, for example it is pre-loaded with: development plot ratios; employment densities by land use classification (e.g. B1 office, B2 industrial, B8 warehousing etc.); multiplier values that are derived from the HCA’s Additionality Guide (but which can be overridden if there is sufficient data/information to provide a more insightful view on economic linkages); and GVA values derived from the Office of National Statistics (ONS) but set at employee level rather than per head of population level. This allows TEAM to produce a series of outputs linked to scenarios relatively quickly and for the results to be calibrated to different spatial units given the granularity of data already sitting in the model. For example, the GVA figures will differ between areas.
Benefits have been articulated at gross level (the full capacity of the new land and premises demanded) and net level (the gross position reduced to account for deadweight, displacement and leakage). Again, TEAM is pre-loaded with default data on deadweight, leakage and displacement (from the HCA Additionality Guide) which allows the default version of our analysis to be produced relatively quickly. The net jobs and GVA figures are the key metrics from this analysis. A Present Value for the GVA is also calculated and a 30 year appraisal period is used as this links the economic benefits to the reasonable persistence of jobs and economic activity arising as a result of the report's recommended interventions. This is shorter than the 60 year transport appraisal period but it was felt that this is more attuned to the cycle of property development, business growth and employment linked to the recommended measures in the Freight and Logistics Report.
A.5.2 Appraisal Discussion
It must be recognised that the appraisal requirements are unique to the Freight and Logistics Report; therefore the methodology cannot be mapped exactly onto the requirements of WebTAG. Nevertheless, an approach has been undertaken that is both sensible and pragmatic in the context of the type of study and which draws heavily on the advice set out in WebTAG to calculate the expected stream of benefits -economic, environmental and social - that is expected to ensue from the implementation of each scenario. The appraisal methodology provides valuable information to assist in the identification of the preferred recommendations.
As set out in this Appendix, at this stage we are not able to quantify scheme costs to any degree of accuracy to make a full transport cost-benefit analysis meaningful. Furthermore not all elements of the appraisal can be quantified in a monetary manner – this is typically within the elements of the environmental appraisal, where a combination of qualitative and quantitative methods was required.
For the Wider Economic Benefits calculation, it is also important to note that the method does not account for:
n Any specific quantitative analysis of inward investment gains that may occur. This is because the floor space demand data is derived from the GBFM which is fundamentally based on GB based businesses.
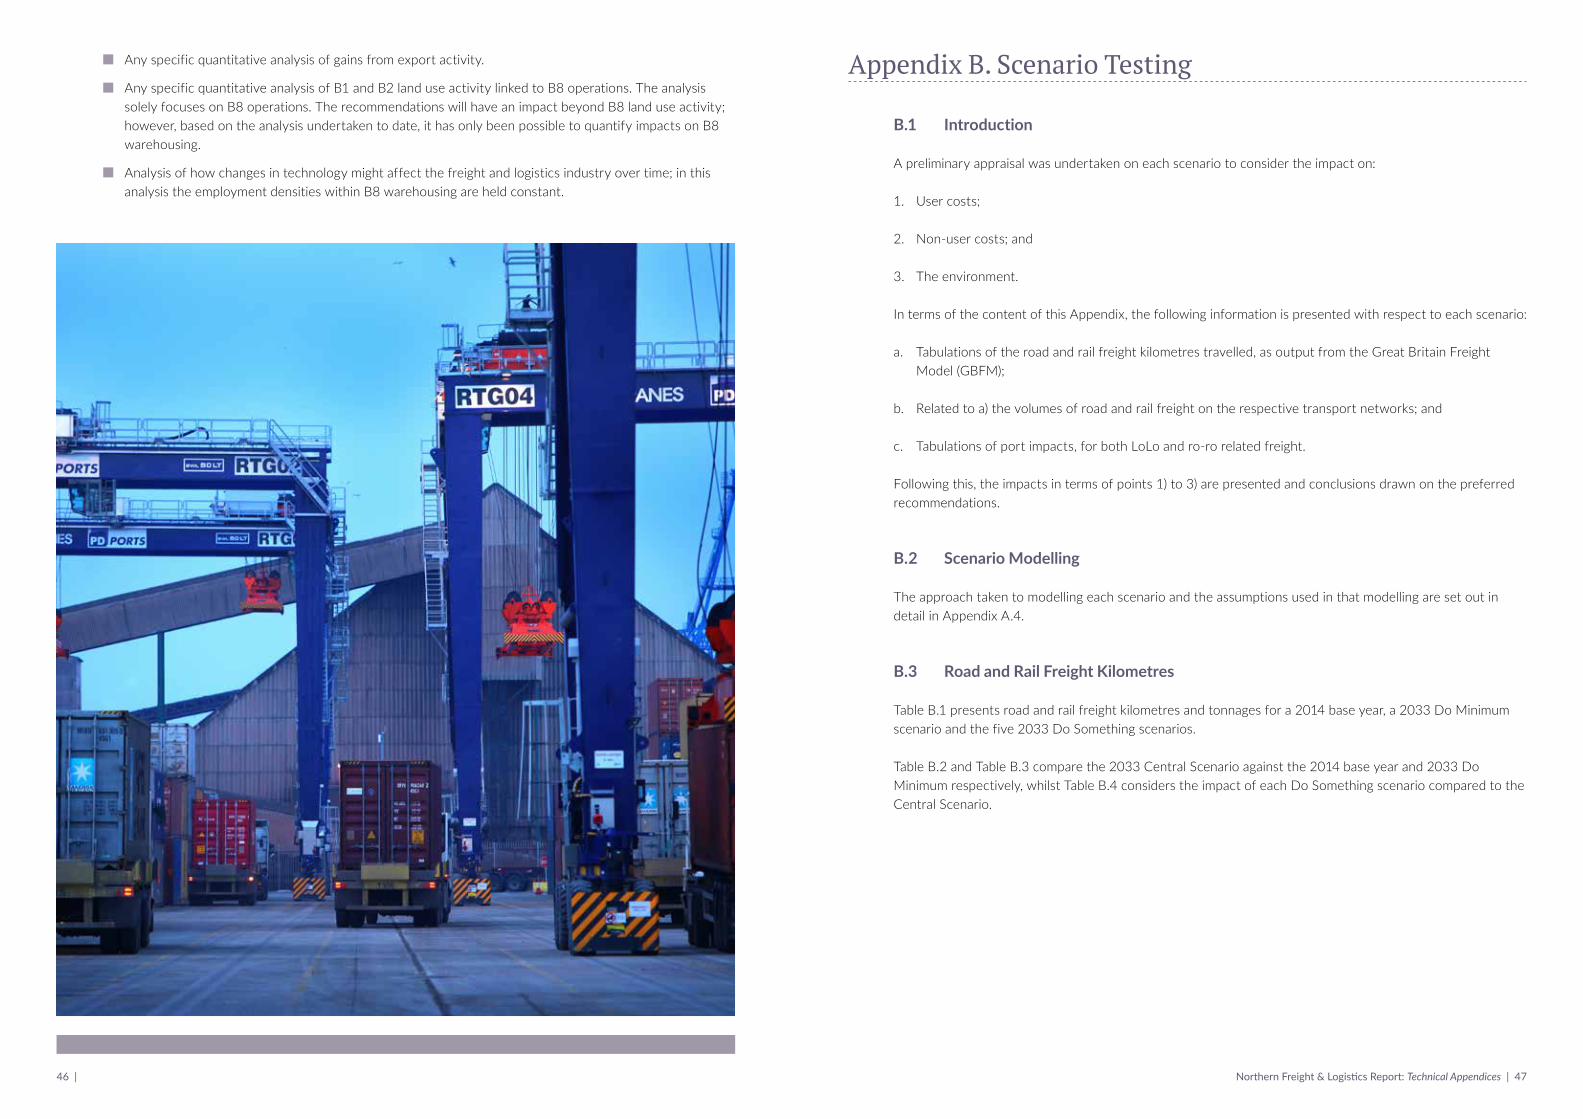
46 | Northern Freight & Logistics Report: Technical Appendices | 47
n Any specific quantitative analysis of gains from export activity.
n Any specific quantitative analysis of B1 and B2 land use activity linked to B8 operations. The analysis solely focuses on B8 operations. The recommendations will have an impact beyond B8 land use activity; however, based on the analysis undertaken to date, it has only been possible to quantify impacts on B8 warehousing.
n Analysis of how changes in technology might affect the freight and logistics industry over time; in this analysis the employment densities within B8 warehousing are held constant.
Appendix B. Scenario Testing
B.1 Introduction
A preliminary appraisal was undertaken on each scenario to consider the impact on:
1. User costs;
2. Non-user costs; and
3. The environment.
In terms of the content of this Appendix, the following information is presented with respect to each scenario:
a. Tabulations of the road and rail freight kilometres travelled, as output from the Great Britain Freight Model (GBFM);
b. Related to a) the volumes of road and rail freight on the respective transport networks; and
c. Tabulations of port impacts, for both LoLo and ro-ro related freight.
Following this, the impacts in terms of points 1) to 3) are presented and conclusions drawn on the preferred recommendations.
B.2 Scenario Modelling
The approach taken to modelling each scenario and the assumptions used in that modelling are set out in detail in Appendix A.4.
B.3 Road and Rail Freight Kilometres
Table B.1 presents road and rail freight kilometres and tonnages for a 2014 base year, a 2033 Do Minimum scenario and the five 2033 Do Something scenarios.
Table B.2 and Table B.3 compare the 2033 Central Scenario against the 2014 base year and 2033 Do Minimum respectively, whilst Table B.4 considers the impact of each Do Something scenario compared to the Central Scenario.

48 | Northern Freight & Logistics Report: Technical Appendices | 49
Table B.1: Freight km (Million) and Tonnage (Million)
2014 2033 Do Minimum
2033 Central
2033 Roads
2033 Rail
2033 Water
2033 Environ’t
GB HGV km 25,306.5 29,435.8 27,745.2 27,711.5 27,530.0 27,569.3 27,745.2
of which in the North 6,798.4 7,923.5 7,902.6 7,934.4 7,833.3 8,020.3 7,902.6
GB HGV Tonnes 1,531.2 1,737.3 1,728.5 1,728.5 1,730.0 1,728.5 1,728.5
of which to/from/within the North
537.9 639.5 671.1 671.1 671.0 692.8 671.1
GB Train kms 41.1 45.0 77.7 77.7 53.6 77.7 77.7
of which in the North 10.8 10.3 19.2 19.2 13.8 19.2 19.2
GB Rail freight tonnes 111.0 100.3 156.5 156.5 169.1 156.5 156.5
of which to/from/within the North
62.1 51.2 85.4 85.4 94.0 85.4 85.4
Source: GBFM
Table B.2: Freight km (Million) and Tonnage (Million) – Comparison against 2014 Base
2014 2033 Do Minimum
2033 Central
2033 Roads
2033 Rail
2033 Water
2033 Environ’t
GB HGV km 4,129.3 2,438.7 2,405.0 2,223.5 2,262.8 2,438.7
of which in the North 1,125.1 1,104.2 1,136.0 1,034.9 1,221.9 1,104.2
GB HGV Tonnes 206.0 197.2 197.2 198.7 197.2 197.2
of which to/from/within the North
101.6 133.3 133.3 133.1 154.9 133.3
GB Train kms 3.8 36.5 36.5 12.5 36.5 36.5
of which in the North -0.5 8.4 8.4 3.0 8.4 8.4
GB Rail freight tonnes -10.7 45.5 45.5 58.1 45.5 45.5
of which to/from/within the North
-10.9 23.3 23.3 31.9 23.3 23.3
Source: GBFM
Table B.3: Freight km (Million) and Tonnage (Million) – Comparison against 2033 Do Minimum
2014 2033 Do Minimum
2033 Central
2033 Roads
2033 Rail
2033 Water
2033 Environ’t
GB HGV km -1,690.6 -1,724.3 -1,905.8 -1,866.5 -1,690.6
of which in the North -20.8 10.9 -90.2 96.8 -20.8
GB HGV Tonnes -8.8 -8.8 -7.3 -8.8 -8.8
of which to/from/within the North
31.6 31.6 31.5 53.3 31.6
GB Train kms 32.7 32.7 8.6 32.7 32.7
of which in the North 8.9 8.9 3.5 8.9 8.9
GB Rail freight tonnes 56.2 56.2 68.8 56.2 56.2
of which to/from/within the North
34.2 34.2 42.8 34.2 34.2
Source: GBFM
Table B.4: Freight km (Million) and Tonnage (Million) – Comparison against 2033 Central Scenario
2014 2033 Do Minimum
2033 Central
2033 Roads
2033 Rail
2033 Water
2033 Environ’t
GB HGV km -33.7 -215.2 -175.9 -
of which in the North 31.7 -69.4 117.7 -
GB HGV Tonnes -0.0 1.5 - -
of which to/from/within the North
0.0 -0.1 21.7 -
GB Train kms - -24.1 - -
of which in the North - -5.4 - -
GB Rail freight tonnes - 12.6 - -
of which to/from/within the North
- 8.6 - -
Source: GBFM
Figure B.1 to Figure B.8 in Appendix B.4 present the impact of the road and rail freight (as output from GBFM) on the respective transport networks; in the first instance illustrating the impact of the Central Scenario over the Do Minimum Scenario and then the impact of each of the alternative Do Something Scenarios compared to the Central Scenario. Table B.5 provides commentary on the main points that can be drawn from the figures.

50 | Northern Freight & Logistics Report: Technical Appendices | 51
Table B.5: Summary of Impacts on the Road and Rail Networks
Scenario Road Freight Rail Freight
Central Refer to Figures B.1 and B.2
n General increase in HGV kms and tonnes from 2014 to 2033
n HGV km nationally: 2033 Central is much lower than 2033 Do Minimum
n However traffic in the North remains stable: main environmental benefit felt by other regions
n Tonnes by road rises marginally in the North in the 2033 Central versus the 2033 Do Minimum
Refer to Figures B.3 and B.4
n Reduction in rail traffic from 2014 to 2033 Do Minimum largely due to the decline in coal
n 2033 Central versus 2033 Do Minimum:
– Large increase in train kms nationally
– Growth particularly on the main
intermodal routes
– Tonnes to/from/within the North rises
more than for other traffic
Road Freight Refer to Figure B.5
n Switch to trans-Pennine tunnel route plus feeder routes (M60 (south & west), M1, M18)
n Relieves other trans-Pennine routes (M62, A628, A50, M6)
n Induces a shift in some South East – North West routings – away from the M6 to the M1 and A1
Refer to Figures B.3 and B.4
n This scenario has been modelled as a re-assignment of the HGV origin destination matrix.
– The rail traffics are therefore unchanged
from the central scenario
Rail Freight n Refer to Figure B.6
n Double length intermodal trains reduces rail cost, attracting more rail mode share from road across the country
n Piggyback across the Pennines results in fewer HGVs on the M62
Refer to Figure B.7
n Double length intermodal trains reduces rail cost, attracting more rail mode share from road across the country
n Double length intermodal trains results in fewer trains on intermodal routes across the network
Waterborne Freight n Refer to Figure B.8
n Greater use of Northern ports instead of Dover Straits results in fewer HGV kms nationally
n Reduced traffic to/from Southern, Welsh and Scottish ports
n However, more HGV kms on the Northern road network
n This scenario has been modelled as a redistribution of European unitised sea services carrying trade (e.g. ferries). These traffics are typically unsuitable for rail, so the impact on the rail network has not been modelled
Environment n The modelling to represent this scenario was a simple representation of Low Emission Zones
n The only impacts are on the environmental impact and the user costs
n The modelling to represent this scenario was a simple representation of Low Emission Zones
n The only impacts are on the environmental impact and the user costs
B.4 Transport Network Impact
Figure B.1: 2033 Do Minimum HGV Flows
Source: GBFM

52 | Northern Freight & Logistics Report: Technical Appendices | 53
Figure B.2: 2033 Impact of Central Scenario compared against Do Minimum – HGV Flows
Source: GBFM
Figure B.3: 2033 Do Minimum Daily Trains Run
Source: GBFM

54 | Northern Freight & Logistics Report: Technical Appendices | 55
Figure B.4: 2033 Impact of the Central Bundle compared to the Do Minimum – Daily Trains Run
Source: GBFM
Figure B.5: 2033 Roads Scenario compared against Central Scenario – HGV Flows
Source: GBFM
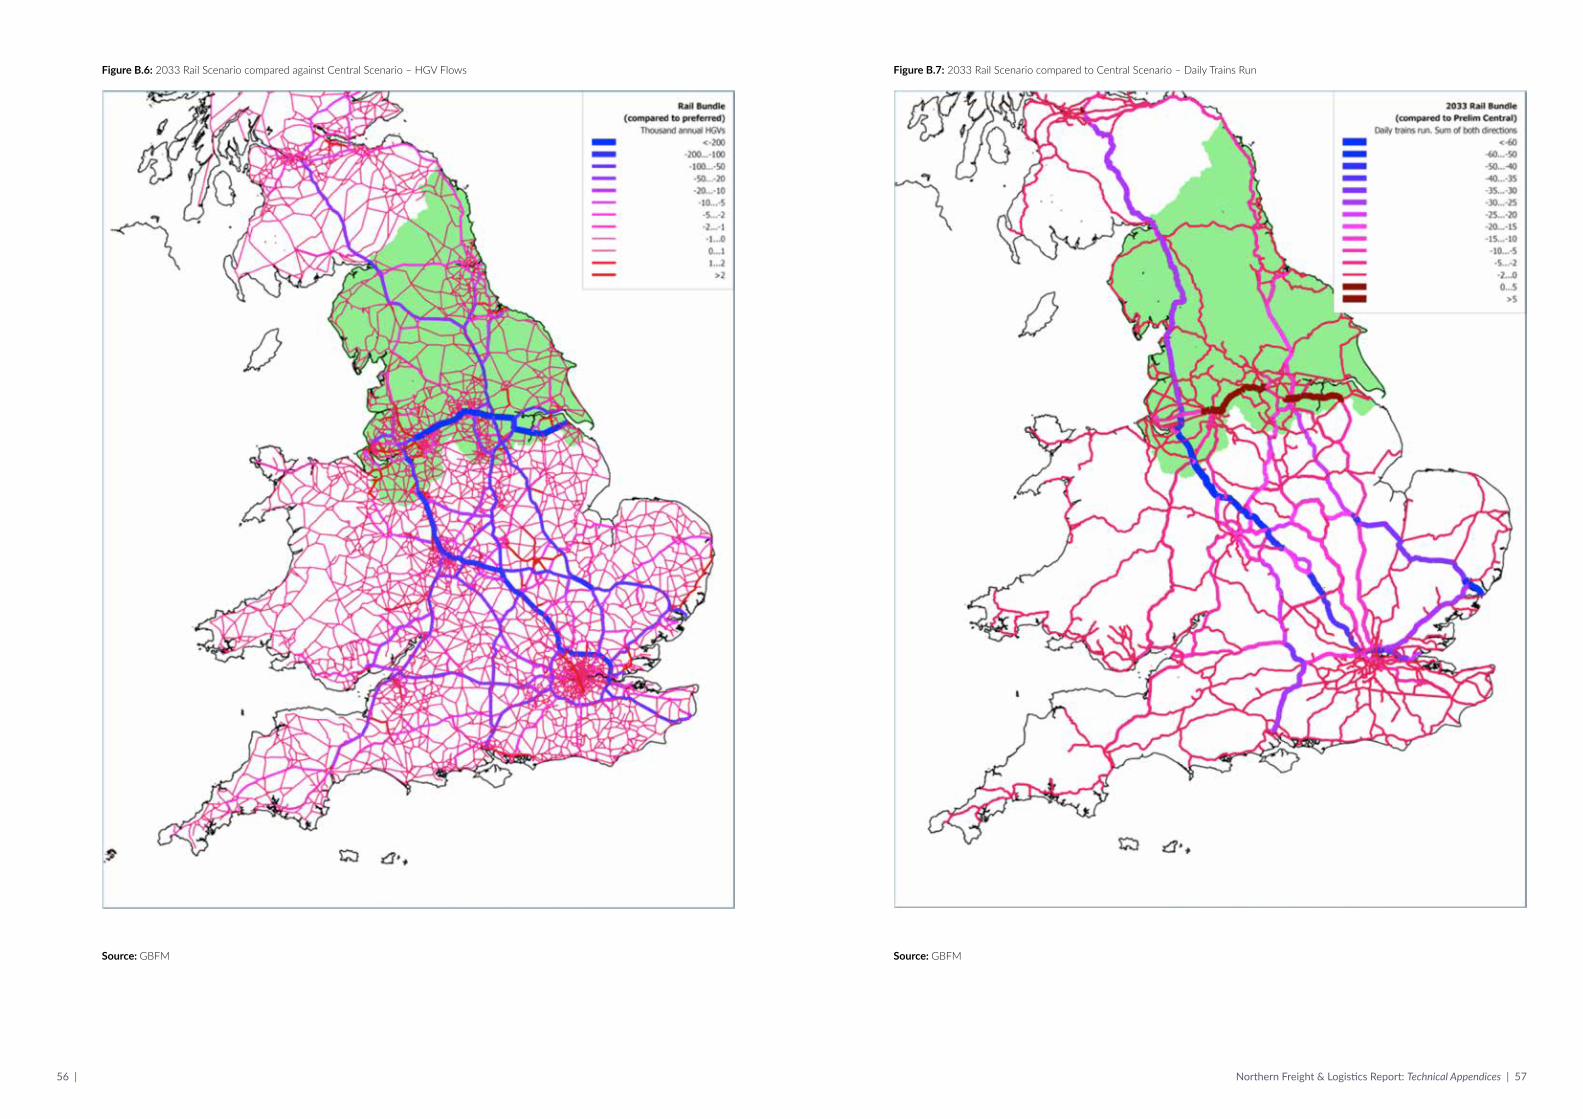
56 | Northern Freight & Logistics Report: Technical Appendices | 57
Figure B.6: 2033 Rail Scenario compared against Central Scenario – HGV Flows
Source: GBFM
Figure B.7: 2033 Rail Scenario compared to Central Scenario – Daily Trains Run
Source: GBFM

58 | Northern Freight & Logistics Report: Technical Appendices | 59
Figure B.8: 2033 Water Scenario compared to Central Scenario – HGV Flows
Source: GBFM
B.5 Port Impacts
The impacts of each scenario in terms of units passing through UK ports are shown in Table B.7 to Table B.10 (ro-ro units) and Table B.11 to Table B.14 (LoLo units).
Table B.6 provides the main observations that can be drawn from the data.
Table B.6: Port Impacts – Main Observations
Scenario Observation
Central n General increase in market due to trade growth
n Humber: large increase in 2033 Central versus Do Minimum
n Also North West and North East
Road n This scenario has been modelled as a re-assignment of the HGV origin destination matrix
n The port traffics are therefore unchanged from the Central Scenario
Rail n The option of using piggyback services (unaccompanied HGV trailers on trains) from Humber ports encourages more traffic to use Humber ports
Water n Subsidising ferries to/from Northern ports boosts traffic at Northern ports
Environment n The modelling to represent this scenario was not done at the port level; therefore the port shares are the same as the Central Scenario
Ro-ro Forecasts
Table B.7: Ro-ro Units (Million)
2014 2033 Do Min
2033 Central
2033 Roads Bundle
2033 Rail Bundle
2033 Water
2033 Environment
Humber 1.05 1.49 2.75 2.75 2.88 3.63 2.75
North West 0.78 2.21 2.44 2.44 2.43 2.75 2.44
North East 0.19 0.24 0.37 0.37 0.36 0.48 0.37
Other GB 6.28 8.52 6.89 6.89 6.78 5.37 6.89
Total 8.30 12.45 12.45 12.45 12.45 12.24 12.45
of which North 2.02 3.94 5.56 5.56 5.67 6.87 5.56
Source (2014): DfT Maritime Statistics [Includes Channel Tunnel ro-ro and accounts for MAFIs carrying more than one unit]
Source (2033): MDS Transmodal modelling

60 | Northern Freight & Logistics Report: Technical Appendices | 61
Table B.8: Ro-ro Units (Million) Compared against 2014 Base
2014 2033 Do Min
2033 Central
2033 Roads Bundle
2033 Rail Bundle
2033 Water
2033 Environment
Humber - 0.44 1.70 1.70 1.83 2.58 1.70
North West - 1.43 1.66 1.66 1.65 1.97 1.66
North East - 0.05 0.17 0.17 0.17 0.29 0.17
Other GB 2.24 0.61 0.61 0.50 -0.91 0.61
Total - 4.15 4.15 4.15 4.15 3.94 4.15
of which North - 1.92 3.54 3.54 3.65 4.85 3.54
Source (2014): DfT Maritime Statistics [Includes Channel Tunnel ro-ro and accounts for MAFIs carrying more than one unit]
Source (2033): MDS Transmodal modelling
Table B.9: Ro-ro Units (Million) Compared against 2033 Do Minimum
2014 2033 Do Min
2033 Central
2033 Roads Bundle
2033 Rail Bundle
2033 Water
2033 Environment
Humber - - 1.26 1.26 1.39 2.14 1.26
North West - - 0.24 0.24 0.22 0.55 0.24
North East - - 0.13 0.13 0.12 0.24 0.13
Other GB -1.63 -1.63 -1.74 -3.15 -1.63
Total - - 0.00 0.00 0.00 -0.21 0.00
of which North - - 1.63 1.63 1.74 2.94 1.63
Source (2014): DfT Maritime Statistics [Includes Channel Tunnel ro-ro and accounts for MAFIs carrying more than one unit]
Source (2033): MDS Transmodal modelling
Table B.10: Ro-ro Units (Million) Compared against 2033 Central Scenario
2014 2033 Do Min
2033 Central
2033 Roads Bundle
2033 Rail Bundle
2033 Water
2033 Environment
Humber - - - 0.00 0.13 0.88 0.00
North West - - - 0.00 -0.01 0.31 0.00
North East - - - 0.00 -0.01 0.12 0.00
Other GB - - - 0.00 -0.11 -1.52 0.00
Total - - - 0.00 0.00 -0.21 0.00
of which North - - - 0.00 0.11 1.31 0.00
Source (2014): DfT Maritime Statistics [Includes Channel Tunnel ro-ro and accounts for MAFIs carrying more than one unit]
Source (2033): MDS Transmodal modelling
LoLo Forecasts
Table B.11: LoLo Units (million)
2014 2033 Do Min
2033 Central
2033 Roads Bundle
2033 Rail Bundle
2033 Water
2033 Environment
Humber 0.25 0.35 0.32 0.32 0.32 0.52 0.32
North West 0.39 0.55 0.89 0.89 0.89 1.12 0.89
North East 0.19 0.29 0.42 0.42 0.42 0.49 0.42
Other GB 4.58 6.80 6.37 6.37 6.38 6.08 6.37
Total 5.41 8.00 8.00 8.00 8.00 8.21 8.00
of which North 0.83 1.20 1.63 1.63 1.62 2.13 1.63
Source (2014): DfT Maritime Statistics
Source (2033): MDS Transmodal modelling
Table B.12: LoLo Units (Million) Compared against 2014 Base
2014 2033 Do Min
2033 Central
2033 Roads Bundle
2033 Rail Bundle
2033 Water
2033 Environment
Humber - 0.11 0.08 0.08 0.07 0.28 0.08
North West - 0.16 0.49 0.49 0.49 0.72 0.49
North East - 0.10 0.23 0.23 0.23 0.30 0.23
Other GB - 2.22 1.79 1.79 1.80 1.50 1.79
Total - 2.59 2.59 2.59 2.59 2.80 2.59
of which North - 0.37 0.80 0.80 0.79 1.30 0.80
Source (2014): DfT Maritime Statistics
Source (2033): MDS Transmodal modelling
Table B.13: LoLo Units (Million) Compared against 2033 Do Minimum
2014 2033 Do Min
2033 Central
2033 Roads Bundle
2033 Rail Bundle
2033 Water
2033 Environment
Humber - - -0.03 -0.03 -0.04 0.17 -0.03
North West - - 0.33 0.33 0.33 0.56 0.33
North East - - 0.13 0.13 0.13 0.20 0.13
Other GB - - -0.43 -0.43 -0.42 -0.72 -0.43
Total - - 0.00 0.00 0.00 0.21 0.00
of which North - - 0.43 0.43 0.42 0.93 0.43
Source (2014): DfT Maritime Statistics
Source (2033): MDS Transmodal modelling

62 | Northern Freight & Logistics Report: Technical Appendices | 63
Table B.14: LoLo Units (Million) Compared to 2033 Central Scenario
2014 2033 Do Min
2033 Central
2033 Roads Bundle
2033 Rail Bundle
2033 Water
2033 Environment
Humber - - - 0.00 -0.00 0.20 0.00
North West - - - 0.00 0.00 0.23 0.00
North East - - - 0.00 -0.00 0.07 0.00
Other GB - - - 0.00 0.00 -0.29 0.00
Total - - - 0.00 0.00 0.21 0.00
of which North - - - 0.00 -0.00 0.50 0.00
Source (2014): DfT Maritime Statistics
Source (2033): MDS Transmodal modelling
B.6 User Costs
The impacts of each scenario on the following user costs have been estimated as follows:
n Road user costs, comprising:
– Moving asset purchase
– Wages
– Overheads
– Fuel
– Maintenance
– Road vehicle excise duty
– Tolls
n Rail user costs, comprising:
– Moving asset purchase
– Wages
– Overheads
– Fuel
– Maintenance
– Track charges
– Terminal lifts/shunts/port charges
n Port user costs, comprising:
– Shipping costs
– Moving asset purchase
– Crew and overheads
– Fuel
– Terminal lifts/shunts/port charges
– European inland costs
– Liverpool and Tees LoLo extra shipping costs
Other user costs that have been taken into account are:
n Waterway (Aire and Calder); and
n Warehousing (including land and labour)
For certain freight flows costs have been adjusted (halved) to represent user costs for the UK only. This is the case for:
n Shipping costs (both European and LoLo deep sea) and European inland costs;
n Road (for international (LoLo, ro-ro, Channel Tunnel, international bulk)); and
n Rail (for Port intermodal).
The user costs for each scenario are summarised in Table B.15 and are presented with respect to the Do Minimum Scenario.
Table B.15: 2033 User Costs compared against Do Minimum (£M 2010 Prices, 2033 Values)
Change from Do Minimum
User Cost Do Minimum Central Road Rail Water Environment
Road User Costs 29,978.37 -898.05 -930.30Note1 -974.90 -940.81Note2 -470.63Note 3
Rail User Costs 605.58 453.02 453.02 474.35 453.02 453.02
Shipping Cost 1,441.37 -35.82 -35.82 -37.55 - -35.82
Relative European Inland Cost
3,808.26 -295.51 -295.51 -300.66 - -295.51
LoLo Deep Sea - 3.87 3.87 3.87 - 3.87
Waterway (Aire and Calder)
- 4.18 4.18 4.18 4.18 4.18
Warehousing (Land+Labour)
- -68.40 -68.40 -68.40 -68.40 -68.40
Total - -836.71 -868.96 -899.11 -552.01 -409.29
A negative in the table indicates a cost saving compared to the Do Minimum
n Note 1 – The road user costs presented here do not include the user cost of abolishing road tolls in the North. The estimated user cost saving of abolishing road tolls in the North in 2033 is £25.3 Million (2010 prices).
n Note 2 – Road user and port user costs have not been disaggregated in this scenario.
n Note 3 – The estimated impact of the Low Emission Zones (LEZ) is £13 per HGV (30 minutes of HGV time) (2010 prices) with 32.9 million HGVs to or from the LEZs in 2033.

64 | Northern Freight & Logistics Report: Technical Appendices | 65
B.7 Non-User Costs
Non-user costs have been calculated using the Department for Transport’s Mode Shift Benefit approach, which takes into account the change in HGV kilometres (as described in Appendix A.5) with values as summarised in Table B.16 and Table B.17. The non-user costs in the 2033 Do Something Scenarios compared to the Do Minimum Scenario are summarised in Table B.18.
Table B.16: MSB Values by Road Type and Component (Pence per Lorry Mile) (2010 Prices, 2033 Values)
2010 Prices and 2033 Values (p/lorry mile)
Motorways
A-Road OtherWeighted
AverageHigh Low
Congestion 116.6 28.3 84.8 91.9 67.2
Accidents 0.6 0.6 6.6 6.5 3.2
Noise 10.6 8.2 9.4 16.5 9.4
Pollution 0.0 0.0 0.1 0.2 0.1
Greenhouse Gases 8.2 8.2 9.6 12.3 9.6
Infrastructure 6.4 6.4 22.0 157.0 16.5
Other (roads) 5.5 5.5 5.5 5.5 5.5
Taxation -28.5 -28.5 -29.4 -36.7 -29.4
Rail -9.9 -9.9 -9.9 -9.9 -9.9
Total 109.6 18.9 98.8 243.3 72.2
Table B.17: MSB Component Values for Rail and Water (Pence per Lorry Mile) (2010 Prices, 2033 Value)
2010 Prices and 2033 Values p/lorry mile
Noise 4.28
Pollution 3.72
Climate Change 2.52
Other 1.59
Taxation -2.19
Total 9.92
Table B.18: 2033 Non-User Costs Compared against Do Minimum (£M 2010 Prices, 2033 Values)
Change from Do Minimum
User Cost Do Minimum Central Road Rail Water Environment
Congestion 12,147 -644.38 -698.67 -727.06 -709.11 -644.38
Accidents 600 -22.95 -26.38 -25.95 -26.19 -22.95
Noise 943 -50.62 -54.86 -57.05 -55.64 -56.91
Pollution -670 -38.92 -39.87 -43.86 -42.47 -43.33
Greenhouse Gases 1,178 -64.14 -67.33 -72.30 -70.41 -72.79
Infrastructure 3,609 -120.71 -171.72 -135.98 -140.34 -120.71
Other (roads) 717 -41.40 -42.51 -46.66 -45.21 -41.40
Taxation -4,803 277.22 284.61 312.38 302.69 277.22
Total 13,721 -705.91 -816.73 -796.48 -786.69 -725.25
A negative in the table indicates a cost saving compared to the Do Minimum
B.8 Environment
B.8.1 Overview
An assessment of the environment and sustainability performance of the six scenarios has been undertaken to ensure that freight movements are made in both a cost efficient and sustainable way.
The environmental appraisal methodology is described in Appendix A.5.1.2. The quantification of environmental impacts using valuation techniques in accordance with Mode Shift Benefits Value methodology is provided in Appendix B.8.2 and the environmental appraisal in accordance with WebTAG is provided in Appendix B.8.3.
B.8.2 Mode Shift Benefits – Environmental Appraisal
The financial value of the environmental benefits and disbenefits have for completeness been presented alongside the wider economic appraisal included in Appendix C.3.2.
A summary of the findings is presented in Table B.19.
Table B.19: MSB Values - Environment (£m)
2033 Central
2033 Road
2033 Rail
2033 Environment
2033 Water
Noise -50.62 -54.86 -57.05 -56.91 -55.64
Pollution -38.92 -39.87 -43.86 -43.33 -42.47
Greenhouse Gases -64.14 -67.33 -72.30 -72.79 -70.41
Undiscounted; 2010 prices and 2033 values

66 | Northern Freight & Logistics Report: Technical Appendices | 67
As may be observed from Table B.19 compared to the Do Minimum, all of the proposed scenarios result in an improved environmental impact (negative values imply a benefit compared to the Do Minimum scenario). The figures presented in the table are in millions of pounds sterling e.g. the noise benefits for the 2033 Central Scenario equate to £50.62 million.
Comparing the MSB values for each scenario and applying a sensitivity test for the 2033 preferred scenario, the variance of benefits across all the appraised environmental impacts is within £10 million. The key conclusion from this applying the MSRS appraisal methods is that there are substantial environmental benefits to be gained through adopting recommendations of the Freight and Logistics Report for the North compared to the Do Minimum case.
B.8.3 WebTAG Environmental Appraisal
Having undertaken a quantitative assessment of the environmental impacts of each of the proposed scenarios it is also important to consider environmental impacts through a high level qualitative appraisal to consider the wider potential environmental impacts associated with the recommendations proposed in the Freight and Logistics Report.
This high level qualitative environmental appraisal is principled upon a high level WebTAG approach for report recommendations with supplementary commentary on its use as part of this study. Using this methodology an Appraisal Summary Table (AST) for each appraised option will apply the appraisal scale illustrated in Table B.20.
Table B.20: WebTAG Appraisal Impact Scale
Impact
--- Large Adverse
-- Moderate Adverse
- Slight Adverse
0 Neutral
+ Slight Beneficial
++ Moderate Beneficial
+++ Large Beneficial
B.8.3.1 Scoping of the Qualitative Environmental Appraisal
At the report scoping stage, consideration was given to the environmental impact of the proposed recommendations on the natural environment. In line with WebTAG principles of proportionality the appraisal should focus on potentially significant environmental impacts and scope out other environmental impacts for the purpose of the appraisal. Given the early stage of recommendation development, details of site specific interventions are as yet unknown. The broad geographical remit of the report recommendations meant that the impacts of air quality, greenhouse gas and noise impacts were identified as a priority for this strategic appraisal. Environmental impacts such as townscape or landscape, the historic environment, water environment and biodiversity were scoped out, due to the known level of detail associated with each intervention. It is important that these impacts are considered for each intervention once they come online to ensure appropriate management of environmental impacts.
The appraisal below considers and is labelled with reference to the following scenarios:
n Do Minimum 2033 vs Central Scenario 2033;
n Do Minimum 2033 vs Road Scenario 2033;
n Do Minimum 2033 vs Rail Scenario 2033;
n Do Minimum 2033 vs Waterborne Freight Scenario 2033; and
n Do Minimum 2033 vs Environment Scenario 2033.
B.8.3.2 Overview of Qualitative Environmental Appraisal Method
Air Quality and Greenhouse Gas
The biggest contribution to poor air quality in the UK is road transport emissions. Heavy Goods Vehicles (HGVs) are a major contributor to emissions from this sector and therefore potentially significant changes in HGV flows could have a significant effect on future air quality.
This appraisal has considered air quality consistent with WebTAG guidance and has considered that changes in daily flows of more than 200 HGVs are potentially significant. This is consistent with Highways England’s Design Manual for Roads and Bridges, Volume 11 (DMRB) 6 air quality screening criteria.
It should be noted that the predicted changes in HGV flows are modelled for 2033 whereas the location of Air Quality Management Areas (AQMAs) are based on current monitored and modelled pollutant concentrations. The high level air quality appraisal is based on the traffic model forecasts produced and, taking a worst case scenario, the AQMAs that exist as of 2016. The number and location of AQMAs is expected to reduce between now and the traffic model forecast of 2033 due to improvements in vehicle emissions as emphasised by Defra’s latest (December 2015) report on improving air quality in the UK. Therefore this appraisal takes a precautionary approach. It is assumed that the interventions proposed in the report recommendations will be undertaken on a rolling programme between 2016 and 2033. It is important that the programme of interventions undertakes a review of the most up to date AQMAs ahead of potential adoption of each intervention in order to ensure compliance with air quality legislative requirements.
Noise
Similarly, the appraisal has considered noise impacts using the WebTAG method. The most recent version of the appraisal methodology (TAG Unit A3) was issued in December 2015. This update to the November 2014 version incorporated further Defra guidance on assessment of transport-related noise and its impact on annoyance, sleep disturbance and health impacts. TAG Unit A3 states that assessing the noise implications of multi-modal transport schemes presents a particular challenge for two main reasons:
“People exhibit different responses to noise from and within different transport modes, making the determination of cumulative impact difficult”…. and
“Noise is a local impact which depends on the precise geometric relationship of source and receiver – these may not be sufficiently well defined at early stages of scheme development.”
6 http://www.standardsforhighways.co.uk/ha/standards/dmrb/vol11/index.htm

68 | Northern Freight & Logistics Report: Technical Appendices | 69
Paragraph 2.2.2 notes:
“…The noise appraisal should be proportional to the scheme and its proposed impact. Analysis should be no more detailed than is required to support robust decision making. The analyses outlined in this Unit may not be appropriate for all schemes, but should provide the basis for less detailed analyses where appropriate...”
Taking the above into account, and given the geographic extents of the proposals, this desktop exercise is qualitative and the establishment of likely effects has been based on broad scheme proposals, vicinity of residential receptors and likely existing background noise.
The December 2015 TAG Unit A3 considers impacts from road, rail and air traffic in terms of annoyance, sleep disturbance and health impacts, in turn based upon Defra guidance, for which there are dose-response relationships. A 1 decibel increase in noise level is the minimum considered in WebTAG.
B.8.3.3 Do Minimum 2033 versus Central Scenario
Assessment of the Central Scenario of interventions demonstrates that a total of 869km of modelled links are predicted to experience an increase of more than 200 HGVs per day in 2033. A large proportion of these links in the north which will experience increases in HGV flows are located primarily in a horizontal band from Liverpool across to Hull and include large sections of the strategic road network including the M62, M60, A1, A63, M18, M180 and M58. An increase in HGV flows is predicted across 20 AQMAs including those located within the Greater Manchester, Liverpool, Leeds and Sheffield areas.
The Central Scenario is predicted to reduce HGV flows by more than 200 vehicles per day on 3,124km of road network in 2033. This would be expected to bring about an improvement in air quality, and mainly on links that run north to south including the M6, M1 and A1 south of Wakefield. A decrease in HGV flows is predicted on links intersecting 78 AQMAs including those located in Greater Manchester, Walsall, Stoke on Trent, Barnsley and Wakefield.
Figure B.9 presents these changes in HGV flows graphically and illustrates that the Central Scenario will have its largest impact on increasing HGV flows in the north of England; while HGV numbers will be reduced in the south of the country.
Figure B.9: Central Scenario Changes Compared to AQMAs
The Central Scenario will reduce the number of vehicle kilometres travelled by road based freight and increase rail based freight. The movement of freight by rail has lower emissions per tonne of freight per kilometre compared to road freight movement; therefore it would be expected that overall regional emissions would fall as a result of the Central Scenario.

70 | Northern Freight & Logistics Report: Technical Appendices | 71
Table B.21: Central – Environmental Appraisal Results
Environmental Impact
Baseline Summary of Impacts Quantitative Qualitative Distributional / 7-pt Scale
Noise Large number of receptors affected by transportation noise across the north, in particular road traffic noise.
With the Central Scenario there will be improvements to transport links and associated infrastructure across all modes. Highest impacts are likely at locations where potential new schemes are introduced e.g. HS2, HS3 and Matlock-Buxton (despite mitigation). Although there will be opportunities to mitigate noise adjacent to improved infrastructure (A66/A69/M60), in purely noise terms these are likely to be less significant than noise changes brought about by new schemes. In some cases improvements will be associated with increases in traffic (e.g. around distribution centres), and in others there will be just increases in activity resulting in noise increases e.g. Manchester Airport. Further impacts will also arise as a result of traffic associated with distribution centres it is considered that the overall impacts are likely to be moderate adverse. The impacts should be considered and mitigated on a scheme by scheme basis.
Moderate adverse
--
Environmental Impact
Baseline Summary of Impacts Quantitative Qualitative Distributional / 7-pt Scale
Air Quality (Local & Regional)
There are approximately 300 AQMAs declared for exceedances of the national air quality objective for nitrogen dioxide (NO₂) or particulate matter (PM₁₀) or both pollutants within the North of England. The AQMAs are primarily located in urban areas and along busy roads where there are sensitive receptors (such as residential properties) located in close proximity to emission sources.
Local Air QualityThe central bundle is predicted to increase HGVs by more than 200 vehicles per day on 869km of road. 284km of these intersect existing AQMAs. The central bundle is predicted to decrease HGVs by more than 200 vehicles per day on 3,124km of modelled links. 871km of these links will intersect existing AQMAs.Regional EmissionsOverall vehicle kilometres are expected to reduce and be replaced by rail freight movements. This would be expected to reduce regional emissions of NOx and PM₁₀.
Local Air QualityLarge adverse to large beneficial depending on the magnitude of change, baseline air quality and the location of nearby sensitive receptorsIt is anticipated there would be an improvement in air quality, expected on links that run north to south including the M6, M1 and A1 south of Wakefield; however there is likely to be a decrease in air quality primarily in a horizontal band from Liverpool across to Hull and including large sections of the strategic road network including the M62, M60, A1, A63, M18, M180 and M58.Regional EmissionsMinor beneficial as there is a greater length of links experiencing a decrease in HGVs.
Unknown at this stage
+
Greenhouse Gases
In 2013 in the UK transport emissions of CO₂ accounted for 121,751.8 KtCO2 (DECC 2016), of which road emissions made up 121,751.8 KtCO₂ and Diesel Rail 2,125.6 KtCO₂.
Overall vehicle kilometres are expected to reduce and be replaced by rail freight movements. This would be expected to reduce total emissions of CO₂ compared to the baseline levels.
Minor beneficial
+

72 | Northern Freight & Logistics Report: Technical Appendices | 73
B.8.3.4 Do Minimum 2033 versus Road Scenario
Assessment of the Road Scenario demonstrates that a total of 869km of modelled links are predicted to experience an increase of more than 200 HGVs per day in 2033. A large proportion of these links in the north which will experience increases in HGV flows are located primarily in a horizontal band from Liverpool across to Hull and include large sections of the strategic road network including the M62, M60, A1, A63, M18, M180 and M58. An increase in HGV flows is predicted across 22 AQMAs including those located within the Greater Manchester, Liverpool, Leeds and Sheffield areas.
The Central Scenario is predicted to reduce HGV flows by more than 200 vehicles per day on 3,278km of road network in 2033. This would be expected to bring about an improvement in air quality, and mainly on links that run north to south, including the M6, M1 and A1 south of Wakefield. A decrease in HGV flows is predicted on links intersecting 82 AQMAs including those located in Greater Manchester, Walsall, Stoke on Trent, Barnsley and Wakefield.
Figure B.10 presents these changes graphically and illustrates that the road bundle will have its largest impact on increasing HGV flows in the north of England while HGV numbers will be reduced in the south of the country.
Figure B.10: Road Scenario Changes Compared to AQMAs
The Road Scenario will reduce the number of vehicle kilometres travelled by road based freight and increase rail based freight. The movement of freight by rail has lower emissions per tonne of freight moved per kilometre compared to road freight movement; therefore it would be expected that overall regional emissions would fall as a result of the road bundle.
Table B.22: Road Scenario – Environmental Appraisal Results
Environmental Impact
Baseline Summary of Impacts Quantitative Qualitative Distributional / 7-pt Scale
Noise Large number of receptors affected by transportation noise, in particular road traffic noise.
With the Road Scenario there would be an increase in emphasis on road freight over and above that of the Central Scenario, with corresponding motorway widening schemes (M62, M60, M6, M1, M56). Although there will be opportunities for mitigation associated with road improvements, there is the potential for noise increases in moving noise sources closer to residential areas, and for increased traffic noise in areas where mitigation cannot help offset this. Overall it is considered that increases in road traffic noise will not be offset by decreases in rail freight traffic. Therefore it is considered that overall there will be moderate adverse impacts associated with this option.
Moderate adverse
--
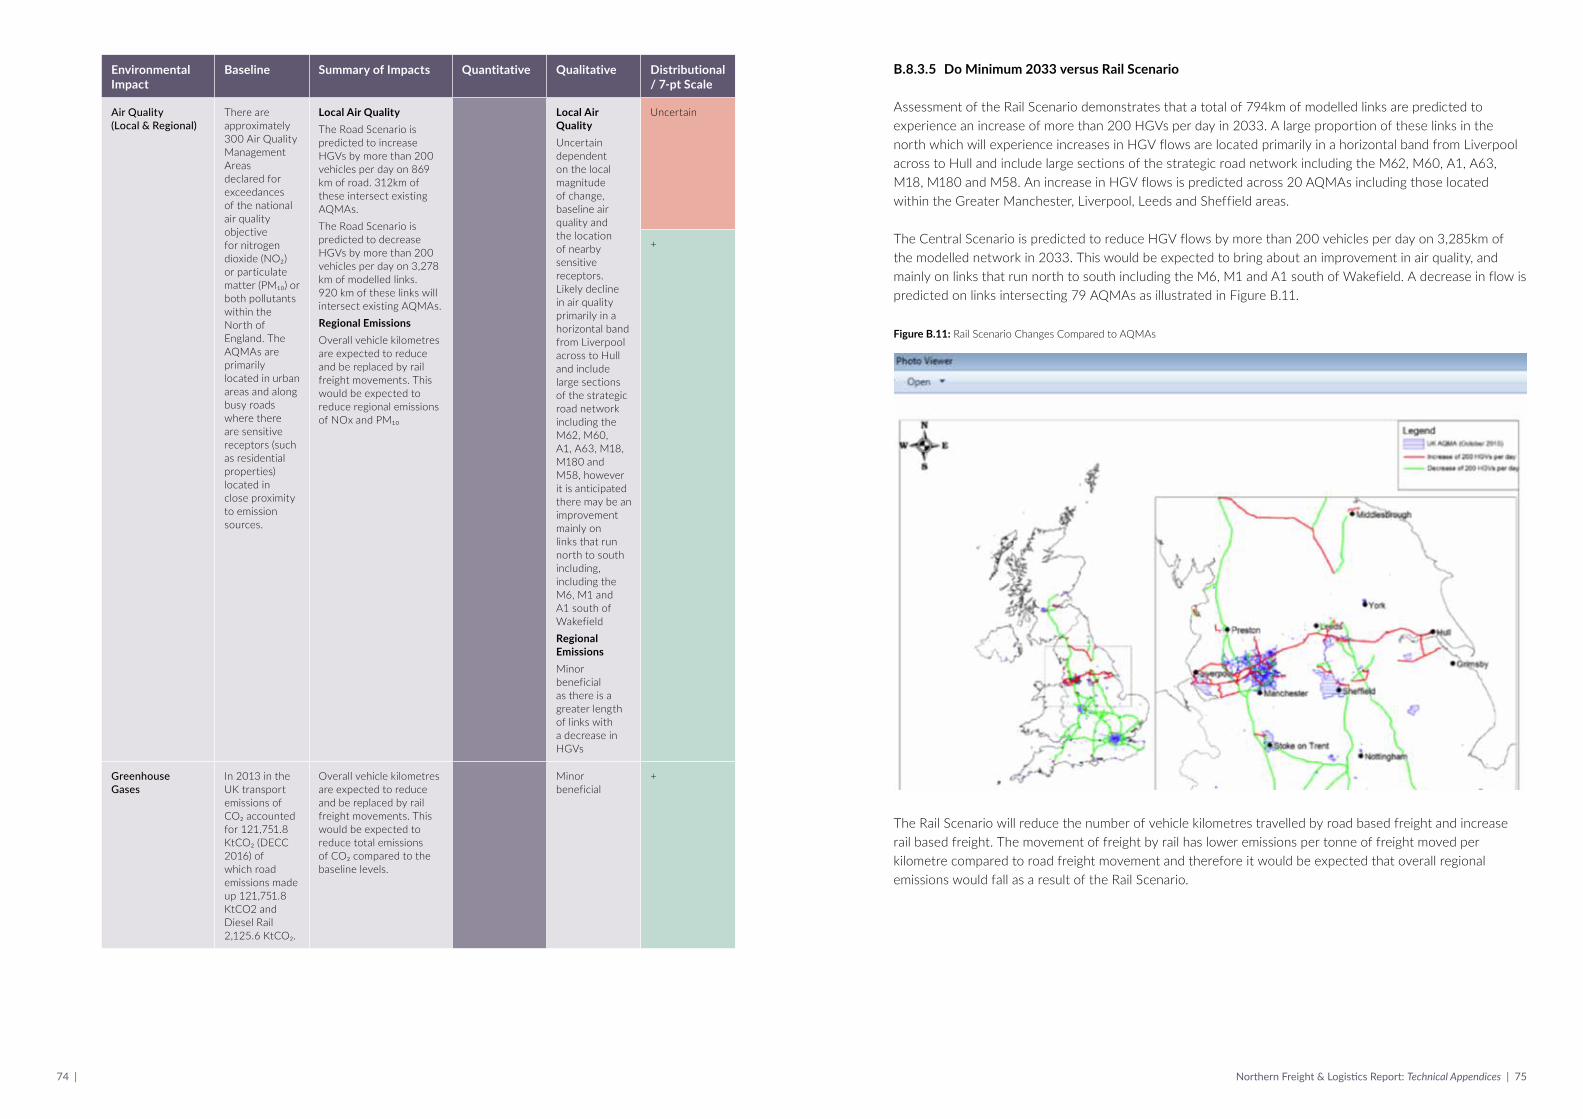
74 | Northern Freight & Logistics Report: Technical Appendices | 75
Environmental Impact
Baseline Summary of Impacts Quantitative Qualitative Distributional / 7-pt Scale
Air Quality (Local & Regional)
There are approximately 300 Air Quality Management Areas declared for exceedances of the national air quality objective for nitrogen dioxide (NO₂) or particulate matter (PM₁₀) or both pollutants within the North of England. The AQMAs are primarily located in urban areas and along busy roads where there are sensitive receptors (such as residential properties) located in close proximity to emission sources.
Local Air QualityThe Road Scenario is predicted to increase HGVs by more than 200 vehicles per day on 869 km of road. 312km of these intersect existing AQMAs. The Road Scenario is predicted to decrease HGVs by more than 200 vehicles per day on 3,278 km of modelled links. 920 km of these links will intersect existing AQMAs.Regional EmissionsOverall vehicle kilometres are expected to reduce and be replaced by rail freight movements. This would be expected to reduce regional emissions of NOx and PM₁₀
Local Air QualityUncertain dependent on the local magnitude of change, baseline air quality and the location of nearby sensitive receptors. Likely decline in air quality primarily in a horizontal band from Liverpool across to Hull and include large sections of the strategic road network including the M62, M60, A1, A63, M18, M180 and M58, however it is anticipated there may be an improvement mainly on links that run north to south including, including the M6, M1 and A1 south of WakefieldRegional EmissionsMinor beneficial as there is a greater length of links with a decrease in HGVs
Uncertain
+
Greenhouse Gases
In 2013 in the UK transport emissions of CO₂ accounted for 121,751.8 KtCO₂ (DECC 2016) of which road emissions made up 121,751.8 KtCO2 and Diesel Rail 2,125.6 KtCO₂.
Overall vehicle kilometres are expected to reduce and be replaced by rail freight movements. This would be expected to reduce total emissions of CO₂ compared to the baseline levels.
Minor beneficial
+
B.8.3.5 Do Minimum 2033 versus Rail Scenario
Assessment of the Rail Scenario demonstrates that a total of 794km of modelled links are predicted to experience an increase of more than 200 HGVs per day in 2033. A large proportion of these links in the north which will experience increases in HGV flows are located primarily in a horizontal band from Liverpool across to Hull and include large sections of the strategic road network including the M62, M60, A1, A63, M18, M180 and M58. An increase in HGV flows is predicted across 20 AQMAs including those located within the Greater Manchester, Liverpool, Leeds and Sheffield areas.
The Central Scenario is predicted to reduce HGV flows by more than 200 vehicles per day on 3,285km of the modelled network in 2033. This would be expected to bring about an improvement in air quality, and mainly on links that run north to south including the M6, M1 and A1 south of Wakefield. A decrease in flow is predicted on links intersecting 79 AQMAs as illustrated in Figure B.11.
Figure B.11: Rail Scenario Changes Compared to AQMAs
The Rail Scenario will reduce the number of vehicle kilometres travelled by road based freight and increase rail based freight. The movement of freight by rail has lower emissions per tonne of freight moved per kilometre compared to road freight movement and therefore it would be expected that overall regional emissions would fall as a result of the Rail Scenario.

76 | Northern Freight & Logistics Report: Technical Appendices | 77
Table B.23: Rail Scenario – Environmental Appraisal Results
Environmental Impact
Baseline Summary of Impacts Quantitative Qualitative Distributional / 7-pt Scale
Noise Large number of receptors affected by transportation noise, in particular road traffic noise.
With the Rail Scenario there will be an increased emphasis on rail freight movement. Noise associated with use of new infrastructure to facilitate this, such as new passing loops, in addition to increased activity at existing and new distribution centres will offset the reduction in freight movements by road. However the cumulative impacts from all interventions will result in moderate adverse impacts.
Moderate adverse
--
Air Quality (Local & Regional)
There are approximately 300 AQMA declared for exceedances of the national air quality objective of nitrogen dioxide (NO₂) or particulate matter (PM₁₀) or both pollutants within the North of England. The AQMAs are primarily located in urban areas and along busy roads where there are sensitive receptors (such as residential properties) located in close proximity to emission sources.
Local Air QualityThe Rail Scenario is predicted to increase HGVs by more than 200 vehicles per day on 794 km of road. 279km of these intersect existing AQMAs. The Rail Scenario is predicted to decrease HGVs by more than 200 vehicles per day on 3,285km of modelled links. 891km of these links will intersect existing AQMAs.Regional EmissionsOverall vehicle kilometres are expected to reduce and be replaced by rail freight movements. This would be expected to reduce regional emissions of NOx and PM₁₀.
Local Air QualityLarge adverse to large beneficial depending on the magnitude of change, baseline air quality and the location of nearby sensitive receptors.Regional EmissionsMinor beneficial as there is a greater length of links experiencing a decrease in HGVs.
Uncertain
+
Greenhouse Gases
In 2013 in the UK transport emissions of CO2 accounted for 121,751.8 KtCO₂ (DECC 2016) of which road emissions made up 121,751.8 KtCO₂ and Diesel Rail 2,125.6 KtCO₂.
Overall vehicle kilometres are expected to reduce and be replaced by rail freight movements. This would be expected to reduce total emissions of CO₂ compared to the baseline levels.
Minor beneficial
B.8.3.6 Do Minimum 2033 versus Waterborne Freight Scenario
There are no AQMAs declared in the UK for pollution associated with shipping. Furthermore, as of 1st January 2015, EU Member States must ensure that ships in the North Sea and the English Channel use fuels with a maximum sulphur content of 0.10%. Higher sulphur contents are permitted, but only if the appropriate exhaust cleaning systems are in place. Any increased shipping activities associated with the Waterborne Freight Scenario would therefore be unlikely to have a significant impact on air quality as a result of shipping emissions.
Table B.24: Waterborne Freight Scenario – Environmental Appraisal Results
Environmental Impact
Baseline Summary of Impacts Quantitative Qualitative Distributional / 7-pt Scale
Noise Large number of receptors affected by transportation noise.
With the Waterborne Freight Scenario there will be a reduction in road and rail freight movement, necessitating an increase in maritime and waterway traffic and associated infrastructure. Although this will see beneficial impacts in terms of replacement of road and rail movement, the cumulative impacts from remaining interventions associated with the Central Scenario will result in moderate adverse impacts.
Moderate adverse
Air Quality (Local & Regional)
There are no Air Quality Management Areas declared in the UK for pollution associated with waterways and shipping.
Local Air QualityEU regulations require the sulphur content of fuel to be no more than 0.1% (North Sea and English Channel). Any increase in sulphur emissions associated with increased shipping activities is therefore likely to be non-significant. Regional EmissionsExpected to be non-significant (for reasons above)
Local Air QualityNegligibleRegional EmissionsNegligible
Unknown at this stage
Greenhouse Gases
In 2013 in the UK transport emissions of CO₂ accounted for 121,751.8 KtCO₂ (DECC 2016), of which road emissions made up 121,751.8 KtCO₂ and Diesel Rail 2,125.6 KtCO₂.
Overall vehicle kilometres are expected to reduce and be replaced by waterborne freight movements. This would be expected to reduce total emissions of CO₂ compared to the baseline levels.
Minor beneficial

78 | Northern Freight & Logistics Report: Technical Appendices | 79
B.8.3.7 Do Minimum 2033 versus Environment Scenario
The introduction of Clean Air Zones (CAZ) in Leeds, Sheffield, Manchester, Hull, Newcastle, and Liverpool would be expected to deliver air quality improvements in these cities. This is because each zone would restrict HGVs according to their vehicle emissions standards, allowing only cleaner vehicles to enter the city. Assuming that all the HGVs associated with the Preferred Preliminary Central Scenario and entering each CAZ were ultra-low emission vehicles, any increase in HGVs associated with this scenario would have significantly lower air quality impacts.
By switching the HGVs to ultra-low emission vehicles such as electric, the present value of the reduction in NOx emissions would be £47,144 (2015 prices), as calculated from the Defra Emission Factor Toolkit based on the estimated distance travelled by HGVs in each city (Central Scenario). The monetary benefits of the NOx emissions were calculated using the TAG unit A3 – Air Quality Valuation workbook.
It should be noted that the monetary benefit of reducing NOx emissions is significantly higher where there is non-compliance with EU legal limits for Air Quality. As air quality is expected to improve in future years, there is a year on year reduction in the size of the road network expected to be non-compliant with EU legal limits for air quality, and this is taken into account in the TAG unit A3 workbook. As such, it follows that the monetary benefit of any reduction in NOx emissions in each city will be greater the earlier the CAZ is implemented. If the CAZs were implemented in 2021 there would be a present value benefit of £368,866.
Table B.25: Environment Scenario – Environmental Appraisal Results
Environmental Impact
Baseline Summary of Impacts Quantitative Qualitative Distributional / 7-pt Scale
Noise Large number of receptors affected by transportation noise.
Consolidation of deliveries within urban centres is likely to result in beneficial impacts, especially where low-noise vehicles are used (e.g. electric); however cumulative impacts from all interventions will result in minor adverse impacts.
Moderate adverse
-
Environmental Impact
Baseline Summary of Impacts Quantitative Qualitative Distributional / 7-pt Scale
Air Quality (Local & Regional)
There are approximately 300 Air Quality Management Areas declared for exceedances of the national air quality objective of nitrogen dioxide (NO₂) or particulate matter (PM₁₀) or both pollutants within the North of England. The AQMAs are primarily located in urban areas and along busy roads where there are sensitive receptors (such as residential properties) located in close proximity to emission sources.
Local Air QualityExpected to lead to air quality benefits where clean air zones are introduced, particularly where they bring forward compliance with EU air quality limit values. Regional EmissionsBased on the Central Scenario, total NOx emissions are expected to decrease by 73 tonnes (opening year) if a Clean Air Zone is introduced in Leeds, Sheffield, Manchester, Hull, Newcastle and Liverpool.
Local Air QualityMajor to minor beneficial depending on the baseline air quality and improvement in air quality achieved.Regional EmissionsMajor to minor beneficial
Unknown
Greenhouse Gases
In 2013 in the UK transport emissions of CO₂ accounted for 121,751.8 KtCO2 (DECC 2016) of which road emissions made up 121,751.8 KtCO₂ and Diesel Rail 2,125.6 KtCO₂.
The vehicle kms and types of vehicles used are anticipated to be greenhouse gas emissions. This would be expected to reduce total emissions of CO₂ compared to the baseline levels.
Minor beneficial
B.9 Summary
This Appendix has presented and considered the results of the modelling and transport, economic and environmental appraisal work undertaken on the six scenarios for the Northern Freight and Logistics Report. Appendix C explains how the preferred recommendations were identified, how its components were developed and how appraisal was then undertaken to identify the resulting benefits.

80 | Northern Freight & Logistics Report: Technical Appendices | 81
Appendix C. Appraisal of Preferred Recommendations
C.1 Identification of the Preferred recommendations – a discussion of results from the tested scenarios
Our approach to identifying the preferred recommendations was based upon assembling an initial bundle of measures derived from stakeholder consultation and the project team’s own experience and professional judgment, with the objective of maximising overall benefits (reducing user and non-user costs and maximising GVA from additional employment within the freight and logistics sector), whilst keeping capital intensive interventions to a minimum, using incremental testing. It was self-evident that significant benefits could be derived from increasing the proportion of goods passing through Northern ports because of the relief of roads thereby by-passed and the reduction in user costs. This increases traffic reaching these ports and, where road access is clearly sub-standard and lacking capacity (such as at Hull and Liverpool), interventions are clearly advantageous. A cut, for example, in access times by just 15 minutes per HGV has a Present Value of over £200m for access to Seaforth before account is taken of the environmental benefits that can be derived.
Similar arguments apply with respect to the need for expanded road capacity across the Pennines, particularly if more freight from the Continental mainland is to arrive in the North West via east coast ports.
The case for additional rail capacity is based on similar principles; the network is currently approaching capacity at key pinch-points so that without more capacity available for freight further transfer from road will be challenging, frustrating the opportunity to reduce environmental and user costs. That modal switch will be all the greater if Multimodal Distribution Parks (MDPs) are rail served while the cut in user costs that result can add to the proportion of UK warehousing located in the North, adding to Gross Value Added (GVA).
Other relatively low cost or self-funding interventions, such as a new quay in Leeds on the Aire and Calder Navigation to cater for building materials and semi-bulks; add further to benefits without significant extra costs.
However, there are a number of further interventions which have been proposed or considered that required explicit testing as a variant on the preferred strategy to determine the value they would bring. These are listed in Appendix A.3 but can be summarised as:
n Further road network expansion via a new road between the M1 north of Sheffield to Manchester and the introduction of ‘road-trains’ (multiple units being controlled by one driver);
n A radical upgrade of rail capability through double length intermodal trains (to reduce unit costs and paths required) and constructing a ‘piggyback’ capable route between the east coast and the North West;
n The subsidy of short sea shipping; and
n Regulations that effectively ban diesel powered HGVs from central city areas.
The proposed new road incorporating a tunnel through the Pennines would confer benefits to the freight industry through reduced travel times and would improve the case for distribution developments in South Yorkshire in particular. Approximately, the (annual) value of benefits in 2033 that could be generated as a contribution towards the capital investment would be some £137m, including £99m of mode shift benefits and £37m of user benefits (excluding any further benefits through reduced congestion or economic regeneration benefits). This is unlikely on its own to justify the investment.
A radical upgrade in rail capability would also generate an increase in the (annual) value of benefits in 2033 of £205m (£141m of user benefits and £64m of mode shift benefits). However, we do not believe this would be sufficient to justify the capital invested.

82 | Northern Freight & Logistics Report: Technical Appendices | 83
In both cases, we consider it would be a mistake to make our recommendations dependent on these interventions.
A subsidy for short sea shipping could generate an annual (2033) user benefit that exceeds the cost of the subsidy by diverting more traffic to longer-distance shipping services (a form of virtuous circle) and as a result of the environmental benefits generated by further reducing long distance overland haulage from southern ports. However, the margin of benefit is modest and the legal hurdles that would need to be overcome for international cargo potentially prohibitive. As stated above, this is therefore a further intervention for which investment may not be worthwhile.
Regulations to limit diesel powered HGVs through central city areas raises different issues. There would undoubtedly be a significant cost. We estimate that the central areas of the major Northern cities experience around 200 million HGV kms per annum. This amount of traffic would generate some 3,500 tonnes of NOx, the equivalent of that produced by around 125,000 people. In the event that air quality regulations effectively limit the ability of the central areas of the major cities to absorb more people and jobs it follows that cutting HGV emissions through such regulation could make a significant contribution to economic regeneration in central urban areas. These are just those areas that will benefit the most through the improved public transport connectivity being considered by Transport for the North. However, until that ‘air quality’ case can be made, which is beyond the remit of this study, that ‘value calculation’ can only be speculative. This is discussed further in Appendix E.7.
These alternative intervention bundles revealed, therefore, that further benefits could be identified through a more ‘radical’ approach to developing a freight and logistics strategy but that none were essential to define a strategy that could in any event demonstrate major benefits. Our conclusion was, therefore, that the initially defined Preliminary Central Scenario and its ‘bundle’ of measures with only minor amendment should be defined as the Preferred Recommendations to be worked up in detail.
However, the lessons derived from these tests should not be forgotten and could provide a ‘direction of travel’ for incremental upgrade. The benefits through the proposed subsidy for short sea liner services could be replicated through how port infrastructure dues are charged; shipping effectively pays full infrastructure charges (what the market will bear) while rail freight pays only for incremental wear and tear. Upgraded rail infrastructure, particularly to accommodate double length trains on congested lengths of the network could provide a means of dealing with capacity shortfalls and could be achieved through simply joining trains together that can be split for onward delivery. A new trans-Pennine road clearly confers benefits and it may prove feasible to identify a less expensive route that can be equally effective. And finally our proposals within the Preferred Recommendations to gradually locate major rail and water linked distribution parks on the edge of conurbations defines a location that is highly compatible with the development of low or zero emission urban freight delivery vehicles which can reduce the add-on cost this approach implies, as deliveries would come direct from distribution centres and would not be subject to the extra cost of cross-docking in urban areas.
C.2 Preferred Recommendations
The Preferred Recommendations components are as per those presented for the Preliminary Central Scenario in Table A.2 in Appendix A.3.
C.3 Appraisal Results
This section sets out the results of the transport, environmental and wider economic appraisal exercises, which are presented in an Appraisal Summary Table alongside additional analysis.
C.3.1 Transport Appraisal
A 60 year appraisal has been undertaken of the preferred recommendations, with transport user and non-user costs and benefits discounted according to the discount rates set out in WebTAG Databook (December 2015) 7 as shown in Table C.1.
Table C.1: Discount Rates
Years from Current Year Discount Rate
0-30 3.50%
31-75 3.00%
76-125 2.50%
126-200 2.00%
201-300 1.50%
301 and over 1.00%
Source: WebTAG
Two forecast years have been adopted and explicitly modelled for the preferred strategy: 2033 and 2043, with the approach to calculating benefits defined as follows:
n Opening Year (assumed to be 2017) to 2033 - benefits linearly interpolated;
n 2033 to 2043 – benefits linearly interpolated; and
n 2043 to 2076 – benefits held constant at 2043 levels.
Key outputs from the modelling are shown in Table C.2 to Table C.6.
Table C.2: Freight km (million) and Tonnage (million)
2014 2033 Do Minimum
2033 Preferred
2043 Do Minimum
2043 Preferred
GB HGV km 25,306.50 29,435.80 27,745.20 31,014.60 28,458.40
of which in the North 6,798.40 7,923.50 7,902.60 8,273.20 8,186.60
GB HGV Tonnes 1,531.20 1,737.30 1,728.50 1,831.00 1,815.70
of which to/from/within the North
537.9 639.5 671.1 675.0 718.5
GB Train kms 41.1 45.0 77.7 49.5 106.7
of which in the North 10.8 10.3 19.2 11.1 26.1
7 https://www.gov.uk/government/publications/webtag-tag-data-book-december-2015

84 | Northern Freight & Logistics Report: Technical Appendices | 85
Table C.3: Ro-ro Units (million)
2014 2033 Do Minimum
2033 Preferred
2043 Do Minimum
2043 Preferred
Humber 1.05 1.49 2.75 1.81 3.3
North West 0.78 2.21 2.44 2.59 2.83
North East 0.19 0.24 0.37 0.29 0.42
Other GB 6.28 8.51 6.89 9.58 7.74
Total 8.3 12.45 12.45 14.27 14.29
of which North 2.02 3.94 5.56 4.69 6.55
Table C.4: LoLo Units (million)
2014 2033 Do Minimum
2033 Preferred
2043 Do Minimum
2043 Preferred
Humber 0.25 0.35 0.32 0.42 0.37
North West 0.39 0.55 0.89 0.66 1.05
North East 0.19 0.29 0.42 0.35 0.49
Other GB 4.57 6.8 6.37 8.06 7.57
Total 5.40 7.99 8.00 9.49 9.48
of which North 0.83 1.19 1.63 1.43 1.91
Table C.5: User Costs Compared Against Do Minimum (£M)
2033 Preferred 2043 Preferred
2033 Do Minimum
Change from 2033 Do Minimum
2043 Do Minimum
Change from 2043 Do Minimum
Road User Costs 29,978.37 -1,305.34 33,610.59 -1,556.54
Rail User Costs 605.58 453.02 637.19 908.29
Shipping Cost 1,441.37 -35.82 1,703.194 -54.83
Relative European Inland Cost 3,808.26 -295.51 4,927.44 -357.52
LoLo Deep Sea - 3.87 - 4.57
Waterway (Aire and Calder) - 4.18 - 4.18
Warehousing (Land+Labour) - -68.40 - -108.63
Total -1,244.00 -1,160.48
12010 Prices, 2033 Values; 22010 Prices 2043 Values
Table C.6: Non-User Costs Compared Against Do Minimum (£M)
2033 Preferred 2043 Preferred
2033 Do Minimum
Change from 2033 Do Minimum
2043 Do Minimum
Change from 2043 Do Minimum
Congestion 12,147 -644.38 15,692 -1,195.72
Accidents 600 -22.95 757 -42.72
Noise 943 -50.62 1,220 -94.05
Pollution -670 -38.92 -869 -72.22
Greenhouse Gases 1,178 -64.14 2,134 -167.01
Infrastructure 3,609 -120.71 3,721 -184.35
Other (roads) 717 -41.40 756 -62.40
Taxation -4,803 277.22 -5,059 417.81
Total 12,147 -705.91 15,692 -1,400.67
12010 Prices, 2033 Values; 22010 Prices 2043 Values
The quantified monetary costs of the Preferred Recommendations compared against the Do Minimum are presented in the Appraisal Summary Table in Table C.7. The values are presented in £M 2010 Values and at 2010 Prices. A negative in the table indicates a cost saving against the Do Minimum (i.e. a benefit). Table C.8 summarises the impacts into total user and total non-user costs.
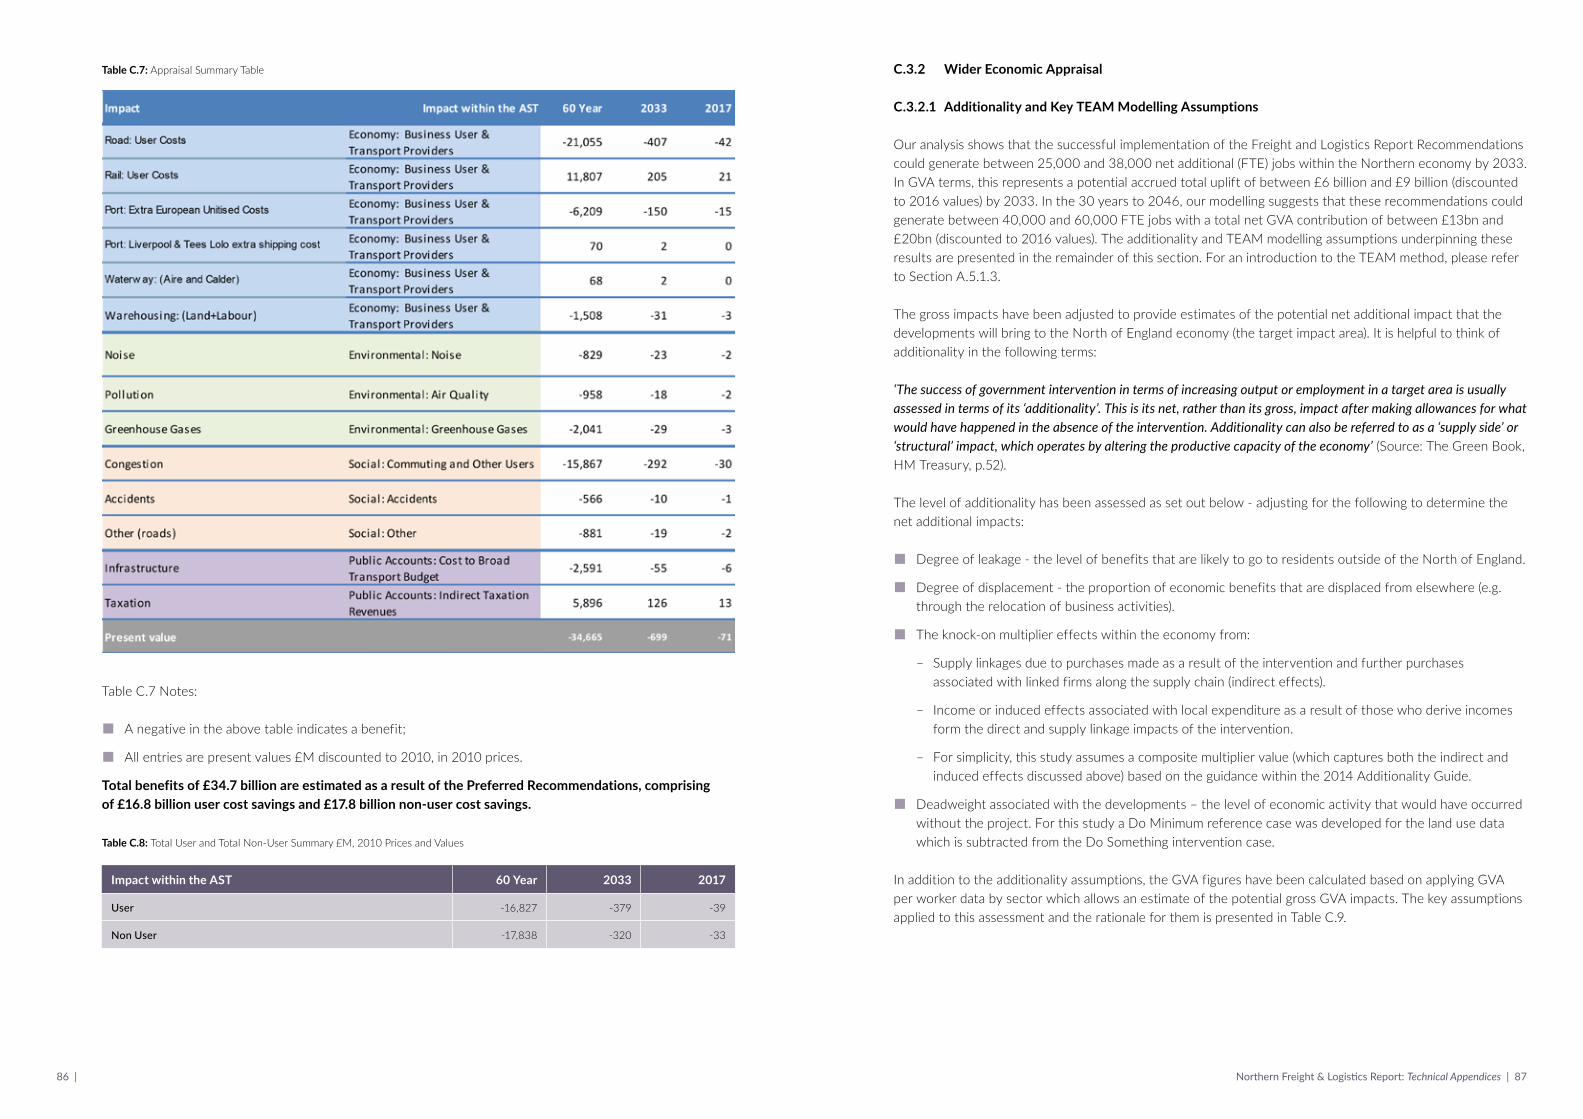
86 | Northern Freight & Logistics Report: Technical Appendices | 87
Table C.7: Appraisal Summary Table
Table C.7 Notes:
n A negative in the above table indicates a benefit;
n All entries are present values £M discounted to 2010, in 2010 prices.
Total benefits of £34.7 billion are estimated as a result of the Preferred Recommendations, comprising of £16.8 billion user cost savings and £17.8 billion non-user cost savings.
Table C.8: Total User and Total Non-User Summary £M, 2010 Prices and Values
Impact within the AST 60 Year 2033 2017
User -16,827 -379 -39
Non User -17,838 -320 -33
C.3.2 Wider Economic Appraisal
C.3.2.1 Additionality and Key TEAM Modelling Assumptions
Our analysis shows that the successful implementation of the Freight and Logistics Report Recommendations could generate between 25,000 and 38,000 net additional (FTE) jobs within the Northern economy by 2033. In GVA terms, this represents a potential accrued total uplift of between £6 billion and £9 billion (discounted to 2016 values) by 2033. In the 30 years to 2046, our modelling suggests that these recommendations could generate between 40,000 and 60,000 FTE jobs with a total net GVA contribution of between £13bn and £20bn (discounted to 2016 values). The additionality and TEAM modelling assumptions underpinning these results are presented in the remainder of this section. For an introduction to the TEAM method, please refer to Section A.5.1.3.
The gross impacts have been adjusted to provide estimates of the potential net additional impact that the developments will bring to the North of England economy (the target impact area). It is helpful to think of additionality in the following terms:
‘The success of government intervention in terms of increasing output or employment in a target area is usually assessed in terms of its ‘additionality’. This is its net, rather than its gross, impact after making allowances for what would have happened in the absence of the intervention. Additionality can also be referred to as a ‘supply side’ or ‘structural’ impact, which operates by altering the productive capacity of the economy’ (Source: The Green Book, HM Treasury, p.52).
The level of additionality has been assessed as set out below - adjusting for the following to determine the net additional impacts:
n Degree of leakage - the level of benefits that are likely to go to residents outside of the North of England.
n Degree of displacement - the proportion of economic benefits that are displaced from elsewhere (e.g. through the relocation of business activities).
n The knock-on multiplier effects within the economy from:
– Supply linkages due to purchases made as a result of the intervention and further purchases associated with linked firms along the supply chain (indirect effects).
– Income or induced effects associated with local expenditure as a result of those who derive incomes form the direct and supply linkage impacts of the intervention.
– For simplicity, this study assumes a composite multiplier value (which captures both the indirect and induced effects discussed above) based on the guidance within the 2014 Additionality Guide.
n Deadweight associated with the developments – the level of economic activity that would have occurred without the project. For this study a Do Minimum reference case was developed for the land use data which is subtracted from the Do Something intervention case.
In addition to the additionality assumptions, the GVA figures have been calculated based on applying GVA per worker data by sector which allows an estimate of the potential gross GVA impacts. The key assumptions applied to this assessment and the rationale for them is presented in Table C.9.

88 | Northern Freight & Logistics Report: Technical Appendices | 89
Table C.9: Key TEAM Assumptions
Assumption Assumption Applied
Rationale
Impact Area - The impacts and benefits are analysed at the North of England level, defined by the three regions of North West, North East and Yorkshire & the Humber.
Warehousing Demand Growth Compared to Do Minimum Scenario
As per Table C.10 Land use change figures drawn from analysis and assumptions presented in Appendix E.6 which draws on analysis using the Great Britain Freight Model and professional judgement.
Occupancy Rate (Full Development)
90% Assuming demand for additional warehousing will be taken up, to recognise that there will always be an element of churn as businesses move between sites to fill their needs, an occupancy rate of 90% has been applied.
Warehouse (B8) (Large Scale and High Bay Warehousing
80 m2 per job Employment density guidance within the HCA Employment Density Guide varies by type of Distribution Centre. Density of National Distribution Centres is suggested at 95 m2 required per job; Regional Distribution Centre 77 m2; ‘Final Mile’ Distribution Centre 70 m2. As such, 80 m2 is considered broadly appropriate without further in depth analysis.
Composite Multiplier
1.56 For simplicity and given the lack of survey data (which would facilitate the use of input-output modelling), this study assumes a composite multiplier value. Within the Additionality Guide, the regional level range is between 1.38 and 1.56. At the UK level, suggested composite multipliers range from 1.8 to 2.8. Following discussions with the DfT it was determined to apply a cautious estimate of 1.56, though, as the Northern economy includes three regions, this may be an under-estimate.
Deadweight 0% N/A – Deadweight included in Do Minimum Scenario.
Leakage 10% Small allowance for Leakage allowed as some employees may live outside the North of England (such as in Derbyshire in the East Midlands or North Wales). The majority of benefits are anticipated to go to people living within the three regions in the North of England. Further analysis of travel to work patterns would be needed to refine this figure further.
Displacement 0% There will be churn as some businesses move within the Northern economy. However, the Do Minimum and the intervention scenarios land use data applied are aggregated figures (i.e. not at a site by site level) and so the churn is already factored into the figures. As such, the displacement factor applied for the Northern economy is zero.
Substitution 0% As per Table 2.2 of the Additionality Guide, substitution is not usually an issue for transport schemes and we have not seen evidence to suggest it would be an issue for the Freight and Logistics Strategy.
GVA Per Worker (Freight Sector)
£33,820 (North East); £35,829 (North West); £37,602 (Yorkshire & the Humber).
ONS 2012 data (Regional workplace GVA / Workforce Jobs) matched to transportation and storage sector with productivity assumed to be held constant8.
GVA Per Worker (Supply Chain) (Multiplier Jobs)
£38,715 (North East); £40,534 (North West); £39,267 (Yorkshire & the Humber).
ONS 2012 data (Regional workplace GVA / Workforce Jobs) matched to total economy. 2013 data with productivity assumed to be productivity held constant.
Discount Rate 3.5% The standard HM Treasury Green Book social discount rate of 3.5% has been applied to discount benefits to the 2016 Present Value9.
Build Out / Take Up Rate
Linear build out and take up of B8 land between 2017 and 2033. Same linear rate between 2033 and 2043. Land use stabilises at 2043.
Assumption in line with transport modelling and reductions in transport costs incentivising Freight businesses to locate to the North.
8 9
Table C.10 presents the assumptions made for the change in B8 warehousing floor space by region in 2014, 2033 and 2043 in the Do Minimum and the Preferred Scenarios.
Table C.10: B8 Warehousing Floor Space Change Forecasts by Region (m²)
Current 2033 2043
Area 2014 2033 Do Min
2033 Central
Impacts 2033
(Preferred - Do Min)
2043 Do Min
2043 Preferred
Impacts 2043
(Preferred - Do Min)
North East 1,197,554 1,258,405 1,325,522 67,117 1,277,635 1,384,232 106,597
North West 5,932,665 6,307,514 7,458,810 1,151,296 6,443,838 8,272,367 1,828,529
Yorkshire & the Humber
4,998,756 5,433,941 6,215,528 781,588 5,607,959 6,849,304 1,241,345
Total 12,128,976 12,999,860 14,999,860 2,000,000 13,329,432 16,505,903 3,176,471
Source: MDS Transmodal
C.3.2.2 Quantitative TEAM Assessment
Table C.11 and Table C.12 present the results of the quantitative TEAM assessment in terms of the estimated difference between the Do Minimum scenario and the Preferred Recommendations in 2033. It is important to note that the demand for warehousing will vary by scenario; however the change in demand for warehousing and logistics space is focused on the Preferred Recommendations only. There are alternative scenarios that have not been analysed through TEAM to assess the impacts of a road/rail/waterborne freight focused scenario, the impacts of higher growth within the Northern Economy, or the impact of a more environmentally focused bundle of measures. A qualitative discussion of the likely differences in the wider impacts of each scenario is provided in Appendix C.2.
The number of jobs that could be supported depends on many factors including the employment density of the individual site developments; the take up and occupancy rates achieved by the developments; supply of land through the planning system for warehousing use; and freight sector policies elsewhere in the UK such as in the Midlands and Scotland. Planning policies across the local authorities in the North will have a key impact on the rate of growth that could be achieved, particularly if distribution centres are required to be built on green belt land. As such, to represent this uncertainty, we present a low and a high scenario for the intervention of plus/minus 20%.
Our assessment suggests that by 2033, an additional two million square metres of increased warehousing will be required in the North of England, which could support an estimated total of between 25,000 and 38,000 net additional jobs within the Northern economy. Of these jobs, between 14,000 and 21,000 are estimated to be within the wider logistics sector supply chain (indirect effects) and jobs supported by additional rounds of expenditure from the directly employed workers salaries (induced effects). These results are presented in Table C.11 and Table C.12 and show the net additional jobs and GVA between the 2033 Preferred Recommendation scenario and the Do Minimum scenario.
8 There is emerging evidence to suggest that this GVA per worker figure underestimates the productivity achieved within the freight sector. For example, a recent study by BPF estimates that GVA per employee is around £51,000 a year, rising to £75,000 by 2035 – Delivering the goods, BPF, December 2015 http://www.bpf.org.uk/sites/default/files/resources/BPF-Delivering-the-Goods-Dec-15-web.pdf [accessed 15th January 2016]
9 The standard social discount rate of 3.5% has been applied though the developments are business developments so it might be more appropriate, though less usual, to apply a real terms rate of return on UK equities, which is generally put, on the basis of extensive research, at 6%.
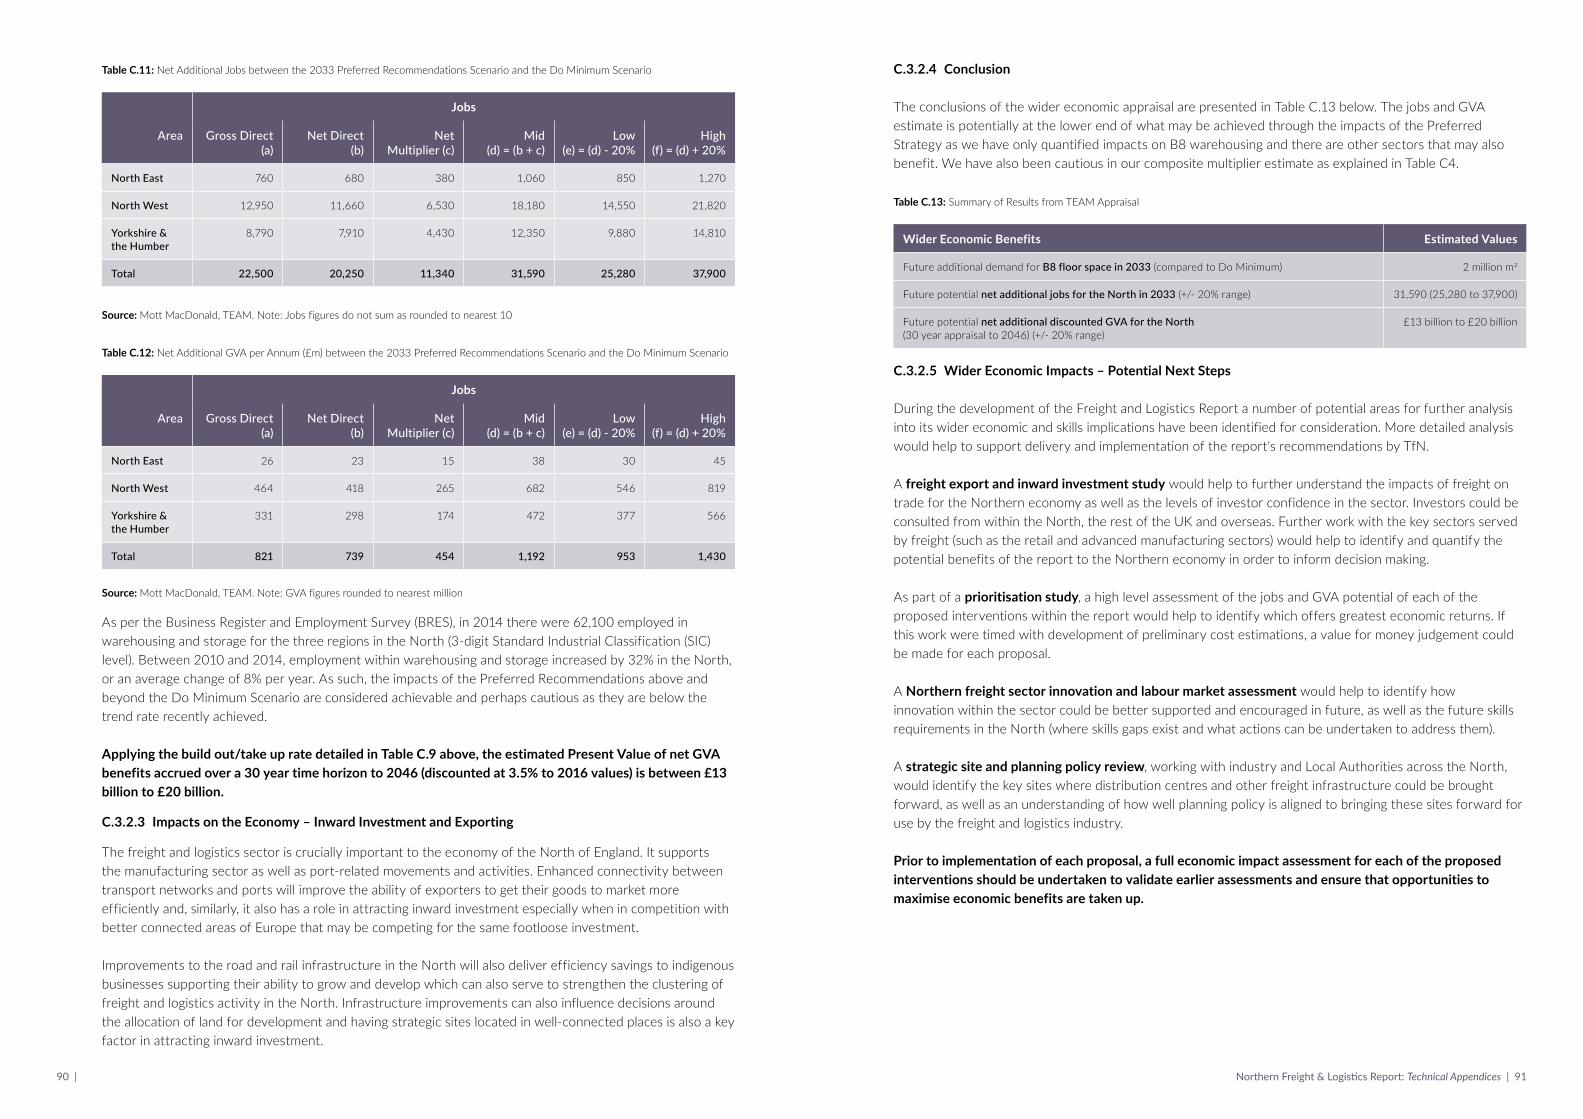
90 | Northern Freight & Logistics Report: Technical Appendices | 91
Table C.11: Net Additional Jobs between the 2033 Preferred Recommendations Scenario and the Do Minimum Scenario
Jobs
Area Gross Direct (a)
Net Direct (b)
Net Multiplier (c)
Mid (d) = (b + c)
Low (e) = (d) - 20%
High (f) = (d) + 20%
North East 760 680 380 1,060 850 1,270
North West 12,950 11,660 6,530 18,180 14,550 21,820
Yorkshire & the Humber
8,790 7,910 4,430 12,350 9,880 14,810
Total 22,500 20,250 11,340 31,590 25,280 37,900
Source: Mott MacDonald, TEAM. Note: Jobs figures do not sum as rounded to nearest 10
Table C.12: Net Additional GVA per Annum (£m) between the 2033 Preferred Recommendations Scenario and the Do Minimum Scenario
Jobs
Area Gross Direct (a)
Net Direct (b)
Net Multiplier (c)
Mid (d) = (b + c)
Low (e) = (d) - 20%
High (f) = (d) + 20%
North East 26 23 15 38 30 45
North West 464 418 265 682 546 819
Yorkshire & the Humber
331 298 174 472 377 566
Total 821 739 454 1,192 953 1,430
Source: Mott MacDonald, TEAM. Note: GVA figures rounded to nearest million
As per the Business Register and Employment Survey (BRES), in 2014 there were 62,100 employed in warehousing and storage for the three regions in the North (3-digit Standard Industrial Classification (SIC) level). Between 2010 and 2014, employment within warehousing and storage increased by 32% in the North, or an average change of 8% per year. As such, the impacts of the Preferred Recommendations above and beyond the Do Minimum Scenario are considered achievable and perhaps cautious as they are below the trend rate recently achieved.
Applying the build out/take up rate detailed in Table C.9 above, the estimated Present Value of net GVA benefits accrued over a 30 year time horizon to 2046 (discounted at 3.5% to 2016 values) is between £13 billion to £20 billion.
C.3.2.3 Impacts on the Economy – Inward Investment and Exporting
The freight and logistics sector is crucially important to the economy of the North of England. It supports the manufacturing sector as well as port-related movements and activities. Enhanced connectivity between transport networks and ports will improve the ability of exporters to get their goods to market more efficiently and, similarly, it also has a role in attracting inward investment especially when in competition with better connected areas of Europe that may be competing for the same footloose investment.
Improvements to the road and rail infrastructure in the North will also deliver efficiency savings to indigenous businesses supporting their ability to grow and develop which can also serve to strengthen the clustering of freight and logistics activity in the North. Infrastructure improvements can also influence decisions around the allocation of land for development and having strategic sites located in well-connected places is also a key factor in attracting inward investment.
C.3.2.4 Conclusion
The conclusions of the wider economic appraisal are presented in Table C.13 below. The jobs and GVA estimate is potentially at the lower end of what may be achieved through the impacts of the Preferred Strategy as we have only quantified impacts on B8 warehousing and there are other sectors that may also benefit. We have also been cautious in our composite multiplier estimate as explained in Table C4.
Table C.13: Summary of Results from TEAM Appraisal
Wider Economic Benefits Estimated Values
Future additional demand for B8 floor space in 2033 (compared to Do Minimum) 2 million m2
Future potential net additional jobs for the North in 2033 (+/- 20% range) 31,590 (25,280 to 37,900)
Future potential net additional discounted GVA for the North (30 year appraisal to 2046) (+/- 20% range)
£13 billion to £20 billion
C.3.2.5 Wider Economic Impacts – Potential Next Steps
During the development of the Freight and Logistics Report a number of potential areas for further analysis into its wider economic and skills implications have been identified for consideration. More detailed analysis would help to support delivery and implementation of the report's recommendations by TfN.
A freight export and inward investment study would help to further understand the impacts of freight on trade for the Northern economy as well as the levels of investor confidence in the sector. Investors could be consulted from within the North, the rest of the UK and overseas. Further work with the key sectors served by freight (such as the retail and advanced manufacturing sectors) would help to identify and quantify the potential benefits of the report to the Northern economy in order to inform decision making.
As part of a prioritisation study, a high level assessment of the jobs and GVA potential of each of the proposed interventions within the report would help to identify which offers greatest economic returns. If this work were timed with development of preliminary cost estimations, a value for money judgement could be made for each proposal.
A Northern freight sector innovation and labour market assessment would help to identify how innovation within the sector could be better supported and encouraged in future, as well as the future skills requirements in the North (where skills gaps exist and what actions can be undertaken to address them).
A strategic site and planning policy review, working with industry and Local Authorities across the North, would identify the key sites where distribution centres and other freight infrastructure could be brought forward, as well as an understanding of how well planning policy is aligned to bringing these sites forward for use by the freight and logistics industry.
Prior to implementation of each proposal, a full economic impact assessment for each of the proposed interventions should be undertaken to validate earlier assessments and ensure that opportunities to maximise economic benefits are taken up.

92 | Northern Freight & Logistics Report: Technical Appendices | 93
C.4 High Growth Scenario Sensitivity Test
In terms of representing the transformational economic scenario from the TfN Independent Economic Review (IER) in the modelling and appraisal framework there are a number of mechanisms that need to be taken into account:
n Increased population: leads to an increased consumption of food and other consumables in the North. We could expect that this is a linear relationship depending on how other variables change too. Increased population is also likely to lead to a greater consumption of construction materials (such as for house building), fuels etc.
n Increased GVA: leads to increased production in the North. In terms of freight, there is no clear relationship since the extra GVA will not necessarily be spread equally amongst the industries that exist at the moment. However, within the boundaries of the current study we have not considered which industries will be generating this extra GVA. Therefore for the purposes of our freight projections, have assumed that the production (and therefore freight traffic generation) increases in line with increased GVA equally across all industries in the North, and in line with GVA.
n Similarly increased GVA: leads to increased industrial consumption.
n In the Transformed North scenario is the extra freight activity between the North and other regions entirely additional to the UK, or is it (perhaps partly) at the expense of traffic between other regions? For example, if we consider the instance of an industry - mostly based in the North – that is growing in line with Northern GVA and serving the UK market. As national consumption would only be slightly increasing, this may result in the squeezing out of other producers, in other regions. However, the converse is also true and if a product was solely produced in the South and consumed in the North, and if Northern consumption increased, this would necessitate increased production in the South. Hence, identifying winners and losers is complicated, although the general pattern is that growth in a neighbouring region or country is beneficial in terms of generating trade. Therefore, and for the purpose of this study, we have (tentatively) assumed that increased growth in the North would likely result in a slight increase in growth in other UK regions.
With reference to the Independent Economic Review (IER) and the transformational projections for GDP/GVA and population growth for the various scenarios:
n GVA: The transformational projection indicates a 5.61% growth over the business as usual approach. Hence the 2014-2033 GVA growth in our standard 2033 scenarios should be scaled by a factor of 1.0561 to represent the Transformed North scenario.
n Population: The transformational projection indicates a 2.74% growth over the business as usual approach. Therefore the 2014-2033 population growth assumed in our standard 2033 scenarios should be scaled by a factor of 1.0274 to represent the Transformed North scenario.
Based on the above arguments and observations about the Transformed North GVA and population growth results, we have therefore undertaken the steps as follows:
Traffic Volumes
1. Calculated the average of the GVA and the population extra growth (beyond the business as usual scenario): The average of the scale factors 1.0561 and 1.0274 is 1.04175.
2. We have then applied this 1.04175 factor to all traffic to, from and within the North. This has resulted in slightly more total traffic to and from other regions.
3. We have then assigned this traffic to the transport networks to produce results. E.g.to quantify the extra traffic on the M62, and the extra traffic through Northern and non-Northern ports (as summarised in Table C.14 to Table C.16).
User and Non-User Benefits
To evaluate the user benefits of the preferred recommendations without Transformed North growth, we have considered the user costs in a "Do minimum" scenario and compared these to the preferred recommendations. As the total tonnes of cargo moved are the same, the difference in user costs represents the user benefits.
However, as there is more traffic in the Transformed North scenario, the total user costs will be higher than in the preferred recommendations - and probably higher than the Do-minimum scenario, so there is no meaningful comparator.
Clearly, if there is more traffic on Northern road and rail networks in the Transformed North scenario, there is more traffic to benefit from the transport improvements of the preferred recommendations, and these transport improvements become more essential as the existing road and rail capacity becomes increasingly insufficient.
A simple way of estimating the user benefits is to firstly note the total user benefit overall (not just in the North) in the preferred recommendations (without Transformed North) in 2033. This is £699 million as per Table C.7 (2010 prices and 2010 values).
If we then take into account the total % increase in tonnes overall (not just in the North) in the Transformed North scenario we can make a reasonable assumption about the level of growth in the country overall, e.g: if there's a 4.175% growth in traffic to/from/within the North, this level of growth is consistent with approximately 1.674% growth in tonnes overall for the country (Table C.14).
Given the extra 1.674% cargo transported overall in the Transformed North scenario, the overall user benefits of the preferred recommendations can be assumed to also increase by approximately 1.674%. The user and non-user benefits are therefore as summarised in Table C.17. The total user benefits (in 2033) for the Transformational scenario are £711 million compared to the £699 million for the preferred recommendations.
Table C.14: Freight Km (million) and Tonnes (million)
2033 Do Minimum
2033 Preferred Scenario
2033 Transformational
Scenario 2043 Do Minimum
2043 Preferred Scenario
GB HGV km 29,436 27,745 28,239 31,015 28,458
of which in the North 7,923 7,903 8,211 8,273 8,187
GB HGV Tonnes 1,737 1,728 1,756 1,831 1,816
of which to/from/within the North
639 671 699 675 719
GB Train kms 45 78 79 50 107
of which in the North 10 19 20 11 26
GB Rail freight tonnes 100 156 160 109 213
of which to/from/within the North
51 85 89 55 117

94 | Northern Freight & Logistics Report: Technical Appendices | 95
Table C.15: Ro-ro Units (million)
2014 2033 Do Minimum
2033 Preferred Scenario
2033 Transformational
Scenario 2043 Do Minimum
2043 Preferred Scenario
Humber 1.05 1.49 2.75 2.87 1.81 3.3
North West 0.78 2.21 2.45 2.55 2.59 2.83
North East 0.19 0.24 0.37 0.38 0.29 0.42
Other GB 6.28 8.51 6.89 6.93 9.58 7.74
Total 8.30 12.45 12.45 12.73 14.28 14.28
of which North 2.02 3.94 5.56 5.80 4.70 6.55
Table C.16: LoLo Units (million)
2014 2033 Do Minimum
2033 Preferred Scenario
2033 Transformational
Scenario 2043 Do Minimum
2043 Preferred Scenario
Humber 0.25 0.35 0.32 0.34 0.42 0.37
North West 0.39 0.55 0.89 0.92 0.66 1.05
North East 0.19 0.29 0.42 0.44 0.35 0.49
Other GB 4.57 6.8 6.37 6.45 8.06 7.57
Total 5.41 8.00 8.00 8.15 9.48 9.48
of which North 0.83 1.20 1.63 1.69 1.42 1.91
Table C.17: Appraisal Summary Table: 2033 User Costs and Benefits for Preferred Scenario compared to Transformational Scenario. (£M)
2010 Prices and Values
NB Negatives in the table imply a benefit
Table C.18: 2033 Summary of User and Non-User Benefits (£M) 2010 Prices and Values
Impact within the AST Preferred Transformational
User -379 -386
Non User -320 -325
NB Negatives in the table imply a benefit

96 | Northern Freight & Logistics Report: Technical Appendices | 97
Appendix D. Report Details
D.1 Full Report Measures List
This section presents the full list of public sector measures contained in the Preferred Recommendations, categorised into four different packages: rail; road, waterborne freight and policy and planning. Commentary is provided for each measure to explain the rationale behind its inclusion and the impacts that it is expected to have on the way in which the industry operates, including anticipated private sector responses.
Table D.1: Full List of Preferred Recommendations Public Sector Measures
Public Sector Measure Commentary
Rail
A package of infrastructure solutions in line with Network Rail’s declared aspiration to allow the use of 750m long trains on intermodal routes, and also the use of 20% more operational hours per week through continued changes to maintenance regimes. Cohesive W10/12 loading gauge access to ports and MDPs on intermodal routes (including trans-Pennine).
Enhancements to the existing conventional rail network to allow the freight operating companies to increase the efficiency of their services by operating longer trains, within a suitable loading gauge and using their locomotives for more time each week.
Public sector funding where required to link MDPs to the rail and waterborne freight networks.
MDPs are large distribution parks with access to the rail and/or waterborne freight networks as well as good access to the road network.Addressing market failure where it exists to ensure that MDPs are rail and/or water-connected by investing in those connections. Connections may be achieved through the uplift in the land value achieved through the granting of planning permission or some of the alternative approaches set out in Appendix E. It may also be worth considering funding mechanisms whereby the public sector takes the risk to fund a connection and recoups that cost through a usage charge.
‘Chaining’ of MDPs – ensuring that they are well-connected to a single freight route.
Ensuring that MDPs are well-located on the rail network to minimise the cost of loading gauge and capacity enhancements by focusing them on a main freight route.
Development of and securing for the freight industry 6 trans-Pennine freight paths per hour (3 in each direction).
To provide additional capacity for rail freight services on conventional routes on the east-west axis.
Development of a new North-South rail passenger route (HS2) – diverting passenger services from the WCML. Securing 5 freight paths per hour north of Wigan; 11 between Crewe and Wigan and 12 southwards of Crewe (two way totals).
To provide additional capacity for rail freight services on conventional routes on the north-south axis.
Creation of additional network capacity in advance of forecast demand on the East Coast Main Line and Midland Main Line e.g. passing loops, in-cab signalling, electrification and potential line re-openings to achieve and secure 14 freight paths per hour south of Doncaster and 5 per hour north of York (two-way totals).
Enhancements to the existing conventional rail network to provide additional capacity for rail freight services.
Enhanced rail network management e.g. relinquishment of unused paths.
Improvements to the existing management of the rail network to provide additional capacity for rail freight services.
Re-opening/upgrading rail links to address capacity shortfalls; for example Matlock – Buxton and Leamside.
Selected re-opening of routes for rail freight services. For example the Matlock-Buxton route would allow aggregates to be delivered to the South of England whilst providing additional capacity for passenger services on the Hope Valley Route between Manchester and Sheffield.

98 | Northern Freight & Logistics Report: Technical Appendices | 99
Public Sector Measure Commentary
Waterborne Freight
Public sector support for Liquid Natural Gas (LNG) bunkering and cold ironing infrastructure at ports.
Addressing market failure where it exists to ensure that ports in the North of England are able to offer LNG bunkering – as LNG may be able to offer lower variable costs per nautical mile for maritime transport in the future which will help the development of traffic through northern estuaries. The availability of this infrastructure will allow shipping lines to invest in LNG-powered vessels.The European Commission is currently assisting some ports on the Continent to install LNG bunkering infrastructure.
Financing for port / hinterland connections and infrastructure to support Motorways of the Sea services.
Addressing market failure where it exists to ensure that road and rail access to ports and, in some circumstances, shipping services between the North of England and other European ports can be developed. Motorways of the Sea are an EU initiative to support the development of more environmentally sustainable shipping services and associated infrastructure, both within ports and to connect ports to their hinterlands.
Public sector funding where required to link MDPs to the rail and waterborne freight networks.
MDPs are large distribution parks with access to the rail and/or waterborne freight networks as well as good access to the road network.Addressing market failure where it exists to ensure that MDPs are rail and/or water-connected by investing in those connections. Connections may be achieved through the uplift in the land value achieved through the granting of planning permission or some of the alternative approaches set out in Appendix E. It may also be worth considering funding mechanisms whereby the public sector takes the risk to fund a connection and recoups that cost through a usage charge.
Upgrade Aire & Calder Navigation to Class II waterway as far as Leeds (as per South Yorkshire waterway) to reach new quay at Stourton.
Upgrading the waterway network between the Humber and Leeds to allow cost-effective barges to access the city centre, mainly carrying bulk materials but also containers.
Road
Endorsement of TfN Northern Trans-Pennine improvements (A66/A69) – resilience for freight. Stage -1: Proposed Scheme (strategic study into the planned improvements)
Programme of works to increase capacity and resilience on the routes, thereby reducing journey times for HGVs. Major study being carried out in parallel as part of Roads Workstream. Dualling of the A69 and A66; economy of the north of England currently heavily dependent on the M62 for east-west connectivity.
Endorsement of TfN Manchester North West Quadrant improvements (M60) – capacity improvements. Stage -1: Proposed Scheme (strategic study into potential improvements)
Programme of works to increase capacity and resilience on the route, reducing journey times for HGVs. Major study being carried out in parallel as part of Roads Workstream. Aims to improve all modes of transport to the north and west of Manchester; M60 J8-18 currently experiences high congestion.
Development of a network of secure HGV parking facilities; for example at rail connected warehousing sites.
Addressing market failure where it exists to ensure that sufficient HGV parking is planned for and developed in strategic locations on the road network in the North of England to provide safe and secure parking at a reasonable cost for drivers, vehicles and their loads.
Investment into last mile distribution solutions and impact mitigation.
Addressing market failure where it exists to ensure that ‘last mile’ distribution into city centres can in the future be carried out using low or ultra-low emission vehicles based on a harmonised approach across the North of England.
Delivery of substantial improvements to land side access to ports.
Selected road enhancements to improve local road access to ports in the North of England (e.g. Hull and Liverpool). These include:A63 Castle Street (Yorkshire & Humber)Stage 2: Programme entry sort (Planning application to be submitted) - 1.5km improvement at A63 Castle Street including a new split level junction.A5036 Princess Way - Port of Liverpool Access (North West)Stage 0: Committed Scheme (ground investigations/surveys conducted Summer 2015) - Comprehensive upgrade to improve access to the Port of Liverpool from the A5036.
Implementation of appropriate vehicle signage and routing plans.
Planning authorities ensuring that signage and HGV drivers’ maps are available to help drivers take the most appropriate routes to access the major origins and destinations of freight e.g. industrial parks, large factories, shopping centres.
The report also endorses a number of existing proposals for local road network upgrades – including existing A road capacity upgrades, existing A road interchange / junction improvement schemes, existing link road / relief road / orbital road / bypass schemes, existing motorway interchange / junction improvement schemes, existing smart motorway schemes.
Programmes of works to increase capacity and resilience will reduce journey times for HGVs that will benefit the Northern freight and logistics industry. The full list of schemes endorsed by the report is provided in italics below.
A19 Testos Junction Improvements (North East)Stage 2: Programme entry granted (Preferred route announced in Spring 2014)
Construction of a flyover to take the A19 over the Testos junction; increase in A19 roundabout size.
South Heywood M62 J19 Link Road (North West)Stage 2: Included in Greater Manchester’s Local Growth Fund allocation
New 1km link road to existing and planned employment sites including the Heywood Distribution Park and in the South Heywood area.
Wigan Gateway - M58 Link (North West)Stage 2: Included in Greater Manchester’s Local Growth Fund allocation
2km single carriageway link road between the M6 J26 and the A571 Billinge Road/Foundry Lane junction.
Preston Western Distributor (North West)Stage 2: Included in Lancashire’s Local Growth Fund allocation (route approved; planning application under development)
New 4km long dual carriageway (and associated link roads) located to the west of Preston City Centre.
Middlewich Action Plan (North West)Stage 2: Programme entry granted (March 2015)
Construction of Middlewich Eastern Bypass, a 2.2km link between Booth Lane and Pochin Way.
East Leeds Orbital Road (Yorkshire & Humber)Stage 2: Included in the West Yorkshire Transport Fund; first phase to start construction in Spring 2016
7km route to stretch from the Outer Ring Road at Red Hall to Thorpe Park on the east side of Leeds.
M58 Junction 1 Improvements (North West)Stage 2: Programme entry granted (Sep 2015)
Additional slip lane facilities to enable movements onto the M58 southbound and off the M58 northbound carriageway.
Sunderland Strategic Transport Corridor (North East)Stage 2: New Wear Crossing - planning application due in 2016. Dualling from New Wear Crossing to City Centre. Included in the North East’s Local Growth Fund allocation
Dual carriageway link between A19 and the Port of Sunderland inc. new bridge over the River Wear.
Poynton Relief Road (North West)Stage 2: Included in Cheshire and Warrington’s Local Growth Fund allocation. Preferred route announced November 2015; planning application to follow in 2016.
3km relief road to stretch between the Manchester Airport Eastern Link Road and the south of Poynton.
New High Level Bridge in Warrington (North West)Stage 1: Funding plan under development
New bridge crossing over the River Mersey; improved route to Slutchers Lane in the south of the town centre.
Durham Western Relief Road (North East)Stage 1: Included in the North East’s Local Growth Fund allocation
New connection between the principal roads feeding into Durham from the west, the A690 and A691.

100 | Northern Freight & Logistics Report: Technical Appendices | 101
A585 Windy Harbour - Skippool (North West)Stage 0: Committed Scheme (DfT confirmed funding for the scheme in December 2014)
New bypass of two congested junctions on the A585 at Little Singleton north of the M55.
Mottram Moor link road (North West)Stage 0: Committed Scheme (DfT funding commitment in December 2014; feasibility study confirmed)
New link road from the M67 to a new junction at the A57 (T) at Mottram Moor.
A57(T) to A57 link road (North West)Stage 0: Committed Scheme (DfT funding commitment in December 2014; feasibility study confirmed)
New single carriageway from the A57 at Mottram Moor to a new junction on the A57 at Brookfield.
A61 Dualling (Yorkshire & Humber)Stage 0: Committed Scheme (DfT funding commitment in December 2014; feasibility study confirmed)
Completion of the dualling of the A61 between the A616 roundabout and Junction 36 of the M1.
A1 Birtley to Coal House widening (North East)Stage 0: Committed Scheme (Funding from the DfT confirmed in December 2014)
Widening of the A1 south of Gateshead between the Birtley and Coalhouse junctions to provide dual three lanes.
A19 Norton to Wynard (North East)Stage 0: Committed Scheme (Funding from the DfT confirmed in December 2014)
Widening of the Billingham Bypass to dual three lanes.
M60 Simister Island Interchange (North West)Stage 0: Committed Scheme (DfT funding commitment in December 2014)
Improvement of the intersection between the M60, M62 and M66 north of Manchester.
M1/M62 Lofthouse Interchange (Yorkshire & Humber)Stage 0: Committed Scheme (DfT funding commitment in December 2014)
Reconstruction of the M1 and M62 Junction as a free-flowing interchange.
A1 Scotswood to North Brunton (North East)Stage 0: Committed Scheme (Scheme identified in Dec 14 after completion of A1 congestion feasibility study)
Narrow lane widening between J74 (Scotshead) to Jn 79 (North Brunton); 3 or 4 lanes of traffic to be provided at junctions.
M62 J20-25 Smart Motorway Stage 0: Committed Scheme (DfT funding commitment in December 2014 - to be developed for this Road Period)
Upgrade to Smart Motorway across the Pennines between Rochdale (J20) and Brighouse (J25).
M1 J35A-39 Smart MotorwayStage 0: Committed Scheme (DfT funding commitment in December 2014 - to be developed for next Road Period)
Upgrade to Smart Motorway between J35A (for the A616) and Denby Dale (J39) near Barnsley.
M6 J21A-26 Smart MotorwayStage 0: Committed Scheme (DfT funding commitment in December 2014 - to be developed for this Road Period)
Upgrade to Smart Motorway between the M62 Croft Interchange (J21A) and Wigan (J26).
M62 J10-12 Smart MotorwayStage 0: Committed Scheme (DfT funding commitment in December 2014 - to be developed for this Road Period)
Upgrade to Smart Motorway between the M6 Croft Interchange (J10) and the M60 Winton Interchange (J12) to the west of Manchester.
M60 J24-27 & 1-4 Smart MotorwayStage 0: Committed Scheme (DfT funding commitment in December 2014 - to be developed for this Road Period)
Upgrade to Smart Motorway between the M67 Denton interchange (J24) to the A560 (J27) and between Stockport (J1) and the M56 (J4).
M56 J6-8 Smart MotorwayStage 0: Committed Scheme (DfT funding commitment in December 2014 - to be developed for this Road Period)
Upgrade to Smart Motorway between Manchester Airport (J6) to the A556 (J8) including hard shoulder running.
M6 J16-19 Smart MotorwayStage 0: Committed Scheme (DfT funding commitment in December 2014 - to be developed for this Road Period)
Upgrade to Smart Motorway between the junctions with the A500 (J16) and the A556 (J19).
M53 J5-11 Smart Motorway Stage 0: Committed Scheme (DfT funding commitment in December 2014 - to be developed for this Road Period)
Upgrade to Smart Motorway between the junction with the A41 (J5) and the M56 Stoak Interchange (J11).
A1 Redhouse to Darrington (Yorkshire & Humber)Stage -1: Proposed Scheme (planning work still to start)
Upgrade of last non-motorway section of the A1 in Yorkshire to motorway standard.
A1 (M) Doncaster Bypass (Yorkshire & Humber)Stage -1: Proposed Scheme (planning work still to start)
Creation of a new strategic route to the North East with additional lane capacity for the A1(M) around Doncaster.
Policy and Planning
TfN to explore with local and national government the most appropriate mechanisms to secure an accelerated build out of well-sited MDPs and to identify the best ways in which public sector support for transport infrastructure such as rail connections can be provided.
The provision of 50 hectares per annum of large, suitable sites for MDP development with the potential for rail and/or water connections is critical to successful strategy delivery. TfN must explore the most appropriate ways in which these sites can be brought forward through the planning system and also the mechanisms through which the appropriate connections can be funded.
TfN to maintain an evidence base and leadership role for freight.
To enable continual monitoring of the degree to which the road, rail and waterway network and the supply of land for freight and logistics meet industry requirements in terms of capacity and location.
TfN to specify the required outputs such as capacity and performance of road and rail networks.
To ensure that the capacity and capability of the North’s road and rail networks is optimised with respect to both passenger and freight users (e.g. through rail timetabling), so that capacity can be made available for rail freight services ahead of demand.
TfN to engage with similar sub-national transport authorities to develop strategies of mutual benefit.
Bi-lateral discussions with neighbouring areas, such as the Midlands, Wales and Scotland, to achieve outcomes of mutual benefit. Such outcomes might include co-ordinated interventions to improve cross-boundary connections and to reduce transit traffic that could be handled via northern ports.
TfN to work with the National Infrastructure Commission (NIC). To ensure that infrastructure of strategic importance to the North is taken forward as Endorsed Recommendations by the NIC and through liaison with the NIC.
TfN to work with ‘Business North’. To ensure that the private sector is able to provide advice on necessary actions to implement the strategy through the ‘Business North’ initiative, which is backed by the Confederation of British Industry.
TfN to safeguard access to the rail network for freight. To ensure that capacity is available ahead of demand by securing access options (guaranteed freight paths) throughout the country as required to protect its own investments in network upgrades.
Consideration of potential benefits of freight operator’s recognition schemes such as ECO Stars and implementation of a pan-Northern scheme if considered beneficial.
TfN to carry out an assessment of the costs and benefits of developing a pan-northern scheme to encourage road hauliers to adopt measures that have the aim of increasing safety and operational efficiency and reducing environmental emissions, and then roll out the scheme over the medium to long term if considered beneficial.
Contribution to pan-Northern inward investment marketing initiatives.
TfN to carry out an assessment of the costs and benefits of developing a pan-northern marketing initiative to demonstrate how freight and logistics can encourage inward investment in the North.
Development of a consistent, harmonised approach to the regulation of access by freight vehicles in urban areas.
TfN to develop a consistent, harmonised approach to the regulation of freight access in urban areas in order to encourage the use of ultra-low emission vehicles for ‘last mile’ distribution in the main northern cities and then implements the regulations across the North. This would incentivise the private sector to invest in ultra-low emission vehicles for ‘last mile’ collections and deliveries and in operational concepts such as consolidation on the edge of the main cities.

102 | Northern Freight & Logistics Report: Technical Appendices | 103
Investment and support for freight and logistics industry focused training/apprenticeship programmes and qualifications at all levels. TfN support for and promotion of existing programmes commissioned and funded by bodies such as BIS/SKA and to lobby for further funding and wider programmes.TfN to carry out an assessment of supply and demand for training and education in relevant freight and logistics skills in the North.TfN to then develop a strategy to ensure the supply of skilled labour over the long-term.
To address existing industry concerns that there is a shortage of HGV drivers; as the average age of drivers is 50+, and to provide a diversified, qualified workforce over the longer-term to support the growing freight and logistics industry. Any assistance provided by TfN must be non-discriminatory and avoid State aid under EU law.
D.2 Rail Freight Path Proposals
One of the key measures put forward in the Preferred Recommendations is the provision of additional rail freight capacity on key North-South and East-West axes, as well as on certain rail freight routes in the South. Table D.2 below sets out the future paths required per hour in 2033 on these key axes and provides a comparison to the existing level of path provision. It should be noted that, by 2033, it is assumed that 20% longer trains will be operating for 20% more days per week i.e. 44% more capacity with the same paths.
Table D.2: Rail Freight Paths per Hour (Directions Summed)
2014 Preferred Recommendations (2033)
Additional Capacity Required
West Coast Main Line
North of Wigan 3.1 4.8 1.7
Crossing Weaver 6.3 11.1 4.8
South of Crewe 6.8 11.5 4.7
East Coast Main Line + Midland Main Line
North of York 5.4 5.1 -0.3
South of Doncaster 7.4 13.6 6.2
Crossing Pennines
Total Crossing Pennines 4.1 6.0 1.9
Also Relevant:
Through Oxford 4.0 5.1 1.1
Felixstowe Branch 3.7 7.8 4.1
Source: MDS Transmodal
D.3 Anticipated Private Sector Response: Multimodal Distribution Parks
One of the main anticipated responses from the private sector as a result of the implementation of the suite of public sector measures outlined in Appendix D.1 and the associated efficiency savings is the development of additional MDPs in the North of England and wider UK.
Table D.3 identifies the locations of potential UK MDPs, whether they have the potential for rail and/or water connections and their status in spring 2016. It should be noted that the list of sites set out in the table reflects the sites assumed for modelling purposes, both for this study and the 2013 Freight Market
Study for Network Rail. It is important to recognise that, without similar sites in the South and the Midlands, the Preferred Recommendations cannot be fully delivered, as trains require remote destination terminals if they are to fulfil their role in providing lower cost transport. The list is not intended to be definitive, but it is representative of what would be required.
Table D.3: Potential UK Multimodal Distribution Parks
Site (Old) County Name
Region Potential for Rail Connection?
Potential for Water Connection?
Status (Spring 2016)
Rossington South Yorkshire Yorkshire & Humber
Y N Being developed
Wakefield West Yorkshire Yorkshire & Humber
Y N Existing*
Ditton Cheshire North West Y N Existing*
Port Salford Greater Manchester
North West Y Y Being developed
Immingham Humberside Yorkshire & Humber
Y Y Within port
Tees Cleveland North East Y Y Existing*
Seaforth Merseyside North West Y Y Land being assembled
Sheffield South Yorkshire Yorkshire & Humber
Y N Being developed
Port Warrington Cheshire North West Y Y Not yet rail-linked
Doncaster South Yorkshire Yorkshire & Humber
Y N Existing
Selby West Yorkshire Yorkshire & Humber
Y N Existing
Knowsley Merseyside North West Y N Being re-developed
Kingsway Greater Manchester
North West Y N Not yet rail-linked
Parkside Merseyside North West Y N Not yet consented
Risley Cheshire North West Y N Not yet developed
Port Cheshire (EP) Cheshire North West Y Y Potential to expand
Goole Humberside Yorkshire & Humber
Y Y Potential to expand
Tyne Tyne & Wear North East Y Y Potential to develop
Wigan Greater Manchester
North West Y N Not yet developed
Stourton West Yorkshire Yorkshire & Humber
Y Y Capable of redevelopment
Markham Vale Derbyshire East Midlands Y N Proposed

104 | Northern Freight & Logistics Report: Technical Appendices | 105
DIRFT Northamptonshire East Midlands Y N Existing & expansion consented
London Gateway Essex East of England Y Y Consented & being developed
Burnaston X / Etwall
Derbyshire East Midlands Y N Planning application anticipated
Corby Northamptonshire East Midlands Y N Existing, capable of being formalised
Four Ashes / F'stone
Staffordshire West Midlands Y N Proposed
Bicester Oxfordshire South East Y N Potential to develop
Milton Keynes Buckinghamshire South East Y N Proposed
South Northampton
Northamptonshire East Midlands Y N Proposed
Kegworth Leicestershire East Midlands Y N Consented
Sevington Kent South East Y N Proposed
Hams Hall West Midlands West Midlands Y N Existing
Avonmouth Avon South West N N Proposed
Radlett Hertfordshire East of England Y N Consented
Mossend Strathclyde Scotland Y N Existing
Gartcosh Strathclyde Scotland Y N Proposed
Castle Donington Leicestershire East Midlands Y N Existing*
Luton Bedfordshire East of England Y N Proposed
Barking Essex East of England Y N Existing*
Stoke Staffordshire West Midlands Y N Proposed
Birch Coppice Warwickshire West Midlands Y N Existing*
Dartford (Howbury P)
Kent South East Y N Consented
SIFE Berkshire South East Y N Awaiting consent
Grangemouth Central Scotland Y Y Existing*
Coventry West Midlands West Midlands Y N Existing
Swindon Wiltshire South West Y N Existing
Wentloog South Glamorgan Wales Y N Existing*
Telford Shropshire West Midlands Y N Existing
* Potential to expand
D.4 Application of Stakeholder Consultation in Report Development
In order to ensure that stakeholder expertise, experience and vision for the freight and logistics sector informed the report development process, a comprehensive programme of stakeholder engagement was undertaken as outlined in the methodology provided in Appendix A.2. This section summarises the stakeholder feedback received by project phase and provides an overview of how it has been used to shape and inform the Preferred Recommendations.
D.4.1 Phase 1 – Establishing the Baseline
Stakeholder engagement was a key element in Phase 1 and several different consultation activities were undertaken to inform the development of a baseline for the report. Stakeholders were encouraged to provide their views on the current strengths and opportunities for the sector; constraints and issues; and the changes and developments required for the sector to realise its potential. Key findings from the consultation activities undertaken in Phase 1 are briefly summarised below.
D.4.1.1 Strengths and Opportunities
During the interviews and at the report development conference and online survey, stakeholders were asked to give their views on the strengths and opportunities for freight and logistics in the North of England. Below, the key themes and areas identified are summarised. These comments were used to set the context for the report and identified areas for where policy could be focused in order to support the sector in realising its potential.
Current Infrastructure
Stakeholders identified existing infrastructure as a strength for the freight and logistics sector in the North. East and West ports, inland waterways, rail, road and air were all identified individually as strengths but generally stakeholders also stressed the importance of the connections between these modes. The combination of modes and connections were seen to distinguish the North from other areas of the UK. Existing intermodal provision was seen as a strength whilst the availability of land for the provision of further sites was seen as an opportunity.
The geographic location of the North of England was seen to offer both a strength and an opportunity in terms of proximity and access to centres of population within the North, Scotland and the South. In particular, the proximity of the Northern ports to centres of population compared to Southern ports was seen to offer significant advantage and opportunity. The ability to receive manufacturing cargoes in the North was also identified as a comparative advantage over the South.
The cost of land and labour in the North compared to the South of England were identified as key strengths. In addition, stakeholders identified that the planning regime (whilst noted below as a constraint) was more favourable than in the South. The North was also seen as less congested than both the Midlands and the South.
D.4.1.2 Issues and Constraints
Stakeholders were also asked to identify current issues and constraints in the sector and the findings from this exercise have been used when considering potential interventions to be included within the six packages of bundles. The key themes are briefly set out below.

106 | Northern Freight & Logistics Report: Technical Appendices | 107
Capacity and Congestion
Congestion and capacity on the transport network were the most commonly identified topics when stakeholders were asked to identify constraints and issues for the sector. Constraints on East-West routes were identified on road and rail. North-South links were also felt to be nearing capacity which could limit any plans within the report to service the South from Northern bases.
When asked to consider highway capacity, stakeholders considered that congestion on the M62 and M60 were significantly constraining the sector, however, stakeholders also identified a range of pinch-points across the North that impacted their businesses. Congestion for last mile journeys was also flagged as a constraint as was congestion approaching ports, particularly in Liverpool and Hull. Whilst port infrastructure was identified as a key strength for the North, the need to update and renew this was also stressed.
Lack of sufficient high gauge capacity was identified as a substantial constraint for rail freight. It was also argued that more intermodal facilities are required but that comparatively few are currently proposed in the North compared to the rest of the UK. In addition, it was felt that generally across the North, there was insufficient rail connectivity with air. For many of the rail constraints, stakeholders considered that a prolonged lack of sufficient investment in the rail network was a key contributing factor which had resulted in substantial capacity issues. Poor quality rail freight paths were much discussed and the impact on asset utilisation stressed. Furthermore, many stakeholders expressed the view that passenger rail was prioritised over freight to the extent that it constrained the sector.
Inland waterways were seen to offer significant opportunity but were currently constrained by a lack of sufficient infrastructure and investment.
Planning and Policy
A lack of previous collaboration between the Northern regions was seen to have constrained strategic planning and investment. It was felt that freight had not been considered at a strategic level previously and this had constrained the sector, acting as a barrier to private investments. In addition, there was much frustration expressed by stakeholders about the bureaucracy, cost and delays that planning processes brought to the sector. Freight was also not seen to be part of the strategic planning framework.
Training and Skills
Another widely expressed constraint and growing issue for the sector was the shortage of Heavy Goods Vehicles (HGV) drivers. Stakeholders expressed difficulties in recruiting, retaining and training suitably qualified HGV drivers. The cost of obtaining a license, the comparative salary with other similar roles and the unsociable hours were all thought to make it challenging to attract new people into the role. Skills and training in the sector were broadly thought to be a constraint and were identified as an area where there are opportunities to attract new people to the industry through increased training provision.
D.4.1.3 Changes and Developments
Stakeholders were asked to identify the changes and developments that they saw as necessary for the sector to realise its potential. A full list of interventions, changes and developments were collated and used to inform the development of bundles, scenario analysis and the production of the strategy. We present the key themes and a summary of suggestions below.
Specific Improvements
Specific improvement schemes across rail, road, air and water networks were identified, as were the need for inter-modal and distribution investments. The need for investment in East-West routes came through particularly strongly in the stakeholder submissions.
Long-Term Strategic Approach
Stakeholders wanted to see a long-term and strategic approach to both public sector investment and planning with freight and logistics being seen as a strategic priority. An integrated approach to transport and spatial planning was thought necessary, with areas that might have a future freight use being ‘protected’. In addition, ‘red tape’ in planning and regulation processes were thought to offer much potential for improvement and stakeholders stressed that these interventions should happen early, providing important ‘quick-wins’.
Changing Demands for the Industry
Demographic patterns, consumer trends and increasing requirements in terms of speed of delivery, were all thought to be in need of consideration in terms of ensuring that interventions in the sector were appropriate.This included the need to consider last mile journeys and how these may be satisfied over the coming decades.
Hi-Technology
Again, thinking about the lifetime of the report, some respondents stressed the need for hi-technology solutions to be fully considered as both a substitute for more traditional investment and to complement such investments.
Training and Education
Particularly driven by a shortage of HGV drivers, stakeholders stressed the need to offer appropriate training opportunities. The need for skills and training across the sector and measures that attracted new people to the sector, which was generally seen not to have a very high profile image, were identified.
Collaboration
The report was seen as an opportunity to develop public-private collaborative working both in terms of particular investments and also in relation to sharing knowledge and experience in developing policy. Suggestions such as working groups and regional representatives built on the consultation activities that have been part of the report development so far were voiced. Collaboration within the sector in terms of marketing and offering a common voice to influence policy was also seen to offer potential.
Considerations Beyond and Within the North of England
Finally, many stakeholders stressed the connections that exist beyond the North of England, and the much broader network of which freight is a part. They warned against the report and associated interventions being too inward looking. In addition, stakeholders stressed the need to explicitly consider the impact of the recommendations on different areas within the North of England.
D.4.2 Phase 2 – Forecasting the Future
As set out in Appendix A.2, the Steering Group (SG) and the Private Sector Reference Group (PSRG) provided feedback on the Phase 2 methodology, including the six scenarios which contained a series of proposed bundles of interventions. In addition, group members were also asked to consider the initial modelling outputs for the Preliminary Central Scenario as part of a joint SG and PSRG workshop held on 2nd December 2015.

108 | Northern Freight & Logistics Report: Technical Appendices | 109
Stakeholder feedback on the Phase 2 methodology was reviewed by the project team and considered when developing the final report. The review exercise found that many of the comments received related to the content of the bundles, rather than the methodology, with the focus of the majority of observations querying the rationale for including or omitting certain interventions. Specific queries relating to the methodology included the principles which underpinned the macro economic and population assumptions, and these comments were addressed in the final report utilising guidance from the DfT and findings from the parallel TfN studies.
Following the review, many of the comments were discussed further at the joint SG and PSRG workshop. In addition, stakeholder feedback was considered in the development of the final report, resulting in greater rationale to underpin the inclusion of interventions.
D.4.3 Phase 3 – Report Development
A stakeholder conference was held on 14th January 2016 at Leeds City Museum. Over 90 delegates attended representing the private and public sectors from the local, regional, pan regional and national levels.
Following a series of presentations on the draft report, including an overview of the proposal interventions and the appraisal outputs, stakeholders were invited to comment and provide feedback within a facilitated workshop session. Nine workshop groups were convened and key findings and general themes are set out in turn below.
Following the conference, the project team reflected upon the stakeholder findings and utilised the feedback in the development of the final report and recommendations.
D.4.3.1 Draft Vision and Objectives
Conference delegates were asked to comment on the vision presented in the draft report and feedback on this was mixed. Many of the delegates considered that the vision was appropriate for the report as it was modest, pragmatic and deliverable. However this was challenged by many stakeholders who suggested that the vision was not ambitious and should have a customer/market outlook or should echo the vision for the Northern Powerhouse.
When asked to consider the strategy objectives, there was a consensus that these needed to have more clarity and be measurable. In addition, there was a suggestion that the vision, the objectives and the interventions did not clearly interrelate and there was a recommendation that the objectives should specifically reference the environment, efficiency, energy, jobs, resilience, connectivity and funding.
D.4.3.2 Interventions
Delegates were asked to comment and reflect upon the interventions contained within the draft report. Feedback on the interventions was mixed; with a number of stakeholders commenting that it lacked ambition as many of the interventions were operational focused or endorsed schemes which were already committed. Furthermore, there was a suggestion that the interventions were conservative, uncontentious and deliverable, but the lack of a headline, transformational, visionary scheme based on innovation, technology or major new infrastructure was regarded by some as a key omission. In addition, stakeholders recommended that the environment, energy, technology, innovation and future-proofing all needed greater prominence, with an ambition to ensure public funding is promised and delivered.
There was a common theme that interventions which deliver mode shift should be prioritised such as rail capacity improvements, to reduce the amount of freight moved on the road network. Furthermore, many stakeholders commented that the draft report required additional interventions to support greater inland waterway movements, both east-west and north-south, to further support the concept of mode shift.
The location of interventions was queried by a number of delegates with many noting that the focus of the strategy was on facilitating and enhancing East-West movements. With this in mind, there was a suggestion that the draft report did not focus on the delivery of interventions in the north of the study area, such as the North East and Cumbria.
The joined-up thinking and rail capacity focus was praised, but there was a suggestion that further study was required to identify the location of under-used rail paths. In addition, it should be noted that many delegates expressed concern that Network Rail would not have the resources or capacity to deliver many of the rail interventions included within the draft report.
Stakeholders further reflected upon the potential barriers to the implementation and considered the key challenges to be public and private sector funding constraints, the local planning authorities which may not favour strategic infrastructure and a changeable political climate.
Other common themes related to the presentation of the final report, with many suggesting that the document required a customer-focused presentation, including the insertion of maps and a timeline. Further suggestions included the inclusion of costed interventions and the identification of quick wins and priorities, scheme dependencies and existing schemes.
D.4.3.3 Action Plan and Delivery
When asked to reflect on the implementation and deliverability of the draft report, many stakeholders felt a timeline with costs and benefits, priorities, ‘quick wins’, and a sense of the interdependencies was needed. Furthermore, stakeholders wanted an appreciation of which interventions would deliver efficiency gains and where the funding for implementation would be obtained.
Regular dialogue and joint working were considered to be important aspects to secure the successful delivery of the draft recommendations, and stakeholders noted that there was a requirement for TfN to work with different organisations and stakeholders throughout the process to achieve this.
Across the groups, there was a common theme that the powers and funding abilities of TfN need to be clarified, with some stakeholders suggesting that TfN should have devolved powers to act in a similar capacity to TfL in order to address cross-boundary issues. Other example organisations cited included the former Regional Development Agencies and the London Docklands Development Corporation.
D.4.3.4 Level of Support
The level of support for the report was evident; however there were concerns that it would not deliver a transformational change to the freight and logistics sector in the North of England. In addition, there were suggestions that the Draft Strategy would not attract the support of the private sector or the Treasury due to the level of detail and the lack of customer focus.
It should be noted that the workshop discussions identified that there is strong stakeholder support for further consultation and dissemination of the draft report and it is recommended that TfN should look to build on this through its proposed engagement channels.

110 | Northern Freight & Logistics Report: Technical Appendices | 111
Appendix E. Supporting Policy and Commercial Context
Appendix E provides supporting information to provide further context, explanation and justification to key aspects of the report. The material contained within this Appendix falls into two categories:
n Narrative explanation by MDS Transmodal of key issues with respect to a given aspect of the freight and logistics sector and how this has been considered in the report development;
n Commissioned specialist sub-consultancy support for the development of this report, setting out an expert explanation of a particular aspect of report context/development.
E.1 Introduction
The TfN Freight and Logistics Baseline Report (Autumn 2015) reviews the UK freight sector from a statistical perspective and the Northern Freight & Logistics Report describes the impact of different interventions. This Appendix discusses the realistic scope for intervention given the commercial structure that defines the freight and logistics industry, the policy context established by Government at the national and EU level and interfaces with other workstreams.
The freight industry lies almost entirely within the private sector and as such is highly competitive. In the case of road haulage, entry is relatively straightforward; the minimum scale for an enterprise is effectively a single vehicle. At the other end of the spectrum are the large container lines such as Maersk and MSC where the largest individual operators control over 15% of global trade but themselves operate within ‘Alliances’ which have gained regulatory approval, subject to a number of safeguards but recognising the value of scale. In the UK, the largest port company controls around 25% of total capacity, but in operating as primarily a landlord port finds its own tenants are in active competition with one another. This is a complex industry.
A key feature of the freight industry is that few companies can offer comprehensive 'in-house' supply chains to their customers. Even the integrated parcel companies use other airlines to provide 'bellyhold' capacity on passenger services to provide global coverage. A high level of co-operation between freight companies is therefore normal while at the same time there is continuous monitoring by regulators to ensure a competitive environment is maintained; a complex balancing act in an industry with high scale economies.
This Appendix also seeks to set out how and why the private sector could react positively towards the public sector interventions proposed in the preferred recommendations, given the context in which they operate. It considers:
1. The UK ports sector;
2. The UK rail freight sector;
3. The developer sector, responsible for creating 'off-port' distribution sites;
4. The occupier sector, responsible for contracting for warehousing on sites developers prepare; and
5. The 'urban freight' sector, where public sector interventions need to be integrated with private sector demand.
We have treated road haulage as a passive follower of the above sectors because of its flexibility, the minimal scope for market distortion through anti-competitive behaviour and the relatively short life of road haulage equipment. Scale economies in the haulage market tend to rely on marketing and networking rather than be related physically to the capacity of the unit of production; less than 30 tonnes in an HGV.

112 | Northern Freight & Logistics Report: Technical Appendices | 113
The sections on developers and occupiers have been written by specialist consultants in these areas; Savills and LCP respectively, commissioned to provide support as part of the report development, in order to best capture how key actors in their sectors are likely to regard the opportunity offered by Northern Powerhouse.
Developers identify sites for distribution centres (warehouses), prepare plans, secure planning consents and arrange the funding to deliver plots. Distribution centres form the origin or destination for around half of all freight in Britain by tonnage. Where plots are only road connected there is relatively little advantage in their co-location and in practice it is often easier to gain planning consent for a stand-alone site because road network and other environmental capacity thresholds may not be tripped.
In the case of rail or water connected sites, however, co-location is of great advantage as it raises the scale at which rail and water services can be offered and spreads the cost of terminals across more cargo. Developers are generally expected to provide the rail terminal ahead of demand. This makes it a great deal more difficult to deliver multi-modal sites even though there are both environmental and financial benefits; given sufficient scale, intermodal rail offers significant line haul cost advantages over road.
Potential occupiers will generally wish to secure a plot within around 6 - 12 months of starting a search and be operational within 2 years. They will generally therefore seek a plot that already has planning consent. This consideration will lead to rail or water linked sites being avoided unless they already have consent, despite the transport cost advantages rail and water offer. It will be important to address this constraint to reducing freight transport costs to the North.
E.2 Port SectorUK ports handled some 485 million tonnes of freight in 2014. 45% of this tonnage was energy related (coal, oil and gas) while 35% was unitised (containers and trailers). The remainder consisted of bulk agricultural goods (grain and fertilisers), industrial bulks (e.g. iron ore), aggregates, steel and forest products. Generally speaking, energy goods are falling as a consequence of low carbon agendas, industrial bulks are stagnant as UK heavy industry has migrated elsewhere while unit load tonnages have grown steadily, reflecting the import of consumer goods.
The ports industry itself includes a handful of multi-site port companies, led by ABP (around a quarter of the market by tonnage), Peel Ports, PD, Forth Ports and Hutchison. These 5 port groups account for around 65% of the market by tonnage. The major trust ports of Dover, Tyne and Milford Haven account for another 15% while the remainder passes through a wide range of smaller trust and a few independent commercial ports.
Tonnages have fallen since a pre-recession peak that pre-dated the decline in coal traffic that had reflected Government policy to reduce CO2 emissions. However, the major port companies have prospered commercially as unit load traffic has recovered and the value of their property has grown as the advantages of a port based location have become clearer. Ports are major freight transport hubs and are attracting energy projects (e.g. wind farm assembly) and port centric distribution as a consequence of the maritime services they can access. The major ports will enjoy rail access and the Thames, Humber and Mersey waterways extend the geography of waterside access considerably to a wide range of distribution sites.
UK ports policy has been to avoid distorting the market through subsidy and to encourage active competition to protect user interests. It is Government policy that each port is encouraged to achieve financial sustainability through the dues and charges levied. The 1964 Harbours Act provides statutory ports with the right to levy charges as they see fit to maintain and upgrade their infrastructure within a competitive environment. These infrastructure charges raise around £1 billion per annum and fund infrastructure maintenance and upgrades. Unlike rail freight, freight moved by sea through UK ports pays its full infrastructure cost through these charges that fund port capital spending. Over and above this ‘conservancy’ or landlord role ports also host a wide range of cargo handling (stevedoring) and storage activities that both employ large numbers of people and add value within local economies.
Ports compete through their location (proximity to inland consumers and producers and the cost of maritime diversion required to reach them) and the quality of their infrastructure. This applies particularly to the size of ships they can accommodate and the type of ships they can handle. A number of stevedores also operate in these ports, often using separately owned terminals and sometimes competing with their landlords.
Over 100 container and ro-ro vessels operate on scheduled services to the North of England; each operating in competition with other lines either based in the North or serving Northern markets through ports in the south. These lines provide ro-ro and LoLo container services that link the North of England with Ireland, the Continent and (generally by transhipment) other continents. The share which Northern ports secure of the national market reflects their geography, the cost of overland transport versus maritime transport, the size and type of ships they can accommodate and their capacity to accommodate industrial and distribution facilities on their estates.
Table E.1 describes 2014 volumes through Northern Ports within the context of UK totals.

114 | Northern Freight & Logistics Report: Technical Appendices | 115
Table E.1: Cargo through North of England Ports 2014 (‘000s tonnes)
Bulk Liquid Dry Bulk Semi Bulk Containers Ro-Ro Total
Tyne 48 5253 101 335 964 6701
Sunderland - 358 328 - - 686
Tees & H 20886 11712 3258 2029 1652 39537
Hull 1689 3603 1519 1426 2687 10826
Goole 32 438 834 - - 1804
Humber & River wharves
9255 1348 1041 - - 11644
Grimsby & Immingham
20851 21320 951 1459 14789 59370
Heysham 33 4 33 - 4403 4472
Liverpool 10572 7584 957 4852 7070 30898
Manchester 5284 1772 68 - - 7126
Also:
Barrow 234
Workington 278
Lancaster 151
Garston 499
Blyth 505
Berwick 59
Seaham 572
Silloth 166
Total North of England
175,528
Other Mainland GB
302 million
Mainland GB 486 million
Share in North 36%
The shipping lines that serve these ports are international, trading to make profits through a judicious balance of service frequency, port coverage and scale economies. They are therefore reactive to port infrastructure upgrade, improvements in port access (e.g. reduced road congestion) and to shifts in demand (e.g. the proximity of large warehousing complexes and changes in energy policy).
Because direct public sector subsidy is more or less out of the question within existing legal and policy constraints, if a port is to gain market share then the public sector's principle leverages are limited to inland network upgrade and land use policies that encourage 'local' economic development. Ports cannot 'co-operate' in the sense of sharing markets; it is most important that shipping lines and port occupiers address a ports market that competes internally, driving up infrastructure and service quality.
It therefore follows that if the recommendations are to be successful, and attract a higher proportion of Northern traffic directly to Northern Ports, the ports themselves must offer a more attractive proposition to the lines who themselves will have to buy or long term charter more and suitable larger ships. It is therefore most important that these lines, already well established at ports in the North, have confidence in the improved inland links (road and rail) and development prospects (distribution sites adjacent to ports) that are planned because these have a direct impact on port competitiveness.
E.3 Rail Freight Sector
The UK rail freight industry handled some 115m tonnes in 2014 and has, excluding coal, experienced growth of some 2% per annum in tonnage terms since the industry was re-stabilised after 2004 through (a), the replacement of Railtrack by Network Rail and (b), the introduction of a track charging and a grant regime that was even handed between operators. However, the rapid decline in coal traffic as power stations are run down will put a great deal of commercial pressure on the sector, raising the incentive to develop 'new' traffics to replace those recently lost.
There are five significant suppliers of rail traction services to the freight industry. They operate a fleet of some 500 locomotives and work between their own or third party clients’ terminals. They have experienced a loss of coal traffic recently as coal fired power stations have begun to close but have secured growth in intermodal traffic as well as in aggregates. They have invested in new locomotives to raise the length of trains they can haul and in wagons that can more efficiently handle cargo.
Forecasts depend heavily on the development of rail served distribution parks. The higher the proportion of the overall warehousing stock is on rail served sites, the better the prospects for rail freight growth as a result of lower door to door costs.
The principal constraint to that growth otherwise will be a lack of capacity on a North – South axis because the main opportunities lie in longer haul traffic when in competition with road. However, the parallel growth in rail passenger traffic (around 4% per annum over the last 20 years) occupies much of the available capacity and the development of HS2 will only relieve this pressure if the capacity released on the North – South routes is not entirely devoted to dealing with that passenger growth.
Rail freight economies are highly sensitive to the length of trains that can be operated and the degree to which assets can be utilised. Faster transit times and efficient pathing allow the same assets (locomotives and wagons) to accomplish more trips per week and in a competitive environment reduce user costs and therefore render rail freight more competitive. It follows that access to efficient paths within the working timetable is of crucial importance. There are several examples across the UK where lack of effective capacity is limiting the potential of rail freight and adding to costs through poor asset utilisation (slow pathing).
The legal framework that rail freight operates under is such that most is only charged the long run incremental infrastructure costs that it imposes. Direct state funding of services is limited to around £20m per annum based on subventions to users of intermodal services where (a), financial costs exceed the revenue available (the latter determined by road haulage costs) and (b), the environmental benefits exceed the cost of such subventions. EU directives now effectively render freight terminals ‘open-access’; access being available to third parties if spare capacity is available.
Table E.2 describes rail freight growth over recent years by tonnage. Coal traffic in the latest financial year was at almost exactly the same level as 10 years earlier and all other freight had grown by 17%. Over the same period all road traffic (in tonnes) recorded by survey fell by 15% from 1.74 billion to 1.49 billion tonnes (source: Transport Statistics Great Britain (TSGB)). Total tonne kilometres by road fell by 10% over the same period.
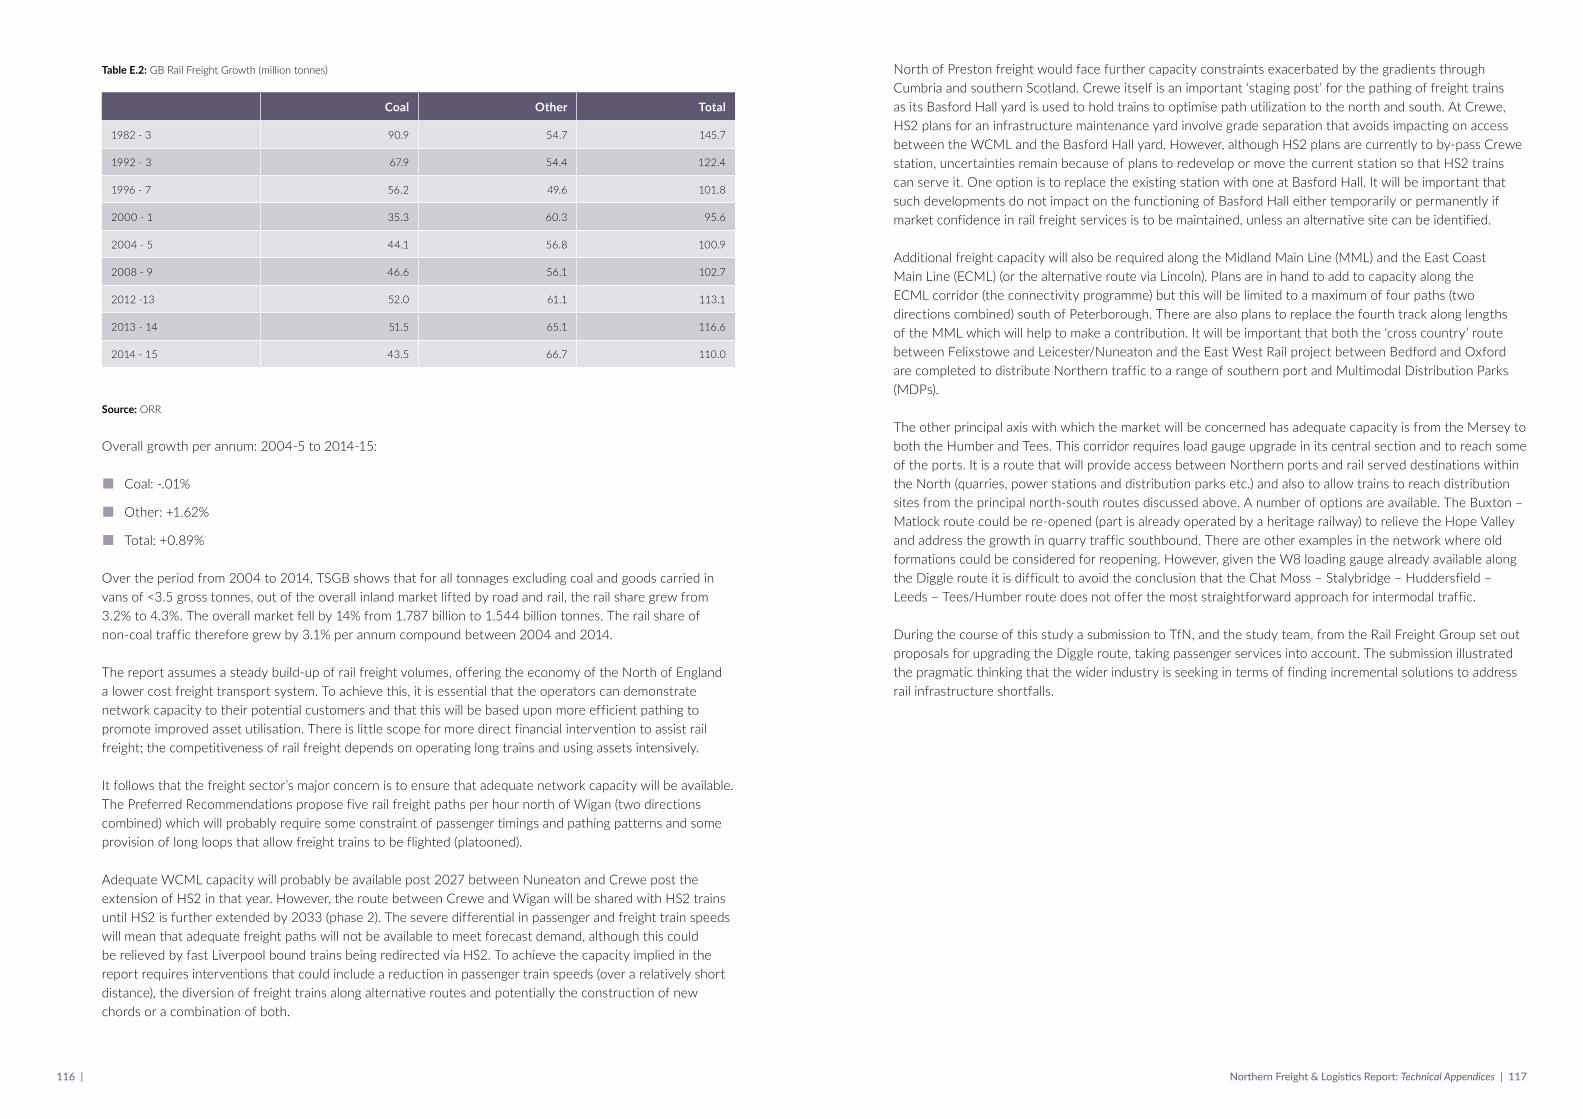
116 | Northern Freight & Logistics Report: Technical Appendices | 117
Table E.2: GB Rail Freight Growth (million tonnes)
Coal Other Total
1982 - 3 90.9 54.7 145.7
1992 - 3 67.9 54.4 122.4
1996 - 7 56.2 49.6 101.8
2000 - 1 35.3 60.3 95.6
2004 - 5 44.1 56.8 100.9
2008 - 9 46.6 56.1 102.7
2012 -13 52.0 61.1 113.1
2013 - 14 51.5 65.1 116.6
2014 - 15 43.5 66.7 110.0
Source: ORR
Overall growth per annum: 2004-5 to 2014-15:
n Coal: -.01%
n Other: +1.62%
n Total: +0.89%
Over the period from 2004 to 2014, TSGB shows that for all tonnages excluding coal and goods carried in vans of <3.5 gross tonnes, out of the overall inland market lifted by road and rail, the rail share grew from 3.2% to 4.3%. The overall market fell by 14% from 1.787 billion to 1.544 billion tonnes. The rail share of non-coal traffic therefore grew by 3.1% per annum compound between 2004 and 2014.
The report assumes a steady build-up of rail freight volumes, offering the economy of the North of England a lower cost freight transport system. To achieve this, it is essential that the operators can demonstrate network capacity to their potential customers and that this will be based upon more efficient pathing to promote improved asset utilisation. There is little scope for more direct financial intervention to assist rail freight; the competitiveness of rail freight depends on operating long trains and using assets intensively.
It follows that the freight sector’s major concern is to ensure that adequate network capacity will be available. The Preferred Recommendations propose five rail freight paths per hour north of Wigan (two directions combined) which will probably require some constraint of passenger timings and pathing patterns and some provision of long loops that allow freight trains to be flighted (platooned).
Adequate WCML capacity will probably be available post 2027 between Nuneaton and Crewe post the extension of HS2 in that year. However, the route between Crewe and Wigan will be shared with HS2 trains until HS2 is further extended by 2033 (phase 2). The severe differential in passenger and freight train speeds will mean that adequate freight paths will not be available to meet forecast demand, although this could be relieved by fast Liverpool bound trains being redirected via HS2. To achieve the capacity implied in the report requires interventions that could include a reduction in passenger train speeds (over a relatively short distance), the diversion of freight trains along alternative routes and potentially the construction of new chords or a combination of both.
North of Preston freight would face further capacity constraints exacerbated by the gradients through Cumbria and southern Scotland. Crewe itself is an important ‘staging post’ for the pathing of freight trains as its Basford Hall yard is used to hold trains to optimise path utilization to the north and south. At Crewe, HS2 plans for an infrastructure maintenance yard involve grade separation that avoids impacting on access between the WCML and the Basford Hall yard. However, although HS2 plans are currently to by-pass Crewe station, uncertainties remain because of plans to redevelop or move the current station so that HS2 trains can serve it. One option is to replace the existing station with one at Basford Hall. It will be important that such developments do not impact on the functioning of Basford Hall either temporarily or permanently if market confidence in rail freight services is to be maintained, unless an alternative site can be identified.
Additional freight capacity will also be required along the Midland Main Line (MML) and the East Coast Main Line (ECML) (or the alternative route via Lincoln). Plans are in hand to add to capacity along the ECML corridor (the connectivity programme) but this will be limited to a maximum of four paths (two directions combined) south of Peterborough. There are also plans to replace the fourth track along lengths of the MML which will help to make a contribution. It will be important that both the ‘cross country’ route between Felixstowe and Leicester/Nuneaton and the East West Rail project between Bedford and Oxford are completed to distribute Northern traffic to a range of southern port and Multimodal Distribution Parks (MDPs).
The other principal axis with which the market will be concerned has adequate capacity is from the Mersey to both the Humber and Tees. This corridor requires load gauge upgrade in its central section and to reach some of the ports. It is a route that will provide access between Northern ports and rail served destinations within the North (quarries, power stations and distribution parks etc.) and also to allow trains to reach distribution sites from the principal north-south routes discussed above. A number of options are available. The Buxton – Matlock route could be re-opened (part is already operated by a heritage railway) to relieve the Hope Valley and address the growth in quarry traffic southbound. There are other examples in the network where old formations could be considered for reopening. However, given the W8 loading gauge already available along the Diggle route it is difficult to avoid the conclusion that the Chat Moss – Stalybridge – Huddersfield – Leeds – Tees/Humber route does not offer the most straightforward approach for intermodal traffic.
During the course of this study a submission to TfN, and the study team, from the Rail Freight Group set out proposals for upgrading the Diggle route, taking passenger services into account. The submission illustrated the pragmatic thinking that the wider industry is seeking in terms of finding incremental solutions to address rail infrastructure shortfalls.

118 | Northern Freight & Logistics Report: Technical Appendices | 119
E.4 Developing a Market for Distribution Centre Developers
A key element of the recommendations to encourage developers to construct large distribution parks that accommodate a number of large distribution centres, each occupied by different cargo owners and distributors. A typical scale is around 500,000m2 of buildings overall (say 10 buildings in total) on a site of around 125 hectares and to include its own wharf or rail terminal. One example developed in the North ‘originally’ from existing assets is at Ditton in Halton.
Another example of a ‘green field’ site is that of Rossington near Doncaster. There are other examples in the Midlands at (DIRFT), Hams Hall and Birch Coppice and several other sites in the planning process (Kegworth secured its consent at the end of 2015).
Those sites confer great advantages in allowing many different warehouses to share the same railway terminal, eliminating ‘last mile’ haulage costs and providing the scale to fill long and frequent trains. However, they are difficult to execute because the developer needs to plan so far ahead (and provide the finance) and few sites are actually suitable given the scale and connectivity required. Savills have extensive experience with such sites and in the following paper sets out a detailed exposition of the context and issues for the strategy in this area.
------------------------------------------------------------------------------------------------------------------------------
Transport for the North – Freight and Logistics Report
Development Dynamics
Written by Savills March 2016
E.4.1 Purpose of the Paper
This paper seeks to outline (at a relatively high level) the key issues affecting the delivery and deliverability of large distribution park schemes with consideration of the barriers to delivery. These principally fall under the following headings:
n Planning
n Market forces and dynamics
n Funding and finance
n Time
Consideration is given to how each of these factors have different impacts on rail and non-rail served sites. Each also brings with it a different degree of risk. The particular issues faced by rail-served sites are considered because of the focus of the emerging strategy on the promotion of multi-modal logistics solutions.
It therefore provides context to understand whether investors and developers are likely to respond positively to the emerging recommendations; clearly that needs to be compatible with the market.
As is set out in the first section, which provides a brief overview of market conditions, the overall background is positive but clearly market dynamics and therefore the appetite by developers and funds to engage in and seek to deliver schemes varies according to location. Again the purpose of this paper is not to provide a locational analysis; this would best be the subject of a separate paper.
E.4.2 Market Conditions
This section provides an overview of the industrial/distribution property market which inevitably provides the basis upon the development industry takes decisions to bring forward the development of industrial/distribution park schemes. The statistics look at modern industrial and distribution buildings of at least 9290 sq m (100,000 sq ft).
The level of available choice, particularly for good quality, well located new or modern space has diminished significantly within the prime distribution locations in England. This shortage in the supply of buildings is exacerbated by the shortage in employment land supply. If existing buildings are not available, the alternative for an occupier is to transact on a design and build basis (if time permits), but this option is also becoming increasingly restricted. Design and build is a more likely option for those occupiers with the largest requirements (speculative buildings have generally been developed only up to c. 46,450 sq m) and/or who are seeking to put in place a strategic component of their supply chain and will have specific requirements of the building.
The significantly reduced levels of supply and relatively buoyant demand conditions have encouraged speculative starts on new buildings.
Figure E.1: North West Take-Up

120 | Northern Freight & Logistics Report: Technical Appendices | 121
n Take-up in the North West reached 4.56m sq ft in 2015, breaking all previous records and eclipsing the long term average of 3.44m sq ft.
n The North West was the second best performing region in the UK, only eclipsed by the East Midlands.
n Overall this was made up of 20 separate transactions against the long term average of 15.
Figure E.2: North West Take-Up By Grade
n 48% of the market was for build-to-suit units the largest being Exertis taking 543,000 sq ft at Burnley Bridge Business Park.
n The first unit to be let during a speculative construction period in the North West was taken in Q4 2015, when Amazon committed to take 110,000 sq ft at Venus 100.
Figure E.3: North West Supply (by Grade)
Figure E.4: North West Supply (by Size)

122 | Northern Freight & Logistics Report: Technical Appendices | 123
Figure E.5: North West Supply and Development Pipeline
n Current supply in the North West is 5.71m sq ft of which 81% is classified as Grade B or C (Grade A being the most up to date).
n Of the 32 units on the market only 7 are classified as Grade A.
n The available units are heavily skewed to the smaller end of the scale with 61% of the available supply between 100,000 – 200,000 sq ft.
n 2.2m sq ft of space is due for delivery in the North West in 2016 across 11 schemes, the largest being 357,000 sq ft at Logistics North in Bolton and the average size unit being 199,000 sq ft.
North of England Take-Up
n Take-up in the North of England reached 8.08m sq ft in 2015, which was a 15% decrease on 2014. However take-up was still 14% above the long term average of 7.08m sq ft, highlighting the strong occupier demand in the region.
n Interestingly H1 2015 saw the highest amount of take-up ever recorded by Savills for the half year point in the North of England.
n Overall 2015 was made up of 35 separate transactions against the long term average of 30.
Figure E.6: North of England Take-Up
Figure E.7: North of England Take-Up by Grade
n 47% of the market was for build-to-suit units in 2015, the largest being TK Maxx taking 650,000 sq ft at Ferrybridge, Wakefield.
n The only unit to be let during a speculative construction period in the North of England was Venus 100, when Amazon signed for 110,000 sq ft in Q4 2015.

124 | Northern Freight & Logistics Report: Technical Appendices | 125
Figure E.8: North of England Supply (by Size)
Figure E.9: North of England Supply (by Grade)
Figure E.10: North of England Supply and Development Pipeline
n Current supply in the North of England is 8.72 m sq ft of which 78% is classified as Grade B or C
n Of the 50 units on the market only 14 are classified as grade A.
n The available units are predominantly skewed to the smaller end of the market with 66% of the available supply between 100,000 – 200,000 sq ft.
n 2.5 m sq ft of space is due for delivery in the North of England in 2016 across 11 schemes.
E.4.3 The Growing Market for Rail Served Sites
There has been substantial growth in rail freight since the first rail served distribution parks were developed from the mid 1990’s (the best known being Hams Hall and DIRFT). Whilst the reasons behind the growth have been well rehearsed they are worth summarising here as context:
n Modern rail terminal facilities (and associated distribution buildings) have been developed and have provided a growing network for the logistics sector to utilise;
n Service reliability, route availability and frequency have all improved;
n Costs are competitive with road for long haul, particularly with the rise in HGV fuel costs;
n An increase in CO₂ reduction policies being implemented by corporate occupiers;
n The continued growth in imports and containerised traffic (the UK is a net importer of manufactured goods), which fits well with primary hauls from the ports which are invariably rail-connected; and
n Increasing levels of freight from continental Europe using the Channel Tunnel.
Logistics operators are responding to policy initiatives, the need to adopt more cost effective transport solutions in order to remain competitive, and other factors, in increasingly using rail freight as part of a multi-modal solution to optimising logistics. On a practical basis, this means logistics operators continuing to use road haulage as the main mode of transport, as it will remain the most practical and cost effective form of transport for most flows of goods (particularly secondary flows), but with the ability to utilise rail freight for some flows from the same location, when the volumes involved and the length of haul means that it provides the most practical and cost effective option. Dependant on the relative cost structures of alternative modes of transport the length of haul where rail becomes more attractive will vary.

126 | Northern Freight & Logistics Report: Technical Appendices | 127
Greater volumes of goods are originating from fewer locations (e.g. the ports or from manufacturers who increasingly concentrate production into larger plants). As rail freight operates at its most economic when goods are moved in full length trains, the increasing concentration of goods on strategic sites should generate the required volumes to operate full length train services. As a large proportion of rail freight's costs are fixed, the costs per unit moved are consequently reduced.
However the key factor which renders rail freight competitive compared with road transport, both from a cost and service quality perspective, is the ability to locate distribution centres on rail served sites: which is driving the demand by occupiers to site their largest warehouses on SRFIs, and is likely to be a key requirement of the logistics market over the medium to long term.
Each terminal developed on a SRFI becomes part of a growing network which itself delivers economies by enabling the provision of new rail services, and by serving a new geographical catchment.
The creation of a network is key to the logistics market being able to use it i.e. to adopt multi-modal solutions, induce efficiencies, and take freight off the road.
E.4.4 Delivery and Deliverability
This section looks at the key potential factors determining delivery and deliverability and, in particular, the relative competitive position between rail served (or multi-modal) distribution sites and those which are not (i.e. are simply road based). Some of the factors act as real barriers to development. The key issues are:
n Location and accessibility;
n Planning;
n Market alternatives;
n Funding and finance; and
n Time.
E.4.4.1 Location and Accessibility
Whilst a site can improve its competitive position for freight purposes by having improved access to cheaper forms of transport (rail and/or water) or by having the quality of the road access improved, the over-riding point is that the site has to be in an appropriate logistics/manufacturing location in the first place.
This is inevitably determined by accessibility to:
n Infrastructure (normally motorways and trunk roads) and its quality, capacity and congestion levels;
n Markets (for distribution to consumers);
n Suppliers; and
n Labour.
Optimising a distribution location is unique to each operator because it is dependent on the location of suppliers/point of origin for goods, and customers. However it is possible to generalise about the best logistics locations, which will become increasingly constrained by way of choice if multi-modal sites are required.
In order to maximise distribution efficiency and growth in the sector, any allocations need to be brought forward in optimal locations.
E.4.4.2 Planning
Planning is uncertain; necessarily it is subject to the democratic process. There is, accordingly, risk attached in varying degrees. It is also expensive; typically a large allocated employment site could be expected to cost c. £300,000 – 500,000 to undertake all necessary surveys and make an outline planning application. If a NSIP route is pursued (which would apply to a SRFI scheme), our experience suggests that the total cost of gaining a DCO can easily be in excess of £4 million.
Planning risk is reduced by promoting development on an already allocated site, and the cost of representations through a local plan need not be excessive.
The promotion and delivery of a strategic site now carries a higher level of risk, generally because the layer of regional strategic plan making (which typically would have been the provider of regionally important strategic sites) has gone. If a SRFI is promoted (which will be through the NSIP route) the risk attached is supposedly reduced by the process being heavily weighted to consultation before the formal application is made. The process is rigorous, it ensures all matters are dealt with before an in-principle decision is taken, and it is transparent. However, as detailed above, the cost is significantly higher and the exposure to risk is substantial. Whilst the DCO process is taken out of local control the development industry’s view is that there is too much risk attached to it unless there is material local political support.
These are significant costs for developers, funds etc to have at risk often for a prolonged period; this particularly applies to larger sites which are likely to be more complex in landownership, planning and infrastructure terms and to take longer to achieve planning.
Hence the market may be drawn to promoting and developing (relatively) smaller, road-based sites which may be a local plan allocation because of the lower risk and cost attached, in preference to the larger strategic sites (including those which are rail served) which are required to supply the logistics market.
E.4.4.3 Market Alternatives
Arguably demand soaked up by existing sites (e.g. Omega in the north west) represents a lost opportunity to the delivery of more sustainable multi-modal sites. Those road based sites (whether regionally allocated or local plan allocations) form significant competition to the delivery of rail served sites because they are less complex, quicker to bring to market (speed to market is important because of the need to respond to the cyclical nature of the economy and the property market, and to supply occupiers’ needs), lower cost and lower risk.
Developers will continue to focus on those opportunities whilst they remain available.
However a planning policy which seeks to deliver regional distribution parks needs to have a positive proposition that aligns with marker reality, rather than seeking to invoke a restrictive (centrally controlled) policy (on B8 delivery). Necessarily there is a balance to be struck. Any regional policy needs to recognise distribution at a local level: logistics is critical to making cities work and there are penalties imposed on cities associated with breaching air regulations. 50% of NOx is from transport of which at least half is from freight. This is a constraint on city development for which a coordinated approach to urban logistics should provide part of the solution.
E.4.4.4 Funding and Finance
Provided below is a working example of a large distribution park scheme (say capable of accommodating c. 8 million sq ft) looking at it on both a rail and non-rail served basis.
The infrastructure cost is c. £77 million and the rail infrastructure cost an additional c. £61 million.

128 | Northern Freight & Logistics Report: Technical Appendices | 129
Our viability assessment suggests an Internal Rate of Return (IRR) (pre-finance) of 13.91% and a Net Present Value (NPV) of the land (pre-finance) of £5,687,121.
If rail is stripped out the numbers become far more attractive with an IRR with rail costs removed of 22.66% and an NPV with rail costs removed of £27,002,935.
The impact on IRR is particularly acute because of both the scale of costs incurred and the requirement for upfront funding. There is a substantial and increased risk associated with the quantum of cash out and the rate of payback being deferred and subject to the market i.e. the rate of take-up.
Hence this puts rail served sites at a competitive disadvantage to non-rail served sites – simply because of:
n The reduced upfront expenditure;
n Increase in speed to market; and
n Reduced complexity of infrastructure delivery and agreements with infrastructure providers.
Achieving a position of overall viability is more difficult when in areas of lower land values – which is the case for many locations across the North, particularly relative to the Midlands and the South East.
Finding a funding mechanism which flattens the cashflow, reduces the upfront expenditure and reduces risk, must be a key objective. Equally if the public sector is to invest then it must be on equitable and reciprocal basis. One way forward would be to utilise EZ status as a way to retain rates income and enable (in the same way as a TIF scheme works) short term capital investment with a longer term payback.
E.4.4.5 Time
The time necessary to promote major proposals is significant. As an example an SRFI proposal in the Midlands started seriously in 2010 with the negotiation of an agreement with a landowner, followed by the developer being in a position (having aggregated land interests and brought together a coherent and deliverable proposal) to commence informal consultation in 2012. The formal DCO process started in 2014 with a decision given in 2016.
Six years is not unusual and is probably the minimum period necessary to undertake site assembly, technical work, undertake consultation and go through the formal DCO process.
This puts a significant time cost and risk on to the development industry and, in terms of delivering sites to the market and generating economic growth, clearly suffers from significant time lag.
E.5 Developing a Market for Distribution Centre Occupiers
The occupiers of the distribution sites discussed in Appendix E.4 are either the owners of the goods (e.g. a white goods manufacturer), a retailer (e.g. a supermarket) or a third party distributor. They tend to identify the need for a new building some 12 – 24 months before occupation is required, often as a result of corporate changes, the realisation that technical upgrade is required or because of disruptive change (e.g. the growth in internet trading). As a result, there is a continual churn in demand and it is this that drives the ‘refreshment’ of the national stock of warehousing of around 40mm2 of large units (>100,000 square feet) that provides the opportunity for the planning system to gradually drive the relocation of the distribution industry over the next 20-30 years. LCP are specialists in advising occupiers as to location and technical requirements. Their paper below sets out how LCP see the case should be made to occupiers to locate in the North of England.

130 | Northern Freight & Logistics Report: Technical Appendices | 131

132 | Northern Freight & Logistics Report: Technical Appendices | 133

134 | Northern Freight & Logistics Report: Technical Appendices | 135

136 | Northern Freight & Logistics Report: Technical Appendices | 137

138 | Northern Freight & Logistics Report: Technical Appendices | 139

140 | Northern Freight & Logistics Report: Technical Appendices | 141
E.6 Modelling Competition between Distribution Centre Locations
The interventions proposed within the report will reduce the relative cost of using a distribution centre within the North of England as compared with alternative locations. In order to estimate the savings that might be generated and the impact that might have of locational decisions we have conducted a modelling exercise that reflects how occupiers make their decisions, albeit on a generic basis.
Our approach is based upon:
(i) A schedule of ‘current’ sheds of greater than 9,000m2 (approximately 100,000 square feet) in Great Britain, amounting to around 40 million m2, by county.
Figure E.11: Freight and Logistics Assets: Warehousing
Typical rent levels by county, plus overheads and light/heat/power etc…
(iii) Typical labour costs by county
(iv) Transport costs to and from each county (assumptions as follows):
Assumptions that:
Inbound traffic:
n 60% domestic
n 25% ex shortsea from mainland Europe
n 15% ex deep sea
Outbound:
n 100% domestic based on warehouse location by county
An economic model combines elements (ii), (iii) and (iv) to calculate total supply chain costs between cargo origins and Regional Distribution Centres for each county, based on current transport costs.
Under the ‘current’ or Do Nothing scenario, the overall costs are summarised in the map provided in Figure E.12 below.
Figure E.12: Distribution Centre Location Costs: Rent + Labour + Transport
The lowest cost locations for Distribution Centres as set out below are mainly in the Midlands. Only 27% of the current distribution of sheds is within 10% of the minimum cost solution.
A revised version (Freight and Logistics Strategy for the North of England) is then recalculated using lower transport costs based upon the central strategy, which are lower.

142 | Northern Freight & Logistics Report: Technical Appendices | 143
This process is set out in detail as follows:
Base Case
The operating costs of a typical 80,000sqm National Distribution Centre (NDC) are modelled for a location in each county under the above scenarios with respect to inbound cargo origins and transport modes utilised.
The NDC has an assumed employment density of 140m2 per employee.
Modelled operating costs for the NDC consider the sum of:
n Inbound transport costs from mixture of deep-sea, EU and domestic origins;
n NDC operating costs (rents, wages and overheads); and
n Outbound transport costs to RDCs nationally
The NDC is assumed to be located in each county at a non-rail served site, except in Leicestershire, Northants, West Midlands and Warwickshire so that on a comparative basis their rail connectivity is ‘scored’.
The throughput assumed is 51,000 HGV-equivalent units per annum
1. Deep-seaport choice – 15% of total inbound, of which:
n For North East, North Yorkshire and Scotland – 50% Felixstowe, 25% Southampton and 25% Tees;
n For rest of Yorkshire – 50% Felixstowe, 25% Southampton and 25% Humber;
n For North West – 50% Felixstowe, 25% Southampton and 25% Liverpool;
n Rest of GB – 65% Felixstowe and 35% Southampton
Rail or road assumed, whichever is the lowest cost mode
Additional shipping costs to North over and above Felixstowe:
n Liverpool £200/unit
n Tees £400/unit
2. EU seaport port choice – 25% of total inbound, of which:
n For North East, North Yorkshire and Scotland – 55% Dover Straits, 45% Tees;
n For rest of Yorkshire – 55% Dover Straits, 45% Humber;
n For North West – 55% Dover Straits, 45% Humber;
n Rest of GB – 100% Dover Straits
100% is assumed by accompanied road haulage from the Dover Straits, except by rail to rail-served NDCs in Leicestershire, Northants, West Midlands and Warwickshire
Additional shipping costs to the North over and above Dover Straits: £125/unit
3. Domestic – 60% of total inbound, proportion by county based on existing warehouse floor space location. Either rail or road traction is assumed, whichever is lowest cost mode (road or rail).
4. Outbound to RDCs, proportion by county based on warehouse floor space
Non rail-served at both ends except for NDCs in Leicestershire, Northants, West Midlands and Warwickshire (as per above); choice of rail or road based on lowest cost mode
Northern Strategy
As per base case with the following changes to reflect transport cost efficiencies in northern England:
NDCs in North West, North East and Yorkshire/Humber located at rail-served sites.
1. 1. Deep-sea port choice – as per base case 15% of total inbound, of which:
n For North East, North Yorkshire and Scotland – 35% Felixstowe, 15% Southampton and 50% Tees;
n For rest of Yorkshire – 35% Felixstowe, 15% Southampton and 50% Humber;
n For North West – 35% Felixstowe, 15% Southampton and 50% Liverpool.
As per base case, rail or road, whichever is lowest cost mode
Additional shipping costs to North over and above Felixstowe:
n Liverpool £50/unit
n Tees £14/unit
2. EU port choice – as per base case 25% of total inbound, of which:
n For North East, North Yorkshire and Scotland – 25% Dover Straits, 75% Tees;
n For rest of Yorkshire – 25% Dover Straits, 75% Humber;
n For North West – 25% Dover Straits, 25% Humber;
To rail-served NDCs in North West, North East and Yorkshire/Humber and base case NDCs in Leicestershire, Northants, West Midlands and Warwickshire - rail or road, whichever is lowest cost mode
For all other locations – 100% accompanied road haulage
Additional shipping costs to North over and above Dover Straits:
n North Sea £68/unit
3. Domestic – as per base case

144 | Northern Freight & Logistics Report: Technical Appendices | 145
4. Outbound:
Rail-served RDCs in North West, North East and Yorkshire /Humber.
As per base case, rail or road, whichever is lowest cost mode.
Summary of Outputs
Under the Do Nothing scenario, the ‘golden triangle’ (as should be expected) is estimated to be the optimum location for NDCs sourcing and distributing on a national basis.
Under the Freight and Logistics Report, South Yorkshire appears to be the optimum location for NDCs sourcing and distributing on a national basis.
Base Case Outputs
Table E.3: Base Case Outputs
Code County Total Index Current % National Floor Space
41 West Midlands £53,425,623 100 4.6%
12 Leicestershire £53,469,108 100 4.6%
13 Northamptonshire £53,704,304 101 7.0%
38 Warwickshire £53,721,320 101 1.7%
8 South Yorkshire £56,215,194 105 4.3%
21 Buckinghamshire £57,426,023 107 2.1%
15 Cambridgeshire £58,788,757 110 2.4%
14 Lincolnshire £59,359,320 111 0.9%
6 Humberside £59,885,072 112 2.9%
10 Derbyshire £60,378,071 113 2.0%
22 Oxfordshire £60,411,849 113 1.3%
39 Shropshire £60,663,189 114 0.5%
17 Suffolk £60,945,064 114 1.1%
11 Nottinghamshire £60,965,062 114 2.6%
31 Gloucestershire £61,021,678 114 0.6%
40 Staffordshire £61,034,382 114 7.0%
45 Merseyside £61,295,295 115 2.8%
32 Wiltshire £61,586,026 115 1.5%
9 West Yorkshire £62,070,815 116 6.0%
23 East Sussex £62,241,837 117 0.1%
18 Bedfordshire £62,365,518 117 1.4%
7 North Yorkshire £62,441,580 117 1.4%
25 West Sussex £62,597,245 117 0.3%
43 Greater Manchester £62,678,458 117 5.8%
46 Clwyd £62,869,064 118 1.1%
19 Hertfordshire £63,062,099 118 1.9%
16 Norfolk £63,070,157 118 0.8%
29 Kent £64,286,274 120 1.4%
42 Cheshire £64,322,767 120 3.4%
50 Gwent £64,437,707 121 0.9%
49 Powys £64,804,124 121 0.1%
37 Hereford And Worcester
£65,005,582 122 1.2%
28 Hampshire £65,049,203 122 1.2%
20 Berkshire £65,190,096 122 0.4%
1 Cleveland £65,553,308 123 1.0%
27 Greater London £65,664,093 123 4.3%
44 Lancashire £66,507,389 124 3.1%
26 Essex £66,577,978 125 2.4%
2 Durham £66,636,276 125 1.2%
30 Avon £66,900,205 125 1.3%
24 Surrey £67,388,407 126 0.2%
48 Gwynedd £68,360,896 128 0.0%
5 Tyne And Wear £68,624,727 128 0.8%
52 South Glamorgan £68,641,931 128 0.1%
51 Mid Glamorgan £69,417,103 130 0.6%
35 Dorset £69,933,517 131 0.1%
3 Cumbria £70,193,482 131 0.5%
36 Somerset £71,217,000 133 0.6%
4 Northumberland £72,241,809 135 0.3%
53 West Glamorgan £72,320,069 135 0.4%
47 Dyfed £74,103,479 139 0.0%
34 Devon £74,558,819 140 0.3%
54 Borders £77,450,810 145 0.0%
59 Dumfries And Galloway £79,050,039 148 0.0%
33 Cornwall £81,743,819 153 0.0%
57 Lothian £84,972,280 159 1.4%
60 Strathclyde £89,394,280 167 2.9%
55 Central £89,877,252 168 0.8%
58 Tayside £90,064,531 169 0.0%
56 Fife £90,247,077 169 0.2%
62 Grampian £96,176,266 180 0.4%
61 Highland £98,608,709 185 0.0%

146 | Northern Freight & Logistics Report: Technical Appendices | 147
Freight and Logistics Strategy Outputs
Table E.4: Freight and Logistics Strategy Outputs
Code County Total Index Current % National Floor Space
8 South Yorkshire £48,347,283 100 4.3%
6 Humberside £49,999,620 103 2.9%
45 Merseyside £50,109,618 104 2.8%
13 Northamptonshire £50,579,567 105 7.0%
12 Leicestershire £50,762,877 105 4.6%
41 West Midlands £50,781,041 105 4.6%
38 Warwickshire £50,825,283 105 1.7%
7 North Yorkshire £51,081,745 106 1.4%
1 Cleveland £51,549,328 107 1.0%
2 Durham £52,675,824 109 1.2%
43 Greater Manchester £52,846,115 109 5.8%
9 West Yorkshire £53,074,649 110 6.0%
42 Cheshire £53,857,150 111 3.4%
5 Tyne And Wear £53,909,230 112 0.8%
21 Buckinghamshire £54,134,871 112 2.1%
3 Cumbria £54,849,642 113 0.5%
44 Lancashire £54,991,576 114 3.1%
4 Northumberland £56,210,769 116 0.3%
15 Cambridgeshire £57,495,352 119 2.4%
14 Lincolnshire £58,276,417 121 0.9%
17 Suffolk £58,456,600 121 1.1%
22 Oxfordshire £58,674,934 121 1.3%
23 East Sussex £59,124,351 122 0.1%
32 Wiltshire £59,131,341 122 1.5%
10 Derbyshire £59,368,154 123 2.0%
31 Gloucestershire £59,382,345 123 0.6%
39 Shropshire £59,472,783 123 0.5%
25 West Sussex £59,506,047 123 0.3%
46 Clwyd £59,579,883 123 1.1%
40 Staffordshire £59,984,578 124 7.0%
11 Nottinghamshire £59,991,038 124 2.6%
18 Bedfordshire £60,783,141 126 1.4%
16 Norfolk £61,022,892 126 0.8%
19 Hertfordshire £61,091,236 126 1.9%
29 Kent £61,323,864 127 1.4%
28 Hampshire £62,265,309 129 1.2%
50 Gwent £62,381,539 129 0.9%
20 Berkshire £62,813,879 130 0.4%
27 Greater London £63,182,935 131 4.3%
49 Powys £63,330,804 131 0.1%
37 Hereford And Worcester
£63,567,921 131 1.2%
26 Essex £64,126,516 133 2.4%
30 Avon £64,694,761 134 1.3%
24 Surrey £64,703,249 134 0.2%
48 Gwynedd £65,041,381 135 0.0%
52 South Glamorgan £65,957,018 136 0.1%
51 Mid Glamorgan £66,677,210 138 0.6%
35 Dorset £66,959,262 138 0.1%
36 Somerset £68,429,727 142 0.6%
53 West Glamorgan £69,482,773 144 0.4%
54 Borders £70,841,369 147 0.0%
34 Devon £71,408,074 148 0.3%
47 Dyfed £71,778,210 148 0.0%
59 Dumfries And Galloway £72,418,094 150 0.0%
57 Lothian £77,532,858 160 1.4%
33 Cornwall £78,565,436 163 0.0%
58 Tayside £81,418,397 168 0.0%
60 Strathclyde £81,506,618 169 2.9%
56 Fife £81,666,893 169 0.2%
55 Central £81,841,061 169 0.8%
62 Grampian £86,974,962 180 0.4%
61 Highland £89,426,626 185 0.0%
These are summarised in the histogram presented in Figure E.13.

148 | Northern Freight & Logistics Report: Technical Appendices | 149
Figure E.13: Do Minimum Scenario: Ranking of NDC Costs
Only 7 counties are within 10% of the lowest cost (West Midlands), one of which is South Yorkshire
However, the introduction of various interventions in the report reduces costs from some Northern counties through a cut in shipping costs to nearby Northern ports and the location of warehouses on rail served sites. As a result several Northern counties costs are well within 10% of the minimum cost solution so that 43% of the entire stock is within that 10% range, as shown in Figure E.14.
Figure E.14: Preferred Strategy: Ranking of NDC Costs
South Yorkshire becomes the most competitive county for sourcing and distributing on a national basis, and 12 counties are within 10% of the minimum cost solution, including Humberside, Merseyside, North Yorkshire, Cleveland, Durham, Greater Manchester and West Yorkshire.
We believe it follows that a larger area of Britain, and particularly areas in the north, will be attractive as locations for NDCs that probably account for around 30 – 40% of all large warehouse capacity.
We estimate that of the 13 million m2 of the total stock of large warehouses that are in the North only
around 3 million m2 could currently be regarded as performing a national distribution role; only South Yorkshire as a location was to be found in those locations within 10% of the minimum cost solution under current conditions (minimum cost solution was in West Midlands county). We estimate a further 12 million m2 of NDC capacity was located elsewhere mainly in the Midlands, Cambridgeshire and Buckinghamshire. However, under the central Northern strategy, 12 counties were within 10% of the cost of the ‘generic’ minimum cost solution of which 8 were in the North. It is self-evident, therefore, that a substantial switch of warehousing capacity could be expected to be located in the North in the future.
Estimating Potential to Switch Region
Approach 1: Replicating Golden Triangle
There is no established way in which to model the degree to which warehouse distribution can be expected to change overall. Established techniques only model the optimum site for a specific occupier. A substantial proportion of warehousing is related to local population (Regional Distribution Centres (RDCs)) while some areas, such as the West Midlands Metropolitan area maybe very well located but are congested and short of suitable sites. The West Midlands has 4.5% of the population and 4.6% of large warehousing stock. By contrast, the three golden triangle counties of Leicestershire, Northamptonshire and Warwickshire, almost as well placed, have 3.6% of the population and 13.3% of large warehousing. They combine competitiveness with sites suitable for development.
The revision of transport costs given the Northern Powerhouse interventions also place Merseyside and Humberside within 5% of the lowest cost solution (which would be South Yorkshire). Together they also account for 3.6% of the population but currently only 5.7% of the warehousing. If that share of warehousing was to reach the same level as the three golden triangle countries currently of 13.3% (+7.6%) that would equate to an extra 3 million m2 of capacity in the North. That assumes no increase for South Yorkshire (despite jumping to the top of the rankings), Greater Manchester or other northern countries which all ‘move up the rankings’ to be grouped with the three golden triangle counties.
Approach 2: Replicating the Share of the Top 10 Counties
The top 10 countries in the base case account for 32.5% of warehousing but include only two Northern counties (7.2% of national warehousing capacity). In the case of the report, six of the top 10 counties are Northern counties, accounting for 10% of the population and 13% of warehousing. In the case of the other four counties (those in the Midlands), 8% of the population accounts for 18% of warehousing; a quite different ratio. If the six Northern counties were to operate at the Midlands ratio of population to warehousing those counties’ share of warehousing would rise from 13% to 22.5%. This would equate to an extra 3.8mm2 of warehousing.
These comparative exercises suggest, therefore, that at least 3 million m2 of extra warehousing could be attracted to the North based on the proposed interventions. Given the life-cycle of Distribution Centres (25 – 30 years) approximately two thirds of this process could be expected to be complete by 2033. We have therefore concluded that a reasonable assumption is for there to have been a net transfer of 2 million m2 of warehousing to the North by 2033, a growth in large warehousing capacity from (currently) 13 million m2 to 15 million m2.
We would expect the additional 2mm2 to be distributed mainly along the Mersey corridor and along or south of the corridor between Immingham, Doncaster and Wakefield. There are further opportunities in the Tees/North Yorkshire/Durham area.
Figure E.11 shows the current distribution of warehousing by northern county. In the period to 2033 we would expect 60% of current warehousing to be recycled (7.2 million m2). Of this figure, some 56% lies in Merseyside, Greater Manchester, West Yorkshire and South Yorkshire, areas in which there is likely to

150 | Northern Freight & Logistics Report: Technical Appendices | 151
be pressure for further residential growth that could be addressed through the release of land currently occupied by warehousing. A transfer of 56% of 7.2 million m2 or 4 million m2 of warehousing, occupying a gross area of some 1,000 hectares, could provide the capacity for around 25,000 residences.
Similarly, the ‘transfer’ of 2 million m2 of warehousing from areas to the south (i.e. in the Midlands) of the North of England would release (net) the area to construct a further 12,500 residences in other areas short of residential development space.
E.7 Urban Freight Issues and Objectives
E.7.1 Introduction
Road freight movements in urban areas are a source of environmental emissions (principally SOx, NOx and particulate matter as well as greenhouse gases), contribute to congestion and generate noise (the latter being a particular issue at night). The issue of emissions become even more urgent in 2015 as the Department for Environment, Food and Rural Affairs (Defra) published the results of new research on the number of premature deaths due to poor air quality, which means that action plans must be developed to improve air quality to achieve EU air quality targets by 2020. Its modelling suggests that several cities need to adopt Low Emission Zones (LEZs) by 2020 to meet EU air quality standards and one of those cities (Leeds) is in the North.
E.7.2 Stakeholder Issues
These issues cause concern for residents in urban areas in the North and for the local authorities that are responsible for environmental regulation and transport policy. At the same time, residents wish to have a wide range of goods available in the local shops and receive e-commerce parcels at their homes or workplace. Road freight transport operators want to be able to make collections and deliveries in urban areas in the most cost effective way, while receivers and shippers of goods require short lead times for deliveries and deliveries to be made at the lowest possible cost.
Figure E.15 shows the main stakeholder groups that are affected by freight transport in the urban areas of the North of England, with their main expectations. In very general terms, residents and visitors are seeking a high quality of life or high quality experience, while transport operators and their customers have a strong interest in achieving low cost on-time deliveries. These different expectations can result in conflicts that need to be resolved through trade-offs between the private needs of the freight industry and its customers and public needs through intervention in the market by the public sector in the North of England. In economic terms, where the costs of private activities are not fully reflected in the user costs of the freight industry and their customers, there is market failure; the public sector therefore has a role in seeking to balance the needs of the private operators with the wider needs of society.
Figure E.15: Main Stakeholder Groups - Urban Freight Transport
E.7.3 The Key Objective: Improving Air Quality
This is particularly the case in relation to air quality because there is a risk that poor air quality will have to be remedied (to protect human health) by limiting the amount of economic activity that can take place in city centres. As set out in the Freight and Logistics Report, we estimate there will be around 200 million HGV kilometres in northern city central areas in 2033. The main fuel remains diesel and could limit the cities’ further development by, in effect, ‘using up’ a finite ‘budget’ of tolerable NOx emissions. However, current standard environmental modelling assumptions suggest that NOx emissions will have already reduced through various technological and practical changes before legal ceilings are breached. Should this not prove to be the case there is a stronger case, and considerably higher economic value, that could be claimed upon the removal of HGV miles from central areas, to allow other economic development to take place.
Again, as set out in the report, there is in any event a strong case for the public sector to consider freight policy interventions that deliver environmental benefits and in particular the use of very low or zero emission vehicles in urban areas to reduce emissions and noise and improve the quality of life for people that live and work in city centres. A policy to pursue low or zero emission ‘last mile’ deliveries would represent a further opportunity for an informed and pro-active freight policy on the part of the public sector to contribute to the economic growth of the North of England.

152 | Northern Freight & Logistics Report: Technical Appendices | 153
E.7.4 Potential Policy Interventions
The public sector in the North of England should therefore consider introducing a package of measures that would incentivise (or even require) the private sector to switch to low or zero emission vehicles for ‘last mile’ deliveries, probably by introducing Low Emission Zones (LEZs). It would be essential that all the urban areas affected adopted harmonised policy measures to ensure that the regulatory and policy environment for the industry was not fragmented; by adopting a harmonised regulatory environment for the freight industry across the North, there would be a stable investment environment for the industry across the wider region.
In practical terms the switch from diesel-powered vehicles for in-bound vehicles into the LEZs to use low or zero emission vehicles for ‘last mile’ deliveries could be achieved in a number of ways, but the principle ones are:
n Hybrid HGVs switching to electric (or other ultra-low-emission fuels) upon entering the LEZ.
n Articulated HGVs arriving at a parking area on the boundary with the LEZ and switching to ultra-low-emission tractor units.
n Switching the cargo from a diesel powered HGV to low or zero emission vehicles at a consolidation centre before entering the LEZ.
All of these options involve additional costs for an operator compared to using a diesel-powered HGV for the delivery or collection and so a suitable harmonised regulatory regime would be required to incentivise or require the appropriate behaviour. This could involve banning diesel powered vehicles from the LEZs, or applying punitive charges for these vehicles when they enter the LEZ.
Alternatively, in the absence of LEZs, softer measures could be deployed to incentivise the use of low and zero emission vehicles involving a combination of only allowing low or zero-emission vehicles to:
n Access pedestrianised areas outside certain time windows;
n Use priority/bus lanes;
n Make quiet night-time deliveries and;
n Use the most conveniently sited loading and unloading bays.
E.7.5 Urban Distribution Centres
MDS Transmodal has, in the past, considered the potential for a network of Urban Distribution Centres (UDCs), which would be common-user warehouses located on Multimodal Distribution Parks (MDPS) that would consolidate goods from different shippers and receivers into “full” loads for final delivery by electric vehicles in urban centres. MDPs would be ideal locations for UDCs because many of the inbound consignments would be received by rail and barge and would have to change mode of transport in any case. Instead of unloading the goods in a traditional RDC with cross-docking to a diesel-powered HGV, they could be handled via the UDC and transferred into consolidated loads for final delivery by an electric HGV.
If pure electric trucks were used for these urban deliveries, the distribution parks where the UDCs are located would need to be within the effective round trip range of the electric vehicles. Given existing battery technology this may mean that the UDCs need to be located no more than (say) 40km from the major urban centres in Northern England.

154 |