north carolina statewide - connect ncdot movement of hazardous material ... to soap, makeup, and...
TRANSCRIPT

North Carolina Statewide
Multimodal Freight Plan
Pipeline and Hazardous Material
Profile
prepared for
North Carolina
Department of Transportation
prepared by
Cambridge Systematics, Inc.
with
IEM
February 1, 2017


report
North Carolina Statewide Multimodal
Freight Plan
Pipeline and Hazardous Material Profile
prepared for
North Carolina Department of Transportation
prepared by
Cambridge Systematics, Inc.
730 Peachtree Street NE, Suite 500
Atlanta, GA 30318
with
IEM
date
February 1, 2017


North Carolina Statewide Multimodal Freight Plan
Cambridge Systematics, Inc.
i
Table of Contents
1.0 Introduction ........................................................................................................................................ 1-1
1.1 Overview, Data and Methodology .............................................................................................. 1-1
1.2 Organization of the Report ......................................................................................................... 1-4
2.0 Fuels .................................................................................................................................................... 2-5
2.1 Fuel Model ................................................................................................................................. 2-7
2.2 Fuel Volumes by Mode in 2015 and Projections to 2045 .......................................................... 2-8
2.3 Pipelines .................................................................................................................................. 2-10
2.3.1 Pipeline System Description ....................................................................................... 2-11
2.4 Non-Fuel Petroleum Products ................................................................................................. 2-20
2.4.1 Chemical Pipelines ..................................................................................................... 2-22
2.4.2 Pipeline Operators ...................................................................................................... 2-22
2.4.3 Intermodal Connections .............................................................................................. 2-23
2.4.4 Bottlenecks and Deficiencies ...................................................................................... 2-29
Fuel Pipeline System Capacity ................................................................................... 2-29
Fuel Terminal Access and Multimodal Connectivity ................................................... 2-29
Field Fuel Blending ..................................................................................................... 2-30
2.5 Safety ....................................................................................................................................... 2-30
2.6 Existing and Expected Future Needs ...................................................................................... 2-31
3.0 Selected Extremely Hazardous Substances and non-Extremely Hazardous Substances ......... 3-1
3.1 Overview of Flows ...................................................................................................................... 3-1
3.2 Bottlenecks and Deficiencies ..................................................................................................... 3-4
3.3 Existing and Expected Future Needs ........................................................................................ 3-5


North Carolina Statewide Multimodal Freight Plan
Cambridge Systematics, Inc.
iii
List of Tables
Table 1.1 Top Ten Chemical Shipping States by Value ....................................................................... 1-3
Table 2.1 Total Estimated Refined Petroleum Fuel Shipments In North Carolina by Mode in
2015 ...................................................................................................................................... 2-9
Table 2.2 Active Pipeline Diameters ................................................................................................... 2-11
Table 2.3 Fuel to and from North Carolina by Pipeline ...................................................................... 2-18
Table 2.4 Non-Fuel Petroleum Product to and from North Carolina by Pipeline ................................ 2-20
Table 2.5 Basic Chemical Product To and From North Carolina by Pipeline ..................................... 2-22
Table 2.6 Major Pipeline Operators in North Carolina ........................................................................ 2-23
Table 2.7 Fuel Terminals .................................................................................................................... 2-26
Table 2.8 Propane Terminals ............................................................................................................. 2-28
Table 2.9 Aviation Terminals .............................................................................................................. 2-28


North Carolina Statewide Multimodal Freight Plan
Cambridge Systematics, Inc.
v
List of Figures
Figure 2.1 Star, NC Butane Rail to Truck Transloading Facility ............................................................ 2-6
Figure 2.2 Midland Transload Facility .................................................................................................... 2-7
Figure 2.3 Annual Stock Quantity of Selected Petroleum Products in North Carolina ........................ 2-10
Figure 2.4 North Carolina Active Pipeline Network by Commodity ..................................................... 2-12
Figure 2.5 Active Product Pipelines by Diameter ................................................................................ 2-13
Figure 2.6 Active Natural Gas Pipelines by Diameter.......................................................................... 2-14
Figure 2.7 Active Liquefied Petroleum Gas Pipelines ......................................................................... 2-15
Figure 2.8 Other Active Gas Pipelines ................................................................................................. 2-16
Figure 2.9 Other Commodities by Pipeline - Refined Petroleum Fuel, 2045 Tons .............................. 2-17
Figure 2.10 Refined Petroleum Fuel Flow in Pipelines, 2045 Tons ....................................................... 2-19
Figure 2.11 Non-Fuel Petroleum Product Flow in Pipelines, 2045 Tons ............................................... 2-21
Figure 2.12 Major Intermodal Terminals for Pipeline in North Carolina................................................. 2-25
Figure 2.13 Dixie Terminal in Apex, NC ................................................................................................ 2-30
Figure 3.1 Extremely Hazardous Substance Flows ............................................................................... 3-2
Figure 3.2 Non-Extremely Hazardous Material Flows ........................................................................... 3-3


North Carolina Statewide Multimodal Freight Plan
Cambridge Systematics, Inc.
vii
List of Acronyms
AFRAMAX Average Freight Rate Assessment Maximum – Oil tanker ship with dead weight tonnage
ranging between 80,000 and 120,000
bbls Barrels
CAS Chemical Abstract Service
CSXT CSX Transportation – CSX Not acronym, actual name of a Class 1 US Railroad
EHS Extremely Hazardous Substance
EIA US Energy Information Administration
EPCRA Emergency Planning and Community Right-to-Know Act
FAF4 Freight Analysis Framework version 4
HazMat Hazardous Material - Any chemical in transportation, in any form, that exhibits one or
more of nine hazardous properties classes: explosives, gasses, flammable liquids,
flammable solids, oxidizing substances and organic peroxides, toxic and infectious
substances, radioactive materials, corrosive substances, and miscellaneous.
GIS Geographic Information System
IRS Internal Revenue Service
LEPC Local Emergency Planning Committee – Designated by State Emergency Response
Commissions as local entities responsible for chemical emergency planning
LLC Limited Liability Company
MBPD Million Barrels Per Day
NAICS North American Industry Classification System
NGL Natural Gas Liquids – Hydrocarbons separated from natural gas including: ethane,
propane, butane, isobutene, pentane, and pentane plus or natural gasoline
NPMS National Pipeline Mapping System – Geographical mapping data maintained PHMSA
PHMSA Pipeline and Hazardous Materials Safety Administration
SARA Tier II Hazardous chemical inventory form used to collect chemical inventory data from
chemical facilities under the authority of federal Superfund Amendments
Reauthorization Act
TPQ Threshold Planning Quantity, quantity of an extremely hazardous substance that
requires reporting on the Tier II form
TSCA Toxic Substances Control Act – Federal statute that regulates the identification and
control of toxic substances
USDOT US Department of Transportation


North Carolina Statewide Multimodal Freight Plan
Cambridge Systematics, Inc.
1-1
1.0 Introduction
The movement of Hazardous Material (HazMat) freight has an enormous impact on North Carolina’s
transportation infrastructure today and will have in the future. One early example will help define the scope of
this HazMat profile. The fuel movement model developed for this study estimates that during 2015 the state
generated nearly two million shipments of fuel, delivering to the state 458 million barrels of fuel by ship,
pipeline, and rail, and distributed to local markets within the state by pipeline, rail and truck. With
communities growing, land-use increasingly congested and development costly, and the demands on all
parts of our aging infrastructure increasing, it is important that the state consider critical investments in the
transportation infrastructure that will support the safe and timely delivery of HazMat freight to local markets
and to destinations outside of North Carolina.
1.1 Overview, Data and Methodology
HazMat is a complex subject because of the nature of the particular chemistry of each individual chemical on
one end and how completely dependent our economy is on HazMat on the other, not to mention the public
health, safety and environmental issues that are evident any time an accident occurs. Exploring this subject
is further complicated by the many differing and largely incomplete data sets available on the topic collected
by government agencies with different regulatory, public safety and emergency management, and economic
purposes. This profile will work with a number of these different data sources to develop the context and
scope of HazMat freight in the state of North Carolina. It is important to state that none of these data sources
are complete enough to adequately or fully describe the nature, scope, volume or even the value of HazMat
freight anywhere in the United States, including in North Carolina. It is however, possible to use the data that
is available to take snaps shots of key parts of HazMat freight system and build models that increase our
understanding of this important subject.
To begin with, it is helpful to define HazMat. HazMat includes any chemical, in any form, that has one or
more hazardous properties and that is in transportation. The key properties are those that make up the nine
US Department of Transportation (US DOT) HazMat classes: explosives, gasses, flammable liquids,
flammable solids, oxidizing substances and organic peroxides, toxic and infectious substances, radioactive
materials, corrosive substances, and miscellaneous. So many chemicals meet these definitions that it is
necessary to narrow the scope to a more comprehendible scale. We will start with a wide view and
progressively narrow our focus.
The Chemical Abstracts Service (CAS) registry presently contains more than 123 million unique organic and
inorganic chemical substances and more than 66 million sequences, with 340,000 regulated chemicals and
millions of commercially available products.1 From among these, the US Environmental Protection Agency
maintains a list of over 83,000 chemicals in the Toxic Substances Control Act (TSCA) inventory that are
registered for use in industry in the United States, with about 40,000 of these typically present in commerce.2
If a chemical is present in commerce it has to be considered freight at some point in its lifecycle and may be
present anywhere on the North Carolina transportation system.
1 Chemical Abstract Service Registry
2 Toxic Substance Control Act Inventory, November, 2016

North Carolina Statewide Multimodal Freight Plan
Cambridge Systematics, Inc.
1-2
This leads to the first key point, due to the free commerce clause in the US Constitution there are very few
restrictions to the transportation of HazMat. Other than some limitations for transporting some classes of
HazMat on designated routes over steep terrain and through tunnels, many of these 40,000 chemicals will be
present somewhere within the transportation system at all times.
The second key point is that HazMat, in some form, is in transportation everywhere in the state all of the
time, as it is essential to our society and economy; it is ubiquitous. Many chemicals are present in common
products that are used to power, clean, make, or maintain virtually everything our society needs to survive.
Almost everything we drink, grow, eat, wear, and drive, fly or float, the roads we drive on and the fuel we use
to get where we are going, what we use to build our homes and offices, to clean, preserve, maintain, and
enable our lives is transported at some point as HazMat freight. HazMat is routinely transported in commerce
in all modes of transportation. HazMat freight is transported by ship or barge, pipeline, rail, and truck. Air
transport of Dangerous Goods (another name for HazMat) occurs routinely but only in limited quantities with
strict packaging requirements and the shipping of many specific chemicals by air is forbidden due to inherent
safety concerns.
Our dependency on HazMat is so complete that interruptions in the movement of HazMat freight will have
immediate and profound consequences on the daily lives of everyone relying on the affected supply chains.
Many chemicals that are commonly transported are essential for industry to make the products we all need.
These base chemicals are essential because they are the building blocks for making whole families of
related chemicals and products. One example in North Carolina is the Extremely Hazardous Substance
(EHS) chemical ethylene oxide. The state imports large numbers of rail cars of this toxic, carcinogenic,
flammable, reactive, and often unstable chemical. The reason for importing a chemical with so many
hazards is because modern chemistry depends on it. In addition to its important use as a disinfectant for
surgical tools, it allows industry in the state to make everything from antifreeze, to soap, makeup, and tooth
paste at facilities in the Triad. There are a number of these base chemicals that are imported in the state
and many of them are also EHSs.
To further narrow the focus, over 6,900 North Carolina facilities submitted Hazardous Chemical Inventory
Reports (SARA Tier II) in 2013. A Tier II report is required to be submitted when a business stores one or
more hazardous chemicals in volumes exceeding 10,000 pounds for most, or for EHSs the Threshold
Planning Quantity (TPQ) or 500 pounds, whichever is lower. These numbers of facilities and chemicals
should not be considered as exhaustive because there are many exemptions to these reporting
requirements, such as, farmers are not required to report fertilizers they use, explosives are not reported in
this data, nor are chemicals present in laboratories under qualified supervision, nor those used in foods or
drugs. But this information helps to define and narrow the scope for this profile. These reports showed over
15,000 unique hazardous chemicals in production, use, and/or storage in North Carolina. In 2013, the
average volume of chemicals held in storage exceeded 318 billion pounds over any 24-hour period of time.3
This is not usage or throughput at these facilities it is storage, annual usage is usually many times higher.
The North Carolina Tier II data supported the identification of primary transportation routes and
corresponding annual transportation volumes by mode for a selection of these important base chemicals,
EHSs, and other chemicals that local first responders and emergency management officials identified as
important. These first of their kind studies were conducted on behalf of the North Carolina Division of
3 2013, NC Tier II, Hazardous Chemical Inventory data

North Carolina Statewide Multimodal Freight Plan
Cambridge Systematics, Inc.
1-3
Emergency Management for groups of Domestic Preparedness Regions covering the entire state over the
course of five years from 2008 to 2012. These studies were conducted using a demand-pull model where the
presence of a study chemical at a facility meant that the demand was present and the chemical was either
locally produced or pulled into the state over the transportation system. Using authority given to Local
Emergency Planning Committees (LEPCs) under Section 303(d)(3) of the 1986 Emergency Planning and
Community Right-to-Know Act (EPCRA), owners or operators were asked to provide volume, container,
destination and origin data for all shipments of priority chemicals to or from their facilities by transportation
mode.
The primary data collected by these studies is substantive and allowed for the identification of primary EHS
transportation routes and related volumes for each transportation mode. The third key point is one of the
important lessons learned while doing these studies. That is, other than in several notable exceptions, North
Carolina does not produce base chemicals. Instead the state imports base chemical commodities and either
consumes them or makes them into other products.
One of the exceptions is PCS Phosphate in Aurora, North Carolina. PSC Phosphate manufactures several
base chemicals from the phosphate they mine and a dozen phosphate based products valued at $1.2 Billion
dollars in 2015. About 60 percent of these are fertilizers used in agriculture. This business is highlighted later
in the profile. This is just one example of how the states’ economy is highly dependent on the movement of
HazMat as freight, not just because it supports nearly everything we do, but also because HazMat is itself a
class of products North Carolina exports. North Carolina is the 7th highest value producer and shipper of
chemicals in the United States with a value of well over $2.3 billion dollars shipped in 2012 by the chemical
manufacturing industry4 (See Table 1.1 ). Yet the state is not within the top 20 shippers of HazMat overall
for all economic sectors. North Carolina imported $30.88 billion dollars’ worth of HazMat commodities,
weighing over 63.1 billion pounds in 2012. 5
Table 1.1 Top Ten Chemical Shipping States by Value
State Value of Shipments (Mil $)
California $5,873
Texas $5,399
New Jersey $3,486
Illinois $2,521
Ohio $2,521
New York $2,502
North Carolina $2,344
Pennsylvania $2,303
Louisiana $1,959
Source: 2012, United States Census, Industry Snapshot, Chemical Manufacturing (325)
4 2012, US Census Bureau, Economic Census, Industry Snapshot, Chemical Manufacturing (NAICS 325)
5 2012, US Census Bureau, Economic Census, Commodity Flow Survey, Tables 5 a and 5 b, pg. 5

North Carolina Statewide Multimodal Freight Plan
Cambridge Systematics, Inc.
1-4
This apparent conflict between these two points is not an error, it is important information. It means that
North Carolina is a net consumer of HazMat for the production of goods, including other HazMat products,
and imports HazMat as fuel. Again PCS Phosphate is a good example. In order to produce the fertilizer that
they sell, they need to import many unit train quantities of anhydrous ammonia.
It is important to also identify what is not present in the state. Crude oil is a base chemical that has received
a lot of attention nationally over the last four years because of a number of major accidents. One
catastrophic event in particular gained international attention. This event occurred in Lac Megantic, Canada
on July 6, 2013, where an early morning rail accident, subsequent fire and explosion led to significant loss of
life and property destruction. Essentially the explosion wiped out the core of this small town. A series of
similar but less harmful events followed in locations all along primary rail corridors in the United States.
These events were in part due to the development of the Bakken Oil Fields in North Dakota and the massive
increase in the shipment of crude oil by rail to east coast refineries that had previously received foreign crude
oil by ship.
There was a concern expressed by state government officials that North Carolina may be on a rail system
used to ship crude oil. According to HazMat car load counts received from both Class I railroads operating in
the North Carolina (CSXT and Norfolk Southern) over the course of conducting the HazMat Transportation
studies, it was confirmed that the state has no production nor shipment into or out of the state of crude oil by
rail. The US Energy Information Administration (EIA) data shows no pipelines, ship/barge, or truck shipments
of crude oil through the state, nor is there any refining capacity that would require crude oil to be imported.
North Carolina has no refineries that process crude oil.
As of November 2016, North Carolina does have 6 bio-fuel production facilities, but very little information is
available on them beyond the fact they produce about 97 million gallons of bio-fuels per year, and that
several more are still under construction. This highlights the fourth key point; nearly all fuel used for any
purpose in North Carolina is imported.
1.2 Organization of the Report
Consequently, a review of two HazMat sectors will provide significant insight into HazMat freight issues in
North Carolina. These two sectors are: fuels; and selected EHS and non-EHS chemicals. Each is explored in
separate sections of this profile. Section 2 discusses the distribution and transportation of fuels and Section 3
focuses on priority chemicals studied over the course of the North Carolina HazMat Transportation study
series. Within each of these sections of the profile, the primary HazMat activity, and the industries and
markets served are identified, the bottlenecks and deficiencies in the transportation system are evaluated,
and safety concerns are identified. Current and future demand estimates are provided. Finally, existing and
expected future needs are evaluated.
North Carolina Statewide Multimodal Freight Plan
Cambridge Systematics, Inc.
2-5
2.0 Fuels
North Carolina imports all of its petroleum based fuel and natural gas, as well as, significant quantities of bio-
fuels, such as ethanol. The transportation network used for transportation of fuel consists of:
5,490 miles of pipeline for the movement of petroleum fuel, non-fuel products, propane, and natural gas
38 inland motor fuel terminals – 36 supported by pipeline, 4 also served by rail, and 2 receive ethanol
exclusively by rail – all support truck loading operations (5 market areas served: Charlotte, Greensboro,
Apex, Selma, and Fayetteville)
12 aviation fuel terminals –7 military bases, 5 supported by pipeline, 3 by rail, and 4 by truck (4 market
areas served: Charlotte, Winston-Salem, Greensboro, and Morrisville)
2 propane terminals – one supported by pipeline and one supported by rail, both support truck loading
operations (2 market areas served: Sylva in western NC and Apex in east central NC)
2 Transload Facilities, one in Star, NC (Figure 2.1 ) and the second in Midland, NC (Figure 2.2 ) –
these facilities transfer unit train quantities of butane from rail tank cars to truck tank trailers for delivery
to fuel terminals and elsewhere for fuel blending to raise the octane during winter months, serving all
markets
6 marine petroleum terminals - receive ships and barges through the Port of Wilmington, also served by
rail and trucks (1 market area served: Wilmington)
Rail transport of petroleum fuels and bio-fuels for large volume delivery to terminals and large volume
consumers not served by a pipeline or port; and
Truck tank trailer fleets and support services to enable the transport and local delivery of all fuels but
natural gas
6 bio-fuel production facilities in North Carolina with close to 97 million gallons per year production
capacity or about 5 percent of demand – 2 are under construction

North Carolina Statewide Multimodal Freight Plan
Cambridge Systematics, Inc.
2-6
Figure 2.1 Star, NC Butane Rail to Truck Transloading Facility

North Carolina Statewide Multimodal Freight Plan
Cambridge Systematics, Inc.
2-7
Figure 2.2 Midland Transload Facility
Available data on the terminals in this network was obtained from the United States Energy Information
Administration (EIA) but was inaccurate, incomplete and very basic. Information from the IRS identified many
missing terminals, as did searches of Google Earth satellite images and general web searches. Terminals
pay tariffs on fuel to the IRS, as such, the IRS keeps a more accurate list. Data on the shell capacity and
products they support at these terminals was obtained whenever possible from on-line documents produced
by the terminal operators. Additional data was obtained to fill in gaps from shareholder annual reports,
Security and Exchange Commission 10K filings, construction contracts, local news articles, and by
generating close estimates of shell capacities for about one third of the terminals. These estimates were
based on dimensions of the tanks determined using satellite images and estimation tools.
The disaggregated county level Freight Analysis Framework version 4 (FAF4) used for other parts of this
study was missing any information on the shipments of refined petroleum fuels. This required the
development of a fuel model to attempt to understand the transportation of fuel in North Carolina.
2.1 Fuel Model
A mass-balance logic model was developed based on the terminal shell capacities to derive the expected
flows of refined petroleum fuels by mode within the state using the central assumption that the terminals hold
no more than two weeks of fuel; all delivered to local markets. Other assumptions in the model include:
Pipeline demand is at 100 percent capacity based on their implementation of shipping histories as a
means of allocating resources to client terminals
Other modes of importing fuel into the state have excess capacity and are more flexible, but because
they cost more, they are avoided when the pipeline can meet a demand, they include the marine
terminals and railroad supported terminals
All petroleum fuel is imported into the state moves to local markets and consumers – one-way flow

North Carolina Statewide Multimodal Freight Plan
Cambridge Systematics, Inc.
2-8
Markets outside of North Carolina are served by North Carolina terminals, but to an unknown degree
without FAF4 data to represent these market relationships
All movement will use the most efficient transportation mode whenever possible to save cost
Bio-fuels are 10 percent of petroleum fuel (Bio-Diesel and Ethanol)
Ethanol and bio-diesel may come from in state or outside sources but at unknown quantities
Ethanol is not shipped in any pipeline, it is generally carried long distances by ship, barge, and rail, and
trucks support local delivery
Tanker ships are estimated at no larger than 1,215,000-barrel capacity AFRAMAX class due to draft
limitations at the marine terminal docks
Rail and tanker truck capacities were fixed at the high end nominal levels (meaning that the shipment
counts are likely low)
All transmix6 fuels are collected and returned to the refinery by truck for reprocessing accounting for
about .5 to 1 percent of the pipeline capacity
Fuel received at marine terminals predominately serves the local market but can be more widely
distributed based on demand
Does not include natural gas because it generates very little freight outside of the pipeline and
distribution systems (Proposed expansions by Dominion on this system will link seven counties in the
state to shale gas sources in southwestern Pennsylvania)
2.2 Fuel Volumes by Mode in 2015 and Projections to 2045
The fuel model supports a conservative estimate with a mass balance of over 94 percent of the combined
peak capacity of the three fuel pipelines of 1,877,000 barrels per day. It is expected that some Virginia
markets are also served by the terminal in Greensboro, and South Carolina markets are also served by the
terminal in Charlotte. The model does not include or account for natural gas. It allows for some local
increases in delivery due to temporary surges in demand. The model drops the mass balance to 73 percent
of the total state-wide capacity when the marine terminals are included beyond local demand.
Table 2.1 displays the results of the model. It is estimated that in 2015 nearly two million fuel shipments
were made into and within the state over all modes of the state’s transportation system, distributing near
459 million barrels of fuel to local consumers annually. Based on EIA data for 23 years of North Carolina fuel
6 Transmix is the fuel in the pipeline that mixes at the boundary between different products during shipment.

North Carolina Statewide Multimodal Freight Plan
Cambridge Systematics, Inc.
2-9
consumption, the IEM analysis projects a 23 percent reduction in demand for motor fuel out to 2045,
reducing demand for motor fuel to 352 million barrels annually in North Carolina.7
Table 2.1 Total Estimated Refined Petroleum Fuel Shipments In North Carolina by
Mode in 2015
Into Terminals Out of Terminals
Mode Percent Barrels Shipments Barrels Shipments
Pipeline 62 283,435,932 - - -
Ship 31 143,622,565 118 - -
Rail 7 30,522,539 30,508 - -
Truck < 1 1,386,690 6,299 414,701,130 1,924,950
Air * 44,266,596 N/A
Totals 458,967,726 36,925 458,967,726 1,924,950
Notes: Includes Gasoline, Diesel, Bio-Fuels, Propane, Aviation Fuel and Additives. Does not include Natural Gas.
* 44,266,596 barrels of jet fuel is used to fuel aircraft with no outbound shipments
Figure 2.3 shows the annual stock quantity of selected petroleum products in terminals of North Carolina per
EIA data. Notice that diesel stock quantity decreased significantly since 1993. Based on the trend of the
selected petroleum products stock quantity, the motor fuel use in North Carolina is projected to decrease by
23% from 2015 to 2045. Note that annual stock quantity is the sum of the stock quantity on last day of each
month. Divide annual stock quantity by 12 gives an estimate of the expected stock quantity at any time of the
year. Large reductions in distillate fuel oil and residual fuel oil account for a significant part of this reduction.
Distillate fuel oil is mostly diesel and aviation fuels. There has been a significant reduction in diesel fuel
usage in North Carolina, likely due to trucks refueling in neighboring states with lower fuel taxes. Residual
fuel oil includes the heavier hydrocarbons that remain in the distillation process after the lighter hydrocarbons
are removed. It usually used for industrial applications and steam generation. North Carolina has not used
residual fuel oil since 2010. It is likely that the industries that used this fuel have converted to natural gas as
a fuel source.
7 US Energy Information Administration, North Carolina Refinery, Bulk Terminal, and Natural Gas Plant Stocks of
Selected Petroleum Products, from 1993 to 2015

North Carolina Statewide Multimodal Freight Plan
Cambridge Systematics, Inc.
2-10
Figure 2.3 Annual Stock Quantity of Selected Petroleum Products in North
Carolina
2.3 Pipelines
Pipelines move more than two thirds of all the crude oil and refined products in the United States. Based on
the estimates described in the previous section, the pipeline system in North Carolina moves 62 percent of
petroleum based fuels to five local market areas. They are generally the most economical and safest way to
transport large quantities of refined petroleum products or natural gas over land. Several recent exceptions
to the otherwise exceptional safety record highlight North Carolina’s dependence on pipeline deliveries of
fuel. These exceptions include a rupture and spill on a section of the Colonial Pipeline in Alabama that
occurred in September of 2016, and an explosion and fire about a mile away from the first event about a
month later in October of 2016. Within one week of the first event there were widespread shortages in the
state, and within two weeks, most gas stations were out of fuel. Despite these events the pipeline system
remains the most reliable means of delivering the needed 283 million barrels of fuel to the state per year.
North Carolina has a significant pipeline network. The state sits mid-route on several major pipelines that
transport refined petroleum products from the US Gulf Coast to destinations along the northeastern United
States, is the terminus of a major Natural Gas Liquids (NGL) or propane pipeline also from the Gulf Coast,
and has numerous refined product and natural gas distribution terminals across the state. The next section
describes the physical and operational characteristics of the pipeline network in North Carolina. The data
0
1,000
2,000
3,000
4,000
5,000
6,000
7,000
19
93
19
94
19
95
19
96
19
97
19
98
19
99
20
00
20
01
20
02
20
03
20
04
20
05
20
06
20
07
20
08
20
09
20
10
20
11
20
12
20
13
20
14
20
15
Tho
usa
nd
Bar
rels
Residual Fuel Oil
Distillate Fuel Oil
Kerosene
Blended Gasoline
Finished Gasoline
Trend of Selected Petroleum Products
North Carolina Statewide Multimodal Freight Plan
Cambridge Systematics, Inc.
2-11
analyzed for this pipeline profile was taken from the National Pipeline Mapping System (NPMS) GIS Layer,
and Freight Analysis Framework version 4 (FAF4).
2.3.1 Pipeline System Description
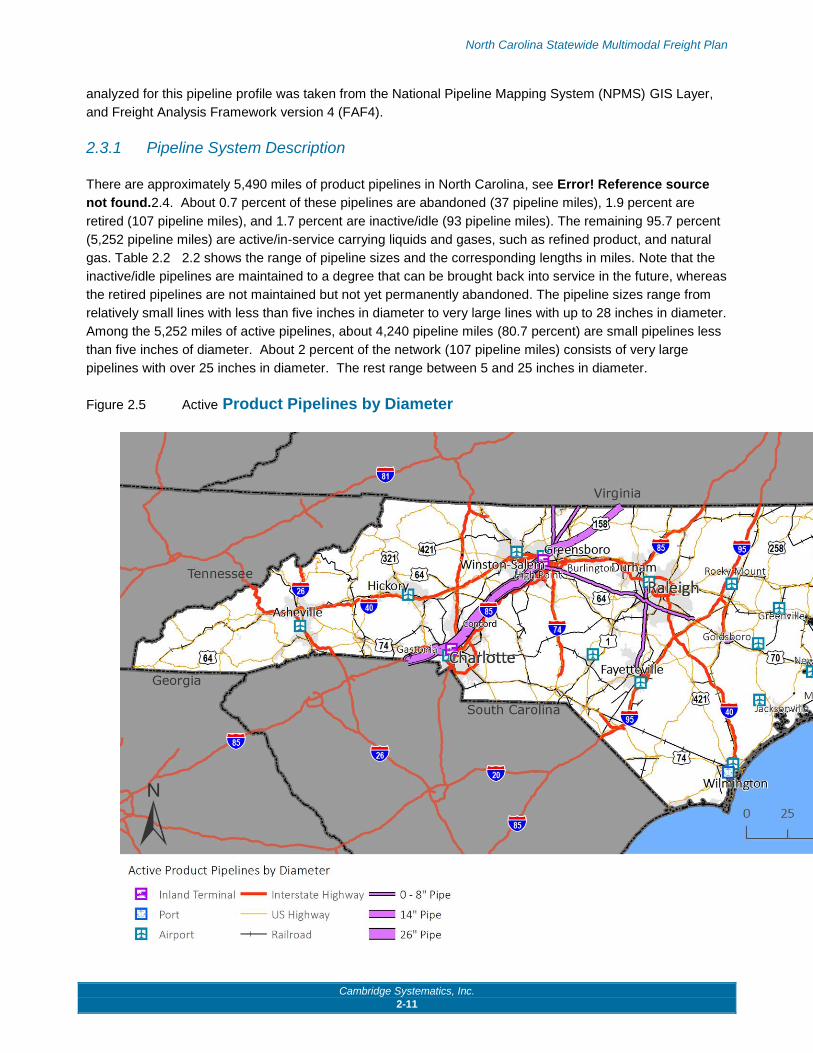
There are approximately 5,490 miles of product pipelines in North Carolina, see Error! Reference source
not found.2.4. About 0.7 percent of these pipelines are abandoned (37 pipeline miles), 1.9 percent are
retired (107 pipeline miles), and 1.7 percent are inactive/idle (93 pipeline miles). The remaining 95.7 percent
(5,252 pipeline miles) are active/in-service carrying liquids and gases, such as refined product, and natural
gas. Table 2.2 2.2 shows the range of pipeline sizes and the corresponding lengths in miles. Note that the
inactive/idle pipelines are maintained to a degree that can be brought back into service in the future, whereas
the retired pipelines are not maintained but not yet permanently abandoned. The pipeline sizes range from
relatively small lines with less than five inches in diameter to very large lines with up to 28 inches in diameter.
Among the 5,252 miles of active pipelines, about 4,240 pipeline miles (80.7 percent) are small pipelines less
than five inches of diameter. About 2 percent of the network (107 pipeline miles) consists of very large
pipelines with over 25 inches in diameter. The rest range between 5 and 25 inches in diameter.
Figure 2.5 Active Product Pipelines by Diameter

North Carolina Statewide Multimodal Freight Plan
Cambridge Systematics, Inc.
2-12
Figure 2.6 Active Natural Gas Pipelines by Diameter
2.5 displays a map of the North Carolina pipeline network with the lines that are in service by pipeline
diameter. Error! Reference source not found.2.6 and 2.7 are maps of the active natural gas and liquefied
petroleum gas (propane) pipeline systems respectively. Error! Reference source not found.2.8 displays
other active gas pipelines near Greenville and Durham, NC, that carry specialized chemicals over short
distances, and Figure 2.9 displays the projected flow of refined petroleum fuel by pipeline in North Carolina.
Table 2.2 Active Pipeline Diameters
Diameter (inches) Miles
< 5 4,240
(5 to 10) 459
(10 to 15) 361
(15 to 20) 76
(20 to 25) 9
> 25 107
North Carolina Statewide Multimodal Freight Plan
Cambridge Systematics, Inc.
2-13
Total 5,252
Source: National Pipeline Mapping System (NPMS).

No
rth C
aro
lina S
tate
wid
e M
ultim
od
al F
reig
ht P
lan
Cam
brid
ge S
yste
ma
tics, In
c.
2-1
4
Figure 2.4 North Carolina Active Pipeline Network by Commodity

North
Ca
rolin
a S
tate
wid
e M
ultim
od
al F
reig
ht P
lan
Cam
brid
ge S
yste
ma
tics, In
c.
2-1
5
Figure 2.5 Active Product Pipelines by Diameter

No
rth C
aro
lina S
tate
wid
e M
ultim
od
al F
reig
ht P
lan
Cam
brid
ge S
yste
ma
tics, In
c.
2-1
6
Figure 2.6 Active Natural Gas Pipelines by Diameter

North
Ca
rolin
a S
tate
wid
e M
ultim
od
al F
reig
ht P
lan
Cam
brid
ge S
yste
ma
tics, In
c.
2-1
7
Figure 2.7 Active Liquefied Petroleum Gas Pipelines

No
rth C
aro
lina S
tate
wid
e M
ultim
od
al F
reig
ht P
lan
Cam
brid
ge S
yste
ma
tics, In
c.
2-1
8
Figure 2.8 Other Active Gas Pipelines

North
Ca
rolin
a S
tate
wid
e M
ultim
od
al F
reig
ht P
lan
Cam
brid
ge S
yste
ma
tics, In
c.
2-1
9
Figure 2.9 Other Commodities by Pipeline - Refined Petroleum Fuel, 2045 Tons
Note: Refined petroleum fuels include all motor fuels, jet fuels, and heating oils.

North Carolina Statewide Multimodal Freight Plan
Cambridge Systematics, Inc.
2-20
According to US Pipeline and Hazardous Materials Administration (PHMSA) data, FAF4 data,
pipeline/terminal operators, and EIA gasoline sales data, refined petroleum fuel is transported in North
Carolina through pipeline as shown in Table 2.3 Fuel to and from North Carolina by Pipeline2.3.
The demand is expected to decrease by 26 percent from 2012 to 2045. A total of 27 million tons of fuel is
expected to be transported into North Carolina in 2045 as shown in Figure 2.10. Within this group of fuels is
a large amount of aviation fuel that is consumed at the major airports in Charlotte, Morrisville and
Fayetteville, all of which connect to the Colonial Pipeline system. Gasoline is mainly transported to facilities
in Greensboro, Charlotte, Selma, and Fayetteville for blending with ethanol and butane and distribution by
truck. Additionally, about 60 percent of the fuel demand in the mid-Atlantic and lower northeastern states is
met by the Colonial and Plantation pipelines with fuel transported from southern Gulf states through
Greensboro, North Carolina serving as the primary hub.
Table 2.3 Fuel to and from North Carolina by Pipeline
From To 2012 Thousand Tons 2045 Thousand Tons
South Carolina Charlotte, NC 36,443 26,968
Charlotte, NC Greensboro, NC 24,700 18,278
Greensboro, NC Raleigh, NC 22,602 16,725
Raleigh, NC Selma, NC 8,355 6,183
Raleigh, NC Fayetteville, NC 2,672 1,977
Greensboro, NC Virginia 2,147 1,589
Source: FAF4, PHMSA hazardous liquid annual data, EIA gasoline sales data and pipeline/terminal operators.

North
Ca
rolin
a S
tate
wid
e M
ultim
od
al F
reig
ht P
lan
Cam
brid
ge S
yste
ma
tics, In
c.
2-2
1
Figure 2.10 Refined Petroleum Fuel Flow in Pipelines, 2045 Tons

North Carolina Statewide Multimodal Freight Plan
Cambridge Systematics, Inc.
2-22
2.4 Non-Fuel Petroleum Products
The “non-fuel petroleum products” are commodities with SCTG code of 19 in FAF4 dataset, and is officially
named as “other coal and petroleum products not else classified”. This commodity type does not include
crude petroleum, gasoline, aviation turbine fuel, ethanol (including kerosene and fuel alcohols), or fuel oils
(including diesel, bunker C and biodiesel). It does include lubricating oils and greases, gaseous
hydrocarbons (including liquefied natural gas, liquefied propane, liquefied butane), and other coal products
and products of petroleum refining, and natural asphaltic minerals, not elsewhere classified. Table 2.4 and
Figure 2.11 provides a summary of non-fuel petroleum products flowing in North Carolina by pipeline.
Table 2.4 Non-Fuel Petroleum Product to and from North Carolina by Pipeline
From To 2012 Thousand Tons 2045 Thousand Tons
Greensboro, NC Charlotte, NC 4.8 5.1
Greensboro, NC Greensboro, NC 3.6 6.3
Charleston, SC Charlotte, NC 2,394.9 6,308.0
Charleston, SC Greensboro, NC 1.2 5.0
Greenville, SC Charlotte, NC 6,501.6 6,970.4
Greenville, SC Greensboro, NC 4,722.4 8,370.6
Greenville, SC Rest of NC 1.8 2.0
Rest of SC Charlotte, NC 794.4 773.4
Rest of SC Greensboro, NC 2,506.7 4,034.8
Richmond, VA Charlotte, NC 145.1 284.7
Richmond, VA Greensboro, NC 55.0 178.6
Virginia Beach, VA Charlotte, NC 1.9 0.8
Virginia Beach, VA Greensboro, NC 34.9 23.0
Washington D.C. Charlotte, NC 91.8 115.8
Washington D.C. Greensboro, NC 541.6 1,129.9
Washington D.C. Rest of NC 0.1 0.2
Rest of VA Charlotte, NC 607.8 401.8
Greensboro, NC Richmond, VA 2,311.7 4,720.6
Greensboro, NC Virginia Beach, VA 1,092.5 2,614.6
Greensboro, NC Washington D.C. 3,378.8 8,109.6
Greensboro, NC Rest of VA 4,213.3 8,921.5
Source: Freight Analysis Framework Version 4 (FAF4)

North
Ca
rolin
a S
tate
wid
e M
ultim
od
al F
reig
ht P
lan
Cam
brid
ge S
yste
ma
tics, In
c.
2-2
3
Figure 2.11 Non-Fuel Petroleum Product Flow in Pipelines, 2045 Tons
North Carolina Statewide Multimodal Freight Plan
Cambridge Systematics, Inc.
2-24
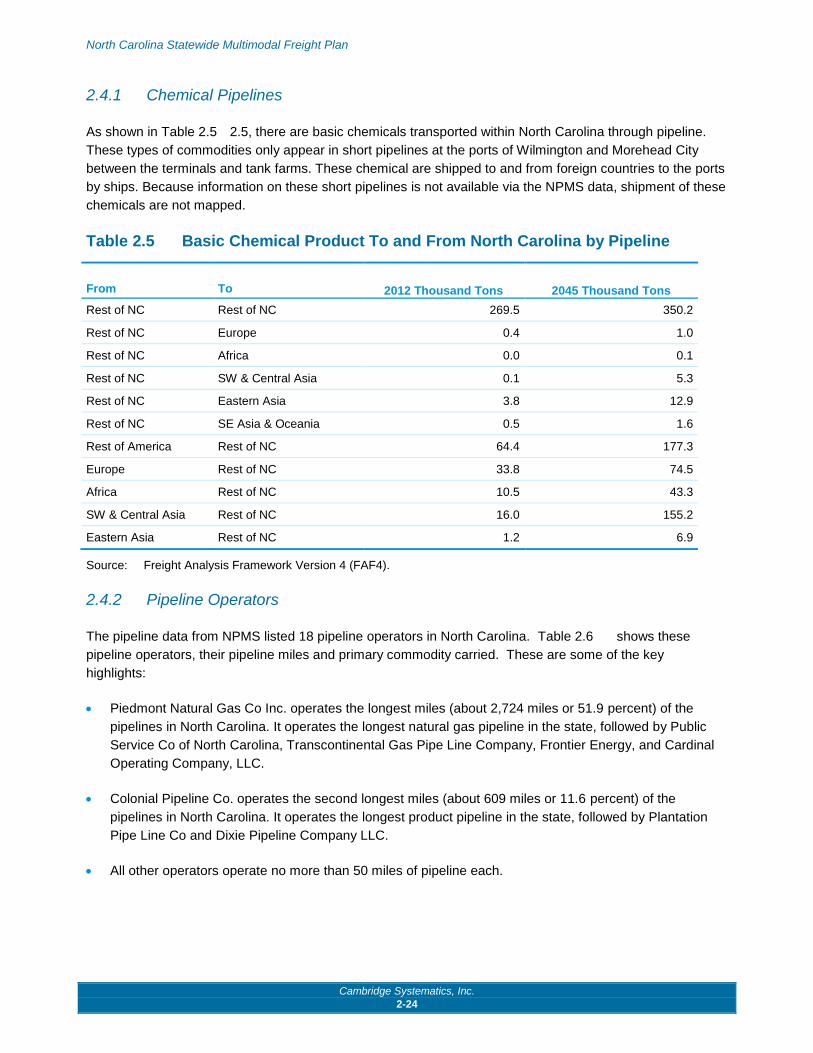
2.4.1 Chemical Pipelines
As shown in Table 2.5 2.5, there are basic chemicals transported within North Carolina through pipeline.
These types of commodities only appear in short pipelines at the ports of Wilmington and Morehead City
between the terminals and tank farms. These chemical are shipped to and from foreign countries to the ports
by ships. Because information on these short pipelines is not available via the NPMS data, shipment of these
chemicals are not mapped.
Table 2.5 Basic Chemical Product To and From North Carolina by Pipeline
From To 2012 Thousand Tons 2045 Thousand Tons
Rest of NC Rest of NC 269.5 350.2
Rest of NC Europe 0.4 1.0
Rest of NC Africa 0.0 0.1
Rest of NC SW & Central Asia 0.1 5.3
Rest of NC Eastern Asia 3.8 12.9
Rest of NC SE Asia & Oceania 0.5 1.6
Rest of America Rest of NC 64.4 177.3
Europe Rest of NC 33.8 74.5
Africa Rest of NC 10.5 43.3
SW & Central Asia Rest of NC 16.0 155.2
Eastern Asia Rest of NC 1.2 6.9
Source: Freight Analysis Framework Version 4 (FAF4).
2.4.2 Pipeline Operators
The pipeline data from NPMS listed 18 pipeline operators in North Carolina. Table 2.6 shows these
pipeline operators, their pipeline miles and primary commodity carried. These are some of the key
highlights:
Piedmont Natural Gas Co Inc. operates the longest miles (about 2,724 miles or 51.9 percent) of the
pipelines in North Carolina. It operates the longest natural gas pipeline in the state, followed by Public
Service Co of North Carolina, Transcontinental Gas Pipe Line Company, Frontier Energy, and Cardinal
Operating Company, LLC.
Colonial Pipeline Co. operates the second longest miles (about 609 miles or 11.6 percent) of the
pipelines in North Carolina. It operates the longest product pipeline in the state, followed by Plantation
Pipe Line Co and Dixie Pipeline Company LLC.
All other operators operate no more than 50 miles of pipeline each.

North Carolina Statewide Multimodal Freight Plan
Cambridge Systematics, Inc.
2-25
Table 2.6 Major Pipeline Operators in North Carolina
Pipeline Operator Primary Commodity Carried Miles %
Piedmont Natural Gas Co Inc. Natural Gas 2,724 51.9%
Colonial Pipeline Co Product 609 11.6%
Public Service Co of North Carolina Natural Gas 599 11.4%
Transcontinental Gas Pipe Line Company Natural Gas 587 11.2%
Plantation Pipe Line Co Product 317 6.0%
Frontier Energy Natural Gas 137 2.6%
Cardinal Operating Company, LLC Natural Gas 104 2.0%
Dixie Pipeline Company LLC Liquefied Petroleum Gas 90 1.7%
City of Monroe Natural Gas Dept. Natural Gas 44 0.8%
City of Toccoa Natural Gas System Natural Gas 13 0.3%
East Tennessee Natural Gas, LLC Natural Gas 8 0.2%
Buckeye Development & Logistics, LLC Liquefied Petroleum Gas 6 0.1%
Douglas Pipeline Co Other Gas 3 0.1%
Duke Energy Asheville Combustion Turbine Natural Gas 3 0.1%
Fayetteville Gas Producers, LLC Natural Gas 2 0.0%
Pine Needle Operating Company, LLC Natural Gas 2 0.0%
Pitt Landfill Gas, LLC Other Gas 2 0.0%
Columbia Gas Transmission, LLC Natural Gas 1 0.0%
Total Miles 5,252 100%
Source: National Pipeline Mapping System (NPMS).
2.4.3 Intermodal Connections
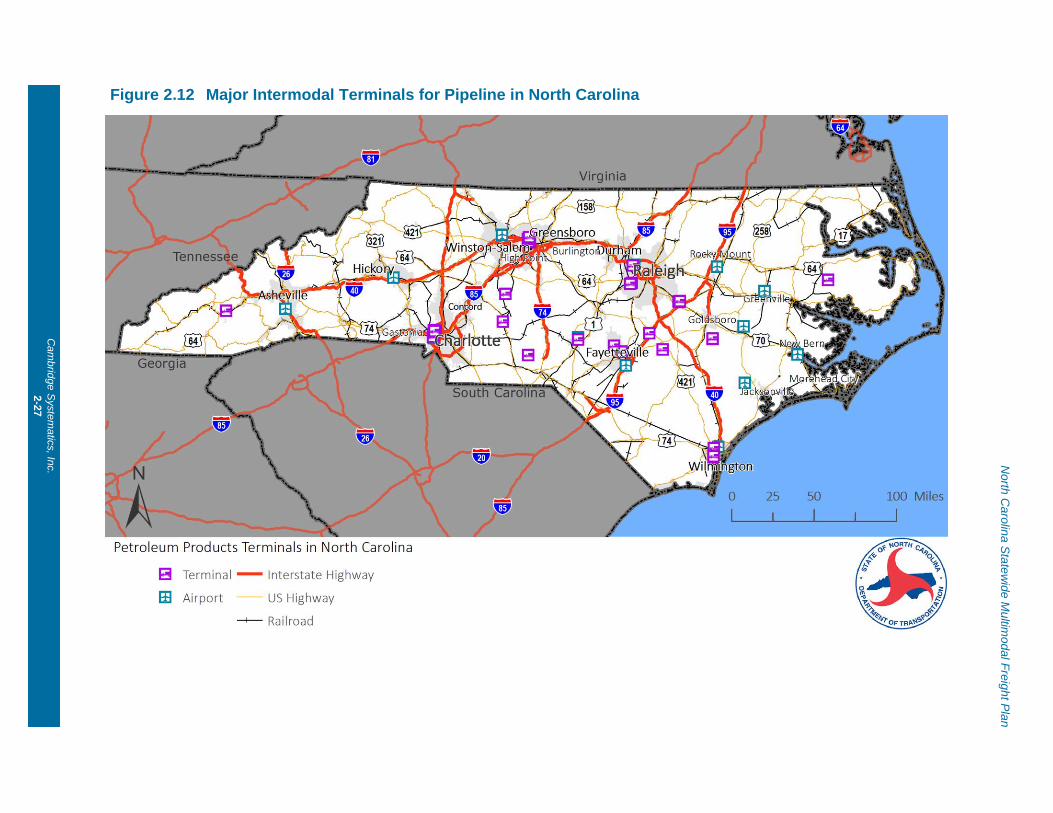
Figure 2.12 shows the location of major intermodal petroleum product terminals for pipelines in North
Carolina. Tables 2.7 to 2.9 show their names, addresses, commodities and capacities. There are 38 fuel,
propane and aviation terminals and the pipelines supporting these terminals are operating at or near capacity
mainly transporting fuels (gasoline, diesel, aviation fuel), at an estimated rate of 283 million barrels per year.
Below is the breakdown for the terminal clusters by city:
There are ten fuel terminals in Selma, NC. They all are connected to the pipeline system operated by
Colonial. It is estimated a total 66 million barrels of commodities (mainly gasoline and diesel fuel) are
transported to Selma, NC by pipelines. Gasolines are blended there with bio-fuel, which are transported
into the terminal by 9,498 rail cars each year. The processed products are shipped out from these
terminals by 336,340 trucks each year.
There are twelve fuel terminals in Charlotte, NC. They are connected to the pipelines operated by
Colonial and/or Plantation. It is estimated a total 93 million barrels of commodities are transported to
Charlotte, NC by pipelines. Gasolines are blended there with bio-fuel, which are transported in by 13,341
rail cars each year. The processed products are shipped out from these terminals by 426,580 trucks
each year.
North Carolina Statewide Multimodal Freight Plan
Cambridge Systematics, Inc.
2-26
There are seven fuel terminals in Greensboro, NC. They are connected to the pipelines operated by
Colonial and/or Plantation. It is estimated a total 83 million barrels of commodities are transported to
Greensboro, NC by pipelines. Gasolines are blended there with bio-fuel, which are transported in by
11,892 rail cars each year. The processed products are shipped out from these terminals by 382,621
trucks each year.
There are six marine fuel terminals in Wilmington, NC. They supported by and estimated 118 AFRAMAX
class size shiploads per year. It is estimated a total 131 million barrels of commodities are transported to
Wilmington, NC by ships. Gasolines are blended there with bio-fuel, which are transported in by ship at
approximate quantity of 13 million barrels. The processed products are shipped out from these terminals
by 662,771 trucks each year.
There is one terminal is Apex, NC. It is supported by a connection to the Colonial Pipeline System. It is
estimated a total of 4.8 million barrels of commodities are shipped to Apex by pipeline each year.
Gasolines are blended there with bio-fuel which are transported in by 2,260 truck shipments each year.
The processed products are shipped out from this terminal by 24,863 trucks each year.
Another Apex terminal supports only propane. It is served by the Dixie Pipeline. It is estimated a total of
over 11 million barrels of propane are shipped to Apex by pipeline each year. Propane is loaded onto
shipped out from this terminal by 50,587 trucks per year.
There is one terminal in Fayetteville, NC. It is supported by a connection to the Colonial Pipeline System.
It is estimated a total of 21.1 million barrels of commodities are shipped to the Fayetteville terminal by
pipeline each year. Gasolines are blended there with bio-fuel which are transported in by 2,220 truck
shipments each year. The processed products are shipped out from this terminal by 24,420 trucks each
year.
There is an ethanol terminal in Denton, NC. It is supported with 1,342 rail car per year (17 unit trains) of
ethanol deliveries by rail. Ethanol is shipped out by 4,369 trucks each year.
North
Ca
rolin
a S
tate
wid
e M
ultim
od
al F
reig
ht P
lan
Cam
brid
ge S
yste
ma
tics, In
c.
2-2
7
Figure 2.12 Major Intermodal Terminals for Pipeline in North Carolina

North Carolina Statewide Multimodal Freight Plan
Cambridge Systematics, Inc.
2-28
Table 2.7 Fuel Terminals
Name Address Commodity Shell
Capacity (bbls)
Notes
Kinder Morgan Southeast Terminal Selma 4
4086 Buffalo Rd, Selma, NC 27576
Gasoline, Diesel, Ethanol 160,000
Ethanol Blending, Dye Injection
Marathon Petroleum Company Selma
3707 Buffalo Rd, Selma, NC 27576 Gasoline, Ethanol 151,300 Listed as BP, ethanol
Kinder Morgan Southeast Terminal Selma 2
2100 West Oak Street, Selma, NC 27576 Diesel, Ethanol 70,000 Ethanol Blending
Kinder Morgan Southeast Terminal Selma 1
2200 W Oak St, Selma, NC 27576
Gasoline, Diesel, Ethanol 332,000
Ethanol Blending, Truck Refueling, Additive Injection, Dye Injection
ARC Terminals Holding Co Selma
2999 West Oak Street, Selma, NC 27567
Gasoline, Distillates, Ethanol, Biodiesel 171,000
TransMontaigne Product Services Selma - N
2427 W Oak St, Selma, NC 27576 Diesel, Gasoline 529,000
Marathon Petroleum Company Selma MOC 1
2555 W Oak St, Selma, NC 27576 Gasoline 312,000
Citgo Petroleum Corp Selma
4095 Buffalo Rd, Selma, NC 27576 Gasoline, Diesel 250,000
Kinder Morgan Southeast Terminal Selma 3
4383 Buffalo Road, Selma, NC 27576
Gasoline, Diesel, Ethanol 190,000
Ethanol Blending, Additive Injection, Dye Injection
Magellan Pipeline Co LP Selma
4414 Buffalo Rd, Selma, NC 27576
Diesel Fuel, Gasoline, Ethanol 186,300
Motiva Enterprises LLC Raleigh Blending Terminal
2232 Ten-Ten Road, Apex, NC 27539-8115 Gasoline 186,300 Ethanol Blending Facility
Motiva Enterprises LLC Fayetteville
992 Shaw Mill Road, Fayetteville, NC 28311
Gasoline, Diesel, Ethanol 185,000
Magellan Pipeline Co Charlotte 1
7145 Old Mt. Holly Rd., Charlotte, NC 28214
Gasoline, Diesel, Ethanol 155,000
Kinder Morgan Southeast Terminal Charlotte 3
7325 Old Mt. Holly Rd, Charlotte, NC 28214 Diesel and Ethanol 145,000
Ethanol Blending, Additive and Dye Injection
Marathon Petroleum Co Charlotte
8035 Mt Holly Rd, Charlotte, NC 28214 Gasoline 145,000
TransMontaigne Product Services Charlotte Paw Creek
7615 Old Mt Holly Rd, Charlotte, NC 28214 Gasoline, Diesel 327,667
Citgo Petroleum Corp Charlotte
7600 Mt Holly Rd, Charlotte, NC 28214 Gasoline, Diesel 240,000
Eco-Energy Distribution Services LLC Charlotte
7720 Mount Holly Road, Charlotte, NC 28214
Gasoline, Ethanol, biodiesel 130,000
Kinder Morgan Southeast Terminal Charlotte 2
6801 Freedom Dr, Charlotte, NC 28214
Gasoline, Diesel, Jet A, Ethanol 376,000
Ethanol Blending, Additive and Dye Injection

North Carolina Statewide Multimodal Freight Plan
Cambridge Systematics, Inc.
2-29
Name Address Commodity Shell
Capacity (bbls)
Notes
Motiva Enterprises LLC Charlotte NC Motiva South
6851 Freedom Drive, Charlotte, NC 28214 Gasoline 180,000
Magellan Pipeline Co LP Charlotte 2
7924 Mt. Holly Road, Charlotte, NC 28214
Gasoline, Diesel, Ethanol 325,000
Motiva Enterprises LLC Charlotte
410 Tom Sadler Road, Charlotte, NC 28214
Gasoline, distillate, jet and bio fuels 200,000
Marathon Petroleum Co LLC Charlotte - East
7401 Old Mt Holly Road, Charlotte, NC 28214
Gasoline, diesel, ethanol 350,000
Kinder Morgan Southeast Terminal Charlotte 1
502 Tom Sadler Road, Charlotte, NC 28214 Gasoline, Diesel 658,000 Dye Injection
JT Russell & Sons Inc. - Denton
18846 NC-8, Denton, NC 27239 Ethanol and Asphalt 36,000
Eco-Energy Distribution Services LLC High Rock is partner
Kinder Morgan Southeast Terminal Greensboro 2
6376 Burnt Popular Road, Greensboro, NC 27409
Gasoline, Diesel, Ethanol 631,000
Ethanol Blending, Additive and Dye Injection
Motiva Enterprises LLC Greensboro Blending Terminal
101 South Chimney Rock Road, Greensboro, NC 27409 Gasoline 215,000
Magellan Terminals Holdings LP Greensboro 1
115-S Chimney Rock Rd., Greensboro, NC 27409
Diesel, Gasoline, Ethanol 215,000
TransMontaigne Products Services Inc Greensboro
6907 B West Market Street, Greensboro, NC 27409 Diesel, Gasoline 479,000
Center Point Terminal LLC Greensboro
6900 West Market Street, Greensboro, NC 27409
Diesel, Gasoline, Biodiesel, Distillate, Jet Fuel 684,000
Kinder Morgan Southeast Terminal Greensboro 1
6907 West Market Street, Greensboro, NC 27409
Gasoline, Diesel, Ethanol, Jet A 735,000
Ethanol Blending, Additive and Dye Injection
Magellan Pipeline Co LP Greensboro 2
7109 W. Market St., Greensboro, NC 27409
Diesel, Gasoline, Ethanol 631,000
Buckeye Terminal LLC Wilmington
1312 Front Street, Wilmington, NC 28401 Diesel, Gasoline 572,000
Kinder Morgan Terminal Wilmington LLC Woodbine Street
1710 Woodbine St, Wilmington, NC, 28402
Chemicals, Petroleum, Asphalt 821,529
Additive Injection, Blending, Heating
Kinder Morgan Terminal Wilmington LLC River Road
3340 River Road, Wilmington, NC 28412
Chemicals, Veg Oils, Petroleum 313,000
Kinder Morgan Terminal Wilmington LLC N 6th Street
2005 North Sixth Street, Wilmington, NC 28401
Petroleum and Specialty Chemicals 1,100,000
Apex Oil Company Inc. Wilmington
3314 River Road, Wilmington, NC 28412
Asphalt, Liquid Asphalt, Distillate, Biodiesel, Aviation Gasoline 1,485,000

North Carolina Statewide Multimodal Freight Plan
Cambridge Systematics, Inc.
2-30
Name Address Commodity Shell
Capacity (bbls)
Notes
Colonial Terminals Wilmington
1002 S Front Street, Wilmington, NC 28401
Caustics, Acids, Petroleum, Specialty Chemicals, Solvents, Alcohols 730,239
Blending, Heating, Truck Scales
Source: Pipeline Operators, US Energy Information Administration (EIA), US Internal Revenue Service, and other
sources
Table 2.8 Propane Terminals
Name Address Commodity Shell Capacity
(bbls) Notes
Enterprise Products Aberdeen - Operating LLC Sylva NGL
2805 Skyland Drive, Sylva, NC 28779 Propane, NGL 6,667 Rail Terminal
Enterprise Products Aberdeen NGL
1674 Roseland Rd, Aberdeen, NC 28315
Natural Gas Liquids (Propane, Butane, Isobutane,
Pentane, Ethane, etc.) - No tanks, just monitoring
Dixie Pipeline Enterprise Products HGL
1497 Central Dr, Southern Pines, NC 28387 Propane -
No apparent storage
Dixie Pipeline Apex Tank (Enterprise Products)
1521 E Williams St, Apex, NC 27539 Propane 426,190
NGL 36 MBPD Pipeline Capacity
Source: Pipeline Operators, US Energy Information Administration (EIA), US Internal Revenue Service, and other
sources
Table 2.9 Aviation Terminals
Name Address Commodity Shell Capacity
(bbls)
Pope Air Force Base Gena Street, Pope Field, NC, 28308 Jet Fuel 630,000
Seymore Johnson AFB 1510 Wright Brothers Ave, Goldsboro, NC 27531 Jet Fuel 94,500
North Carolina Air National Guard 4930 Minuteman Way, Charlotte, NC 28208 Jet Fuel 5,700
Camp McKall Army Base Hoffman NC, 28347 Jet Fuel 3,500
US Coast Guard - Elizabeth City 1664 Weeksville Rd, Elizabeth City, NC 27909 Jet Fuel 5,500
US Marine Corps - Camp Lejeune (New River)
White St AS-201, Jacksonville, NY 28540 Jet Fuel 28,000
US Marine Corps - Cherry Point Highway 101, Cherry Point, NC 28533 Jet fuel 76,000
Raleigh-Durham Airport Authority (Worldwide Flight Services)
2800 West Terminal Blvd, Morrisville, NC 27560 Aviation Fuel 153,000
Aircraft Service International, Inc. 6502 Old Dowd Rd., Charlotte, NC 28219 Jet Fuel 350,000

North Carolina Statewide Multimodal Freight Plan
Cambridge Systematics, Inc.
2-31
Name Address Commodity Shell Capacity
(bbls)
Signature Flight Support 1060 PTI Drive, Greensboro, NC 27409 Jet Fuel 1,800
Landmark Aviation 3821 N. Liberty St., Winston-Salem, NC 27105 Jet Fuel 1,500
Source: Pipeline Operators, US Energy Information Administration (EIA), and other sources
2.4.4 Bottlenecks and Deficiencies
There are two clear bottlenecks and one major deficiency in the transportation infrastructure for fuels in North
Carolina.
Fuel Pipeline System Capacity
The first and most obvious bottleneck is more of a vulnerability. It concerns the pipelines are operating at or
near maximum capacity. While there appears to be some additional capacity to import fuel via the marine
terminals at the Port of Wilmington, this would only be sufficient for emergency needs and surge capacity as
there would be a higher cost to transport fuel to markets around the state. Over the mid to long- term this
additional cost would be passed on to consumers as increased fuel prices. Consequently, the state is highly
dependent on the pipelines. When there is a supply disruption, as was experienced during the two recent
Colonial pipeline events in Alabama, the state has few options except to suffer the economic and social
impacts that a prolonged fuel shortage will cause.
Fuel Terminal Access and Multimodal Connectivity
The second bottleneck concerns the linkages between the fuel terminals and all other modes of transport.
They are weak at best. All of the inland and marine terminals are only supported with two lane roads as
connections to main arterial roads, highways, and the interstate system. Not all of the fuel terminals have full
access to rail lines to obtain ethanol by rail. This may not seem to be important except when you consider:
Every railcar that can deliver ethanol to a terminal replaces three or more deliveries by truck tank trailer
The nearly two million truck tank trailer loads leaving these terminals per year is nearly two million
opportunities for a serious accident and HazMat event as these trucks turn or merge into traffic
The Charlotte group of terminals, for example, are estimated to ship out nearly 92.4 million barrels of fuel per
year in more than 426,500 truck trailers loads at an average rate of 1,169 per day, or close to 50 truck trailer
loads per hour, every day all year. These connections between modes are the main bottleneck.
New terminals are being built in isolated areas with access to rail and local roads. The JR Russel & Sons
ethanol terminal in Denton, NC for example, is located 14 miles from Interstate 85. To get to the interstate,
trucks must travel over sections of three state highways and two local roads. Local officials are concerned for
the safety of the residents.
Another example is the Dixie propane facility in Apex, NC. This facility receives propane from the dedicated
propane pipeline and ships out an estimated 11 million barrels of propane per year with more than 50,000
truck tank trailer loads, 138 shipments per day, or almost 6 per hour. During some periods of the day this

North Carolina Statewide Multimodal Freight Plan
Cambridge Systematics, Inc.
2-32
may not seem like a big problem, but during rush hour times it is a major safety concern for the facility and
local officials. Trucks leaving the facility have to stop at a gate, from that point to where they need to begin to
turn into traffic is about 18 feet. This is not enough space to accelerate and safely merge a large fully loaded
semi-truck into traffic on State Highway 55, especially when carrying HazMat. (See Figure 2.13)
Figure 2.13 Dixie Terminal in Apex, NC
Field Fuel Blending
The deficiency concerns fuel blending. Gasoline is not one chemical, it is more of an engineered fuel. A
mixture of chemicals with different properties are blended together in precise combinations and ratios during
the fall and winter, and spring and summer and to obtain the different grades of fuel matched to the seasonal
temperature variations. Additives are included in the mixture to help keep engine components from fowling,
as a lubricant, a corrosion inhibitor, to increase octane, and meet environmental standards. Ethanol and
butane are two of the most important chemicals that are included in these blends. Ethanol ranges from 0 up
to 85 percent of the blend. Butane ranges from 2 up to 10 percent of the blend.
Some of the terminals in the state have automatic blending systems built into their truck loading racks, but
others do not. Both butane and ethanol are primarily shipped into the state in rail tank cars. These tank cars
can be delivered directly to only 3 of the inland terminals who are equipped to receive them. The ones that
do not have rail facilities have to pay for delivery of ethanol and butane by truck tank trailers to the terminal
or meet them in the middle somewhere and blend directly into the tanker trucks before they deliver fuel to the
gas stations. This situation gives rise to the transload facilities in Star and Midland, NC. These transload
facilities transfer ethanol and butane from rail tank cars into truck tank trailers. Often this field blending is
done in back lots, without adequate safety processes and systems, and no community awareness.
Rail connections need to be established with all fuel terminals in the state that distribute gasoline. Field
blending of gasoline needs to be discouraged.
2.5 Safety
In addition to the significant safety issues discussed in the previous section concerning field blending of
gasoline, these activities are usually opportunistic and ad-hock providing community first responders, and

North Carolina Statewide Multimodal Freight Plan
Cambridge Systematics, Inc.
2-33
emergency management officials little opportunity to plan for or prepare an adequate response. Beyond that,
the citing of these activities is often poor, exposing the population in many communities and especially
sensitive populations, such as schools, day cares, hospitals, and similar facilities, to unnecessary risk.
Use of side rails to store rail cars of Butane, propane and ethanol in close proximity to Star and Midland, NC
and elsewhere in the state, while lawful and advantageous to them, again exposes the population to
unnecessary risk. The terminals need to develop rail car storage facilities adequate to support their needs.
North Carolina needs to promote and enhance the safe operation of all of the pipeline systems in the state.
Local utility identification and marking (811) and safety programs that seek to prevent violations of pipeline
easements are important, especially as development demands begin to encroach due to rapid development.
Local government land-use planners need to be aware of all pipeline easements and demonstrate respect
for the serious public safety risk presented by a breach or fire anywhere on a pipeline system. They need to
recognize that during an event it will be necessary to isolate the event area within a 150-foot radius and may
be necessary to evacuate within a half-mile radius. It is prudent to not allow some sensitive populations like
hospitals and prisons to be built within a half-mile of a pipeline8. There is no way a major hospital, large
school, prison or major event location can be evacuated quickly enough to save everyone from harm during
a rapidly evolving HazMat event, it is best not to build these types of facilities within a half-mile of any
HazMat facility.
2.6 Existing and Expected Future Needs
Three existing priority needs have been identified, they are:
Enhancing the connections between all modes of transportation at all terminals;
Planning for public protective actions at the community level out to a half-mile for all terminals; and
Engaging local land-use planners and public officials in an effort to prevent encroachment on the
terminals and pipeline easements.
Developing additional pipeline capacity may be a future need if fuel demand exceeds expectations or if the
pipelines become less reliable and a need is identified to develop some redundancy and resiliency within the
pipeline infrastructure.
8 US DOT Emergency Response Guidebook, Guide 128, Evacuation Distance for Fire


North Carolina Statewide Multimodal Freight Plan
Cambridge Systematics, Inc.
3-1
3.0 Selected Extremely Hazardous Substances and non-
Extremely Hazardous Substances
The State of North Carolina, Division of Emergency Management, conducted a series of regional HazMat
Transportation studies over five years from 2008 to 2012. These studies identified priority Extremely
Hazardous Substance (EHS) corridors covering the entire state of North Carolina. Each study year a process
was followed to work with key stakeholders to identify and rank study chemicals that represented the most
significant hazard to the community, reducing the focus down from hundreds or thousands of candidate
chemicals to the 10 to 14 priority study chemicals that had the greatest potential for a community scale risk.
3.1 Overview of Flows
Detailed shipping data was then obtained directly from shippers or facilities that reported these priority
chemicals. This security sensitive and proprietary information was used to complete the studies and now has
been desensitized for use in this profile. The data behind five sets of EHS corridors maps generated for
previous studies have been merged into two state-wide maps representing the total shipping volumes of the
most common study chemicals over the five study years. The following 13 EHS chemicals are represented
on the EHS Flow Map: Anhydrous Ammonia, Chlorine, Formaldehyde, Hydrogen Fluoride, Hydrogen
Chloride, Sulfuric Acid, Sulfur Dioxide, Bromomethane, Hydrogen Peroxide, Cycloheylamine, Vinyl Acetate
Monomer, Phenol, and Ethylene Oxide. Four Non-EHS chemicals were also common to most of these
studies that are represented on the Non-EHS Flow Map, including: Phosphoric Acid, Toluene Diisocyanate,
Butane, and Toluene. The combined volume of these chemicals by highway and railway transportation
modes are presented on

No
rth C
aro
lina S
tate
wid
e M
ultim
od
al F
reig
ht P
lan
Cam
brid
ge S
yste
ma
tics, In
c.
3-2
Figure 3.1 Extremely Hazardous Substance Flows

North
Ca
rolin
a S
tate
wid
e M
ultim
od
al F
reig
ht P
lan
Cam
brid
ge S
yste
ma
tics, In
c.
3-3
Figure 3.2 Non-Extremely Hazardous Material Flows

North Carolina Statewide Multimodal Freight Plan
Cambridge Systematics, Inc.
3-1
3.1 and 3.2 respectively. These maps do not show door-to-door shipments but stay on major transportation
corridors, and do not break out the chemicals individually.
It is evident on both maps that these EHS and Non-EHS HazMat chemicals are present on nearly every
major highway, all of the interstate highway system, the entire length of both Class I railroads, and many of
the short line railroads in significant volumes. Volumes of over a billion pounds per year or more are
represented on some parts of the transportation system. Charlotte, Winston-Salem, Raleigh, and Wilmington
are major HazMat hubs. These 17 chemicals are representative of both the significant hazard and volume of
the many thousands of chemicals that are on the North Carolina transportation system. It is important to also
recognize that massive quantities of HazMat are moved by barge and ship also, especially concentrated at
the two ports in the state. Other significant concentrations of HazMat in transportation are found at truck
parking areas, and rail yards and side rails that are present in many communities across the state.

No
rth C
aro
lina S
tate
wid
e M
ultim
od
al F
reig
ht P
lan
Cam
brid
ge S
yste
ma
tics, In
c.
3-2
Figure 3.1 Extremely Hazardous Substance Flows

North
Ca
rolin
a S
tate
wid
e M
ultim
od
al F
reig
ht P
lan
Cam
brid
ge S
yste
ma
tics, In
c.
3-3
Figure 3.2 Non-Extremely Hazardous Material Flows

North Carolina Statewide Multimodal Freight Plan
Cambridge Systematics, Inc.
3-4
3.2 Bottlenecks and Deficiencies
Three key areas of needs and deficiencies were identified:
The navigation channel into Morehead City adjacent to Radio Island at the mouth of the Newport River is
filling with sediment and deposition of sand and is a bottleneck to the transport of HazMat by ship in that
area. This is causing PCS Phosphate to only partially load ships to prevent grounding and other safety
concerns. This repeated and ongoing condition has a direct and significantly negative impact on their
profitability and competitiveness, as the fixed costs per shipment remain the same but the amount of
product moved per ship is greatly reduced. PSC Phosphate is concerned about the safety of their
shipping operations and profitability. They suggest the Corps of Engineers enhance the channel that
nature seems to favor, rather than continuing to dredge in an area of ongoing deposition.
The concurrent use of the two Class I railroad mainlines for passenger, freight, and HazMat service in
North Carolina, as elsewhere in the United States, is a deficiency. Not only do these trains have different
maximum allowable speeds over the same track, but they also have different infrastructure needs that
are not compatible with each other. It is not advisable to collocate passenger, freight, and HazMat
support infrastructure at one location.
Areas within the transportation system where there is especially high HazMat transportation risk include:
communities with heavy land-use development involving large numbers of sensitive populations and
environmental receptors or large recreation or public event facilities alongside major transportation
corridors; unsecured rail yards, side rails within major communities, at-grade railroad crossings and
freeway ramps.
Highlight - PCS Phosphate
PCS Phosphate is an open pit mine that annually produces 1.2 million tons of phosphoric acid, 0.3
million tons of purified acid, 0.1 million tons of phosphate feed and a dozen other chemicals vital to
agriculture and a number of industries throughout the country. They: import and ship large volumes of
gaseous, liquid, and dry HazMat products using the state’s rail, highway and port transportation systems;
operate a 31-mile railroad spur that connects the facility to the Norfolk Southern and CSXT railways;
export large volumes of HazMat and import many unit train quantities of anhydrous ammonia and other
chemicals; and chemically react the phosphoric acid with ammonia to produce differing grades of
fertilizer.
PCS operates a terminal on Radio Island located near the mouth of the Newport River at Morehead City,
North Carolina. They ship product from the mine and processing plant facilities via barges navigating the
Pamlico, Core, and Back sounds to fill ships at this terminal with phosphate products for export with
26 percent going off shore and a total value of $1.2 Billion dollars in 2015. This operation has been
hindered by sedimentation into the channel supporting their terminal, causing them to only partially load
ships to prevent grounding and other safety concerns. This repeated and ongoing condition has a direct
and significantly negative impact on their profitability and competitiveness, as the fixed costs per
shipment remain the same but the amount of product moved per ship is greatly reduced.
North Carolina Statewide Multimodal Freight Plan
Cambridge Systematics, Inc.
3-5
3.3 Existing and Expected Future Needs
It is important for local and state government to prevent incompatible land-uses, especially those involving
HazMat, to be able to protect the public. In some cases, there is a failure to maintain a separation between
incompatible land uses because the authorities are not engaged with the HazMat community, and there is
not an understanding of the significant hazards that HazMat can bring into a community nor that a
community can create hazard by bringing people into close proximity to HazMat facilities and corridors. The
citing of especially sensitive populations, such as schools, day cares, hospitals, and similar facilities,
adjacent to HazMat facilities and transportation corridors is almost commonplace within North Carolina and
the United States overall.
Use of side rails to store rail cars of HazMat within cities exposes the population to unnecessary risk. Local
government land-use planners need to be aware of all HazMat sources in their community, including the
locations of these side rails and rail yards and demonstrate respect for the serious public safety risk they
represent. They need to recognize that during an event that it will be necessary to isolate the area within a
3,000-foot radius9 and it may be necessary to evacuate out a number of miles. It is not a question of if a
HazMat event will occur but when and how bad will it be. It is prudent to not allow some sensitive
populations like hospitals and prisons to be built within a 3,000-foot radius of identified EHS transportation
corridors.
Three urgent current and future needs have been identified in this profile. They are:
All parties to work through the Local Emergency Planning Committee (LEPC) in their county to develop
land-use planning policies that prevent incompatible land-uses relative to HazMat storage, use or
transportation.
Communities should eliminate as many at-grade railroad crossing as possible.
Railroads should consider not using side rails within city limits to store HazMat rail cars.
9 2016 US Department of Transportation, Emergency Response Guidebook, Table 3 for a large Chlorine release