normal backwardation in short-term interest rate futures markets
TRANSCRIPT

NORMAL BACKWARDATION IN SHORT-TERM INTEREST RATE FUTURES MARKETS
TIM KREHBIEL ROGER COLLIER
INTRODUCTION
Interest rate futures contract prices provide forecasts of spot market in- terest rates. Market participants use these forecasts as inputs for borrow- ing and lending decisions, and for the pricing of interest rate derivatives.’ This study adds to the body of literature that assesses the empirical qual- ities of these forecasts. Commitment of Trader’s reports for the Chicago Mercantile Exchange’s Eurodollar and Treasury bill futures contracts are examined to determine whether the net positions of large noncommercial traders are consistent with the theory of normal backwardation.
Four explanations for the existence of systematic risk premia have been advanced. Systematic risk premia are a feature of the normal back- wardation model as developed by Keynes (1 930), Hicks (1 939), and later refined by Houthakker (1957) and Rockwell (1967). These “normal back- wardation” models introduce systematic risk premia as a means to clear
‘The array of Eurodollar contract prices arranged from the nearby through the most distant delivery month is known as the Eurodollar strip. Use of the Eurodollar strip is common in the pricing of interest rate derivatives. Such use is predicated on the belief that the Eurodollar strip is both inorc cost- and informationally efficient than a forward rate curve developed from the spot market yield cuwe. In June of 1994, the Chicago Mercantile Exchange extended the Eurodollar strip to more distant settlement dates. The Eurodollar strip now includes prices for Eurodollar futures contracts with settlement dates ten years in the future. This change has potentially increased the importance of the Eurodollar strip as a pricing tool for interest rate derivatives [Bansal and Marshall ( I 993)].
w Tim Krehbiel is an Associate Professor of Finance at Oklahoma State University.
w Roger Collier is an Assistant Professor of Finance at the University of Central Oklahoma.
The Journal of Futures Markets, Vol. 16, No. 8, 899-913 (1996) 0 1996 by John Wiley & Sons, Inc. CCC 0270-731 4/96/080899-15

900 Krehblel
the futures market. Risk premiums result from an imbalance in the ag- gregate desired positions of hedgers. Net short (long) hedging is postu- lated to induce a risk premium to attract net long (short) speculative open interest. The risk premium is a compensation paid by hedgers to specu- lators for risk bearing services. Systematic risk premia are a feature of the cost-of-carry models presented by Chance (1995) and Grauer and Litz- enberger (1979). The spot market price of a storable good is determined by the expected price at a future date, the cost of carrying the good to the future date, and a risk premium which accounts for the risk associated with the distribution of terminal spot market prices. The components of the spot market price substituted into the cost of carry relationship from the futures market produce a contract price that equals the expected spot market price minus the risk premium. Systematic risk premia are a feature of the asset pricing models used by Chen, Cornett, and Nabar (1993) and Bailey and Chan (1993) to value futures contracts. These studies examine the relationship between expected changes in futures contract prices and systematic nondiversifiable risk factors. Finally, Meulbroek (1992) argues for the existence of systematic differences in the futures contract price and the expected spot market price as the result of nightly marking to market. For long futures positions, interest foregone when rates rise more than offsets interest gains when rates fall. This potentially introduces a downward bias in interest rate futures prices.
In this study the normal backwardation hypothesis of Hicks (1939) and Keynes (1930) is tested using Eurodollar and Treasury bill futures prices and information from the Commitment of Trader Reports. The remainder of the study proceeds as follows. The first section reviews re- lated research, the second section develops the hypotheses of this study and discusses the empirical methods used, and the third discusses the sample and the data used. The fourth section reports the results, and the last section summarizes the analysis and findings.
RELATED RESEARCH Cole, Impson, and Reichenstein (1991), Cole and Reichenstein (1994), and Krehbiel and Adkins ( 1 994) test Eurodollar and Treasury bill futures prices for consistency with the unbiased expectations model. These stud- ies produce evidence consistent with the existence of systematic risk pre- mia for contracts distant from delivery and for specific time periods.
Cole, Impson, and Reichenstein (1991) find Treasury bill futures prices one and two quarters before delivery do not fail tests of rational expectations forecasts. For three quarters before delivery, results are am-

Normal Backwardation 901
biguous. For four quarters before, rational expectations and unbiasedness are rejected.
Krehbiel and Adkins (1994) use cointegration methodology to test Eurodollar and Treasury bill futures prices for the absence of systematic risk premia. Parameter restrictions on the cointegrating vector in the vec- tor autoregression of spot and futures prices are implied by the unbiased expectations hypothesis. For the Treasury bill futures market, no param- eter restrictions implied by the unbiased expectations hypothesis could be rejected. All parameter restrictions implied by the unbiased expecta- tions hypothesis are rejected for the Eurodollar futures market in the sample period, 1982.1-1992.4. Cole and Reichenstein (1994) examine subperiods in the history of Eurodollar futures trading. The unbiased expectations hypothesis can be rejected using data from the early sample period, 1982.2-1 986.2. The unbiased expectations hypothesis cannot be rejected using data from the later sample period, 1986.3-1991.2.
Kolb ( 1992) tests the empirical implications of normal backwarda- tion in the Treasury bill futures market. He finds no evidence consistent with normal backwardation and, therefore, no evidence of systematic risk premia.
These studies have utilized time series of futures and spot market prices to address the issue of normal backwardation. Chang (1 985) ex- amined wheat corn and soybean futures contracts for evidence of system- atic risk premia using both price data and information from the Com- mitment of Trader’s Report. He finds evidence consistent with the existence of systematic risk premia for these markets. The nonparametric test procedure used by Chang (1985) was proposed as a test of the market timing ability of individual forecasters by Henriksson and Merton (198 1). To apply the test of market timing ability the aggregate net position of large speculative traders is treated as a forecast of the direction of change in the futures contract price. The subsequent price change is used to determine the proportion of correct forecasts.
Cumby and Modest (1987) have illustrated that under certain con- ditions the power of the Henriksson and Merton (1981) test procedure is diminished. They show the equivalence between the nonparametric test and a regression based test utilizing the same information.
This study utilizes the nonparametric test procedure of Henriksson and Merton (1981) and addresses the findings of Cumby and Modest (1987) using robust regression analysis.
HYPOTHESIS AND EMPIRICAL METHOD Merton (1981) shows that if a forecast is to have value it must cause a rational investor to modify his prior beliefs about the probability distri-
902 Krehbiel
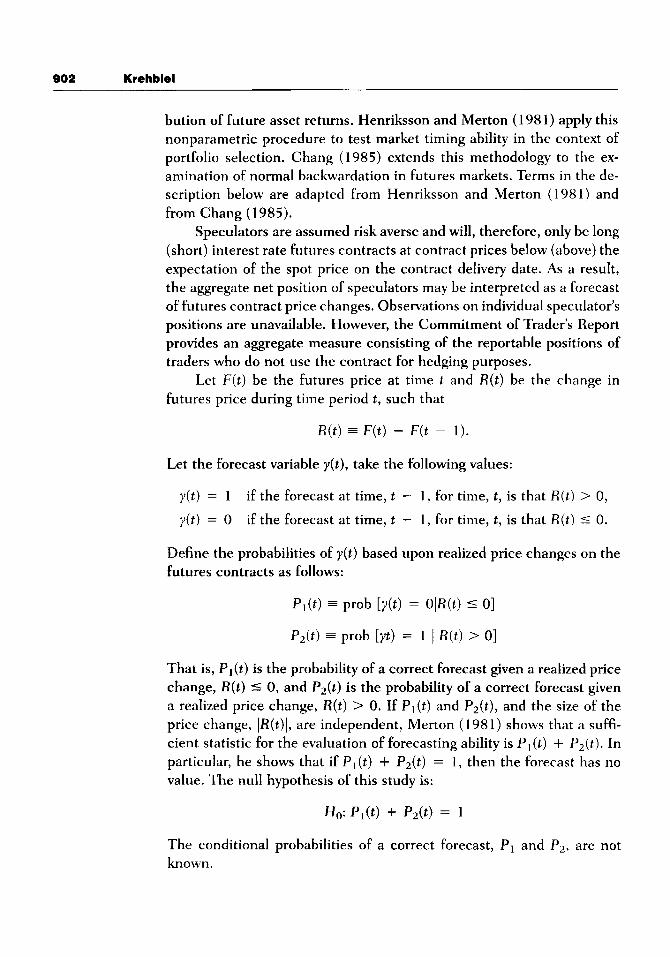
bution of future asset returns. Henriksson and Merton (1981) apply this nonparametric procedure to test market timing ability in the context of portfolio selection, Chang (1985) extends this methodology to the ex- amination of normal backwardation in futures markets. Terms in the de- scription below are adapted from Henriksson and Merton (198 1) and from Chang (1985).
Speculators are assumed risk averse and will, therefore, only be long (short) interest rate futures contracts at contract prices below (above) the expectation of the spot price on the contract delivery date. As a result, the aggregate net position of speculators may be interpreted as a forecast of futures contract price changes. Observations on individual speculator’s positions are unavailable. However, the Commitment of Trader’s Report provides an aggregate measure consisting of the reportable positions of traders who do not use the contract for hedging purposes.
Let F ( t ) be the futures price at time t and R ( t ) be the change in futures price during time period t, such that
R ( t ) F ( t ) - F( t - 1).
Let the forecast variable y ( t ) , take the following values:
y ( t ) = 1
y ( t ) = 0
if the forecast at time, t - 1 , for time, t, is that R ( t ) > 0,
if the forecast at time, t - 1 , for time, t, is that R ( t ) I 0.
Define the probabilities of y ( t ) based upon realized price changes on the futures contracts as follows:
Pl(t) = prob [ y ( t ) = OIR(t) I 01
P2(t) = prob [ y t ) = 1 I R ( t ) > 01
That is, Pl(t) is the probability of a correct forecast given a realized price change, R ( t ) 5 0, and P z ( t ) is the probability of a correct forecast given a realized price change, R ( t ) > 0. If Pl(t) and P 2 ( t ) , and the size of the price change, IR(t)l, are independent, Merton (1981) shows that a suffi- cient statistic for the evaluation of forecasting ability is Pl(t) + P 2 ( t ) . In particular, he shows that if P,(t) + P 2 ( t ) = 1 , then the forecast has no value. The null hypothesis of this study is:
Ho: PI@) + P 2 ( t ) = 1
The conditional probabilities of a correct forecast, PI and P2, are not known.

Normal Backwardation 903
Henriksson and Merton (1981) show that, under the null, the test statistic is defined by the hypergeometric distribution:
where
nl = number of correct forecasts, given R ( t ) 5 0,
n = number of times a forecast of R ( t ) 5 0 is made,
NI 3 number of sample observations where R(t) 5 0,
N 2 = number of sample observations where R(t) > 0, and
N = N1 + N 2 = total number of sample observations.
Because the distribution is independent of PI and P z , the conditional probabilities need not be estimated. Provided the forecasts are known or observable, all variables are directly observable. Henriksson and Merton ( 1 98 1) show that the distribution of nl is governed by the following upper and lower bounds:
Equations ( 1 ) and (2) are used to establish confidence intervals for testing the null. Given the nature of a zero-sum game and that speculators be- have rationally, a one-tailed test is more appropriate. For such a one-tailed test with a probability confidence level of c, one could reject the null hypothesis if nl 2 x"(c) where x*(c) is defined as the solution to
For large samples, the hypergeometric distribution can be approximated accurately by the normal distribution.* The parameters used for this nor- mal approximation are the expected value and variance for the hypergeo- metric distribution given in (1):
nN1 E(n,) = - N (4)
2See Lehmann (1975, theorem 19) for a general proof.

904 Krehbiel
Cumby and Modest (1987) note that given the assumptions made by Henriksson and Merton ( 1 98 1 ): (i) the magnitude of the subsequent price change is independent of the probability of a correct forecast; (ii) the conditional probabilities of a correct forecast remain constant over time; the uniformly most powerful unbiased test for independence is Fisher's exact test. Cumby and Modest (1987) point out that the independence assumption is likely to be violated when forecasters rely on technical analysis to generate their forecasts, and that the Henriksson and Merton (198 1 ) test is misspecified when the conditional probabilities are not con- stant over time.
When the independence assumption is relaxed, the natural extension of the Henriksson and Merton (1981) procedure is a test of whether the mean of the unconditional price change distribution differs from the mean of the price change distribution conditioned on the forecast. This test can be implemented as a test of the difference from zero of the slope coefficient in the relationship:
See Cumby and Modest (1987) for details.
DATA
The Commodity Futures Trading Commission provides a breakdown of month-end open interest for markets in which five or more traders hold positions equal to or above the reporting levels established by the CFTC. Clearing members, futures commission merchants, and foreign brokers are required to make daily reports to the CFTC showing each trader's positions on their books that in any future month of a commodity, exceed the reporting level. All of a trader's reported futures positions in a com- modity are classified as commercial if the trader uses futures contracts traded in the particular commodity for hedging as defined in the Com- mission's regulations. Other reportable positions are classified as non- commercial. Reportable noncommercial positions provide information on the positions of large speculators.
Commitment of Trader Reports dated 1/15/86 through 3/22/94 are used in this study On October 6, 1992 the CFTC began publishing the Commitment of Trader's Report weekly. Prior to this time, the reports were published bimonthly. The sample contains 162 observations from

Normal Backwardation 905
the bimonthly reporting period and 77 observations from the weekly re- porting period. From each report the sign of the net open interest (long- short) of noncommercial traders is calculated. Each observation of net open interest is treated as a forecast of the direction of price change in the futures contract, y ( t ) . Forecasts are classified as successful if net open interest is positive and the contract price change in the two-week period between reports is positive or if net open interest is negative and the contract price change in the inter-report period is negative.
Commitment of Trader Reports do not indicate the distribution of reported positions across futures contracts, hence it is not possible to identify exactly which futures contracts to utilize in forming price changes. For this study, six price change series are considered. The Treas- ury bill and Eurodollar futures contracts have March (MAR), June (JUN), September (SEP), and December (DEC) delivery cycles. Daily settlement prices are from the Futures Industry Institute Data Center.
A price change series is constructed for each delivery month. Price changes are measured from one report date to the next. The price changes for all outstanding March contracts are summed to form one observation in the series labeled EMAR (Eurodollar) and TMAR (Treasury bill). June (EJUN, TJUN), September (ESEP, TSEP), and December (EDEC, TDEC) series are constructed similarly. For the March, June, September, and December series, price changes for futures contracts in their delivery month are not included in the summation. For example, to construct the EMAR observation for the reporting period, 1/15/90-1/3 1/90, price changes for three March contracts are summed: MAR90, MAR91, MAR92. For the reporting period, 2/28/90-3/15/90, price changes for two March contracts are summed: MAR91, MAR92. Prices from the March Eurodollar contracts, MAR86 through MAR99, are used to construct the series, EMAR.
Series EALL and TALL are constructed by summing price changes for all outstanding contracts for each reporting period. Series ENB and TNB differ from the other series in that they consist of price changes for only the nearby contract. Note that the initial trading date for Treasury bill futures contracts and the weekly frequency of the Commitment of Traders Report in the latter part of the sample interact to reduce the number of observations for the Treasury bill series below 239. For in- stance, the March 94 contract began trading on 04/13/93. The last day of trading for this contract was 03/02/94. The March 95 contract began trading on 03/14/94 and is not used in this study.

906 Krehbiel
TABLE I
Commitment of Trader Reports January 1986-February 1994 Eurodollar and Treasury Bill Net Positions as a Percent of Open Interest
Ezrrodol lar Treasury Bill
Noncornm Comm Other Noncoinm Comm Other 1/15/86 12/31/87 N = 4 8 Average 01 1/15/86 12/31/87 N=48 Average 01
( + I - ) , ( - / + ) Average % Positive
( + I - ) . ( - / + ) Average 70 Positive
( + I - ) , ( - / + ) Average % Positive
( + I - ) , ( - I + ) Average Yo Positive
10 - 0 0066 0 27 111 5/88 7 - 0 0065 0 38 1/15/90 6 0 0260 0 83 10/6/92 9 -00198 0 35
10 0 0141 0 58 12/29/89 5 0 0371 0 73 9/30/92 10 - 0.01 11 0 39 3/22/94 1 0 1366 1 00
6
0.42 N = 48 5 - 0.0306 0.19 N = 66 11 -0.0150 0.35 N = 77 0 - 0.1169 0
- 0.0075 241,679 10
0.0497 0.79 1/15/88
0 1206 0.79 1/15/90
0.1467 0.98 10/6192
0.0921 0.82
564,278 7
930,084 2
1,855,817 7
4 -0.2273 0.10 12/29/89 5 -0.1835 0 19 9/30/92 0 -0.3071 0.00 3/22/94 4 - 0 2353 0.05
4 35,300 0.1776 0.90
10 24,600 0.0629 0.60 N = 66 2 44,083 0.1605 0.98 N = 77 0 34,420 0.1433 1 .oo
N = 48
RESULTS
Preliminary analysis of the data indicates an interesting difference in the character of the Eurodollar and Treasury bill futures markets. Speculative (noncommercial) net open interest in the Treasury bill market is negative (on the short side of the market) in only 35 of the 239 periods while noncommercial net open interest is negative in 127 of the 239 periods in the Eurodollar market.
Table I provides a breakdown of traders’ positions in the Eurodollar and Treasury bill futures markets over the sample period. Statistics are presented for subperiods of approximately equal calendar length. The column labeled, Average 01, (open interest) illustrates the dramatic growth in the Eurodollar market relative to the Treasury bill market. Dur- ing the sample period, average open interest in the Eurodollar contract has increased by 1.6 million contracts, while open interest in the Treasury bill futures contract did not experience substantial change. The number of times that net open interest changed sign, i.e., long to short or short to long is tabulated by trader groups; noncommercial, commercial, other, in the rows labeled, (+/ - ) ( - /+). The average net (long-short) open interest as a percentage of total open interest and the percentage of the report periods for which each trader group had net positive open interest is reported in the rows labeled, % positive.

Normal Backwardation 907
Noncommercial positions in Table I illustrate that speculative net open interest tends to be on the short side of the Eurodollar market in all time periods except 1/15/90 through 9/30/92, and on the long side of the Treasury bill market. In the first subperiod noncommercial traders had positive net open interest on 27% of the 48 report dates in the Eu- rodollar market, noncommercial traders had positive net open interest on 79% of the report dates in the Treasury bill market.
Average speculative net open interest is a smaller percentage of total open interest in the Eurodollar market than in the Treasury bill market. In the first reporting period, the average net open interest of noncom- mercial traders is negative and less than 1 % of total open interest in the Eurodollar market, while it is positive and slightly less than 5% in the Treasury bill market. However, by the end of the sample period, given the growth of the Eurodollar market, the net position of noncommercial trad- ers is far greater in the Eurodollar market in terms of number of contracts, -0.0198 * 1,855,817 = 36,745 contracts (short) relative to noncom- mercial traders in the Treasury bill market, 0.0921 ' 34,420 = 3170 contracts (long).
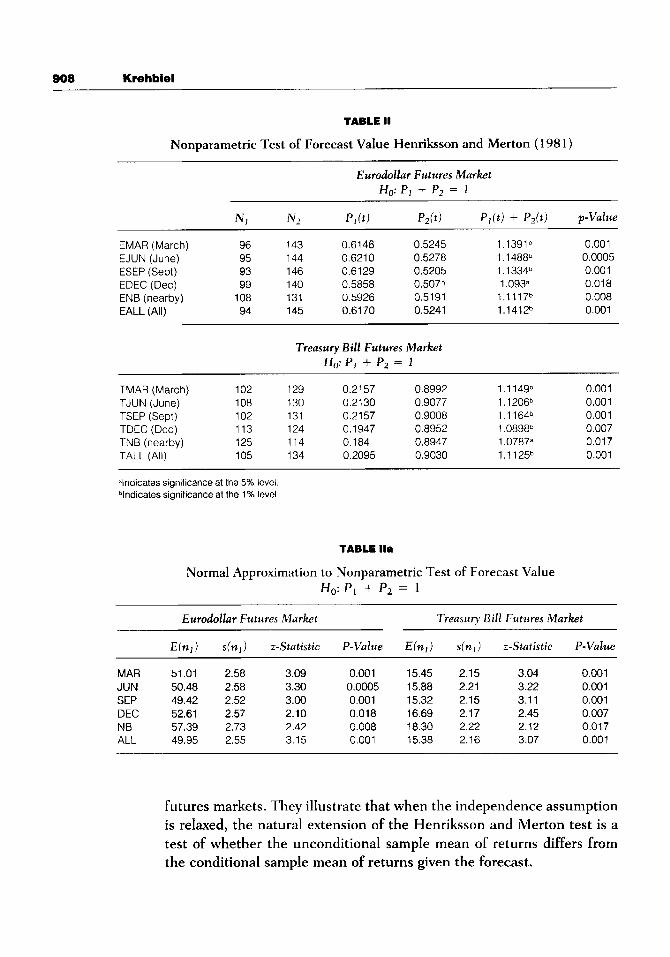
Table I1 contains the results of tests of the null hypothesis in the Eurodollar and Treasury bill futures market assuming a hypergeometric distribution of the test statistic. Table IIa presents the test results for the normal approximation to the hypergeometric distribution. In Table I1 col- umns N1 and N2 list the number of up and down markets, respectively, while columns Pl(t) and P 2 ( t ) contain the relative frequency of correct forecasts of up and down markets as revealed by net short or net long speculative positions. The column headed p-value contains the signifi- cance level at which the null hypothesis of no forecast value can be re- jected. For both Eurodollar and Treasury bill markets and for all price change series considered, the null hypothesis can be rejected at a signif- icance level of at least 5%. The large disparity between the conditional probabilities of a correct forecast in down and up markets in the second panel of Table I1 is a direct result of the preponderance of positive spec- ulative net open interest reported for the Treasury bill market.
The results in Tables IIa corroborate the findings based on a hyper- geometric distribution, the null hypothesis that the speculators' forecasts embodied in their market positions have no value, is rejected for both Eurodollar and Treasury bill futures markets.
Cumby and Modest (1987) have argued that the independence as- sumption of the Henriksson and Merton (1981) test procedure may be violated when forecasters use technical analysis to form their forecasts. This occurrence is more than likely the case in this application to the
908 Krehbiel
TABLE II
Nonparametric Test of Forecast Value Henriksson and Merton (1981)
Eurodollar Futures Market Ho: PI + Pz = I
NI N2 P l ( t ) P2 (t ) Pl(t) + P J t ) p-Value
EMAR (March) 96 143 0.6146 0.5245 11391O 0.001
ESEP (Sept) 93 146 0.6129 0.5205 1 1334b 0.001
EALL (All) 94 145 0.61 70 0.5241 1.1412b 0.001
EJUN (June) 95 144 0 6210 0.5278 1.1488b 0.0005
EDEC (Dec) 99 140 0.5858 0.5071 1.093" 0.018 ENB (nearby) 108 131 0.5926 0.5191 1 .I 1 17b 0.008
Treasury Bill Futures Market Ho: PI + Pz = I
TMAR (March) 102 129 0.2157 0.8992 1.1 14gb 0.001 TJUN (June) 108 130 0.2130 0.9077 1.1 206b 0,001 TSEP (Sept) 102 131 0.2157 0.9008 1.1 164b 0.001
TALL (All) 105 134 0.2095 0.9030 1.1125b 0.001
TDEC (Dec) 113 124 0.1947 0.8952 1 .0898O 0.007 TNB (nearby) 125 114 0.184 0.8947 1.0787' 0.017
4ndicates significance at the 5% level. blndicates significance at the 1% level.
TABLE IIa
Normal Approximation to Nonparamc .:ic Test of Forecast Value Ho: P1 + P z = 1
Eurodollar Futures Market Treasury Sill Futures Market
E(nl) s (nl ) z-Statistic P-Value
MAR 51.01 2.58 3.09 0.001 JUN 50.48 2.58 3.30 0.0005 SEP 49.42 2.52 3.00 0.001 DEC 52.61 2.57 2.10 0.018 NB 57.39 2.73 2.42 0.008 ALL 49.95 2.55 3.15 0.001
E(n,) s(n1)
15.45 2.15 15.88 2.21 15.32 2.15 16.69 2.17 18.30 2.22 15.38 2.16
z-Statistic P-Value
3.04 0.001 3.22 0.001 3.1 1 0.001 2.45 0.007 2.12 0.017 3.07 0.001
futures markets. They illustrate that when the independence assumption is relaxed, the natural extension of the Henriksson and Merton test is a test of whether the unconditional sample mean of returns differs from the conditional sample mean of returns given the forecast.

Normal Backwardation 909
TABLE 111
Least Absolute Deviation Regression: R , = a + p " y ( t ) Estimated Value p and p-Value
~
Price Change Series Eirrodollar Treasury Bill
MAR
JUN
SEP
DEC
NB
ALL
4.071 0
4.3435 (0.003) 2.4607
(0.007) 2.4583
(0.005) 0.5052
14.020 (0.014)
(0.01 1)
(0.110)
0.2608 (0.187) 0.5028 0.024 0.3169 (0.063) 0.5258 (0.010) 0.1399 (0.244) 01.5953 (0.023)
Originally, the binary forecast indicator, y ( t ) , was used in regression tests suggested by Cumby and Modest ( 1987). Ordinary least squares estimation of relationship (6) finds no evidence of a relationship between the subsequent price change and the forecast indicator. However, the Bera-Jarque test applied to regression residuals indicates the residuals are decidedly non-normal.
The regression tests are repeated replacing the binary forecast indi- cator with the ratio of noncommercial traders net open interest to total open interest and using least absolute deviation estimation. Least abso- lute deviation estimation is chosen because it is robust in the presence of non-normal disturbances. Least absolute deviation estimation from the Shazam software is applied to the estimation of (6). The resulting param- eter estimates and their associated p-values are included in Table 111.
All the estimated coefficients are positive. Except for the nearby price change series, the estimated coefficients from the Eurodollar market are consistent with a significant difference in the mean of the unconditional and conditional price change distributions. All estimated coefficients ex- cept for the nearby price series are significantly different from zero at the 5 % confidence level.
In the Treasury bill futures market, the evidence is not nearly so consistent. The March, September, and nearby price series produce pa- rameter estimates not significantly different from zero, indicating no sta- tistically significant difference in the mean of the unconditional and con- ditional price change distributions.

91 0 Krehbiel
TABLE IV
Commitment of Traders Report Periods January I986 through March 1994 in Which Net-Short (Long) Commercial Open Interest is Associated With Net-
Long (Short) Noncommercial Open Interest
Eurodollar
Net-Short Commercial Net-Long Commercial Open Interest Open Interest
Frequency Positive price changes Average change in margin Speculative/hedging H,: p 5 1/2
64 39 $137.50 1.64 1.7F
119 60 $19.38 8.36 0.09
Treasury Bill
Net-Short Commercial Net-Long Corrtntercial Open Interest Open Interest
Frequency Positive price changes Average change in margin Speculative/hedging H,: p s 112
199 112 $682.00 0.49 1.77*
13 4 - $63.45 1.11 - 1.50
'Indicates significance at the 5% level.
The previous analysis addresses the profitability of speculative trad- ing. An additional implication of the theory of normal backwardation is that net hedging and net speculative open interest are of opposite signs, that is, speculators are net long when hedgers are net short and vice versa. In addition, the contract price must, on average, increase when specu- lative open interest is net long and decrease when speculative open in- terest is net short. Information from the Commitment of Traders reports and the nearby price change series is presented in Table JV to address these additional implications of the theory,
Results shown in Table IV for the Eurodollar futures market are consistent with normal backwardation theory, in periods in which net- short commercial (hedging) open interest occurs with net-long noncom- mercial open interest. The nearby futures contract price increases in 39 of these 64 periods. A z-test rejects the hypothesis that this proportion is less than or equal to one-half at the 5% significance level. The average increase in the nearby contract price produces a margin account gain of $1 37.50 per long contract. The size of the net-long speculative open in-

Normal Backwardation 91 I
terest is approximately 1.42 times the size of the net-short hedging open interest in these periods.
In periods in which net-long commercial open interest occurs with net-short noncommercial open interest, results are not consistent with the theory of normal backwardation. In exactly one-half of these periods, the nearby Eurodollar contract price increases. On average, short spec- ulative positions suffer a margin account loss of $19.33 per short con- tract. Interestingly, the size of net-short speculative positions is 8.36 times the size of net-long hedging positions in these periods.
Treasury bill results reported in the second panel of Table IV are fully consistent with the theory of normal backwardation, Net-short com- mercial open interest occurs with net-long noncommercial open interest in 199 of the 239 periods of the sample. A positive change in the nearby futures contract occurs in 112 of these 199 periods. A z-test rejects the hypothesis that this proportion is less than or equal to one-half at the 5% significance level. The average price change in the nearby futures contract produces a margin account gain of $68 1.75 per long contract. The size of net speculative open interest in these periods is approximately one- half the size of net hedging open interest. Although occurring infre- quently, periods in which net-long Commercial open interest occurs with net-short noncommercial open interest are associated with negative av- erage price changes as required by the theory of normal backwardation.
SUMMARY The theory of normal backwardation proposes that systematic risk premia will equilibrate the futures market when there is an imbalance between net hedging and net speculative positions. This study uses commercial and noncommercial positions from Commitment of Traders reports and price change data to examine the implications of the theory of normal backwardation. Henriksson and Merton’s (198 1) nonparametric test of forecast value and the extension proposed by Cumby and Modest ( 1987) are applied to the net open interest of noncommercial traders. The ad- ditional implication of normal backwardation that hedgers and specula- tors have net positions of opposite sign when speculative positions earn positive returns is also tested with the data.
In the Eurodollar market:
0 Henriksson and Merton’s nonparametric test rejects the null hypoth- esis that noncommercial net open interest has no forecast power. Least absolute deviation regression based tests reject the null hypoth- esis that unconditional price change distributions have the same mean
91 2 Krehbiel
as price change distributions conditioned on the forecast provided by the sign and magnitude of net noncommercial open interest. For reporting periods when commercials are net short and noncom- mercials are net-long, noncommercial’s positions earn an average of $137.50 per contract.
For reporting periods when commercials are net-long and noncom- mercial are net-short, noncommercial’s positions lose an average of $19.38 per contract.
In the Treasury bill market:
0 Henriksson and Merton’s nonparametric test rejects the null hypoth- esis that noncommercial net open interest has no forecast power.
Least absolute deviation regression based tests do not reject the null hypothesis that unconditional and conditional price change distribu- tions have the same mean for three of the six price change series used in the study.
0 For reporting periods when commercials are net short and noncom- mercials are net-long, noncommercial’s positions earn an average of $682.00 per contract.
0 For reporting periods when commercials are net-long and noncom- mercials are net-short, noncommercial’s positions earn an average of $63.45 per contract.
These results are predominantly consistent with the implications of normal backwardation. Net noncommercial open interest is a valuable forecast of the direction of change in contract price. Additionally, in pe- riods when net commercial and net noncommercial open interest are of opposite sign, average contract price change produces a gain for noncom- mercial traders in three of four cases.
Eurodollar futures contracts are commonly used as inputs in pricing interest rate swap and other derivative contracts. The size of the system- atic risk premiums embedded in Eurodollar and Treasury bill futures con- tracts is an empirical issue that impacts the pricing of these derivative contracts.
BIBLIOGRAPHY
Bailey, W., and Chan, K.C. (1993): “Macroeconomic Influences and the Varia-
Bansal, V., Ellis, M. , and MarshalI, J. (1993): “The Pricing of Short-Dated and bility of the Commodity Futures Basis,’’Joumd of Finance, 48:555-574.
Forward Interest Rate Swaps,” Financial Analysts Journal, 49:82-87.

Normal Backwardation 91 3
Chance, D. (1995): An Introduction to Derivatives (3rd ed.). Dryden Press, Chaps. 8 and 9.
Chang, E. (1985): “Returns to Speculators and the Theory of Normal Backwar- dation,” The Journal of Finance, 40: 193-208.
Chen, A., Cornett, M., and Nabar, P. (1993): “An Empirical Examination of Interest-Rate Futures Prices” The Journal of Futures Markets, 13:78 1-797.
Cole, C., Impson, M., and Reichenstein, W. (1991): “DO Treasury Bill Futures Rates Satisfy Rational Expectation Properties?” %Journal of Futures Mar- kets, 11:591-601.
Cole, C., and Reichenstein, W. (1 994): “Forecasting Interest Rates with Euro- dollar Futures Rates’’ The Journal of Futures Markets, 14:37-50.
Cumby, R.E., and Modest, D.M. ( 1 987): “Testing for Market Timing Ability: A Framework for Forecast Evaluation,” Journal of Financial Economics,
Grauer, F., and Litzenberger, R. (1979): “The Pricing of Commodity Futures Contracts, Nominal Bonds and Other Risky Assets Under Commodity Price Uncertainty,” The Journal of Finance, 34:69-83.
Henriksson, R., and Merton, R. (1981): “On Market Timing and Investment Performance. 11. Statistical Procedures for Evaluating Forecasting Skills,” Journal of Business, 54:5 13-533.
Hicks, J.R. (1939): Value and Capital (2d ed.). Oxford: Clarendon Press, Chap. 10.
Houthakker, H.S. (1957): “Can Speculators Forecast Prices?” Review of Eco- nomics and Statistics, 39: 143-1 5 1.
Keynes, J.M. (1930): A Treatise on Money. London: Macmillan. Kolb, R., (1992): “Is Normal Backwardation Normal?” The Journal of Futures
Markets, 12:75-91. Krehbiel, R., and Adkins, L. ( I 994): “lnterest Rate Futures: Evidence on Forecast
Power, Expected Premiums, and the Unbiased Expectations Hypothesis,” 7’heJournal of Futures Markets, 14:53 1-543.
Lehmann, E. ( 1975): Nonparametrics: Statistical Methods Based on R a n k . San Francisco: Holden-Day.
Merton, R. ( 1 98 1): “On Market Timing and Investment Performance. I. An Equi- librium Theory of Value for Market Forecasts,”Journal of Business, 54:363- 406.
Meulbroek, L. (1992): “A Comparison of Forward and Futures Prices of an In- terest Rate-Sensitive Financial Asset,” TheJournal of Finance, 41 :38 1-396.
Muth, J.F. (1961): “Rational Expectations and the Theory of Price Movements,” Econometrica, July:3 15-335.
Rockwell, C. ( 1 967): “Normal Backwardation, Forecasting and the Returns to Commodity Futures Traders,” Food Research Institute Studies, 7: 107-1 30.
Ross, S. (1976): “The Arbitrage Theory of Capital Asset Pricing,”Journal ofEco- nomic Theory, 13:343-362.
19:169-189.