noninvasive monitoring of peripheral perfusion in ... alexander augusto pinto... · noninvasive...
TRANSCRIPT

Noninvasive Monitoring O f Peripheral Per fusion In Crit ically I l l Patients
AlexANdre lIMA


Noninvasive Monitoring O f Peripheral Per fusion In Crit ically I l l Patients
Beoordeling van de perifere circulatie bij ernstig ziekte patienten
Thesis
to obtain the degree of Doctor from the Erasmus University Rotterdam
by command of the rector magnificus
Prof.dr. H.G. Schmidt
and in accordance with the decision of the Doctorate BoardThe public defense shall be held on
Thursday 14th March 2013 at 15:30 hrs
by
Alexandre Augusto Pinto limaborn in São Paulo, Brazil

PrOMOTIeCOMMISSIe
Promotor: Prof.dr. J. Bakker
Overige leden: Dr. A.H. van den Meiracker Prof.dr. A.B.J. Groeneveld Prof.dr. D. De Backer
Copromotor: Dr. J. van Bommel

… to the memory of my father


TAble Of CONTeNTS
Introduction 9Outline of thesis
PArT A Available noninvasive methods to monitor peripheral perfusion
and oxygenation
23
Chapter 1 Non-invasive monitoring of peripheral perfusion 25
Chapter 2 Monitoring peripheral perfusion in critically ill patients at the bedside 47
PArT b Methodological aspects 63
Chapter 3 Use of a peripheral perfusion index derived from the pulse oximetry
signal as a non-invasive indicator of perfusion
65
Chapter 4 Assessment of tissue oxygen saturation during a vascular occlusion
test using near-infrared spectroscopy: the role of probe spacing and
measurement site studied in healthy volunteers
77
Chapter 5 Peripheral vasoconstriction influences thenar oxygen saturation
measured by nearinfrared spectroscopy
91
5a. letter to the editor: Near infrared spectroscopy 93
PArT C Clnical application 107
Chapter 6 The prognostic value of the subjective assessment of peripheral
perfusion in critically ill patients
109
Chapter 7 Low tissue oxygen saturation at the end of early goal- directed therapy
is associated with worse outcome in critically ill patients
123
Chapter 8 The relation of near-infrared spectroscopy with changes in peripheral
circulation in critically ill patients
137
8a. Letter to the editor: Noninvasive does not mean simple or accurate! 139
PArT d Improving peripheral circulation 157
Chapter 9 Nitroglycerin improves peripheral perfusion and tissue oxygenation in
patients with circulatory shock
159
PArT e General disucssion and main findings 175
Summary and conclusions 183
Samenvatting en conclusie 185
Acknowledgements 187
list of publications 193
Curriculum vitae 201


IntroductionIntroduc tion: a historical perspec tive


Introduction: a historical perspective 11
Shock
The evolution of medical knowledge over history happened more recently than ad-vances in the art, industry and other sciences. The industrial revolution through the 18th and 19th centuries was bringing innovations and transforming life in America and Europe whereas it was widely accepted that diseases were the result of an imbalance in humours, and one of the conventional treatments to bring back the good healthy was draining blood through a phlebotomy (bloodletting) (1). Bloodletting was a com-mon ‘cure for everything’ from ancient times until the nineteenth century. The practice gained wide acceptance in America in the eighteenth century with Dr. Benjamin Rush, who treated George Washington for acute laryngitis by draining one liter (nine pounds) of blood in less than 24 hours (2). George Washington died soon afterward. In that time, there was no knowledge of the association between loss of blood and circulatory shock. In fact, shock was still an abstract concept, usually described as ‘sudden vital depres-sion’, ‘great nervous depression’, or ‘final sinking of vitality’. The history of hemodynamic monitoring overlaps with the history of shock and much of the history of shock relates to the history of traumatic shock. The term shock only came into clinical use with Edwin A. Morri, who began to popularize the term using it in his 1867 Civil War text, ‘A Practical Treatise on Shock After Operations and Injuries’ (3). Since then, the word shock started to be linked with the concept of cardiovascular collapse. In the same year, a British Surgeon named Jordan Furneaux wrote what it is known to be one of the first elaborate descriptions of abnormalities in peripheral perfusion during shock conditions (4). In his description, he emphasized the cold, clammy and mottle skin associated with high heart rate (figure 1). The belief held by notable physicians of that time was that those altera-tions in peripheral perfusion during shock were the result of a disorder of the nervous system, known as ‘nervous collapse’. Despite these results, the final studies about neural regulation of cardiovascular function in shock did not occur until 1950s.
The era of modern hemodynamic monitoring begins, in many ways, with two impor-tant technological advancements: the ability to measure blood pressure noninvasively and cardiac output. After the introduction of the mercury sphygmomanometer in 1896 by Scipione Riva-Rocci, hypotension started to be used to define shock (5). Riva-Rocci introduced the now familiar instrument that collapses vessels by means of an inflatable cuff which became generally adopted (figure 2). Later on, the work of German doc-tor Werner Frossman, with studies done of right heart catheterization, earned him the Nobel Prize in Medicine and Physiology in 1956 (6) (figure 3). The primary purpose was to develop a technique for direct delivery of drugs to the heart. His success culminated later on with the development of the thermodilution cardiac output measurements with flow-directed pulmonary artery catheter by Swan and Ganz (7). The ability to measure blood pressure and cardiac output contributed to a great extent to the understanding of

12 Introduction
figure 1. One of the first descriptions of abnormaities in peripheral perfusion during shock conditions done by Dr. Jordan Furneaux. He emphasized the cold, clammy and mottle skin associated with high heart rate (underlined)

Introduction: a historical perspective 13
figure 2. The ability to measure blood pressure with the mercury sphygmomanometer was first developed by Riva-Rocci S.
figure 3. Werner Forssmann (1904–1979), Berlin, introduced a ureteral catheter into his left basilic vein (1929). Thorax X-ray and his paper. His success culminated later on with the development of the thermodilution cardiac output measurements

14 Introduction
pathophysiology of shock. Thus, the definition of shock and its alterations over decades correlated with advancements in technology used to assess the condition. In the 1940s, shock definition was based only on blood volume alterations (8). In 1950s, shock defini-tion was expanded to the concept that shock condition could become irreversible (9). In 1960s, low cardiac output started to be used to define shock, and more recently with current knowledge, shock definition is extended to the cellular level (Table 1)(10;11).
Systemic versus Local Regulation
One important step in the understanding of the dynamics of shock was the recogni-tion of the participation of peripheral circulation. In this context, one of the earliest references about dynamic component of peripheral vascular bed is the work of Danish scientist August Krogh in the 1920s. He addressed fundamental issues underlying the behavior of the microvasculature during physiological stimulus. In his line of work, he demonstrated adaptive microvascular adjustments in the muscle during exercise (12). His investigations suggested a selective increase in the delivery of oxygen to the tissue by mechanisms of recruitment or derecruitment of capillaries with an active blood flow. For this, he was awarded the Nobel Prize in 1920 and became an internationally well known biomedical scientist during the first decade of the 20th century.
Table 1. Definitions of shock over last decades. From blood volume alterations to celular injury.
‘‘shock is a peripheral circulatory failure resulting from a discrepancy in the size of the vascular bed and the volume of the intravascular fluid.’’ Alfred Blalock, 1940s (8)
‘‘shock is a syndrome that results from a depression of many functions, but in which reduction of the effective circulating blood volume is of basic importance, and in which impairment of the circulation steadily progresses until it eventu-ates in a state of irreversible circulatory failure.’’ Carl Wiggers, 1950s (9)
‘‘a clinical condition characterized by signs and symptoms, which arise when the cardiac output is insufficient to fill the arterial tree with blood, under sufficient pressure to provide organs and tissues with adequate blood flow.’’Simeone, 1960s (10)
‘‘state in which profound and widespread reduction of effective tissue perfusion leads first to reversible, and then if prolonged, to irreversible cellular injury.’’ Kumar and Parrillo, 2001 (11)

Introduction: a historical perspective 15
August Krogh studies not only provided one of the fundamental principles of blood-tissue perfusion relationship, but also attracted a new generation of clinical investigators who ameliorate human studies in the circulatory function. From the 1930s and 1940s, physiology was beginning its growth as a science and investigations of the phenomena of shock and variations of local blood flow in the peripheral circulation became the focus of scientists’ attention. During this period, many investigators have shown that the terminal network of microscopic-sized vessels represents an organic unit essential in the maintenance of tissue perfusion. But it was in 1950 that the American physiologist Carl John Wiggers, in his experimental studies of hemorrhagic shock, introduced the term ‘peripheral circulation failure’ by demonstrating the association between acute reduc-tion of circulating blood volume and impairment of perfusion at the tissue level (13). His studies were followed by a broad spectrum of basic physiologic questions that was posed with respect to the participation of the peripheral circulation under circulatory shock conditions.
Although in the early 1900s the scientific community had already realized the exis-tence of other origins of shock than trauma, it was only in the 1920s and 1940s that it became recognized that intravenous administration of endotoxins (e.g., typhoid toxin) could produce hypotension. Some doctors even suggested a therapeutic use for endotoxin derived from P. aeruginosa to treat malignant hypertension, fortunately a treatment further rejected by the medical establishment (14). The connection between hypotension and peripheral vasodilatation in the so-called vasodilatory shock was first published in a review by Gilbert in 1960 (15). It was clear from his review that local vascular changes and general cardiovascular alterations were both part for endotoxin challenge. He suggested that changes in systemic vascular resistance could not provide information about local vascular resistance changes and describe this phenomenon as “dilation in one (vascular) bed might be accompanied by constriction elsewhere”, and he was one of the first to provide evidence of heterogeneous distribution of blood flow in sepsis. This phenomenon was later confirmed with the use of intravital microscopy in 1960s with experimental shock models, when it became apparent the different be-havior between peripheral circulation within organs and systemic circulation during acute shock situations (16). This overlap “systemic versus local regulation” led a shift in thinking concerning separate sets of regulatory mechanisms for central and peripheral circulation during shock conditions. In this regard, the work of the physiologist Arthur Clifton Guyton was perhaps one of the most important scientific contributions in this field. Guyton is most famous for his experiments in the 1950s and 1960s, which studied the physiology of cardiac output and its relationship with the peripheral circulation. He elaborated the Frank-Starling law of the heart by showing that it is not only the function of the heart which controls cardiac output but instead that cardiac output is controlled by the various factors in the peripheral circulatory system which regulate the return of

16 Introduction
blood to the heart. It was Guyton who formalised that the venous return is approximate-ly proportional to the mean circulatory filling pressure minus the right atrial pressure, which pressure difference is called the “pressure gradient for venous return” (17). The clinical relevance of such studies became apparent in 1970s and 1980s when investiga-tors recognized that resuscitation is based on knowledge of fundamental physiological variables not only of central but also of peripheral circulation.
Monitoring of Peripheral Perfusion
In 1958, Dr. Weil, in an attempt to perform real time measurements of vital signs and alarms in a four-bed unit called “shock Ward”, introduced continuous monitoring of elec-trocardiogram, blood pressure, pulse rate, respiratory rate, and other vital signs comple-mented by arterial and central venous pressures, urine output and by peripheral tem-peratures. With initial emphasis in myocardial infarction complicated with cardiogenic shock, it was the first prototype of an intensive care unit with continuous monitoring, that later became a 42-bed intensive care unit at the University of Southern California. His service pioneered routines of bedside monitoring and measuring devices, includ-ing the earliest use of arterial and central venous catheters (18). In 1960s, respiratory and hemodynamic measurements were complemented by laboratory measurements, including lactate and blood gases analysis. Critical care medicine has emerged as an independent multidisciplinary speciality with first organization created in 1967 by Drs. Safa, Shoemaker and Weil, which evolved into the ‘Society of Critical Care Medicine’. Over the years that followed, increasingly more sophisticated hemodynamic and respiratory methods of monitoring were introduced. Weil was one of the first investigators to study the relationship between peripheral circulation measured with skin temperature and prognosis of low flow shock. In 1969, in a cohort of 100 patients (44 nonsurvivors) admit-ted with diagnosis of cardiogenic or hypovolemic shock, he showed that the likelihood of dead was high when skin temperature measured on great toe persisted low (<27°C) during the first three hours of admission (19). He also found a high correlation between skin temperature and cardiac output. Weil suggested that skin temperature measure-ments in low flow shock could be an alternative approach to overcome the technical difficulty of measuring cardiac output, which by that time was still problematic at the bedside.
New concepts have evolved which defined organ or systemic failures. Clinical reports of patients who developed multiple organ failure after trauma, shock or sepsis started to emerge describing the factors contributing to organ dysfunction. In the 1970s, systemic organ perfusion was assessed indirectly at the bedside by measuring the degree of derangement in global variables, such as cardiac output, lactic acidosis and base deficit, and resuscitation of the critically ill was based on normalization of these global hemody-namic values. In the 1980s, some studies proposed to increase cardiac output or oxygen

Introduction: a historical perspective 17
delivery to so-called ‘supranormal’ values, an alternative approach aiming at adequate organ utilization (20;21). In 1990s, it became clear that even though global hemodynamic variables may be normalized, there may be regions with inadequate oxygenation at the tissue level, suggesting the importance of assessment of regional oxygenation at the organ level. Of all the various tissue-specific vascular beds that could be monitored, the gut mucosa, more specifically, the gastric mucosa was more appropriated due to its easy assessment. Gastric tonometry was then effectively introduced in the clinical practice for the assessment of the adequacy of local gastrointestinal perfusion, and it represents an important landmark in the history of peripheral hemodynamic monitoring (22-25). Since the introduction of gastric tonometry has proved to be of prognostic value, the field of regional noninvasive monitoring gained wide interest, and studies started to address the importance of monitoring peripheral vascular beds more susceptible to hypoperfusion, such as skin, muscle, and gastrointestinal tract.

18 Introduction
refereNCeS
(1) Fram J, Salmans S. Weird Cures: The Most Hilarious, Disgusting, and Downright Dangerous Medi-cal Treatments Ever! Running Press Book Publishers, 2006.
(2) Manji RA, Wood KE, Kumar A. The history and evolution of circulatory shock. Crit Care Clin 2009; 25(1):1-29.
(3) Morris EA. A practical treatise on shock after operations and injuries. London, 1867. (4) Jordan F. Shock after Surgical Operations and Injuries. Br Med J 1867; 1(319):136-137. (5) Riva-Rocci S. Un nuovo sfigmemanometro. Gazetta Medica di Torino 1896; 47: 981-986. (6) Bourassa MG. The history of cardiac catheterization. Can J Cardiol 2005; 21(12):1011-1014. (7) Swan HJ, Ganz W, Forrester J, Marcus H, Diamond G, Chonette D. Catheterization of the heart in
man with use of a flow-directed balloon-tipped catheter. N Engl J Med 1970; 283(9):447-451. (8) Blalock A. Acute circulatory failure as exemplified by shock and hemorrhage. Surg Gynecol Obstet
1934; 58:551-566. (9) Wiggers CJ. The physiology of shock. Harvard UniversityPress. Cambridge (MA): Harvard Univer-
sity Press; 1950. (10) Simeone FA. Some issues in problems of shock. Fed Proc 1961; 20(3). (11) Kumar A PJ. Shock: pathophysiology, classification and approach to management. In: Parrillo JE
DR, editor. Critical care medicine: principles of diagnosis and management in the adult. St. Louis (MO): Mosby Publications, 2001: 371-420.
(12) Krogh A. The number and distribution of capillaries in the muscles with calculations of oxygen pressure necessary for supplying the tissue. J Physiol London 1919; 52:409-415.
(13) Wiggers CJ, Ingraham RC, Dillie J. Hemorrhagic-hypotension shock in locally anesthetized dogs. Am J Phys 1945;143:126–33.
(14) Dapremont C, Thomas Rf, Johnson Jb. Observations on the effects of pyrogens in the treatment of patients with hypertension. J Natl Med Assoc 1951; 43(5):300-304.
(15) Gilbert RP. Mechanisms of the hemodynamic effects of endotoxin. Physiol Rev 1960; 40:245-279. (16) Hinshaw LB. Sepsis/septic shock: participation of the microcirculation: an abbreviated review. Crit
Care Med 1996; 24(6):1072-1078. (17) Guyton AC, Lindsey AW, Kaufmann BN. Effect of mean circulatory filling pressure and other
peripheral circulatory factors on cardiac output. Am J Physiol 1955; 180(3):463-468. (18) Weil MH, Tang W. From intensive care to critical care medicine: a historical perspective. Am J
Respir Crit Care Med 2011; 183(11):1451-1453. (19) Joly HR, Weil MH. Temperature of the great toe as an indication of the severity of shock. Circula-
tion 1969; 39(1):131-138. (20) Vincent JL. The International Sepsis Forum’s frontiers in sepsis: High cardiac output should be
maintained in severe sepsis. Crit Care 2003; 7(4):276-278. (21) Sharma VK, Dellinger RP. The International Sepsis Forum’s frontiers in sepsis: High cardiac output
should not be maintained in severe sepsis. Crit Care 2003; 7(4):272-275. (22) Doglio GR, Pusajo JF, Egurrola MA, Bonfigli GC, Parra C, Vetere L et al. Gastric mucosal pH as a
prognostic index of mortality in critically ill patients. Crit Care Med 1991; 19:1037-1040. (23) Gutierrez G, Palizas F, Doglio G, Wainsztein N, Gallesio A, Pacin J et al. Gastric intramucosal pH as a
therapeutic index of tissue oxygenation in critically ill patients. Lancet 1992; 339(8787):195-199. (24) Marik PE. Gastric intramucosal pH. A better predictor of multiorgan dysfunction syndrome and
death than oxygen-derived variables in patients with sepsis. Chest 1993; 104:225-229.

Introduction: a historical perspective 19
(25) Maynard N, Bihari D, Beale R, Smithies M, Baldock G, Mason R et al. Assessment of splanchnic oxy-genation by gastric tonometry in patients with acute circulatory failure. JAMA 1993; 270:1203-1210.

20 Introduction
OUTlINe Of THeSIS
The present thesis aims to address several aspects of monitoring peripheral perfusion in critically ill patients, from defining the basic concepts and methodological issues to clinical studies further exploring the potential prognostic value of noninvasive monitor-ing of peripheral perfusion in different patient groups.
PArT A presents a brief introduction to the concepts of noninvasive monitoring of peripheral perfusion and summarizes current knowledge about available techniques to detect abnormalities of peripheral perfusion and oxygenation in critically ill patients (Chapter 1). Additionally, it provides relevant background information and discusses clinical applicability of such monitoring approach at the bedside (Chapter 2).
PArT b presents and discusses some of the methodological aspects of peripheral perfusion monitoring focusing mainly on portable optical devices. Chapter 3 introduces and validates the perfusion index from the pulse oximetry signal to detect abnormal peripheral perfusion. First, it describes the variation of this variable in healthy individu-als. Then, it shows its relationship with clinical indicators of poor peripheral perfusion in critically ill patients. Chapter 4 presents a comprehensive evaluation on the issue of best measurement site (Forerarm vs. Thenar) and probe spacing (15 mm vs. 25 mm) to assess peripheral tissue oxygenation (StO2) using near-infrared spectroscopy (NIRS). Chapter 5 and 5a evaluates and discusses the potential contribution of variations in peripheral blood flow on NIRS-derived signal, induced either by peripheral cooling or head-up tilt test.
PArT C reports a series of observational studies investigating the prognostic factor and potential clinical applications of monitoring peripheral perfusion noninvasively. Chapter 6 analyses the predictive value of clinical abnormalities in peripheral perfusion for organ and metabolic dysfunction in critically ill patients. Chapter 7 describes the prognostic value of continuous monitoring of StO2 during early goal-directed therapy of critically ill patients. Chapter 8 and 8a discuss the relationship between the condi-tion of peripheral circulation and NIRS-derived measurements of tissue oxygenation in critically ill patients. Additionally, it describes the predictive value of both parameters in identifying an unfavourable outcome for severe organ and metabolic dysfunction.
PArT d discusses administration of nitroglycerin as vasodilator therapy to reverse peripheral hypoperfusion and presents the results of an intervention study with step-wise dose of intravenous infusion of nitroglycerin to improve clinical abnormalities of peripheral circulation in patients with circulatory shock (Chapter 9).
PArT f presents general discussion, main findings, conclusion, summary of this thesis, and recommendations for future work.


PArT A Available noninvasive methods to monitor peripheral per fusion and ox ygenation


Chapter 1Non - invasive monitoring of peripheral per fusion
Intensive Care Med 2005; 3:1316-1326
Alexandre Lima, Jan Bakker

26 Chapter 1
AbSTrACT
Early hemodynamic assessment of global parameters in critically ill patients fails to provide adequate information on tissue perfusion. It requires invasive monitoring and may represent a late intervention initiated mainly in the intensive care unit. Noninvasive monitoring of peripheral perfusion can be a complementary approach that allows very early application throughout the hospital. In addition, as peripheral tissues are sensitive to alterations in perfusion, monitoring of the periphery could be an early marker of tis-sue hypoperfusion. In this review, we discuss noninvasive methods for monitoring per-fusion in peripheral tissues based on clinical signs, body temperature gradient, optical monitoring, transcutaneous oximetry, and sublingual capnometry. Clinical signs of poor peripheral perfusion consist of a cold, pale, clammy, and mottled skin, associated with an increase in capillary refill time. The temperature gradients peripheral-to-ambient, central-to-peripheral and forearm-to-fingertip skin are validated methods to estimate dynamic variations in skin blood flow. Commonly used optical methods for peripheral monitoring are perfusion index, near-infrared spectroscopy, laser Doppler flowmetry and orthogonal polarization spectroscopy. Continuous noninvasive transcutaneous measurement of oxygen and carbon dioxide tensions can be used to estimate cutaneous blood flow. Sublingual capnometry is a noninvasive alternative for gastric tonometry.

Non-invasive monitoring of peripheral perfusion 27
INTrOdUCTION
An important goal of hemodynamic monitoring is the early detection of inadequate tissue perfusion and oxygenation to institute prompt therapy and guide resuscitation, avoiding organ damage. In clinical practice, tissue oxygenation is frequently assessed by using conventional global measurements, such as blood pressure, oxygen derived variables and blood lactate levels. However, the assessment of global hemodynamic parameters fails to reflect increased blood lactate levels, the imbalance between oxygen demand and oxygen supply, or the status of the microcirculation [1-3]. In addition, it often requires invasive monitoring techniques that usually limit early initiation, typically after the patient has been admitted to the intensive care unit (ICU).
To address these limitations, there have been many attempts to perform measure-ments of blood flow and oxygenation in peripheral tissues [4, 5]. In circulatory failure, blood flow is diverted from the less important tissues (skin, subcutaneous, muscle, gas-trointestinal tract) to vital organs (heart, brain and kidneys). Thus, monitoring perfusion in these less vital tissues could be an early marker of vital tissue hypoperfusion. Second, the assessment of perfusion in peripheral tissues is more easily obtainable using nonin-vasive monitoring techniques, thus facilitating earlier initiation.
Monitoring of peripheral perfusion and oxygenation does not need any intravascular catheter, transesophageal probe insertion, blood component analysis or penetration of the skin. It and can be performed directly (clinical evaluation and body temperature gradient) or through signal processing (optical monitoring; transcutaneous oximetry; sublingual capnometry). In this review, we discuss several available noninvasive meth-ods to monitor peripheral perfusion and oxygenation (table 1).
Clinical Assessment
During circulatory failure, global decrease in oxygen supply and redistribution of blood flow caused by increased vasoconstriction results in decreased perfusion in organ sys-tems. Some organs, including the brain, heart and kidney, have vasomotor autoregula-tion that maintains blood flow in low blood pressure states. However, the cutaneous circulation is deprived of autoregulation, and the sympathetic neurohumoral response predominates resulting in a decrease in skin perfusion and temperature in these condi-tions. The assessment of skin temperature is made using the dorsal surface of the exam-iner hands or fingers, because these areas are most sensitive to temperature perception. Patients are considered to have cool extremities if all examined extremities are cool to the examiner, or only the lower extremities are cool despite warm upper extremities, in the absence of peripheral vascular occlusive disease. Clinical signs of poor peripheral perfusion consist of a cold, pale, clammy, and mottled skin, associated with an increase

28 Chapter 1
Table 1. Measurement methods to study peripheral perfusion
Method Variable Advantage Limitations
Clinical Assessment
Warmth and Coolness skinCRT
Depends only on physical examination;Valuable adjunct for hemodynamic monitoring in circulatory shock
Difficult interpretation in distributive shock
Body Temperature Gradient
dTc-pdTp-aTskin-diff
Validated method to estimate dynamic variations in skin blood flow
At least two temperature probes required;Does not reflect the variations in real time
Pulse Oximetry PFI Easily obtainable;Reflect real time changes in peripheral blood flow
Not accurate during patient motion
NIRS Hb,HbO2 and HbT variationsStO2 Cytaa3
Assessment of oxygenation in all vascular compartments;It can be applied to measure regional blood flow and oxygen consumption
Requires specific software to display the variables.
OPS FCD Direct visualization of the microcirculation
Observer-related bias;Semi-quantitative measure of perfusion
LDF Microvascular blood flow Useful method to evaluate endothelium-dependent vascular responses
Small sampling volume for cutaneous blood flow measurement;Does not reflect heterogeneity of blood flow
Transcutaneous Oximetry
PtcO2 / PtcCO2
Tc-indexDirect measurement of PtcO2 / PtcCO2;Early detection of peripheral hypoperfusion
Necessity to frequently change the sensor position; Requires blood gas analysis
Sublingual Capnometry
PslCO2
Psl-aCO2
Direct measurement of tissue PCO2 noninvasively
Requires blood gas analysis to obtain PaCO2;Normal and pathological values not yet defined
CrT: capillary refill time; dTc-p: temperature gradient central-to-peripheral; dTp-a: temperature; gradient peripheral-to-ambient; Tskin-diff: forearm-to-fingertip skin-temperature gradient; PfI: peripheral perfusion index; NIrS: Near-infrared spectroscopy; Hb: deoxygenated hemoglobin ; HbO2: oxygenated hemoglobin ; HbT: total hemoglobin (HbO2 + Hb); StO2: tissue oxygen saturation; Cytaa3: cytochrome aa3; OPS: Orthogonal polarization spectroscopy; fCd: functional capillary density; ldf: Laser Doppler flowmetry; PtcO2: oxygen partial pressure in the skin; PtcCO2: carbon dioxide partial pressure in the skin; Tc-index: transcutaneous oxygen index ( PtcO2 / PaO2 ); PslCO2: sublingual tissue PCO2; Psl-aCO2: gradient between PslCO2 and arterial PCO2

Non-invasive monitoring of peripheral perfusion 29
in capillary refill time. In particular, skin temperature and capillary refill time have been advocated as a measure of peripheral perfusion [6-11].
Capillary refill time (CRT) was introduced into the assessment of trauma and a value of <2 seconds was considered normal [12]. It is based on the assumption that a de-layed return of a normal color after emptying the capillary bed by compression is due to decreased peripheral perfusion. CRT has been validated as a measure of peripheral perfusion with significant variation in children and adults. Schriger and Baraff [8], in a study in the normal population, reported that CRT varied with age and sex. It was found that a CRT of 2 sec was a normal value for most young children and young adults, but the lowest CRT was substantially higher in healthy women (2,9 sec) and in elderly (4,5 sec). Using these normal variations, it was further shown that a prolonged CRT did not predict a 450 ml blood loss in adult blood donors nor hypovolemic states in patients admitted to the emergency room [10]. Clinically, several studies have reported a poor correla-tion between CRT, heart rate, blood pressure and cardiac output [6, 7, 10]. However, prolonged CRT in pediatric patients has been found to be a good predictor of dehydra-tion, reduced stroke volume and increased blood lactate levels [6, 11]. In adult patients following cardiac surgery, no significant relationship between cardiac index and CRT was found during the first 8h following ICU admission [7].
Distal extremity skin temperature has also been related to the adequacy of the circulation. Kaplan et al. [9] compared distal extremity skin temperature (evaluated by subjective physical examination) with biochemical and hemodynamic markers of hypoperfusion in adult ICU patients. In this study, it was found that patients with cold periphery (including septic patients) had lower cardiac output and higher blood lactate levels as a marker of more severe tissue hypoxia. In another study, Hasdai et al. [13] showed the importance of the physical examination in determining the prognosis of patients with cardiogenic shock. In this study, the presence of a cold and clammy skin was an independent predictor of 30-day mortality in patients with cardiogenic shock complicating acute myocardial infarction.
From these studies it is clear that skin temperature together with CRT are a valuable adjunct in hemodynamic monitoring during circulatory shock, and should be the first approach to assess critically ill patient. Not much is known about the clinical applicabil-ity of these variables after the patient has been admitted to the intensive care unit [14].
Temperature Gradients
Since Joly and Ibsen studied the toe temperature as an indicator of the circulatory shock [15, 16], body temperature gradients have been used as a parameter of peripheral perfu-sion. In the presence of a constant environmental temperature, a change in the skin temperature is the result of a change in skin blood flow [17]. The temperature gradients peripheral-to-ambient (dTp-a) and central-to-peripheral (dTc-p) can better reflect cuta-

30 Chapter 1
neous blood flow than the skin temperature itself. Considering a constant environment condition, dTp-a decreases and dTc-p increases during vasoconstriction. The peripheral skin temperature is measured using a regular temperature probe attached to the ventral face of the great toe. This site is more convenient for peripheral temperature measure-ment because of the negligible local heat production and the distal location from other monitoring devices [18]. The concept of the dTc-p is based on the transfer of heat from the body core to the skin. The heat conduction to the skin by the blood is also controlled by the degree of vasoconstriction of the arterioles and arteriovenous anastomoses. High blood flow causes heat to be conducted from the core to the skin, whereas reduction in blood flow decreases the heat conduction from the core. During vasoconstriction, the temperature of the skin falls and the heat conduction from the core decreases, so that the central temperature rises and the dTc-p increases. A gradient of 3 to 7ºC occurs in patients with stable hemodynamics [19]. Hypothermia, cold ambient temperature (<20°C) [20] and vasodilatory shock limits the use of dTc-p as an estimate of peripheral perfusion. Forearm-to-fingertip skin-temperature gradient (Tskin-diff ) has also been used as an index of peripheral circulation to identify the initiation of thermoregulatory vasoconstriction in patients following surgery [21]. Fingertip temperature is measured with the temperature probe attached to the ventral face of the finger. The use of Tskin-diff is based on assumption that the reference temperature is a skin site exposed to the same ambient temperature as the fingertip. It has been applied in conditions where an ambient temperature is not stable, such as in patients undergoing surgery [21-23]. A change in ambient temperature, therefore, affects similarly forearm and fingertip tem-perature, producing little influence in the gradient. Basically, when vasoconstriction de-creases fingertip blood flow, finger skin temperature decreases, and Tskin-diff increases. Experimental studies have suggested a Tskin-diff threshold of 0ºC for the initiation of vasoconstriction, and a threshold of 4ºC for severe vasoconstriction in anesthetized patients [22, 23].
The body temperature gradient was first applied to assess patients with circula-tory shock and to differentiate central heat retention caused by fever from peripheral vasoconstriction [15, 16, 24]. A number of studies have attempted to correlate body temperature gradient to global hemodynamic variables in hypovolemic, septic and cardiogenic shock, with conflicting results [15, 25-31]. Henning et al. [28] studied dTp-a in patients with circulatory failure associated with hypovolemia and low cardiac output. An increase in dTp-a to more than 4 to 6°C over an interval of 12 hours was observed in survivors, and a good relationship between the lowest dTp-a and the highest blood lactate levels was found in hypovolemic patients at time of admission. In assessing the potential value of dopamine as a therapeutic agent to treat circulatory shock, Ruiz et al. [25] showed that survival was associated with an increase in dTp-a of more than 2°C, and that dTp-a was correlated to increases in cardiac output and a reduction in blood lactate

Non-invasive monitoring of peripheral perfusion 31
levels. To determine the value of dTp-a to assess peripheral perfusion in cardiogenic shock, Vincent et al. [27] found that a cardiac index below 1.8 l/min.m2 was associated with a decrease in dTp-a below 5°C, and that the increase in dTp-a occurred earlier than the increase in skin oxygen partial pressure during recovery; this correlation was not found in septic shock. No relationship was observed between dTc-p and cardiac output in adults with diverse causes of shock [31] and in children after open heart surgery [26, 29, 30]. One reason for the inaccurate relationship between body temperature gradi-ent and global hemodynamic parameters could be related to unstable environment, as skin temperature depends also on ambient temperature, and the thermoregulatory response is suppressed in anesthetised patients [32]. In addition, global hemodynamic parameters may not be sensitive enough to reflect changes in peripheral blood flow in critically ill patients [33, 34]. Tskin-diff may be an alternative, but its use in these condi-tions has not yet been defined.
Optical Monitoring
Optical methods apply light with different wave lengths directly to tissue components using the scattering characteristics of tissue to assess different states of these tissues [35]. At physiologic concentrations, the molecules that absorb most light are hemoglo-bin, myoglobin, cytochrome, melanins, carotenes and bilirrubin. These substances can be quantified and measured in intact tissues using simple optical methods. The assess-ment of tissue oxygenation is based on the specific absorption spectrum of oxygen-ated hemoglobin (HbO2), deoxygenated hemoglobin (Hb) and cytochrome aa3 (cytaa3). Commonly used optical methods for peripheral monitoring are perfusion index, near-infrared spectroscopy, laser-Doppler flowmetry and orthogonal polarization spectral.
Peripheral Perfusion IndexThe peripheral perfusion index (PFI) is derived from the photoeletric plethysmographic signal of pulse oximetry and has been used as a noninvasive measure of peripheral perfusion in critically ill patients [36]. Pulse oximetry is a monitoring technique used in probably every trauma, critically ill and surgical patient. The principle of pulse oximetry is based on two light sources with different wavelengths (660 nm and 940 nm) emitted through the cutaneous vascular bed of a finger or earlobe. The Hb absorbs more light at 660 nm and HbO2 absorbs more light at 940 nm. A detector at the far side measures the intensity of the transmitted light at each wavelength, and the oxygen saturation is derived by the ratio between the red light (660 nm) and the infra-red light (940 nm) absorbed. As other tissues also absorb light, such as connective, bone and venous blood, the pulse oximetry distinguishes the pulsatile component of arterial blood from the non-pulsatile component of other tissues. Thus, using a two-wavelength system, the non-pulsatile component can be discarded, and the pulsatile component is used to

32 Chapter 1
calculate the arterial oxygen saturation. The overall hemoglobin concentration can be determined by a third wavelength at 800 nm, which resemble the spectrum for both Hb and HbO2. The resulting variation in intensity of this light can be used to determine the variation in arterial blood volume (pulsatile component). The PFI is calculated as the ratio between the pulsatile component (arterial compartment) and the non-pulsatile component (other tissues) of the light reaching the detector of the pulse oximetry and it is calculated independently from the patient oxygen saturation (Fig. 1). A peripheral perfusion alteration is accompanied by variation in the pulsatile component, and be-cause the non-pulsatile component does not change, the ratio changes. As a result, the value displayed on the monitor reflects changes in peripheral perfusion.
Studies with body temperature gradient suggest that PFI can be a direct indicator of peripheral perfusion. A PFI of 1.4 was found to correlate best with hypoperfusion in critically ill patients using normal values in healthy adults [36]. A good relationship between Tskin-diff and PFI was observed in anesthetised patients to identify the initia-tion of thermoregulatory vasoconstriction [37]. PFI could reflect changes in dTc-p and Tskin-diff and therefore it could reflect vascular reactivity in adult critically ill patients [36, 38]. Another study showed that PFI could be used to predict severity of illness in neonates with a cutoff value ≤1.24 [39]. The inclusion of PFI into the pulse oximetry signal is a recent advance in clinical monitoring. However, more studies are needed to define its clinical utility.
fig. 1 The pulsation of arterial blood causes a pulsating volume variation. Peripheral perfusion index (PFI) is calculated as the ratio between the arterial pulsatile component (IP) and the nonpulsatile component (INP). I0 Source light intensity; I light intensity at the detector

Non-invasive monitoring of peripheral perfusion 33
Near-Infrared SpectroscopyNear-infrared spectroscopy (NIRS) offers a technique for continuous, noninvasive, bedside monitoring of tissue oxygenation. Like pulse oximetry, NIRS use the principles of light transmission and absorption to measure the concentrations of hemoglobin, oxygen saturation (StO2), and cytaa3 noninvasively in tissues. NIRS has a greater tissue penetration than pulse oximetry, and provides a global assessment of oxygenation in all vascular compartments (arterial, venous and capillary). The tissue penetration is directly related to the spacing between illumination and detection fibers. With 25 mm spacing, approximately 95% of the detected optical signal is from a depth of zero to 23 mm (Fig. 2). NIRS has been used to assess forearm skeletal muscle oxygenation during induced reac-tive hyperemia in healthy adults, and it produced reproducible measurements of tissue oxygenation during both arterial and venous occlusive events [40]. Using the venous and arterial occlusion methods, NIRS can be applied to measure regional blood flow and oxygen consumption by following the rate of HbO2 and Hb changes [40-42]. In the venous occlusion method, a pneumatic cuff is inflated to a pressure of approximately 50 mmHg. Such a pressure blocks venous occlusion, but does not impede arterial inflow. As a result, venous blood volume and pressure increase. NIRS can reflect this change by an increase in HbO2, Hb and total hemoglobin (tHb). In arterial occlusion method, the pneumatic cuff is inflated to a pressure of approximately 30 mmHg greater than systolic pressure. Such a pressure blocks both venous outflow and arterial inflow. Depletion of local available O2 is monitored by NIRS as a decrease in HbO2 and a simultaneous increase in Hb, whereas tHb remains constant. After release of the occluding cuff, a hyperaemic response is observed (Fig. 3). Blood volume increases rapidly, resulting in an increase in HbO2 and a quick washout of Hb. In addition to blood flow and evaluation of HbO2 and Hb changes, NIRS can assess cytaa3 redox state. Cytaa3 is the final receptor in the oxygen transport chain that reacts with oxygen to form water, and approximately 90%
fig. 2 A Diagram of a distal tip of the NIRS optical cable. B With 25 mm spacing (d) between emission and detection probes, approx. 95% of the detected optical signal is from 23 mm of tissue penetration

34 Chapter 1
of cellular energy is derived from this reaction. Cytaa3 remains in a reduced state during hypoxemia. The absorption spectrum of cytaa3 in its reduced state shows a weak peak at 70 nm, whereas the oxygenated form does not. Therefore, monitoring changes in its redox state can provide a measure of the adequacy of oxidative metabolism. Despite the potential clinical applications of NIRS, some limitations still exist. The contribution of the cytaa3 signal is small, and its interpretation remains controversial, requiring more rigor-ous development [43]. There is no a gold standard to which NIRS data can be directly compared and one of the reasons is that a variety of NIRS equipment is commercially available with different working systems.
In small and large-animal models of hemorrhagic shock and resuscitation, NIRS demonstrated sensitivity in detecting skeletal muscle and visceral ischemia [44-47]. As a noninvasive measure of peripheral perfusion, NIRS has been applied in superficial muscles (brachioradialis muscle, deltoid muscle, tibialis anterior) of trauma ICU patients to monitor the adequacy of tissue oxygenation and the detection of a compartment syndrome [48-52]. The use of NIRS in deltoid muscle during resuscitation of severe trauma patients has been reported recently [48, 49]. Cairns et al. [49] studied trauma ICU patients and reported a strong association between elevated serum lactate levels and elevated cytaa3 redox state during 12 hours of shock resuscitation and development of multiple organ failure. More recently, Mckinley et al. [48] showed a good relationship between StO2, systemic oxygen delivery and lactate in severely trauma patients during and after resuscitation, over a period of 24 hours. In a recent study with septic and non-septic patients, NIRS has been used to measure both regional blood flow and oxygen consumption after venous occlusion [53]. In this study, septic patients had muscular
fig. 3 Quantitative NIRS measurements during arterial occlusion. After release of the occluding cuff blood volume increases rapidly, resulting in an increase in HbO2 and a quick washout of Hb, followed by a hyperemic response. Oxygen consumption is calculated as the rate of decrease in HbO2 (dotted line)

Non-invasive monitoring of peripheral perfusion 35
oxygen consumption two times greater than nonseptic patients, but oxygen extraction was similar in both groups, emphasizing oxygen extraction dysfunction in sepsis. In an-other study, no relationship was found between forearm blood flow, measured by NIRS, and systemic vascular resistance in septic shock patients [41]. These studies outline the ability of NIRS to reflect microcirculatory dysfunction in skeletal muscle in septic shock. The potential to monitor regional perfusion and oxygenation noninvasively at the bed-side makes clinical application of NIRS technology of particular interest in intensive care.
Orthogonal Polarization SpectralOrthogonal polarization spectral (OPS) is a noninvasive technique that uses reflected light to produce real-time images of the microcirculation. The technical characteristics of the device has been described elsewhere [54]. Light from a source passes through the first polarizer and it is directed towards the tissue by a set of lens. As the light reaches the tissue, the depolarized light is reflected back through the lenses to a second polar-izer or analyzer and forms an image of the microcirculation on the CCD, which can be captured through a single videotape (Fig. 4). The technology has been incorporated into a small, hand-held video microscope, which can be used in both research and clinical settings. OPS can assess tissue perfusion using the functional capillary density (FCD),
fig. 4 OPS optical schematic. (A) The light passes through the first polarizer and is reflected back through the lens. (b) The polarized light reflecting from the surface is eliminated, and the depolarized light forms an image of the microcirculation on a videocamera (charge-coupled device, CCD)

36 Chapter 1
i.e., the length of perfused capillaries per observation area given as cm/cm2. FCD is a very sensitive parameter for determining the status of nutritive perfusion to the tissue and it is an indirect measure of oxygen delivery. One of the most easily accessible sites in humans for peripheral perfusion monitoring is the mouth. OPS has been able to produce excellent images of the sublingual microcirculation by placing the probe under the tongue. Movement artifacts, semi-quantitative measure of perfusion, the presence of various secretions such as saliva and blood, observer-related bias and patients ad-equately sedated to prevent them for damaging the device are some of the limitations of the technique.
The use of sublingual tissues with OPS provides information about the dynamics of microcirculatory blood flow and, therefore, it can monitor the perfusion during clinical treatment of circulatory shock. It was used to monitor the effects of improvements in microcirculatory blood flow with dobutamine and nitroglycerin in volume resuscitated septic patients [55, 56]. OPS has been applied in the ICU to study the properties of sublingual microcirculation in both septic shock and cardiogenic shock [2, 56-58]. In septic patients, it was shown with OPS that microvascular alterations were more severe in patients with a worse outcome, and that these microvascular alterations could be reversed using vasodilators [2]. In patients with cardiac failure and cardiogenic shock, the number of small vessels and the density of perfused vessels were lower compared with control patients, and the proportion of perfused vessels was higher in patients who survived than in patients who did not survive [57]. Using OPS during the time course of treatment of patients with septic shock, Sakr et al. [58] demonstrated that the be-haviour of the sublingual microcirculation differed between survivors and nonsurvivors. Although alterations in the sublingual microcirculation may not be representative of other microvascular beds, changes in the sublingual circulation evaluated by capnom-etry during hemorrhagic shock have been related to changes in perfusion of internal organs such as the liver and intestine [59]. Thus, OPS could be of use in the monitoring of tissue perfusion.
Laser Doppler FlowmetryLaser Doppler flowmetry (LDF) is a non-invasive, continuous measure of microcirculatory blood flow, and it has been used to measure microcirculatory blood flow in many tissues including neural, muscle, skin, bone and intestine. The principle of this method is to measure the Doppler shift - the frequency change that light undergoes when reflected by moving objects, such as red blood cells. LDF works by illuminating the tissue under observation with a monochromatic laser from a probe. When the tissue is illuminated, only 3-7% is reflected. The remaining 93-96% of the light is either absorbed by various structures or undergoes scattering. Another optical fibre collects the backscattered light from the tissue and returns it to the monitor (Fig. 5). As a result, LDF produces an

Non-invasive monitoring of peripheral perfusion 37
output signal that is proportional to the microvascular perfusion [60]. Depending on the device and the degree of invasiveness, it can be used to assess blood flow in muscle, gastric, rectal and vagina mucosae. But as a non-invasive measure of peripheral blood flow, its use is limited to the skin [60]. LDF has been applied to obtain information on the functional state of the skin microcirculation during reactive hyperemia in several conditions, such as diabetes mellitus, essential hypertension, atherosclerosis and sepsis [61]. A major limitation of this technique is that LDF does not take into account the heterogeneity of blood flow as the velocity measurements represent the average of velocities in all vessels of the window studied. In addition, skin blood flow signal var-ies markedly depending on probe position. No current laser Doppler instrument can present absolute perfusion values (e.g. ml/min/100 gram tissue) and measurements are expressed as Perfusion Units, which are arbitrary.
LDF has been useful to evaluate endothelium-dependent vascular responses in the skin microcirculation during either reactive hyperemia [61, 62] or the noninvasive local application of acetylcholine or sodium nitroprusside [63-65]. This characteristic of LDF was used in critically ill patients to evaluate endothelial dysfunction in sepsis. Observa-tional studies have shown that the hyperaemic response in septic patients is decreased, and a relationship between changes in vasculature tone and severity of sepsis has been
fig. 5 Schematic diagram of laser Doppler flowmetry. When the tissue is illuminated by a laser source (1), 93–97% of the light is either absorbed by various structures or undergoes scattering (a, b). The remaining 3–7% is reflected by moving red blood cells (c, d) and returns to the second optical fiber (2). Microvascular perfusion is defined as the product of mean red blood cells (RBC) velocity and mean RBC concentration in the volume of tissue under illumination from the probe

38 Chapter 1
described [66-68]. In addition, restored vasomotion in patients with sepsis evaluated by LDF seems to be associated with a favourable prognosis [67]. The ability of LDF to assess abnormalities of skin blood flow control in sepsis could be of clinical use for early detection of microcirculatory derangements in high-risk patients.
PO2 and PCO2 Transcutaneous Measurements
Continuous noninvasive measurement of oxygen (O2) and carbon dioxide (CO2) ten-sions is possible because both gases can diffuse through the skin and thus their partial pressures can be measured in transcutaneous tissue. Normally the skin is not very permeable to gases, but at higher temperatures, the ability of the skin to transport gases is improved. Oxygen sensors for transcutaneous electrochemical measurements are based on polarography: a typical amperometric transducer in which the rate of a chemical reaction is detected by the current drained through an electrode. The sensor heats the skin to 43-45ºC. The skin surface oxygen tension is increased as a result of 3 effects: [69] heating the stratum corneum beyond 40ºC changes its structure, which allows oxygen to diffuse faster; [70] the local oxygen tension is increased by shifting the oxygen dissociation curve in the heated dermal capillary blood; and [71] by dermal capillary hyperemia. These transcutaneous sensors enable us to directly estimate arte-rial oxygen pressure (PaO2) and arterial carbon dioxide pressure (PaCO2) and it has been successfully used for monitoring PaO2 and PaCO2 in both neonates and in adults [72-74]. Newborn infant is suitable because of its thin epidermal layer. However, in adults the skin is thicker and differences in the skin cause the PtcO2 to be lower than PaO2. The cor-relation between PtcO2 and PaO2 also depends on the adequacy of blood flow. The low blood flow caused by vasoconstriction during shock overcomes the vasodilatory effect of PtcO2 sensor. This causes a mild tissue hypoxia beneath the PtcO2 sensor. The lack of the PtcO2 ability to accurately reflect the PaO2 in low flow shock enables us to estimate cutaneous blood flow through the relationship between the two variables. Some studies have suggested the use of a transcutaneous oxygen index (tc-index), i.e., the changes of PtcO2 relative to changes of PaO2 [72, 75-78]. When the blood flow is adequate, the PtcO2 and PaO2 values are almost equal and the tc-index is close to 1. During low flow shock the PtcO2 will drop and becomes dependent to the PaO2 value and tc-index decreases. A tc-index more than 0,7 has been associated with hemodynamic stability [72, 75, 77, 78]. Transcutaneous Carbon Dioxide Partial Pressure (PtcCO2) has been also used as an index of cutaneous blood flow. Differences between PaCO2 and PtcCO2 have been explained by local accumulation of CO2 in the skin due to hypoperfusion. Because of the diffusion constant of CO2 is about 20 times greater than O2, PtcCO2 has been showed to be less sensitive to changes in hemodynamics than PtcO2 [79]. One of the main limitations of this technique is the necessity of blood gas analysis to obtain the tc-index and PaCO2. In addition, the sensor position has to be changed every one to two hours to avoid burns.

Non-invasive monitoring of peripheral perfusion 39
After each repositioning, a period of 15 to 20 min is required for the next readings, which limits its use in emergency situations.
The ability of PtcO2 to reflect tissue perfusion in critically ill adult patients has been ap-plied using the tc-index. Tremper and Shoemaker [75] found a good correlation (r=0.86) between tc-index and cardiac index in patients with shock. In this study, the authors showed that when cardiac index was >2.2 L/min.M2, tc-index averaged 0.79; when cardiac index was between 1.5 and 2.2 L/min.M2, tc-index was 0.48; and when cardiac index was <1.5 L/min.M2, tc index was 0.12. However, the relationship between tc-index and cardiac index may not exist in hyperdynamic shock. Reed et al. [78] studied PtcO2 at different cardiac indices. In this study, 71 measurements were made in 19 patients, and a low tc-index was seen in 71% of the patients with a cardiac index >4.2L/min.m2. PtcO2 and PtcCO2 monitoring have been used as an early indicator of tissue hypoxia and subclinical hypovolemia in acutely ill patients [80, 81]. Tatevossian et al. [81] studied 48 severely injured patients during early resuscitation in the emergency department and operating room. The sequential patterns of PtcO2 and PtcCO2 were described throughout initial resuscitation. The nonsurvivors had lower PtcO2 values and higher PtcCO2 values compared with the survivors. These differences were already evident early after the patient’s arrival. The authors reported a critical tissue perfusion threshold of a PtcO2 <50 mmHg for >60 min and a PtcCO2 >60 mmHg for > 30 min. Patients who failed to avoid these critical thresholds had 89% to 100% mortality. This technology has not gained widespread acceptance in clinical practice, as the time needed for calibration limits its early use in the emergency department, and critical PtcO2 and PtcCO2 values have not been established.
Sublingual Capnometry
The measurements of tissue-arterial CO2 tension gradient have been used to reflect the adequacy of tissue perfusion. The gastric and ileal mucosal CO2 clearance has been the primary reference for measurements of regional PCO2 gradient during circulatory shock [82]. The regional PCO2 gradient represents the balance between regional CO2 produc-tion and clearance. During tissue hypoxia, CO2 is produced by hydrogen anions buffered by tissue bicarbonate, which adds to the amount of CO2 produced by normal oxida-tive metabolism. The amount of CO2 produced, either aerobically or because of tissue hypoxia will be cleared if blood flow is maintained. In low flow states, CO2 increases as a result of stagnation phenomenon [83]. Gastric tonometry is a technique that can be used to assess the adequacy of gut mucosal blood flow to metabolism. The methodological limitations of gastric tonometry demanded a search for a tissue where PCO2 could be easily measured in a noninvasive approach. Comparable decreases in blood flow during circulatory shock have been also demonstrated in the sublingual tissue PCO2 (PslCO2) [84, 85]. The currently available system for measuring PslCO2 consists of a disposable

40 Chapter 1
PCO2 sensor and a battery powered handheld instrument. The instrument uses fibre optic technology to transmit light through the sensor placed between the tongue and the sublingual mucosa. Carbon dioxide diffuses across a semi-permeable membrane of the sensor and into a fluorescent dye solution. The dye emits light that is proportional to the amount of CO2 present. This light intensity is analyzed by the instrument and displayed as a numeric PslCO2 value.
Clinical studies have suggested that PslCO2 is a reliable marker of tissue hypoperfu-sion [86-89]. Weil et al. [89] applied PslCO2 in 46 patients with acutely life threatening illness or injuries admitted to the emergency department or ICU. In this study, 26 pa-tients with physical signs of circulatory shock and high blood lactate levels had higher PslCO2 values, and a PslCO2 threshold value of 70 mmHg was predictive for the severity of the circulatory failure. Similarly as PCO2 in the gut mucosal, PslCO2 is also influenced by PaCO2 [90]. Hence, the gradient between PslCO2 and PaCO2 (Psl-aCO2) is more specific for tissue hypoperfusion. This has been shown in the study of Marik and Bankov [88] who determined the prognostic value of sublingual capnometry in 54 hemodynamic unstable critically ill patients. In this study, Psl-aCO2 was a sensitive marker for tissue perfusion and a useful end point for the titration of goal-directed therapy. In contrast to PslCO2 alone, the Psl-aCO2 better differentiated between survivors and nonsurvivors, and a difference of >25 mm Hg indicated a poor prognosis. One limitation of this technique includes the necessity of blood gas analysis to obtain PaCO2. In addition, established normal and pathological Psl-aCO2 values are not well defined.
CONClUSION
The conventional systemic hemodynamic and oxygenation parameters are nei-ther specific nor sensitive enough to detect regional hypoperfusion. In clinical practice, a more complete evaluation of tissue oxygenation can be achieved by adding nonin-vasive assessment of perfusion in peripheral tissues to global parameters. Noninvasive monitoring of peripheral perfusion could be a complementary approach that allows very early application throughout the hospital, including the emergency department, operating room, and hospital wards. Such approach can be applied using both simple physical examination and new current technologies, as discussed above. Although these methods may reflect variations in peripheral perfusion with certain accuracy, more stud-ies are needed to define the precise role of such methods in the management of the critically ill patients. Finally, evidence for clinical and cost effectiveness of these methods is an important aspect that needs further investigations with a more formal technology assessment.

Non-invasive monitoring of peripheral perfusion 41
refereNCeS
1. Bakker J, Coffernils M, Leon M, Gris P, Vincent J-L (1991)Blood lactate levels are superior to oxygen-derived variables in predicting outcome in human septic shock. Chest 99:956-962
2. De Backer D, Creteur J, Preiser JC, Dubois MJ, Vincent JL (2002)Microvascular blood flow is altered in patients with sepsis. Am J Respir Crit Care Med 166:98-104
3. Rady MY, Rivers EP, Nowak RM (1996)Resuscitation of the critically ill in the ED: responses of blood pressure, heart rate, shock index, central venous oxygen saturation, and lactate. Am J Emerg Med 14:218-225
4. Shoemaker WC, Appel PL, Kram HB, Nathan RC, Thompson JL (1988)Multicomponent noninvasive physiologic monitoring of circulatory function. Crit Care Med 16:482-490
5. Siegemund M, van Bommel J, Ince C (1999)Assessment of regional tissue oxygenation. Intensive Care Med 25:1044-1060
6. Tibby SM, Hatherill M, Murdoch IA (1999)Capillary refill and core-peripheral temperature gap as indicators of haemodynamic status in paediatric intensive care patients. Arch Dis Child 80:163-166
7. Bailey JM, Levy JH, Kopel MA, Tobia V, Grabenkort WR (1990)Relationship between clinical evalu-ation of peripheral perfusion and global hemodynamics in adults after cardiac surgery. Crit Care Med 18:1353-1356
8. Schriger DL, Baraff L (1988)Defining normal capillary refill: variation with age, sex, and tempera-ture. Ann Emerg Med 17:932-935
9. Kaplan LJ, McPartland K, Santora TA, Trooskin SZ (2001)Start with a subjective assessment of skin temperature to identify hypoperfusion in intensive care unit patients. J Trauma 50:620-627
10. Schriger DL, Baraff L (1991)Capillary refill: is it a useful predictor of hypovolemic states ? Ann Emerg Med 20:601-605
11. Steiner MJ, DeWalt DA, Byerley JS (2004)Is this child dehydrated? JAMA 291:2746-2754 12. Champion HR, Sacco WJ, Carnazzo AJ, Copes W, Fouty WJ (1981)Trauma score. Crit Care Med
9:672-676 13. Hasdai D, Holmes DR, Jr., Califf RM, Thompson TD, Hochman JS, Pfisterer M, Topol EJ (1999)Cardio-
genic shock complicating acute myocardial infarction: predictors of death. GUSTO Investigators. Global Utilization of Streptokinase and Tissue-Plasminogen Activator for Occluded Coronary Arteries. Am Heart J 138:21-31
14. McGee S, Abernethy WB, III, Simel DL (1999)Is this patient hypovolemic? JAMA 281:1022-1029 15. Joly HR, Weil MH (1969)Temperature of the great toe as an indication of the severity of shock.
Circulation 39:131-138 16. Ibsen B (1967)Treatment of shock with vasodilators measuring temperature of the great toe: ten
years experience in 150 cases. Dis Chest 52:425 17. Guyton AC (1996)Body temperature, temperature regulation, and fever. In: Guyton AC, Hall J.E.
(eds)Textbook of Medical Physiology. W.B. Saunders Company, pp 911-922 18. Ross BA, Brock L, Aynsley-Green A (1969)Observations on central and peripheral temperatures in
the understanding and management of shock. Br J Surg 56:877-882 19. Curley FJ, Smyrnios NA (2003)Routine monitoring of critically ill patients. In: Irwin RS, Cerra FB,
Rippe JM (eds)Intensive Care Medicine. Lippincott Williams & Wilkins, pp 250-270 20. Ibsen B (1966)Further observations in the use of air-conditioned rooms in the treatment of
hyperthermia and shock. Acta Anaesthesiol Scand Suppl 23:565-570

42 Chapter 1
21. Rubinstein EH, Sessler DI (1990)Skin-surface temperature gradients correlate with fingertip blood flow in humans. Aneshesiology 73:541-545
22. Sessler DI (2003)Skin-temperature gradients are a validated measure of fingertip perfusion. Eur J Appl Physiol 89:401-402
23. House JR, Tipton MJ (2002)Using skin temperature gradients or skin heat flux measurements to determine thresholds of vasoconstriction and vasodilatation. Eur J Appl Physiol 88:141-145
24. Brock L, Skinner JM, Manders JT (1975)Observations on peripheral and central temperatures with particular reference to the occurrence of vasoconstriction. Br J Surg 62:589-595
25. Ruiz CE, Weil MH, Carlson RW (1979)Treatment of circulatory shock with dopamine. Studies on survival. JAMA 242:165-168
26. Ryan CA, Soder CM (1989)Relationship between core/peripheral temperature gradient and central hemodynamics in children after open heart surgery. Crit Care Med 17:638-640
27. Vincent JL, Moraine JJ, van der LP (1988)Toe temperature versus transcutaneous oxygen tension monitoring during acute circulatory failure. Intensive Care Med 14:64-68
28. Henning RJ, Wiener F, Valdes S, Weil MH (1979)Measurement of toe temperature for assessing the severity of acute circulatory failure. Surg Gynecol Obstet 149:1-7
29. Murdoch IA, Qureshi SA, Mitchell A, Huggon IC (1993)Core-peripheral temperature gradient in children: does it reflect clinically important changes in circulatory haemodynamics? Acta Paediatr 82:773-776
30. Butt W, Shann F (1991)Core-peripheral temperature gradient does not predict cardiac output or systemic vascular resistance in children. Anaesth Intensive Care 19:84-87
31. Woods I, Wilkins RG, Edwards JD, Martin PD, Faragher EB (1987)Danger of using core/peripheral temperature gradient as a guide to therapy in shock. Crit Care Med 15:850-852
32. Sessler DI (2000)Perioperative heat balance. Aneshesiology 92:578-596 33. Rivers E, Nguyen B, Havstad S, Ressler J, Muzzin A, Knoblich B, Peterson E, Tomlanovich M (2001)
Early goal-directed therapy in the treatment of severe sepsis and septic shock. N Engl J Med 345:1368-1377
34. Vincent JL (1996)End-points of resuscitation: arterial blood pressure, oxygen delivery, blood lactate, or…? Intensive Care Med 22:3-5
35. Flewelling R (2000)Noninvasive optical monitoring. In: Bronzino JD (ed)The Biomedical Engineer-ing Handbook. Springer, pp 1-10
36. Lima AP, Beelen P, Bakker J (2002)Use of a peripheral perfusion index derived from the pulse oximetry signal as a noninvasive indicator of perfusion. Crit Care Med 30:1210-1213
37. Kurz A, Xiong J, Sessler DI, Dechert M, Noyes K, Belani K (1995)Desflurane reduces the gain of thermoregulatory arteriovenous shunt vasoconstriction in humans. Aneshesiology 83:1212-1219
38. Lima A, Bakker J (2004)The peripheral perfusion index in reactive hyperemia in critically ill pa-tients. Critical Care 8:S27-P53
39. De Felice C, Latini G, Vacca P, Kopotic RJ (2002)The pulse oximeter perfusion index as a predictor for high illness severity in neonates. Eur J Pediatr 161:561-562
40. Van Beekvelt MC, Colier WN, Wevers RA, Van Engelen BG (2001)Performance of near-infrared spectroscopy in measuring local O(2)consumption and blood flow in skeletal muscle. J Appl Physiol 90:511-519
41. De Blasi RA, Ferrari M, Natali A, Conti G, Mega A, Gasparetto A (1994)Noninvasive measurement of forearm blood flow and oxygen consumption by near-infrared spectroscopy. J Appl Physiol 76:1388-1393
Non-invasive monitoring of peripheral perfusion 43
42. Edwards AD, Richardson C, van der ZP, Elwell C, Wyatt JS, Cope M, Delpy DT, Reynolds EO (1993)Measurement of hemoglobin flow and blood flow by near-infrared spectroscopy. J Appl Physiol 75:1884-1889
43. Taylor DE, Simonson SG (1996)Use of near-infrared spectroscopy to monitor tissue oxygenation. New Horiz 4:420-425
44. Rhee P, Langdale L, Mock C, Gentilello LM (1997)Near-infrared spectroscopy: continuous mea-surement of cytochrome oxidation during hemorrhagic shock. Crit Care Med 25:166-170
45. Puyana JC, Soller BR, Zhang S, Heard SO (1999)Continuous measurement of gut pH with near-infrared spectroscopy during hemorrhagic shock. J Trauma 46:9-15
46. Beilman GJ, Myers D, Cerra FB, Lazaron V, Dahms RA, Conroy MJ, Hammer BE (2001)Near-infrared and nuclear magnetic resonance spectroscopic assessment of tissue energetics in an isolated, perfused canine hind limb model of dysoxia. Shock 15:392-397
47. Crookes BA, Cohn SM, Burton EA, Nelson J, Proctor KG (2004)Noninvasive muscle oxygenation to guide fluid resuscitation after traumatic shock. Surgery 135:662-670
48. McKinley BA, Marvin RG, Cocanour CS, Moore FA (2000)Tissue hemoglobin O2 saturation during resuscitation of traumatic shock monitored using near infrared spectrometry. J Trauma 48:637-642
49. Cairns CB, Moore FA, Haenel JB, Gallea BL, Ortner JP, Rose SJ, Moore EE (1997)Evidence for early supply independent mitochondrial dysfunction in patients developing multiple organ failure after trauma. J Trauma 42:532-536
50. Muellner T, Nikolic A, Schramm W, Vecsei V (1999)New instrument that uses near-infrared spec-troscopy for the monitoring of human muscle oxygenation. J Trauma 46:1082-1084
51. Arbabi S, Brundage SI, Gentilello LM (1999)Near-infrared spectroscopy: a potential method for continuous, transcutaneous monitoring for compartmental syndrome in critically injured patients. J Trauma 47:829-833
52. Giannotti G, Cohn SM, Brown M, Varela JE, McKenney MG, Wiseberg JA (2000)Utility of near-infrared spectroscopy in the diagnosis of lower extremity compartment syndrome. J Trauma 48:396-399
53. Girardis M, Rinaldi L, Busani S, Flore I, Mauro S, Pasetto A (2003)Muscle perfusion and oxygen consumption by near-infrared spectroscopy in septic-shock and non-septic-shock patients. Intensive Care Med 29:1173-1176
54. Groner W, Winkelman JW, Harris AG, Ince C, Bouma GJ, Messmer K, Nadeau RG (1999)Orthogonal polarization spectral imaging: a new method for study of the microcirculation. Nat Med 5:1209-1212
55. De Backer D, Dubois MJ, Creteur J, Vincent J-L. (2001)Effects of dobutamine on microcirculatory alterations in patients with septic shock. Intensive Care Med 27:S237
56. Spronk PE, Ince C, Gardien MJ, Mathura KR, Oudemans-van Straaten HM, Zandstra DF (2002)Nitroglycerin in septic shock after intravascular volume resuscitation. Lancet 360:1395-1396
57. De Backer D, Creteur J, Dubois MJ, Sakr Y, Vincent JL (2004)Microvascular alterations in patients with acute severe heart failure and cardiogenic shock. Am Heart J 147:91-99
58. Sakr Y, Dubois MJ, De Backer D, Creteur J, Vincent JL (2004)Persistent microcirculatory alterations are associated with organ failure and death in patients with septic shock. Crit Care Med 32:1825-1831
59. Jin X, Weil MH, Sun S, Tang W, Bisera J, Mason EJ (1998)Decreases in organ blood flows associated with increases in sublingual PCO2 during hemorrhagic shock. J Appl Physiol 85:2360-2364

44 Chapter 1
60. Schabauer AM, Rooke TW (1994)Cutaneous laser Doppler flowmetry: applications and findings. Mayo Clin Proc 69:564-574
61. Farkas K, Fabian E, Kolossvary E, Jarai Z, Farsang C (2003)Noninvasive assessment of endothelial dysfunction in essential hypertension: comparison of the forearm microvascular reactivity with flow-mediated dilatation of the brachial artery. Int J Angiol 12:224-228
62. Koller A, Kaley G (1990)Role of endothelium in reactive dilation of skeletal muscle arterioles. Am J Physiol 259:H1313-H1316
63. Morris SJ, Shore AC, Tooke JE (1995)Responses of the skin microcirculation to acetylcholine and sodium nitroprusside in patients with NIDDM. Diabetologia 38:1337-1344
64. Warren JB (1994)Nitric oxide and human skin blood flow responses to acetylcholine and ultravio-let light. FASEB J 8:247-251
65. Blaauw J, Graaff R, van Pampus MG, van Doormaal JJ, Smit AJ, Rakhorst G, Aarnoudse JG (2005)Abnormal endothelium-dependent microvascular reactivity in recently preeclamptic women. Obstet Gynecol 105:626-632
66. Hartl WH, Gunther B, Inthorn D, Heberer G (1988)Reactive hyperemia in patients with septic conditions. Surgery 103:440-444
67. Young JD, Cameron EM (1995)Dynamics of skin blood flow in human sepsis. Intensive Care Med 21:669-674
68. Sair M, Etherington PJ, Peter WC, Evans TW (2001)Tissue oxygenation and perfusion in patients with systemic sepsis. Crit Care Med 29:1343-1349
69. Mimoz O, Rauss A, Rekik N, Brun-Buisson C, Lemaire F, Brochard L (1994)Pulmonary artery cath-eterization in critically ill patients: a prospective analysis of outcome changes associated with catheter-prompted changes in therapy. Crit Care Med 22:573-579
70. Swan HJ, Ganz W, Forrester J, Marcus H, Diamond G, Chonette D (1970)Catheterization of the heart in man with use of a flow-directed balloon-tipped catheter. N Engl J Med 283:447-451
71. Feihl F, Perret C (1995)Right heart catheterization at bedside: a note of cautious optimism. Inten-sive Care Med 21:296-298
72. Hasibeder W, Haisjackl M, Sparr H, Klaunzer S, Horman C, Salak N, Germann R, Stronegger WJ, Hackl JM (1991)Factors influencing transcutaneous oxygen and carbon dioxide measurements in adult intensive care patients. Intensive Care Med 17:272-275
73. Carter B, Hochmann M, Osborne A, Nisbet A, Campbell N (1995)A comparison of two transcutane-ous monitors for the measurement of arterial PO2 and PCO2 in neonates. Anaesth Intensive Care 23:708-714
74. Phan CQ, Tremper KK, Lee SE, Barker SJ (1987)Noninvasive monitoring of carbon dioxide: a com-parison of the partial pressure of transcutaneous and end-tidal carbon dioxide with the partial pressure of arterial carbon dioxide. J Clin Monit 3:149-154
75. Tremper KK, Shoemaker WC (1981)Transcutaneous oxygen monitoring of critically ill adults, with and without low flow shock. Crit Care Med 9:706-709
76. Shoemaker WC, Wo CC, Bishop MH, Thangathurai D, Patil RS (1996)Noninvasive hemodynamic monitoring of critical patients in the emergency department. Acad Emerg Med 3:675-681
77. Tremper KK, Barker SJ (1987)Transcutaneous oxygen measurement: experimental studies and adult applications. Int Anesthesiol Clin 25:67-96
78. Reed RL, Maier RV, Landicho D, Kenny MA, Carrico CJ (1985)Correlation of hemodynamic variables with transcutaneous PO2 measurements in critically ill adult patients. J Trauma 25:1045-1053
79. Tremper KK, Shoemaker WC, Shippy CR, Nolan LS (1981)Transcutaneous PCO2 monitoring on adult patients in the ICU and the operating room. Crit Care Med 9:752-755

Non-invasive monitoring of peripheral perfusion 45
80. Waxman K, Sadler R, Eisner ME, Applebaum R, Tremper KK, Mason GR (1983)Transcutaneous oxygen monitoring of emergency department patients. Am J Surg 146:35-38
81. Tatevossian RG, Wo CC, Velmahos GC, Demetriades D, Shoemaker WC (2000)Transcutaneous oxygen and CO2 as early warning of tissue hypoxia and hemodynamic shock in critically ill emer-gency patients. Crit Care Med 28:2248-2253
82. Fiddian-Green RG, Baker S (1987)Predictive value of the stomach wall pH for complications after cardiac operations: comparison with other monitoring. Crit Care Med 15:153-156
83. De Backer D, Creteur J (2003)Regional hypoxia and partial pressure of carbon dioxide gradients: what is the link? Intensive Care Med 29:2116-2118
84. Nakagawa Y, Weil MH, Tang W, Sun S, Yamaguchi H, Jin X, Bisera J (1998)Sublingual capnometry for diagnosis and quantitation of circulatory shock. Am J Respir Crit Care Med 157:1838-1843
85. Povoas HP, Weil MH, Tang W, Moran B, Kamohara T, Bisera J (2000)Comparisons between sublin-gual and gastric tonometry during hemorrhagic shock. Chest 118:1127-1132
86. Rackow EC, O’Neil P, Astiz ME, Carpati CM (2001)Sublingual capnometry and indexes of tissue perfusion in patients with circulatory failure. Chest 120:1633-1638
87. Marik PE (2001)Sublingual capnography: a clinical validation study. Chest 120:923-927 88. Marik PE, Bankov A (2003)Sublingual capnometry versus traditional markers of tissue oxygen-
ation in critically ill patients. Crit Care Med 31:818-822 89. Weil MH, Nakagawa Y, Tang W, Sato Y, Ercoli F, Finegan R, Grayman G, Bisera J (1999)Sublingual
capnometry: a new noninvasive measurement for diagnosis and quantitation of severity of circulatory shock. Crit Care Med 27:1225-1229
90. Pernat A, Weil MH, Tang W, Yamaguchi H, Pernat AM, Sun S, Bisera J (1999)Effects of hyper- and hypoventilation on gastric and sublingual PCO(2). J Appl Physiol 87:933-937


Chapter 2Monitoring peripheral per fusion in cr it ical ly i l l patients at the bedside
Curr Opin Crit Care 2012; 18(3): 273-9
Michel E. van Genderen, Jasper van Bommell, Alexandre Lima

48 Chapter 2
AbSTrACT
Purpose of review
The goal of circulatory monitoring is the use of an accurate, continuous and noninvasive method that can easily assess tissue perfusion under clinical conditions. As peripheral tissues are sensitive to alterations in perfusion, the noninvasive monitoring of peripheral circulation could be used as an early marker of systemic haemodynamic derangement. We, therefore, aim to discuss the currently available methods that can be used at the bedside as well as the role of peripheral perfusion monitoring in critically ill patients.
recent findings
The deterioration of peripheral circulation has frequently been observed in critically ill patients with the use of subjective assessment and several optical techniques. In various patient categories, more severe and persistent alterations have been associated with worse outcomes, and these associations were independent of systemic haemodynamic parameters. Interventions aimed at systemic parameters have an unpredictable effect on peripheral circulation parameters, especially during hyperdynamic conditions. Thus, it appears that changes in peripheral perfusion reflect changes in regional vasomotor tone rather than systemic blood flow.
Summary
Subjective assessments and optical techniques provide important information regard-ing peripheral circulation. Moreover, these techniques are relatively easy to implement and interpret at the bedside and can be applied during acute conditions. Further re-search is warranted to investigate the effects of therapeutic interventions on peripheral perfusion parameters and patient outcome.
Monitoring peripheral perfusion at bedside 49
INTrOdUCTION
The conventional classification for the causes of haemodynamic instability discriminates between a lack of circulating volume, insufficient pump function, obstruction of blood flow and loss of blood flow regulation (1). Although corresponding treatment modali-ties have been established, selecting the correct method can be very difficult when a proper diagnosis cannot be made. Especially in patients with severe sepsis, a combina-tion of hypovolaemia, reduced ventricular function, and pronounced vasodilation can lead to inadequate tissue perfusion. Because each of these determinants can cause hypotension, monitoring of cardiac function and volume status is essential for selecting the proper therapy. However, regional tissue hypoperfusion may persist, despite the normalisation of systemic haemodynamics.
During circulatory shock, blood flow is diverted from less important tissues to vital organs (heart, brain and kidneys) to maintain vital organ perfusion at the cost of pe-ripheral circulation, resulting in poor outcome in various pathophysiologic conditions. Sympathetic activity, which is induced by the baroreceptor reflex as a response to systemic hypotension, leads to increased vasomotor tone. As sympathetic neuroactiv-ity predominates in the skin and muscle, the sympathetic neurohumoural response-induced vasoconstriction manifests primarily as decreased peripheral perfusion (2). Therefore the rationale of peripheral perfusion monitoring is based on the concept that peripheral tissues are the first to reflect hypoperfusion during shock, and the last to reperfuse during resuscitation (3).
It is well known that inadequate systemic circulation in both hypo- and hyperdynamic shock states can be accompanied by impaired peripheral circulation (4). These abnor-malities can be determined noninvasively using simple clinical assessments (5), skin temperature measurements (5), and optical monitoring devices (6;7). These ‘peripheral’ techniques each involve the use of ‘abnormal’ values, which are generally associated with worse outcome in critically ill patients, do not need an intravascular catheter, and can be used directly at the bedside without entry into the body through orifices or skin or mucosal tissue punctures (Table 1). In the following section, we will discuss the cur-rently available and commonly used techniques for assessing peripheral circulation in clinical conditions.

50 Chapter 2
ClINICAl ASSeSSMeNT Of PerIPHerAl PerfUSION
The cutaneous vascular bed plays an important role in the thermoregulation of the body, and this process can result in skin perfusion alterations that have direct effects on skin temperature and colour, i.e., a cold, clammy, white and mottled skin.
Capillary refill time
Capillary refill time (CRT) is defined as the time required for a distal capillary bed (i.e., the nailbed) to regain its colour after pressure has been applied to cause blanching. This concept was first introduced by Champion et al. in 1981 as a component of the international trauma severity score for the rapid and structured cardiopulmonary as-sessment of critically ill patients (8). Because CRT assessment is an easily applicable method in many circumstances, it is most useful for assessing peripheral perfusion and predicting unfavourable outcomes in both critically ill adult and paediatric patients.
Table 1. Different methods used to measure peripheral perfusion.
Method Variable Main advantage Main limitation Suggested cut-offs
Clinical assessment
Cold/warmDepends only on the physical examination;
valuable adjunctfor haemodynamic
monitoring in circulatory shock
Observer dependent. Digitalised
and perhaps automated
measurements may overcome this
limitation
Capillary refill time
>4.5 seconds,related to higher
morbidity and mortality
Mottle scoreMottling is widely
described and is an easily assessable clinical sign
The score cannot be used in patients with
black skin.
Score 4-5,related to survival
body temperature gradient
Forearm-to-fingerValidated method
for estimating microcirculatory skin
perfusion
Does not reflect peripheral perfusion
variations in real time
>4°C,related to higher
morbidity and mortality
Central-to-toe
>7°C,related to higher
morbidity and mortality
Optical monitoring
Peripheral perfusion index
Noninvasive approach to monitor the
haemodynamics of critically ill patients
Not accurate during patient motion
<1.4%,related to higher
morbidity and mortality
Near-infraredspectroscopy
Can easily be repeated and
can provide quantitative information on
microvascular function within a few minutes
Data are reported with different
devices, and the vascular
occlusion test is not standardised
<70% or 75%,related to higher
morbidity and mortality

Monitoring peripheral perfusion at bedside 51
For instance, in paediatric patients, Bohnborst et al. (9) showed that among several clinical signs present at the very first instance of suspected infection, a prolonged CRT demonstrated the most sensitive correlation with proven infection. In a recent review of clinical features that are used to confirm or exclude the possibility of serious infection in paediatric patients presented to ambulatory care, a prolonged CRT was shown to be one of the strongest indications of serious infection (10). In these patients, there may be alterations in the balance of vasoconstrictor and vasodilator substances and in the cross-talk between endothelial cells, which could result in impaired microvascular tissue blood flow regulation that is related to significant dehydration, serious infection, and severe organ dysfunction (11).
In a healthy adult population, Schriger et al. (12) reported that the upper limit of a normal CRT is 4.5 seconds. After applying this cutoff in critically ill patients, we demon-strated that a delayed return of normal colour (>4.5 seconds) can be regarded as de-creased peripheral perfusion. Moreover, we found that following initial haemodynamic optimisation during the first 24 hours of intensive care unit (ICU) admission, the CRT could be used to discriminate patients with more severe organ dysfunction. In addi-tion, a prolonged CRT (>4.5 seconds) was related to tissue hypoperfusion and a greater likelihood of worsening organ failure in the following days, compared to patients with a normal CRT (5;13). Although inter-observer variability remains a matter of debate, an upper normality limit of >4.5 seconds appears to be highly reproducible for critically ill patients admitted to the ICU (14).
Skin temperature
Skin temperature is best estimated using the dorsal surface of the hands or fingers of the medical examiner, as these areas are most sensitive to temperature perception. Patients are considered to have cool extremities if all examined extremities are considered cool by the examiner or if only the lower extremities are cool despite warm upper extremities in the absence of peripheral vascular occlusive disease (15). It has been demonstrated that subjectively determined variations in skin temperature correspond to objective measures of peripheral skin perfusion (13;16). Similarly, fingertip temperature estima-tions correlated well with objective assessments of fingertip blood flow (17). Accord-ingly, patients with a subjectively determined ‘abnormal’ peripheral perfusion following initial haemodynamic resuscitation have been associated with higher lactate levels and more severe organ dysfunction (5).
Mottling
Mottling of the skin is easily recognised and is often encountered in critically ill patients. It is defined as a bluish skin discoloration that typically manifests near the elbows or knees and has a distinct patchy pattern. Mottling is the result of heterogenic small vessel

52 Chapter 2
vasoconstriction and is thought to reflect abnormal skin perfusion. To analyse mottling objectively, Ait-Oufella et al. recently developed a clinical scoring system (from 0 to 5) based on the area of mottling from the knees to the periphery (Fig. 1) (18). This group reported that a higher mottling score within 6 hours after initial resuscitation was a strong predictive factor of 14-day mortality during septic shock, and this was indepen-dent of systemic haemodynamics. This scoring system is very easy to learn, has good inter-observer agreement, and can be used at the bedside.
From these studies, it is clear that the clinical assessment (Fig. 1) of peripheral perfu-sion is a valuable adjunct for the haemodynamic monitoring of critically ill patients and should be incorporated into future multimodal monitoring strategies to adequately monitor optimal circulatory shock resuscitation.
body temperature gradient
Although skin temperature has been shown to be an easily accessible parameter for circulatory shock severity (19), later research demonstrated that body temperature gradients can better reflect changes in cutaneous blood flow than the absolute skin temperature itself in critically ill patients (20;21). Body temperature gradients are determined by the temperature difference between two measurement points, such as
figure 1. Peripheral perfusion methods used in clinical practice. Different methods are used to measure peripheral perfusion, and these provide quantitative real-time information regarding peripheral circulation at the bedside.

Monitoring peripheral perfusion at bedside 53
peripheral-to-ambient, central-to-toe, and forearm-to-fingertip (Tskin-diff ). Increased vasoconstriction during circulatory shock leads to decreased skin temperature and a diminished ability of the core to regulate its temperature before hypothermia occurs. Consequently, core temperature is maintained at the cost of the periphery to maintain vital organ perfusion, resulting in an increased central-to-peripheral temperature dif-ference, when vasoconstriction decreases fingertip blood flow. This concept permits the establishment of central-to-toe temperature difference as an indicator of peripheral perfusion in critically ill patients, and a normal temperature gradient of 3 to 7°C occurs once the patient’s haemodynamics have been optimised (22). Because the effect of the operating room environment on skin and body temperature changes during surgery, especially with the use of cardiopulmonary bypass, Tskin-diff may be a more reliable measurement for critically ill patients (23). The use of Tskin-diff is based on assumption that the reference temperature is a skin site exposed to the same ambient temperature as the fingertip. A different ambient temperature, therefore, affects similarly forearm and fingertip temperature, producing little change in the gradient (Fig. 1). Experimental studies have suggested Tskin-diff thresholds of 0°C for initiating vasoconstriction and 4°C for severe vasoconstriction (24;25). In critically ill adult patients, Tskin-diff measure-ments conducted simultaneously with clinical observation have helped to address the reliability of subjective peripheral perfusion assessment, and are able to indicate abnormal peripheral perfusion in the post-resuscitation period (5).
OPTICAl MONITOrING
Optical methods apply light with different wavelengths directly to the tissue to assess various tissue states. There are several research techniques (described elsewhere; (26)) that apply optical methods to visualize the microcirculation, assess oxygen availability, measure PCO2, and assess microvascular function in different tissues. Commonly used optical methods in the clinical setting that are able to monitor peripheral perfusion at the bedside include finger photoplethysmography and NIRS. Although these techniques are particularly promising, as objective numerical information can be obtained within a couple of minutes, the interpretations should be considered in combination with the clinical examination and additional peripheral perfusion measurements (13).
Peripheral perfusion index
The peripheral perfusion index (PPI) is derived from the photoelectric plesthysmo-graphic signal of the pulse oximeter. Pulse oximetry, a standard of care in the ICU, al-lows for the measurement of arterial haemoglobin oxygen saturation and pulse rate monitoring. This noninvasive tool uses two wavelengths of light (red and infrared) that

54 Chapter 2
are transmitted through the distal phalanx of the index finger, resulting in the display of a pulsatile photoplethysmographic waveform. Analogous to an arterial pulse contour analysis, several variables can be derived from the plethysmographic waveform, such as the PPI (Fig. 1). The PPI is the ratio of the pulsatile part to the non-pulsatile part of the curve, expressed as a percentage. Because the size of the pulsatile portion increases with vasodilation and decreases with vasoconstriction, changes in the PPI reflect changes in peripheral vasomotor tone. This was first demonstrated in a model of axillary plexus-induced vasodilatation, and the analgesic effect of this nerve block could be predicted within minutes using the increase in PPI as a measure of concomitant peripheral va-sodilatation in patients undergoing hand surgery (27). Similarly, the PPI was shown to be rapidly reduced following sympathetic response-induced vasoconstriction after the introduction of a nociceptive skin stimulus (28) or an intravenous injection of epineph-rine (29) or norepinephrine (30). Furthermore, in a lower body negative pressure model, the PPI also rapidly decreased following sympathetic activation in healthy volunteers who underwent stepwise decreases in venous return (31).
In a large population of healthy volunteers, the median PPI value was 1.4 % (7). In critically ill patients, the same value was found to represent a very sensitive cutoff point for determining abnormal peripheral perfusion, as defined by a prolonged CRT and an increased skin temperature difference (5;7;32). Therefore, this easily obtainable and non-invasive method can be used for monitoring peripheral perfusion in critically ill patients.
Near-infrared spectroscopy
Near infrared spectroscopy (NIRS) is a noninvasive technique that enables the determi-nation of tissue oxygenation based on the spectro-photometric quantitation of oxy- and deoxyhaemoglobin within a tissue. Although this technique can be applied to any tis-sue, it is primarily used to monitor peripheral oxygenation of muscle tissue in critically ill patients. The variables that are analysed using NIRS can either be directly calculated or derived from physiological interventions, such as an arterial and venous vascular oc-clusion test (VOT). As a result, information regarding muscle oxygen saturation (StO2) and the absolute tissue haemoglobin index (THI), an indicator of blood volume in the microvasculature tissue region, can be obtained (33). In addition, changes in StO2 levels during a VOT have been used to represent microvascular reactivity (6;34-36). The utility of NIRS for managing critically ill patients remains a matter of debate. Increasing publications using NIRS have described profound alterations in microvascular function in patients suffering from different pathophysiological conditions, such as sepsis and traumatic shock (37-40). In a study by Shapiro et al., the dynamic NIRS variables col-lected during a VOT were strongly associated with the severity of organ dysfunction and mortality in patients with septic shock (41). In this study, the StO2 recovery slope was most sensitive for the prediction of mortality. This is of special interest because there

Monitoring peripheral perfusion at bedside 55
is a lack of agreement on standardisation for the appropriate method for performing a VOT (42;43). When measured at the thenar eminence, NIRS-derived measurements are influenced by the peripheral circulation condition (Fig. 1) (9;20). Nevertheless, when used in conjunction with other peripheral perfusion methods, repeated StO2 monitor-ing has the potential to assess the effect of therapeutic intervention on the peripheral microvascular circulation in various shock states. Similarly, Colin et al. (44) investigated the dynamic response of StO2 at different sites during the first 6 hours of severe sepsis resuscitation, and argued that StO2 values measured at the masseter muscle may better relate to patient outcome and may be a more powerful indicator for monitoring the effect of resuscitation, compared to measurements taken at the thenar eminence.
Although NIRS can potentially be very useful for tissue oxygenation and perfusion assessments, additional studies are still being conducted to clarify its role in the clinical management of ICU patients.
POTeNTIAl THerAPeUTIC INTerVeNTIONS TO reSUSCITATe PerIPHerAl PerfUSION
Although the relationship between systemic and peripheral circulation is not always well defined, the assessment of peripheral perfusion during peripheral cooling-induced vasoconstriction in healthy volunteers has shown that profound changes in the periph-eral circulation can occur independently of systemic haemodynamic parameters, such as blood pressure and cardiac output (32). Similar observations have been made during therapeutic hypothermia following cardiac arrest (45). In patients with severe sepsis, this discrepancy between systemic and peripheral circulation can become even larger; regional vasoconstriction appears to be independent of systemic blood flow in these patients (23). Considering that peripheral vasoconstriction during septic shock is an effect of increased sympathetic activity, the origin of the latter is unclear; it is likely that baroreceptor reflex activity, systemic inflammatory response and the loss of parasympa-thetic activity each may play a role (46;47).
Although the mechanism involved in sepsis resuscitation is not yet fully understood, it is clear that the persistence of impaired peripheral perfusion is associated with worse patient outcomes (5;6). It can be hypothesized that interventions specifically aimed at the peripheral vascular bed could resuscitate these alterations. For instance, based on the central-to-toe temperature, Boerma et al. showed that the administration of nitroglycerine to septic patients following early resuscitation significantly improved peripheral perfusion, independently of systemic haemodynamics (48). Although there was a trend to increasing mortality, this was accompanied by reduced morbidity in

56 Chapter 2
the nitroglycerine-treated patient group compared to the placebo group; as a result, vasodilatory agents may be promising treatment modalities.
Although fluid resuscitation is the first-line therapy for sepsis-induced hypoperfu-sion, few studies have evaluated its effect on peripheral perfusion. Futier et al. recently showed that the administration of a fluid challenge had positive effects on peripheral tissue oxygenation in patients undergoing major abdominal surgery (49).
Whether these interventions are capable of resuscitating different peripheral perfu-sion parameters is however still unknown. Current studies to determine the effects of these interventions on peripheral circulation in critically ill patients are ongoing.
CONClUSION
The rationale for monitoring peripheral perfusion is based on the concept that the pe-ripheral circulation is the first to reflect a disturbance of the circulation that may lead to shock. Monitoring peripheral circulation not only provides a different point of reference for patient circulation, but it also does not require invasive techniques and can be used directly at the bedside. Moreover, it is a simple approach that can be rapidly applied throughout the hospital, including the emergency department, operating room, wards and intensive care unit.

Monitoring peripheral perfusion at bedside 57
refereNCeS
(1) Weil MH, Shubin H. Proposed reclassification of shock states with special reference to distributive defects. Adv Exp Med Biol 1971 Oct;23(0):13-23.
(2) Lima A, Bakker J. Noninvasive monitoring of peripheral perfusion. Intensive Care Med 2005 Oct;31(10):1316-26.
(3) Poeze M, Solberg BC, Greve JW, Ramsay G. Monitoring global volume-related hemodynamic or regional variables after initial resuscitation: What is a better predictor of outcome in critically ill septic patients? Crit Care Med 2005 Nov;33(11):2494-500.
(4) Bonanno FG. Clinical pathology of the shock syndromes. J Emerg Trauma Shock 2011 Apr;4(2):233-43.
(5) Lima A, Jansen TC, van Bommel J, Ince C, Bakker J. The prognostic value of the subjective assess-ment of peripheral perfusion in critically ill patients. Crit Care Med 2009 Mar;37(3):934-8.
(6) Lima A, van Bommel J, Jansen TC, Ince C, Bakker J. Low tissue oxygen saturation at the end of early goal-directed therapy is associated with worse outcome in critically ill patients. Crit Care 2009;13 Suppl 5:S13.
(7) Lima AP, Beelen P, Bakker J. Use of a peripheral perfusion index derived from the pulse oximetry signal as a noninvasive indicator of perfusion. Crit Care Med 2002 Jun;30(6):1210-3.
(8) Champion HR, Sacco WJ, Carnazzo AJ, Copes W, Fouty WJ. Trauma score. Crit Care Med 1981 Sep;9(9):672-6.
(9) Bohnhorst B, Lange M, Bartels DB, Bejo L, Hoy L, Peter C. Procalcitonin and valuable clinical symptoms in the early detection of neonatal late-onset bacterial infection. Acta Paediatr 2012 Jan;101(1):19-25.
(10) Van den Bruel A, Haj-Hassan T, Thompson M, Buntinx F, Mant D. Diagnostic value of clinical fea-tures at presentation to identify serious infection in children in developed countries: a systematic review. Lancet 2010 Mar 6;375(9717):834-45.
(11) * Pickard A, Karlen W, Ansermino JM. Capillary refill time: is it still a useful clinical sign? Anesth Analg 2011 Jul;113(1):120-3. This concise and very remarkable review reports how to consistently quantify capillary refill time as a simple measure of peripheral perfusion and factors affecting this measurement when used as a clinical sign.
(12) Schriger DL, Baraff L. Defining normal capillary refill: variation with age, sex, and temperature. Ann Emerg Med 1988 Sep;17(9):932-5.
( 13) ** Lima A, van Bommel J, Sikorska K, van Genderen M, Klijn E, Lesaffre E, et al. The relation of near-infrared spectroscopy with changes in peripheral circulation in critically ill patients. Crit Care Med 2011 Jul;39(7):1649-54. The condition of peripheral circulation in critically ill patients strongly influences near-infrared spectroscopy-derived variables. Tissue oxygen saturation resting values and the tissue oxygen saturation reoxygenation rate but not the tissue oxygen saturation deoxy-genation rate were influenced by the peripheral circulation. These changes were independent of systemic hemodynamics.
(14) Lima A, van Genderen M, Boerstra T, Bakker J, van Bommel J. Is bedside clinical examination of capillary refill time reproducible in critically ill patients between different observers? A inter-rater variability study. Intensive Care Med. 37[Supplement 1], 215. 1-9-2011. Ref Type: Abstract
(15) De Backer D, Dubois MJ. Assessment of the microcirculatory flow in patients in the intensive care unit. Curr Opin Crit Care 2001 Jun;7(3):200-3.
58 Chapter 2
(16) Pearson J, Low DA, Stohr E, Kalsi K, Ali L, Barker H, et al. Hemodynamic responses to heat stress in the resting and exercising human leg: insight into the effect of temperature on skeletal muscle blood flow. Am J Physiol Regul Integr Comp Physiol 2011 Mar;300(3):R663-R673.
(17) Carrillo AE, Cheung SS, Flouris AD. A novel model to predict cutaneous finger blood flow via finger and rectal temperatures. Microcirculation 2011 Nov;18(8):670-6.
(18) * Ait-Oufella H, Lemoinne S, Boelle PY, Galbois A, Baudel JL, Lemant J, et al. Mottling score predicts survival in septic shock. Intensive Care Med 2011 May;37(5):801-7. The mottling score is repro-ducible and easy to evaluate at the bedside. The mottling score as well as its variation during resuscitation is a strong predictor of 14-day survival in patients with septic shock.
(19) Joly HR, Weil MH. Temperature of the great toe as an indication of the severity of shock. Circula-tion 1969 Jan;39(1):131-8.
(20) Akata T, Kanna T, Yoshino J, Higashi M, Fukui K, Takahashi S. Reliability of fingertip skin-surface temperature and its related thermal measures as indices of peripheral perfusion in the clinical setting of the operating theatre. Anaesth Intensive Care 2004 Aug;32(4):519-29.
(21) Rubinstein EH, Sessler DI. Skin-surface temperature gradients correlate with fingertip blood flow in humans. Anesthesiology 1990 Sep;73(3):541-5.
(22) Irwin R, Rippe J. Intensive care medicine. 7th ed. Lippincott Williams & Wilkins; 2011. (23) Boerma EC, Kuiper MA, Kingma WP, Egbers PH, Gerritsen RT, Ince C. Disparity between skin perfu-
sion and sublingual microcirculatory alterations in severe sepsis and septic shock: a prospective observational study. Intensive Care Med 2008 Jul;34(7):1294-8.
(24) House JR, Tipton MJ. Using skin temperature gradients or skin heat flux measurements to deter-mine thresholds of vasoconstriction and vasodilatation. Eur J Appl Physiol 2002 Nov;88(1-2):141-5.
(25) Sessler DI. Skin-temperature gradients are a validated measure of fingertip perfusion. Eur J Appl Physiol 2003 May;89(3-4):401-2.
(26) Sakr Y. Techniques to assess tissue oxygenation in the clinical setting. Transfus Apher Sci 2010 Aug;43(1):79-94.
(27) Galvin EM, Niehof S, Verbrugge SJ, Maissan I, Jahn A, Klein J, et al. Peripheral flow index is a reli-able and early indicator of regional block success. Anesth Analg 2006 Jul;103(1):239-43, table.
(28) Takeyama M, Matsunaga A, Kakihana Y, Masuda M, Kuniyoshi T, Kanmura Y. Impact of skin incision on the pleth variability index. J Clin Monit Comput 2011 Aug;25(4):215-21.
(29) Mowafi HA, Ismail SA, Shafi MA, Al-Ghamdi AA. The efficacy of perfusion index as an indicator for intravascular injection of epinephrine-containing epidural test dose in propofol-anesthetized adults. Anesth Analg 2009 Feb;108(2):549-53.
(30) Biais M, Cottenceau V, Petit L, Masson F, Cochard JF, Sztark F. Impact of norepinephrine on the relationship between pleth variability index and pulse pressure variations in ICU adult patients. Crit Care 2011;15(4):R168.
(31) Lima A, van Genderen M, Klijn E, Bartels SA, van Bommel J, Bakker J. Perfusion index as a predictor for central hypovolemia in humans. Crit Care 15(Suppl 1), P69. 11-3-2011. Ref Type: Abstract
(32) ** Lima A, van Genderen ME, Klijn E, Bakker J, van Bommel J. et al: Peripheral vasoconstriction influences thenar oxygen saturation as measured by near-infrared spectroscopy. Intensive Care Med 2012 Feb 14. Depending on the condition of peripheral circulation, significant decreases in peripheral blood flow can affect StO2-derived measurements. Therefore, careful consideration must be given when using NIRS to measure tissue oxygenation in critically ill patients, and consideration should be given to the peripheral circulation when interpreting peripheral tissue oxygenation.

Monitoring peripheral perfusion at bedside 59
(33) Bartels SA, Bezemer R, de Vries FJ, Milstein DM, Lima A, Cherpanath TG, et al. Multi-site and multi-depth near-infrared spectroscopy in a model of simulated (central)hypovolemia: lower body negative pressure. Intensive Care Med 2011 Apr;37(4):671-7.
(34) Doerschug KC, Delsing AS, Schmidt GA, Haynes WG. Impairments in microvascular reactivity are related to organ failure in human sepsis. Am J Physiol Heart Circ Physiol 2007 Aug;293(2):H1065-H1071.
(35) Gomez H, Torres A, Polanco P, Kim HK, Zenker S, Puyana JC, et al. Use of non-invasive NIRS during a vascular occlusion test to assess dynamic tissue O(2)saturation response. Intensive Care Med 2008 Sep;34(9):1600-7.
(36) Skarda DE, Mulier KE, Myers DE, Taylor JH, Beilman GJ. Dynamic near-infrared spectroscopy measurements in patients with severe sepsis. Shock 2007 Apr;27(4):348-53.
(37) De Blasi RA, Palmisani S, Alampi D, Mercieri M, Romano R, Collini S, et al. Microvascular dysfunc-tion and skeletal muscle oxygenation assessed by phase-modulation near-infrared spectroscopy in patients with septic shock. Intensive Care Med 2005 Dec;31(12):1661-8.
(38) Doerschug KC, Delsing AS, Schmidt GA, Haynes WG. Impairments in microvascular reactivity are related to organ failure in human sepsis. Am J Physiol Heart Circ Physiol 2007 Aug;293(2):H1065-H1071.
(39) Gomez H, Torres A, Polanco P, Kim HK, Zenker S, Puyana JC, et al. Use of non-invasive NIRS during a vascular occlusion test to assess dynamic tissue O(2)saturation response. Intensive Care Med 2008 Sep;34(9):1600-7.
(40) Skarda DE, Mulier KE, Myers DE, Taylor JH, Beilman GJ. Dynamic near-infrared spectroscopy measurements in patients with severe sepsis. Shock 2007 Apr;27(4):348-53.
(41) ** Shapiro NI, Arnold R, Sherwin R, O’Connor J, Najarro G, Singh S, et al. The association of near-infrared spectroscopy-derived tissue oxygenation measurements with sepsis syndromes, organ dysfunction and mortality in emergency department patients with sepsis. Crit Care 2011 Sep 22;15(5):R223. NIRS measurements for the StO2 initial, StO2 occlusion and StO2 recovery slope were abnormal in patients with septic shock compared to sepsis patients. The recovery slope was most strongly associated with organ dysfunction and mortality.
(42) Mayeur C, Campard S, Richard C, Teboul JL. Comparison of four different vascular occlusion tests for assessing reactive hyperemia using near-infrared spectroscopy. Crit Care Med 2011 Apr;39(4):695-701.
(43) * Damoisel C, Payen D. Vascular occlusion tests: do we need another definition? Crit Care Med 2011 Nov;39(11):2587-8. Editorial discussing that nicely represent the lack of disagreement regarding the ideal method for performing the vascular occlusion test.
(44) ** Colin G, Nardi O, Polito A, Aboab J, Maxime V, Clair B, et al. Masseter tissue oxygen saturation predicts normal central venous oxygen saturation during early goal-directed therapy and pre-dicts mortality in patients with severe sepsis. Crit Care Med 2011 Oct 20. StO2 measurements in 3 different sites (masseter, deltoid and thenar)during the first 6 hours of severe sepsis resuscitation compared to central venous oxygen saturation. The authors found that StO2 values measured on masseter muscle could better predict a central venous oxygen saturation >70% than thenar tissue oxygen. In addition, they showed that StO2 measured on either masseter or deltoid muscle were better predictors of 28-day mortality than StO2 measured on thenar, indicating that StO2 on masseter muscle may be a more powerful indicator of resuscitation strategy than measure-ments taken on thenar eminence.

60 Chapter 2
(45) van Genderen ME, Lima A, Akkerhuis M, Bakker J, van Bommel J. Persistent peripheral and micro-vascular perfusion alterations after out-of-hospital arrest are associated with poor survival. Crit Care Med 2012. In Press.
(46) Convertino VA, Ludwig DA, Cooke WH. Stroke volume and sympathetic responses to lower-body negative pressure reveal new insight into circulatory shock in humans. Auton Neurosci 2004 Apr 30;111(2):127-34.
(47) Cooke WH, Convertino VA. Association between vasovagal hypotension and low sympathetic neural activity during presyncope. Clin Auton Res 2002 Dec;12(6):483-6.
(48) ** Boerma EC, Koopmans M, Konijn A, Kaiferova K, Bakker AJ, van Roon EN, et al. Effects of nitroglycerin on sublingual microcirculatory blood flow in patients with severe sepsis/septic shock after a strict resuscitation protocol: a double-blind randomized placebo controlled trial. Crit Care Med 2010 Jan;38(1):93-100. In this randomized trial, a low-dose nitroglycerin improved central-to-toe temperature difference and thus peripheral perfusion independent of systemic haemodynamics. Of note, these patients had reduced morbidity compared to the placebo group.
(49) * Futier E, Christophe S, Robin E, Petit A, Pereira B, Desbordes J, et al. Use of near-infrared spec-troscopy during a vascular occlusion test to assess the microcirculatory response during fluid challenge. Crit Care 2011 Sep 16;15(5):R214. Hypovolaemia significantly affects the muscle StO2 recovery slope in patients undergoing major abdominal surgery. Volume expansion was able to improve tissue oxygenation despite apparently ineffective changes of systemic haemodynamics.


PArT bMethodological aspec ts


Chapter 3Use of a peripheral per fusion index derived f rom the pulse oximetr y signal as a non - invasive indicator of per fusion
Crit Care Med 2002, 30:1210-1213
Alexandre Lima, Peter Beelen, Jan Bakker

66 Chapter 3
AbSTrACT
Objective: Peripheral perfusion in critically ill patients frequently is assessed by use of clinical signs. Recently, the pulse oximetry signal has been suggested to reflect changes in peripheral perfusion. A peripheral perfusion index based on analysis of the pulse oximetry signal has been implemented in monitoring systems as an index of peripheral perfusion. No data on the variation of this index in the normal population are available, and clinical application of this variable in critically ill patients has not been reported. We therefore studied the variation of the peripheral perfusion index in healthy adults and related it to the central-to-toe temperature difference and capillary refill time in critically ill patients after changes in clinical signs of peripheral perfusion.
design: Prospective study.Setting: University-affiliated teaching hospital.Patients: One hundred eight healthy adult volunteers and 37 adult critically ill patients.Interventions: None.
Measurements and Main results: Capillary refill time, peripheral perfusion index, and arterial oxygen saturation were measured in healthy adults (group 1). Capillary refill time, peripheral perfusion index, arterial oxygen saturation, central-to-toe temperature difference, and hemo-dynamic variables were measured in critically ill patients (group 2) during different peripheral perfusion profiles. Poor peripheral perfusion was defined as a capillary refill time >2 secs and central-to-toe temperature difference >=7°C. Peripheral perfusion index and arterial oxygen saturation were measured by using the Philips Medical Systems Viridia/56S monitor. In group 1, measurements were made before and after a meal. In group 2, two measurements were made, with the second measurement taken when the peripheral perfusion profile had changed. A total of 216 measurements were carried out in group 1. The distribution of the peripheral per-fusion index was skewed and values ranged from 0.3 to 10.0, median 1.4 (inner quartile range, 0.7–3.0). Seventy-four measurements were carried out in group 2. A significant correlation be-tween the peripheral perfusion index and the core-to-toe temperature difference was found (R2= .52; p <0 .001). A cutoff peripheral perfusion index value of 1.4 (calculated by constructing a receiver operating characteristic curve) best reflected the presence of poor peripheral perfu-sion in critically ill patients. Changes in peripheral perfusion index and changes in core-to-toe temperature difference correlated significantly (R = .52, p <0 .001).
Conclusions: The peripheral perfusion index distribution in the normal population is highly skewed. Changes in the peripheral perfusion index reflect changes in the core-to-toe temperature difference. Therefore, peripheral perfusion index measurements can be used to monitor peripheral perfusion in critically ill patients.

Pulse oximeter signal as indicator of perfusion 67
INTrOdUCTION
Early recognition of impaired organ perfusion is important to avoid tissue hypoxia that ultimately could lead to organ failure. During circulatory shock, skin blood flow decreases to preserve vital organ perfusion. This results in the clinical signs of poor peripheral perfusion, such as a cold, pale, clammy, and mottled skin (1). Indexes of peripheral perfusion thus have been used to identify inadequate perfusion in critically ill patients (2–4). Peripheral perfusion can be assessed from clinical signs (1), from the central-to-toe temperature difference (2, 3, 5), or with techniques such as laser Doppler and capillary microscopy (6). Recently, the pulse oximetry signal has been suggested to reflect changes in peripheral perfusion (7). In addition, the ratio between the pulsatile and nonpulsatile component of the pulse oximetry signal has been related to peripheral perfusion (8). Because a pulse oximeter is universally available in the operating room and intensive care unit, this ratio could be used to monitor perfusion in these circumstances.
Although the manufacturer reports the lower and upper limit of normal to be 0.3 and 10.0, respectively, the variation in normal subjects and the clinical application of this ra-tio as an index of peripheral perfusion in critically ill patients have not yet been studied. The objective of the current study, therefore, was to assess the variation of this perfusion index in healthy adults and study the relationship between the peripheral perfusion index (PFI) and clinical signs of poor peripheral perfusion in critically ill patients.
MeTHOdS
Participants
The study was conducted at a university-affiliated teaching hospital. Group 1 consisted of 108 healthy adult volunteers (mean age, 30 ± 9 yrs). Group 2 consisted of 37 critically ill patients (mean age, 70 ± 13 yrs) admitted to the medical/surgical intensive care unit.
Measurements
Group 1. The measurements included capillary refill time, PFI, and arterial oxygen satu-ration (Spo2). We measured capillary refill time by applying firm pressure to the distal phalanx of the index finger for 5 secs and recording the time for return of the normal color by using a conventional wristwatch. PFI and Spo2 were measured by using the Viridia/56S monitor (Philips Medical Systems). The Viridia system calculates the PFI as the ratio between the pulsatile component and the nonpulsatile component of the light reaching the light-sensitive cell of the pulse oximetry probe.
Group 2. The measurements included PFI, Spo2, ambient temperature, central temper-ature, great toe temperature, finger temperature, capillary refill time, and hemodynamic

68 Chapter 3
variables including heart rate and mean arterial pressure. The central temperature was measured by using either a pulmonary artery catheter or a rectal probe. The peripheral temperature was measured on the ventral face of the great toe with a temperature probe (Philips Medical Systems 21078A). The finger temperature was measured simultaneously with the PFI measurement on the same finger by using a similar probe. The central-to-toe temperature difference was calculated, and a difference up to 7°C was considered normal (9). The doses of vasoactive drugs were recorded. Poor peripheral perfusion was defined as a capillary refill time >2 secs or a central-to-toe temperature difference >=7°C.
Protocol
To evaluate the variation of the PFI in healthy volunteers (group 1), measurements were taken in the hospital restaurant before and after their normal lunch after a 5- to 10-min rest. Volunteers were seated and instructed to keep their hands still on the table to avoid motion artifacts and to have the hands at the level of the heart. A question-naire was used to collect information about history of smoking and vascular disease (diabetes, hypertension). In group 2, two measurements were taken from each patient. The first measurement was taken when peripheral perfusion was abnormal; the second measurement was taken when the peripheral perfusion profile had normalized. Patients with central hypothermia (core temperature <36°C) and limb ischemia attributable to vascular occlusion were excluded.
Statistical Analysis
Data are presented as mean ± sd and medians with the 25th and 75th percentiles unless otherwise indicated. Differences between groups or within groups were assessed by using the Mann-Whitney test for nonparametric data. Pearson’s correlation index was calculated where applicable. We considered p < .05 to be statistically significant. Statisti-cal analyses were conducted with Statistical Package for the Social Sciences version 9.0 (SPSS, Chicago, IL).
Informed Consent
The Institutional Review Board waived the need for written informed consent from the healthy volunteers. Informed consent was obtained from the relatives of the patients.
reSUlTS
Group 1.
One hundred and eight healthy volunteers were included, and a total of 216 measure-ments were made. The distribution of age in the healthy volunteers was normal: skew-

Pulse oximeter signal as indicator of perfusion 69
ness, 0.06; median, 36 yrs (inner quartile range, 30–45 yrs). The distribution of PFI was skewed (Fig. 1, Table 1). Descriptive analysis showed no significant difference between variance and skewness of the measurements before and after the meal (Table 1). Also, no significant differences were found between smokers (n = 26) and nonsmokers (n = 82), as well as between volunteers with (n = 11) or without (n = 97) vascular disease (diabetes, hypertension). All volunteers had a normal capillary refill time and arterial oxygen saturation (96% to 100%).
Group 2.
A total of 74 measurements were carried out in the 37 patients studied. Descriptive statistics revealed a mean PFI of 2.2 ± 0.22 with a median of 1.8 (inner quartile range, 0.5–3.2). Table 2 summarizes hemodynamic data during abnormal peripheral perfusion
uration (SpO2). We measured capillary refilltime by applying firm pressure to the distalphalanx of the index finger for 5 secs andrecording the time for return of the normalcolor by using a conventional wristwatch. PFIand SpO2 were measured by using the Viridia/56S monitor (Philips Medical Systems). TheViridia system calculates the PFI as the ratiobetween the pulsatile component and the non-pulsatile component of the light reaching thelight-sensitive cell of the pulse oximetryprobe.
Group 2. The measurements included PFI,SpO2, ambient temperature, central tempera-ture, great toe temperature, finger tempera-ture, capillary refill time, and hemodynamicvariables including heart rate and mean arte-rial pressure. The central temperature wasmeasured by using either a pulmonary arterycatheter or a rectal probe. The peripheral tem-perature was measured on the ventral face ofthe great toe with a temperature probe (Phil-ips Medical Systems 21078A). The finger tem-perature was measured simultaneously withthe PFI measurement on the same finger byusing a similar probe. The central-to-toe tem-perature difference was calculated, and a dif-ference up to 7°C was considered normal (9).The doses of vasoactive drugs were recorded.Poor peripheral perfusion was defined as acapillary refill time �2 secs or a central-to-toetemperature difference �7°C.
Protocol
To evaluate the variation of the PFI inhealthy volunteers (group 1), measurementswere taken in the hospital restaurant before andafter their normal lunch after a 5- to 10-minrest. Volunteers were seated and instructed tokeep their hands still on the table to avoid mo-tion artifacts and to have the hands at the level ofthe heart. A questionnaire was used to collectinformation about history of smoking and vas-cular disease (diabetes, hypertension). In group2, two measurements were taken from each pa-tient. The first measurement was taken whenperipheral perfusion was abnormal; the secondmeasurement was taken when the peripheralperfusion profile had normalized. Patients withcentral hypothermia (core temperature �36°C)and limb ischemia attributable to vascular oc-clusion were excluded.
Statistical Analysis
Data are presented as mean � SD and me-dians with the 25th and 75th percentiles un-less otherwise indicated. Differences betweengroups or within groups were assessed by us-ing the Mann-Whitney test for nonparametricdata. Pearson’s correlation index was calcu-lated where applicable. We considered p � .05to be statistically significant. Statistical anal-yses were conducted with Statistical Packagefor the Social Sciences version 9.0 (SPSS, Chi-cago, IL).
Informed Consent
The Institutional Review Board waived theneed for written informed consent from thehealthy volunteers. Informed consent was ob-tained from the relatives of the patients.
RESULTS
Group 1. One hundred and eighthealthy volunteers were included, and atotal of 216 measurements were made.The distribution of age in the healthyvolunteers was normal: skewness, 0.06;median, 36 yrs (inner quartile range,
30–45 yrs). The distribution of PFI wasskewed (Fig. 1, Table 1).
Descriptive analysis showed no signifi-cant difference between variance and skew-ness of the measurements before and afterthe meal (Table 1). Also, no significant dif-ferences were found between smokers (n �26) and nonsmokers (n � 82), as well asbetween volunteers with (n � 11) or with-out (n � 97) vascular disease (diabetes,hypertension). All volunteers had a normalcapillary refill time and arterial oxygen sat-uration (96% to 100%).
Group 2. A total of 74 measurementswere carried out in the 37 patients stud-ied. Descriptive statistics revealed a meanPFI of 2.2 � 0.22 with a median of 1.8(inner quartile range, 0.5–3.2). Table 2summarizes hemodynamic data duringabnormal peripheral perfusion and nor-mal peripheral perfusion, as well as themean doses of vasoactive drugs. No sig-nificant relationship between core tem-perature and PFI or core-to-toe tempera-ture difference was found. A significantexponential relationship between PFI andthe core-to-toe temperature differencewas found (R2 � .52, p � .001; Fig. 2).
We found a significant linear correla-tion between changes in PFI and changesin the core-to-toe temperature difference(R2 � .52, p � .001; Fig. 3).
In all cases, a concordant change in
Figure 1. Frequency distribution of all 216 pe-ripheral perfusion index values in the normalvolunteers. Line represents normal distribution.
Table 1. Descriptive statistics of peripheral perfusion index (PFI) measurements in healthy volunteers(group 1)
PFIAll Measurements
(n � 216)Before Meal(n � 108)
After Meal(n � 108) p Value
Mean 2.2 � 2.0 2.2 � 2.0 2.2 � 1.9 NSMedian (IQR) 1.4 (0.7–3.0) 1.4 (0.6–3.2) 1.5 (0.8–2.8) NSP5–95 0.3–6.0 0.3–6.0 0.4–6.3Skewness 1.61 � 2.44 1.59 � 2.42 1.64 � 2.42 NSVariance 3.84 4.12 3.59 NS
IQR, inner quartile range; P5–95, 5th and 95th percentiles; NS, not significant.
Table 2. Hemodynamics, variables of peripheral perfusion, and vasoactive medication during abnormaland normal peripheral perfusion in the 37 patients
T1 T2 p
Core temperature, °C 37.5 � 0.2 37.5 � 0.1 NSHeart rate, bpm 92 � 3 91 � 3 NSMean arterial pressure, mm Hg 81 � 3 78 � 2 NSSpO2, % 97 � 1 96 � 0 NSCore-to-toe temperature difference, °C 9.0 � 0.45 4.9 � 0.3 �.001Perfusion index 0.7 � 0.1 3.6 � 0.3 �.001Dopamine, �g/kg�min 2.5 � 0.83 1.4 � 0.44 NSDobutamine, �g/kg�min 2.9 � 1.1 2.1 � 0.5 NSNoradrenaline, �g/kg�min 0.09 � 0.03 0.05 � 0.02 NS
T1, condition of abnormal peripheral perfusion; T2, condition of normal peripheral perfusion;SpO2, arterial oxygen saturation; NS, not significant.
1211Crit Care Med 2002 Vol. 30, No. 6
figure 1. Frequency distribution of all 216 peripheral perfusion index values in the normal volunteers. Line represents normal distribution
Table 1. Descriptive statistics of peripheral perfusion index (PFI) measurements in healthy volunteers (group 1)
IQR, inner quartile range; P5–95, 5th and 95th percentiles; NS, not significant.

70 Chapter 3
and normal peripheral perfusion, as well as the mean doses of vasoactive drugs. No significant relationship between core temperature and PFI or core-to-toe temperature difference was found. A significant exponential relationship between PFI and the core-to-toe temperature difference was found (R2= .52, p < .001;Fig. 2).
We found a significant linear correlation between changes in PFI and changes in the core-to-toe temperature difference (R2= .52, p < .001;Fig. 3). In all cases, a concordant change in PFI and core-to-toe temperature difference was found. No significant relation-ship was found between mean arterial pressures, dose of vasoactive agents, and PFI or between changes in these variables and changes in PFI.
Table 2. Hemodynamics, variables of peripheral perfusion, and vasoactive medication during abnormal and normal peripheral perfusion in the 37 patients
T1, condition of abnormal peripheral perfusion; T2, condition of normal peripheral perfusion; SpO2, arterial oxygen saturation; NS, not significant.
PFI and core-to-toe temperature differ-ence was found. No significant relation-ship was found between mean arterialpressures, dose of vasoactive agents, andPFI or between changes in these variablesand changes in PFI.
In 16 patients, cardiac output wasmeasured. No significant relationshipwas found between changes in cardiacoutput and changes in either core-to-toetemperature difference or PFI.
We assessed the ability of the PFI toindicate an abnormal peripheral perfusion,as reflected by an abnormal core-to-toetemperature difference by constructinga receiver operating characteristic curve. APFI of 1.4 discriminated best between anormal and abnormal core-to-toe temper-ature difference in these critically ill pa-tients (area under the curve, 0.91; 95%confidence interval, 0.84–0.98). Table 3 re-ports the corresponding sensitivity, speci-ficity, and likelihood ratios.
DISCUSSION
We studied whether a perfusion indexcalculated from the pulse oximetry sig-nal, and available on-line in some moni-toring systems, can reflect clinical signsof decreased peripheral perfusion (capil-lary refill time and central-to-toe temper-ature difference) in critically ill patients.Because no data were available on normalvalues for this perfusion index, we alsostudied the variation of this variable inhealthy individuals. We show that a PFIof 1.4 can be used to detect abnormalperipheral perfusion in critically ill pa-tients, corresponding with the medianvalue found in the healthy volunteers. Inaddition, changes in this perfusion indexadequately reflect changes in clinicalsigns of peripheral perfusion and thuscan be used to assess effect of therapeuticinterventions on peripheral perfusion.
During circulatory failure associatedwith hypovolemia and low cardiac out-put, redistribution of blood flow causedby increased vasoconstriction results indecreased perfusion of the skin (1).Therefore, in critically ill patients, skinperfusion frequently is used to assess ad-equacy of global blood flow. Clinical signsof poor skin perfusion consist of a cold,pale, clammy, and mottled skin. Recently,techniques have become available tomeasure perfusion of the skin. LaserDoppler flow measurements and capillarymicroscopy (6) can adequately quantifychanges in capillary blood flow but arenot readily available in the emergencydepartment or intensive care unit.
When blood supply to the skin de-creases, the temperature of the skin alsodecreases. Therefore, measurements of skintemperature have been used to indicate de-creases in skin blood flow as a marker ofvasoconstriction and poor oxygen delivery(3, 2). Also, peripheral skin temperaturehas been advocated as a marker of the se-verity of shock (4). In addition, becausevasoconstriction of the skin reduces bodyheat loss, the difference between the core
temperature and skin temperature may in-crease. The central-to-toe temperature dif-ference therefore has been used to diagnoseand treat patients with global blood flowabnormalities (3, 5). To have this parame-ter of peripheral perfusion available online,at least two temperature probes are neces-sary, and the skin temperature probeshould be carefully affixed. These require-ments may limit the use of these variablesin emergency situations and clinically un-stable patients.
Pulse oximetry is a monitoring tech-nique used in almost every trauma andcritically ill patient. Monitoring of pulseoximetry during surgery is mandatory inmany countries. The principle of thepulse oximetry is the difference in absor-bance of light with different wavelengths(660 and 940 nm) by oxygenated hemo-globin. Other tissues, such as connectivetissue, bone, and venous blood, also ab-sorb light and thus affect the resultingsignal. However, whereas the arterialcomponent of the signal is pulsatile, theabsorption of light by other tissues isfairly constant. So, to have a proper esti-mate of the arterial oxygen saturation ofthe hemoglobin, the pulse oximetry hasto distinguish the pulsatile componentfrom the nonpulsatile component, wherethe pulsatile component is used subse-quently to calculate the arterial oxygensaturation (10, 11). When the signal isweak, for example, during vasoconstric-tion, the pulse oximetry signal requiresamplification up to �109 (10). Althoughanalysis of the pulse oximeter waveformhas been used to assess the volume statusof patients during major surgery (7), theamplification necessary during a low sig-nal (vasoconstriction, hypovolemia)could limit its clinical application in crit-ically ill patients. The perfusion index,used in this study, is calculated as theratio between the pulsatile and the nonpul-satile component of the light reaching thedetector of the pulse oximeter. When pe-ripheral hypoperfusion exists, the pulsatile
Figure 2. Relationship between peripheral perfu-sion index (PFI) and core-to-toe temperature dif-ference in all 74 measurements in the 37 patientsstudied. Displayed is the best fit curve (logarith-mic) R2 � .52, p � .001. Reference lines are themedian PFI of healthy volunteers and the refer-ence for an abnormal core-to-toe temperaturedifference.
Figure 3. Relationship between changes in pe-ripheral perfusion index (PFI) and changes incore-to-toe temperature difference. Displayed arethe linear regression and the correlation coeffi-cient. dPerfusion index, PFI during abnormalperfusion � PFI during normal perfusion; dCore-Toe temperature, temperature difference duringabnormal perfusion � temperature differenceduring normal perfusion.
Table 3. Use of peripheral perfusion index (PFI) as a measure of abnormal core-to-toe (C-T) temper-ature difference, an abnormal capillary refill time, or either
C-T Refill Either
Sensitivity, % 81 84 86Specificity, % 86 88 100Likelyhood ratio after positive test 6.0 7.1 —Likelyhood ratio after negative test 0.19 0.18 0.14
Normal PFI was defined as a PFI � 1.4. Definition of abnormal C-T temperature difference andabnormal capillary refill time: see text.
1212 Crit Care Med 2002 Vol. 30, No. 6
figure 2. Relationship between peripheral perfusion index (PFI) and core-to-toe temperature difference in all 74 measurements in the 37 patients studied. Displayed is the best fit curve (logarithmic) R2= .52, p < .001. Reference lines are the median PFI of healthy volunteers and the reference for an abnormal core-to-toe temperature difference

Pulse oximeter signal as indicator of perfusion 71
In 16 patients, cardiac output was measured. No significant relationship was found between changes in cardiac output and changes in either core-to-toe temperature dif-ference or PFI.
We assessed the ability of the PFI to indicate an abnormal peripheral perfusion, as reflected by an abnormal core-to-toe temperature difference by constructing a receiver operating characteristic curve. A PFI of 1.4 discriminated best between a normal and abnormal core-to-toe temperature difference in these critically ill patients (area under the curve, 0.91; 95% confidence interval, 0.84–0.98). Table 3 reports the corresponding sensitivity, specificity, and likelihood ratios.
PFI and core-to-toe temperature differ-ence was found. No significant relation-ship was found between mean arterialpressures, dose of vasoactive agents, andPFI or between changes in these variablesand changes in PFI.
In 16 patients, cardiac output wasmeasured. No significant relationshipwas found between changes in cardiacoutput and changes in either core-to-toetemperature difference or PFI.
We assessed the ability of the PFI toindicate an abnormal peripheral perfusion,as reflected by an abnormal core-to-toetemperature difference by constructinga receiver operating characteristic curve. APFI of 1.4 discriminated best between anormal and abnormal core-to-toe temper-ature difference in these critically ill pa-tients (area under the curve, 0.91; 95%confidence interval, 0.84–0.98). Table 3 re-ports the corresponding sensitivity, speci-ficity, and likelihood ratios.
DISCUSSION
We studied whether a perfusion indexcalculated from the pulse oximetry sig-nal, and available on-line in some moni-toring systems, can reflect clinical signsof decreased peripheral perfusion (capil-lary refill time and central-to-toe temper-ature difference) in critically ill patients.Because no data were available on normalvalues for this perfusion index, we alsostudied the variation of this variable inhealthy individuals. We show that a PFIof 1.4 can be used to detect abnormalperipheral perfusion in critically ill pa-tients, corresponding with the medianvalue found in the healthy volunteers. Inaddition, changes in this perfusion indexadequately reflect changes in clinicalsigns of peripheral perfusion and thuscan be used to assess effect of therapeuticinterventions on peripheral perfusion.
During circulatory failure associatedwith hypovolemia and low cardiac out-put, redistribution of blood flow causedby increased vasoconstriction results indecreased perfusion of the skin (1).Therefore, in critically ill patients, skinperfusion frequently is used to assess ad-equacy of global blood flow. Clinical signsof poor skin perfusion consist of a cold,pale, clammy, and mottled skin. Recently,techniques have become available tomeasure perfusion of the skin. LaserDoppler flow measurements and capillarymicroscopy (6) can adequately quantifychanges in capillary blood flow but arenot readily available in the emergencydepartment or intensive care unit.
When blood supply to the skin de-creases, the temperature of the skin alsodecreases. Therefore, measurements of skintemperature have been used to indicate de-creases in skin blood flow as a marker ofvasoconstriction and poor oxygen delivery(3, 2). Also, peripheral skin temperaturehas been advocated as a marker of the se-verity of shock (4). In addition, becausevasoconstriction of the skin reduces bodyheat loss, the difference between the core
temperature and skin temperature may in-crease. The central-to-toe temperature dif-ference therefore has been used to diagnoseand treat patients with global blood flowabnormalities (3, 5). To have this parame-ter of peripheral perfusion available online,at least two temperature probes are neces-sary, and the skin temperature probeshould be carefully affixed. These require-ments may limit the use of these variablesin emergency situations and clinically un-stable patients.
Pulse oximetry is a monitoring tech-nique used in almost every trauma andcritically ill patient. Monitoring of pulseoximetry during surgery is mandatory inmany countries. The principle of thepulse oximetry is the difference in absor-bance of light with different wavelengths(660 and 940 nm) by oxygenated hemo-globin. Other tissues, such as connectivetissue, bone, and venous blood, also ab-sorb light and thus affect the resultingsignal. However, whereas the arterialcomponent of the signal is pulsatile, theabsorption of light by other tissues isfairly constant. So, to have a proper esti-mate of the arterial oxygen saturation ofthe hemoglobin, the pulse oximetry hasto distinguish the pulsatile componentfrom the nonpulsatile component, wherethe pulsatile component is used subse-quently to calculate the arterial oxygensaturation (10, 11). When the signal isweak, for example, during vasoconstric-tion, the pulse oximetry signal requiresamplification up to �109 (10). Althoughanalysis of the pulse oximeter waveformhas been used to assess the volume statusof patients during major surgery (7), theamplification necessary during a low sig-nal (vasoconstriction, hypovolemia)could limit its clinical application in crit-ically ill patients. The perfusion index,used in this study, is calculated as theratio between the pulsatile and the nonpul-satile component of the light reaching thedetector of the pulse oximeter. When pe-ripheral hypoperfusion exists, the pulsatile
Figure 2. Relationship between peripheral perfu-sion index (PFI) and core-to-toe temperature dif-ference in all 74 measurements in the 37 patientsstudied. Displayed is the best fit curve (logarith-mic) R2 � .52, p � .001. Reference lines are themedian PFI of healthy volunteers and the refer-ence for an abnormal core-to-toe temperaturedifference.
Figure 3. Relationship between changes in pe-ripheral perfusion index (PFI) and changes incore-to-toe temperature difference. Displayed arethe linear regression and the correlation coeffi-cient. dPerfusion index, PFI during abnormalperfusion � PFI during normal perfusion; dCore-Toe temperature, temperature difference duringabnormal perfusion � temperature differenceduring normal perfusion.
Table 3. Use of peripheral perfusion index (PFI) as a measure of abnormal core-to-toe (C-T) temper-ature difference, an abnormal capillary refill time, or either
C-T Refill Either
Sensitivity, % 81 84 86Specificity, % 86 88 100Likelyhood ratio after positive test 6.0 7.1 —Likelyhood ratio after negative test 0.19 0.18 0.14
Normal PFI was defined as a PFI � 1.4. Definition of abnormal C-T temperature difference andabnormal capillary refill time: see text.
1212 Crit Care Med 2002 Vol. 30, No. 6
figure 3. Relationship between changes in peripheral perfusion index (PFI) and changes in core-to-toe temperature difference. Displayed are the linear regression and the correlation coefficient. dPerfusion index, PFI during abnormal perfusion - PFI during normal perfusion;dCore-Toe temperature, temperature difference during abnormal perfusion - temperature difference during normal perfusion
Table 3. Use of peripheral perfusion index (PFI) as a measure of abnormal core-to-toe (C-T) temperature difference, an abnormal capillary refill time, or either
Normal PFI was defined as a PFI _ 1.4. Definition of abnormal C-T temperature difference and abnormal capillary refill time: see text.

72 Chapter 3
dISCUSSION
We studied whether a perfusion index calculated from the pulse oximetry signal, and available on-line in some monitoring systems, can reflect clinical signs of decreased peripheral perfusion (capillary refill time and central-to-toe temperature difference) in critically ill patients. Because no data were available on normal values for this per-fusion index, we also studied the variation of this variable in healthy individuals. We show that a PFI of 1.4 can be used to detect abnormal peripheral perfusion in critically ill patients, corresponding with the median value found in the healthy volunteers. In addition, changes in this perfusion index adequately reflect changes in clinical signs of peripheral perfusion and thus can be used to assess effect of therapeutic interventions on peripheral perfusion.
During circulatory failure associated with hypovolemia and low cardiac output, redistribution of blood flow caused by increased vasoconstriction results in decreased perfusion of the skin (1). Therefore, in critically ill patients, skin perfusion frequently is used to assess adequacy of global blood flow. Clinical signs of poor skin perfusion consist of a cold, pale, clammy, and mottled skin. Recently, techniques have become available to measure perfusion of the skin. Laser Doppler flow measurements and capil-lary microscopy (6) can adequately quantify changes in capillary blood flow but are not readily available in the emergency department or intensive care unit.
When blood supply to the skin decreases, the temperature of the skin also decreases. Therefore, measurements of skin temperature have been used to indicate decreases in skin blood flow as a marker of vasoconstriction and poor oxygen delivery (3, 2). Also, peripheral skin temperature has been advocated as a marker of the severity of shock (4). In addition, because vasoconstriction of the skin reduces body heat loss, the difference between the core temperature and skin temperature may increase. The central-to-toe temperature difference therefore has been used to diagnose and treat patients with global blood flow abnormalities (3, 5). To have this parameter of peripheral perfusion available online, at least two temperature probes are necessary, and the skin tempera-ture probe should be carefully affixed. These requirements may limit the use of these variables in emergency situations and clinically unstable patients.
Pulse oximetry is a monitoring technique used in almost every trauma and critically ill patient. Monitoring of pulse oximetry during surgery is mandatory in many coun-tries. The principle of the pulse oximetry is the difference in absorbance of light with different wavelengths (660 and 940 nm) by oxygenated hemoglobin. Other tissues, such as connective tissue, bone, and venous blood, also absorb light and thus affect the resulting signal. However, whereas the arterial component of the signal is pulsatile, the absorption of light by other tissues is fairly constant. So, to have a proper estimate of the arterial oxygen saturation of the hemoglobin, the pulse oximetry has to distinguish the
Pulse oximeter signal as indicator of perfusion 73
pulsatile component from the nonpulsatile component, where the pulsatile component is used subsequently to calculate the arterial oxygen saturation (10, 11). When the signal is weak, for example, during vasoconstriction, the pulse oximetry signal requires am-plification up to ×109 (10). Although analysis of the pulse oximeter waveform has been used to assess the volume status of patients during major surgery (7), the amplification necessary during a low signal (vasoconstriction, hypovolemia) could limit its clinical application in critically ill patients. The perfusion index, used in this study, is calculated as the ratio between the pulsatile and the nonpulsatile component of the light reaching the detector of the pulse oximeter. When peripheral hypoperfusion exists, the pulsatile component decreases, and because the nonpulsatile component does not change, the ratio decreases. Because the amplification necessary during the low signal affects both the pulsatile and nonpulsatile component, the ratio between these components is not affected. Although this variable has been incorporated in some monitoring systems as a parameter of peripheral perfusion, no data are available on the variation in the normal population. Also, no studies have been published on the relationship between the index and clinically used variables of peripheral perfusion in critically ill patients.
In the current study, we found a skewed and wide range of PFI values in healthy volunteers. We found no significant differences in the distribution of PFI values before or after a meal in this group of volunteers. Also, no differences were found between volunteers with or without chronic disease associated with vascular (or microvascular) abnormalities (e.g., hypertension, diabetes) or between smokers and nonsmokers. The variation in PFI was not related to differences in capillary refill times because these were all normal in the volunteers. Unfortunately, it was impossible to measure other indexes of peripheral perfusion, for example, the central-to-toe temperature difference in these volunteers.
By constructing a receiver operating characteristic, we found the median value of the healthy volunteers to be the best discriminating cutoff value to detect an abnormal core-to-toe temperature difference. This cutoff value also resulted in adequate predict-ability to detect an abnormal capillary refill time. Although this cutoff value suggests that 50% of the healthy volunteers had an abnormal peripheral perfusion, the two groups probably do not compare. Most of the critically ill patients were treated with vasoactive agents and were likely to have a disturbed regulation of peripheral circulation. Probably the cutoff value to detect abnormal peripheral circulation in the healthy volunteers is closer to the lower limit of normal reported by the manufacturer (0.3) representing the 5th percentile in our study. In addition, changes in clinical indicators of peripheral perfu-sion were met by concordant changes of the PFI in all patients.
Although poor peripheral perfusion often accompanies circulatory failure, the prac-tical application of these indexes and the relationship with central hemodynamics or tissue oxygenation are not well studied. Assessment of capillary refill time has been

74 Chapter 3
found difficult in emergency situations, whereas the application of toe temperature measurements is often very limited in emergency medicine (12). In adult cardiac surgery patients and patients with cardiogenic shock, a crude correlation between the central-to-toe temperature difference and cardiac output has been reported (13, 2). In pediatric patients, both capillary refill time and the central-to-toe temperature difference was not related to global hemodynamics or blood lactate concentrations (14). However, in general pediatric patients, most of whom had septic shock, these indexes of peripheral perfusion correlated significantly with global hemodynamics and blood lactate concen-trations (14). In contrast with this study, the central-to-toe temperature difference has been found of limited value in adult patients with septic shock (2). Also in our study, changes in cardiac output did not correlate with changes in clinical signs of poor periph-eral perfusion or the PFI. These different findings could be related to the heterogeneity in skin blood flow regulation during changes in global blood flow and associated sym-pathetic nerve activity (15). Nevertheless, improvements in peripheral perfusion after treatment are associated with improved outcome in patients with circulatory shock (16). The PFI represents an easily obtainable measure of peripheral perfusion and thus could be used to monitor the effect of therapy on peripheral perfusion in critically ill patients.
CONClUSION
Our results show that the PFI in normal populations has a highly skewed distribution. The best discriminating value to detect an abnormal peripheral perfusion in critically ill patients equals the median value of normal volunteers but nevertheless can adequately reflect the presence of clinical indicators of poor peripheral perfusion in critically ill pa-tients. Changes in these clinical indicators are reflected by changes in the PFI. Therefore, this easily obtainable and noninvasive method may have a role in monitoring peripheral perfusion in critically ill patients.
Pulse oximeter signal as indicator of perfusion 75
refereNCeS
1. Bond RF: A review of the skin and muscle hemodynamics during Hemorrhagic hypotension and shock. Adv Shock Res 1982; 8:53–70
2. Vincent JL, Moraine JJ, Van der Linden P: Toe temperature versus transcutaneous oxygen tension monitoring during acute circulatory failure. Intensive Care Med 1988; 14:64–68
3. Brock L, Skinner JM, Manders JT: Observations on peripheral and central temperatures with particular reference to the occurrence of vasoconstriction. Br J Surg 1975; 62:589–595
4. Joly HR, Weil MH: Temperature of the great toe as an indication of the severity of shock. Circula-tion 1969; 39:131–138
5. Kholoussy AM, Sufian S, Pavlides C, et al: Central peripheral temperature gradient. Its value and limitations in the management of critically ill surgical patients. Am J Surg 1980; 140:609–612
6. Carpentier PH: New techniques for clinical assessment of the peripheral microcirculation. Drugs 1999; 59: 17–22
7. Partridge BL: Use of pulse oximetry as a noninvasive indicator of Intravascular volume status. J Clin Monit 1987; 3:263–268
8. Hales JR, Stephens FR, Fawcett AA, et al: Observations on a new non-invasive monitor of skin blood flow. Clin Exp Pharmacol Physiol 1989; 16:403–415
9. Curley FJ, Smyrnios NA: Routine monitoring of critically ill patients. In: Intensive Care Medicine. Irwin RS, Cerra FB, Rippe JM (Eds). 1998, pp 250–270
10. Sinex JE: Pulse oximetry: Principles and limitations. Am J Emerg Med 1999; 17:59–67 11. Severinghaus JW: History and recent developments in pulse oximetry. Scand J Clin Lab Invest
Suppl 1993; 214:105–111 12. Champion HR, Sacco WJ, Copes WS, et al: A revision of the Trauma Score. J Trauma 1989; 29:623–
629 13. Bailey JM, Levy JH, Kopel MA, et al: Relationship between clinical evaluation of peripheral perfu-
sion and global hemodynamics in adults after cardiac surgery. Crit Care Med 1990; 18:1353–1356 14. Tibby SM, Hatherill M, Murdoch IA: Capillary refill and core-peripheral temperature gap as
indicators of haemodynamic status in paediatric intensive care patients. Arch Dis Child 1999; 80:163–166
15. Peters JK, Nishiyasu T, Mack GW: Reflex control of the cutaneous circulation during passive body core heating in humans. J Appl Physiol 2000; 88:1756–1764
16. Ruiz CE, Weil MH, Carlson RW: Treatment of circulatory shock with dopamine. Studies on survival. JAMA 1979; 242:165–168

Chapter 4Assessment of t issue ox ygen saturation during a vascular occlusion test using near- infrared spec troscopy: the role of probe spacing and measurement site studied in healthy volunteers
Crit Care 2009; 13 Suppl 5: S4
Rick Bezemer, Alexandre Lima, Dean Myers, Eva Klijn, Michal Heger, Peter T.
Goedhart, Jan Bakker, Can Ince

78 Chapter 4
AbSTrACT
Introduction: To assess potential metabolic and microcirculatory alterations in criti-cally ill patients, near-infrared spectroscopy (NIRS) has been used, in combination with a vascular occlusion test (VOT), for the non-invasive measurement of tissue oxygen saturation (StO2), oxygen consumption, and microvascular reperfusion and reactivity. The methodologies for assessing StO2 during a VOT, however, are very inconsistent in the literature and, consequently, results vary from study to study, making data compari-son difficult and potentially inadequate. Two major aspects concerning the inconsistent methodology are measurement site and probe spacing. To address these issues, we investigated the effects of probe spacing and measurement site using 15 mm and 25 mm probe spacings on the thenar and the forearm in healthy volunteers and quantified baseline, ischemic, reperfusion, and hyperemic VOT-derived StO2 variables.
Methods: StO2 was non-invasively measured in the forearm and thenar in eight healthy volunteers during 3-minute VOTs using two InSpectra tissue spectrometers equipped with a 15 mm probe or a 25 mm probe. VOT-derived StO2 traces were analyzed for base-line, ischemic, reperfusion, and hyperemic parameters. Data were categorized into four groups: 15 mm probe on the forearm (F15 mm), 25 mm probe on the forearm (F25 mm), 15 mm probe on the thenar (T15 mm), and 25 mm probe on the thenar (T25 mm).
results: Although not apparent at baseline, probe spacing and measurement site significantly influenced VOT-derived StO2 variables. For F15 mm, F25 mm, T15 mm, and T25 mm, StO2 ownslope was -6.4 ± 1.7%/minute, -10.0 ± 3.2%/minute, -12.5 ± 3.0%/minute, and -36.7 ± 4.6%/minute, respectively. StO2 upslope was 105 ± 34%/minute, 158 ± 55%/minute, 226 ± 41%/minute, and 713 ± 101%/minute, and the area under the hyperemic curve was 7.4 ± 3.8%·minute, 10.1 ± 4.9%·minute, 12.6 ± 4.4%·minute, and 21.2 ± 2.7%·minute in these groups, respectively. Furthermore, the StO2 parameters of the hyperemic phase of the VOT, such as the area under the curve, significantly cor-related to the minimum StO2 during ischemia.
Conclusions: NIRS measurements in combination with a VOT are measurement site-dependent and probe-dependent. Whether this dependence is anatomy-, physiology-, or perhaps technology-related remains to be elucidated. Our study also indicated that reactive hyperemia depends on the extent of ischemic insult.

Assessment of tissue oxygen saturation in healthy volunteers 79
INTrOdUCTION
It is now well established that tissue oxygen utilization and regional microcircula-tory oxygen transport properties are severely affected during sepsis and shock [1-9]. To assess and identify these metabolic and microcirculatory alterations non-invasively, near-infrared spectroscopy (NIRS) has recently been applied to measure the behavior of tissue oxygen saturation (StO2). Besides observation of steady-state values, a vascular occlusion test (VOT) has been introduced for the measurement of tissue oxygen con-sumption and of microvascular reperfusion and reactivity [9-14].
The VOT seems to be sensitive to the progress and outcome of sepsis in critical illness [9,12]. A large number of variables exist in the performance of this maneuver, however, yielding apparently conflicting results and uncertainty as to the significance of the vari-ous VOT-derived StO2 parameters [11]. The analysis, interpretation, and understanding of VOT-derived StO2 traces, although being widely employed in septic and trauma patients, is limited, especially for the post-occlusion phase of the VOT. Consequently, identification of which StO2 parameters are most appropriate for scoring (micro)vas-cular reperfusion and reactivity remains to be determined. Proper characterization of VOT-derived StO2 parameters in health is hence needed to allow translation of results obtained in patients to pathophysiological phenomena.
The main problem with the interpretation of StO2 data in the literature is the diver-sity of methodologies used for assessing StO2 during a VOT. Results vary from study to study, making data comparison and interpretation difficult and possibly inadequate. Two major aspects regarding the inconsistent methodology are the measurement site and probe spacing (that is, the spatial separation between the illumination and detec-tion fibers of the NIRS probe). The measurement site is important because differences may exist in the sensitivity of muscle groups and/or other anatomical structures to the VOT during health and/or pathophysiological conditions. Probe spacing, on the other hand, will determine the depth of measurement within the respective muscle group. To study the roles of both variables, we performed 3-minute VOTs in healthy volunteers and measured using 15 mm and StO2 25 mm probe spacings on the thenar and the forearm. VOT-derived StO2 traces were quantified for baseline, ischemic, reperfusion, and hyperemic StO2 parameters. We expect these results to provide an essential frame of reference for conducting StO2 measurements in future clinical studies.
MATerIAlS ANd MeTHOdS
Subjects
The study protocol was approved by the Medical Ethics Committee of the Erasmus Medi-cal Center Rotterdam. Eight healthy volunteers (Table 1) who were not receiving any

80 Chapter 4
vaso-active medication were requested to refrain from consuming caffeine-containing beverages prior to the experiments. The subjects were comfortably seated in the experi-mental room (mean ± standard deviation room temperature was 21 ± 1°C) 1 hour before measurements and were requested not to perform any physical labor (for example, lift-ing and writing).
Near-infrared spectroscopy
StO2 was continuously and non-invasively measured using two InSpectra tissue spec-trometers (Model 325; Hutchinson Technology, Hutchinson, MN, USA). The spectrom-eters use reflectance mode probes that have a 1.5 mm optical fiber to illuminate the tissue and a 0.4 mm optical fiber to collect the backscattered light from the tissue. Two types of probes were used for this study: one with 15 mm spacing between the illumina-tion and the collecting optical fibers, and one with 25 mm spacing. Both probes have been used in various studies with varying results [9-12].
The relative optical attenuation of the backscattered light at four wavelengths (680 nm, 720 nm, 760 nm, and 800 nm) is measured to calculate two second-derivative at-tenuation values, one centered at 720 nm and the other at 760 nm [15]. The ratio of the 720 nm to 760 nm second-derivative values is directly extrapolated to StO2, defined as
Table 1. Demographic characteristics of the studied subjects

Assessment of tissue oxygen saturation in healthy volunteers 81
[HbO2]/([Hb] + [HbO2]), via a calibration table. The calibration table relating StO2 to the second-derivative attenuation ratio is stored permanently within the NIRS device and is common to each device and probe used [15]. The NIRS devices were calibrated before the first measurement in each subject using a light-scatter calibrator.
Vascular occlusion test
One NIRS probe was placed on the skin of the thenar eminence and another NIRS probe was placed on the lateral side of the anterior surface of the forearm for simultaneous measurement of thenar StO2 and forearm StO2 during the VOTs. Both the hand and the forearm were kept at heart level with the palms up. The subjects were instructed not to move their hand or arm, or to change their sitting position during measurements.
Baseline arterial pressure was measured using a manual sphygmomanometer. After a 3-minute stabilization period (baseline measurement), stagnant ischemia was induced for 3 minutes by rapidly inflating a pneumatic cuff (within 5 seconds), placed around the upper arm, to 50 mmHg above systolic blood pressure. The cuff was subsequently deflated (within 1 second) and StO2 measurements were continued up to 5 minutes post ischemia.
StO2 curve characteristics
StO2 data from the two devices were continuously saved (one sample every 3.5 seconds) on two computers and were retrospectively analyzed using InSpectra Analysis V3.3 software (Hutchinson Technology). The VOT-derived StO2 traces were divided into four phases: baseline, ischemia, reperfusion, and hyperemia (Figure1).
The ischemic phase was analyzed for StO2 downslope (%/minute), minimum StO2 after 3 minutes of ischemia (%), and ΔStO2 (%; that is, the difference between baseline and minimum StO2). The StO2 downslope is generally considered to reflect muscle metabolism and the minimum StO2 is considered to indicate the extent of ischemia.
The reperfusion phase was analyzed for two parameters: upslope (%/minute) and rise time (minutes), both StO2 measured over the interval from minimum StO2 to baseline (Figure 1). Although these parameters are directly StO2 related (StO2 upslope = ΔStO2/Rise time), the StO2 upslope is metabolism-dependent as it is based on ΔStO2 after a fixed time of occlusion (that is, 3 minutes), while the rise time solely represents the time required to wash out the stagnantly deoxygenated blood by oxygenated arterial blood during reperfusion. These two parameters were therefore measured and analyzed separately.
The hyperemic phase of the VOT was analyzed for peak StO2 during reperfusion (%), for StO2 overshoot (that is, difference between peak StO2 and baseline StO2), for the area under the hyperemic curve (AUC; %·minute), and for the settling time from release of the cuff to recovery to baseline StO2 (minutes).

82 Chapter 4
Measurement protocol
Three measurement variables were investigated and compared for the assessment of VOT-derived StO2 parameters: dominant arm versus nondominant arm, forearm versus thenar, and superficial tissue versus deep tissue (as measured by the different probe spacings). For this purpose, four measurements were performed per subject: two on the dominant side and two on the nondominant side. Although good reproducibility of NIRS measurements during sequential VOTs has been demonstrated by Gómez and col-leagues [11], the side and probes were switched after every VOT. Additionally, to avoid any effect of starting conditions, the first measurement in four subjects was performed on the dominant side with the 15 mm probe on the forearm and the 25 mm probe on the thenar, whereas in the other four subjects the first measurement was performed on the nondominant side with the 15 mm probe on the thenar and the 25 mm probe on the forearm.
Statistical analysisFirst, differences between the dominant arm and the nondominant arm were analyzed
and data were subsequently categorized into four groups: 15 mm probe on the forearm (F15 mm), 25 mm probe on the forearm (F25 mm), 15 mm probe on the thenar (T15 mm), and 25 mm probe on the thenar (T25 mm). Statistical analysis was performed in
figure 1. Vascular occlusion test-derived tissue oxygen saturation phases and parameters. The vascular occlusion test-derived tissue oxygen saturation (StO2) traces were divided into four phases (baseline, ischemia, reperfusion, and hyperemia) and were analyzed for baseline StO2 (BSLN), StO2 downslope, minimum StO2, StO2 upslope, rise time, peak StO2, area under the hyperemic curve (AUC), and settling time.

Assessment of tissue oxygen saturation in healthy volunteers 83
GraphPad Prism software (GraphPad Software, San Diego, CA, USA). Normal distribution of the data within all groups (dominant, nondominant, F15 mm, F25 mm, T15 mm, and T25 mm) was confirmed for each StO2 parameter using the D’Agostino and Pearson omnibus normality test. Comparative analysis between groups was performed using analysis of variance with a Bonferroni post-hoc test. Correlation analysis was performed by Pearson’s analysis for normally distributed datasets. All data are presented as the mean ± standard deviation. Differences between groups with P < 0.05 were considered statistically significant.
reSUlTS
No differences between the dominant and nondominant sides were found and data could therefore be categorized into four groups: F15 mm, F25 mm, T15 mm, and T25 mm. Baseline StO2 was similar in all groups and independent of probe spacing and measurement site: 81 ± 10% for F15 mm, 85 ± 7% for F25 mm, 87 ± 4% for T15 mm, and 87 ± 3% for T25 mm. Occlusion of the upper arm by a pneumatic cuff resulted in an immediate decrease in StO2. Release of the occlusion after 3 minutes was followed by a rapid increase in StO2 and a StO2 overshoot relative to baseline. Less than 3 minutes post-ischemia, StO2 values were restored to baseline level.
Ischemic phase
The downslopes during ischemia were measured using linear regression analysis over the linear part (that is, R2 > 0.95) of the StO2 curve. For the first three groups (F15 mm, F25 mm, and T15 mm), the downslopes were linear over the entire 3-minute period of ischemia. The downslopes measured in the T25 mm group, in contrast, were linear over a time interval of 2.34 ± 0.38 minutes. For F15 mm, F25 mm, T15 mm, and T25 mm, StO2 down-slopes were -6.4 ± 1.7%/minute, -10.0 ± 3.2%/minute, -12.5 ± 3.0%/minute, and -36.7 ± 4.6%/minute, respectively (Figure 2). Hence, during 3 minutes of ischemia, StO2 decreased significantly (P < 0.001) by 20 ± 5%, 31 ± 11%, 38 ± 9%, and 84 ± 6% for F15 mm, F25 mm, T15 mm, and T25 mm, respectively, which resulted in a minimum StO2 of 60 ± 13%, 54 ± 16%, 49 ± 8%, and 3 ± 5% in these groups (Figure 2).
For all groups, minimum StO2 values were significantly lower than baseline values (P < 0.001). For the downslopes and ΔStO2 during ischemia, values for F15 mm differed significantly from values for F25 mm (P < 0.01), for T15 mm (P < 0.001), and for T25 mm (P < 0.001). The minimum StO2 was significantly higher in the F15 mm group with respect to T15 mm (P < 0.05) and to T25 mm (P < 0.001). No significant differences between F25 mm and T15 mm were found for these parameters. Downslopes, ΔStO2, measured in the
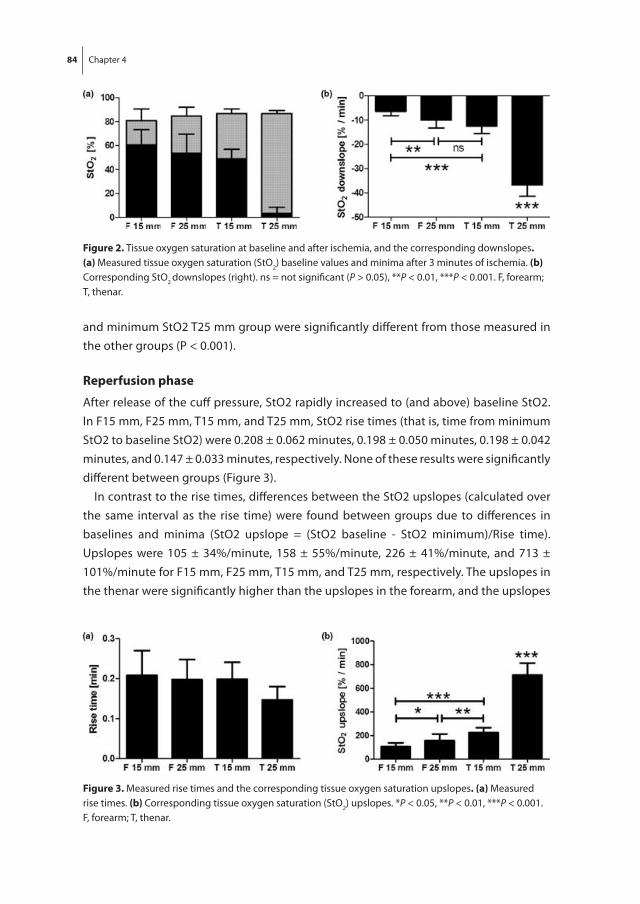
84 Chapter 4
and minimum StO2 T25 mm group were significantly different from those measured in the other groups (P < 0.001).
reperfusion phase
After release of the cuff pressure, StO2 rapidly increased to (and above) baseline StO2. In F15 mm, F25 mm, T15 mm, and T25 mm, StO2 rise times (that is, time from minimum StO2 to baseline StO2) were 0.208 ± 0.062 minutes, 0.198 ± 0.050 minutes, 0.198 ± 0.042 minutes, and 0.147 ± 0.033 minutes, respectively. None of these results were significantly different between groups (Figure 3).
In contrast to the rise times, differences between the StO2 upslopes (calculated over the same interval as the rise time) were found between groups due to differences in baselines and minima (StO2 upslope = (StO2 baseline - StO2 minimum)/Rise time). Upslopes were 105 ± 34%/minute, 158 ± 55%/minute, 226 ± 41%/minute, and 713 ± 101%/minute for F15 mm, F25 mm, T15 mm, and T25 mm, respectively. The upslopes in the thenar were significantly higher than the upslopes in the forearm, and the upslopes
figure 3. Measured rise times and the corresponding tissue oxygen saturation upslopes. (a) Measured rise times. (b) Corresponding tissue oxygen saturation (StO2) upslopes. *P < 0.05, **P < 0.01, ***P < 0.001. F, forearm; T, thenar.
figure 2. Tissue oxygen saturation at baseline and after ischemia, and the corresponding downslopes. (a) Measured tissue oxygen saturation (StO2) baseline values and minima after 3 minutes of ischemia. (b) Corresponding StO2 downslopes (right). ns = not significant (P > 0.05), **P < 0.01, ***P < 0.001. F, forearm; T, thenar.

Assessment of tissue oxygen saturation in healthy volunteers 85
measured with the 25 mm probe were significantly higher than those measured with the 15 mm probe (Figure 3).
Although the rise time and StO2 upslope both describe (micro)vascular reperfusion following ischemia, apparently these parameters are sensitive to different variables. Hence, where the rise time is similar for the forearm and the thenar and is independent of the applied probe, the StO2 upslope depends significantly on both the muscle and the probe type.
Hyperemic phase
Peak StO2 following release of the upper arm occlusion was 88 ± 7%, 93 ± 5%, 95 ± 3%, and 98 ± 0% for F15 mm, F25 mm, T15 mm, and T25 mm, respectively, Only the peak in the F15 mm group differed significantly from the thenar (P < 0.001 with respect to T15 mm and T25 mm). No significant differences were found for the StO2 overshoot (that is, peak StO2 - Baseline StO2): 6.9 ± 3.8%, 8.6 ± 3.7%, 8.7 ± 3.2%, and 11.3 ± 2.7% for F15 mm, F25 mm, T15 mm, and T25 mm, respectively.
The settling time, defined as the time required for the StO2 to completely restore to baseline (Figure 4), was 2.170 ± 0.511 minutes, 1.950 ± 0.475 minutes, 2.588 ± 0.306 minutes, and 2.755 ± 0.360 minutes for F15 mm, F25 mm, T15 mm, and T25 mm, respec-tively. No significant differences were found with respect to the probe spacing (that is, F15 mm versus F25 mm (P > 0.05) and T15 mm versus T25 mm (P > 0.05)), but significant differences existed between measurement sites (that is, F15 mm versus T15 mm and T25 mm (P < 0.05), and F25 mm versus T15 mm and T25 mm (P < 0.01).
The AUC was 7.4 ± 3.8%·minute, 10.1 ± 4.9%·minute, 12.6 ± 4.4%·minute, and 21.2 ± 2.7%·minute for F15 mm, F25 mm, T15 mm, and T25 mm, respectively (Figure 4). No significant differences were found between the 15 mm probe and the 25 mm probe on the forearm. Using the 15 mm probe, the AUC in the thenar was significantly higher (P < 0.01) than in the forearm. AUCs measured in the T25 mm group were significantly higher than those measured in the other groups (P < 0.001).
figure 4. Measured settling times and the corresponding areas under the hyperemic curves. (a) Measured settling times. (b) Corresponding areas under the curves. ns = not significant (P > 0.05), *P < 0.05, **P < 0.01, ***P < 0.001. F, forearm; T, thenar.

86 Chapter 4
Correlation analysis
To investigate the relationship between the extent of ischemia and the parameters of reperfusion and hyperemia, StO2 correlation analysis (Pearson’s analysis) was performed for minimum StO2 versus reperfusion parameters (StO2 upslope and rise time) and hy-peremic parameters (peak StO2, StO2 overshoot, AUC, and settling time) from combined data of F15 mm, F25 mm, and T15 mm. T25 mm data were excluded from the analysis because StO2 downslopes were not linear over the entire 3-minute period of ischemia, which would affect the consistency in the correlation analysis.
StO2 upslope correlated significantly with minimum StO2 (r = 0.81, P < 0.001), while the rise time did not (r = 0.12, P > 0.05). The peak StO2 (r = 0.3, P < 0.05), StO2 overshoot (r = 0.44, P < 0.001), and AUC (r = 0.45, P < 0.01) exhibited a weak positive correlation with minimum StO2, whereas a correlation was absent with respect to settling time (r = 0.16, P > 0.05).
To illustrate why the rise time and StO2 upslope behave differently in relation to the measurement site and probe spacing, two individual measurements are described in detail. One measurement was performed with the 15 mm probe on the forearm and the other with the 15 mm probe on the thenar, both with a baseline StO2 of 88%. The StO2 downslope during ischemia was -8%/minute in the forearm and -16%/minute in the thenar. This resulted in different StO2 minima for the two curves: 64% in the forearm and 40% in the thenar. After release of the occlusion, both curves restored back to their baseline level in 0.233 minutes. The rise times, and thus the reperfusion dynamics, for both curves were therefore equal. The StO2 upslopes, in contrast, were very different: 103%/minute in the forearm and 206%/minute in the thenar. This suggests that the StO2 upslope does not solely reflect post-ischemia reperfusion dynamics, but is also strongly influenced by the extent of StO2 decrease during ischemia.
dISCUSSION
The primary finding of this study was that, although not apparent at baseline, the probe spacing and measurement site significantly influenced VOT-derived StO2 variables. The upslope in the reperfusion phase of the VOT was StO2 shown to depend on the minimum StO2 after 3 minutes of ischemia, while the rise time was not. Furthermore, the StO2 parameters of the hyperemic phase of the VOT were shown to significantly correlate to the minimum StO2 value after 3 minutes of ischemia.
Among the investigations employing a NIRS device identical to the ones used in the present study, some studies have used 15 mm probe spacing [10,11,14] while others have used 25 mm probe spacing [9,12,16-18]. In healthy volunteers, all of these studies - including ours - have shown that baseline StO2 values were similar, independent of the applied probe. The VOT-derived StO2 variables as reported in the literature, however,

Assessment of tissue oxygen saturation in healthy volunteers 87
varied widely between the studies using a 15 mm probe and the studies using a 25 mm probe [9-12,14,16-18]. The values obtained in the present study are comparable to those obtained in the above-referenced studies. In the present study we quantitatively compared the VOT-derived StO2 variables obtained using both probes and confirmed the hypothesis that this difference in StO2 downslopes is indeed caused by the use of different probe spacings. In the thenar, the 15 mm probe provided a longer time in-terval of linear StO2 decay during ischemia than the 25 mm probe, which could make the estimation of the ischemic insult and muscle metabolism inaccurate and possibly inadequate when using the 25 mm probe.
The potential mechanisms by which the VOT-derived StO2 traces might be different when measured by the 15 mm or 25 mm probes could be anatomy-related, physiology-related, or even technology-related. It is well established that muscle cells consume much more oxygen per unit time compared with skin and adipose tissue. Additionally, if the ischemic stimulus is more extensive in the muscle compared to the more superficial layer of (sub)dermal tissue, the reactive hyperemia is probably also of a larger extent in the deeper, muscular, layer. In this light, the probe dependence, and thus the mea-surement depth dependence, of the StO2 downslope and hyperemic parameters could therefore be explained by variable relative contributions of (sub)dermal tissue and muscular tissue to the NIRS signal for the different probing depths. Another option that might explain the probe dependence of the StO2 traces, however, is that the number of photons that reach the detection fiber of the NIRS probe decreases with increasing probe spacing, which, in turn, could decrease the accuracy of the StO2 calculation. This could be especially true at low microcirculatory oxygenation, as occurs during ischemia, where the optical absorbance of blood is much higher compared to at high oxygen-ation. This, however, is purely suggestive and no evidential data are present to support this speculation.
In the present article we provide a frame of reference for comparison of data mea-sured in the thenar and forearm using the 15 mm probe and the 25 mm probe for a very broad spectrum of VOT-derived StO2 parameters; that is, baseline parameters, ischemic parameters, reperfusion parameters, and hyperemic parameters.
An important conceptual issue that is addressed in the present study is the difference between StO2 upslope and the rise time in the reperfusion phase of the VOT. First, it was shown that StO2 upslopes were different between the experimental groups while rise times were similar in these groups. Second, the correlation analysis performed on the minimum StO2 values after 3 minutes of ischemia versus the StO2 upslopes and rise times showed that the StO2 upslope correlated significantly with the minimum StO2 while the rise time did not. From a physiological point of view, the rise time represents the time it takes to wash out (or replace) the stagnantly deoxygenated blood in the measurement volume of the NIRS probe by oxygenated arterial blood. The StO2 upslope, on the other

88 Chapter 4
hand, has no single physiological meaning as it is the product of multiple variables, such as the baseline StO2, minimum StO2, and rise time. Hence, the use of rise time seems to be a more representative measure of (micro)vascular reperfusion than StO2 upslope.
Another pertinent result from the correlation analysis was the significant positive correlation between the hyperemic parameters and the minimum StO2, indicating that the extent of hyperemia is related to the extent of ischemia. This suggests that the use of a target or threshold StO2 might be more appropriate for standardization of the hyperemic phase of the VOT. After 3 minutes of ischemia, however, StO2 decreased to a minimum of 60% in the forearm and 49% in the thenar when one uses the 15 mm probe and to 54% in the forearm and 1% in the thenar if one uses the 25 mm probe. The probe type should therefore be taken into account when one uses a defined StO2 threshold value of 30 or 40%. Moreover, the occlusion time might exceed 3 minutes when using the 15 mm probe, which could be uncomfortable for the studied subject.
Conclusively, the data from this study support the hypothesis that the NIRS mea-surements in combination with a VOT are measurement site-dependent and probe-dependent. The present study showed that the use of upslope is StO2 sensitive to the minimum StO2 after 3 minutes of ischemia and does not solely reflect the (micro)vascular reperfusion rate. Although the rise time seems a better measure for (micro)vascular reperfusion following ischemia, this study could not determine whether the use of the rise time can distinguish healthy (micro)vasculature from nonhealthy (micro)vasculature. Our study also indicated that reactive hyperemia depends on the extent of ischemic insult and supports the use of a target StO2 over the use of a fixed time of occlusion for a metabolism-independent analysis of (micro)vascular reactivity, whereby the type of probe should be taken into account. Whether the observed measurement site dependence and probe dependence is anatomy-related, physiology-related, or perhaps technology-related remains to be elucidated.
Abbreviations
NIRS: near-infrared spectroscopy; StO2: tissue oxygen saturation; VOT: vascular occlu-sion test.
Competing interests
The NIRS devices were provided by Hutchinson Technologies.
Acknowledgements
This article is part of Critical Care Volume 13 Supplement 5: Tissue oxygenation (StO2) in healthy volunteers and critically-ill patients. The full contents of the supplement are available online at http://ccforum.com/supplements/13/S5. Publication of the supple-ment has been supported with funding from Hutchinson Technology Inc.

Assessment of tissue oxygen saturation in healthy volunteers 89
refereNCeS
1. Fink MP: Cytopathic hypoxia. Mitochondrial dysfunction as mechanism contributing to organ dysfunction in sepsis. Crit Care Clin 2001, 17:219-237.
2. Boerma EC, Mathura KR, van der Voort PH, Spronk PE, Ince C: Quantifying bedside-derived imag-ing of microcirculatory abnormalities in septic patients: a prospective validation study. Crit Care 2005, 9:R601-606.
3. Ince C, Sinaasappel M: Microcirculatory oxygenation and shunting in sepsis and shock. Crit Care Med 1999, 27:1369-1377.
4. Ince C: The microcirculation is the motor of sepsis. Crit Care 2005, 9(Suppl 4):S13-S19. 5. De Backer D, Creteur J, Preiser JC, Dubois MJ, Vincent JL: Microvascular blood flow is altered in
patients with sepsis. Am J Respir Crit Care Med 2002, 166:98-104. 6. Astiz ME, DeGent GE, Lin RY, Rackow EC: Microvascular function and rheologic changes in hyper-
dynamic sepsis. Crit Care Med 1995, 23:265-71. 7. Kirschenbaum LA, Astiz ME, Rackow EC, Saha DC, Lin R: Microvascular response in patients with
cardiogenic shock. Crit Care Med 2000, 28:1290-1294. 8. Trzeciak S, McCoy JV, Phillip Dellinger R, Arnold RC, Rizzuto M, Abate NL, Shapiro NI, Parrillo
JE, Hollenberg SM, Microcirculatory Alterations in Resuscitation and Shock Investigators: Early increases in microcirculatory perfusion during protocoldirected resuscitation are associated with reduced multiorgan failure at 24 h in patients with sepsis. Intensive Care Med 2008, 34:2210-2217.
9. Creteur J, Carollo T, Soldati G, Buchele G, De Backer D, Vincent JL: The prognostic value of muscle StO2 in septic patients. Intensive Care Med 2007, 33:1549-1556.
10. Skarda DE, Mulier KE, Myers DE, Taylor JH, Beilman GJ: Dynamic near-infrared spectroscopy measurements in patients with severe sepsis. Shock 2007, 27:348-353.
11. Gómez H, Torres A, Polanco P, Kim HK, Zenker S, Puyana JC, Pinsky MR: Use of non-invasive NIRS during a vascular occlusion test to assess dynamic tissue O2 saturation response. Intensive Care Med 2008, 34:1600-1607.
12. Pareznik R, Knezevic R, Voga G, Podbregar M: Changes in muscle tissue oxygenation during stagnant ischemia in septic patients. Intensive Care Med 2006, 32:87-92.
13. De Blasi RA, Palmisani S, Alampi D, Mercieri M, Romano R, Collini S, Pinto G: Microvascular dysfunc-tion and skeletal muscle oxygenation assessed by phase-modulation near-infrared spectroscopy in patients with septic shock. Intensive Care Med 2005, 31:1661-1668.
14. Doerschug KC, Delsing AS, Schmidt GA, Haynes WG: Impairments in microvascular reactivity are related to organ failure in human sepsis. Am J Physiol Heart Circ Physiol 2007, 293:H1065-H1071.
15. Myers DE, Anderson LD, Seifert RP, Ortner JP, Cooper CE, Beilman GJ, Mowlem JD: Noninvasive method for measuring local hemoglobin oxygen saturation in tissue using wide gap second derivative near-infrared spectroscopy. J Biomed Opt 2005, 10:034017.
16. Strahovnik I, Podbregar M: Measurement of skeletal muscle tissue oxygenation in the critically ill. Signa Vitae 2008, 3:43-50.
17. Nanas S, Gerovasili V, Dimopoulos S, Pierrakos C, Kourtidou S, Kaldara E, Sarafoglou S, Venet-sanakos J, Roussos C, Nanas J, Anastasiou-Nana M: Inotropic agents improve the peripheral microcirculation of patients with end-stage chronic heart failure. J Card Fail 2008, 14:400-406.
18. Siafaka A, Angelopoulos E, Kritikos K, Poriazi M, Basios N, Gerovasili V, Andreou A, Roussos C, Nanas S: Acute effects of smoking on skeletal muscle microcirculation monitored by near-infrared spectroscopy. Chest 2007, 131:1479-1485.


Chapter 5Peripheral vasoconstr ic tion inf luences thenar ox ygen saturation measured by nearinfrared spec troscopy
Intensive Care Med 2012, 38(4): 606-11
Alexandre Lima, Michel E. van Genderen, Eva Klijn, Jan Bakker, Jasper van
Bommel


Chapter 5aLet ter to the editor : Near infrared spec troscopy
Crit Care Med 2009 Jan; 37(1): 384-385
Can Ince, Rick Bezemer, Alexandre Lima

94 Chapter 5a
AbSTrACT
Purpose
Near-infrared spectroscopy has been used as a noninvasive monitoring tool for tissue oxygen saturation (StO2) in acutely ill patients. This study aimed to investigate whether local vasoconstriction induced by body surface cooling significantly influences thenar StO2 as measured by InSpectra model 650.
Methods
Eight healthy individuals (age 26 ± 6 years) participated in the study. Using a cooling blanket, we aimed to cool the entire body surface to induce vasoconstriction in the skin without any changes in central temperature. Thenar StO2 was noninvasively mea-sured during a 3-min vascular occlusion test using InSpectra model 650 with a 15-mm probe. Measurements were analyzed for resting StO2 values, rate of StO2 desaturation (RdecStO2, %/min), and rate of StO2 recovery (RincStO2, %/s) before, during, and after skin cooling. Measurements also included heart rate (HR), mean arterial pressure (MAP), cardiac output (CO), stroke volume (SV), capillary refill time (CRT), forearm-to-fingertip skin-temperature gradient (Tskin-diff ), perfusion index (PI), and tissue hemoglobin index (THI).
results
In all subjects MAP, CO, SV, and core temperature did not change during the proce-dure. Skin cooling resulted in a significant decrease in StO2 from 82% (80–87) to 72% (70–77) (P < 0.05) and in RincStO2 from 3.0%/s (2.8–3.3) to 1.7%/s (1.1–2.0) (P < 0.05). Similar changes in CRT, Tskin-diff, and PI were also observed: from 2.5 s (2.0–3.0) to 8.5 s (7.2–11.0) (P < 0.05), from 1.0°C (−1.6–1.8) to 3.1°C (1.8–4.3) (P < 0.05), and from 10.0% (9.1–11.7) to 2.5% (2.0–3.8), respectively. The THI values did not change significantly.
Conclusion
Peripheral vasoconstriction due to body surface cooling could significantly influence noninvasive measurements of thenar StO2 using InSpectra model 650 with 15-mm probe spacing.

Near infrared spectroscopy 95
INTrOdUCTION
Near-infrared spectroscopy (NIRS) is a noninvasive technique that allows the determi-nation of tissue oxygenation based on spectrophotometric quantitation of oxy- and deoxyhemoglobin levels within a tissue. Since its advent as a noninvasive monitoring tool for peripheral tissue oxygenation, a relationship between the potential influences of skin circulation on tissue oxygen saturation (StO2) signals has been debated. Numer-ous studies have investigated different NIRS devices in various tissues and under various experimental conditions [1–4]. These studies indicate that the StO2 signal is widely influenced by the volume of the vascular bed in the catchment area of the probe. Cur-rent clinical NIRS studies, particularly those performed in an intensive care setting seem to neglect this relationship when monitoring peripheral tissue oxygenation. One of the reasons may be the lack of studies that address the influence of thenar skin circulation on StO2 signal as measured with the most current commercial device available (InSpec-tra model 650).
We recently reported in an observational study that abnormalities in skin perfusion contribute significantly to the StO2-derived signal measured with an InSpectra model 650 probe on the thenar, and this correlation was independent of disease condition or systemic hemodynamics [5]. The question that remains is how important is the potential contribution of low skin blood flow, specifically of the thenar eminence, on StO2? To answer this question, we performed StO2-derived tissue oxygenation measurements during local vasoconstriction induced by extremity cooling. We hypothesize that the decrease in skin blood flow resulting from peripheral vasoconstriction during body surface cooling significantly influences the noninvasive measurement of thenar StO2 using an InSpectra model 650 with 15-mm probe spacing.
MATerIAlS ANd MeTHOdS
Study population
The study was conducted at a university-affiliated teaching hospital. We recruited healthy volunteers with no history of receiving any vasoactive medication. The volunteers were instructed to avoid caffeine-containing drinks for 24 h before the experiments. The local medical ethics committee approved this study protocol.
Measurements
StO2-derived tissue oxygenation. StO2-derived tissue oxygenation was continuously monitored using an InSpectra tissue spectrometer model 650 with a 15-mm probe over the thenar eminence. A vascular occlusion test (VOT) was performed by arrest of fore-

96 Chapter 5a
arm blood flow using a conventional sphygmomanometer pneumatic cuff. The cuff was placed around the upper arm and was inflated to a pressure approximately 30 mmHg greater than patient systolic pressure for 3 min. On the completion of the ischemic pe-riod, the occluding cuff was rapidly deflated to 0 mmHg. VOT-derived StO2 parameters were divided into three components: resting StO2 values, rate of StO2 desaturation (RdecStO2, expressed as %/min), and rate of StO2 recovery (RincStO2, expressed as %/s).
Peripheral perfusion. Peripheral perfusion was evaluated using conventional physical examination with capillary refill time (CRT), forearm-to-fingertip skin-temperature gradient (Tskin-diff ), perfusion index (PI), and tissue hemoglobin index (THI). CRT was measured by applying firm pressure to the distal phalanx of the index finger for 15 s. A chronometer recorded the time for the return of the normal color. The Tskin-diff was ob-tained with two skin probes (Hewlett Packard 21078A) attached to the index finger and on the radial side of the forearm, midway between the elbow and the wrist. Tskin-diff can better reflect changes in cutaneous blood flow than skin temperature itself. When being evaluated under constant environmental conditions, Tskin-diff increases during vasoconstriction, and a threshold of 4°C has been shown to reflect vasoconstriction in critically ill patients [6]. The PI provides a noninvasive method for evaluating perfusion and has been shown to reflect changes in peripheral perfusion [7]. In this study, the PI value was obtained using Masimo pulse oximetry, which displays a range from 0.02% (very weak pulse strength) to 20% (very strong pulse strength). The THI was derived from a second-derivative attenuation spectrum and is part of the StO2 algorithm of the NIRS monitor.
Global hemodynamic parameters. Global hemodynamic parameters included heart rate (HR), stroke volume (SV), cardiac output (CO), and mean arterial pressure (MAP). Global parameters were recorded using thoracic bioimpedance, as measured by a noninvasive cardiac output monitor (NICOM; Cheetah Medical Inc., Wilmington, DE, USA). The NICOM system and technology have been described elsewhere [8]. In summary, connecting the NICOM to the subject requires four double electrode stickers placed on the thorax, according to the manufacturer’s instructions. Data are automatically recorded using a computer data logger on a minute-by-minute basis.
Cooling techniques and monitoring
Body surface cooling was achieved using circulating cold water blankets (Thermowrap, Or-Akiva Ind. Park, Israel). A cooling pump device (CSZ Blanketrol III, model 233, Cincin-nati SubZero, Inc.) was connected to the blankets to pump cold water. The water tem-perature was set to the desired temperature. The blanket garment was attached directly to the patient’s body using medically approved adhesive.

Near infrared spectroscopy 97
Protocol
Individuals were positioned in supine position dressed with the cooling blankets on a comfortable bed. The blanket suit covered the entire body with the exception of the head, instrumented forearm, hands, and feet. The cooling pump device permitted control of blanket water temperature by changing the temperature of water perfusing the suit. The suit was then perfused with 32°C water. Electronic measurements were obtained continuously and the values are reported as averaged data for each interval. The time points included the following: baseline measurements prior to the cooling process (T0), after 30 min of peripheral cooling (T1), and after 30 min of the suspension of cooling and initiation of the rewarming process (T2). For this protocol, peripheral cooling was designed mainly to chill the skin over the entire body to induce only skin va-soconstriction without any changes in central temperature. Therefore, core temperature was measured each 5 min with an infrared tympanic thermometer (First Temp Genius model 3000A). Ambient temperature was constant during all experiments (T = 22°C). Skin vasoconstriction was defined as a minimal 50% decrease either in the Tskin-diff temperature or the PI signal.
Statistical analysis
The results are presented as the median (25th–75th), unless otherwise specified. A one-way repeated-measures ANOVA was conducted to compare NIRS-derived and periph-eral perfusion parameters prior, during, and after rewarming. The Bonferroni post hoc test was performed if a significant main effect was observed. SPSS (version 15.0, SPSS, Chicago, IL) was used for statistical analysis. A P value less than 0.05 was considered statistically significant.
Table 1. Descriptive analysis of the physiological variables in all 8 healthy volunteers stratified by the time points T0 (baseline), T1 (during peripheral cooling) and T2 (after stop cooling and re-warming process). Data presented as median [25th;75th]
Time point
T0 T1 T2
Heart rate (bpm) 76 [70;83] 67 [58;73] 70 [67;74]
Stroke volume (ml) 110 [76;125] 139 [132;147] 114 [106;164]
Cardiac output (L/min) 8,6 [8.0;9.4] 10,1 [8.9;12.2] 7.9 [7.3;10.1]
Mean arterial pressure (mmHg) 93[88;101] 100[92;107] 95[87;100]
Central temperature (oC) 36,8 [36.6;36.9] 36,6 [36.4;36.9] 36,6 [36.4;36.9]

98 Chapter 5a
reSUlTS
Eight healthy individuals (4 male, 4 female) participated in the study. The mean age, height, and weight were 26 ± 6 years, 172 ± 5 cm, and 74.1 ± 6.2 kg, respectively. Table 1 lists the global hemodynamic variables stratified by the time points of the study. All subjects tolerated the cooling process well and did not develop shivering during the experiment. We found a nonsignificant tendency towards an increase in SV and CO dur-ing peripheral cooling at T1 (Table 1). Core temperature and heart rate did not change significantly during the experiment.
Figure 1 presents the time course of the NIRS dynamic variables and peripheral per-fusion parameters before, during, and after the skin cooling process. Table 2 lists the absolute values of all peripheral parameters as stratified by time points. The peripheral cooling resulted in skin vasoconstriction in all volunteers with a significant decrease in the Tskin-diff temperature and in the PI signal: 55% (40–175) and 77% (62–83) compared with baseline, respectively. Concomitantly, we observed a significant decrease in StO2 and RincStO2 values but not in RdecStO2. The rewarming process increased StO2 and RincStO2 values towards baseline levels. Similar changes in CRT, Tskin-diff, and PI were also observed. The THI values did not change significantly during the entire experiment.
(A) (B) (C)
(D) (E) (F)
figure 1. Evolution of of NIRS-derived variables and peripheral perfusion before peripheral cooling (T0), during peripheral cooling (T1) and after re-warming (T2). Abreviation: (A) StO2=peripheral tissue oxygenation (%); (B) RincStO2= rate of StO2 recovery after arterial occlusion (%/sec); (C) RdecStO2=rate of StO2 desaturation during arterial occlusion (%/min); (D) Tskin-diff= forearm-to-fingertip skin-temperature gradient (0C); (E) PI=perfusion index (%); (F) CRT=capillary refill time (sec). Lines represent individual values for each healthy volunteer. Bars are mean±95%CI

Near infrared spectroscopy 99
We were also interested in investigating which of the NIRS variables was most affected by changes in skin circulation. Our results indicated that the magnitude of changes seem to be more prominent in RincStO2 than StO2 and that RincStO2 is more sensitive to changes in peripheral perfusion than StO2 itself. When compared with baseline values, the magnitude of the RincStO2 decreases was larger than that observed for StO2 [47% (30–62%) vs. 11% (9.2–13.1), P = 0.001].
dISCUSSION
The key finding from this study is that changes in vasomotor tone in the skin of the thenar eminence contributed significantly to the StO2-derived parameters as measured with a NIRS InSpectra device. The main mechanistic theory of our study is that peripheral vasoconstriction due to surface cooling results in decreased perfusion of the skin and, therefore, in parallel, changes in the StO2 resting values and in the StO2 recovery rate. Under resting conditions, the impact of peripheral perfusion alterations on NIRS-derived measurements can be expected to be magnified as the skin temperature decreases.
This finding was not totally unexpected because light from the NIRS system must pass through the skin and some absorbance in the resistance vessels that supply subepidermal capillaries would be anticipated. The 15-mm NIRS probe mainly covers approximately an 8-mm depth of tissue and focusing on the muscle. Skin and subcuta-neous layers above the muscle definitely contribute to the overall StO2 measured. It is likely that the decreasing StO2 effect after skin cooling is mainly due to the upper layers’ compromised perfusion because of cutaneous vasoconstriction. One may argue that it
Table 2. Descriptive analysis of NIRS-derived variables and peripheral perfusion parameters stratified by the time points T0 (baseline), T1 (during peripheral cooling) and T2 (after stop cooling and re-warming process). Data presented as median [25th;75th]
Time point
T0 T1 T2
StO2 (%) 82 [80;87] 72* [70;77] 80 [79;85]
RincStO2 (%/sec) 3.0 [2.8;3.3] 1.7* [1.1;2.0] 3.2 [3.0;4.2]
RdecStO2 (%/min) 9.5 [8.0;11.6] 8.6 [7.5;9.6] 8.8 [7.7;11.5]
THI (a.u.) 13.1 [12.8;13.9] 13.2 [12.6;13.9] 13.3 [12.9 ;14.2]
Tskin-diff (oC) 1.0 [-1.6;1.8] 3.1* [1.8;4.3] 1.2 [-0.3;2.7]
CRT (sec) 2.5 [2.0;3.0] 8.5* [7.2;11.0] 4.0 [3.0;5.7]
PI (%) 10.0 [9.1;11.7] 2.5* [2.0;3.8] 9.1 [8.2;11.7]
RincStO2= rate of StO2 increase after arterial occlusion; RdecStO2=rate of StO2 deoxygenation during arterial occlusion; THI=tissue hemoglobine index; Tskin-diff= forearm-to-fingertip skin-temperature gradient; CRT=capillary refill time; PI=Perfusion Index* P<0.05 vs. baseline 1 and baseline 2 (one-way repeated-measures ANOVA with Bonferroni post hoc test)
100 Chapter 5a
is possible that the cooling device induced changes beyond that of skin circulation and that flow in skeletal muscle was also altered. Our study does not allow us to conclude which of the two components (skin or muscle) is the major contributor to the changes in StO2-derived variables in our model. Nevertheless, we speculate that participation of muscle blood flow was not predominant because THI readings in our volunteers presented small changes during the cooling period. On the other hand, participation of skin blood flow was significant, as reflected by changes in skin temperature, PI, and CRT. The THI represents the total tissue concentration of hemoglobin in both extravascular and vascular tissue, and its physiological significance and clinical utility are still under investigation. Our model induced changes mainly on the arterial side of microcircula-tion and may explain why THI was not affected by the peripheral cooling device, as the sensitivity of THI is greater for vessels with high capacitance, such as post capillaries and venous compartments. This phenomenon may explain why other NIRS researchers have reported low THI values and normal StO2 in patients with sepsis, as this is a condition related to vascular leak and low vascular density due to microcirculatory derangements [9, 10]. Therefore, the decreased NIRS signal from oxygenated hemoglobin is likely the result of a decrease in arterial blood volume within the peripheral vasculature as a con-sequence of vasoconstriction.
We chose this model to test our hypotheses because previous studies, including one by our own group, have shown that peripheral vasoconstriction is a frequent abnor-mality in critically ill patients [11, 12]. For instance, studies that employed NIRS as a peripheral tissue oxygenation monitoring device have shown that the fall in StO2 in peripheral tissues correlates well with the degree of hypotension in trauma and hemor-rhagic shock [13–16]. However, these findings were always related to acute shock states and the disturbance of the systemic circulation, which indicates that the pathological link between hypotension and the fall in StO2 may be explained by increased peripheral vasoconstriction as a result of the adrenergic response that follows the neurohumoral compensatory mechanisms induced by the low-flow systemic shock state. Peripheral vasoconstriction may very well explain the fall in StO2 levels in acute situations, such as in trauma and cardiogenic or hemorrhagic shock. In critically ill patients after resuscita-tion of the systemic circulation, during the stability phase, peripheral vascular tone may no longer reflect the acute compensatory mechanisms because others factors overcome this physiologic response; such factors include mechanical ventilation, vasopressors, vasodilators, sedatives, and opiate use. However, abnormalities in peripheral perfusion may persist despite patient systemic hemodynamic stability [11, 12, 17]. The noticeable decreases in StO2 and StO2 recovery rate in our model provide evidence that periph-eral vasoconstriction markedly influences the NIRS measurements of thenar tissue oxygenation and may confound interpretation of StO2-derived parameters in critically ill patients, in whom peripheral perfusion constantly changes over time.
Near infrared spectroscopy 101
Another interesting finding was that we could induce significant changes in StO2-derived tissue oxygenation values by maintaining unchanged systemic hemodynamics. We found a nonsignificant tendency towards an increase in SV and CO during peripheral cooling. This finding may be explained by the shift of blood volume from the vasocon-stricted peripheral circulation to the central circulation with a subsequent increase in the cardiac preload, justifying the augmentation of cardiac output as a result of an increase in stroke volume. In one previous study conducted by our group, we found that changes in StO2-derived parameters were correlated with parameters of peripheral perfusion in critically ill patients but were independent of the hemodynamic status of the patient [5]. In another recent study in a model of controlled central hypovolemia, a decreased venous return with a concomitant decrease in stroke volume did not lead to clinically significant changes in StO2 as measured on the thenar [18]. These find-ings strongly suggest that StO2-derived parameters are more affected by changes in peripheral vasomotor tone than by systemic hemodynamic conditions. Perhaps even more interesting to the clinician who applies NIRS for peripheral perfusion monitoring is the knowledge that abnormal StO2-derived parameters may reflect a condition of peripheral vasoconstriction independent of systemic hemodynamics.
In conclusion, the presence of peripheral vasoconstriction due to body surface cool-ing could significantly influence the noninvasive measurement of thenar StO2 using an InSpectra model 650 with 15-mm probe spacing. Depending on the condition of peripheral circulation, significant decreases in peripheral blood flow can affect StO2-derived measurements, particularly StO2 and StO2 recovery rate, which are exclusively dependent on local vasodilation capacity. Therefore, careful consideration must be given when using NIRS to measure tissue oxygenation in critically ill patients, and con-sideration should be given to the peripheral circulation when interpreting peripheral tissue oxygenation.

102 Chapter 5a
refereNCeS
1. Creteur J, Carollo T, Soldati G, et al: The prognostic value of muscle StO2 in septic patients. Inten-sive Care Med 2007; 33:1549-1556
2. Doerschug KC, Delsing AS, Schmidt GA, et al: Impairments in microvascular reactivity are related to organ failure in human sepsis. Am J Physiol Heart Circ Physiol 2007; 293:H1065-H1071
3. Gomez H, Torres A, Polanco P, et al: Use of non-invasive NIRS during a vascular occlusion test to assess dynamic tissue O(2)saturation response. Intensive Care Med 2008; 34:1600-1607
4. Skarda DE, Mulier KE, Myers DE, et al: Dynamic near-infrared spectroscopy measurements in patients with severe sepsis. Shock 2007; 27:348-353
5. Lima A, van Bommel J, Jansen TC, et al: Low tissue oxygen saturation at the end of early goal-directed therapy is associated with worse outcome in critically ill patients. Crit Care 2009; 13 Suppl 5:S13-
6. Schriger DL, Baraff L Defining normal capillary refill: variation with age, sex, and temperature. Annals of Emergency Medicine 1988; 17:932-935
7. Sessler DI Skin-temperature gradients are a validated measure of fingertip perfusion. Eur J Appl Physiol 2003; 89:401-402
8. House JR, Tipton MJ Using skin temperature gradients or skin heat flux measurements to deter-mine thresholds of vasoconstriction and vasodilatation. Eur J Appl Physiol 2002; 88:141-145
9. Galvin EM, Niehof S, Verbrugge SJ, et al: Peripheral flow index is a reliable and early indicator of regional block success. Anesth Analg 2006; 103:239-43, table
10. Lima AP, Beelen P, Bakker J Use of a peripheral perfusion index derived from the pulse oximetry signal as a noninvasive indicator of perfusion. Crit Care Med 2002; 30:1210-1213
11. Squara P, Denjean D, Estagnasie P, et al: Noninvasive cardiac output monitoring (NICOM): a clinical validation. Intensive Care Med 2007; 33:1191-1194
12. Kaplan LJ, McPartland K, Santora TA, et al: Start with a subjective assessment of skin temperature to identify hypoperfusion in intensive care unit patients. J Trauma 2001; 50:620-627
13. Lima A, Jansen TC, van Bommel J, et al: The prognostic value of the subjective assessment of peripheral perfusion in critically ill patients. Crit Care Med 2009; 37:934-938
14. Thompson MJ, Ninis N, Perera R, et al: Clinical recognition of meningococcal disease in children and adolescents. The Lancet 2006; 367:397-403
15. Crookes BA, Cohn SM, Bloch S, et al: Can near-infrared spectroscopy identify the severity of shock in trauma patients? Journal of Trauma 2005; 58:806-813
16. Ikossi DG, Knudson MM, Morabito DJ, et al: Continuous muscle tissue oxygenation in critically injured patients: a prospective observational study. Journal of Trauma 2006; 61:780-788
17. McKinley BA, Marvin RG, Cocanour CS, et al: Tissue hemoglobin O2 saturation during resuscita-tion of traumatic shock monitored using near infrared spectrometry. Journal of Trauma 2000; 48:637-642
18. Cohn SM, Nathens AB, Moore FA, et al: Tissue oxygen saturation predicts the development of organ dysfunction during traumatic shock resuscitation. Journal of Trauma 2007; 62:44-54
19. Dranzenovic R, Samsel RW, Wylam ME, et al: Regulation of perfused capillary density in canine intestinal mucosa during endotoxemia. Journal of Applied Physiology 1992; 72:259-265
20. De Backer D, Creteur J, Preiser JC, et al: Microvascular blood flow is altered in patients with sepsis. Am J Respir Crit Care Med 2002; 166:98-104
21. Neviere R, Mathieu D, Chagnon JL, et al: Skeletal muscle microvascular blood flow and oxygen transport in patients with severe sepsis. Am J Respir Crit Care Med 1996; 153:191-195

Near infrared spectroscopy 103
22. Weinberg JR, Boyle P, Thomas K, et al: Capillary blood cell velocity is reduced in fever without hypotension. Int J Microcirc Clin Exp 1991; 10:13-19
23. Lima A., van Bommel J, Sikorska K, et al: The relation of near-infrared spectroscopy with changes in peripheral circulation in critically ill patients. Critical Care Medicine 2011; 39(7):1649-54
24. Bartels SA, Bezemer R, de Vries FJ, et al: Multi-site and multi-depth near-infrared spectroscopy in a model of simulated (central)hypovolemia: lower body negative pressure. Intensive Care Med 2011; 37(4):671-7

104 Chapter 5a
leTTer TO THe edITOr:
Critical Care Medicine 37(1), January 2009, pp 384-385
NeAr INfrAred SPeCTrOSCOPY
Over the last years, tissue microcirculatory and regional perfusion and oxygenation have made an important entry into the functional hemodynamic monitoring of criti-cally ill patients (1). Clinical assessment of these parameters has become possible by the introduction of optical spectroscopic technologies such as near-infrared spectroscopy. This technique is based on the oxygen-dependent optical absorption of blood in the near-infrared spectrum. There are three prime factors which distinguish the currently available devices: 1) the algorithm used to calculate regional/microcirculatory hemo-globin saturation; 2) the spatial separation of the illumination and detection fiber, which determines the measurement depth; and 3) the location of the probe.
In a recent issue of Critical Care Medicine, Soller et al (2) presented a study in volunteers where a decrease in venous return (as a model of hypovolemia) was induced by lower limb negative pressure. In the model, they compared a self-developed near-infrared spectroscopy device, which measures a parameter called muscle oxygen tension, to a commercially available device from Hutchinson Technology (HT), which measures a parameter called tissue oxygen saturation and has been studied clinically (3–5). The au-thors concluded that their device has “superior sensitivity” to detect acute hypovolemia when compared with the HT device. However, in their study design, two of the above-mentioned factors were not under experimental control resulting in a faulty conclusion. This may lead to confusion in the field of those using the near-infrared spectroscopy technique and needs to be addressed.
The first shortcoming concerns the probe distance. Their device has a 30-mm probe distance and they compared it with the HT device using a 15-mm probe distance. Sec-ond, a more serious shortcoming in their study design is of a physiologic nature. The authors put their probe on the forearm, whereas they put the HT probe on the thenar. However, the effect of the measurement site, i.e., forearm vs. thenar, was not validated. Surprisingly, the authors neglected to add a simple experiment by switching the probes around and repeating the experiment. To investigate the influence of the measurement site, we performed a similar experiment in two volunteers twice (n = 4) using a tilt table to that by simulate hypovolemia. We used two HT devices applying a 15-mm probe, similar to Soller et al, on the thenar and on the forearm. We found that the forearm was more sensitive to acute changes in venous return than is the thenar, where thenar tissue oxygen saturation decreased from 90 ± 5% to 88 ± 7% and forearm tissue oxygen satura-tion decreased from 83 ± 5% to 75 ± 4%. This simple experiment demonstrated that the conclusion of Soller et al is incorrect and was based on an inadequate study design.

Near infrared spectroscopy 105
In conclusion, validation studies such as those presented by Soller et al should be performed with more methodologic rigor and a clear sense of objective where basic physiologic considerations should form the core component.
refereNCeS
1. Weil MH, Tang W: Welcoming a new era of hemodynamic monitoring: Expanding from the macro to the microcirculation. Crit Care Med 2007; 35:1204–1205
2. Soller BR, Ryan KL, Rickards CA, et al: Oxygen saturation determined from deep muscle, not the-nar tissue, is an early indicator of central hypovolemia in humans. Crit Care Med 2008;36:176–182
3. Myers DE, Anderson LD, Seifert RP, et al: Noninvasive method for measuring local haemoglobin oxygen saturation in tissue using wide gap second derivative near-infrared spectroscopy. J Biomed Opt 2005; 10:034017-1-034017-18
4. McKinley BA, Marvin RG, Cocanour CS, et al: Tissue hemoglobin O2 saturation during resuscita-tion of traumatic shock monitored using near infrared spectrometry. J Trauma 2000; 48:637–642
5. Creteur J, Carollo T, Soldati G, et al: The prognostic value of muscle StO2 in septic patients. Inten-sive Care Med 2007; 33:1549–1556


PArT C Prognostic value of monitoring peripheral per fusion


Chapter 6The prognostic value of the subjec tive assessment of peripheral per fusion in cr it ical ly i l l patients
Crit Care Med 2009 Mar; 37(3):934-8
Alexandre Lima, Tim c. Jansen, Jasper van Bommel, Can Ince, Jan Bakker
110 Chapter 6
AbSTrACT
Objective: The physical examination of peripheral perfusion based on touching the skin or measuring capillary refill time has been related to the prognosis of patients with circulatory shock. It is unclear, however, whether monitoring peripheral perfusion after initial resuscitation still provides information on morbidity in critically ill patients. There-fore, we investigated whether subjective assessment of peripheral perfusion could help identify critically ill patients with a more severe organ or metabolic dysfunction using the Sequential Organ Failure Assessment (SOFA) score and lactate levels.
designed: Prospective observational study.Setting: Multidisciplinary Intensive Care Unit in a University Hospital.Patients: Fifty consecutive adult patients admitted to the intensive care unit.Interventions: None.
Measurements and main results: Patients were considered to have abnormal peripheral perfusion if the examined extremity had an increase in capillary refill time (>4.5 sec) or it was cool to the examiner hands. To address reliability of subjective inspection and palpation of peripheral perfusion, we also measured forearm-to-fingertip skin-temperature gradient (Tskin-diff), central-to-toe temperature difference (Tc-toe) and peripheral flow index (PFI). The mea-surements were taken within 24 hours of admission to the intensive care after hemodynamic stability was obtained (mean arterial pressure >65 mmHg). Changes in SOFA score during the first 48 hours were analyzed (Δ-SOFA). Individual SOFA score was significantly higher in pa-tients with abnormal peripheral perfusion than in those with normal peripheral perfusion (9±3 vs. 7±2, P<0.05). Tskin-diff, Tc-toe and PFI were congruent with the subjective assessment of peripheral perfusion. The proportion of patients with Δ-SOFA score >0 was significantly higher in patients with abnormal peripheral perfusion (77% vs. 23%, P<0.05). The logistic regression analysis showed that the odds of unfavourable evolution are 7.4 (95%CI 2-19; P<0.05) times higher for a patient with abnormal peripheral perfusion. The proportion of hyperlactatemia was significantly different between patients with abnormal and normal peripheral perfusion (67% vs. 33%, P<0.05). The odds of hyperlactatemia by logistic regression analysis are 4.6 (95%CI 1.4-15; P<0.05) times higher for a patient with abnormal peripheral perfusion.
Conclusions: Subjective assessment of peripheral perfusion with physical examination following initial hemodynamic resuscitation in the first 24h of admission could identify hemodynamically stable patients with a more severe organ dysfunction and higher lactate levels. Patients with abnormal peripheral perfusion had significantly higher odds of worsening organ failure than did patients with normal peripheral perfusion following initial resuscitation.

Subjective assessment of peripheral perfusion 111
INTrOdUCTION
Clinical signs of poor peripheral perfusion have been shown to be an early marker of inadequate tissue perfusion in acute circulatory shock (1-3). The rationale of monitoring peripheral perfusion is based on the concept that during hypotension the sympathetic neurohumoral response predominates on peripheral tissues resulting in a decreased skin perfusion and temperature (4, 5). Thus, monitoring of peripheral perfusion can assess the effect of the neurohumoral compensatory mechanism induced by low flow shock states in an acute stage of the disease.
Studies have showed that the subjective assessment of peripheral perfusion, in par-ticular, the physical examination by touching the skin or measuring capillary refill time, can identify patients at high risk of complications from acute circulatory shock (6-9). Hasdai et al. (7) showed the importance of the physical examination of peripheral perfu-sion in determining the prognosis of patients with cardiogenic shock. In their study, the presence of a cold and clammy skin was an independent predictor of 30-day mortality. Although septic shock is associated with peripheral vasodilation, cool extremities may be present in the early stage of sepsis. In another recent study, Thompson et al. (8) studied the time course of the clinical features of meningococcal disease in children and adolescents before the admission to the hospital, and they identified cold hands and feet together with abnormal skin colour as the main important clinical signs within the first 12 h of the onset of illness. From these studies it is clear that subjective assess-ment of peripheral perfusion is a valuable adjunct in hemodynamic monitoring during circulatory shock, and should be the first approach to assess critically ill patient.
However, most studies on clinical assessment of peripheral perfusion have focused on specific populations of patients or have been performed during resuscitation in an acute stage of the disease (3, 8-10). It is unclear whether monitoring peripheral perfu-sion with physical examination in a general population of intensive care unit (ICU) after initial resuscitation still provides information about organ derangements and whether it predicts outcome in terms of organ dysfunction.
In view of these observations, we carried out a prospective study to evaluate whether subjective assessment of peripheral perfusion in the post-resuscitation phase of patients admitted to a general ICU could predict organ dysfunction. In particular, we wished to investigate if clinical monitoring of peripheral perfusion could help identify patients with a more severe organ dysfunction or metabolic dysfunction, as expressed by high Sequential Organ Failure Assessment (SOFA) score and lactate levels.

112 Chapter 6
MATerIAlS ANd MeTHOdS
Study design and patients
This prospective observational study was conducted in the intensive care of a university hospital, admitting all patients except those following cardiac surgery. We enrolled con-secutive critically ill patients who had undergone initial resuscitation and stabilization within 24h of ICU admission. Patients were excluded if they had severe peripheral vascu-lar disease (with a history of vascular surgery). The institutional review board approved the study. Each patient or relative provided written informed consent.
Measurements
The assessment of peripheral perfusion was based on the subjective evaluation of the examiner, and patients were considered to have abnormal peripheral perfusion if the examined extremity had an increase in capillary refill time or it was cool to the examiner hands. Capillary refill time was measured by applying firm pressure to the distal phalanx of the index finger for 15 seconds. A chronometer recorded the time for return of the nor-mal colour and 4.5 seconds was defined as the upper limit of normality (11). To address the reliability of the subjective assessment of peripheral perfusion by the examiner, we also measured forearm-to-fingertip skin-temperature gradient (Tskin-diff ), central-to-toe temperature difference (Tc-toe) and peripheral flow index (PFI) simultaneously with clinical observation. The Tskin-diff was obtained from two skin probes (Hewlett Packard 21078A) attached to the index finger and on the radial side of the forearm, mid-way between the elbow and the wrist. The Tc-toe was calculated from central temperature, with an infrared tympanic thermometer (First Temp Genius Thermometer – 3000A), and great toe temperature measured on the ventral face with a skin probe (Hewlett Packard 21078A). The temperature gradients Tskin-diff and Tc-toe can better reflect cutaneous blood flow than the skin temperature itself. Considering a constant environment con-dition, Tskin-diff and Tc-toe increases during vasoconstriction (12, 13). PFI provides a noninvasive method to evaluate peripheral perfusion and it has been shown to reflect changes in peripheral perfusion (14, 15). PFI is derived from the pulse oximetry signal and it was measured using the Nellcor-OxiMax pulse oximetry and the Hewlett Packard monitor (Viridia/56S). To confirm the subjective assessment of abnormal peripheral per-fusion condition, this study used the following definition of vasoconstriction: Tskin-diff >0oC (12), Tc-toe >7oC (13) and PFI <1,4 (14). Although the ambient temperature at each patient’s bedside was not directly measured, the ICU has one-person closed rooms and the ambient temperature in each patient room was individually and actively controlled at 22oC. Thereafter, routine global hemodynamic variables such as heart rate, mean arte-rial pressure, central venous pressure and urine output were obtained.

Subjective assessment of peripheral perfusion 113
Basic demographic characteristics and all the variables of SOFA score were collected for each patient. The investigator registered the measurements within 24 hours of ad-mission to the intensive care after hemodynamic stability was obtained (mean arterial pressure >65 mmHg and no change in vasopressor infusion rate for 2 h). Changes in SOFA score during the first 48 hours (Δ-SOFA) were also analyzed and was calculated as the difference between the 48-hour SOFA score and the admission score (16). Arterial blood samples were withdrawn for the determination of blood gases and lactate levels. Hyperlactatemia was defined as a blood lactate level >2mmol/L. We were interested in evaluating whether subjective assessment of peripheral perfusion could help identify patients with unfavorable evolution defined as Δ-SOFA score >0 and hyperlactatemia.
Statistics
The results are presented as mean ±SD, unless otherwise specified. Differences between group means were tested by Student’s t-tests, and for variables that were not normally distributed, by Mann-Whitney U test. The Chi-square test was used to compare frequen-cies. To estimate the association between abnormal peripheral perfusion and both Δ-SOFA score and hyperlactatemia, logistic regression analysis was performed. P values £0.05 were considered statistically significant.
reSUlTS
Of 50 patients included in the study, 39 had circulatory shock on admission of ICU, of whom 21 had septic shock and 18 had no septic shock. Table 1 summarizes the clinical data of the patients. During the first 24h of ICU admission, 23 (46%) patients had ab-normal peripheral perfusion following resuscitation and stabilization. Individual SOFA score was significantly higher in patients with abnormal peripheral perfusion than in those with normal peripheral perfusion (9±3 vs. 7±2, P<0.05). Tskin-diff, Tc-toe and PFI measurements were congruent with the subjective assessment of peripheral perfusion (Table 2). Hemodynamic variables were similar in patients with abnormal and normal peripheral perfusion (Table 3). In patients who received vasopressor therapy (N=33), the dose of vasopressor did not differ between normal (N=17) and abnormal (N=16) peripheral perfusion condition (0.19±0.11 vs. 0.17±0.10; P=0.80).
The proportion of patients with unfavourable evolution was significantly higher in pa-tients with abnormal peripheral perfusion (Table 4). Logistic regression analysis showed that the odds of unfavorable evolution are 7.4 (95%CI 2-19; P<0.05) times higher for a patient with abnormal peripheral perfusion than for a patient with normal peripheral perfusion. Differences in global hemodynamic variables, such as heart rate, mean arte-rial pressure, central venous pressure and urine output were not statistically significant

114 Chapter 6
Table 1.
Demographic data of the patients
Number of patients 50
Age (years) 51 (17-80)
Male/Female 39/11
SOFA admission 8 (2-15)
APACHE II 23 (13-35)
Admission category
Pneumonia 9
Trauma 8
Abdominal sepsis 7
Postoperative 5
COPD 3
Cardiogenic shock 2
Hepatic encephalopathy 2
Hypovolemic/Hemorrhagic shock 2
Mediastinitis 2
Meningitis 2
Pancreatitis 2
Post cardiac arrest 2
Cerebrovascular accident 1
Lung cancer 1
Systemic lupus erythematosus 1
Urosepsis 1
Survivor/Non-survivor 35/15
Values are given as mean (range) where appropriate
Table 2. Objective parameters of peripheral circulation according to the subjective evaluation of peripheral perfusion
Subjective Evaluation
Objective Parameters Normal (N=27) Abnormal (N=23) P Value
Tskin-diff (oC) -0.2±2.8 4.6±2.8 <0.01
Tc-toe (oC) 6.5±3.4 10±4.1 <0.01
PFI 2.3±1.6 0.7±0.8 <0.01
Tskin-diff=forearm-to-fingertip skin-temperature gradient; Tc-toe=central-to-toe temperature difference; PFI=peripheral flow index

Subjective assessment of peripheral perfusion 115
between patients with and without unfavourable evolution (data not shown). The proportion of patients with hyperlactatemia was significantly higher in patients with abnormal peripheral perfusion (Table 5). Logistic regression analysis showed that the odds of hyperlactatemia in a patient with abnormal peripheral perfusion are 4.6 (95%CI 1.4-15; P<0.05) times higher than in a patient with normal peripheral perfusion.
dISCUSSION
This prospective observational study shows that the subjective assessment of periph-eral perfusion could discriminate patients with a more severe organ dysfunction, as expressed by high SOFA score and lactate levels in patients with abnormal peripheral perfusion. One may argue that high SOFA score in the abnormal peripheral perfusion group may be related to the level of mean arterial pressure or to the use of vasopres-sor support. However, our patients were all resuscitated and stabilized at the moment
Table 3. Global hemodynamics variables in abnormal and normal peripheral perfusion
Peripheral Perfusion
Normal (N=27) Abnormal (N=23) P Value
HR (bpm) 90±22 94±20 0.53
MAP (mmHg) 80±14 81±18 0.87
CVP (mmHg) 14±6 13±7 0.84
Urine output (ml/h) 111±83 72±30 0.14
HR=heart rate; MAP=mean arterial blood pressure; CVP=central venous pressure
Table 4. Proportion of patients with unfavourable evolution (Δ-SOFA>0) and favourable evolution (Δ-SOFA score≤0) stratified by normal and abnormal peripheral perfusion a
Peripheral Perfusion
Normal (N=27) Abnormal (N=23)
Δ-SOFA ≤ 0 (N=33), % of patients 70 30
Δ-SOFA > 0 (N=17), % of patients 23 77
a P<0.05, by Chi-square test
Table 5. Proportion of hyperlactatemia and normal blood lactate levels between patients with abnormal and normal peripheral perfusion a
Peripheral Perfusion
Normal (N=27) Abnormal (N=23)
Normal lactate levels (N=29), % of patients 69 31
Hyperlactatemia (N=21), % of patients 33 67
a P<0.05, by Chi-square test

116 Chapter 6
that data were collected, and global hemodynamic variables or dose of vasopressor were similar between patients with normal and abnormal peripheral perfusion. This finding suggests that abnormal peripheral perfusion is not related to hypotension or vasoconstriction from a pharmacologic intervention. This lack of association between abnormal peripheral perfusion and global hemodynamic variables is not unexpected, since some studies have reported a poor correlation between clinical examination of peripheral perfusion and heart rate, blood pressure or cardiac output (3, 10, 17). In addi-tion, recent observations suggest that microcirculatory alterations in circulatory shock are independent of systemic variables (18, 19) and that systemic variables may not be sensitive enough to reflect changes in peripheral blood flow in critically ill patients (20).
Delta-SOFA score has been suggested to monitor the evolution of organ failure (16). In our study, we investigated whether the condition of peripheral perfusion in resuscitated patients could predict an increase in severity of organ dysfunction. Our results show that patients who persist with abnormal peripheral perfusion after initial resuscitation have a significantly higher probability of unfavourable evolution, as indicated by an increase in the Δ-SOFA score. Thus, monitoring peripheral perfusion could identify these patients who do not improve despite initial resuscitation and stabilization. Similarly, the logistic regression analysis showed that patients who have an abnormal peripheral perfusion following resuscitation are more likely to remain hyperlactatemic. The interpretation of hyperlactatemia in critically ill patients is complex, and factors other than hypoperfu-sion may be involved (21). Nevertheless, our findings are in agreement with those of Kaplan et al. (6) showing that patients with cold extremity are associated with higher blood lactate levels. The correlation between abnormal peripheral perfusion and high blood lactate levels in our patients is not surprising as hyperlactatemia in most cases takes place in the presence of organ dysfunction (22-24). This prospective study does not show a causal relation between poor peripheral perfusion and organ dysfunction or tissue hypoperfusion, but some reports indicate this relation (1, 25-27). Studies on measurements of blood flow and oxygenation in peripheral tissues suggest that com-pensatory vasoconstriction results in maldistribution of microcirculatory flow, which has been associated with organ dysfunction and multiple organ failure (1, 25-27).
In a recent consensus conference on hemodynamic monitoring in shock it was now recognized that the definition of shock requires evidence of circulatory and cellular dysfunction, manifested by markers of hypoperfusion such as elevated blood lactate levels, regardless of the presence of hypotension (20). Because data were collected in the post-resuscitation period, our patients exhibited no other clinical signs of circulatory shock apart from hyperlactatemia and abnormal peripheral perfusion. Normotension with persisting hyperlactatemia following initial resuscitation have been associated with a high incidence of organ failure (28, 29). Our study is in agreement with these findings, demonstrating that abnormal peripheral perfusion in patients with no other clinical

Subjective assessment of peripheral perfusion 117
signs of shock is predictive of progressing organ dysfunction. Thus, if the clinician stops the resuscitation after the traditional end points have been normalized, a majority of pa-tients will remain in a state of compensated shock. The absence of abnormal peripheral perfusion after initial resuscitation identifies patients with a more favourable outcome. Therefore clinical assessment of peripheral perfusion during resuscitation has potential to optimize resuscitation procedures. However, this was not the topic of this study. The subjective inspection and palpation of peripheral perfusion is safe, non-invasive and very easy to perform at the bedside and enables physicians to identify those patients with tissue hypoperfusion before continuing to invasive procedures. The subsequent potential of subjective assessment of peripheral perfusion in a general ICU population applied by multiple clinicians must be investigated further to address whether aiming at normalization of peripheral perfusion will have an impact on outcome.
As the focus of our study was to address the relationship between abnormal pe-ripheral perfusion and organ failure, we minimized the variability of the subjective assessment of peripheral perfusion by having only one investigator collecting the data. In addition, we compared this subjective assessment of peripheral perfusion with 3 objective measurements: Tskin-diff, Tc-toe and PFI. These parameters are independent indicators of peripheral blood flow (30). We found that the subjective clinical assessment of peripheral perfusion was in agreement with the objective measurements of Tskin-diff, Tc-toe and PFI (Table 2).
This study has several limitations that should be acknowledged. First, measurements of global blood flow (cardiac output) were not made in this study. The main focus was to assess the relationship between the presence of abnormal peripheral perfusion following our standard hemodynamic optimization protocol and organ dysfunction. Second, we did not include other methods of peripheral perfusion monitoring, such as cutaneous laser Doppler flowmetry, transcutaneous oximetry or sublingual capnometry as we emphasized the subjective assessment of peripheral perfusion. In addition, we speculate that these noninvasive methods could have shown the same association with Tskin-diff, Tc-toe and PFI. Third, although Tc-toe is a well-validated method to estimate peripheral blood flow, central temperature in our study was obtained using a tympanic thermometer, which may not be a reliable representation of core temperature. However, the impact of central temperature in Tc-toe calculation is small compared to the skin temperature of the great toe, as abnormalities in Tc-toe are a result mainly of changes in peripheral vasoconstriction (30). Fourth, changes in ambient temperature may have influenced the subjective assessment of the skin temperature. Differences in ambient temperature at each patient’s bedside were not directly measured. However, the ICU consists of one-person closed rooms and the ambient temperature in each patient room was individually controlled at 22oC. Moreover, the differences in subjective skin temperature were in agreement with differences in Tskin-diff in our study. As a change

118 Chapter 6
in ambient temperature similarly affects forearm and fingertip temperature producing little influence in the gradient between forearm and fingertip (30) we think the effect of ambient temperature was small. Last, peripheral perfusion is not static; it alters over time in a constant dynamic situation, and our measurements were made within 24h of ICU admission.
CONClUSION
In conclusion, we found that a clinical assessment of peripheral perfusion by physical examination following initial hemodynamic optimization during the first 24h of ad-mission could discriminate hemodynamically stable patients with more severe organ dysfunction. In addition, patients with abnormal peripheral perfusion following this initial resuscitation had significantly higher odds of worsening organ failure and higher lactate levels compared to patients with normal peripheral perfusion at this time point. The easy application of this clinical assessment of peripheral perfusion at the bedside has a potential as a simple and inexpensive tool for early detection of worsening organ dysfunction and possibly the adequacy of treatment in critically ill patients.

Subjective assessment of peripheral perfusion 119
refereNCeS
1. Chien LC, Lu KJ, Wo CC, et al: Hemodynamic patterns preceding circulatory deterioration and death after trauma. J Trauma 2007; 62:928-932
2. McGee S, Abernethy WB, III, Simel DL: Is this patient hypovolemic? JAMA 1999; 281:1022-1029 3. Bailey JM, Levy JH, Kopel MA, et al: Relationship between clinical evaluation of peripheral perfu-
sion and global hemodynamics in adults after cardiac surgery. Crit Care Med 1990; 18:1353-1356 4. Miyagatani Y, Yukioka T, Ohta S, et al: Vascular tone in patients with hemorrhagic shock. J Trauma
1999; 47:282-287 5. Ikossi DG, Knudson MM, Morabito DJ, et al: Continuous muscle tissue oxygenation in critically
injured patients: a prospective observational study. J Trauma 2006; 61:780-788 6. Kaplan LJ, McPartland K, Santora TA, et al: Start with a subjective assessment of skin temperature
to identify hypoperfusion in intensive care unit patients. J Trauma 2001; 50:620-627 7. Hasdai D, Holmes DR, Jr., Califf RM, et al: Cardiogenic shock complicating acute myocardial infarc-
tion: predictors of death. GUSTO Investigators. Global Utilization of Streptokinase and Tissue-Plasminogen Activator for Occluded Coronary Arteries. Am Heart J 1999; 138:21-31
8. Thompson MJ, Ninis N, Perera R, et al: Clinical recognition of meningococcal disease in children and adolescents. Lancet 2006; 367:397-403
9. Evans JA, May J, Ansong D, et al: Capillary refill time as an independent prognostic indicator in severe and complicated malaria. J Pediatr 2006; 149:676-681
10. Tibby SM, Hatherill M, Murdoch IA: Capillary refill and core-peripheral temperature gap as indica-tors of haemodynamic status in paediatric intensive care patients. Arch Dis Child 1999; 80:163-166
11. Schriger DL, Baraff L: Defining normal capillary refill: variation with age, sex, and temperature. Ann Emerg Med 1988; 17:932-935
12. Pezawas T, Rajek A, Plochl W: Core and skin surface temperature course after normothermic and hypothermic cardiopulmonary bypass and its impact on extubation time. Eur J Anaesthesiol 2007; 24:20-25
13. Curley FJ, Smyrnios NA: Routine monitoring of critically ill patients. In: Irwin RS, Cerra FB, Rippe JM (Eds). Intensive Care Medicine. Lippincott Williams & Wilkins, 2003, pp250-270
14. Lima AP, Beelen P, Bakker J: Use of a peripheral perfusion index derived from the pulse oximetry signal as a noninvasive indicator of perfusion. Crit Care Med 2002; 30:1210-1213
15. Galvin EM, Niehof S, Verbrugge SJ, et al: Peripheral flow index is a reliable and early indicator of regional block success. Anesth Analg 2006; 103:239-243
16. Ferreira FL, Bota DP, Bross A, et al: Serial evaluation of the SOFA score to predict outcome in critically ill patients. JAMA 2001; 286:1754-1758
17. Schriger DL, Baraff L: Capillary refill: is it a useful predictor of hypovolemic states ? Ann Emerg Med 1991; 20:601-605
18. De Backer D, Creteur J, Dubois MJ, et al: Microvascular alterations in patients with acute severe heart failure and cardiogenic shock. Am Heart J 2004; 147:91-99
19. De Backer D, Creteur J, Dubois MJ, et al: The effects of dobutamine on microcirculatory alterations in patients with septic shock are independent of its systemic effects. Crit Care Med 2006; 34:403-408
20. Antonelli M, Levy M, Andrews PJ, et al: Hemodynamic monitoring in shock and implications for management. International Consensus Conference, Paris, France, 27-28 April 2006. Intensive Care Med 2007; 33:575-590
21. Bakker J: Lactate: may I have your votes please? Intensive Care Med 2001; 27:6-11

120 Chapter 6
22. Bakker J, Gris P, Coffernils M, et al: Serial blood lactate levels can predict the development of multiple organ failure following septic shock. Am J Surg 1996; 171:221-226
23. Roumen RM, Redl H, Schlag G, et al: Scoring systems and blood lactate concentrations in relation to the development of adult respiratory distress syndrome and multiple organ failure in severely traumatized patients. J Trauma 1993; 35:349-355
24. Durham RM, Moran JJ, Mazuski JE, et al: Multiple organ failure in trauma patients. J Trauma 2003; 55:608-616
25. Sakr Y, Dubois MJ, De Backer D, et al: Persistent microcirculatory alterations are associated with organ failure and death in patients with septic shock. Crit Care Med 2004; 32:1825-1831
26. Doerschug KC, Delsing AS, Schmidt GA, et al: Impairments in microvascular reactivity are related to organ failure in human sepsis. Am J Physiol Heart Circ Physiol 2007; 293(2):H1065-71
27. Knotzer H, Maier S, Dunser M, et al: Oscillation frequency of skin microvascular blood flow is associated with mortality in critically ill patients. Acta Anaesthesiol Scand 2007; 51:701-707
28. Meregalli A, Oliveira RP, Friedman G: Occult hypoperfusion is associated with increased mortality in hemodynamically stable, high-risk, surgical patients. Crit Care 2004; 8:R60-R65
29. Howell MD, Donnino M, Clardy P, et al: Occult hypoperfusion and mortality in patients with suspected infection. Intensive Care Med 2007; 33:1892-1899
30. Lima A, Bakker J: Noninvasive monitoring of peripheral perfusion. Intensive Care Med 2005; 31:1316-1326


Chapter 7Low tissue ox ygen saturation at the end of ear ly goal - direc ted therapy is associated with worse outcome in cr it ical ly i l l patients
Crit Care 2009; 13 Suppl 5:S13
Alexandre Lima, Jasper van Bommel, Tim C. Jansen, Can Ince, Jan Bakker

124 Chapter 7
AbSTrACT
Introduction
The prognostic value of continuous monitoring of tissue oxygen saturation (StO2) dur-ing early goal-directed therapy of critically ill patients has not been investigated. We conducted this prospective study to test the hypothesis that the persistence of low StO2 levels following intensive care admission is related to adverse outcome.
Methods
We followed 22 critically ill patients admitted with increased lactate levels (>3 mmol/l). Near-infrared spectroscopy (NIRS) was used to measure the thenar eminence StO2 and the rate of StO2 increase (RincStO2) after a vascular occlusion test. NIRS dynamic measurements were recorded at intensive care admission and each 2-hour interval dur-ing 8 hours of resuscitation. All repeated StO2 measurements were further compared with Sequential Organ Failure Assessment (SOFA), Acute Physiology and Chronic Health Evaluation (APACHE) II and hemodynamic physiological variables: heart rate (HR), mean arterial pressure (MAP), central venous oxygen saturation (ScvO2) and parameters of peripheral circulation (physical examination and peripheral flow index (PFI)).
results
Twelve patients were admitted with low StO2 levels (StO2 <70%). The mean scores for SOFA and APACHE II scores were significantly higher in patients who persisted with low StO2 levels (n = 10) than in those who exhibited normal StO2 levels (n = 12) at 8 hours after the resuscitation period (P < 0.05; median (interquartile range): SOFA, 8 (7 to 11) vs. 5 (3 to 8); APACHE II, 32(24 to 33) vs. 19 (15 to 25)). There was no significant relationship between StO2 and mean global hemodynamic variables (HR, P = 0.26; MAP, P = 0.51; ScvO2, P = 0.11). However, there was a strong association between StO2 with clinical abnormalities of peripheral perfusion (P = 0.004), PFI (P = 0.005) and RincStO2 (P = 0.002). The persistence of low StO2 values was associated with a low percentage of lactate decrease (P < 0.05; median (interquartile range): 33% (12 to 43%) vs. 43% (30 to 54%)).
Conclusions
We found that patients who consistently exhibited low StO2 levels following an initial resuscitation had significantly worse organ failure than did patients with normal StO2 values, and found that StO2 changes had no relationship with global hemodynamic variables.

Low tissue oxygen saturation at the end of EGDT 125
INTrOdUCTION
A more complete evaluation of tissue perfusion can be achieved by adding non-invasive assessment of peripheral perfusion to global parameters [1]. Non-invasive monitoring of peripheral perfusion is an alternative approach that allows very early application throughout the hospital, including the emergency department, operating room, and hospital wards. The rationale of monitoring peripheral perfusion is based on the con-cept that peripheral tissues are the first to reflect hypoperfusion in shock and the last to reperfuse during resuscitation [1,2]. Poor peripheral perfusion may therefore be consid-ered an early predictor of tissue hypoperfusion and a warning signal of ongoing shock.
In the clinical practice, non-invasive monitoring of peripheral perfusion can be per-formed easily using current new technologies, such as near-infrared spectroscopy (NIRS) [3]. NIRS technology has been used as a tool to monitor tissue oxygen saturation (StO2) in acutely ill patients [4]. In addition, the analysis of changes in StO2 during a vascular occlusion test, such as a brief episode of forearm ischemia, has been used as a marker of integrity of the microvasculature - in particular, the StO2 recovery after the vascular occlusion test [5-7]. These reports, however, have studied the correlation of intermittent StO2 measurements and outcome where there are only limited data describing whether continuous monitoring of StO2 during the early resuscitation phase is related to mor-bidity or to mortality.
We therefore conducted the present prospective observational study to investigate the association between continuous StO2 measurements during early resuscitation of high-risk patients and subsequent adverse outcomes. The primary study objective was to investigate whether persistence of low StO2 values during early goal-directed therapy could help to identify patients with more severe organ dysfunction and severity of disease as expressed by Sequential Organ Failure Assessment (SOFA) and Acute Physi-ology and Chronic Health Evaluation (APACHE) II scores. Because the value of StO2 as a parameter of peripheral perfusion is not quite clear, we also investigated the relation of low StO2 values with global hemodynamic and peripheral circulation parameters.
MATHerIAl ANd MeTHOdS
Study population
The current prospective observational study was conducted in the intensive care unit (ICU) of a university hospital. We enrolled 22 consecutive critically ill patients with increased lactate levels (>3 mmol/l) who had no history of severe peripheral vascular disease. The institutional review board approved the study. Each patient or relative provided written informed consent.

126 Chapter 7
Measurements
Global hemodynamic variables included the heart rate (HR), central venous pressure, mean arterial pressure (MAP) and central venous oxygen saturation (ScvO2). All mea-surements were obtained using standard equipment. ScvO2 was measured continu-ously with a fiber-optic probe (CeVOX®; Pulsion Medical Systems AG, Munich, Germany). Thenar StO2 was continuously monitored using an InSpectra Tissue Spectrometer Model 650 (Hutchinson Technology Inc., Hutchinson, MN, USA) with a 15 mm probe over the thenar eminence. Based on the variability of StO2 values in previous studies, we used a cut-off value of 70% to define the StO2 level as low [5-11].
We measured the StO2 response to the vascular occlusion test to investigate peripheral perfusion reactivity. The vascular occlusion test was performed using a sphygmomanom-eter cuff wrapped around the arm over the brachial artery. After a 1-minute period to stabilize the NIRS signal, the cuff was rapidly inflated until 30 mmHg above the systolic arterial pressure. After 3 minutes of ischemia, the sphygmomanometer was rapidly de-flated and the StO2 was recorded until the StO2 level returned to baseline values. The vascular occlusion test-derived StO2 traces were analyzed for the rate StO2 of increase (RincStO2) during the release. We calculated the RincStO2 slope obtained by the regres-sion line between the lowest StO2 value and the StO2 correspondent to the baseline value following the ischemic period (slope, expressed as percent per second). One individual who was blinded from all treatment and clinical data performed the NIRS measurements.
Peripheral circulation parameters included physical examination of peripheral perfu-sion and the peripheral flow index (PFI). Based on physical examination of peripheral perfusion, patients were considered to have abnormal peripheral perfusion if the exam-ined extremities (both hands) had an increase in capillary refill time or were cool to the examiner’s hands. The capillary refill time was measured by applying firm pressure to the distal phalanx of the index finger for 15 seconds. A chronometer recorded the time for the return of the normal color and 4.5 seconds was defined as the upper limit of normal-ity [12]. The PFI provides a non-invasive method for evaluating perfusion and has been shown to reflect changes in peripheral perfusion [13,14]. The PFI is derived from the pulse oximetry signal, which was obtained from a Nellcor-OxiMax pulse oximeter and Hewlett Packard monitor (Viridia 56S, Philips Medical Systems, Boblingen, Germany). The ICU contains single-person closed rooms, and the ambient temperature in each patient’s room was individually and actively set at 22°C.
Study protocol
All patients were followed during the first 8 hours after ICU admission. Hemodynamic support in all patients - including vasopressor (noradrenaline) and, if needed, addition of dobutamine - was aimed at standard resuscitation endpoints adapted from the Surviv-ing Sepsis Campaign Guidelines to maintain HR <100/minute, MAP ≥60 mmHg, central

Low tissue oxygen saturation at the end of EGDT 127
venous pressure of 8 to 12 mmHg, urinary output ≥0.5 ml/kg/hour and ScvO2 ≥70% [15]. Measurements, obtained continuously between admission and the 8-hour period of resuscitation, included temperature, all global hemodynamic variables, StO2, the PFI and physical examination of peripheral perfusion. Arterial blood samples were withdrawn simultaneously for lactate measurement. The vascular occlusion test was performed at two time points: immediately upon admission to the ICU and again after 8 hours of re-suscitation. Basic demographic characteristics, APACHE II and SOFA scores were collected for each patient. Clinical and laboratory data needed to calculate the SOFA and APACHE II scores were reported as the worst value within 24 hours after ICU admission.
Hyperlactatemia was defined as a blood lactate level >3 mmol/l. We calculated the percentage of lactate decrease over the first 8-hour period of ICU admission. All patients were mechanically ventilated and sedation with midazolam and analgesia was provided according to individual needs.
Statistical analysis
Unless otherwise specified, the results are presented as the median (interquartile range). Differences between group means were tested by Student t-tests; for variables that were not normally distributed, differences were tested by a nonparametric test. For clinical characteristics of the study groups, differences between groups were assessed using Fisher’s exact test. The multiple regression analysis adjusted for global hemodynamic variables (HR, MAP and central venous pressure) was used to analyze the impact of the persistence of StO2 <70% on the SOFA and APACHE II scores. We used the linear mixed-model analysis to assess the magnitude of contribution from each systemic and peripheral physiological variable on all repeated StO2 measurements during the 8-hour period of resuscitation. P ≤ 0.05 was considered statistically significant.
reSUlTS
Patients’ demographic data are summarized in table 1. All data used in the analysis were obtained at 2, 4, 6 and 8 hrs after admission.
To explore the relationship between changes of StO2 and the severity of organ dysfunction, we stratified patients according to the evolution of StO2 levels within the 8-hour period of ICU resuscitation. Upon ICU admission, 12 (54%) patients had low StO2 levels. From these twelve patients, two patients showed normalization of the StO2 levels. All patients admitted with normal StO2 still had a normal StO2 at T8. Thus, after the 8 hrs of ICU resuscitation, a total of ten patients persisted with low StO2 and twelve patients with normal StO2 levels (Figure 1). Figure 2 shows the SOFA and APACHE II scores stratified by the groups at T8.

128 Chapter 7
The mean scores for both SOFA and APACHE II scores were significantly higher in pa-tients who persisted with low StO2 levels than those who exhibited normal StO2 levels at 8 hrs after the resuscitation period (P<0.05; median [IQR]; APACHE II: 32 [24-33] vs. 19 [15-25], SOFA: 8 [7-11] vs. 5 [3-8]) (Figure 2). Multiple regression analysis on low StO2 levels adjusted for global hemodynamic variables (HR, MAP and CVP) showed that low StO2 levels had a significant contribution for the prediction of SOFA (regression coef-ficient =3.0, 95% CI 2.2-5.7; P=0.04) and APACHE II (regression coefficient =9.1, 95% CI 3.3-13; P=0.026).
The relationship between all repeated StO2 measurements during the 8-hr period of resuscitation with standard hemodynamic variables and with peripheral circulation pa-rameters was assessed using the mixed-model analysis to further explore the contribution from each of these variables on the StO2 level. Table 2 shows the estimation coefficient from each variable. There was no significant relationship between StO2 and global he-modynamic variables. However, there was a strong association between StO2 and clinical abnormalities of peripheral perfusion, PFI and RincStO2. Table 3 shows the descriptive analysis of global hemodynamic variables and peripheral circulation parameters stratified by the level of StO2 at admission and after 8 hours. In patients who received vasopressor
Table1.
Patient demographic data
Number of patients 22
Age (years) 62 [57-71]
Male/Female 16/6
SOFA 7 [5-9]
APACHE II 23 [16-30]
Admission category:
Septic shock3 pneumonia3 abdominal sepsis1 meningitis
Circulatory failure not associated with sepsis
3 hypovolemic/hemorrhagic3 cardiogenic 4 postoperative2 trauma
Without circulatory failure or sepsis1 cerebrovascular accident2 postoperative
Noradrenaline use, N (%) 16 (72%)
Noradrenaline dose (µg/kg/min) 0.16 [0.07-0.24]
Dobutamine use, N (%) 8 (36%)
Dobutamine dose (µg/kg/min) 4.3 [3.6-6.3]
Mechanical ventilation, N (%) 15 (68%)
Survivor/Non-survivor 17/5
Values are expressed as medians [25th-75th]

Low tissue oxygen saturation at the end of EGDT 129
T0
T8
Patients admitted to the ICU with lactate
levels >3mmol/L(N=22)
StO2 <70%
Yes(N=12)
No(N=10)
No(N=12)
Yes(N=10)
figure 1. Evolution of StO2 levels in our patient population stratified by low (StO2 <70%) and normal (StO2 ≥70%) values upon admission (T0) and 8 h after resuscitation (T8). Patients were divided into two categories according to the StO2 evolution: patients who persisted with low StO2 at T8 and patients who exhibited normal StO2 levels at T8.
figure 2. Box plotting demonstrating the outcome score values stratified by the StO2 levels after 8 hrs of resuscitation. SOFA and APACHE II scores were significantly higher in patients who persisted with StO2 <70% (N=10) than those who exhibited normal StO2 levels (N=12) at 8 hrs after the resuscitation period. *P<0.05.

130 Chapter 7
therapy during resuscitation (N of patients=16; N of StO2 measurements=64), the dose of vasopressor (noradrenaline) did not differ between low (N=35) and normal (N=29) StO2 levels (P=0.13; median [IQR], in mcg/kg/min; 0.19 [0.10-0.33] vs. 0.13 [0.06-0.25]).
Although there was no difference in admission lactate levels between patients with low and normal StO2 levels (P=0.34; median [IQR]; 3.6 [2.2-6.0] vs. 3.4 [3.0-5.0]), the percentage of lactate decrease between T0 and T8 was significantly lower in patients who persisted with low StO2 levels (P<0.05; median [IQR]; 33% [12-43%] vs. 43% [30-54%]). A persistently low StO2 level was associated with increased mortality. Among the non-survivors, 4/5 (80%) had persistently low StO2 levels at T8 compared to 6/17 (35%) in the survivor group.
Table 2. Using the linear mixed models analysis, we assessed the magnitude of contribution from each systemic and peripheral physiological variables on all repeated StO2 measurements during the 8-hr period of resuscitation.
StO2 (Estimate, 95%CI) P value Number of observations
Systemic Hemodynamic:Heart rateMAPScvO2
-0.08 (-0.23-0.63)-0.05 (-0.22-0.11) 0.11 (-0.13-0.36)
0.260.510.36
888888
Peripheral circulation:Clinical abnormalitiesPFIRincStO2
5.7 (2.0-9.6) 8.1 (2.3-13.1)3.9 (2.1-6.0)
0.0040.0050.002
888844
MAP=mean arterial blood pressure; ScvO2=central venous oxygen saturation; PFI=peripheral flow index; RincStO2= rate of StO2 increase after the vascular occlusion test.
Table 3. Global hemodynamic variables and peripheral circulation parameters in patients with low StO2 (<70%) and normal StO2 (>70%) at admission (T0) and after 8 hours (T8)
T0 T8
Low StO2 (N=12)
Normal StO2 (N=10)
P valueLow StO2
(N=10)Normal StO2
(N=12)P value
Hr (bpm) 94 [79-122] 91 [82-106] 0.90 95 [79-113] 98 [74-122] 0.90
MAP (mmHg) 77 [64-94] 79 [72-85] 0.87 67 [60-75] 72 [68-85] 0.14
CVP mmHg) 15 [11-18] 12 [9-14] 0.20 19 [6-20] 15 [7-15] 0.34
SvO2 (%) 75 [63-79] 73 [68-84] 0.38 77 [68-85] 70 [65-80] 0.46
PfI (%) 0.2 [0.2-0.7] 1.8 [0.8-3.7] 0.001 0.9 [0.4-1.1] 2.1 [1.2-3.0] 0.004
Clinical APP, N (%) 11 [92%] 3 (30%) 0.006* 9 (90%) 1 (8%) 0.001*
rincStO2 (%/s) 1.8 [1.4-2.0] 4.0 [2.6-4.7] 0.001 1.7 [1.2-2.5] 4.4 [2.9-4.7] 0.003
Values are expressed as median [25th-75th]. HR=heart rate; MAP=mean arterial blood pressure; CVP=central venous pressure; ScvO2=central venous oxygen saturation; PFI=peripheral flow index; Clinical APP=clinical abnormalities of peripheral perfusion; RincStO2= rate of StO2 increase after the vascular occlusion test. * Fisher’s Exact Test.

Low tissue oxygen saturation at the end of EGDT 131
dISCUSSION
In this prospective observational study, we performed repeated StO2 measurements in critically ill patients to test the hypothesis that the persistence of low StO2 levels during the early resuscitation phase of therapy is associated with a more severe organ dysfunc-tion. The most important finding in our study is that patients who failed to normalize StO2 during early treatment in the ICU had more severe organ dysfunction and disease severity, as assessed by SOFA and APACHE II scores. The higher SOFA score in our pa-tients with low StO2 levels could have been related to therapeutic interventions applied guided by global hemodynamic measurements. However, the association between low StO2 levels and organ failure in our patients was not accompanied by any major differences in either global hemodynamic or doses of vasopressor therapy between patients with low and normal StO2. In addition, we also found that the APACHE II score was significantly higher in patients with low StO2 levels. The APACHE II score differs from the SOFA score since the former is not adjusted for the use of vasoactive drugs. Therefore, these findings suggest that the presence of low StO2 levels does not reflect global hemodynamic effects or vasoconstriction from a pharmacologic intervention.
The association between low StO2 levels and organ failure in our patients were ac-companied by alterations in clinical abnormalities of peripheral perfusion. Current observations have shown a significant association between clinical abnormal peripheral perfusion and severity of organ dysfunction in patients suffering from either septic or non-septic shock [16-19]. This relationship is supported by our study. The association of low StO2 levels with clinical abnormalities of peripheral perfusion in our patients may partly explain the relationship between abnormal peripheral perfusion and a worse outcome. Additionally, low StO2 levels were also associated with a slow rise in StO2 fol-lowing a vascular occlusion test. Abnormal RincStO2 levels have been shown to reflect a variety of dynamic variables linked to local metabolic demand and vascular reactivity that have been associated with outcome in critically ill patients [5-7]. A causal relation-ship between low StO2 and abnormal RincStO2 in our patients is not clear, as it was not the topic of this study. Furthermore, the association between an abnormal RincStO2 and low StO2 levels is not always present, as previous reports have shown a decreased RincStO2 in the presence of normal StO2 values [5, 6]. However, in our patients abnor-mal RincStO2 and low StO2 values were associated with a low PFI, indicating either peripheral vasoconstriction and/or impairment of microcirculatory flow as indicated by the slowed reperfusion during ischemic recovery [20].
Although there was no difference in admission lactate levels, the percentage of lactate decrease during the study was significantly lower in patients who consistently exhibited low StO2 values. The interpretation of hyperlactatemia in critically ill patients is com-plex, and factors other than hypoperfusion may be involved [21]. Both hyperlactatemia

132 Chapter 7
at admission and the lack of its reduction during ICU treatment have been related to increased mortality [22-24]. The correlation between hyperlactatemia and low StO2 in our patients could be related to the presence of tissue hypoperfusion [22, 25, 26]. Nevertheless, our findings support previous reports, including our own, showing that patients with clinical abnormal peripheral perfusion following resuscitation are more likely to remain hyperlactatemic [19, 27].
Regardless of the cause of peripheral tissue hypoperfusion, our data provide evidence that the persistence of low StO2 values could have implications for the treatment of critically ill patients. Restoration of global hemodynamic parameters without an associ-ated normalization of StO2 may warrant further or intensified resuscitation efforts. As the thenar muscle StO2 monitoring is safe, non-invasive, easily obtained at the bedside enabling the physicians to identify patients with peripheral tissue hypoperfusion it may represent a valuable addition to our monitoring tools and end-points of goad-directed therapy. However, the clinical value of repeated StO2 measurements must be inves-tigated further to assess whether a resuscitation goal of normalizing StO2 levels will improve patient outcome.
This study has some limitations that should be acknowledged. First, previous studies have suggested that resting StO2 values are insensitive indicators of tissue perfusion [5-7]. These studies noted that both patients and healthy controls had similar StO2 levels despite evidence of impaired systemic oxygenation in patients. However, in these stud-ies a StO2 threshold as well as time factor was not taken into account. In our study, the repeated measurements of StO2 during early resuscitation were the prognostic factor and the persistence of StO2 levels below the threshold of 70% was associated with the development of a more severe organ injury. Although the optimal StO2 threshold has not been fully investigated and not yet determined in critically ill patients, we arbitrary chose 70% based on previous studies done in healthy volunteers, emergency and in-tensive care patients [5-11]. Second, the number of patients included in the study was limited. Only two patients changed their StO2 level from low to normal; therefore, the prognostic value in this particular group could not be studied. However, it is clear from our findings that patients who consistently showed low StO2 values within the first 8 hrs of ICU treatment had a significantly higher rate of unfavourable outcome. Addition-ally, the absence of low StO2 levels identified patients with a more favourable outcome. Finally, measurements of global blood flow (cardiac output) were not made in this study. Our main focus, however, was to assess the relationship between the presence of low StO2 level following our standard hemodynamic optimization protocol and organ dysfunction.
In conclusion, we established the usefulness of the continuous monitoring of StO2 during the early resuscitation of critically ill patients. We found that patients who re-mained having low StO2 levels following an initial resuscitation had significantly worse

Low tissue oxygen saturation at the end of EGDT 133
organ failure than did patients with normal StO2 values. In addition, low StO2 levels were only accompanied by alterations in the peripheral circulation indicating that StO2 abnormalities are closely related to regional hemodynamics rather than macrohemody-namics.

134 Chapter 7
refereNCeS
1. Chien LC, Lu KJ, Wo CC, Shoemaker WC: Hemodynamic patterns preceding circulatory deteriora-tion and death after trauma. Journal of Trauma 2007, 62:928-932.
2. Poeze M, Solberg BC, Greve JW, Ramsay G: Monitoring global volume-related hemodynamic or regional variables after initial resuscitation: What is a better predictor of outcome in critically ill septic patients? Crit Care Med 2005, 33:2494-2500.
3. Lima A, Bakker J: Noninvasive monitoring of peripheral perfusion. Intensive Care Med 2005, 31:1316-1326.
4. Creteur J: Muscle StO2 in critically ill patients. Curr Opin Crit Care 2008, 14:361-366. 5. Creteur J, Carollo T, Soldati G, Buchele G, De Backer D, Vincent JL: The prognostic value of muscle
StO2 in septic patients. Intensive Care Med 2007, 33:1549-1556. 6. Gomez H, Torres A, Polanco P, Kim HK, Zenker S, Puyana JC, Pinsky MR: Use of non-invasive NIRS
during a vascular occlusion test to assess dynamic tissue O(2)saturation response. Intensive Care Med 2008, 34:1600-1607.
7. Skarda DE, Mulier KE, Myers DE, Taylor JH, Beilman GJ: Dynamic near-infrared spectroscopy measurements in patients with severe sepsis. Shock 2007, 27:348-353.
8. Taylor DE, Simonson SG: Use of near-infrared spectroscopy to monitor tissue oxygenation. New Horiz 1996, 4:420-425.
9. McKinley BA, Marvin RG, Cocanour CS, Moore FA: Tissue hemoglobin O2 saturation during resus-citation of traumatic shock monitored using near infrared spectrometry. Journal of Trauma 2000, 48:637-642.
10. Ikossi DG, Knudson MM, Morabito DJ, Cohen MJ, Wan JJ, Khaw L, Stewart CJ, Hemphill C, Manley GT: Continuous muscle tissue oxygenation in critically injured patients: a prospective observa-tional study. Journal of Trauma 2006, 61:780-788.
11. Cohn SM, Nathens AB, Moore FA, Rhee P, Puyana JC, Moore EE, Beilman GJ: Tissue oxygen saturation predicts the development of organ dysfunction during traumatic shock resuscitation. Journal of Trauma 2007, 62:44-54.
12. Schriger DL, Baraff L: Defining normal capillary refill: variation with age, sex, and temperature. Annals of Emergency Medicine 1988, 17:932-935.
13. Lima AP, Beelen P, Bakker J: Use of a peripheral perfusion index derived from the pulse oximetry signal as a noninvasive indicator of perfusion. Critical Care Medicine 2002, 30:1210-1213.
14. Galvin EM, Niehof S, Verbrugge SJ, Maissan I, Jahn A, Klein J, van Bommel J: Peripheral flow index is a reliable and early indicator of regional block success. Anesth Analg 2006, 103:239-243.
15. Dellinger RP, Levy MM, Carlet JM, Bion J, Parker MM, Jaeschke R, Reinhart K, Angus DC, Brun-Buisson C, Beale R, Calandra T, Dhainaut JF, Gerlach H, Harvey M, Marini JJ, Marshall J, Ranieri M, Ramsay G, Sevransky J, Thompson BT, Townsend S, Vender JS, Zimmerman JL, Vincent JL: Surviv-ing Sepsis Campaign: international guidelines for management of severe sepsis and septic shock: 2008. Critical Care Medicine 2008, 36:296-327.
16. Hasdai D, Holmes DR, Jr., Califf RM, Thompson TD, Hochman JS, Pfisterer M, Topol EJ: Cardiogenic shock complicating acute myocardial infarction: predictors of death. GUSTO Investigators. Global Utilization of Streptokinase and Tissue-Plasminogen Activator for Occluded Coronary Arteries. Am Heart J 1999, 138:21-31.
17. Thompson MJ, Ninis N, Perera R, Mayon-White R, Phillips C, Bailey L, Harnden A, Mant D, Levin M: Clinical recognition of meningococcal disease in children and adolescents. The Lancet 2006, 367:397-403.

Low tissue oxygen saturation at the end of EGDT 135
18. Evans JA, May J, Ansong D, Antwi S, Asafo-Adjei E, Nguah SB, Osei-Kwakye K, Akoto AO, Ofori AO, Sambian D, Sylverken J, Busch W, Timmann C, Agbenyega T, Horstmann RD: Capillary refill time as an independent prognostic indicator in severe and complicated malaria. J Pediatr 2006, 149:676-681.
19. Lima A., Jansen T, van Bommel J, Ince C., Bakker J: The Prognostic Value of the Subjective Assess-ment of Peripheral Perfusion in Critically Ill Patients. Critical Care Medicine 2008, 37:934-938.
20. Lima A, Ince C, Bakker J: Use of tissue oxygenation saturation in association with skin tempera-ture as an indicator of the peripheral tissue perfusion in critically ill patients. Critical Care 2009, 13:s236.
21. Bakker J: Lactate: may I have your votes please? Intensive Care Med 2001, 27:6-11. 22. Bakker J, Gris P, Coffernils M, Kahn RJ, Vincent JL: Serial blood lactate levels can predict the devel-
opment of multiple organ failure following septic shock. Am J Surg 1996, 171:221-226. 23. Nguyen HB, Rivers EP, Knoblich BP, Jacobsen G, Muzzin A, Ressler JA, Tomlanovich MC: Early
lactate clearance is associated with improved outcome in severe sepsis and septic shock. Crit Care Med 2004, 32:1637-1642.
24. Smith I, Kumar P, Molloy S, Rhodes A, Newman PJ, Grounds RM, Bennett ED: Base excess and lactate as prognostic indicators for patients admitted to intensive care. Intensive Care Med 2001, 27:74-83.
25. Roumen RM, Redl H, Schlag G, Sandtner W, Koller W, Goris RJ: Scoring systems and blood lactate concentrations in relation to the development of adult respiratory distress syndrome and mul-tiple organ failure in severely traumatized patients. Journal of Trauma 1993, 35:349-355.
26. Durham RM, Moran JJ, Mazuski JE, Shapiro MJ, Baue AE, Flint LM: Multiple organ failure in trauma patients. Journal of Trauma 2003, 55:608-616.
27. Kaplan LJ, McPartland K, Santora TA, Trooskin SZ: Start with a subjective assessment of skin temperature to identify hypoperfusion in intensive care unit patients. J Trauma 2001, 50:620-627.


Chapter 8The relation of near- infrared spec troscopy with changes in peripheral circulation in cr it ical ly i l l patients
Crit Care Med 2011 Jul; 39(7):1649-5
Alexandre Lima, Jasper van Bommel, karolina Sikorska, Michel E. van Genderen,
Eva Klijn, Emmanuel Lesaffre, Can Ince, Jan Bakker


Chapter 8aLet ter to the editor : Noninvasive does not mean simple or accurate!
Crit Care Med 2012, 40(2):713-4
Alexandre Lima, Jan Bakker

140 Chapter 8a
AbSTrACT
Objective: We conducted this observational study to investigate tissue O2 saturation (StO2) during a vascular occlusion test (VOT) in relationship with the condition of pe-ripheral circulation and outcome in critically ill patients.
design: Prospective observational studySetting: Multidisciplinary Intensive Care Unit in a University Hospital.Patients: Seventy three critically ill adult patients admitted to the intensive care unit.Interventions: None.
Measurements and main results: Patients were followed every 24 h until day 3 after intensive care admission. Near-infrared spectroscopy (NIRS) was used to measure thenar StO2, StO2 deoxygenation rate (RdecStO2) and StO2 recovery rate (RincStO2) after VOT. Measurements included heart rate (HR), mean arterial pressure (MAP), forearm-to-fingertip skin-temperature gradient (Tskin-diff) and physical examination of peripheral perfusion with capillary refill time (CRT). Patients were stratified according to the condi-tion of peripheral circulation (abnormal: Tskin-diff ≥4 and CRT>4.5 sec). The outcome was defined based on daily SOFA score and blood lactate levels. Upon ICU admission, 35 (47.9%) patients had abnormal peripheral perfusion (Tskin-diff>4 or CRT >4.5s). With the exception of RdecStO2, StO2 baseline and RincStO2 were statistically lower in patients who exhibited abnormal than in those with normal peripheral perfusion: 72±9 vs. 81±9; P=0.001 and 1.9±0.7 vs. 3.2±0.9; P=0.001, respectively. When a mixed-model analysis was performed over time for estimate (s) calculation, adjusted to the condition of disease, we did not find a significant clinical effect between VOT-derived StO2 measurements (as re-sponse variables) and mean systemic hemodynamic variables (as independent variables): StO2 vs. HR: s (95% CI)= 0.007 (-0.08; 0.09); StO2 vs. MAP: s (95% CI)= -0.02 (-0.12 ; 0.08); RdecStO2 vs. HR: s (95% CI)=0.002 (-0.0004; 0.006); RdecStO2 vs. MAP: s (95% CI)=0.0007 (-0.003 ; 0.004); RincStO2 vs. HR: s (95% CI)=-0.009 (-0.02; -0.0015); RincStO2 vs. MAP: s (95% CI)=0.01 (0.002 ; 0.018). However, there was a strong association between StO2 baseline and RincStO2 with abnormal peripheral perfusion (APP): StO2 vs. APP: s (95% CI)=-10.1 (-13.9; -6.2); RincStO2 vs. APP: s (95% CI)=-1.1 (-1.4; -0.81). Poor outcome was more closely related to abnormalities in peripheral perfusion than to StO2-derived parameters.
Conclusions: We found that the condition of peripheral circulation in critically ill pa-tients strongly influences StO2 resting values and StO2 reoxygenation rate, but not StO2 deoxygenation rate. In addition, changes in NIRS-derived variables were independent of condition of disease and were not accompanied by any major differences in systemic hemodynamic.

Noninvasive does not mean simple or accurate! 141
INTrOdUCTION
Near-infrared spectroscopy (NIRS) has been used as a tool to monitor tissue oxygen saturation (StO2) in critically ill patient (1). In addition, changes in StO2 during a vascular occlusion test (VOT) have been used as a marker of microvascular reactivity, in particular the StO2 recovery after the VOT (2- 5). During a VOT (upper arm arterial occlusion with a pneumatic cuff ), depletion of local available oxygen is monitored by NIRS as a decrease in StO2; after the cuff release, the arterial inflow is monitored as the rate of StO2 increase during the reperfusion phase. The former can be used to calculate the muscle oxygen consumption and metabolic rate, whereas the latter can be used to quantify the inten-sity of the reactive hyperemia during the reperfusion period.
The utility of NIRS in the management of critically ill patients is still a matter of debate. Increasing publications using NIRS have described profound alterations in microvas-cular function in patients suffering from different pathophysiologic conditions such as sepsis and traumatic shock (6, 2- 4). However, most of these studies have concentrated on correlating NIRS-dynamic variables with the condition of disease or with the patient’s hemodynamic variables, and failed to show any consistent relationship with these parameters. For example, De Blasi et al (6) demonstrated that StO2 recovery rate after a VOT was similar between septic and postsurgical patients. Similarly, Gomez et al. (3) using the same variable reported no differences between hemodynamically stable and unstable trauma patients.
Considering that hemoglobin levels and arterial oxygen saturation remain unchanged, local vasomotor tone is one of the main determinants of peripheral blood flow and thus tissue oxygen delivery. This suggests that NIRS measurements may be more correctly interpreted if measured in association with parameters that reflect the condition of peripheral circulation. Bedside assessment of peripheral blood flow is difficult and it has not yet been incorporated into routine clinical practice. An alternative method to estimate peripheral blood flow variations at the bedside is using forearm-to-fingertip skin-temperature gradient (Tskin-diff ) together with physical examination. Considering a constant environment condition, a Tskin-diff threshold of 4ºC has been showed to reflect vasoconstriction in critically ill patients (7, 8). Other data recently reported by our group showed that clinical abnormalities of peripheral perfusion assessed by physical examination were associated to an unfavourable outcome in critically ill patients (9). The objective of this study was, therefore, to propose a different approach for the interpreta-tion of StO2-derived parameters by adding temperature measurements and physical examination of peripheral perfusion during StO2 monitoring and to characterize the pattern of StO2 dynamic in patients with peripheral vasoconstriction and vasodilation. Additionally, we investigated the relation of both parameters in identifying an unfavour-able outcome for severe organ and metabolic dysfunction.

142 Chapter 8a
MATHerIAl ANd MeTHOdS
Study population
This prospective observational study was conducted in the intensive care of a university hospital. We enrolled consecutive critically ill patients within 24h of ICU admission who had undergone initial resuscitation and stabilization. Patients were excluded if they had severe peripheral vascular disease (with a history of vascular surgery). The institutional review board approved the study. Each patient or relative provided written informed consent.
Measurements
Peripheral circulation parameters included physical examination of peripheral perfu-sion with capillary refill time (CRT) and forearm-to-fingertip skin-temperature gradient (Tskin-diff ). Capillary refill time was measured by applying firm pressure to the distal phalanx of the index finger for 15 seconds. A chronometer recorded the time for the return of the normal colour and 4.5 seconds was defined as the upper limit of normal-ity (10). The Tskin-diff was obtained from two skin probes (Hewlett Packard 21078A) attached to the index finger and on the radial side of the forearm, mid-way between the elbow and the wrist. The temperature gradient Tskin-diff can better reflect cutane-ous blood flow than the skin temperature itself. Considering a constant environment condition, Tskin-diff increases during vasoconstriction and a threshold of 4ºC has been showed to reflect vasoconstriction in critically ill patients (7, 8). Patients were considered to have abnormal peripheral circulation if the examined extremities (both hands) had an increase in capillary refill time >4.5 seconds or when a Tskin-diff >4 ºC was present. The ICU has single-person closed rooms and the ambient temperature in each patient’s room was individually and actively set at 22oC.
Systemic hemodynamic variables included heart rate (HR) and mean arterial pres-sure (MAP). All measurements were obtained using standard equipments. Thenar StO2 was continuously monitored using an InSpectra Tissue Spectrometer Model 650 (Hutchinson Technology Inc., Hutchinson, MN, USA) with a 15 mm probe over the thenar eminence. The VOT was performed by arrest of forearm blood flow using a conventional sphygmomanometer pneumatic cuff. The cuff was placed around the upper arm and was inflated to a pressure approximately 30 mmHg greater than systolic pressure for 3 minutes. On the completion of the ischemic period, the occluding cuff was rapidly deflated to 0 mmHg. VOT-derived StO2 parameters were divided into three components: resting StO2 values, rate of StO2 desaturation (RdecStO2, expressed as %/min) and rate of StO2 recovery (RincStO2, expressed as %/s). One individual who was blinded from all treatment and clinical data performed the NIRS measurements.

Noninvasive does not mean simple or accurate! 143
The first measurement was performed within 24 hours of intensive care admission after hemodynamic stability was obtained (MAP >65 mmHg, and no change in vaso-pressor use for 2h) every 24 h thereafter until day 3. Information collected at enrolment included demographic characteristics, Acute Physiology and Chronic Health Evaluation (APACHE) II score, Sequential Organ Failure Assessment (SOFA) score, and type of diag-nose admission. Because our study was not powered to investigate the association with mortality, we replaced this endpoint by SOFA and blood lactate levels, based on their high relationship with poor outcome (11, 12). The outcome of interest in this study was therefore defined as a SOFA score above 8 points plus hyperlactatemia, defined as a blood lactate level >2mmol/L. Clinical and laboratory data needed for SOFA and lactate were collected at the moment of measurement.
Statistics
Unless otherwise specified, results are presented as mean (SD). Differences between groups means were tested by Student’s t-tests; for variables that were not normally distributed, differences were tested by Mann-Whitney U test. The linear mixed model analysis was used to assess the magnitude of contribution from central temperature, mean arterial pressure, heart rate, dose of vasopressor therapy and abnormal periph-eral perfusion (Tskin-diff>4 or delayed capillary refill time) on all repeated StO2-derived parameters measured during the 3 days study (13). We used generalized mixed-model analysis to estimate slope coefficient prediction for poor outcome (SOFA>8 and lactate >2mmol/L) at each combination of days with abnormal peripheral perfusion and NIRS-derived variables (14). A P-value <0.05 was considered statistically significant. No correc-tion for multiple testing has been performed. Statistical analysis was performed using SPSS (version 15.0, SPSS, Chicago, IL) for t-test and nonparametric test and Statistical Analysis Software 9.2 (SAS Institute Inc. Cary, NC, USA) for mixed model analysis.
reSUlTS
Of 73 patients included in the study, 79% had circulatory shock on admission to ICU, of whom 57% had septic shock and 43% had no septic shock. All patients were under analgesia or sedation and tolerated well the 3 min of occlusion test in the arm. Table 1 summarizes the clinical data of the patients.
All data used in the analysis were obtained at 24, 48 and 72 hrs after admission. Six patients had one set of data collected on admission only and another six patients had their data collected on 24 and 48 hrs only. Upon ICU admission, 35 (47.9%) patients had abnormal peripheral perfusion following resuscitation and stabilization. Table 2 shows NIRS-dynamic variables stratified by the condition of peripheral perfusion upon

144 Chapter 8a
ICU admission. There was a statistically significant difference in StO2 and StO2 recovery between patients with normal and abnormal peripheral perfusion condition (Table 2).
The relationship of NIRS-dynamic variables to the standard hemodynamic, central temperature and peripheral circulation parameters was assessed using the mixed-model analysis to further explore the contribution from each of these variables on the StO2 de-rived parameters. After adjusting for hemodynamic variables (mean arterial pressure and heart rate) and for the diagnostic category (septic shock; circulatory shock not associated with sepsis; without shock and sepsis), the condition of peripheral circulation was found to have a major effect on StO2 and StO2 reoxygenation rate levels. Table 3 shows the esti-
Table 1.
Patient demographic data
Number of patients 15
Age (years) 63 [48-71]
Male/Female 9/6
SOFA 10 [5-11]
APACHE II 22 [16-27]
Admission category: 6 abdominal sepsis5 pneumonia
2 postoperative1 hemorrhagic shock1 meningitis
Noradrenaline use, N (%) 14 (93%)
Noradrenaline dose (µg/kg/min) 0.13 [0.03-0.40]
Mechanical ventilation, N (%) 15 (100%)
Survivor/Non-survivor 10/5
Table 2. Global hemodynamic variables recorded in the three different time points during execution of the study protocol (n = 15). Time points are defined as before nitroglycerin infusion (TBL1), at the maximum dose of nitroglycerin (TMX) and 30 min after cessation of nitroglycerin (TBL2). Cardiac index and stroke volume were measured in 6 patients. Data are mean (SE)
TBL1 TMX TBL2
HR (bpm) 95 (4.3) 97 (4.4) 98 (4.4)
SBP (mmHg) 113 (4.6) 94 (4.0)* 111 (3.8)*
DBP (mmHg) 52 (4.9) 49 (4.8)* 57 (4.9)*
MAP (mmHg) 75 (3.0) 61 (2.9)* 71 (2.3)*
CI, n=6 (L/min/m2) 4.1 (0.4) 3,8 (0.5) 3,9 (0.4)
SV, n=6 (ml) 78 (15) 66 (14) 77 (12)
HR=heart rate; SBP=systolic blood pressure; DBP=diastolic blood pressure; MAP=mean arterial blood pressure; CI=cardiac index; SV=stroke volume. * P<0.05 vs. previous time point (linear model for repeated measurements)

Noninvasive does not mean simple or accurate! 145
mation coefficient from each variable. The clinical importance of systemic hemodynamic variables was not significant or had no clinical impact on StO2-derived variables. However, there was a statistically significant association between StO2 and StO2 recovery with changes in the clinical condition of peripheral perfusion over time. Because the influence of abnormal peripheral perfusion on StO2 was different in each day, a separate estimation was calculated for the three days apart and is shown on table 3.
We also were interested to investigate whether StO2-derived variables were related to the pathophysiologic condition of disease. Accordingly, our patients were stratified by the presence of sepsis and/or shock condition. The linear mixed model analysis showed that the presence of sepsis or shock had no influence on the repeated StO2-derived parameters measured over time (StO2: P=0.72; RdecStO2: P=0.45; RincStO2: P=0.39), and were similar among patients with and without sepsis or shock (Figure 1). In patients who received vasopressor therapy (N=49), the dose of vasopressor did not differ be-tween peripheral vasoconstriction and vasodilation (N=25: 0.24±0.2 vs. N=24: 0.22±0.2; P=0.70). In addition, the estimation coefficient showed that the dose of vasopressor did not have any effect on StO2 (-2±3; P=0.44), RdecStO2 (1.12±1.15; P=0.42), and RincStO2 (-0.62±0.41; P=0.14). We found no relationship between StO2, RdecStO2, RincStO2 and mortality.
The coefficient prediction for poor outcome (SOFA>8 and lactate >2mmol/L) at each combination of days with abnormal peripheral perfusion and StO2-derived variables calculated with mixed-model showed that poor outcome was more closely related to abnormalities in peripheral perfusion than to StO2-derived parameters (Table 4).
Table 3. Peripheral perfusion parameters recorded in the three different time points during execution of the study protocol (n = 15). Time points are defined as before nitroglycerin infusion (TBL1), at the maximum dose of nitroglycerin (TMX) and 30 min after cessation of nitroglycerin (TBL2). RincStO2 and RdecStO2 were collected from 13 patients. Data are mean (SE).
Tbl1 TMx Tbl2
CRT (sec) 9.4 (0.6) 4.8 (0.3)* 7.1 (0.8)*
Tskin-diff ( oC) 3.3 (0.7) 0.7 (0.6)* 1.8 (0.6)*
PI.log (%.) -0.5 (0.2) 0.7 (0.1)* 0.2 (0.1)*
StO2 (%) 75 (3.4) 84 (2.7)* 79 (2.8)
THI (a.u.) 11.1 (1.3) 13.2 (1.4)* 11.6 (1.2)*
RincStO2, n=13 (%/sec) 1.9 (0.08) 2.8 (0.05)* 2.4 (0.09)*
RdecStO2, n=13 (%/min) 8.6 (0.5) 9.2 (0.6) 9.14 (0.7)
CRT=capillary refill time Tskin-diff= forearm-to-fingertip skin-temperature gradient; PI=Perfusion Index; THI=tissue hemoglobine index; RincStO2= rate of StO2 increase after arterial occlusion; RdecStO2=rate of StO2 deoxygenation during arterial occlusion. *P<0.05: previous time point (linear model for repeated measurements)

146 Chapter 8a
figure 1. Box plots demonstrating the time course of resting StO2, rate of StO2 desaturation (RdecStO2) and rate of StO2 recovery (RincStO2) in the different study groups (septic shock, no-septic shock and without sepsis and shock) during the 3 days of measurements
Table 4. Estimation of the effect of nitroglycerin dose on all parameters of peripheral perfusion
Estimate 95% CI P-value
Constant 8.9 [4.60, 13.10] 0.001
CRT (sec) -0.91 [-1.10, -0.50] 0.001
Tskin-diff ( oC) 0.35 [0.09, 0.61] 0.008
PI (%) 1.2 [0.55, 1.85] 0.001
StO2 (%) -0.02 [-0.07, 0.03] 0.42
StO2 (%), corrected for baseline StO2 0.30 [0.14, 0.47] 0.001
CRT=capillary refill time Tskin-diff= forearm-to-fingertip skin-temperature gradient; PI=Perfusion Index
Noninvasive does not mean simple or accurate! 147
dISCUSSION
The major new finding from this prospective observational study is that the condition of peripheral perfusion contributes significantly to NIRS-derived measurements of tissue oxygenation in critically ill patients. Using two distinct methods to evaluate peripheral perfusion (i.e., subjective assessment and skin temperature), we found that changes in peripheral circulation caused parallel changes in the StO2 resting values and in the StO2 reoxygenation rate, but not in the StO2 desaturation rate. In addition, changes in StO2-derived variables were independent of pathophysiologic condition of disease as well as hemodynamic status of the patient. Possible explanation of our findings is that StO2 measurement is an estimation of hemoglobine oxygen saturation in the small vessels and, therefore, is widely influenced by volume of the underlined vascular bed (arterioles, capillaries and small veins), which is decreased in peripheral vasoconstriction. The StO2 baseline represents the resting intravascular hemoglobine saturation levels and the StO2 recovery after the vascular occlusion represents the sudden increase of arterial inflow during the hyperaemic response. Unlike the StO2 deoxygenation rate during arterial oc-clusion in which venous outflow and arterial inflow are blocked, StO2 and StO2 recovery rate are influenced by local blood volume and vasomotor tone. The data from this study support this hypothesis. Patients who presented daily changes in the skin peripheral temperature significantly changed StO2 values independently of changes in heart rate and arterial blood pressure (Table 3). The effect of peripheral blood flow variations in the StO2 measurements has been described in previous reposts. In the study by Davis et al. (15), increases in skin blood flow during local heating in healthy volunteers significantly increased fourfold the StO2-derived tissue oxygenation. In addition, NIRS response to an ischemic challenge during the vascular occlusion test has been shown to correlate to that observed with gauge plethysmography and with laser Doppler fluoximetry (16, 17).
Among the investigations employing a NIRS device identical to the ones used in the present study, some have compared healthy volunteers with septic patients (18, 1, 4) while others have compared healthy volunteers with trauma patients (19, 20). To our knowledge, there are no studies comparing NIRS variables between septic and no-septic shock patients. Our study expands these observations with the demonstration that StO2-derived variables measured over time in a mixed ICU population were independent of disease condition. These findings are consistent with previous reports showing that peripheral blood flow is altered in different experimental and clinical shock condi-tions (21- 25). From an etiologic perspective, both septic and no septic shock shares a combination of pathological derangements present in the peripheral circulation. These alterations include impaired arteriolar vasoregulation and capillary perfusion that are observed mainly in peripheral vascular beds, including skin, muscle, sublingual and gut (26- 29). This may explain the mechanism for the decrease of StO2 and StO2 recovery in

148 Chapter 8a
critically ill patients. For the analysis of changes in the StO2 during VOT, the NIRS probe is usually placed over the thenar eminence, which represents a peripheral vascular bed and is widely influenced by local vasoregulation. This relationship is supported by our study. Considering that hemoglobin levels and arterial oxygen saturation remained unchanged in our patients, the association of StO2-derived variables with cold extremi-ties partly explain the relationship between local vasomotor tone and peripheral tissue oxygenation.
In clinical practice, one of the first strategies to treat circulatory failure is targeting blood pressure as traditional end-point of resuscitation as well as to guide hemodynamic therapy. Some evidence indicates that MAP should be kept above a minimum value of 60 mmHg. This level of MAP represents the point at which autoregulatory control of blood flow to the heart, kidneys, and brain ceases, resulting in pressure-dependent organ blood flow. When MAP falls below this range, organ blood flow also decreases in a linear fashion (30). Therefore, a MAP of 65–90 mmHg is a widely accepted and recom-mended blood pressure range for critically ill patients. Vasoconstrictive agent such as noradrenaline is usually the initial vasopressor to increase MAP. Noradrenaline acts on both alpha-1 and beta-1 adrenergic receptors, thus producing potent vasoconstriction as well as a less pronounced increase in cardiac output. The association between low StO2-derived variables and abnormal peripheral perfusion in our patients was not ac-companied by any major differences in either systemic hemodynamic or dose of vaso-pressor therapy. These findings suggest that the presence of abnormal StO2 levels does not reflect systemic hemodynamic effects or vasoconstriction from a pharmacologic intervention. This lack of association between StO2 measurements and systemic he-modynamic variables is not unexpected, since some studies have reported a degree of disconnection between the macrocirculation and the microcirculation, indicating that strategies to target arterial blood pressure in circulatory shock will not necessarily en-sure adequate regional perfusion (31- 33). In a study by LeDoux and colleagues (33), 10 patients with septic shock received increasing doses of norepinephrine to drive the MAP from 65 to 85 mmHg, with no changes in indices of regional perfusion (as measured by skin capillary blood flow, red blood cell velocity, urine output, and gastric mucosal par-tial pressure of CO2). The authors concluded that the use of a vasopressor to elevate the arterial blood pressure to above 65 mmHg in septic shock did not affect regional blood flow. This was recently supported by data from Dubin et al. (32) who reported the effects of titrating noradrenaline infusion to increase MAP level (65 to 85 mmHg) on sublingual microcirculation. Our results expand this knowledge by addressing the variation of pe-ripheral tissue oxygenation according to condition of peripheral circulation, and not to MAP or heart rate. In particular, the change in the StO2 and StO2 reoxygenation rate was strongly dependent on skin temperature. In this way, our data support the hypothesis that StO2 measurements may be more correctly interpreted if measured in association

Noninvasive does not mean simple or accurate! 149
with skin temperature, and strategies to improve peripheral tissue oxygenation should be investigated in association with the condition of peripheral circulation.
Although our study was not powered to investigate the association with mortality, we replaced this endpoint by SOFA and lactate. The rational of using SOFA and lactate is based on recent reports showing that the level and duration of blood lactate levels is associated with the magnitude of organ dysfunction as well as their high relationship with poor outcome (11, 12). Other data recently reported by our group showed that clinical abnormalities of peripheral perfusion assessed by physical examination were associated to an unfavourable outcome in critically ill patients (9). These findings are in agreement with the present study, in which clinical abnormalities of peripheral perfu-sion were correlated with SOFA and lactate, but not with StO2-derived variables (Table 4). Altered StO2-derived variables have also been associated with outcome in patients with either septic or non-septic shock (1). Taken together, our findings support the hypothesis that the outcome prediction of StO2-derived variables reported in previous studies is partially explained by the relationship between altered StO2-derived values and abnormalities of peripheral perfusion in critically ill patients.
This study has some limitations that should be acknowledged. First, measurements of global blood flow (cardiac output) were not made in this study. Our main focus, however, was to assess the relationship between StO2-derived variables and the condi-tion of peripheral perfusion. Second, we did not include other methods of peripheral blood flow monitoring, such as cutaneous laser Doppler flowmetry. Nevertheless, we speculate that any other noninvasive methods of peripheral flow could have shown the same association, as Tskin-diff is a well-validated method to estimate cutaneous blood flow. Third, changes in ambient temperature may have influenced skin temperature. Dif-ferences in ambient temperature at each patient’s bedside were not directly measured. However, the ICU consists of one-person closed rooms and the ambient temperature in each patient room was individually controlled at 22oC. Moreover, changes in ambi-ent temperature similarly affect forearm and fingertip temperature producing little influence in the gradient between forearm and fingertip (34). Last, we performed the VOT using a constant time interval of 3 min for the duration of occlusion time. Some studies, however, have used different occlusion times needed to reach a StO2 level of 40%. The former approach is based on the concept that the magnitude of the hyperemic response is dependent upon the duration of arterial occlusion, and the later method is based more on the level of StO2 after ischemia than the duration of ischemia. However, no supporting evidence in the literature show which of the methods is superior and more reliable to assess RincStO2 slope. Therefore, the results of our study can only be extended to studies that specifically use the methodology of 3 min occlusion time.
In conclusion, in this prospective observational study we found that the condition of peripheral perfusion contributes significantly to StO2-derived measurements of tissue

150 Chapter 8a
oxygenation in critically ill patients. Of all StO2-derived parameters, StO2 resting values and StO2 reoxygenation rate were most strongly associated with abnormal peripheral perfusion. In addition, changes in StO2-derived variables were independent of the di-agnosis and were not associated with significant differences in systemic hemodynamic.

Noninvasive does not mean simple or accurate! 151
refereNCeS
1. Creteur J, Carollo T, Soldati G, et al: The prognostic value of muscle StO2 in septic patients. Inten-sive Care Med 2007; 33:1549-1556
2. Doerschug KC, Delsing AS, Schmidt GA, et al: Impairments in microvascular reactivity are related to organ failure in human sepsis. Am J Physiol Heart Circ Physiol 2007; 293:H1065-H1071
3. Gomez H, Torres A, Polanco P, et al: Use of non-invasive NIRS during a vascular occlusion test to assess dynamic tissue O(2)saturation response. Intensive Care Med 2008; 34:1600-1607
4. Skarda DE, Mulier KE, Myers DE, et al: Dynamic near-infrared spectroscopy measurements in patients with severe sepsis. Shock 2007; 27:348-353
5. Lima A, van Bommel J, Jansen TC, et al: Low tissue oxygen saturation at the end of early goal-directed therapy is associated with worse outcome in critically ill patients. Crit Care 2009; 13 Suppl 5:S13
6. De Blasi RA, Palmisani S, Alampi D, et al: Microvascular dysfunction and skeletal muscle oxygen-ation assessed by phase-modulation near-infrared spectroscopy in patients with septic shock. Intensive Care Med 2005; 31:1661-1668
7. Sessler DI Skin-temperature gradients are a validated measure of fingertip perfusion. Eur J Appl Physiol 2003; 89:401-402
8. House JR, Tipton MJ Using skin temperature gradients or skin heat flux measurements to deter-mine thresholds of vasoconstriction and vasodilatation. Eur J Appl Physiol 2002; 88:141-145
9. Lima A, Jansen TC, van Bommel J, et al: The prognostic value of the subjective assessment of peripheral perfusion in critically ill patients. Crit Care Med 2009; 37:934-938
10. Schriger DL, Baraff L Defining normal capillary refill: variation with age, sex, and temperature. Annals of Emergency Medicine 1988; 17:932-935
11. Ferreira FL, Bota DP, Bross A, et al: Serial evaluation of the SOFA score to predict outcome in critically ill patients. Journal of the American Medical Association 2001; 286:1754-1758
12. Jansen TC, van Bommel J, Woodward R, et al: Association between blood lactate levels, Sequential Organ Failure Assessment subscores, and 28-day mortality during early and late intensive care unit stay: a retrospective observational study. Crit Care Med 2009; 37:2369-2374
13. G Verbeke, G Molenberghs: Linear mixed models for longitudinal data. New York, Springer-Verlag Inc, 2009
14. G Molenberghs, G Verbeke: Models for discrete longitudinal data. Springer Science Business Media, Inc, 2005
15. Davis SL, Fadel PJ, Cui J, et al: Skin blood flow influences near-infrared spectroscopy-derived measurements of tissue oxygenation during heat stress. J Appl Physiol 2006; 100:221-224
16. Payen D, Luengo C, Heyer L, et al: Is thenar tissue hemoglobin oxygen saturation in septic shock related to macrohemodynamic variables and outcome? Crit Care 2009; 13 Suppl 5:S6-
17. Harel F, Denault A, Ngo Q, et al: Near-infrared spectroscopy to monitor peripheral blood flow perfusion. J Clin Monit Comput 2008; 22:37-43
18. Pareznik R, Knezevic R, Voga G, et al: Changes in muscle tissue oxygenation during stagnant ischemia in septic patients. Intensive Care Med 2006; 32:87-92
19. McKinley BA, Marvin RG, Cocanour CS, et al: Tissue hemoglobin O2 saturation during resuscita-tion of traumatic shock monitored using near infrared spectrometry. Journal of Trauma 2000; 48:637-642
20. Cohn SM, Nathens AB, Moore FA, et al: Tissue oxygen saturation predicts the development of organ dysfunction during traumatic shock resuscitation. Journal of Trauma 2007; 62:44-54

152 Chapter 8a
21. Zhao KS, Junker D, Delano FA, et al: Microvascular adjustments during irreversible hemorrhagic shock in rat skeletal muscle. Microvasc Res 1985; 30:143-153
22. De Backer D, Creteur J, Dubois MJ, et al: Microvascular alterations in patients with acute severe heart failure and cardiogenic shock. Am Heart J 2004; 147:91-99
23. Sakr Y, Dubois MJ, De Backer D, et al: Persistent microcirculatory alterations are associated with organ failure and death in patients with septic shock. Critical Care Medicine 2004; 32:1825-1831
24. Krejci V, Hiltebrand L, Banic A, et al: Continuous measurements of microcirculatory blood flow in gastrointestinal organs during acute haemorrhage. Br J Anaesth 2000; 84:468-475
25. Kerger H, Waschke KF, Ackern KV, et al: Systemic and microcirculatory effects of autologous whole blood resuscitation in severe hemorrhagic shock. Am J Physiol 1999; 276:H2035-H2043
26. Dranzenovic R, Samsel RW, Wylam ME, et al: Regulation of perfused capillary density in canine intestinal mucosa during endotoxemia. Journal of Applied Physiology 1992; 72:259-265
27. De Backer D, Creteur J, Preiser JC, et al: Microvascular blood flow is altered in patients with sepsis. Am J Respir Crit Care Med 2002; 166:98-104
28. Neviere R, Mathieu D, Chagnon JL, et al: Skeletal muscle microvascular blood flow and oxygen transport in patients with severe sepsis. Am J Respir Crit Care Med 1996; 153:191-195
29. Weinberg JR, Boyle P, Thomas K, et al: Capillary blood cell velocity is reduced in fever without hypotension. Int J Microcirc Clin Exp 1991; 10:13-19
30. Guyton AC, Hall JE Local control of blood flow by the tissues, and humoral regulation. 2000; 10:175-182
31. Poeze M, Solberg BC, Greve JW, et al: Monitoring global volume-related hemodynamic or regional variables after initial resuscitation: What is a better predictor of outcome in critically ill septic patients? Crit Care Med 2005; 33:2494-2500
32. Dubin A, Pozo MO, Casabella CA, et al: Increasing arterial blood pressure with norepinephrine does not improve microcirculatory blood flow: a prospective study. Crit Care 2009; 13:R92-
33. Ledoux D, Astiz ME, Carpati CM, et al: Effects of perfusion pressure on tissue perfusion in septic shock. Crit Care Med 2000; 28:2729-2732
34. Lima A, Jansen T, Ince C, et al: Noninvasive monitoring of peripheral perfusion with physical examination and the peripheral flow index correlates with dynamic near-infrared spectroscopy measurements in patients with septic shock. Critical Care 2008; 12 (Suppl12):P60

Noninvasive does not mean simple or accurate! 153
leTTer TO THe edITOr (AUTHOr rePlY):
Critical Care Medicine 40(2), feb 2012, pp 713-4
THeNAr TISSUe OxYGeN SATUrATION MONITOrING: NONINVASIVe dOeS NOT MeAN SIMPle Or ACCUrATe!
We thank Dr Podbregar for the interest and comments about our paper. We did not use the probe spacing of 25 mm because this probe size is no longer available and has been replaced by the 650 model with probe spacing of 15 mm. However, we share same con-cerns of Dr Podbregar regarding probe size. The question that remains is whether the effect of clinical abnormalities on StO2 signal that we observed in our patients would be any different if using a 25 mm probe, which has deeper tissue penetration than the 15 mm probe. As nicely point out by Dr. Podbregar, probe spacing has been shown to provide different values mainly for VOT-derived StO2 measurements. Since probes detect mean StO2 across sampling measurement area, the relative proportion of muscle to skin that is sampled with 25 mm probe is greater than the 15 mm probe. Therefore, the 15 mm probe reports relatively more skin and subcutaneous tissue than muscle and is therefore under more influence of skin blood flow variations. We have emphasized this important point in our discussion and it is likely that the decreasing StO2 signal effect in our patients with clinical abnormalities in peripheral perfusion is mainly due to the up-per layers compromised perfusion as result of alterations in the cutaneous circulation, reflected by cold skin or delayed capillary refill time. The comments of Dr Podbregar shed a light in our study and bring to the discussion whether 15 mm probe has the appropriate spacing sensor to detect oxygenation mainly from muscle tissue. Therefore, regarding probe size we share the opinion that wider sensor spacing with greater tissue depth would be an alternative to decrease the relative contribution of skin blood flow to the total NIRS signal. However, before jumping to this conclusion, further investigation is required to compare the effect of changes in cutaneous circulation on StO2 signal measured with 25 mm probe spacing.
Another important point raised by Dr. Podbregar is related to the 3 min method of vas-cular occlusion test (VOT) used in our study. In others studies, the VOT has been made till the 40% threshold was reached (1,2). There is no standardization of arterial occlusion test, and no supporting evidence in the literature show which of the methods is superior and more reliable to assess the VOT-derived StO2 slopes. It is the opinion of this study’s authors that resaturation slope does not depend on StO2 level achieved, and that 3 min of occlusion time is more adequate to perform a VOT. Defining the StO2 40% maximal desaturation threshold for stopping the VOT is based on concept that ReOx depends on

154 Chapter 8a
the level of StO2 achieved during ischemia and thus it reflects same stimulus for reactive hyperemia for all patients. This argument, however, is in contrast with the physiological concepts of reactive hyperemia. This method of flow-mediated dilation induction of re-active hyperemia is a well understood method that has filled cardiovascular literature for over a decade. The guidelines for flow-mediated dilation testing recommend occluding arterial inflow for a standardized fixed length of time (3). The rationale of using a fixed occlusion time is based on the fact that reactive hyperaemia depends on endothelium, myogenic and tissue-derived metabolic factors, such as for example intravascular partial pressure of O2 (main hypoxic stimulus). Since StO2 is far to reflect any of these factors, let alone intravascular partial pressure of O2, and the duration of vascular occlusion test is known to influence the hyperaemic response, StO2 cannot be used as a threshold marker for hypoxic stimulus. Thus, time of ischemia has more important influence on VOT-derived values than level of StO2 itself. The recent study from Dr. Mayeur group (2) also supported the use of a fixed minimal muscle StO2 target (40%) over the use of 3 min. Dr Mayeur’s study, however, raised same issues as we have discussed above, some of them well addressed by Dr. Damoisel and Dr. Payen (4) in the editorial of Dr. Mayeur’s article. Regarding the deoxygenation rate, an arbitrary threshold of 40 % has been no logic for this parameter since it seems there is no difference in deoxygenation rate among different deflation thresholds (30%, 40%, and 50%) (5).
To conclude, our study aimed to extend our understanding of the effect of peripheral perfusion variations in critically ill patients to the NIRS signal. We found that peripheral perfusion condition contributes significantly to StO2-derived signal measured with a 15 mm probe on thenar. Therefore, the results of our study can only be extended to investigations that specifically use the InSpectra 650 model with a probe spacing of 15 mm and that employ the methodology of 3 min occlusion time.
refereNCeS
1. Gomez H, Torres A, Polanco P, et al: Use of non-invasive NIRS during a vascular occlusion test to assess dynamic tissue O(2)saturation response. Intensive Care Med 2008; 34:1600-1607
2. Mayeur C, Campard S, Richard C, et al: Comparison of four different vascular occlusion tests for assessing reactive hyperemia using near-infrared spectroscopy. Crit Care Med 2011; 39:695-701
3. Corretti MC, Anderson TJ, Benjamin EJ, et al: Guidelines for the ultrasound assessment of endo-thelial-dependent flow-mediated vasodilation of the brachial artery: a report of the International Brachial Artery Reactivity Task Force. J Am Coll Cardiol 2002; 39:257-265
4. Damoisel C, Payen D. Vascular occlusion tests: Do we need another definition? Crit Care Med 2011; 39(11):2587-8
5. Gómez H, Mesquida J, Simon P, et al: Characterization of tissue oxygen saturation and the vascu-lar occlusion test: influence of measurement sites, probe sizes and deflation thresholds. Crit Care 2009;13 Suppl 5:S3


PArT dImproving peripheral circulation


Chapter 9Nitroglycerin Improves Abnormal Peripheral Per fusion And T issue Ox ygenation In Patients With Circulator y Shock
NTG study, submitted
Alexandre Lima, Michel E. van Genderen, Eva Klijn, Tim C. Jansen, Jasper van
Bommel, Jan Bakker


PArT eGeneral discussion and main f indings


General discussion and main findings 177
GeNerAl dISCUSSION
Clinically, the major causes of poor tissue perfusion in critically ill patients can be divided into systemic and regional causes. Inadequate systemic function of circulation may be directly measured. However, regional causes of altered tissue perfusion are more difficult to measure and more tenuous in appearance. From an etiologic perspective, the most common cause of regional hypoperfusion in critically ill patients is alterations in the peripheral vascular function. A variety of factors contribute to these derange-ments in peripheral circulation, and most of these alterations are shared by both septic and nonseptic shock. They are currently attributed to a combination of pathological derangements including impaired arteriolar vasoregulation and capillary perfusion. These are mainly observed in the peripheral vascular beds, such as skin, muscle, and gas-trointestinal tract. Although these are functionally and metabolically different organs, at a circulatory functional level they are remarkably similar. Blood flow in these organs is moderately to strongly influenced by sympathetic vasoconstrictor mechanisms. In this regard, coronary, cerebral, and renal circulations show a high degree of autoregulation with poor sympathetic control, whereas skeletal muscle, gastrointestinal and cutaneous circulations show a predominant sympathetic control with a poor degree of autoregula-tion (1). Observations on the behaviour of the peripheral circulation permit the recogni-tion of two broad phases during the development of shock, irrespective of initiating factors. There is an initial period during which compensatory mechanism predominate, when the neurohumoural response-induced vasoconstriction preserves the perfusion of the vital organs at expense of decreased perfusion in the peripheral tissues. Blood flow variations, therefore, follow a similar response pattern in the skin, muscle and gastroin-testinal vascular beds, which makes these tissues highly sensitive for detecting occult tissue disoxia during acute circulatory shock. With the progression of circulatory shock and after initiation of appropriate therapy, the active participation of the peripheral cir-culation in supporting tissue perfusion becomes less striking and ultimately disappears. Some patients enter a phase of stability, and peripheral circulation alterations may no longer reflect the acute compensatory mechanisms. Others factors, such as mechanical ventilation, vasopressor, vasodilators, sedatives and opiates use overcome the neuro-humoral physiologic response. Nevertheless, these may explain why abnormalities in peripheral circulation still persist despite the patient systemic hemodynamic stability has been reached. Although the metabolic functional disturbances that occur in cutane-ous, muscle or gastrointestinal tissues following circulatory shock have been studied in detail, most of these studies are limited in comparing one vascular bed to another. To what extend each peripheral vascular bed contributes most to tissue hypoperfusion in shock remains to be studied.

178 General discussion and main findings
MAIN fINdINGS
In this thesis, we investigated the feasibility and relevance of monitoring peripheral perfusion in critically ill patients. We showed that noninvasive monitoring of peripheral perfusion is a complementary approach that allows very early application throughout the hospital, including the emergency department, operating room, and hospital wards (Chapter 1). Such approach can be easily applied using both simple clinical examination and new current technologies, particularly the pulse oximetry signal and near-infrared spectroscopy (Chapter 2).
Clinical examination of peripheral circulation
Clinical examination of peripheral circulation allows for rapid and repeated assessment of critically ill patients at the bedside. Peripheral circulation can be easily assessed per-forming a careful physical examination by touching the skin or measuring capillary refill time (CRT). Clinical signs of abnormal skin circulation consist of a cold, pale, clammy, and mottle skin, associated to an increase in CRT. Pressure is applied to the distal phalanx of the index finger for 15 seconds, squeezing the blood from the cutaneous tissue. A de-layed return of normal colour indicates decrease skin perfusion and it is usually related to decreased skin blood flow or cutaneous microcirculation derangement. Assessing the skin temperature will assist in evaluating the cause of sluggish capillary refill. Assuming normal core temperature, decreased skin blood flow as cause of delayed CRT can be estimated by measuring skin temperature, since cold extremities reflect constriction of cutaneous vessels that ultimately decreases the amount of blood volume within peripheral vasculature. Warm extremities indicate adequate cutaneous blood flow and a delayed CRT in this condition suggests cutaneous microcirculation derangement (Chapter 8). Over the past 30 years, the definition of a delayed CRT has been debated in the literature. Based on the clinical observations, the upper normal limit for CRT is often considered 2 seconds (2). However, a delayed return of more than 2 seconds seems to be of limited value in adult critically ill patients, since the upper limit of normality in a healthy population has been shown to be <4.5 seconds (3). Applying this upper limit of normality, we have been able to demonstrate that CRT >5 seconds at physical exam in patients following initial hemodynamic optimization in the intensive care unit was of great value to discriminate hemodynamically stable patients with more severe organ dysfunction, other than circulatory (chapter 6). In addition, patients with a prolonged CRT had significantly higher odds of worsening organ failure than patients with normal CRT. A CRT that is below or above 5 seconds seems to be a better clinical discriminator than the original 2 seconds.
Although skin temperature has been shown to be an easily accessible parameter for circulatory shock severity, body temperature gradients can better reflect changes in cuta-
General discussion and main findings 179
neous blood flow than the absolute skin temperature itself. Body temperature gradients are determined by the temperature difference between two measurement points, such as peripheral-to-ambient, central-to-toe, and forearm-to-fingertip (Tskin-diff ). Increased vasoconstriction during circulatory shock leads to decreased skin temperature and a diminished ability of the core to regulate its temperature before hypothermia occurs. Consequently, core temperature is maintained at the cost of the periphery to maintain vital organ perfusion, resulting in an increased central-to-peripheral temperature dif-ference, when vasoconstriction decreases fingertip blood flow. This concept permits the establishment of central-to-toe temperature difference as an indicator of peripheral perfusion in critically ill patients, and a normal temperature gradient of 3 to 7°C occurs once the patient’s haemodynamics have been optimised (Chapter 2). Because the ef-fect of the operating room environment on skin and body temperature changes during surgery, especially with the use of cardiopulmonary bypass, Tskin-diff may be a more reliable measurement, as the two skin temperatures are exposed to the same ambient temperature as the fingertip. In critically ill adult patients, Tskin-diff measurements conducted simultaneously with clinical observation have helped to address the reli-ability of subjective peripheral perfusion assessment, and are able to indicate abnormal peripheral perfusion in the post-resuscitation period (Chapter 2; Chapter 6).
Noninvasive Optical Monitoring
Optical methods apply light with different wave lengths directly to tissue components using the scattering characteristics of tissue to assess different states of these tissues (4). The assessment of tissue oxygenation is based on the specific absorption spectrum of oxygenated hemoglobin and deoxygenated hemoglobin. Commonly used optical methods for peripheral perfusion monitoring that can be clinically applied at the bedside are pulse oximeter signal (peripheral perfusion index) and near-infrared spectroscopy (Chapter 2).
Peripheral perfusion indexThe peripheral perfusion index (PPI) is derived from the photoeletric plethysmographic signal of pulse oximetry and has been used as a noninvasive measure of peripheral circulation in critically ill patients (Chapter 1). PPI is calculated as the ratio between the pulsatile component (arterial compartment) and the non-pulsatile component (other tissues) of the light reaching the detector of the pulse oximetry. Because the size of the pulsatile portion increases with vasodilation and decreases with vasoconstriction, changes in the PPI reflect changes in peripheral vasomotor tone. In our large population of healthy volunteers, the median PPI value was 1.4 % (Chapter 3). In critically ill patients, the same value was found to represent a very sensitive cutoff point for determining abnormal peripheral perfusion, as defined by a prolonged CRT and an increased skin

180 General discussion and main findings
temperature difference. The inclusion of PFI into the pulse oximetry signal is a recent advance in clinical monitoring and its easily obtainable and noninvasive method can be used for monitoring peripheral circulation in critically ill patients.
Near-Infrared SpectroscopyNear-infrared spectroscopy (NIRS) offers a technique for continuous, noninvasive, bed-side monitoring of tissue oxygenation. Like pulse oximetry, NIRS use the principles of light transmission and absorption to measure the concentrations of haemoglobin and oxygen saturation noninvasively in tissues. NIRS has a greater tissue penetration, which is directly related to the spacing between illumination and detection fibers. With 25 mm spacing, approximately 95% of the detected optical signal is from a depth of zero to 23 mm. The variables that are analysed using NIRS can either be directly calculated or derived from physiological interventions, such as a vascular occlusion test (VOT). Peripheral tissue oxygenation (StO2) measurements reported in the literature varied widely among studies using different probe spacing. Some have used the 15 mm probe spacing, while others have used the 25 mm probe spacing. Since probe spacing has been shown to provide different values mainly for VOT-derived StO2 measurements, we have investigated the influence of measurement sites (forearm and thenar) and probe spacing (15 mm and 25 mm) in the resting StO2 signal as well as in the VOT parameters (Chapter 4). We found that resting StO2 values were unrelated to probe spacing or measurement site. In the other hand, probe spacing and measurement site significantly influenced both deoxygenation and StO2-recovery rate. Based in our findings, we there-fore suggested using the 15 mm probe spacing on the thenar, as it provides reliable and more reproducible results.
Another important technical issue of NIRS-probe is related the potential impact of superficial tissues on NIRS light absorption and scattering. We have described an experi-ment study performed in healthy volunteers showing that the presence of peripheral vasoconstriction due to body surface cooling significantly affect StO2-derived mea-surements, particularly StO2 and StO2-recovery rate, which are exclusively dependent on local vasodilation capacity (Chapter 5 and 5a). We proposed that interpretation of peripheral tissue oxygenation should be performed in association with the condition of peripheral circulation. This finding has been supported by one study we performed to investigate the effect of peripheral perfusion variations in critically ill patients to the NIRS signal (Chapter 8). We found that peripheral perfusion condition contributes sig-nificantly to StO2-derived signal measured with a 15 mm probe on thenar. Additionally, we showed that the presence of sepsis or shock in our patients had no influence on the repeated StO2-derived parameters measured during consecutive three days. Variations in thenar StO2-derived variables were independent of the pathophysiologic condition

General discussion and main findings 181
of disease, and StO2-derived variables were similar among patients with and without sepsis or shock.
The utility of NIRS for managing critically ill patients remains a matter of debate. In-creasing publications using NIRS have described profound alterations in microvascular function in patients suffering from different pathophysiological conditions, such as sepsis and traumatic shock (Chapter 2). In a study by Shapiro et al., for instance (5), the dynamic NIRS variables collected during a VOT were strongly associated with the sever-ity of organ dysfunction and mortality in patients with septic shock. This is of special interest because there is a lack of agreement on standardisation for the appropriate method for performing a VOT (Chapter 8a). Nevertheless, when used in conjunction with other peripheral perfusion methods, repeated StO2 monitoring has the potential to assess the effect of therapeutic intervention on the peripheral microvascular circulation in various shock states. In our prospective observational study, StO2 and StO2-recovery rate after VOT were measured in 22 critically ill patients admitted with increased lactate levels (Chapter 7). We found that patients who consistently exhibited low StO2 levels following an initial resuscitation had significantly worse organ failure than did patients with normal StO2 values. Although NIRS can potentially be very useful for tissue oxygen-ation and perfusion assessments, additional studies are still being conducted to clarify its role in the clinical management of ICU patients.
Clinical Applications in Patient Management
From the above we can conclude that clinical and hemodynamic parameters must be combined with measures of peripheral circulation to continually monitor the critically ill patient as an attempt to maintain an adequate tissue perfusion. Although the mecha-nisms involved in shock resuscitation are not yet fully understood, it is clear that the persistence of abnormal peripheral circulation, measured in skin, muscle, sublingual or intestinal mucosa is associated with worse patient outcomes. It is likely that interven-tions specifically aimed at the peripheral vascular bed would have a greater effect on regional perfusion. This concept originated in the 1990’s with clinical trials of different types of vasodilators (prostacyclin, N-acetylcysteine) targeting splanchnic perfusion as assessed by gastric tonometry (6). These studies demonstrated an improvement in gastric perfusion with drug administration suggesting that successful microcircula-tory recruitment had occurred. More recently, some studies have evaluated short-term infusions of nitroglycerine in septic or non-septic shock and demonstrated significant improvements in capillary perfusion (7-9). In an effort to address weather nitroglycerin could correct abnormalities in peripheral perfusion in patients following initial resusci-tation after admission in the intensive care unit, we demonstrated that stepwise dose of intravenous infusion of nitroglycerin reverses clinical abnormalities of peripheral circulation in patients with circulatory shock (Chapter 9). In addition, we showed that

182 General discussion and main findings
the easy and reliable clinical parameters of peripheral perfusion can be an effective monitoring approach at the bedside to titrate the beneficial effects of nitroglycerin on microcirculation in individual patient with circulatory shock following initial resuscita-tion. Whether this intervention is capable of resuscitating different peripheral vascular beds remains to be determined. Current studies are ongoing to determine the effects of these interventions on peripheral circulation in critically ill patients.
refereNCeS
(1) Guyton AC, Hall JE. Local control of blood flow by the tissues, and humoral regulation. In: Guyton AC, Hall JE, editors. Textbook of Medical Physiology. Philadelphia: W.B. Sounders Company, 2000: 175-182.
(2) Champion HR, Sacco WJ, Copes WS, Gann DS, Gennarelli TA, Flanagan ME. A revision of the Trauma Score. J Trauma 1989; 29(5):623-629.
(3) Schriger DL, Baraff L. Defining normal capillary refill: variation with age, sex, and temperature. Ann Emerg Med 1988; 17(9):932-935.
(4) Flewelling R. Noninvasive optical monitoring. In: Bronzino JD, editor. The Biomedical Engineering Handbook. Springer, 2000: 1-10.
(5) Shapiro NI, Arnold R, Sherwin R, O’Connor J, Najarro G, Singh S et al. The association of near-infrared spectroscopy-derived tissue oxygenation measurements with sepsis syndromes, organ dysfunction and mortality in emergency department patients with sepsis. Crit Care 2011; 15(5):R223.
(6) Buwalda M, Ince C. Opening the microcirculation: can vasodilators be useful in sepsis? Intensive Care Med 2002; 28(9):1208-1217.
(7) Boerma EC, Koopmans M, Konijn A, Kaiferova K, Bakker AJ, van Roon EN et al. Effects of nitroglyc-erin on sublingual microcirculatory blood flow in patients with severe sepsis/septic shock after a strict resuscitation protocol: a double-blind randomized placebo controlled trial. Crit Care Med 2010; 38(1):93-100.
(8) den Uil CA, Caliskan K, Lagrand WK, van der EM, Jewbali LS, van Kuijk JP et al. Dose-dependent benefit of nitroglycerin on microcirculation of patients with severe heart failure. Intensive Care Med 2009; 35(11):1893-1899.
(9) Spronk PE, Ince C, Gardien MJ, Mathura KR, Oudemans-van Straaten HM, Zandstra DF. Nitroglyc-erin in septic shock after intravascular volume resuscitation. Lancet 2002; 360(9343):1395-1396.

Summary and conclusions 183
SUMMArY ANd CONClUSIONS
Resuscitation of circulatory shock is aimed at reestablishing adequate tissue perfusion through optimization of traditional endpoints, such as mean arterial pressure, cardiac output and its determinants. Monitoring critically ill patients in the early hours of shock is therefore essential to recognize alterations in these predefined end points and to assess whether patient needs active intervention. Although the initial objective of hemodynamic monitoring is the restoration of these global macrocirculatory variables, abnormalities in peripheral circulation may still persist and are related to the develop-ment of organ failure and when unrecognized may worse prognosis among critically ill patients. This scenario has led to growing interest in non invasive methods designed to evaluate regional perfusion in peripheral tissues as a valuable adjunct to standard global parameters to predict or diagnosis ongoing tissue hypoperfusion. We propose to complement global parameters of oxygen transport with monitoring parameters of peripheral circulation. Real-time assessment of peripheral circulation at the bedside is easily obtainable using noninvasive monitoring techniques. Moreover, it is a simple approach that can be rapidly applied throughout the hospital, including the emergency department, operating room, wards and intensive care unit.


Samenvatting en conclusie 185
SAMeNVATTING eN CONClUSIe
Tijdens acute circulatoire shock, een fase waarin verschillende weefsels niet goed door-bloed worden, is het herstellen van de doorbloeding van deze weefsels vooral gericht op conventionele hemodynamische parameters zoals bloeddruk, hartfrequentie en cardiac output. In deze ernstig zieke patiënten is goede hemodynamische monitoring en het zorgen voor herstel van de doorbloeding essentieel. Na de start van de juiste behandeling en herstel van de conventionele hemodynamische parameters zal bij de meeste patiënten de activiteit van compensatiemechanismen afnemen. Echter bij som-mige patiënten blijven, ondanks succesvol behandelde conventionele hemodynamische parameters, compensatiemechanismen actief en kan lokale weefsel hypoperfusie voort-bestaan. Hoewel de relatie met conventionele hemodynamische parameters afhankelijk is van het ziektebeeld, lijkt verstoring van de perifere circulatie hoe dan ook gerelateerd aan een slechter klinisch beloop (meer orgaanfalen) in verschillende patiënten groepen. De beoordeling van de perifere circulatie biedt niet alleen een ander referentiepunt voor de beoordeling van de circulatie, maar kan tevens onder alle omstandigheden en op verschillende manieren worden gebruikt en daarmee dienen als een potentiele rode vlag in kritisch zieke patiënten. Met de huidige methoden is beoordeling van de perifere circulatie bij ernstig zieke patiënten makkelijk uit te voeren, goedkoop en eenvoudig toe te passen aan het bed.


Acknowledgements 187
ACkNOwledGeMeNTS
Being new to a country brings challenges for everyone. Moving to the Netherlands was more than just changing location and signing papers; it was a complete life change. It’s not as if the culture was a lot different from my Brazilian background, but there were enough little things here and there that caught me by surprised. Even so, I won’t remember the bad moments nearly as much as I remember the good ones. The direct and friendly nature of the Dutch, the harsh sound of the language, the Dutch dropjes, harings, and water, water everywhere! Then there is the cycling. Before I came to the Netherlands I had not climbed on a bicycle over a decade. It became part of my daily life decision-making, such as the supermarket list; I used to buy only things that fit in my bike. It turns out that my experience in this tiny little country has been amazing, educa-tional, cultural, beautiful and real. And yet, after eight years of living in the Netherlands, experiences I gained and time spent in the land of windmills, channels and tulips will always be memorable. Heel erg bedankt lieverds.
Continuing a fine tradition, I would here like to express my thanks to the people who have been very helpful to me during the time it took me to write this thesis. During my long travels from Brazil to Holland through these years, with laugh and tears, there is not enough space to thank all my family, friends and colleagues. Many people have contributed in numerous ways, to only some of whom it is possible to give particular mention. I do not have room to name everyone here, but be certain that your kindness will be always printed in my heart and reminded in this book.
First and foremost, I would like to start by thanking my promoter and friend Prof.dr. Jan bakker, a great teacher and guide, who played an instrumental role in shaping me as a medical researcher. dear Jan, since we first met in the Sírio Libanes Hospital in São Paulo (I think it was in 2000!) you have been not only a good teacher and leader, but also a great person for making me feel so welcome with your encouragement and hospitality. Thank you for welcoming me in Apeldoorn (my first per-review paper!), in Zwolle (my first Dutch bike!), and finally in Rotterdam. I want to thank you not only as my formal promotor, but because you made this possible by accepting me in your department, giving me an opportunity to learn how to be a scientist and how to survive from it. Thanks for your time, energy, enthusiasm and advices, for teaching me to be independent in my research. Thanks to guide me through the scientific thinking process and for your patient during the long period of my study and career. Also, thank you for your friendship and support through my difficult moments during the thesis period. You are and will always be my source of inspiration and motivation on both academic and personal level.
188 Acknowledgements
I would like to express my deepest grati tude to the members of my inner PhD commit-tee Prof.dr. A.H. van den Meiracker, Prof.dr. A.b.J. Groeneveld, and Prof.dr. d. de backer for accepting the invitation, for the time and for the energy you invested to read and approve my thesis. It is a great honour and privilege to have you in this committee. I also would like to express my sincere gratitude to the plenary committee members Prof.dr. Can Ince, Prof.dr. Jukka Takala, Prof.dr. Peter Pikkers,Prof.dr. eliezer Silva, and Prof.dr. M.H.J. Verhofstad. It was a great honour to have such remarkable scientists in my reading committee. My sincere gratitude to dr. Peter Pikkers, dr. de backer, dr. Jukka Takala and dr. eliezer Silva for their enthusiasm to take part in my thesis defense and for their willingness to travel all the way to Rotterdam.
A very special thank goes to dr. Groenenveld, dear Johan, your support and guidance throughout my research projects as well as your help in proof reading my manuscript drafts are greatly appreciated. Also, enormous gratitude to Prof.dr. Can Ince for his scientific expertise and encouragement, dear Can, thank you for the in-depth conversa-tions that stimulate my brain (not always about work!), your timely suggestions, and insightful discussions about microcirculation in the rooms and hallways of Erasmus (sometimes in the AMC) that certainly have much improved the quality of my work.
Endless gratitude goes to dr. Jasper van bommel, my co-promotor who did much more than a supervisor. dear Jasper, you are a very good teacher, always giving me good ad-vices, pushing me a lot for ideas. Your critical remarks and suggestions have always been very helpful in improving my skills and for strengthening our manuscripts. Thank you for never having any doubts I would manage to get my PhD… I know the beginning was not easy. Really thanks for being patient, tolerant, and above all wonderful company.
For this research, I collected a lot of data. Many people helped with this, for which I would like to particularly thank all the medical assistants of our department, some of whom already left, who cooperated greatly during the process of data collection, inform consent, technical support and bedside discussions. Special thanks to the vice chair of our department dr. diederick Gommers, dear diederick, thank you for welcoming me and watching me through the end of my work with continuous and constructive support, which was extremely valuable. Many thanks to, dr. Mathieu van der Jagt, dr. Jelle epker, dr. bart van den berg, dr. Marianne Zijnen, dr. Johan van der Akker, dr. dinis dos reis Miranda, dr. erwin kompagne, dr. Joachim weigel, dr. Patricia Ger-ritsen, dr. ben van der Hovern, dr. willy Thijsse, dr. Christine Groeninx, dr. Hilde de Geus, dr. Jubi de Haan, dr. Nuray kusadasi, and others (my unreliable memory does not allow me to remember all names!), dear all, thanks for all support and to provide an excellent atmosphere for doing research.

Acknowledgements 189
Special thanks are also extended to all the nurses, secretaries, stock supply work-ers, cleaners, and catering workers from our department, all of whom through their enthusiasm contributed in the data collection process.
I would like to express my appreciation to all patients and family members who agreed to provide consent to participate in the studies, and without whom the clinical medical studies from this thesis would not be possible.
A warm thank to els forman, dear els, I have to thank you for helping me out with all the little problems I had (have) once in a while, not only with boring bureaucratic administrative issues, but also in a personal level. Thanks for always having a warm smile and always ready to help.
I thank Michel and eva for being very good friends and brilliant collaborators, and without their practical help it would not be possible to develop some of the projects in this thesis. Both of them have agreed to become my paranymphs, and that certainly makes me feel confident during my defence. I’m glad I had the chance to work with you both for a while and following your advices, which helped me to accomplish important things in my career. dear eva, it was great to discuss research projects together and to learn from you things like ‘how to get more acquainted with typical Dutch way to be’ …. thanks for your friendship and all your support. I wish all the best for you and for your plus one! Michel, my dear Dutch Surinamese dude, it was a pleasure working side-by-side with you. I am very grateful for your help, your enthusiasm with research, and for the unique collaboration we have developed over last steps of my PhD. Thanks for those coffee breaks ‘in your office’ (great ideas were born there!), for the things we did together and for the ones we will do, for sure. And of course, I wish you success in your internship carrier. All the best for you thesis!
It is a great pleasure to thank all Co-authors who helped me write my manuscripts suc-cessfully. Especial thanks to dr. Tim Jansen who I had the pleasure to work with and share the office during my first years in Erasmus. dear Tim, thanks for your contribution, sug gestions, scientific discussions, and for those COEUR lectures we attended together that have much improved the quality of my work. Also, many thanks to rick bezemer from the AMC to help me to concretise some of the NIRS projects we started to develop together, and for the constructive discussion from the technological point of view in the optical monitoring field. I also extended my thanks to my colleagues from the Depart-ment of Translational Physiology of AMC and especially to dan Milstein, koray Yuruk, Peter Goedhart† and bas bartels to provide a great collaboration and feedback to my work. Also, thanks to my Irish colleague dr. eilish M. Galvin from the department of

190 Acknowledgements
Anesthesiology in the Erasmus MC, who provided great support during our regional anaesthesia blocks studies.
A special thank to my officemates and current fellows PhD, the veterans and the novices, whom I have very much enjoyed working with, especially ditty, Patricia, Paul, Martijn, Helmi, eva, Patrick, egal, rimom, Mats, Zoram, Herma, Yorick, Ido, thanks all for the friendship, good humour, coffee, chocolates (Lekker!), coffee, science talks, coffee, cakes, coffee, dropjes (no thanks!), and much more, but more importantly to provide such welcoming academic and friendly atmosphere… and coffee! Thank you all!
Special thanks also to the graduate students Amber (thanks for your excel skills with NTG data!), Thijs (your student discount card is always welcome!), Noel, Jordan, and Tanne for their time and energy in being fully engaged in a variety of data collection that contributed to the development of this thesis.
I have been fortunate to come across many funny & good friends from inside and out-side Erasmus. A huge thank goes therefore to my friends from Erasmus MC University for their friendship, who always bring joy, laughter and keep me young (not that I’m too old!). The list is far from complete, but I would like to especially mention my ‘pub mates’ rachel (thanks for the fun moments; I wish success and a great time in New York!), katharina and Stefan, Nese, Heidi, Ivana, Marek, Minghui, Annemarie, lisettte, Mariana, Sten and Joris … thank you all for the great time! Special thanks to my polish friend karolina, since we first met in 2010 for a statistical consult, I own you a lot to help me with my dummy statistical questions; even if you did not know the solution, you always tried to find a way to help, and for that I’m really grateful! I wish you success in your thesis! Dziekuje bardzo!
I have also had the chance to deepen some friendships as well as to build new ones inside and outside the Erasmus. To my portuguese friend Marcia, who shared with me the up’s and down’s of getting a PhD, obrigado pelo convívio, amizade e apoio quando necessário e pelos bons momentos de distração na hora do almoço. I have been fortunate to come across some Brazilians friends who through their friendship have kept me inspired and motivated. ricardo e Cintia, apesar de nos conhecermos há pouco tempo, muito obrigado pelo incentivo acadêmico, pela hospitalidade e pelo carinho de vocês! Outside the Erasmus circle, my sincere thanks to Catherine Transler, a thoughtful friend who has recently published her book “Turning International” that shed a light into the challenges of living in a new country. Also, thanks to my Brazilian friend rachel and her husband danny, who friendly welcomed us in their lives, and have been of great support for providing exotics moments on the beach during the summer.

Acknowledgements 191
My family and friends from Brazil deserve special thanks for supporting me through-out the years in various ways. A loving thought is addressed to my parents, my father Norberto† and my mother Aparecida, obrigado mãe pelo carinho incondicional, pelas orações e por sempre acreditar em mim! To my brothers duarte and Henrique and their respective wives renata and Mônica, who made me an uncle of three nieces and two nephews: leila, lilian, falvio, dudu, and Ana Carolina, obrigado pela força, atenção, carinho e ajuda … amo vocês! Para ‘seu’ fausto e toda família Arrais e de Oliveira, com especial agradecimento à minha querida sogrinha dalci e também para as tias Izinha, Jesus e lúcia pelo carinho, orações e amor. Agradeço de coração à toda minha família lima no brasil e em Portugal, tios, tias, primos e primas, não há espaço para todos nessa página, mas há para todos em meu coração.
My big thanks to all my friends from Brazil, especially to my best friend, demian, meu caro amigo, irmão e compadre demian, meu muito obrigado de coração! Maria Vitoria, dani, João Pedro, obrigado pelo carinho, adoro vocês! fernando e Helene, o apoio de voces no Brasil foi e está sendo vital, agradeço de coração toda a juda de vocês! To Carlos eduardo, dear friend Cazé, thanks for caring and always cheer me up! (by the way, I have a Gouda cheese for you!)
Finally, I must thank my wonderful wife Teresa Cristina, as without her love, profes-sional and motivational support, probably I may never have completed this thesis. Tete, you are the person who sacrificed the most during my PhD trajectory. We went through a lot and did a lot. I would have given up long ago without your steady support, wisdom and endless patient. Ik hou van je!


List of publications 193
lIST Of PUblICATIONS
lima A, Beelen P, Bakker J. Use of a peripheral perfusion index derived from the pulse ox-imetry signal as a non-invasive indicator of perfusion. Crit Care Med 2002, 30:1210-1213.
bakker J, de lima AP. Increased blood lactate levels: an important warning signal in surgical practice. Crit Care. 2004 Apr; 8(2):96-8.
lima A, Bakker J. Non-invasive monitoring of peripheral perfusion. Intensive Care Med 2005; 31:1316-1326.
Bakker J, Jansen TC, lima A, Kompanje EJ. Why opioids and sedatives may prolong life rather than hasten death after ventilator withdrawal in critically ill patients. Am J Hosp Palliat Care. 2008 Apr-May; 25(2):152-4.
lima A, Jansen TC, Van Bommel J, Ince C, Bakker J The prognostic value of the subjec-tive assessment of peripheral perfusion in critically ill patients. Crit Care Med 2009 Mar; 37(3):934-8.
lima A, van Bommel J, Jansen TC, Ince C, Bakker J. Low tissue oxygen saturation at the end of early goal-directed therapy is associated with worse outcome in critically ill patients. Crit Care 2009; 13 Suppl 5:S13.
Bezemer R, lima A, Myers D, Klijn E, Heger M, Goedhart PT, Bakker J, Ince C. Assessment of tissue oxygen saturation during a vascular occlusion test using near-infrared spec-troscopy: the role of probe spacing and measurement site studied in healthy volunteers. Crit Care 2009;13 Suppl 5: S4.
Jansen TC, van Bommel J, Mulder PG, lima AP, van der Hoven B, Rommes JH, Snellen FT, Bakker J. Prognostic value of blood lactate levels: does the clinical diagnosis at admis-sion matter? J Trauma 2009 Feb;66(2):377-85.
Jansen TC, van Bommel J, Schoonderbeek FJ, Sleeswijk Visser SJ, van der Klooster JM, lima AP, Willemsen SP, Bakker J; LACTATE study group. Early lactate-guided therapy in intensive care unit patients: a multicenter, open-label, randomized controlled trial. Am J Respir Crit Care Med. 2010 Sep 15;182(6):752-61.

194 List of publications
Bezemer R, Klijn E, Khalilzada M, lima A, Heger M, van Bommel J, Ince C Validation of near-infrared laser speckle imaging for assessing microvascular (re)perfusion. Microvasc Res 2010 Mar;79(2):139-43
lima A, van Bommel J, Sikorska K, van Genderen M, Klijn E, Lesaffre E, Ince C, Bakker J. The relation of near-infrared spectroscopy with changes in peripheral circulation in critically ill patients. Crit Care Med 2011 Jul;39(7):1649-5.
Bartels SA, Bezemer R, Wallis de Vries FJ, Milstein DMJ, lima A, Cherpanath TGV, Heger M, Karemaker JM, Ince C Multi-site and multi-depth near-infrared spectroscopy for the detection of hypovolemia in lower body negative pressure. Intensive Care Med 2011 Apr;37(4):671-7.
van Genderen ME, lima A, de Geus H, Klijn E, Wijnhoven B, Gommers D, van Bommel J. Serum C-reactive protein as a predictor of morbidity and mortality in intensive care unit patients after esophagectomy. Ann Thorac Surg 2011 Jun;91(6):1775-9.
van Genderen M, Gommers D, Klijn E, lima A, Bakker J, van Bommel J. Postoperative sublingual microcirculatory derangement following esophagectomy is prevented with dobutamine. Clin Hemorheol Microcirc. 2011;48(4):275-83.
Bartels SA, Bezemer R, Milstein DM, Radder M, lima A, Cherpanath TG, Heger M, Kare-maker JM, Ince C. The microcirculatory response to compensated hypovolemia in a lower body negative pressure model. Microvasc Res 2011 Nov;82(3):374-80.
van Genderen M, Gommers D, Klijn E, lima A, Bakker J, van Bommel J. Postoperative sublingual microcirculatory derangement following esophagectomy is prevented with dobutamine. Clin Hemorheol Microcirc 2011;48(4):275-83.
lima A, Bakker J. Near-infrared spectroscopy for monitoring peripheral tissue perfusion in critically ill patients. Rev Bras Ter Intensiva. 2011; 23(3):341-351.
lima A, van Genderen ME, Klijn E, Bakker J, van Bommel J. Peripheral vasoconstriction influences thenar oxygen saturation measured by nearinfrared spectroscopy. Intensive Care Med 2012, 38(4):606-11.
van Genderen ME, lima A, Akkerhuis M, Bakker J, van Bommel J. Persistent peripheral and microcirculatory perfusion alterations after out-of-hospital cardiac arrest are associ-ated with poor survival. Crit Care Med. 2012 Aug;40(8):2287-94.

List of publications 195
van Genderen ME, van Bommel J, lima A. Monitoring peripheral perfusion in critically ill patients at the bedside. Curr Opin Crit Care 2012;18(3):273-9.
van Genderen ME, Bartels SA, lima A, Bezemer R, Ince C, Bakker J, van Bommel J. Pe-ripheral perfusion index as an early predictor for central hypovolemia in awake healthy volunteers. Accepted for publication in Anesthesia & Analgesia, February 2013
van Genderen ME, lima A, Bakker J, van Bommel J. Beoordeling van de perifere circulatie bij ernstig ziekte patiënten. Accepted for publication in Ned Tijdsschr Geneeskd, 2013


Abstracts 197
AbSTrACTS
24th Annual ISICeM brussels, belgium, 30 March – 2 April 2004:lima A, Bakker J. The peripheral perfusion index in reactive hyperemia in critically ill patients. Critical Care 2004; 8(Suppl 1):53.
28th Annual ISICeM brussels, belgium, 18–21 March 2008:lima A, Jansen T, Ince C, Bakker J. Noninvasive monitoring of peripheral perfusion with physical examination and the peripheral flow index correlates with dynamic near-infrared spectroscopy measurements in patients with septic shock. Critical Care 2008; 12(Suppl 2):60.
21st Annual Congress eSICM lisbon, Portugal, 21-24 September 2008:J Weigel, A lima, E. Klijn, P Goethart, J Hazelzet, J van Ochten, J. Bakker, C Ince: Microcir-culation is compromised in extreme exercise: a (pilot) Observational study in marathon runners. Intensive Care Med 2008; 34 (Suppl 1): S149
29th Annual ISICeM brussels, belgium, 24–27 March 2009:lima A, Klijn E, Bakker J, Ince C, van Bommel J. Head-up tilt and passive leg raising in healthy volunteers as a preclinical model for preload-induced stroke volume modifica-tion. Critical Care 2009; 13(Suppl 1):211.
lima A, Ince C, Bakker J. Use of tissue oxygenation saturation in association with skin temperature as an indicator of the peripheral tissue perfusion in critically ill patients. Critical Care 2009; 13(Suppl 1):236.
lima A, Galvin E, Bommel JV, Bakker J. Effects of peripheral vasodilation induced by regional anaesthesia blocks on resting tissue oxygenation values. Critical Care 2009; 13(Suppl 1):237.
Bezemer R, lima A, Klijn E, Bakker J, Ince C. Assessment of tissue oxygen saturation dur-ing a vascular occlusion test using near-infrared spectroscopy: role of the probe spacing and measurement site studied in healthy volunteers. Critical Care 2009; 13(Suppl 1):244.
22nd Annual Congress eSICM Vienna, Austria, 11-14 October 2009:A. lima, I. Bikker, J. Van Bommel, C. Ince, J. Bakker: Effects of positive end-expiratory pressure on peripheral tissue oxygenation in a porcine animal model with acute lung injury. Intensive Care Med 2009; 35 (Suppl 1): S155

198 Abstracts
A. lima, M. Alamyar, J. Bakker: Use of near-infrared spectroscopy on finger during a vascular occlusion test to assess the dynamic tissue O2 saturation response (Oral Ses-sions). Intensive Care Med 2009; 35 (Suppl 1): S205
T. Jansen, J. Van Bommel, J. Schoonderbeek, S. Sleeswijk, J. Van der Klooster, A. lima, S. Willemsen, J. Bakker: Early lactate-directed therapy in critically ill patients admitted to the intensive care: a randomized controlled Multi-centre trial (Oral Sessions). Intensive Care Med 2009; 35 (Suppl 1): S213
E. Klijn, S. Niehof, A. lima, J. Bakker, C. Ince, J. Van Bommel: The effect of stroke volume variation on peripheral perfusion in healthy volunteers. Intensive Care Med 2009; 35 (Suppl 1): S282
23rd Annual Congress eSICM barcelona, Spain, 9-13 October 2010:A. lima, J. Van Bommel, E. klijn, van Genderen Michel E., C. Ince, J. Bakker: Defining the best capillary refill time as a prognostic indicator of organic and metabolic dysfunction in critically ill patients. Intensive Care Med 2010; 36 (Suppl 2): S118
A. lima, P. Rosa, K. Sikorska, C. Ince, J. Bakker: Parameters of dynamic tissue O2 satura-tion response in the finger compared with thenar of critically ill patients (Oral Sessions). Intensive Care Med 2010; 36 (Suppl 2): S349
van Genderen Michel E., H.de Geus, A. lima, D. Gommers, J. Van Bommel: NGAL: Not Suitable For Early Detection Of Complications In Postoperative Surgery Patients At The ICU. Intensive Care Med 2010; 36 (Suppl 2): S349
24th Annual Congress eSICM berlin, Germany, 1-5 October 2011A. lima, M. E. van Genderen, J. Bakker, J. van Bommel: Decreased Lactate Clearance Is Associated With Microcirculatory Disturbances In A Porcine Septic Shock Model (Oral Sessions). Intensive Care Med 2011; 38 (Suppl 1): S343
A. lima, M. E. van Genderen, T. Boerstra, J. Bakker, J. van Bommel: Is Bedside Clinical Examination Of Capillary Refill Time Reproducible In Critically Ill Patients Between Differ-ent Observers? An Inter-Rater Variability Study. Intensive Care Med 2011; 38 (Suppl 1): S837
S.A. Bartels, R. Bezemer, D.M. Milstein, A. lima, J.M. Karemake, C. Ince: The Microcircula-tory Response To Controlled, Adequately Compensated, Central Hypovolemia In A Lower Body Negative Pressure Model. Intensive Care Med 2011; 38 (Suppl 1): S716

Abstracts 199
25th Annual Congress eSICM lisbon, Portugal, 13-17 October 2012A. lima, M. E. van Genderen, J. van Bommel, J. Bakker: Nitroglycerin Dose-Dependent Increases Peripheral Perfusion And Improves Tissue Oxygenation In Patients With Circu-latory Shock: Results Of A Prospective, Cross-Over Study (Oral Sessions). Intensive Care Med 2012; 38 (Suppl 1): S449
A. lima, M. E. van Genderen, J. van Bommel, J. Bakker: Abnormally low or abnormally high resting StO2 values are associated with high risk of mortality in critically ill patients (Oral Sessions). Intensive Care Med 2012; 38 (Suppl 1): S775
bOOkS CONTrIbUTIONS
Bakker J, lima A: Monitoring of Tissue Perfusion. In: Neto AR, Mendes CR, Rezende EAC, Dias FS (Eds). Hemodynamic Monitoring in ICU. Revinter, Rio de Janeiro, 2004, pp89-100
Bakker J, lima A: Noninvasive monitoring of peripheral perfusion. In: Pinsky MR, Brochard L, Mancebo J (Eds). Applied Physiology in Intensive Care Medicine. Springer, Berlin, 2006, pp131-141
R. Bezemer R, A lima, C Ince: Monitoring the microcirculation in the critically ill. Oxford Textbook of Critical Care (Oxford Medical Publications)
J. Groeneveld, A. lima: Vasodilators. Oxford Textbook of Critical Care (Oxford Medical Publications)


Curriculum vitae 201
CUrrICUlUM VITAe
Alexandre Augusto Pinto Lima was born on June 25th 1969 in São Paulo, Brazil. He earned his medical degree from Faculdade de Ciências Médicas de Santos, São Paulo in 1996. He completed his internship and residency in tropical infectious diseases and HIV medicine at Instituto de Infectologia Hospital Emilio Ribas, Universidade de São Paulo in 1999. The first two years of fellowship were dedicated to clinical infectious diseases with special programme for research and training in Tropical Diseases. The third year was dedicated to severe infectious diseases in the Division of Intensive Care Unit, with main focus on leptospirosis, meningitis, dengue fever, malaria, and HIV opportunistic infections, in which triggered his interest in intensive care medicine. He decided to follow his career as an intensivist and continued his specialization in an intensive care fellowship at the department of intensive care of Hospital Sírio Libanês, São Paulo from 1999 to 2001. Subsequently, he was employed as Assistant Medical Doctor at Department of Infectious Diseases and Critical Care Medicine of Universidade de São Paulo, and Assistant Medical Doctor at Department of Intensive Care Medicine at Hospital do Servidor Publico Estadual, São Paulo. He started hiis PhD journey in 2004 under the supervision of Prof. dr. J. Bakker at the adult Intensive Care of the Erasmus University Medical Center Rotterdam. He will continue his research in the Erasmus MC in the field of peripheral hemodynamic circula-tion, with the emphasis in optical methods for measuring tissue oxygenation.