nonalcoholic fatty liver disease: regulation of glucose ... · nonalcoholic fatty liver disease:...
TRANSCRIPT
Nonalcoholic fatty liver disease: Regulation of glucose
and fat metabolism in the liver by Carbohydrate
Response Element Binding Protein (ChREBP) and
impact of dietary influence
Vorgelegte Dissertation von
Haiam Omar Mohamed Elkatry, M.Sc.
aus Kairo (Ägypten)
von der Fakultät III – Prozesswissenschaften, Institut für
Lebensmitteltechnologie und Lebensmittelchemie
der Technischen Universität Berlin
zur Erlangung der akademischen Grades
Doktor der Naturwissenschaften
-Dr. rer. nat.-
genehmigte Dissertation
Promotionsausschuss:
Vorsitzender: Prof. Dr. Leif-Alexander Garbe
Berichterstatter : Prof. Dr. Dipl.-Ing. Dietrich Knorr
Berichterstatter : Prof. Dr. Andreas Pfeiffer
Tag der wissenschaftlichen Aussprache: 23.09.2011
Berlin 2011
D83
Nonalcoholic fatty liver disease: Regulation of glucose
and fat metabolism in the liver by Carbohydrate
Response Element Binding Protein (ChREBP) and
impact of dietary influence
Submission from
Haiam Omar Mohamed Elkatry, M.Sc.
from Cairo (Egypt)
Faculty III - Process Science, Institute of Food Technology and Food Chemistry,
Technical University of Berlin,
Submitted in Partial Fulfillment of the Requirements for
the Degree Academic of Doctor in Natural Science (Food Science)
-Dr. rer. nat.-
Approved Thesis
This work has been approved by:
Vorsitzender: Prof. Dr. Leif-Alexander Garbe
Berichterstatter : Prof. Dr. Dipl.-Ing. Dietrich Knorr
Berichterstatter : Prof. Dr. Andreas Pfeiffer
Date of Examination: 23.09.2011
Berlin 2011
D83
Zusammenfassung
I
ZUSAMMENFASSUNG
Deregulationen in der Leberlipidsynthese sind häufig mit Adipositas und
Diabetes Typ 2 verbunden und daher ist ein detailliertes Verständnis der beteiligten,
regulierenden Stoffwechselwege sehr wichtig, um künftig potentielle therapeutische
Targets zu identifizieren. Die Leber ist der wichtigste Ort für den
Kohlenhydratstoffwechsel (Glykolyse und Glykogen-Synthese) sowie Triglycerid-
Synthese (Lipogenese). Carbohydrate-responsive element-binding protein (ChREBP)
wurden in die Regulation durch Glucose der glykolytischen und lipogenen Gene
einbezogen, einschließlich der codierten l-Pyruvatkinase (L-PK) und
Fettsäuresynthase (FAS). In den letzten zehn Jahren konnte anhand verschiedener
Untersuchungen bewiesen werden, dass Nährstoffe, vor allem Glukose und Fettsäuren
in der Lage sind, hepatische Genexpressionen in einer Transkriptionsart zu regulieren.
Diätetische mehrfach ungesättigte Fettsäuren (PUFAs) sind potente Inhibitoren der
hepatischen Lipogenese und Glykolyse. Das Ziel unserer Untersuchungen war es,
einen Test zu entwickeln , bei dem die Aktivierung von ChREBP durch die Analyse
von cytoplasmatic – nuclear translocation of a green fluorescence– zu ChREBP
Hybrid-Protein (ChREBP-GFP) überwacht wird. Der Einfluss verschiedener Zucker
und Süßstoffe (Glukose, Fruktose, Saccharin, Aspartam, Cyclamat, Steviosid),
einfach ungesättigter Fettsäuren [Oleate (C18: 1)] und mehrfach ungesättigter
Fettsäuren [Linoleat (C18: 2) , Eicosapentaensäure (C20: 5), Docosahexaensäure
(C22: 6)] und Polyphenole aus Olivenöl (Oleuropein) wurden auf die von geklonten
menschlichen ChREBP durch die Analyse der Translokation von ChREBP-GFP aus
dem Zytoplasma auf den Nukleus beurteilt und durch ein automatisches
Fluoreszenzmikroskop überwacht. Unsere Ergebnisse zeigen, dass hohe
Konzentrationen von Glukose, Fruktose, Cyclamat mit Insulin und Saccharin mit
bzw. ohne insulinstimulierenden ChREBP Gentranslokation aus dem Zytosol in den
Zellkern nachgewiesen wurden und eine erhöhte DNA-Bindung und transkriptioneller
Aktivität von ChREBP freisetzen. Andererseits gab es eine suppressive Wirkung von
Ölsäure und Eicosapentaensäure auf ChREBP Nukleustranslokation.
Schlüsselwörter: Alkoholfreie Fettleber, ChREBP translokation, glykolyse,
lipogenese, glucose, süßstoffe, olivenöl und mehrfach
ungesättigten Fettsäuren.
Abstract
II
ABSTRACT
Deregulations in hepatic lipid synthesis are often associated with obesity and
type 2 diabetes, and therefore a perfect understanding of the regulation of this
metabolic pathway appears essential to identify potential therapeutic targets. The liver
is a major site for carbohydrate metabolism (glycolysis and glycogen synthesis) and
triglyceride synthesis (lipogenesis). Carbohydrate-responsive element–binding protein
(ChREBP) was implicated in the regulation by glucose of glycolytic and lipogenic
genes, including those encoding l-pyruvate kinase (L-PK) and fatty acid synthase
(FAS). In the last decade, increasing evidence has emerged to show that nutrients, in
particular, glucose and fatty acids, are able to regulate hepatic gene expression in a
transcriptional manner. Dietary polyunsaturated fatty acids (PUFAs) are potent
inhibitors of hepatic glycolysis and lipogenesis. The aim of my study was to establish
an assay to monitor the activation of ChREBP by analyzing cytoplasmatic –
nuclear translocation of a green fluorescence – ChREBP hybrid protein (ChREBP-
GFP). The influence of different of sugars and sweeteners (glucose, fructose,
saccharin, aspartame, cyclamate, stevioside), monounsaturated fatty acids [oleate
(C18:1)] and polyunsaturated fatty acids [linoleate (C18:2), eicosapentanoic acid
(C20:5), docosahexaenoic acid (C22:6)] and polyphenols from olive oil (oleuropein)
on the activity of cloned human ChREBP was assessed by analyzing the translocation
of ChREBP-GFP from cytoplasm to nucleus which was monitored by an automatic
fluorescence microscope system. My results demonstrate that high concentration of
glucose, fructose, cyclamate with insulin and saccharine with or without insulin
stimulate ChREBP gene translocation from the cytosol to the nucleus, anabling
increased DNA-binding and transcriptional activity of ChREBP. On the other hand,
there were a suppressive effect of oleic and eicosapentanoic acids on ChREBP nuclear
translocation.
KEY WORDS: Nonalcoholic fatty liver disease, ChREBP translocation,
glycolysis, lipogenesis, glucose, sweeteners, olive oil and
polyunsaturated fatty acids.
Acknowledgements
III
ACKNOWLEDGEMENTS
My study was carried out during the years 2007- 2011 as a scholarship from
Nutrition and Food Science Department, Faculty of Home Economics, Helwan
University (Egypt) and the financial support from the Egyptian Ministry of High
Education are gratefully acknowledged.
I would like to thank my supervisor Prof. Dr. Andreas Pfeiffer that he has
given me the opportunity to complete the thesis in the Department of Endocrinology,
Diabetes & Nutritional Medicine, Charité, CBF and for the encouragement,
exceptional ideas, and tireless optimism that have kept me going.
My sincere gratitude is due to my supervisor, Prof. Dr. Dipl.-Ing. Dietrich
Knorr for his helping to register my thesis in Department of Food Biotechnology and
Food Process Engineering, Institute of Food Technology and Food Chemistry, Faculty
of Process Engineering, Berlin University of Technology, Germany.
I would like to express my deepest and sincere appreciation to Dr. Volker
Bähr for the continuous support, scientific advice, providing the necessary laboratory
facilities, guiding the experimental work, continuous supervision and every possible
help throughout this work.
Special thanks to Dr. Christiane Bumke-Vogt for guiding the experimental
work, solving the problems, and supervising this investigation. Her valuable advising
and kindly help are greatly appreciated.
I can not forget to extend my thanks to Dr. Martin Osterhoff for supporting the
establishment of the sequencing of the ChREBP vector.
To all present and former colleagues at the Department of Endocrinology,
Diabetes & Nutritional Medicine, Charité, CBF and Department of Clinical Nutrition,
German Institute of Human Nutrition (DIFE), I am thankful for providing a very
comfortable atmosphere to complete my work.
I am extremely grateful to the Egyptian Government and Missions Office for
the financial support during my studies in Germany, especially, Prof. Dr. Galal
Elgemeie and Prof. Dr. El Sayed Tag Eldin.
Gratitude is also extended to all staff members, my colleagues and workers of
the Home Economics Department, Faculty of Specific Education, Ain Shams
University, Egypt for their continuous encouragements.

Acknowledgements
IV
Finally, my sincere thanks and gratitude are for my parents, my dear husband
Abdelrahman Ahmed, my daughter Toqa and my son Ahmed throughout my studies
and during these years abroad. In spite of being away, they were always present for
their advices and encouragement during my stay in Germany.
Haiam Omar Mohamed Omar Elkatry
List of contents
V
LIST OF CONTENTS
ZUSAMMENFASSUNG .......................................................................................... I
ABSTRACT ............................................................................................................ II
ACKNOWLEDGEMENTS .................................................................................. III
LIST OF CONTENTS.............................................................................................V
LIST OF FIGURES............................................................................................... IX
LIST OF ABBREVIATIONS ............................................................................ XIII
1- INTRODUCTION ............................................................................................... 1
2- REVIEW OF LITERATURE ............................................................................. 4
2-1. The role of liver on glucose and lipid metabolism ....................................... 42-1-1. Glucose utilization and production in the Liver ................................... 52-1-2. Insulin regulation of hepatic gene expression....................................... 72-1-3. Expression of glycolytic/lipogenic and gluconeogenic genes is
regulated by carbohydrate availability in the diet ............................. 8
2-2. ChREBP (Carbohydrate responsive element –binding protein) .............. 102-2-1. ChREBP gene ...................................................................................... 102-2-2. ChREBP protein .................................................................................. 112-2-3. ChREBP function ................................................................................ 12
2-2-3-1. ChREBP and SREBP (Sterol regulatory element binding protein-1c) ................................................................................................. 14
2-2-3-2. ChREBP and LXR (liver X receptors) ........................................ 182-2-4. Regulation of ChREBP transcriptional activity ................................. 20
2-2-4-1. Activiation of ChREBP by Translocation ................................... 212-2-4-2. Control of ChREBP activity by
phosphorylatio/dephosphorylation ............................................. 212-2-5. Role of ChREBP in the physiopathology of hepatic steatosis and
insulin resistance ............................................................................... 242-2-5-1. Obesity .......................................................................................... 242-2-5-2. Insulin resistance and Diabetes mellitus ...................................... 242-2-5-3. Non-alcoholic fatty liver disease (NAFLD) .................................. 26
2-2-6. Soft drinks consumption and nonalcoholic fatty liver disease ........... 292-2-6-1. Fructose ........................................................................................ 292-2-6-2. Aspartame..................................................................................... 312-2-6-3. Saccharin ...................................................................................... 32
List of contents
VI
2-2-6-4. Cyclamate ..................................................................................... 332-2-6-5. Stevioside ...................................................................................... 33
2-2-7. Inhibition of ChREBP as a treatment for metabolic syndrome ........ 352-2-7-1. cAMP ............................................................................................ 362-2-7-2. Polyunsaturated fatty acids .......................................................... 37
2-2-7-2-1. Linoleic acid............................................................................ 432-2-7-2-2. Docosahexaenoic acid ............................................................. 432-2-7-2-3. Eicosapentaenoic acid ............................................................ 442-2-7-2-4. Oleic Acid ............................................................................... 45
2-2-7-3. Oleuropein, an Antioxidant Polyphenol from Olive Oil. ............ 46
3- MATERIALS AND METHODS ...................................................................... 47
3.1. Materials ..................................................................................................... 473.1.1 Chemicals and Biochemicals: ............................................................... 473.1.2 Restriction EnzymesAll restriction enzymes were purchased from .... 483.1.3 Extraction kits: ...................................................................................... 493.1.4 PCR Primers for human ChREBP mRNA NM 032951 ...................... 503.1.5 Sequencing Primers: ............................................................................. 513.1.6 Vectors ................................................................................................... 52
3.1.6.1 TOPO TA Cloning, PCR 2.1 ........................................................ 523.1.6.2 GFP-mouse ChREBP vector .......................................................... 523.1.6.3 TrueORF cDNA Clones and PrecisionShuttle Vector System...... 53
3.1.7 Culture Medium .................................................................................... 543.1.8 Antibiotics: ............................................................................................ 543.1.9 Consumable materials: ......................................................................... 543.1.10 Instruments and machines .................................................................. 553.1.11 Software ............................................................................................... 56
3.2. Methods:...................................................................................................... 573.2.1 Polymerase chain reaction (PCR)......................................................... 573.2.2 Agarose gel electrophoresis .................................................................. 583.2.3 DNA Extraction..................................................................................... 593.2.4 DNA Transformation ............................................................................ 593.2.5 Heat shock transformation with E.coli ................................................. 603.2.6 Isolation of DNA Plasmid ..................................................................... 61
3.2.6.1 DNA Mini preparation ................................................................... 613.2.6.2 DNA Maxi preparation .................................................................. 61
3.2.7 Digestion with restriction enzymes ....................................................... 62
List of contents
VII
3.2.7.1 Digestion with enzymes from New England Biolabs ..................... 623.2.7.2 Digestion with enzymes from Fermentas ....................................... 62
3.2.8 DNA Sequencing ................................................................................... 633.2.9 DNA Ligation ........................................................................................ 633.2.10 Vector Encoding for GFP- Labelled Mouse ChREBP ....................... 643.2.11 Transformation of Competent E.coli JM 109 with Mouse ChREBP 643.2.12 Cell Culture ......................................................................................... 65
3.2.12.1 Cell lines and their cultural terms ............................................... 653.2.12.2 Cells passaging and freezing ........................................................ 653.2.12.3 Cells Counting ............................................................................. 653.2.12.4 Coating of 96 well microtiter plates with Poly-D-Lysine. .......... 663.2.12.5 Transient Transfection ................................................................ 663.2.12.6 Test of the best condition of DNA/lipofectamin ratio and cells
count for HUH7, HepG2 and U2OS ........................................... 673.2.12.7 Fixation and staining of cells with 4’-6-diamidino-2-phenylindole
(DAPI). ......................................................................................... 683.2.12.8 Analysis of transfected cells by fluorescence microscope .......... 683.2.12.9 Picture analysis by the fluorescence microscope ......................... 703.2.12.10 Glucose and insulin stimulation ................................................ 723.2.12.11 The effect of sweeteners on the translocation of h.ChREBP..... 723.2.12.12 The effect of PUFAs on the translocation of h.ChREBP........... 72
3.2.13 Stable transfection............................................................................... 733.2.14 Statistical analysis ............................................................................... 74
4- RESULTS AND DISCUSSION ........................................................................ 75
4-1. Cloning of human ChREBP NM-032951 in vitro ...................................... 764-1-1. ChREBP amplification: upstream-exon 1 DNA plasmid with 5`- UTR
+ promoter sequences........................................................................ 774-1-2. ChREBP amplification: exon 1 to exon 6 DNA .................................. 804-1-3. Ligation between upstream-Ex1 and Ex1-Ex6 DNA plasmid vectors 834-1-4. ChREBP amplification: exon 9 to exon 17 ......................................... 884-1-5. ChREBP amplification: 1 exon 6 to exon 17 (low 1 ChREBP) DNA . 914-1-6. Ligation between up exon 6 and 1 exon 6 to exon 17 (low 1 ChREBP)
DNA plasmid vectors ........................................................................ 964-1-7. Ligation between Topo human ChREBP and pEGFP-N1 ................. 99
4-2. GFP-mouse ChREBP vector .....................................................................1014-2-1. Digestion of GFP-mouse ChREBP vector .........................................102
List of contents
VIII
4-2-2. The best condition of cell line (HUH7, U2OS and HepG2) fortransfection .......................................................................................103
4-2-3. The effect of glucose with or without insulin on the translocation ofmouse ChREBP in U2OS, HUH7 and HePG2 ................................105
4-2-4. Sequencing of the Mouse ChREBP ....................................................107
4-3. TrueORF cDNA clones and precision shuttle vector ...............................1084-3-1. Digestion of TrueORF Entry (human ChREBP), and destination (AC
and AN) GFP vectors. ......................................................................1084-3-2. Ligation between human ChREBP and GFP-AC and GFP-AN
destination vectors ............................................................................1114-3-3. Digestion of AC and AN human ChREBP GFP vectors ...................1134-3-4. Sequencing of the human ChREBP ...................................................1154-3-5. The effect of glucose concentration with or without insulin on the
translocation of human ChREBP in HUH7, HepG2 and U2OS .....1174-3-6. The effect of fructose and some artificial sweeteners on the
translocation of human ChREBP in U2OS cells .............................1214-3-6-1. Fructose .......................................................................................1214-3-6-2. The artificial sweeteners (cyclamate, aspartame, saccharine and
stevioside) ....................................................................................1234-3-7. The effect of polyunsaturated fatty acids (PUFAs) on the
translocation of human ChREBP in U2OS cells .............................1284-3-8. The effect of oleic acid and oleuropein (as main component of olive
fruit) on the translocation of human ChREBP in U2OS cells ........1314-3-9. U2OS stable transfection with h. ChREBP .......................................136
5- CONCLUSION ................................................................................................138
6- REFERENCES .................................................................................................140
List of figures
IX
LIST OF FIGURESFigure 1. Metabolic pathways leading to the synthesis of triglycerides in
liver. (Posticet al. 2007) .................................................................... 5
Figure 2. Glycolytic and lipogenic pathways in the liver .............................. 10
Figure 3. ChREBP and Mlx protein structures. (Postic et al. 2007) ............ 12
Figure 4. The multiple functions of carbohydrate-responsive element-
binding protein (ChREBP). (Postic et al. 2007) ............................. 13
Figure 5. Transcriptional control of glycolysis and
lipogenesis.(Denechaud et al. 2008b) .............................................. 15
Figure 6. Schematic roles of ChREBP and SREBP-1c in the regulation
of glycolytic and lipogenic gene expression in response to insulin
and glucose ........................................................................................ 17
Figure 7. ChREBP and SREBP-1c regulate different steps in glycolysis
and gluconeogenesis ......................................................................... 18
Figure 8. Nutritional conditions determined ChREBP transactivity.
(Iizuka & Horikawa 2008) ............................................................... 22
Figure 9. Transcriptional activation of glycolytic and lipogenic genes
by ChREBP/Mlx and SREBP-1c in liver. (Postic et al. 2007)
........... 23
Figure 10. Summary of ChREBP knockdown in liver. (Denechaud et al.
2008b) ................................................................................................ 26
Figure 11. Metabolic defects leading to the development of hepatic
steatosis and insulin resistance. (Postic et al. 2007) ....................... 28
Figure 12. Summary of PUFA control of hepatic PPAR , SREBP-1 and
MLX nuclear abundance (Jump et al. 2008) ................................ 40
Figure 13. Inhibitory effect of PUFA on ChREBP and SREBP-1c
expression and activation. (Postic et al. 2007) ............................... 42
Figure 14. (A) Human ChREBP-cDNA with sequences deriving from 17
exons according to gene bank. (B) Human ChREBP structure.
(Postic et al. 2007) ............................................................................. 77
Figure 15. Upstream-exon 1 DNA ..................................................................... 77
Figure 16. Upstream-exon 1 DNA plasmid in TOPO TA vector .................... 78
Figure 17. Digestion of Upstream-exon 1 DNA plasmid with PshA1 and 78
List of figures
X
Pst1 .....................................................................................................
Figure 18. The covering of sequencing primer M13 to upstream-exon 1
DNA plasmid (A,B) ........................................................................... 80
Figure 19. Exon 1 to Exon 6 DNA ..................................................................... 81
Figure 20. Exon 1 to exon 6 DNA plasmid in TOPO TA vector ..................... 81
Figure 21. Digestion of exon 1 to exon 6 DNA plasmid with EcoR 1 ............. 82
Figure 22. The covering of sequencing primer M13 to exon 1 to exon 6
DNA plasmid (A,B) ........................................................................... 83
Figure 23. Double cut for Upstream-Ex1 DNA plasmid vectors with
BamH1 and PshA1 ........................................................................... 84
Figure 24. Double cut for Ex1-Ex6 DNA plasmid vectors with BamH1 and
PshA1 ................................................................................................. 84
Figure 25. Up Ex6 after ligation between upstream-Ex1 and Ex1-Ex6 DNA
plasmid ............................................................................................... 85
Figure 26. Digestion of up exon 6 DNA Plasmid with Ava1 and Nco1 .......... 86
Figure 27. Digestion of up exon 6 DNA with Avo1, Nco1and BamH1+Nco1 86
Figure 28. The covering of sequencing primer M13 to up exon 6 DNA
plasmid (A,B) .................................................................................... 88
Figure 29. Exon 9 to exon 17 DNA .................................................................... 89
Figure 30. Exon 9 to exon 17 DNA plasmid in TOPO TA vector ................... 89
Figure 31. Digestion of exon 9 to exon 17 DNA plasmid with EcoR 1 ........... 90
Figure 32. The covering of sequencing primer M13 to exon 9 to exon 17
DNA plasmid ..................................................................................... 91
Figure 33. 1 Exon 6 to Exon 17 (low 1 ChREBP) DNA ................................... 92
Figure 34. 1 Exon 6 to exon 17 (low 1 ChREBP) DNA plasmid in TOPO
TA vector ........................................................................................... 92
Figure 35. Digestion of 1 exon 6 to exon 17 (low 1 ChREBP) DNA plasmid
with EcoR 1 (A), Sma 1 and BamH1 (B) ........................................ 93
Figure 36. The covering of sequencing primer M13 to 1 exon 6 to exon 17
DNA plasmid ..................................................................................... 95
Figure 37. Digestion and two possible orientation of up exon 6 DNA ............ 96
Figure 38. Double cut of up exon 6 and 1 exon 6 to exon 17 (low 1 ChREBP) 97
Figure 39. Topo human ChREBP ..................................................................... 98
Figure 40. Digestion of Topo human ChREBP DNA plasmid with EcoR 1 .. 98
List of figures
XI
Figure 41. Digestion of Topo human ChREBP and pEGFP-N1 with
BamH1 and Xho1 (A,B) ................................................................... 99
Figure 42. Double cut for Topo human ChREBP with different restriction
enzymes .............................................................................................. 100
Figure 43. Sequencing of Topo human ChREBP DNA plasmid .................... 101
Figure 44. pEGFP mouse ChREBP vector ....................................................... 102
Figure 45. Digestion of GFP-mouse ChREBP vector with EcoRI (A) and
BamH1 (B) ......................................................................................... 103
Figure 46. Transfection efficiency dependent on DNA/lipofectamin ratio
and cell number for ChREBP in U2OS (A), HUH7 (B) and
HepG2 (C) cells ................................................................................. 105
Figure 47. Glucose and insulin effect on the mouse ChREBP translocation
in U2OS (A), HUH7 (B) and HepG2 (C) cells ................................ 106
Figure 48. The sequencing of the mouse ChREBP .......................................... 107
Figure 49. The True ORF cDNA clones in the pCMV6-Entry vector ........... 108
Figure 50. Restriction sites of Entry (human ChREBP) with Mlu1, Sgfl,
Smal and EcoRl ................................................................................. 110
Figure 51. Restriction sites of destination AC-GFP vector with Mlu 1, Sgf l,
and Sma l ........................................................................................... 110
Figure 52. Restriction sites of destination AN-GFP vector with Mlu 1, Sgf l,
and Sma l ........................................................................................... 111
Figure 53. Double cut of Entry human ChREBP and destination (AC, AN)
GFP vectors ....................................................................................... 112
Figure 54. Entry human ChREBP inside AC- GFP vector (A) and AN-
GFP vector (B) after ligation creating p human ChREBP-GFP
and p GFP- human ChREBP .......................................................... 113
Figure 55. Restriction sites of p human ChREBP-GFP and pGFP- human
ChREP vectors with Mlu 1 and Sgf l .............................................. 114
Figure 56. Restriction sites of p human ChREBP-GFP and pGFP- human
ChREP vectors with EcoR 1 and Sma 1 ......................................... 114
Figure 57 Sequencing of Part of phuman ChREBP-GFP vector(A). The
whole Sequencing of human ChREBP (B) ..................................... 116
Figure 58. Sequencing of the p human ChREBP-GFP vector ........................ 117
Figure 59. Effect of low and high glucose concentration in the presence or 118
List of figures
XII
absence of 100 nM insulin on the subcellular localization of
human ChREBP in HUH7 ...............................................................
Figure 60. Effect of low and high glucose concentration in the presence or
absence of 100 nM insulin on the subcellular localization of
human ChREBP in HepG2 .............................................................. 119
Figure 61. Effect of low and high glucose concentration in the presence or
absence of 100 nM insulin on the subcellular localization of
human ChREBP in U2OS ................................................................ 120
Figure 62. Effect of low and high (5 and 25 mM) fructose concentration in
the presence or absence of 100 nM insulin on the subcellular
localization of human ChREBP in U2OS ....................................... 122
Figure 63. Effect of (0.1 and 1mM) cyclamate in the presence or absence of
100 nm insulin on the subcellular localization of human
ChREBP in U2OS ............................................................................. 125
Figure 64. Effect of (0.1 and 1mM) saccharine in the presence or absence
of 100 nm insulin on the subcellular localization of human
ChREBP in U2OS ............................................................................. 126
Figure 65. Effect of (0.1 and 1mM) aspartame in the presence or absence
of 100 nm insulin on the subcellular localization of human
ChREBP in U2OS ............................................................................. 126
Figure 66. Effect of (10 and 100 µM) stevioside in the presence or absence
of 100 nm insulin on the subcellular localization of human
ChREBP in U2OS ............................................................................. 127
Figure 67 . The effect of DHA on the translocation of human ChREBP ........ 129
Figure 68. The effect of linoleic acid on the translocation of human
ChREBP ............................................................................................ 130
Figure 69. The effect of EPA on the translocation of human ChREBP ......... 131
Figure 70. The effect of oleic acid on the translocation of human ChREBP . 133
Figure 71. The effect of oleuropein on the translocation of human ChREBP 134
Figure 72. Representative images of subcellular localization of GFP-fused
ChREBP ............................................................................................ 135
Figure 73. U2OS stable transfection cell line with p human ChREBP-GFP 137
List of abbreviations
XIII
LIST OF ABBREVIATIONSACBP Acyl CoA binding protein
ACC Acetyl-Coenzym A-Carboxylase
Acetyl-CoA Acetyl-Coenzym A
ADI Accepted daily intake
AgRP Agouti related peptide
ALA Alpha-linolenic acid
AMP Adenosine monophosphate
AMPK Adenosine monophosphate-activated protein kinase
APM Aspartame
ATP Adenosine triphosphate
ATP-CL Adenosine triphosphate citrate-lyase
bHLHZip basic helix-loophelix leucine zipper
BMI Body mass index
Bp Base pare
BSA Bovine serum albumin
BW Body weight
C Cells
cAMP Cyclic adenosine monophosphate
cDNA complementary DNA
ChIP Chromatin immuno precipitation
ChoRE Carbohydrate response element
ChREBP Carbohydrate Responsive Element Binding Protein
CHS Cyclo hexyl sulfamic
CMV Cytomegalovirus
CoA Coenzyme A
CPT-1 Carnitine parmitoyl transferase 1
CS Corn syrup
CVD Cardiovascular disease
DAPI Diamidino-2-phenylinndol Dihydrochlorid
DHA Docosahexaenoic acid
DHAP Dihydroxyacetone 3-phosphate
DMEM Dulbecco’s modified Medium
DNA Deoxyribonucleic acid
List of abbreviations
XIV
Elovl Elongation of very long chain fatty acids protein
EPA Eicosapentaenoic acid
ER Endoplasmic reticulum
EtBr Ethidium bromide
Ex Exon
FABP Fatty acid binding protein
FAO Food and Agriculture Organization
FAS Fatty acid synthase
FBS Fetal bovine serum
FCS Fetal calf serum
FDA Food and Drug Administration
FFA Free fatty acids
G3P Glyceraldehyde 3-phosphate
G6P Glyceraldehyde 6-phosphate
G6Pase Glucose 6-phosphatase
G6PDH Glucose-6-phosphate dehydrogenase
GFP Green Fluorescent Protein
GK Glucokinase
GKRP Glucokinase regulatory protein
GLUT Glucose transporter
Gp Glycogen phosphorylase
GPAT Glycerol-phosphate acyltransferase
GRAS Generally recognized as safe
HCHO High carbohydrate
HFCS High fructose corn syrup
HGP Hepatic glucose production
HMG Hydroxy-3-methylglutaryl
HMP Hexose monophosphate
HNF Hepatocyte nuclear factor
HSL Hormone-sensitive lipase
IREs Insulin response elements
JECFA Joint FAO/WHO Expert Committee on Food Additive
kDa Kilo-Dalton
Km Michaelis constant
List of abbreviations
XV
KO Knockout
LA Linoleic acid
L-PK Liver pyruvate kinase
LXR Liver X receptors
MCD Malonyl-CoA decarboxylase
MEM Minimal Essential Medium
Mlx Max-like protein X
mM MilliMolar
MP Malatepyruvate
mRNA Messenger RNA
MS Metabolic syndrome
NADPH Nicotinamide adenine dinucleotide phosphate
NAFLD Non-alcoholic fatty liver disease
NASH Nonalcoholic steatohepatitis
NEFA Nonesterified fatty acids
NLS Nuclear localization signal
OAA Oxaloacetate
PBS Phosphate-Buffered Saline
PCR Polymerase chain reaction
PEP Phosphoenolpyruvate
PEPCK Phosphoenolpyruvate carboxykinase
PFK Pphosphofructo-1-kinase
PG-DH Phosphogluconate dehydrogenase
PKU Phenylketonuria
PK Pyruvate kinase
PKA Protein kinase A
PP2A Protein phosphatise 2A
PPAR Peroxisome proliferator-activated receptor
PUFA Polyunsaturated fatty acid
RT Room temperature
RXR Retinoid X receptor
SCD Stearoyl- Coenzym A desaturase
SD Soft drink
shChREBP Short hairpin RNA against ChREBP
List of abbreviations
XVI
SRE Sterol regulatory element
SREBP-1c Sterol Regulatory Element-Binding Protein
TGs Triglycerides
USF Upstream stimulatory factor
VLDL Very-low-density lipoprotein
WBSCR14 Williams-Beuren syndrome critical region 14
X5P Xylulose 5- phosphate
ZIP-like Leucine zipper-like
Introduction
1
1- INTRODUCTION
The liver is a major site for carbohydrate metabolism (glycolysis and glycogen
synthesis) and triglyceride synthesis (lipogenesis). In the last decade, increasing
evidence has emerged to show that nutrients - in particular, glucose and fatty acids -
are able to regulate hepatic gene expression in a transcriptional manner. Indeed,
although insulin was long thought to be the major regulator of hepatic gene
expression, it is now clear that glucose metabolism rather that glucose itself also
contributes substantially to the coordinated regulation of carbohydrate and lipid
homeostasis in liver. (Dentin et al. 2006b)
A diet rich in carbohydrates stimulates the glycolytic and lipogenic pathways,
whereas starvation or a diet rich in lipids decreases their activity. The genes encoding
enzymes involved in these pathways include glucokinase (GK) (Iynedjian et al.
1987), L-pyruvate kinase (L-PK) (Vaulont et al. 1986) for glycolysis, ATP citrate
lyase (Elshourbagy et al. 1990), stearoyl- CoA desaturase (SCD-1) (Ntambi 1992),
acetyl CoA carboxylase (ACC) (Katsurada et al. 1990), and fatty acid synthase (FAS)
(Katsurada et al. 1989) for lipogenesis. Most of these enzymes are acutely regulated
by posttranslational and allosteric mechanisms and are controlled on a long-term basis
by a modulation of their transcription rate. Indeed, it is now clear that glycolytic and
lipogenic gene transcription requires both insulin and a high glucose concentration to
be fully induced (Foufelle & Ferr´e 2002). The absorption of carbohydrate in the diet
leads to changes in glucose plasma concentrations but is also concomitant with
changes in the concentrations of the pancreatic hormones insulin, and glucagon.
(Postic et al. 2007)
Recently, carbohydrate-responsive element–binding protein (ChREBP) was
shown to play a pivotal role in the induction of glycolytic and lipogenic genes by
glucose (Dentin et al. 2004; Iizuka et al. 2004) by its capacity to bind to the
carbohydrate-responsive element (ChoRE) present in promoters of these target genes
(Stoeckman et al. 2004); (Ishii et al. 2004) ChREBP is expressed in liver and is
responsive to the nutritional state. The stimulation of ChREBP by glucose occurs at 2
levels. High glucose and insulin concentrations stimulate ChREBP gene expression
(Dentin et al. 2004) and also stimulate its translocation from the cytosol to the
nucleus, thereby increasing the DNA-binding/transcriptional activity of ChREBP
(Kawaguchi et al. 2001). The fact that the DNA-binding activity of ChREBP in
Introduction
2
nuclear extract of livers from rats fed a high-fat diet is decreased compared with that
in rats fed a high-carbohydrate (HCHO) diet suggests that ChREBP may be intimately
involved in fatty acid inhibition of glycolysis and lipogenesis (Yamashita et al. 2001);
(Kawaguchi et al. 2002); (Dentin et al. 2005a).
Nonalcoholic fatty liver disease (NAFLD) is emerging as one of the most
common chronic liver disease in the Western countries. NAFLD, which describes a
large spectrum of liver histopathological features including simple steatosis,
nonalcoholic steatohepatitis, cirrhosis, and hepatocellular carcinoma (Charlton M.
2004), is associated, in the vast majority of the cases, with obesity, insulin resistance,
and type 2 diabetes. Therefore, with the epidemic of obesity and type 2 diabetes,
NAFLD has become an important public health issue. (Postic et al. 2007)
Nonalcoholic fatty liver disease (NAFLD) is a common clinical condition
which is associated with metabolic syndrome in 70% of cases. Inappropriate dietary
fat intake, excessive intake of soft drinks, insulin resistance and increased oxidative
stress result in increased free fatty acid delivery to the liver, and increased hepatic
triglyceride accumulation contributes to fatty liver. Most soft drinks have high
fructose corn syrup which often contains 55% fructose and 45% glucose. Soft drinks
are a leading source of added sugar worldwide, and have been linked to obesity,
diabetes, and metabolic syndrome. The consumption of soft drinks can increase the
prevalence of NAFLD independently of metabolic syndrome. During regular soft
drinks consumption, fat accumulates in the liver by the primary effect of fructose
which increases lipogenesis, and in the case of diet soft drinks, by the additional
contribution of aspartame sweetener and caramel colorant which are rich in advanced
glycation end products that potentially increase insulin resistance and inflammation
(Nseir et al. 2010).
Polyunsaturated fatty acids (PUFAs) suppress ChREBP activity by increasing
its mRNA decay and by altering ChREBP protein translocation from the cytosol to
the nucleus both in primary cultures of hepatocytes and in liver in vivo in mice. The
PUFA-mediated alteration in ChREBP translocation is the result of a decrease in
glucose metabolism (i.e., an inhibition of the activities of GK and G6PDH, the rate-
limiting enzyme of the pentose phosphate pathway) (Dentin et al. 2005a).
Since ChREBP cellular localization is a key determinant of its functional
activity, a better knowledge of the mechanisms involved in regulating its nucleo-
cytoplasmic shuttling and/or its post-translation regulation will be crucial in the future
Introduction
3
to develop novel therapeutic approaches for the study of diseases characterized by
dysregulations of glucose and/or lipid metabolism. Indeed, ChREBP is translocated in
the nucleus under high glucose and insulin concentrations in cultured hepatocytes, it
is in contrast retained in the cytosol in the presence of PUFAs, well-known inhibitors
of lipogenesis (Postic et al. 2007).
Therefore, the aim of this study was to establish an assay to monitor the
activation of ChREBP by analyzing cytoplasmatic – nuclear translocation of a green
fluorescence – ChREBP hybrid protein (ChREBP-GFP). To this end it was attempted
to clone the human ChREBP. The influence of different of sugars and seweeteners
(glucose, fructose, saccharin, aspartame, cyclamate, stevioside), monounsaturated
fatty acids [oleate (C18:1)] and polyunsaturated fatty acids [linoleate (C18:2),
eicosapentanoic acid (C20:5), docosahexaenoic acid (C22:6)] and polyphenols from
olive oil (oleuropein) on the activity of cloned human ChREBP was assassed by
analyzing the translocation of ChREBP-GFP from cytoplasm to nucleus which was
monitored by an automatic fluorescence microscope system.
Review of Literature
4
2- REVIEW OF LITERATURE
2-1. The role of liver on glucose and lipid metabolism
Increased consumption of high-carbohydrate and high-fat (so-called cafeteria
diet) is one of the most important risk factors in the development of the metabolic
syndrome. Excess carbohydrate is mainly converted to triglyceride in the liver, and
excess fat accumulation in the body leads to insulin resistance and metabolic syndrome
(Browning & Horton 2004); (Iizuka & Horikawa 2008)
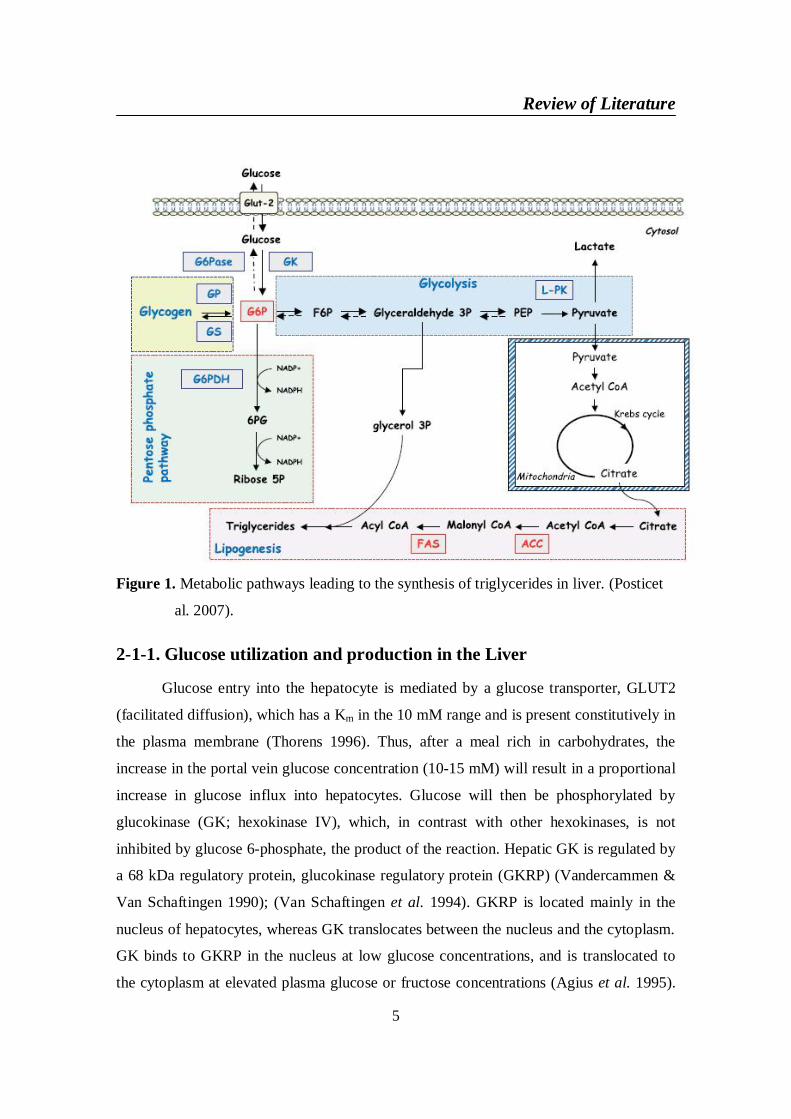
In mammals, the liver is crucial for maintaining overall energy homeostasis and
for the conversion of carbohydrate into fat (Figure 1). The absorption of a high
carbohydrate diet induces several metabolic events aimed at decreasing endogenous
glucose production by the liver and increasing glucose uptake and storage in the form of
glycogen. When glucose is delivered into the portal vein in large quantities and hepatic
glycogen concentrations are restored, glucose is converted in the liver into lipids (through
de novo lipogenesis), which are exported as very-low-density lipoprotein (VLDL) and
ultimately stored as triglycerides (TGs) in adipose tissue. The activity of the metabolic
pathways leading to the synthesis of lipids in liver is strongly dependent upon the
nutritional conditions (Postic et al. 2007).
Overflow of fat to liver could be due to increased dietary intake. Even after a short
term fat feeding, liver fat increases three fold without increase in visceral or skeletal
muscle fat (Samuel et al. 2004). Indeed the adipose tissue fat is an indicator of liver fat.
The intrahepatic lipids increase by 22% for any 1% increase in total adipose tissue, by
21% for any 1% increase in subcutaneous adipose tissue and by 104% for 1% increase in
intra-abdominal adipose tissue (Thomas et al. 2005). Thus liver bears the brunt as soon as
adipose tissue buffering reaches its limit. Zucker rats (fa/fa) have inactivating mutation in
the leptin receptor and hence obese and develops fatty liver. Liver specific correction of
leptin receptor deficiency results in reduced TG accumulation in the liver but not in other
non-adipose tissues. This could be an example of adipokine mediated communication
between adipose tissue and liver. Leptin in conditions of ‘calorie excess’ signals liver to
increase lipid oxidation and to down regulate lipid synthesis and thus protect it and other
organs from steatosis (Lee et al. 2001); (Sanal 2008)
Review of Literature
5
Figure 1. Metabolic pathways leading to the synthesis of triglycerides in liver. (Posticet
al. 2007).
2-1-1. Glucose utilization and production in the Liver
Glucose entry into the hepatocyte is mediated by a glucose transporter, GLUT2
(facilitated diffusion), which has a Km in the 10 mM range and is present constitutively in
the plasma membrane (Thorens 1996). Thus, after a meal rich in carbohydrates, the
increase in the portal vein glucose concentration (10-15 mM) will result in a proportional
increase in glucose influx into hepatocytes. Glucose will then be phosphorylated by
glucokinase (GK; hexokinase IV), which, in contrast with other hexokinases, is not
inhibited by glucose 6-phosphate, the product of the reaction. Hepatic GK is regulated by
a 68 kDa regulatory protein, glucokinase regulatory protein (GKRP) (Vandercammen &
Van Schaftingen 1990); (Van Schaftingen et al. 1994). GKRP is located mainly in the
nucleus of hepatocytes, whereas GK translocates between the nucleus and the cytoplasm.
GK binds to GKRP in the nucleus at low glucose concentrations, and is translocated to
the cytoplasm at elevated plasma glucose or fructose concentrations (Agius et al. 1995).
Review of Literature
6
The Km for glucose in this system (GK / GKRP) is in the 15-20 mM range. The kinetic
characteristics of the glucose transport and phosphorylation steps in hepatocytes imply
that the rate of phosphorylation of glucose is proportional to its plasma concentration.
Glucose 6-phosphate can then enter several pathways: glycogen synthesis, glycolysis and
the pentosephosphate pathway. In the liver, the major function of glycolysis may be to
provide pyruvate not for oxidative purposes, but rather for de novo lipogenesis. When
glucose is the main substrate used for fatty acid synthesis, the enzymes of the glycolytic
pathway can then be considered as an extended part of the lipogenic pathway. The
pentose-phosphate pathway is also directly related to lipogenesis, since it can provide the
NADPH necessary for the final synthesis of acyl-CoA in the reaction catalysed by fatty
acid synthase (FAS). During fasting, or if the carbohydrate content of the diet is low,
glucose will be produced by the liver and glucose utilization is then inhibited. Glucose
production arises first from the glycogen stores (a maximum of 70-80 g in a human
individual) through a pathway called glycogenolysis, which is tightly regulated through
successive cascades of enzyme phosphorylation (Bollen et al. 1998). Then, when the
glycogen stores are depleted, glucose is produced de novo from precursors such as
lactate, alanine or glycerol through a pathway called gluconeogenesis, which utilizes
some of the reversible enzymatic steps of glycolysis, but also has specific steps catalysed
by pyruvate carboxylase, phosphoenolpyruvate carboxykinase (PEPCK), frucose-1,6-
bisphosphatase and glucose- 6-phosphatase (Glc-6-Pase) (Hue 2001); (Foufelle & Ferr´e
2002)
Plasma glucose levels stimulate lipogenesis via several mechanisms. First,
glucose itself is a substrate for lipogenesis. By being glycolytically converted to acytel-
CoA, glucose promotes fatty acid synthesis. Secondly, glucose induces the expression of
lipogenic genes. Finally, glucose increase lipogenesis by stimulating the release of insulin
and inhibiting the release of glucagon from the pancreas (Kersten 2001).
The conversion of glucose into fatty acids through de novo lipogenesis is
nutritionally regulated and both glucose and insulin signaling pathways are elicited in
response to dietary carbohydrates to synergistically induce glycolytic and lipogenic gene
expression. (Denechaud et al. 2008b).
Review of Literature
7
2-1-2. Insulin regulation of hepatic gene expression
Insulin is essential for the maintenance of carbohydrate and lipid homeostasis.
Insulin is secreted by pancreatic cells in response to increased circulating levels of
glucose after a meal, a large fraction of glucose absorbed from the small intestine is
immediately taken up by hepatocytes, which convert it into glycogen. However, when the
liver is saturated with glycogen (roughly 5% of liver mass), any additional glucose taken
up by hepatocytes is shunted into pathways leading to synthesis of fatty acids, which will
be esterified into TG to be exported to adipose tissue as very low-density lipoproteins
(VLDLs). Insulin inhibits lipolysis in adipose tissue by inhibiting hormone-sensitive
lipase (HSL), the enzyme regulating FFA release from adipose tissue (Carmen & Victor
2006). Insulin has a “fat-sparing” effect by driving most cells to preferentially oxidize
carbohydrates instead of fatty acids for energy. Insulin also regulates glucose homeostasis
at many sites, reducing hepatic glucose production (HGP) (via decreased glucose
biosynthesis [gluconeogenesis] and glycogen breakdown [glycogenolysis]) and
increasing the rate of glucose uptake, primarily into skeletal muscle and adipose
tissue.(Postic & Girard 2008)
Insulin is known to modulate the expression of over 100 genes at the
transcriptional level in mammals. The transcriptional effects of insulin are widespread
and concern multiple biological phenomena. In the liver, the transcription of most of the
genes encoding metabolic enzymes is induced by insulin. The genes that are inhibited by
insulin are limited, and encode mainly enzymes involved in hepatic glucose production
(O'Brien & Granner 1996), (O'Brien et al. 2001). In the last few years, important progress
has been made in the identification of the partners involved in the events following
insulin binding to its receptor. In contrast, the factors involved in the transcriptional
effects of insulin were, until recently, largely unknown [although insulin response
elements (IREs) have been identified in some genes], despite intensive studies on the two
well known insulin-responsive genes, namely those encoding GK and PEPCK
(phosphoenolpyruvate carboxykinase). (Foufelle & Ferr´e 2002)
Review of Literature
8
2-1-3. Expression of glycolytic/lipogenic and gluconeogenic genes is
regulated by carbohydrate availability in the diet
The expression of several key glycolytic and lipogenic enzymes in the liver is
induced by a high-carbohydrate diet (Figure 2): GK (Iynedjian et al. 1987), 6-
phosphofructo-1-kinase (Rongnoparut et al. 1991), 6-phosphofructo-2-kinase} fructose-
2,6-bisphosphatase (Colosia et al. 1988), aldolase B (Weber et al. 1984) and liver
pyruvate kinase (L-PK) (Vaulont et al. 1986) for glycolysis; ATP citrate-lyase
(Elshourbagy et al. 1990), acetyl-CoA carboxylase (ACC) (Pape et al. 1988), FAS
(Katsurada et al. 1989) and stearoyl- CoA desaturase (Ntambi 1992) for lipogenesis; and
glucose-6-phosphate dehydrogenase (Katsurada et al. 1989) and 6-phosphogluconate
dehydrogenase (Miksicek & Towle 1983) for the pentose-phosphate pathway. The
transcription of the GK gene can be up-regulated in the presence of a high insulin
concentration (Iynedjian et al. 1989). The genes encoding L-PK, FAS, ACC, S14 and
stearoyl-CoA desaturase require both increased insulin and glucose concentrations in
order to be induced (O'Callaghan et al. 2001). Finally, PEPCK expression can be down-
regulated independently by insulin (Sasaki et al. 1984) or glucose (Cournarie et al. 1999).
Interestingly, the transcription of these genes is also modulated by glucagon in the
opposite direction compared with insulin (Foufelle & Ferr´e 2002).
Indeed, a diet rich in carbohydrates stimulates the glycolytic and lipogenic
pathways, whereas starvation or a diet rich in lipids decreases their activity. The genes
encoding enzymes involved in these pathways include glucokinase (GK) (Iynedjian et al.
1987), L-pyruvate kinase (L-PK) (Vaulont et al. 1986) for glycolysis, ATP citrate lyase
(Elshourbagy et al. 1990), stearoyl- CoA desaturase (SCD-1) (Ntambi 1992), acetyl CoA
carboxylase (ACC) (Katsurada et al. 1990), and fatty acid synthase (FAS) (Katsurada et
al. 1990) for lipogenesis (Figure 1). Most of these enzymes are acutely regulated by
posttranslational and allosteric mechanisms but are also controlled on a long-term basis
by a modulation of their transcription rate. Indeed, it is now clear that glycolytic and
lipogenic gene transcription requires both insulin and a high glucose concentration to be
fully induced (Foufelle & Ferr´e 2002). The absorption of carbohydrate in the diet leads
to changes in glucose concentrations but is also concomitant with changes in the
concentrations of pancreatic hormones, insulin, and glucagon. Fatty acids utilized for the
Review of Literature
9
synthesis of TG in liver are available from the plasma nonesterified fatty acid pool as
well as from fatty acids newly synthesized through hepatic de novo lipogenesis. TGs can
then be stored as lipid droplets within the hepatocytes or secreted into the blood as
VLDLs; they can also be hydrolyzed and the fatty acids channeled toward oxidation
(Marchesini et al. 2001); (Postic et al. 2007)
Although storage as triglycerides is the principal energy storage fuel in mammals,
excessive accumulation of triglycerides in tissues, including liver, is associated with
insulin resistance and enhanced cellular apoptosis (i.e., lipotoxicity) (Unger & Orci
2002). The excessive accumulation of cellular lipids is due to an increased expression of
enzymes from the glycolytic and lipogenic pathway combined with the impaired entry of
fatty acids into the mitochondrial B-oxidation pathway. Therefore, understanding the
transcriptional control of glycolytic and lipogenic gene expression not only by fatty acids
but also by glucose seems important in both physiology and physiopathology and may
yield novel information regarding the treatment and the prevention of the pathogenesis of
hepatic insulin resistance and type 2 diabetes (Dentin et al. 2006b).
Review of Literature
10
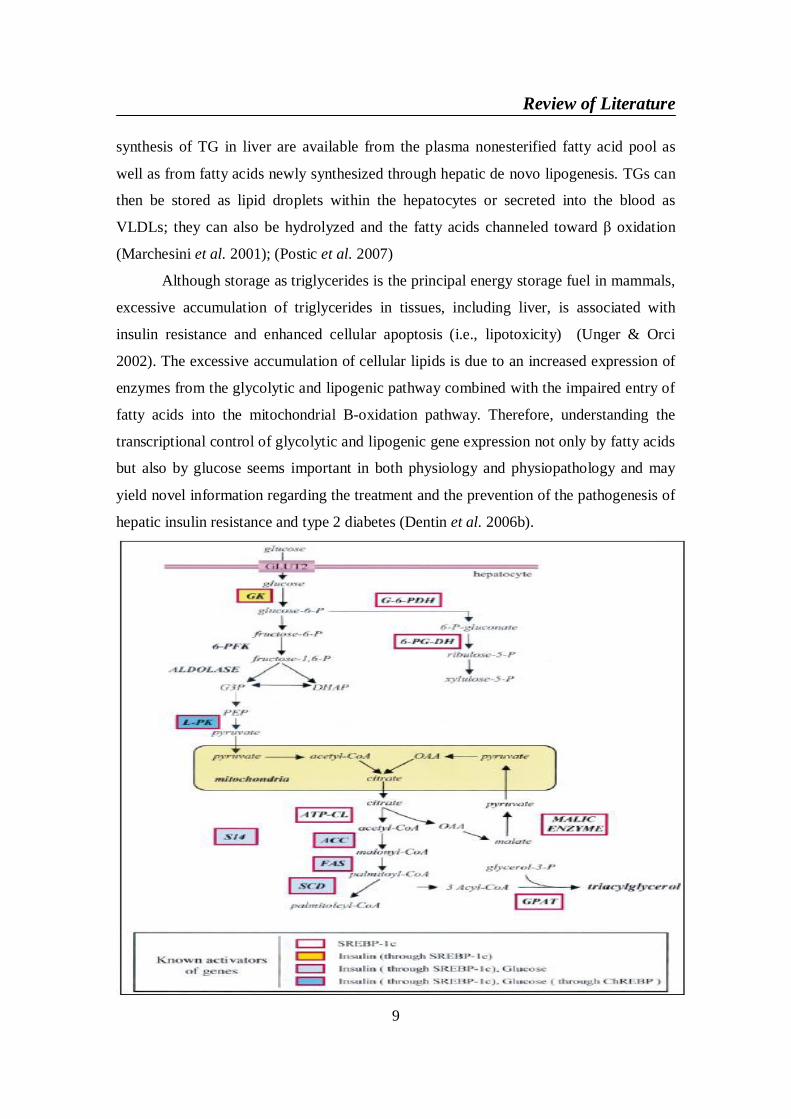
Figure 2. Glycolytic and lipogenic pathways in the liver.
All enzymes indicated in this Scheme are induced at a transcriptional level by a
high-carbohydrate diet. Known activators of their transcription are shown at the
bottom of the Scheme. Abbreviations used : ATP-CL, ATP citrate-lyase ; DHAP,
dihydroxyacetone 3-phosphate ; G-6-PDH, glucose-6-phosphate dehydrogenase ;
GPAT, glycerol-phosphate acyltransferase ; G3P, glyceraldehyde 3-phosphate ;
OAA, oxaloacetate ; 6-PG-DH, 6-phosphogluconate dehydrogenase ; PEP,
phosphoenolpyruvate ; P, phosphate ; 6-PFK, 6-phosphofructo-1-kinase ; SCD,
stearoyl-CoA desaturase. (Foufelle & Ferr´e 2002)
2-2. ChREBP (Carbohydrate responsive element –binding protein)
Carbohydrate-responsive element–binding protein (ChREBP) was shown to play a
pivotal role in the induction of glycolytic and lipogenic genes by glucose (Dentin et al.
2004), (Iizuka et al. 2004) by its capacity to bind to the carbohydrate-responsive element
(ChoRE) present in promoters of these target genes (Stoeckman et al. 2004), (Ishii et al.
2004). ChREBP is expressed in many tissues including liver where it is responsive to the
nutritional state, (Dentin et al. 2005a). ChREBP mediates the transcriptional effect of
glucose on both glycolytic (L-PK) and lipogenic (ACC, FAS) gene expression (Dentin et
al. 2004); (Postic et al. 2007)
2-2-1. ChREBP gene
WILLIAMS-BEUREN SYNDROME region 14 (Wbscr 14) was first identified as
a gene region for a transcription factor bearing basic helix-loophelix leucine zipper
(bHLHZip) structure (Cairo et al. 2001). This gene is among at least 14 deleted genes in
patients with Williams- Beuren syndrome, which is characterized by various clinical
symptoms, including mental retardation, heart abnormalities, unique personality profile,
growth retardation, and hypercalcemia (Tassabehji 2003); (He et al. 2004).
Uyeda et al. successfully purified a transcription factor that bind to the rat L-PK
ChoRE (Yamashita et al. 2001). This transcription factor is the same as the Williams-
Beuren syndrome critical region 14 (WBSCR14) protein, which is now renamed the
carbohydrate response element binding protein (ChREBP) (Cairo et al. 2001) with the
gene symplol MLXIPL (MLX interacting protein-like). Williams-Beuren syndrome is a
Review of Literature
11
neuro-developmental disorder affecting several systems, and is caused by a heterozygous
deletion in chromosomal region 7q11.23 in human. WBSCR14/ChREBP is expressed as
a 4.2kb transcript, and the WBSCR14/ChREBP locus encompasses 33kb of genomic
DNA with 17 exons (de Luis et al. 2000); (Iizuka & Horikawa 2008).
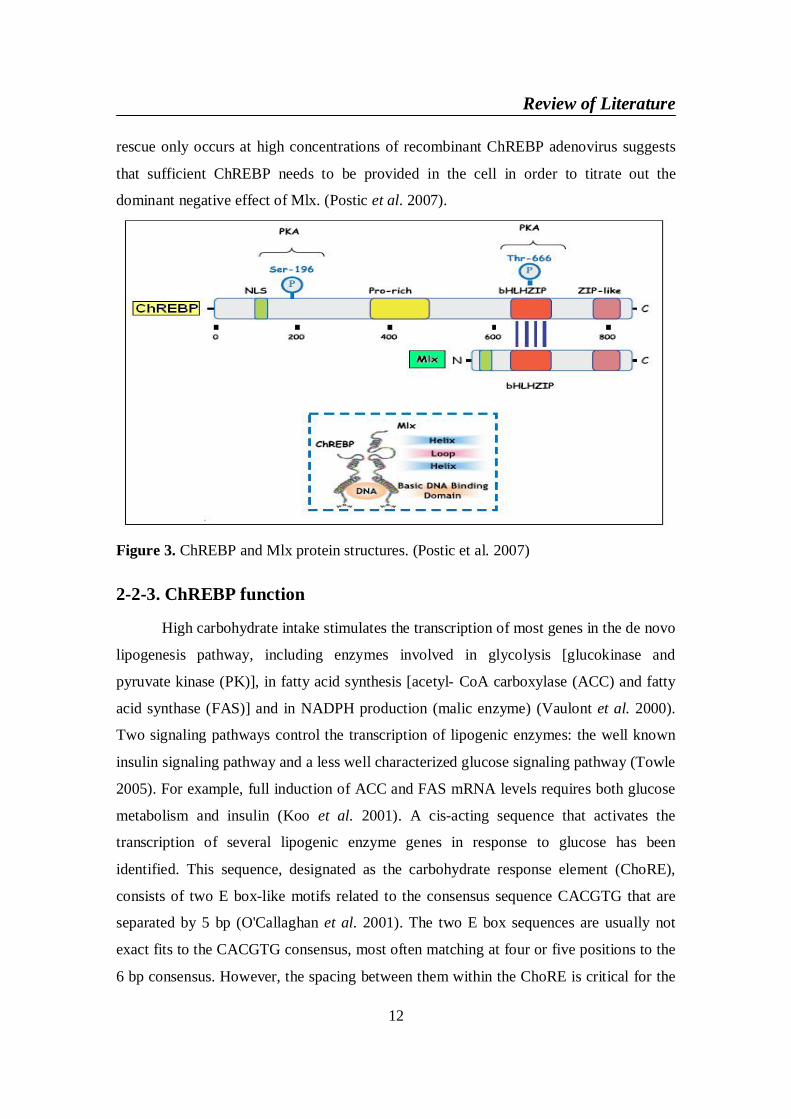
2-2-2. ChREBP protein
ChREBP (864 amino acids and Mr = 94,600) contains several domains, including
a nuclear localization signal (NLS) near the N-terminus, polyproline domains, a basic
loop-helixleucine- zipper (b/HLH/Zip), and a leucinezipper- like (Zip-like) domain
(Figure 3). ChREBP was identified as the long-sought glucose-responsive transcription
factor. ChREBP contains several potential phosphorylation sites for cAMP-dependent
protein kinase (PKA) and AMP-activated protein kinase (AMPK) (Kawaguchi et al.
2001); (Dentin et al. 2006b) Mlx (Max-like protein X) that interacts with the bHLH/LZ
domain of ChREBP (Figure 3). Mlx is a member of the Myc/Max/Mad family of
transcription factors that can serve as a common interaction partner of a transcription
factor network (Meroni et al. 2000). The evidence that Mlx is the partner of ChREBP was
demonstrated using an adenovirus expressing a dominant negative form of Mlx (Ma et al.
2005); (Postic et al. 2007).
ChREBP requires an interaction partner, Mlx, to efficiently bind to ChoRE
sequences and exert its functional activity (Stoeckman et al. 2004). Mlx is a basic helix-
loop helix/ leucine zipper protein that heterodimerizes with several partners, including
ChREBP; MondoA, a paralog of ChREBP expressed predominantly in skeletal muscle,
and the repressors Mad1, Mad4, and Mnt (Billin et al. 2000), (Meroni et al. 2000).
Expressing a dominant negative form of Mlx in hepatocytes completely inhibits
the glucose response of a number of lipogenic enzyme genes, including PK, S14, ACC,
and FAS (Ma et al. 2005). This inhibition is rescued by overexpressing ChREBP but not
MondoA. Therefore, Mlx is an obligatory partner of ChREBP in regulating glucose-
responsive lipogenic enzyme genes (Ma et al. 2006).
The inhibition by a dominant negative form of Mlx directly interferes with the
endogenous ChREBP/Mlx complex and abrogates the glucose response of the ACC
reporter gene in primary cultures of hepatocytes (Ma et al. 2005). This glucose response,
however, can be partially restored when ChREBP is overexpressed. The fact that this
Review of Literature
12
rescue only occurs at high concentrations of recombinant ChREBP adenovirus suggests
that sufficient ChREBP needs to be provided in the cell in order to titrate out the
dominant negative effect of Mlx. (Postic et al. 2007).
Figure 3. ChREBP and Mlx protein structures. (Postic et al. 2007)
2-2-3. ChREBP function
High carbohydrate intake stimulates the transcription of most genes in the de novo
lipogenesis pathway, including enzymes involved in glycolysis [glucokinase and
pyruvate kinase (PK)], in fatty acid synthesis [acetyl- CoA carboxylase (ACC) and fatty
acid synthase (FAS)] and in NADPH production (malic enzyme) (Vaulont et al. 2000).
Two signaling pathways control the transcription of lipogenic enzymes: the well known
insulin signaling pathway and a less well characterized glucose signaling pathway (Towle
2005). For example, full induction of ACC and FAS mRNA levels requires both glucose
metabolism and insulin (Koo et al. 2001). A cis-acting sequence that activates the
transcription of several lipogenic enzyme genes in response to glucose has been
identified. This sequence, designated as the carbohydrate response element (ChoRE),
consists of two E box-like motifs related to the consensus sequence CACGTG that are
separated by 5 bp (O'Callaghan et al. 2001). The two E box sequences are usually not
exact fits to the CACGTG consensus, most often matching at four or five positions to the
6 bp consensus. However, the spacing between them within the ChoRE is critical for the
Review of Literature
13
transcriptional response to glucose. All naturally occurring ChoREs analyzed to date have
a 5 bp spacing between their two E box motifs. Mutations that change this spacing to 6 bp
result in a strongly impaired glucose response, whereas mutations to 4 bp result in a
complete loss of the response (Shih et al. 1995). This stringent spacing requirement
suggests that proteins binding to the two E box motifs might interact sterically (Ma et al.
2007). The emergence of ChREBP in the control of lipogenic gene expression in liver
prompted us to address its role in the physiopathology of hepatic steatosis. (Marchesini et
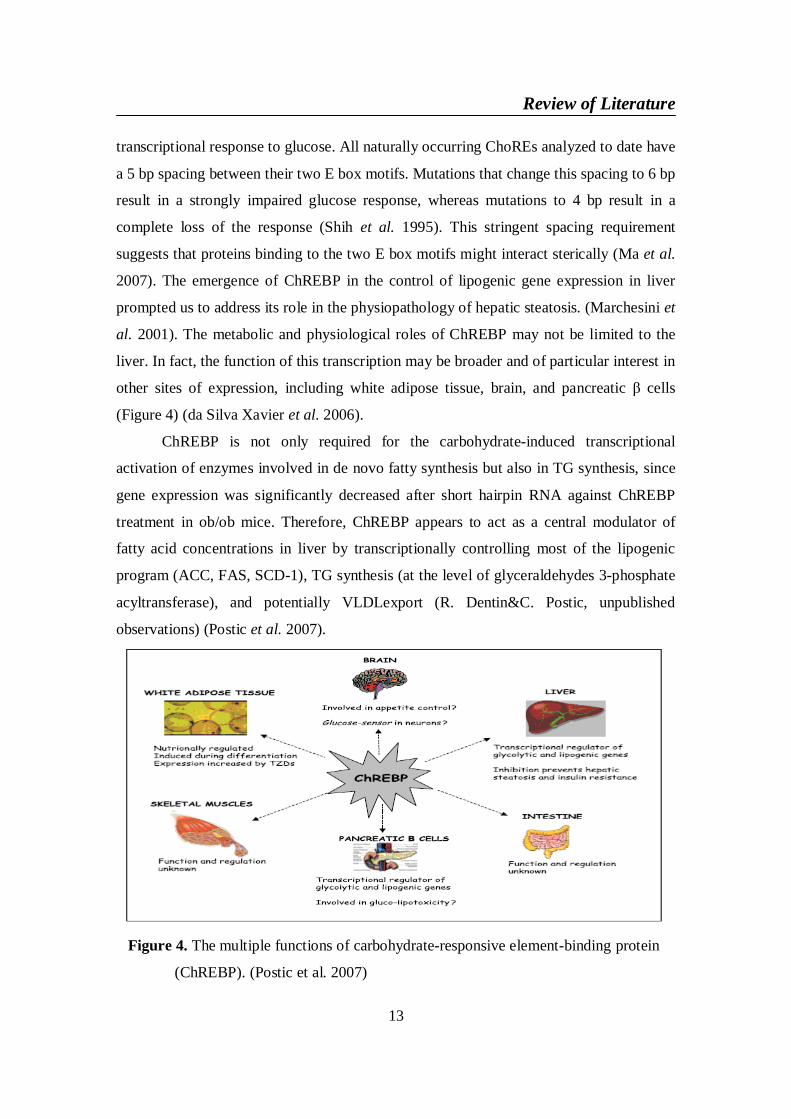
al. 2001). The metabolic and physiological roles of ChREBP may not be limited to the
liver. In fact, the function of this transcription may be broader and of particular interest in
other sites of expression, including white adipose tissue, brain, and pancreatic cells
(Figure 4) (da Silva Xavier et al. 2006).
ChREBP is not only required for the carbohydrate-induced transcriptional
activation of enzymes involved in de novo fatty synthesis but also in TG synthesis, since
gene expression was significantly decreased after short hairpin RNA against ChREBP
treatment in ob/ob mice. Therefore, ChREBP appears to act as a central modulator of
fatty acid concentrations in liver by transcriptionally controlling most of the lipogenic
program (ACC, FAS, SCD-1), TG synthesis (at the level of glyceraldehydes 3-phosphate
acyltransferase), and potentially VLDLexport (R. Dentin&C. Postic, unpublished
observations) (Postic et al. 2007).
Figure 4. The multiple functions of carbohydrate-responsive element-binding protein
(ChREBP). (Postic et al. 2007)
Review of Literature
14
Consequently to adenovirus-mediated inhibition of ChREBP in liver of ob/ob
mice, lipogenesis and triglyceride (TG) synthesis are decreased. As a result, the restored
inhibition of genes from the gluconeogenic pathway (G6Pase and PEPCK) by insulin
leads to the improvement of blood glucose levels. Correction of hepatic steatosis also
leads to decreased levels of plasma TG and nonesterified fatty acids (NEFA). As a
consequence, insulin sensitivity is restored in skeletal muscles and glycogen synthesis is
enhanced, therefore contributing to the decrease in blood glucose concentrations
observed. The overall phenotype is a significant improvement in hyperglycemia,
hyperinsulinemia and hyperlipidemia. Adapted from Dentin et al. (Dentin et al. 2006a);
(Denechaud et al. 2008b).
ChREBP gene expression was reported in the brain, a tissue in which this
transcription factor could play a role in the sensing of glucose (Iizuka et al. 2004)
(Figure 4). Because of leptin deficiency, ob/ob mice are hyperphagic. Interestingly, food
consumption was significantly reduced in ob/ob-ChREBP mice and was associated
with a 30% decrease in the expression of the appetite-stimulating neuropeptide AgRP.
Whether ChREBP directly controls food intake or indirectly controls it through AgRP
expression needs to be further addressed (Postic et al. 2007).
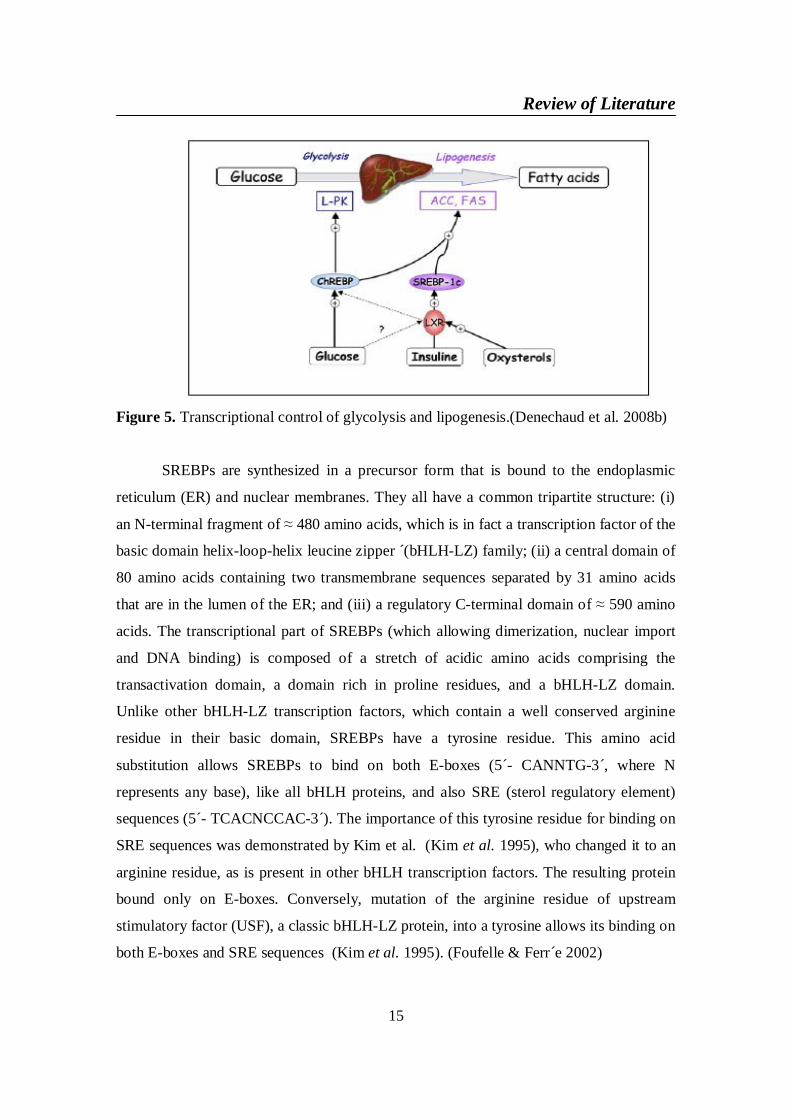
2-2-3-1. ChREBP and SREBP (Sterol regulatory element binding protein-1c)
The transcription factor SREBP- 1c (sterol regulatory element binding protein-
1c) has previously emerged as a major mediator of insulin action on lipogenic genes,
such as acetyl CoA carboxylase (ACC) and fatty acid synthase (FAS) (Foufelle & Ferr´e
2002) (Figure 5). However, SREBP-1c activity alone is not sufficient to account for the
stimulation of glycolytic and lipogenic gene expression in response to carbohydrate since
SREBP-1c gene deletion in mice only results in a 50% reduction in fatty acid synthesis
(Liang et al. 2002). More importantly, L-pyruvate kinase (L-PK), one of the rate-limiting
enzyme of glycolysis is exclusively dependant on glucose (Decaux et al. 1989) and is
not subjected to SREBP-1c regulation (Stoeckman & Towle 2002). (Denechaud et al.
2008b)
Review of Literature
15
Figure 5. Transcriptional control of glycolysis and lipogenesis.(Denechaud et al. 2008b)
SREBPs are synthesized in a precursor form that is bound to the endoplasmic
reticulum (ER) and nuclear membranes. They all have a common tripartite structure: (i)
an N-terminal fragment of 480 amino acids, which is in fact a transcription factor of the
basic domain helix-loop-helix leucine zipper ´(bHLH-LZ) family; (ii) a central domain of
80 amino acids containing two transmembrane sequences separated by 31 amino acids
that are in the lumen of the ER; and (iii) a regulatory C-terminal domain of 590 amino
acids. The transcriptional part of SREBPs (which allowing dimerization, nuclear import
and DNA binding) is composed of a stretch of acidic amino acids comprising the
transactivation domain, a domain rich in proline residues, and a bHLH-LZ domain.
Unlike other bHLH-LZ transcription factors, which contain a well conserved arginine
residue in their basic domain, SREBPs have a tyrosine residue. This amino acid
substitution allows SREBPs to bind on both E-boxes (5´- CANNTG-3 ,́ where N
represents any base), like all bHLH proteins, and also SRE (sterol regulatory element)
sequences (5´- TCACNCCAC-3´). The importance of this tyrosine residue for binding on
SRE sequences was demonstrated by Kim et al. (Kim et al. 1995), who changed it to an
arginine residue, as is present in other bHLH transcription factors. The resulting protein
bound only on E-boxes. Conversely, mutation of the arginine residue of upstream
stimulatory factor (USF), a classic bHLH-LZ protein, into a tyrosine allows its binding on
both E-boxes and SRE sequences (Kim et al. 1995). (Foufelle & Ferr´e 2002)
Review of Literature
16
SREBP was first discovered as a transcription factor that controls genes involved
in the biosynthesis of cholesterol (Brown & Goldstein 1997), more recently the SREBP-
1c isoform has emerged as a major mediator of insulin action on hepatic GK (Foretz et
al. 1999a) and lipogenic gene expression (Foufelle & Ferr´e 2002). To illustrate this
point Kim et al. (Kim et al. 2004) have identified two functional sterol regulatory
elements (SRE) in the rat GK promoter. The authors demonstrate that SREBP-1c can
bind to these SREs and activate the GK promoter. The physiological in vivo interaction
between the SREBP-1c protein and SREs of the GK promoter was confirmed by
chromatin immuno precipitation (ChIP) assay using primary cultures of hepatocytes,
demonstrating the direct involvement of SREBP-1c on GK gene expression. SREBP-1c
also inducees other lipogenic genes by its capacity to bind to SREs present in their
promoters (Magaa & Osborne 1996) (Figure 6). SREBP-1c itself is rapidly induced by
insulin in primary cultures of hepatocytes (Foretz et al. 1999b), providing a pathway for
insulin mediation of lipogenic gene expression (Horton et al. 1998). In addition,
transgenic mice that overexpress SREBP-1c in the liver exhibit liver steatosis and
increased mRNA of most lipogenic genes (Shimomura et al. 1998). Consistent with these
observations, SREBP-1c gene knock-out mice have an impaired ability to fully induce
lipogenic gene expression after high carbohydrate feeding (Liang et al. 2002). The effect
of insulin on SREBP-1c was corroborated by in vivo studies showing that SREBP-1c
expression were low in livers of diabetic rats, and increased markedly after insulin
treatment (Shimomura et al. 1999).
Review of Literature
17
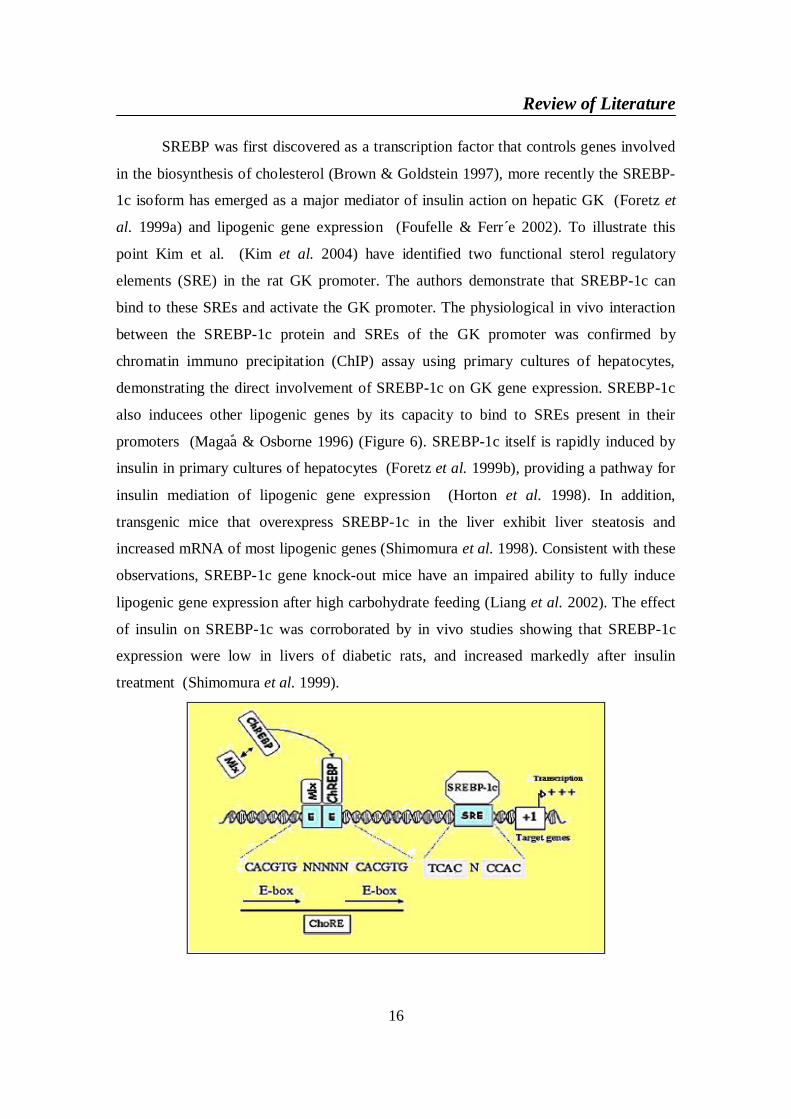
Figure 6. Schematic roles of ChREBP and SREBP-1c in the regulation of glycolytic and
lipogenic gene expression in response to insulin and glucose.
Most lipogenic genes (FAS, ACC) have carbohydrate responsive element
(ChoRE) for binding the ChREBP–Mlx complex and sterol responsive
element (SRE) for binding SREBP-1c, identified through promoter-mapping
analysis. The ChREBP–Mlx complex and SREBP-1c act in synergy to
induce lipogenic gene in response to high glucose and insulin concentration.
(Dentin et al. 2005b)
In the fed state, glucose and insulin coordinate hepatic lipogenesis by regulating
glycolytic and lipogenic gene expression at the transcriptional level. ChREBP and
SREBP 1c share lipogenic genes and genes related to the hexose monophosphate (HMP)
shunt (Ma et al. 2006). Some groups have reported that hepatic glucokinase is required
for the synergistic effects of ChREBP and SREBP 1c on glycolytic and lipogenic gene
expression (Figure 7) (Dentin et al. 2004). Uyeda et al. Showed that glucose-activated
ChREBP directly binds the ChoRE of the L-PK promoter and activates L-PK gene
expression (Yamashita et al. 2001). However, whether SREBP 1c physiologically
mediates the action of insulin on glucokinase remains controversial. The overexpression
of dominant active SREBP 1c induce glucokinase gene expression in hepatocytes.
However, Liang et al . reported that the response of glucokinase to high-carbohydrate diet
refeeding is still conserved in SREBP 1c knockout mice (Liang et al. 2002). In addition,
Iynedjian et al . reported that SREBP 1c cannot bind to liver-type glucokinase promoter
(Hansmannel et al. 2006), and Pichard et al .reported that SREBP 1c knockdown by small
interfering RNAs results in impaired induction of the FAS gene in response to glucose
and insulin but dose not prevent induction of the glucokinase gene (Gregori et al. 2006).
Glucokinase is a key molecule regulation glycolytic flux, and it is important to identify
the various transcription factors that mediate the activation of glucokinase gene
expression gene by insulin.
Review of Literature
18
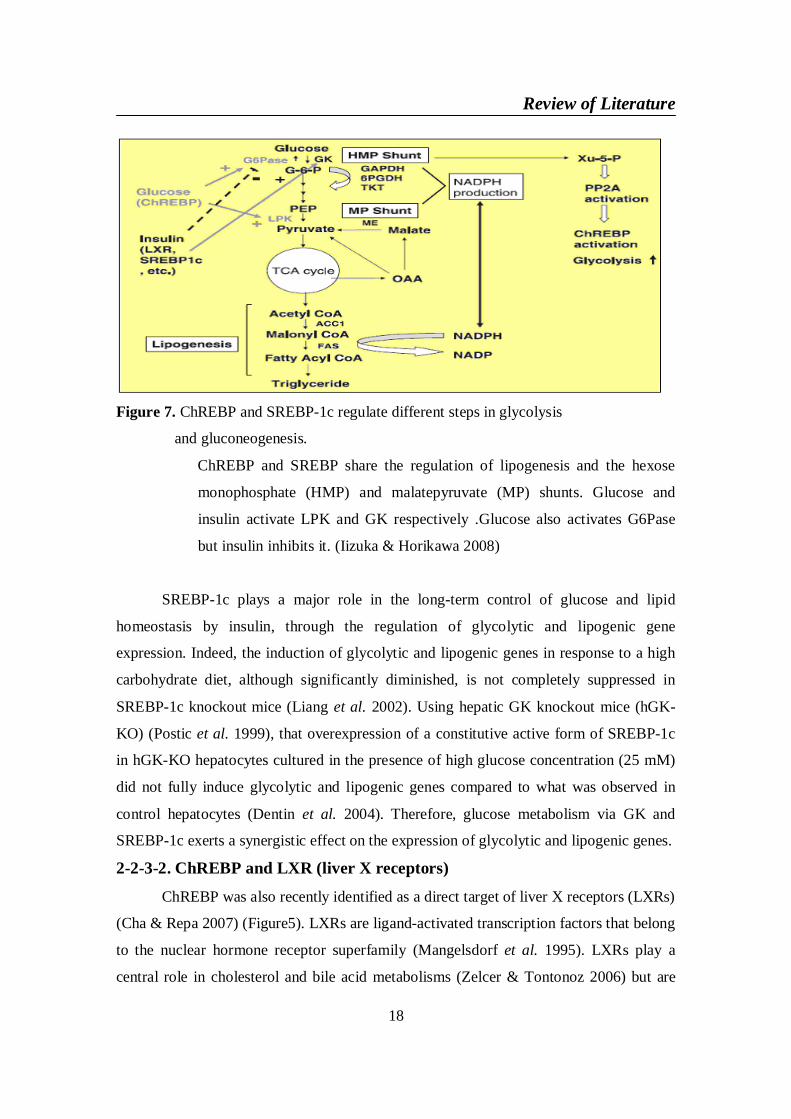
Figure 7. ChREBP and SREBP-1c regulate different steps in glycolysis
and gluconeogenesis.
ChREBP and SREBP share the regulation of lipogenesis and the hexose
monophosphate (HMP) and malatepyruvate (MP) shunts. Glucose and
insulin activate LPK and GK respectively .Glucose also activates G6Pase
but insulin inhibits it. (Iizuka & Horikawa 2008)
SREBP-1c plays a major role in the long-term control of glucose and lipid
homeostasis by insulin, through the regulation of glycolytic and lipogenic gene
expression. Indeed, the induction of glycolytic and lipogenic genes in response to a high
carbohydrate diet, although significantly diminished, is not completely suppressed in
SREBP-1c knockout mice (Liang et al. 2002). Using hepatic GK knockout mice (hGK-
KO) (Postic et al. 1999), that overexpression of a constitutive active form of SREBP-1c
in hGK-KO hepatocytes cultured in the presence of high glucose concentration (25 mM)
did not fully induce glycolytic and lipogenic genes compared to what was observed in
control hepatocytes (Dentin et al. 2004). Therefore, glucose metabolism via GK and
SREBP-1c exerts a synergistic effect on the expression of glycolytic and lipogenic genes.
2-2-3-2. ChREBP and LXR (liver X receptors)
ChREBP was also recently identified as a direct target of liver X receptors (LXRs)
(Cha & Repa 2007) (Figure5). LXRs are ligand-activated transcription factors that belong
to the nuclear hormone receptor superfamily (Mangelsdorf et al. 1995). LXRs play a
central role in cholesterol and bile acid metabolisms (Zelcer & Tontonoz 2006) but are
Review of Literature
19
also important regulators of the lipogenic pathway (Ulven et al. 2005) through the
transcriptional control of SREBP-1c (Chen et al. 2004), FAS (Joseph et al. 2002) ACC
(Zhang et al. 2003) and stearoyl-CoA desaturase 1 (SCD-1) (Chu et al. 2006), the
enzyme required for the biosynthesis of monounsaturated fats, palmitoleate and oleate
from saturated fatty acids (Flowers et al. 2006). In fact, LXRs are central for the insulin-
meditated induction of SREBP-1c (Chen et al. 2004). Known ligands of LXRs are
oxysterols but, interestingly, glucose was also recently shown to activate LXRs and to
induce their target genes, including ChREBP (Figure 5) (Mitro et al. 2007). This study
directly implicated LXRs as master regulators of the glucose-signaling pathway and
challenged the role of previously recognized glucose-sensors such as glucokinase (GK),
the first enzyme of the glycolytic pathway. Indeed, hepatic GK is acting as a glucose-
sensor in liver and is required for the expression of ChREBP as well as the subsequent
induction of glycolytic and lipogenic genes. However, as raised by Lazar and Wilson
(Lazar & Willson 2007) several concerns aroused from the study of Mitro et al. (Mitro et
al. 2007) including the fact that both D-glucose and L-glucose (which is inactive in most
biological reaction including GK activity) were found to activate LXRs (Matschinsky
1996) and that the experiments were performed in HepG2 cells, an hepatoma cell line that
respond poorly to glucose. Clearly, studies performed in a physiological context will be
necessary to help understand the physiological relevance of LXRs as glucose-sensors in
liver. (Denechaud et al. 2008b)
Cholesterol homeostasis genes that require LXR for expression are upregulated in
liver and intestine of fasted mice re-fed with a glucose diet, indicating that glucose is an
endogenous LXR ligand. LXR-a and LXR-b (also called NR1H3 and NR1H2,
respectively) are RXR partners that recognize oxidized cholesterol and control gene
expression linked to cholesterol and fatty acid metabolism6–8. Activation of LXRs
results in decreased atherosclerosis in rodents. LXR ligands have anti-diabetic effects as
well, decreasing liver glucose output and increasing peripheral glucose disposal (Laffitte
et al. 2003); (Mitro et al. 2007)
At the transcriptional level, ChREBP also is regulated loosely in several
conditions. The level of ChREBP mRNA in liver in the fed state is the same as or twice
as high as the level during fasting (Letexier et al. 2005). Repa et al. reported that LXR
directly regulates ChREBP gene expression at the transcriptional level (Cha & Repa
Review of Literature
20
2007). The mouse ChREBP gene promoter contents a LXR response element at about 2.4
kbp, and LXR agonists increase hepatic ChREBP mRNA in wild- type mice but not in
LXR – double knockout mice. Moreover, Saez et al. reported that LXR is activated by
glucose and that high – glucose treatment increased ChREBP mRNA two – fold in
HepG2 cells (Mitro et al. 2007). Insulin also regulates the expression and transactivity of
the LXR gene (Chen et al. 2004). However, despite the hyperinsulinemia and
hyperglycemia seen in ob/ob mice, the level of ChREBP mRNA in liver of ob/ob mice is
only twice as high as in liver of wild type mice (Iizuka et al. 2006); (Iizuka & Horikawa
2008)
Several groups have shown that hepatocyte nuclear factor 4 (HNF4 ), plays an
important complementary role to ChREBP in the induction of L-PK gene expression
(Adamson et al. 2006). Both ChREBP (the ChoRE, located from -165 to -145 bp with
respect to the transcription start site) and HNF4 binding sites (the L3 element, located
from -145 to -127 bp) are required for maximal glucose induced transactivation of the L-
PK gene (Diaz Guerra et al. 1993). While ChREBP and HNF4 have been implicated as
contributing factors in the regulation of the L-PK gene by glucose, the mechanisms
underlying both the glucose activation and cAMP-mediated repression of this gene are
largely unknown. (Burke et al. 2009).
2-2-4. Regulation of ChREBP transcriptional activity
ChREBP is regulated in a reciprocal manner by glucose and cAMP. Studies from
the Uyeda’s laboratory (Kawaguchi et al. 2001) established a model in which ChREBP
would be localized in the cytosol under basal conditions, and would then be translocated
into the nucleus under high glucose concentrations, thereby allowing its binding to the
ChoRE present on glycolytic and lipogenic gene promoters. (Dentin et al. 2006b)
Dysregulations in hepatic lipid synthesis are often associated with obesity and
type 2 diabetes, and therefore a perfect understanding of the regulation of this metabolic
pathway appears essential to identify potential therapeutic targets. The transcription
factor ChREBP (carbohydrate-responsive element-binding protein) has emerged as a
major mediator of glucose action on lipogenic gene expression and as a key determinant
of lipid synthesis in vivo (Postic et al. 2007).
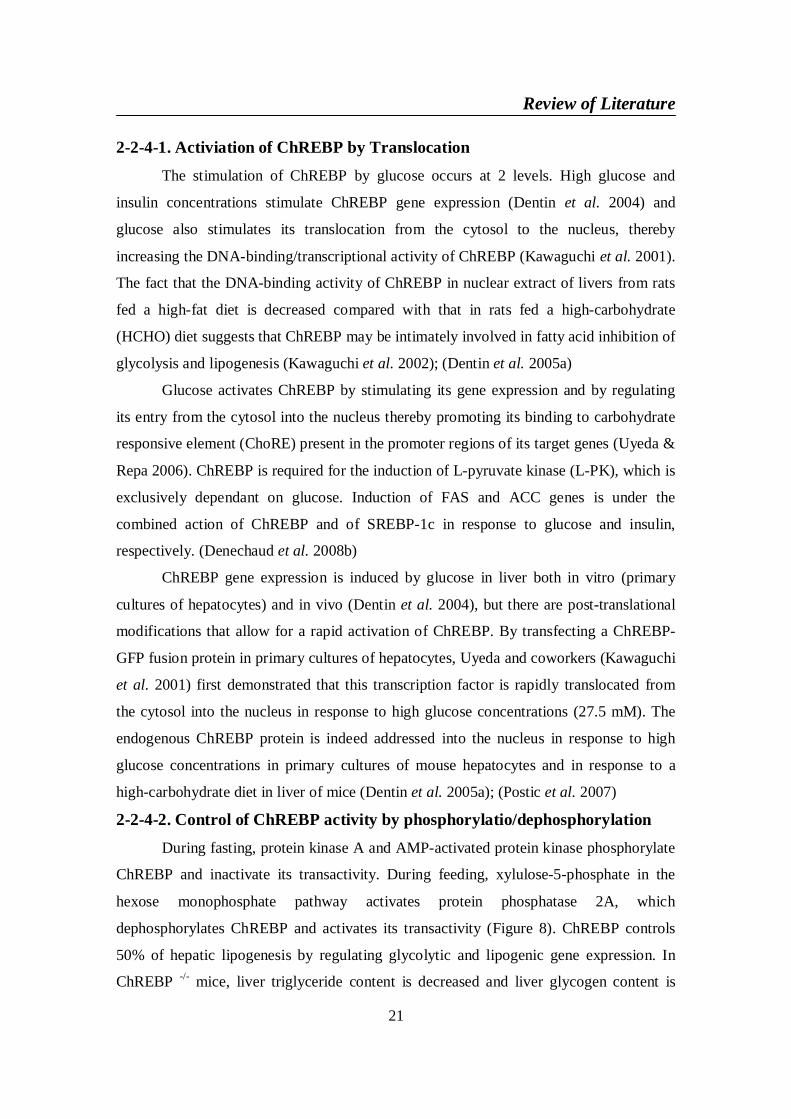
Review of Literature
21
2-2-4-1. Activiation of ChREBP by Translocation
The stimulation of ChREBP by glucose occurs at 2 levels. High glucose and
insulin concentrations stimulate ChREBP gene expression (Dentin et al. 2004) and
glucose also stimulates its translocation from the cytosol to the nucleus, thereby
increasing the DNA-binding/transcriptional activity of ChREBP (Kawaguchi et al. 2001).
The fact that the DNA-binding activity of ChREBP in nuclear extract of livers from rats
fed a high-fat diet is decreased compared with that in rats fed a high-carbohydrate
(HCHO) diet suggests that ChREBP may be intimately involved in fatty acid inhibition of
glycolysis and lipogenesis (Kawaguchi et al. 2002); (Dentin et al. 2005a)
Glucose activates ChREBP by stimulating its gene expression and by regulating
its entry from the cytosol into the nucleus thereby promoting its binding to carbohydrate
responsive element (ChoRE) present in the promoter regions of its target genes (Uyeda &
Repa 2006). ChREBP is required for the induction of L-pyruvate kinase (L-PK), which is
exclusively dependant on glucose. Induction of FAS and ACC genes is under the
combined action of ChREBP and of SREBP-1c in response to glucose and insulin,
respectively. (Denechaud et al. 2008b)
ChREBP gene expression is induced by glucose in liver both in vitro (primary
cultures of hepatocytes) and in vivo (Dentin et al. 2004), but there are post-translational
modifications that allow for a rapid activation of ChREBP. By transfecting a ChREBP-
GFP fusion protein in primary cultures of hepatocytes, Uyeda and coworkers (Kawaguchi
et al. 2001) first demonstrated that this transcription factor is rapidly translocated from
the cytosol into the nucleus in response to high glucose concentrations (27.5 mM). The
endogenous ChREBP protein is indeed addressed into the nucleus in response to high
glucose concentrations in primary cultures of mouse hepatocytes and in response to a
high-carbohydrate diet in liver of mice (Dentin et al. 2005a); (Postic et al. 2007)
2-2-4-2. Control of ChREBP activity by phosphorylatio/dephosphorylation
During fasting, protein kinase A and AMP-activated protein kinase phosphorylate
ChREBP and inactivate its transactivity. During feeding, xylulose-5-phosphate in the
hexose monophosphate pathway activates protein phosphatase 2A, which
dephosphorylates ChREBP and activates its transactivity (Figure 8). ChREBP controls
50% of hepatic lipogenesis by regulating glycolytic and lipogenic gene expression. In
ChREBP -/- mice, liver triglyceride content is decreased and liver glycogen content is
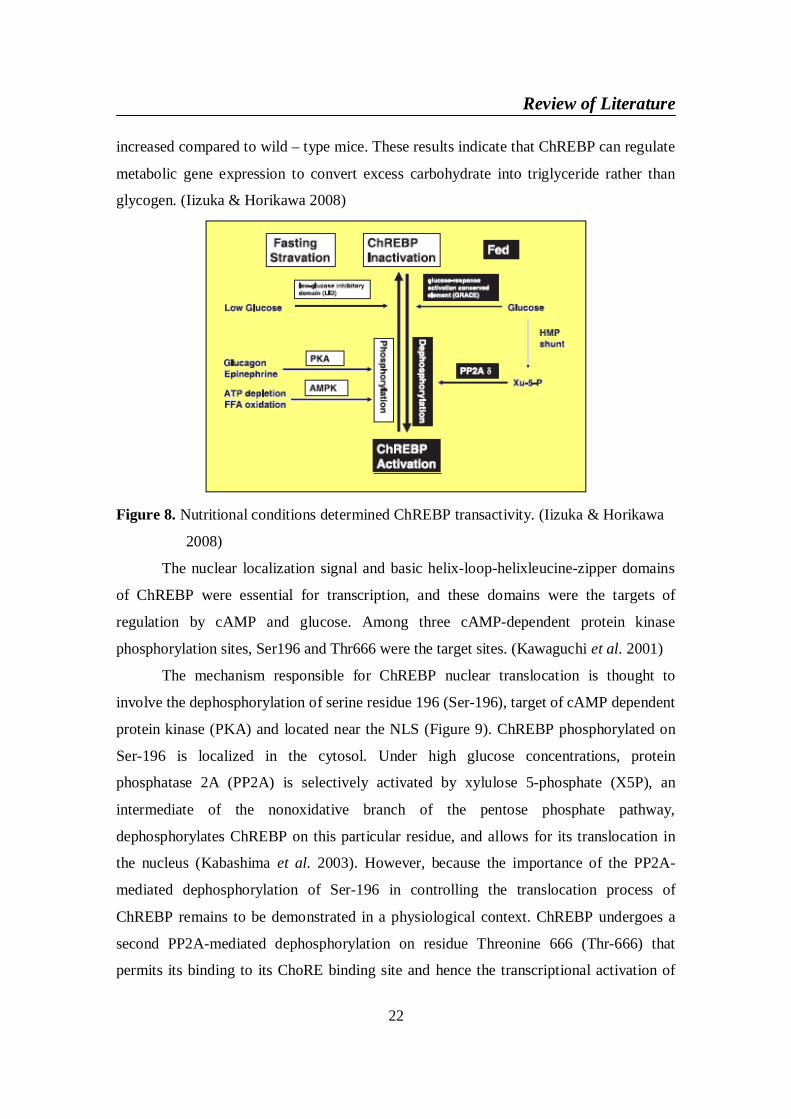
Review of Literature
22
increased compared to wild – type mice. These results indicate that ChREBP can regulate
metabolic gene expression to convert excess carbohydrate into triglyceride rather than
glycogen. (Iizuka & Horikawa 2008)
Figure 8. Nutritional conditions determined ChREBP transactivity. (Iizuka & Horikawa
2008)
The nuclear localization signal and basic helix-loop-helixleucine-zipper domains
of ChREBP were essential for transcription, and these domains were the targets of
regulation by cAMP and glucose. Among three cAMP-dependent protein kinase
phosphorylation sites, Ser196 and Thr666 were the target sites. (Kawaguchi et al. 2001)
The mechanism responsible for ChREBP nuclear translocation is thought to
involve the dephosphorylation of serine residue 196 (Ser-196), target of cAMP dependent
protein kinase (PKA) and located near the NLS (Figure 9). ChREBP phosphorylated on
Ser-196 is localized in the cytosol. Under high glucose concentrations, protein
phosphatase 2A (PP2A) is selectively activated by xylulose 5-phosphate (X5P), an
intermediate of the nonoxidative branch of the pentose phosphate pathway,
dephosphorylates ChREBP on this particular residue, and allows for its translocation in
the nucleus (Kabashima et al. 2003). However, because the importance of the PP2A-
mediated dephosphorylation of Ser-196 in controlling the translocation process of
ChREBP remains to be demonstrated in a physiological context. ChREBP undergoes a
second PP2A-mediated dephosphorylation on residue Threonine 666 (Thr-666) that
permits its binding to its ChoRE binding site and hence the transcriptional activation of
Review of Literature
23
its target genes (Figure 9). Lange and coworkers (Wu et al. 2005) have observed that the
phosphorylation status of the endogenous ChREBP protein (using an in-gel
phosphoprotein assay) is decreased under conditions of increased glucose flux through
hepatic GK. The fact that the overexpression of GK and the lower phosphorylation state
of ChREBP were correlated to a 1.5-fold increase in X5P concentrations seems in
agreement with the model initially proposed by Uyeda and colleagues (Wu et al. 2005).
Although there is no doubt that ChREBP is a phosphoprotein, the fact that its activity is
activated by dephosphorylation has brought some controversy. Studies from the
laboratories of Towle and Chan have strongly challenged these concepts and have
suggested that dephosphorylation is not responsible for the activation of ChREBP. The
first insight came from the observation that although global phosphorylation of the
endogenous ChREBP protein was increased under cAMP conditions, it did not change
when hepatocytes were switched from low to high glucose concentrations (Tsatsos &
Towle 2006).
Figure 9. Transcriptional activation of glycolytic and lipogenic genes by ChREBP/Mlx
and SREBP-1c in liver. (Postic et al. 2007)
Review of Literature
24
2-2-5. Role of ChREBP in the physiopathology of hepatic steatosis and
insulin resistance
2-2-5-1. Obesity
In the past several decade obesity has become extremely common, with
prevalence rates skyrocketing among certain groups and communities (Kopelman 2000).
In as much as traditional dietary approaches to combat obesity have largely failed, the
scientific community has become increasingly interested in the molecular regulation of
triglycerides synthesis and in pharmaceutical approaches to reduce fat storage.
Accordingly, a heavy research effort is currently directed towards the identification of
molecular target for fat storage, and on the development of drugs that specifically reduce
adipose tissue mass. (Kersten 2001)
ChREBP deficiency overcomes the fatty liver phenotype, and improves glucose
tolerance and insulin resistance in ob/ob mice, suggesting that a reduction of ChREBP
activity may have a beneficial effect in the treatment of metabolic diseases associated
with hyperglycemia and dyslipidemia. The study by Iizuka and coworkers (Iizuka et al.
2006) further underlined the importance of ChREBP in the development of obesity and
type 2 diabetes by intercrossing ChREBP knockout mice with ob/ob mice (Iizuka et al.
2004; Postic & Girard 2008).
2-2-5-2. Insulin resistance and Diabetes mellitus
ChREBP was associated with a normalization of hepatic insulin signaling in
ChREBP knockdown ob/ob mice. Interestingly, insulin sensitivity was restored not only
in liver but also in skeletal muscles and adipose tissue, in which a significant
improvement in Akt phosphorylation in response to the insulin bolus was observed
(Dentin et al. 2006a). As a result, glycogen content was restored to control levels in
skeletal muscles from shChREBP RNA-treated ob/ob mice. Skeletal muscle is known to
play a determinant role in the physiopathology of insulin resistance, and defects in
glycogen synthesis have been particularly implicated in its pathogenesis (Petersen &
Shulman 2002); (Postic et al. 2007)
Hepatic insulin resistance has been associated with steatosis in both rodents
(Samuel et al. 2004) and humans (Seppala-Lindroos et al. 2002). This resistance could
result from the contribution of adipose tissue through increased flux of free fatty acids
Review of Literature
25
(FFA) to the liver and by secretion of numerous adipocytokines, which may affect
hepatic insulin action. Although the association between hepatic insulin resistance and
TG accumulation in liver is clear, the causative role for hepatic insulin resistance in the
accumulation of TG has not clearly established. Nevertheless, by markedly preventing
TG accumulation in liver of ob/ob mice, ChREBP knockdown significantly restored
insulin sensitivity in liver as evidenced by the restoration of protein kinase B (Akt), and
Foxo1 phosphorylation by insulin (Dentin et al. 2006a). The transcription factor Foxo1
plays a pivotal role in the control of gluconeogenesis by transcriptionnally regulating the
expression of PEPCK and G6Pase in liver (Puigserver et al. 2002). Insulin-mediated Akt
phosphorylation of Foxo1 leads to its nuclear exclusion, ubiquitination and degradation
(Matsuzaki et al. 2003). The subsequent decrease in nuclear Foxo1 decreases expression
levels of PEPCK and G6Pase, thereby decreasing gluconeogenic rates and reducing blood
glucose. In agreement with these studies, ChREBP knockdown, by rescuing Foxo1
phosphorylation by insulin, led to an efficient inhibition of PEPCK and G6Pase,
associated with a subsequent normalization of blood glucose levels in shChREBP RNA
treated-ob/ob mice (Dentin et al. 2006a) (Figure10).
Diabetes mellitus (DM) is a chronic metabolic disease with high rates of
prevalence and mortality world wide that is caused by an absolute or relative lack of
insulin and or reduced insulin activity (Kamtchouing et al. 2004). It is characterized by
hyperglycemia and long-term complications affecting the eyes, kidneys, nerves, and
blood vessels, and is the most common endocrine disorder. Although the leading
mechanism of diabetic complications remains unclear, much attention has been paid to
the role of oxidative stress. It has been suggested that oxidative stress may contribute to
the pathogenesis of different diabetic complications (Ceriello 2000). Furthermore, with
diabetes, several features appear including an increase in lipid peroxidation (Gumieniczek
2005), alteration of the glutathione redox state, a decrease in the content of individual
natural antioxidants, and finally a reduction in the antioxidant enzyme activities. These
changes suggest an oxidative stress caused by hyperglycemia (Chaudhry et al. 2007).
Many defense mechanisms are involved in alloxan-induced oxidative damage. Among
these mechanisms, antioxidants play the role of a free-radical scavenger (Karaoz et al.
2002); (JEMAI et al. 2009)
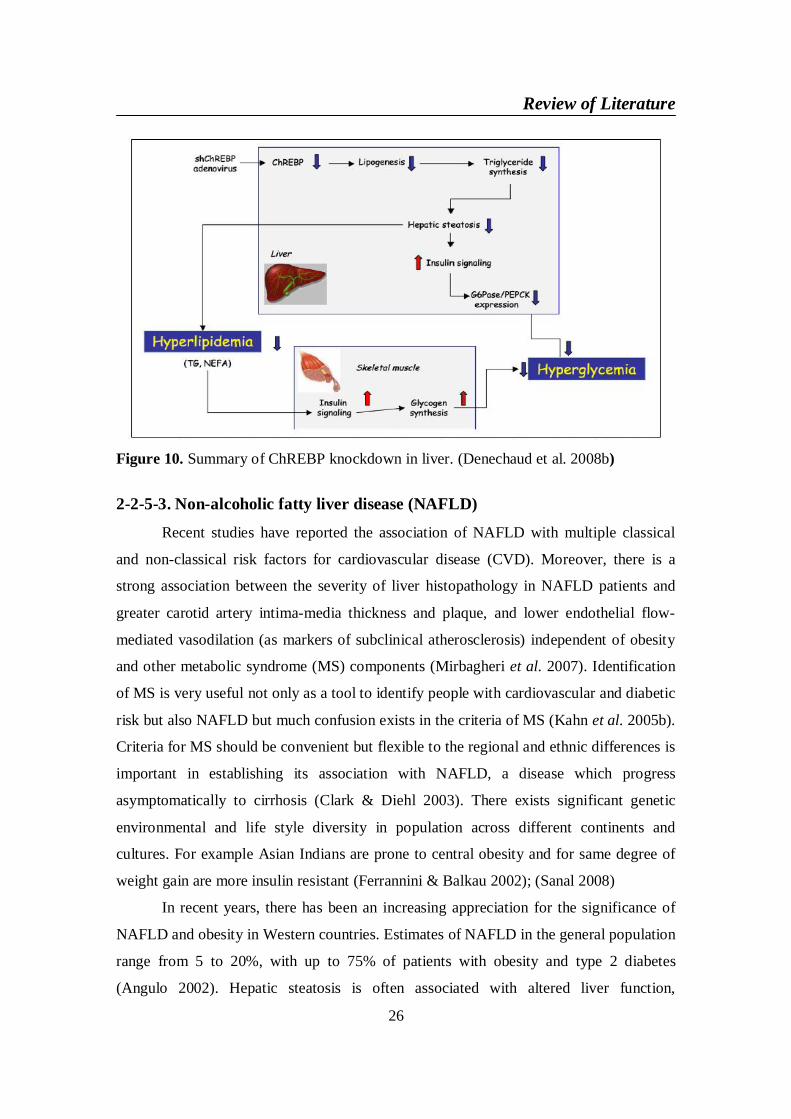
Review of Literature
26
Figure 10. Summary of ChREBP knockdown in liver. (Denechaud et al. 2008b)
2-2-5-3. Non-alcoholic fatty liver disease (NAFLD)
Recent studies have reported the association of NAFLD with multiple classical
and non-classical risk factors for cardiovascular disease (CVD). Moreover, there is a
strong association between the severity of liver histopathology in NAFLD patients and
greater carotid artery intima-media thickness and plaque, and lower endothelial flow-
mediated vasodilation (as markers of subclinical atherosclerosis) independent of obesity
and other metabolic syndrome (MS) components (Mirbagheri et al. 2007). Identification
of MS is very useful not only as a tool to identify people with cardiovascular and diabetic
risk but also NAFLD but much confusion exists in the criteria of MS (Kahn et al. 2005b).
Criteria for MS should be convenient but flexible to the regional and ethnic differences is
important in establishing its association with NAFLD, a disease which progress
asymptomatically to cirrhosis (Clark & Diehl 2003). There exists significant genetic
environmental and life style diversity in population across different continents and
cultures. For example Asian Indians are prone to central obesity and for same degree of
weight gain are more insulin resistant (Ferrannini & Balkau 2002); (Sanal 2008)
In recent years, there has been an increasing appreciation for the significance of
NAFLD and obesity in Western countries. Estimates of NAFLD in the general population
range from 5 to 20%, with up to 75% of patients with obesity and type 2 diabetes
(Angulo 2002). Hepatic steatosis is often associated with altered liver function,
Review of Literature
27
hyperlipidemia, and progression to liver cirrhosis (Marchesini et al. 1999). Studies have
demonstrated an important role for hepatic steatosis in the pathogenesis of insulin
resistance, including increased gluconeogenesis and fasting hyperglycemia in patients
with type 2 diabetes (Petersen et al. 2005); (Dentin et al. 2006a)
NAFLD can progress to nonalcoholic steatohepatitis (NASH), a fatty liver with
hepatitis. This form of liver injury carries a 20-50% risk for progressive fibrosis, 30%
risk for cirrhosis, and 5% risk for hepato- cellular carcinoma (Angulo 2002); (Nseir et al.
2010)
NAFLD is the most common cause of liver dysfunction and affects close to 20
million patients in the US (Ahmed & Byrne 2007). The spectrum of NAFLD ranges from
simple fatty liver (hepatic steatosis), with benign prognosis, to a potentially progressive
form, nonalcoholic steatohepatitis (NASH), which may lead to liver fibrosis and
cirrhosis, resulting in increased morbidity and mortality. All features of the metabolic
syndrome, including obesity, type 2 diabetes, arterial hypertension, and hyperlipidemia
(in the form of elevated triglyceride [TG] levels) are associated with NAFLD/NASH
(Abdelmalek & Diehl 2007). NAFLD is generally asymptomatic, although a minority of
patients may present with progressive liver injury with complications of cirrhosis, liver
failure, and hepatocellular carcinoma. While the clinical diagnosis of NAFLD is usually
made based on high transaminase levels, elevated BMI, ultrasound evidence of fat, and
features of metabolic syndrome, a liver biopsy is required to determine the presence of
NASH and to assess the degree of fibrosis (Adams & Lindor 2007). Despite being
potentially severe, little is known about the natural history or prognostic significance of
NAFLD. Although diabetes, obesity, and age are recognized risk factors for advanced
liver disease, other significant factors leading to progressive liver injury remain to be
identified. (Postic & Girard 2008)
Excessive accumulation of triglycerides (TG) is one the main characteristics of
non-alcoholic fatty liver disease and fatty acids utilized for the synthesis of TG in liver
are available from the plasma non-esterified fatty acid pool but also from fatty acids
newly synthesized through hepatic de novo lipogenesis (Figure 11) (Denechaud et al.
2008b).
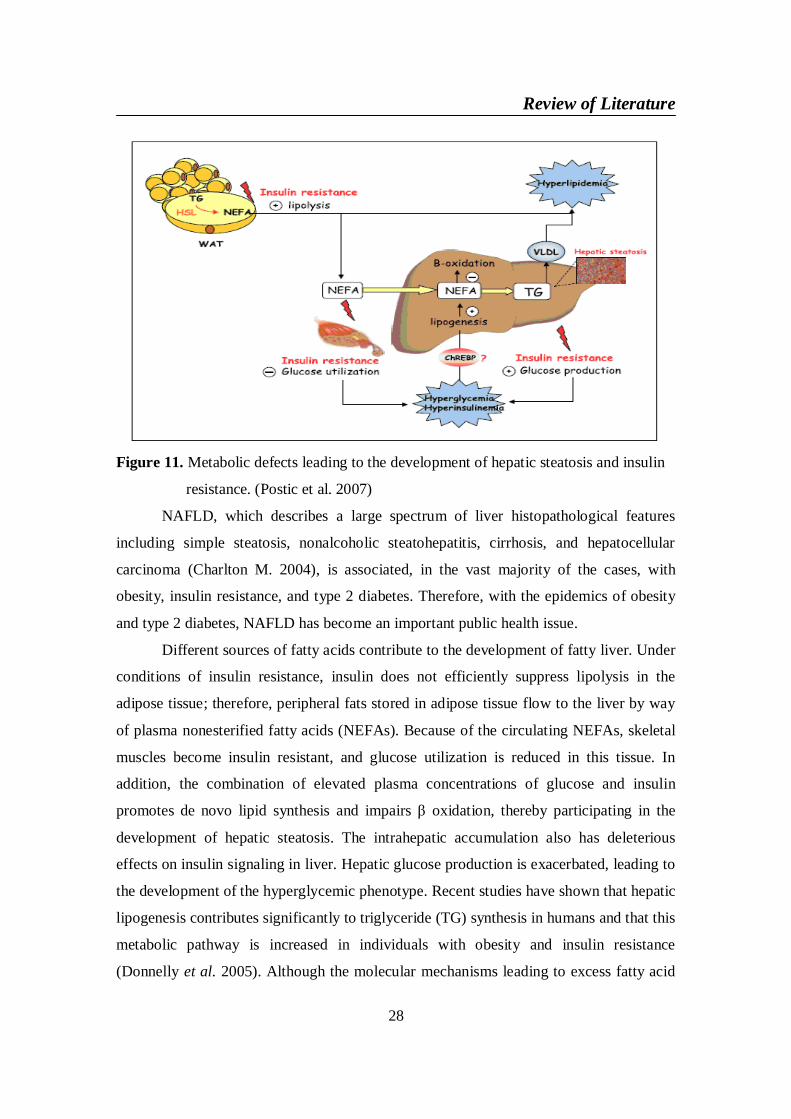
Review of Literature
28
Figure 11. Metabolic defects leading to the development of hepatic steatosis and insulin
resistance. (Postic et al. 2007)
NAFLD, which describes a large spectrum of liver histopathological features
including simple steatosis, nonalcoholic steatohepatitis, cirrhosis, and hepatocellular
carcinoma (Charlton M. 2004), is associated, in the vast majority of the cases, with
obesity, insulin resistance, and type 2 diabetes. Therefore, with the epidemics of obesity
and type 2 diabetes, NAFLD has become an important public health issue.
Different sources of fatty acids contribute to the development of fatty liver. Under
conditions of insulin resistance, insulin does not efficiently suppress lipolysis in the
adipose tissue; therefore, peripheral fats stored in adipose tissue flow to the liver by way
of plasma nonesterified fatty acids (NEFAs). Because of the circulating NEFAs, skeletal
muscles become insulin resistant, and glucose utilization is reduced in this tissue. In
addition, the combination of elevated plasma concentrations of glucose and insulin
promotes de novo lipid synthesis and impairs oxidation, thereby participating in the
development of hepatic steatosis. The intrahepatic accumulation also has deleterious
effects on insulin signaling in liver. Hepatic glucose production is exacerbated, leading to
the development of the hyperglycemic phenotype. Recent studies have shown that hepatic
lipogenesis contributes significantly to triglyceride (TG) synthesis in humans and that this
metabolic pathway is increased in individuals with obesity and insulin resistance
(Donnelly et al. 2005). Although the molecular mechanisms leading to excess fatty acid
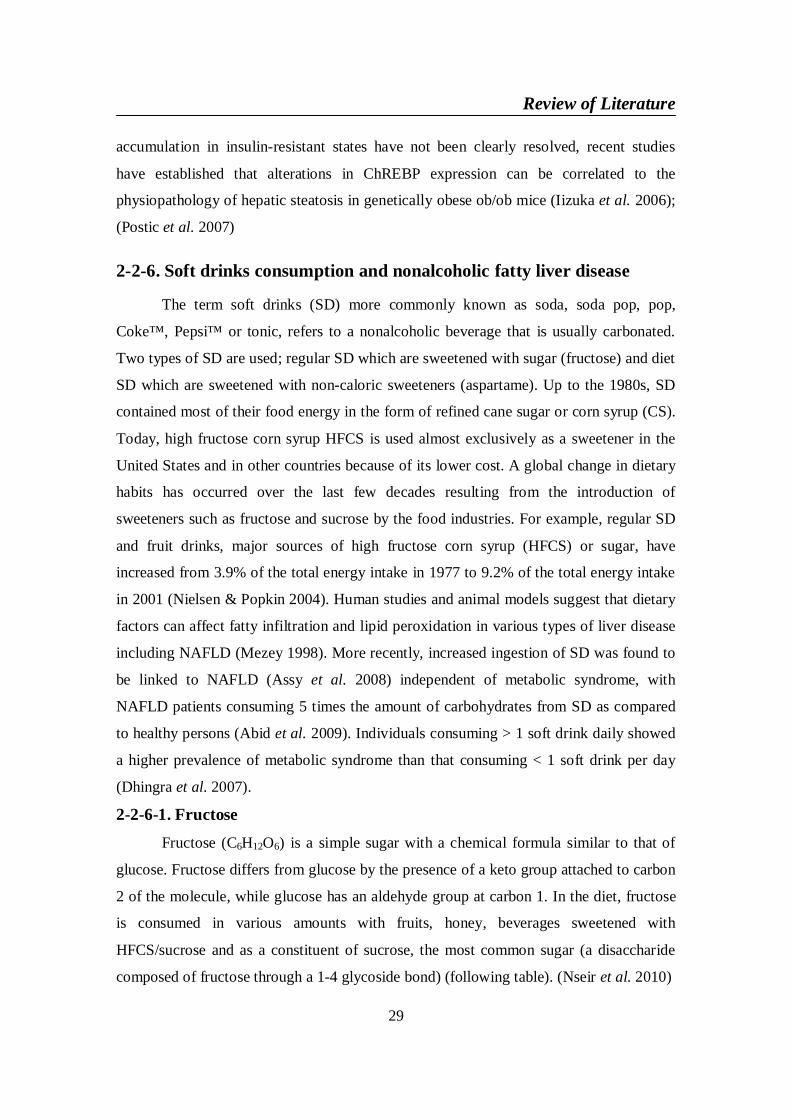
Review of Literature
29
accumulation in insulin-resistant states have not been clearly resolved, recent studies
have established that alterations in ChREBP expression can be correlated to the
physiopathology of hepatic steatosis in genetically obese ob/ob mice (Iizuka et al. 2006);
(Postic et al. 2007)
2-2-6. Soft drinks consumption and nonalcoholic fatty liver disease
The term soft drinks (SD) more commonly known as soda, soda pop, pop,
Coke™, Pepsi™ or tonic, refers to a nonalcoholic beverage that is usually carbonated.
Two types of SD are used; regular SD which are sweetened with sugar (fructose) and diet
SD which are sweetened with non-caloric sweeteners (aspartame). Up to the 1980s, SD
contained most of their food energy in the form of refined cane sugar or corn syrup (CS).
Today, high fructose corn syrup HFCS is used almost exclusively as a sweetener in the
United States and in other countries because of its lower cost. A global change in dietary
habits has occurred over the last few decades resulting from the introduction of
sweeteners such as fructose and sucrose by the food industries. For example, regular SD
and fruit drinks, major sources of high fructose corn syrup (HFCS) or sugar, have
increased from 3.9% of the total energy intake in 1977 to 9.2% of the total energy intake
in 2001 (Nielsen & Popkin 2004). Human studies and animal models suggest that dietary
factors can affect fatty infiltration and lipid peroxidation in various types of liver disease
including NAFLD (Mezey 1998). More recently, increased ingestion of SD was found to
be linked to NAFLD (Assy et al. 2008) independent of metabolic syndrome, with
NAFLD patients consuming 5 times the amount of carbohydrates from SD as compared
to healthy persons (Abid et al. 2009). Individuals consuming > 1 soft drink daily showed
a higher prevalence of metabolic syndrome than that consuming < 1 soft drink per day
(Dhingra et al. 2007).
2-2-6-1. Fructose
Fructose (C6H12O6) is a simple sugar with a chemical formula similar to that of
glucose. Fructose differs from glucose by the presence of a keto group attached to carbon
2 of the molecule, while glucose has an aldehyde group at carbon 1. In the diet, fructose
is consumed in various amounts with fruits, honey, beverages sweetened with
HFCS/sucrose and as a constituent of sucrose, the most common sugar (a disaccharide
composed of fructose through a 1-4 glycoside bond) (following table). (Nseir et al. 2010)
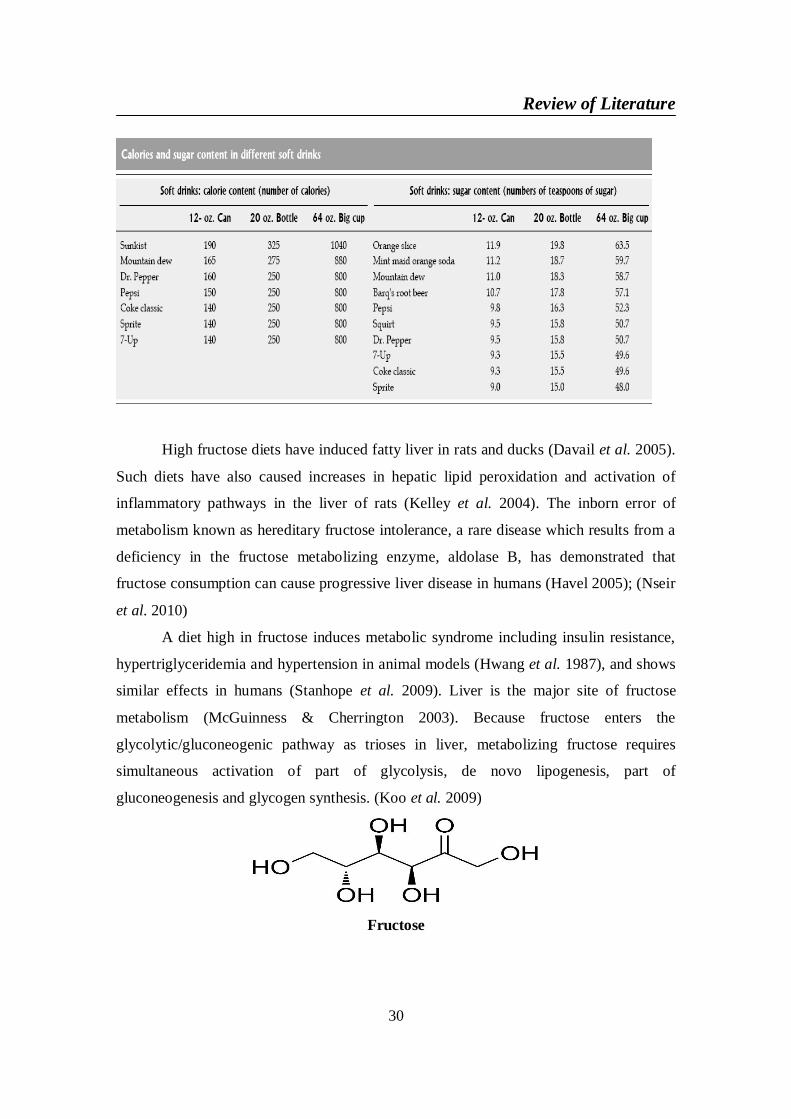
Review of Literature
30
High fructose diets have induced fatty liver in rats and ducks (Davail et al. 2005).
Such diets have also caused increases in hepatic lipid peroxidation and activation of
inflammatory pathways in the liver of rats (Kelley et al. 2004). The inborn error of
metabolism known as hereditary fructose intolerance, a rare disease which results from a
deficiency in the fructose metabolizing enzyme, aldolase B, has demonstrated that
fructose consumption can cause progressive liver disease in humans (Havel 2005); (Nseir
et al. 2010)
A diet high in fructose induces metabolic syndrome including insulin resistance,
hypertriglyceridemia and hypertension in animal models (Hwang et al. 1987), and shows
similar effects in humans (Stanhope et al. 2009). Liver is the major site of fructose
metabolism (McGuinness & Cherrington 2003). Because fructose enters the
glycolytic/gluconeogenic pathway as trioses in liver, metabolizing fructose requires
simultaneous activation of part of glycolysis, de novo lipogenesis, part of
gluconeogenesis and glycogen synthesis. (Koo et al. 2009)
Fructose
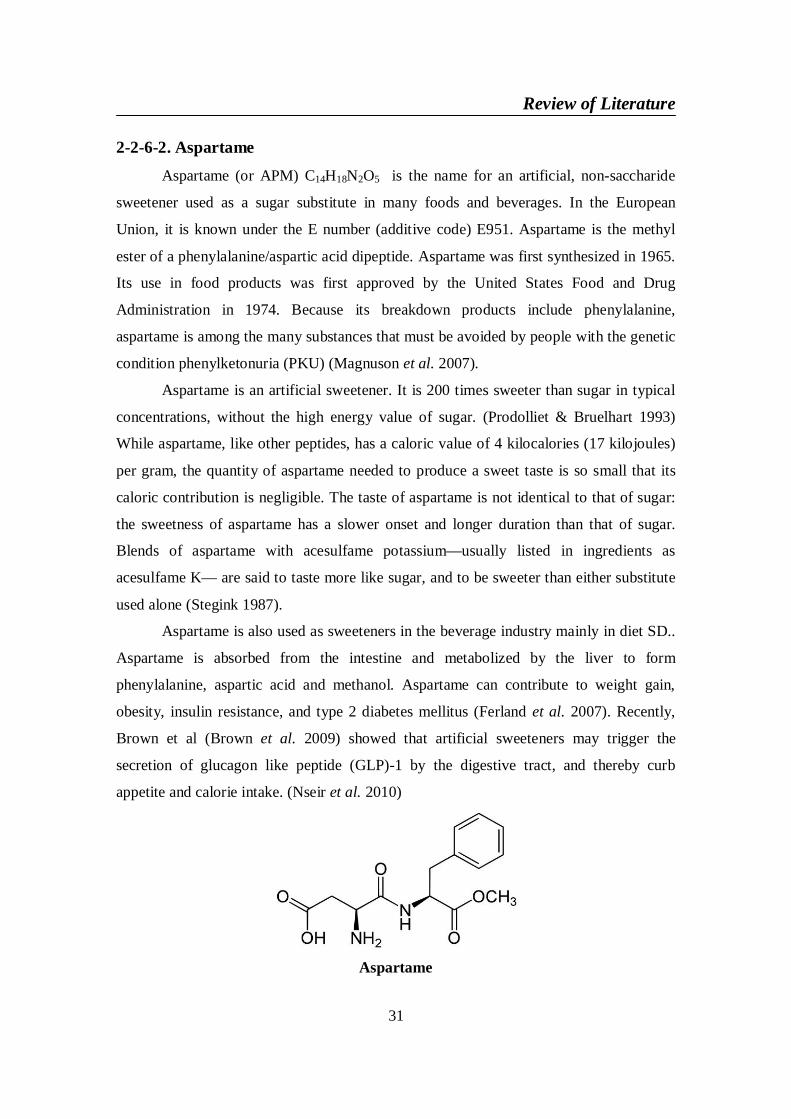
Review of Literature
31
2-2-6-2. Aspartame
Aspartame (or APM) C14H18N2O5 is the name for an artificial, non-saccharide
sweetener used as a sugar substitute in many foods and beverages. In the European
Union, it is known under the E number (additive code) E951. Aspartame is the methyl
ester of a phenylalanine/aspartic acid dipeptide. Aspartame was first synthesized in 1965.
Its use in food products was first approved by the United States Food and Drug
Administration in 1974. Because its breakdown products include phenylalanine,
aspartame is among the many substances that must be avoided by people with the genetic
condition phenylketonuria (PKU) (Magnuson et al. 2007).
Aspartame is an artificial sweetener. It is 200 times sweeter than sugar in typical
concentrations, without the high energy value of sugar. (Prodolliet & Bruelhart 1993)
While aspartame, like other peptides, has a caloric value of 4 kilocalories (17 kilojoules)
per gram, the quantity of aspartame needed to produce a sweet taste is so small that its
caloric contribution is negligible. The taste of aspartame is not identical to that of sugar:
the sweetness of aspartame has a slower onset and longer duration than that of sugar.
Blends of aspartame with acesulfame potassium—usually listed in ingredients as
acesulfame K— are said to taste more like sugar, and to be sweeter than either substitute
used alone (Stegink 1987).
Aspartame is also used as sweeteners in the beverage industry mainly in diet SD..
Aspartame is absorbed from the intestine and metabolized by the liver to form
phenylalanine, aspartic acid and methanol. Aspartame can contribute to weight gain,
obesity, insulin resistance, and type 2 diabetes mellitus (Ferland et al. 2007). Recently,
Brown et al (Brown et al. 2009) showed that artificial sweeteners may trigger the
secretion of glucagon like peptide (GLP)-1 by the digestive tract, and thereby curb
appetite and calorie intake. (Nseir et al. 2010)
Aspartame
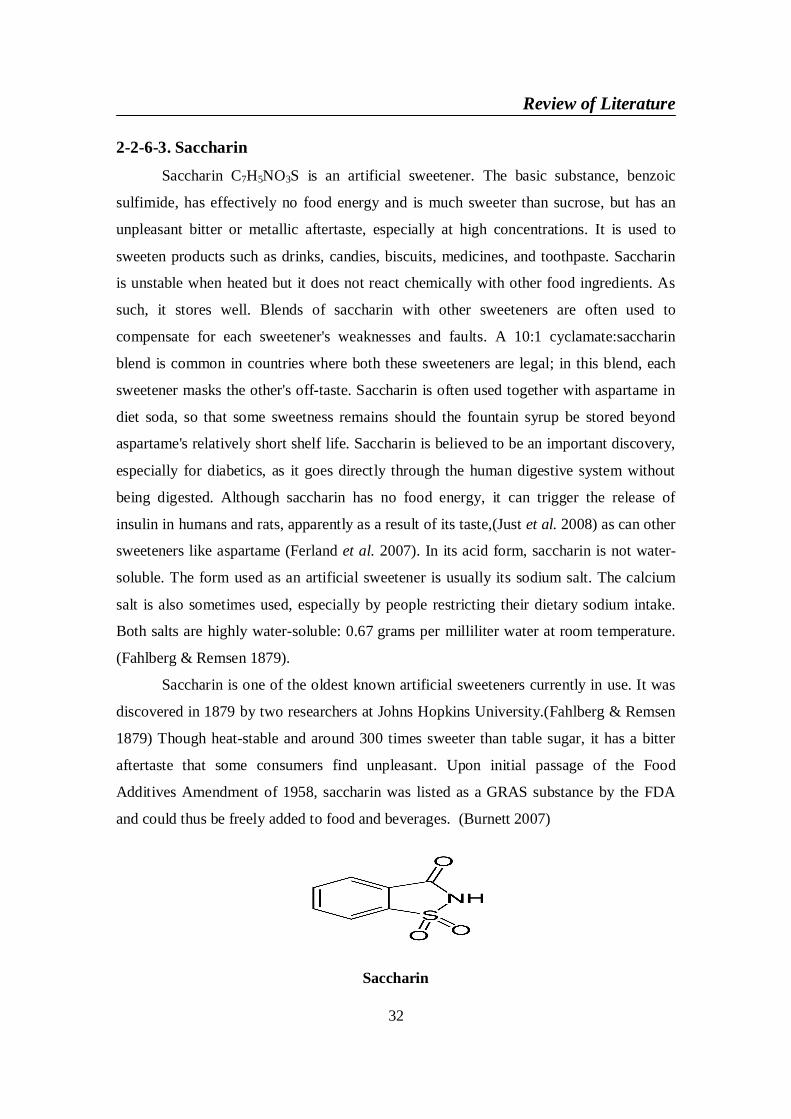
Review of Literature
32
2-2-6-3. Saccharin
Saccharin C7H5NO3S is an artificial sweetener. The basic substance, benzoic
sulfimide, has effectively no food energy and is much sweeter than sucrose, but has an
unpleasant bitter or metallic aftertaste, especially at high concentrations. It is used to
sweeten products such as drinks, candies, biscuits, medicines, and toothpaste. Saccharin
is unstable when heated but it does not react chemically with other food ingredients. As
such, it stores well. Blends of saccharin with other sweeteners are often used to
compensate for each sweetener's weaknesses and faults. A 10:1 cyclamate:saccharin
blend is common in countries where both these sweeteners are legal; in this blend, each
sweetener masks the other's off-taste. Saccharin is often used together with aspartame in
diet soda, so that some sweetness remains should the fountain syrup be stored beyond
aspartame's relatively short shelf life. Saccharin is believed to be an important discovery,
especially for diabetics, as it goes directly through the human digestive system without
being digested. Although saccharin has no food energy, it can trigger the release of
insulin in humans and rats, apparently as a result of its taste,(Just et al. 2008) as can other
sweeteners like aspartame (Ferland et al. 2007). In its acid form, saccharin is not water-
soluble. The form used as an artificial sweetener is usually its sodium salt. The calcium
salt is also sometimes used, especially by people restricting their dietary sodium intake.
Both salts are highly water-soluble: 0.67 grams per milliliter water at room temperature.
(Fahlberg & Remsen 1879).
Saccharin is one of the oldest known artificial sweeteners currently in use. It was
discovered in 1879 by two researchers at Johns Hopkins University.(Fahlberg & Remsen
1879) Though heat-stable and around 300 times sweeter than table sugar, it has a bitter
aftertaste that some consumers find unpleasant. Upon initial passage of the Food
Additives Amendment of 1958, saccharin was listed as a GRAS substance by the FDA
and could thus be freely added to food and beverages. (Burnett 2007)
Saccharin
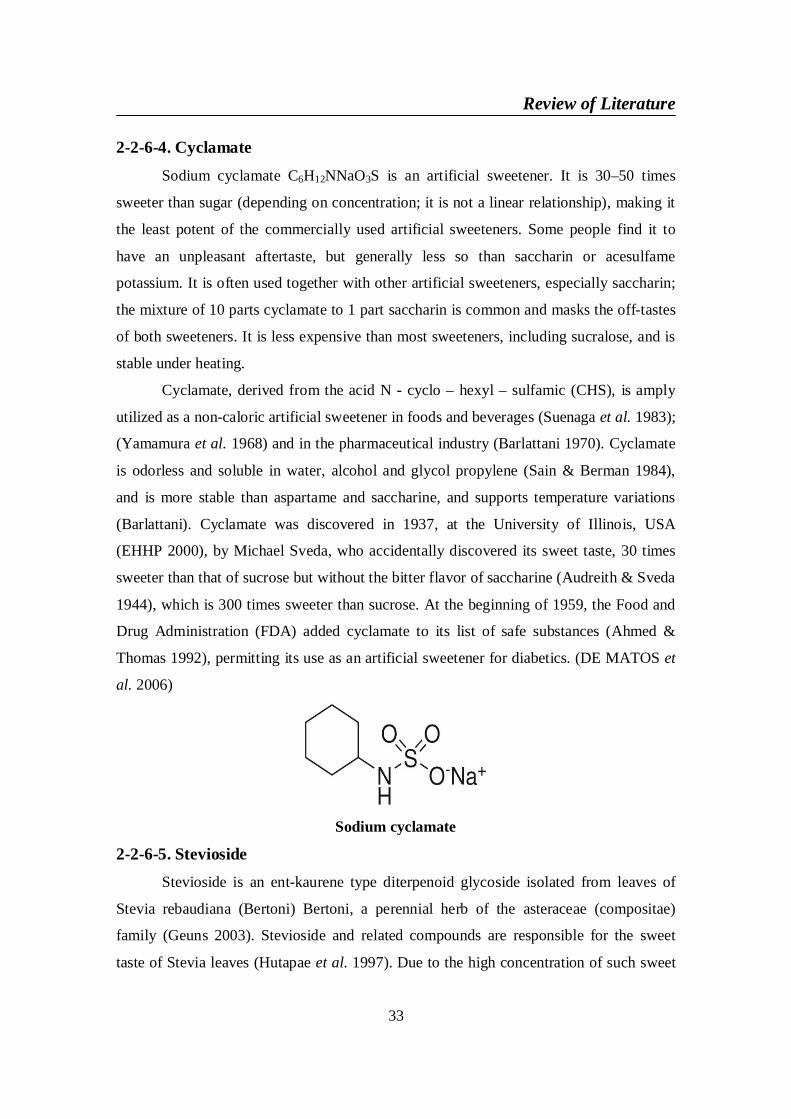
Review of Literature
33
2-2-6-4. Cyclamate
Sodium cyclamate C6H12NNaO3S is an artificial sweetener. It is 30–50 times
sweeter than sugar (depending on concentration; it is not a linear relationship), making it
the least potent of the commercially used artificial sweeteners. Some people find it to
have an unpleasant aftertaste, but generally less so than saccharin or acesulfame
potassium. It is often used together with other artificial sweeteners, especially saccharin;
the mixture of 10 parts cyclamate to 1 part saccharin is common and masks the off-tastes
of both sweeteners. It is less expensive than most sweeteners, including sucralose, and is
stable under heating.
Cyclamate, derived from the acid N - cyclo – hexyl – sulfamic (CHS), is amply
utilized as a non-caloric artificial sweetener in foods and beverages (Suenaga et al. 1983);
(Yamamura et al. 1968) and in the pharmaceutical industry (Barlattani 1970). Cyclamate
is odorless and soluble in water, alcohol and glycol propylene (Sain & Berman 1984),
and is more stable than aspartame and saccharine, and supports temperature variations
(Barlattani). Cyclamate was discovered in 1937, at the University of Illinois, USA
(EHHP 2000), by Michael Sveda, who accidentally discovered its sweet taste, 30 times
sweeter than that of sucrose but without the bitter flavor of saccharine (Audreith & Sveda
1944), which is 300 times sweeter than sucrose. At the beginning of 1959, the Food and
Drug Administration (FDA) added cyclamate to its list of safe substances (Ahmed &
Thomas 1992), permitting its use as an artificial sweetener for diabetics. (DE MATOS et
al. 2006)
Sodium cyclamate
2-2-6-5. SteviosideStevioside is an ent-kaurene type diterpenoid glycoside isolated from leaves of
Stevia rebaudiana (Bertoni) Bertoni, a perennial herb of the asteraceae (compositae)
family (Geuns 2003). Stevioside and related compounds are responsible for the sweet
taste of Stevia leaves (Hutapae et al. 1997). Due to the high concentration of such sweet
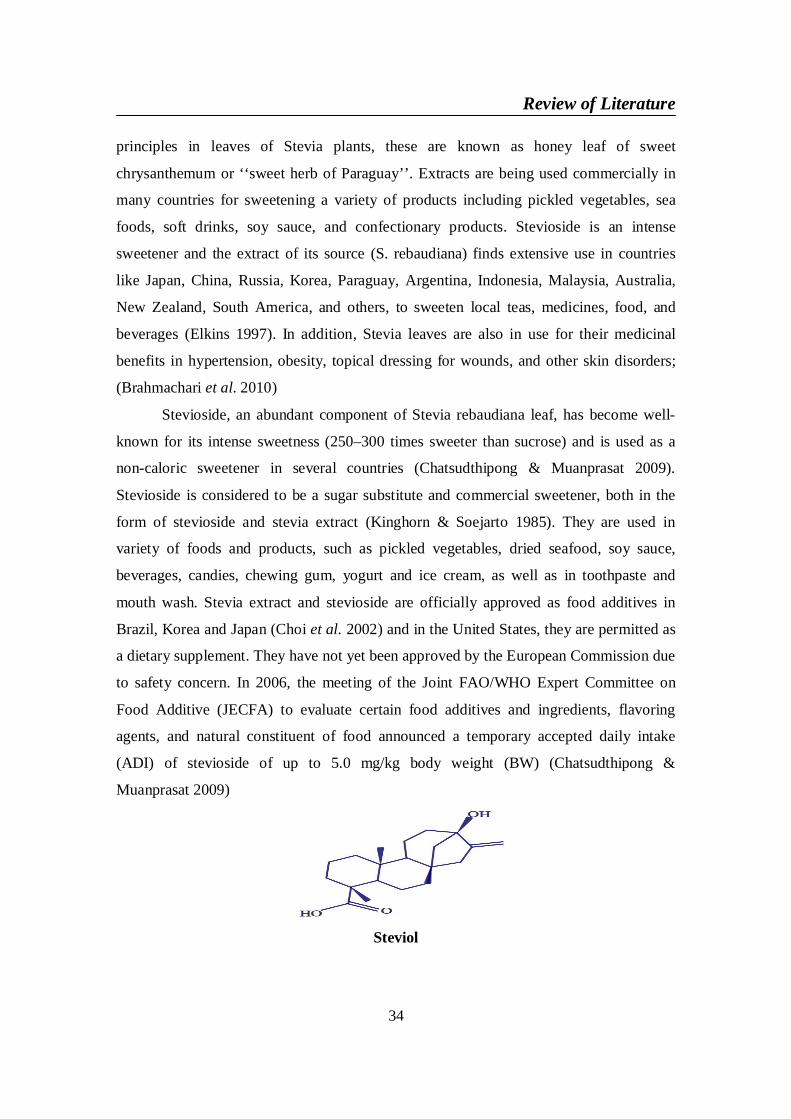
Review of Literature
34
principles in leaves of Stevia plants, these are known as honey leaf of sweet
chrysanthemum or ‘‘sweet herb of Paraguay’’. Extracts are being used commercially in
many countries for sweetening a variety of products including pickled vegetables, sea
foods, soft drinks, soy sauce, and confectionary products. Stevioside is an intense
sweetener and the extract of its source (S. rebaudiana) finds extensive use in countries
like Japan, China, Russia, Korea, Paraguay, Argentina, Indonesia, Malaysia, Australia,
New Zealand, South America, and others, to sweeten local teas, medicines, food, and
beverages (Elkins 1997). In addition, Stevia leaves are also in use for their medicinal
benefits in hypertension, obesity, topical dressing for wounds, and other skin disorders;
(Brahmachari et al. 2010)
Stevioside, an abundant component of Stevia rebaudiana leaf, has become well-
known for its intense sweetness (250–300 times sweeter than sucrose) and is used as a
non-caloric sweetener in several countries (Chatsudthipong & Muanprasat 2009).
Stevioside is considered to be a sugar substitute and commercial sweetener, both in the
form of stevioside and stevia extract (Kinghorn & Soejarto 1985). They are used in
variety of foods and products, such as pickled vegetables, dried seafood, soy sauce,
beverages, candies, chewing gum, yogurt and ice cream, as well as in toothpaste and
mouth wash. Stevia extract and stevioside are officially approved as food additives in
Brazil, Korea and Japan (Choi et al. 2002) and in the United States, they are permitted as
a dietary supplement. They have not yet been approved by the European Commission due
to safety concern. In 2006, the meeting of the Joint FAO/WHO Expert Committee on
Food Additive (JECFA) to evaluate certain food additives and ingredients, flavoring
agents, and natural constituent of food announced a temporary accepted daily intake
(ADI) of stevioside of up to 5.0 mg/kg body weight (BW) (Chatsudthipong &
Muanprasat 2009)
Steviol
Review of Literature
35
2-2-7. Inhibition of ChREBP as a treatment for metabolic syndrome
The importance of ChREBP in the development of obesity and type 2 diabetes
was addressed by intercrossing ChREBP-deficient mice with ob/ob mice (ob/ob-
ChREBP mice). Fat accumulation was prevented in liver of these mice, and their
hyperlipidemic phenotype was significantly improved (Iizuka et al. 2006). Liver-specific
inhibition of ChREBP improves hepatic steatosis and insulin resistance in obese ob/ob
mice. Since ChREBP cellular localization is a determinant of its functional activity, a
better knowledge of the mechanisms involved in regulating its nucleo-cytoplasmic
shuttling and/or its post-translational activation is crucial in both physiology and
physiopathology. (Dentin et al. 2006a)
ChREBP knockdown, both under short-term (two days)and long-term (seven
days) conditions, significantly improves the fatty liver phenotype of ob/ob mice by
decreasing rates of lipogenesis, thereby decreasing hepatic fat accumulation. As expected,
the liver-specific inhibition of ChREBP not only markedly affected the expression of
ACC and FAS, but also that of SCD-1, the rate-limiting enzyme catalyzing the
conversion of saturated long-chain fatty acids into monounsaturated fatty acids, which are
the major components of TG (Flowers et al. 2006). Interestingly, ChREBP knockdown
not only affected the rate of de novo lipogenesis but also had consequences on
oxidation. Lipogenesis and oxidation are directly correlated because malonyl-CoA, the
allosteric inhibitor of CPT-1 (the rate-limiting enzyme of oxidation) is synthesized by
the lipogenic enzyme ACC. The fact that both ACC1 and ACC2 protein content was
significantly lower in liver of fasted ChREBP deficient mice probably led to a
constitutive activation of L-CPT1 activity in liver. The significant decrease in malonyl-
CoA concentrations and the increase in plasma hydroxybutyrate levels measured in
fasted mice support this hypothesis. Therefore, the coordinate modulation in fatty acid
synthesis and oxidation in liver led to overall improvement of lipid homeostasis in
ChREBP-deficient mice. This study is in agreement with the fact that ACC2 gene
knockout is also associated with increased rates of oxidation in liver, leading to the
improvement of overall lipid homeostasis in these mice (Abu-Elheiga et al. 2003). The
beneficial effect of ChREBP knockdown was apparent on overall glucose tolerance and
insulin sensitivity, with a significant improvement in hyperlipidemia, hyperglycemia, and
hyperinsulinemia (Postic et al. 2007).
Review of Literature
36
2-2-7-1. cAMP
AMP-activated protein kinase (AMPK) is a multisubunit protein kinase, which
appears to play a central role in lipid metabolism (Hardie 1992). AMPK was first shown
to catalyze phosphorylation and inactivation of 3-hydroxy-3-methylglutaryl-CoA (HMG-
CoA) reductase and acetyl-CoA carboxylase, the rate limiting enzymes of cholesterol and
fatty acid synthesis, respectively (Hardie & Carling 1997). AMPK is activated by a high
AMP/ATP ratio in the cytosol, which occurs under stressed conditions such as heat
shock, hypoxia, arsenite treatment, and starvation (Moore et al. 1991). The increase in
AMP and the concomitant decrease in ATP, activating AMPK, suggests that this protein
kinase inhibits activation of biosynthetic enzymes such as acetyl-CoA carboxylase to
conserve ATP (Hardie et al. 1998); (Kawaguchi et al. 2002)
AMPK is a highly conserved serine/threonine kinase that functions as an energy
sensor and transducer of cellular metabolism (Hardie 2007). AMPK represents a
metabolic checkpoint for the convergence of intracellular signal transduction cascades
involved in regulating energy balance by integrating information conveyed by specific
nutrient (e.g., glucose and fatty acids) and hormone (e.g., insulin, ghrelin, adiponectin,
leptin and glucagon) signals, the levels of which reflect changes in energy status (Kahn et
al. 2005a). Activation of AMPK requires the phosphorylation of a threonine residue
(T172) contained within the alpha catalytic subunit by an upstream kinase such as LKB1
(Stein et al. 2000). AMPK has been implicated in the control of hepatic glucose and lipid
metabolism, thereby affecting whole body fuel utilization (Viollet et al. 2009). In short-
term regulation, AMPK phosphorylates and inactivates ACC , thus inhibiting the
production of malonyl-CoA and fatty acid biosynthesis (Viollet et al. 2006). In addition,
AMPK also phosphorylates and activates malonyl-CoA decarboxylase (MCD) which
works to decrease cellular malonyl-CoA. The net effect of these actions is to reduce the
level of a potent allosteric inhibitor of carnitine palmitoyl- CoA transferase-1 (CPT-1), a
mitochondrial membrane transporter and rate-limiting enzyme controlling fatty acid
oxidation (Saggerson 2008). Thus, by modulating malonyl-CoA levels, AMPK acts as a
metabolic regulator shifting the balance of hepatic fuel utilization from glucose to fatty
acids while inhibiting de novo fatty acid synthesis from glucose. Long-term regulation of
glycolytic and lipogenic gene expression in liver results, in part, from decreased DNA
binding of SREBP-1c and ChREBP. In addition, it has been also reported that AMPK
Review of Literature
37
directly phosphorylates ChREBP and modulate its DNA binding activity (Kawaguchi et
al. 2002); (Viollet et al. 2009); (Proszkowiec-Weglarz et al. 2009).
During starvation for HePG2 cells, concentrations of plasma glucagon and
epinephrine are increased. Glucagon and epinephrine increase the intracellular cAMP
concentration and activate cAMP-activated protein kinase A (PKA). PKA phosphorylates
ChREBP, in activating it (Kawaguchi et al. 2001). Phosphorylation of ChREBP at Serine
residue 196 (Ser 196) inactivates nuclear import, and phosphorylation at Threonine
residue 666 (Thr 666) prevents DNA binding by ChREBP. Similarly, intracellular AMP
accumulation inhibits ChREBP trans activity by activating AMP-activated protein kinase
(AMPK) and phosphorylating ChREBP . (Kawaguchi et al. 2002)
2-2-7-2. Polyunsaturated fatty acidsDietary fat is an important macronutrient for growth and development of all
animals. Excessive levels of dietary fat or an imbalance of saturated fat versus
unsaturated fat or n-6 versus n-3 polyunsaturated fat (PUFA) have been implicated in the
onset and progression of several chronic diseases, including coronary artery disease and
atherosclerosis (Harris 2003), diabetes and obesity (Kelley et al. 2002), cancer (Cho et al.
2003), Parkinson’s disease, major depressive disorders and schizophrenia (Julien et al.
2006). As such, considerable clinical and basic science research has been directed at
understanding the biochemical and molecular basis of fatty acid effects on complex
physiological systems impacting human health. The understanding of the role dietary fat
plays in these chronic diseases is complicated by the fact that fat has many physiological
roles. Dietary fat is a substrate for energy metabolism, membrane formation and signaling
molecules; dietary fat also regulates gene expression (Jump et al. 2008).
Since the original description of dietary fat as a regulator of gene expression over
a decade ago, many transcription factors have been identified as prospective targets for
fatty acid regulation, including several nuclear receptors like the peroxisome proliferator
activated receptor family (PPAR) ( , , 1 and 2), retinoid X receptor (RXR ), liver
X receptor (LXR ) and hepatic nuclear factor and (HNF4 and ) as well as
several basic helix-loop-helix leucine-zipper transcription factors (bHLH-LZ) like sterol
regulatory element binding protein-1 (SREBP-1), carbohydrate regulatory element
binding protein (ChREBP) and max-like factor X (MLX) (Botolin et al. 2006); (Dentin et
al. 2005a); (Xu et al. 2003); (Jump et al. 2008)
Review of Literature
38
Glucose metabolism in liver is inhibited by administration of fatty acids, the so-
called “glucose sparing” effect (Williamson & Krebs 1961). Fatty acids inhibit genes of
key enzymes of glycolysis and lipogenesis such as L-pyruvate kinase (L-PK), 1 acetyl-
CoA carboxylase, and fatty acid synthetase. L-PK, regulating the flux of metabolites
through the pyruvate-phosphoenolpyruvate cycle (Liimatta et al. 1994), is known to play
an important role in hepatic glucose and lipid metabolism. The activity of L-PK is subject
to acute control by covalent modification and allosteric effectors. On the other hand, long
term control of L-PK is achieved by regulating L-PK gene transcription (Foufelle et al.
1996). Fatty acids inhibit transcription of L-PK and other enzymes in glycolysis and
lipogenesis pathways, whereas excess glucose induces expression of these genes (Duplus
et al. 2000); (Kawaguchi et al. 2002)
A diet that provides 2–5% of energy from (n-3) and (n-6) PUFA leads to a
coordinate suppression of glycolytic and lipogenic genes and to an induction of genes
involved in fatty acid oxidation (Clarke 2004). This metabolic balance in liver leads to a
‘‘partitioning’’ of fatty acids away from triglyceride synthesis toward fatty acid
oxidation. The positive effects of PUFA may in fact delay the onset of insulin resistance
and lipotoxicity and in turn improve the metabolic phenotype of type 2 diabetes. (Dentin
et al. 2006b)
Two general mechanisms characterize fatty acid control of these transcription
factors. Fatty acids bind directly to the transcription factor and control transcription factor
activity. In this fashion, fatty acids act like hydrophobic hormones regulating the function
of nuclear receptors and their impact on transcriptional processes. Non-esterified fatty
acids bind PPAR ( , , 1 and 2) (Xu et al. 1999a); (Xu et al. 1999b), HNF-4 ( and )
(Dhe-Paganon et al. 2002), RXR (Mata de Urquiza et al. 2000) and LXR (Ou et al.
2001). All of these proteins are members of the nuclear receptor super family of ligand-
regulated transcription factors. Amongst these nuclear receptors, however, PPAR
subtypes are the most widely accepted fatty acid-regulated transcription factors. In the
second mechanism, fatty acids control the nuclear abundance of key transcription factors,
such as SREBP-1, NF B, ChREBP and MLX (Xu et al. 2003); (Jump et al. 2008). The
mechanisms controlling the nuclear abundance of these transcription factors is less clear,
but likely does not involve direct binding of the fatty acid to the transcription factor.
While 22:6,n-3 acts like many PUFA to control gene expression by regulating
Review of Literature
39
transcription factor function, 22:6,n- 3 also has unique regulatory effects on gene
transcription. As such, these effects are not shared by other fatty acids. (DiRusso et al.
2005)
Fatty acid effects on hepatic gene expression require their entry into cells. Non-
esterified fatty acids (NEFA) enter cells through fatty acid transport protein (FATP) or
fatty acid transporter (FAT, CD36) or diffusion (Figure 12). NEFA are rapidly converted
to FA-CoA by FATP (Coleman et al. 2002) or fatty acyl-CoA synthetases (Hertzel &
Bernlohr 2000). When fatty acids enter hepatocytes as complex lipids, like chylomicron
remnants, the complex lipids are hydrolyzed by lipases to form NEFA. In either case,
intracellular NEFA is maintained at a very low level by quickly converting the NEFA to
fatty acyl CoA. Fatty acyl-CoAs are also kept at low intracellular levels. Both NEFA and
FA-CoA are bound to fatty acid binding protein (FABP) and fatty acyl CoA binding
protein (ACBP), proteins that transport fatty acids to intracellular compartments for
metabolism (Wolfrum et al. 2001) or to the nucleus to interact with transcription factors
(Patton et al. 1994). The bulk of FA-CoA is rapidly assimilated into complex lipids.
Hepatocytes challenged with exogenous fatty acids rapidly assimilate the fatty acids into
neutral and polar lipids, while a minor fraction will be -oxidized. These metabolic
pathways keep intracellular NEFA and FA-CoA very low. Intracellular NEFA, however,
are not solely dependent on exogenous fatty acids; intracellular NEFA can also arise from
the hydrolysis of complex lipids by lipases acting on phospholipids or triglycerides (Hunt
& Alexson 2002) or by the hydrolysis of FA-CoA by thioesterases (Jump et al. 2008). As
such, these pathways may contribute to the pool of NEFA in cells. The intracellular
NEFA fraction of cells plays an important role in lipid-mediated regulation of
transcription factor function.
Polyunsaturated fatty acids (PUFA) play a key role in membrane composition and
function, metabolism and the control of gene expression. Certain PUFA, like the n-3
PUFA, enhance hepatic fatty acid oxidation and inhibit fatty acid synthesis and VLDL
secretion, in part, by regulating gene expression. (Dentin et al. 2005a)
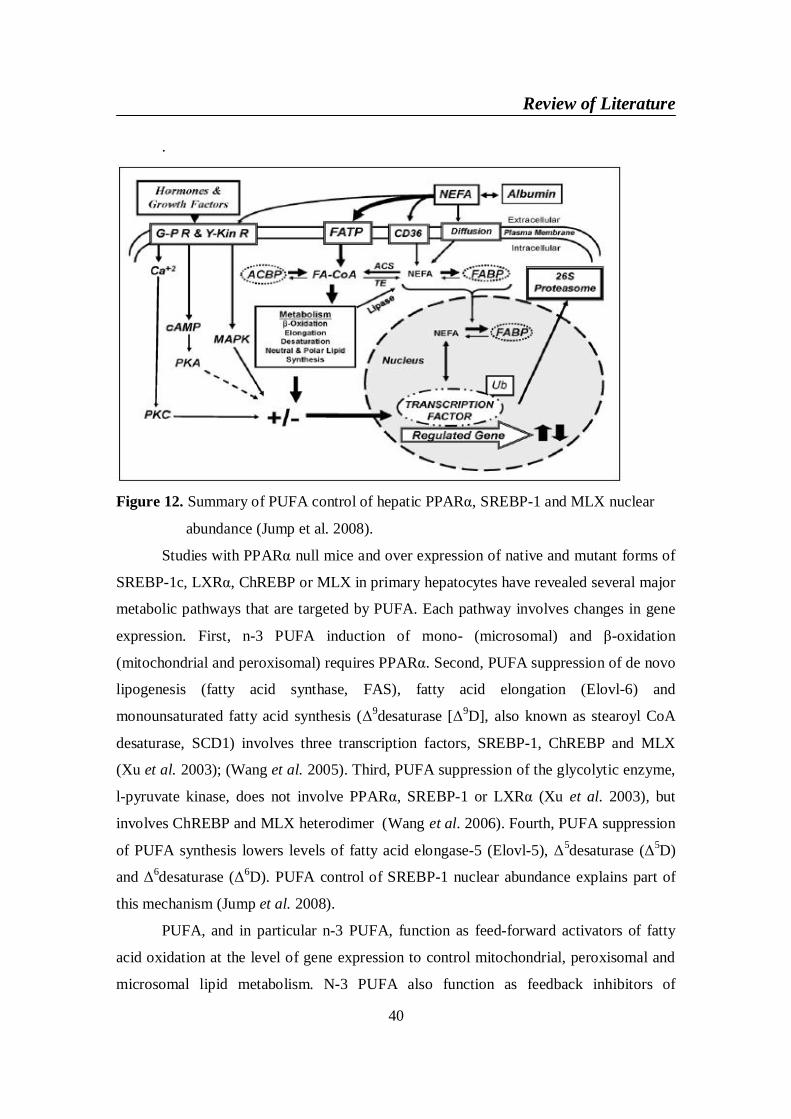
Review of Literature
40
.
Figure 12. Summary of PUFA control of hepatic PPAR , SREBP-1 and MLX nuclear
abundance (Jump et al. 2008).
Studies with PPAR null mice and over expression of native and mutant forms of
SREBP-1c, LXR , ChREBP or MLX in primary hepatocytes have revealed several major
metabolic pathways that are targeted by PUFA. Each pathway involves changes in gene
expression. First, n-3 PUFA induction of mono- (microsomal) and -oxidation
(mitochondrial and peroxisomal) requires PPAR . Second, PUFA suppression of de novo
lipogenesis (fatty acid synthase, FAS), fatty acid elongation (Elovl-6) and
monounsaturated fatty acid synthesis ( 9desaturase [ 9D], also known as stearoyl CoA
desaturase, SCD1) involves three transcription factors, SREBP-1, ChREBP and MLX
(Xu et al. 2003); (Wang et al. 2005). Third, PUFA suppression of the glycolytic enzyme,
l-pyruvate kinase, does not involve PPAR , SREBP-1 or LXR (Xu et al. 2003), but
involves ChREBP and MLX heterodimer (Wang et al. 2006). Fourth, PUFA suppression
of PUFA synthesis lowers levels of fatty acid elongase-5 (Elovl-5), 5desaturase ( 5D)
and 6desaturase ( 6D). PUFA control of SREBP-1 nuclear abundance explains part of
this mechanism (Jump et al. 2008).
PUFA, and in particular n-3 PUFA, function as feed-forward activators of fatty
acid oxidation at the level of gene expression to control mitochondrial, peroxisomal and
microsomal lipid metabolism. N-3 PUFA also function as feedback inhibitors of
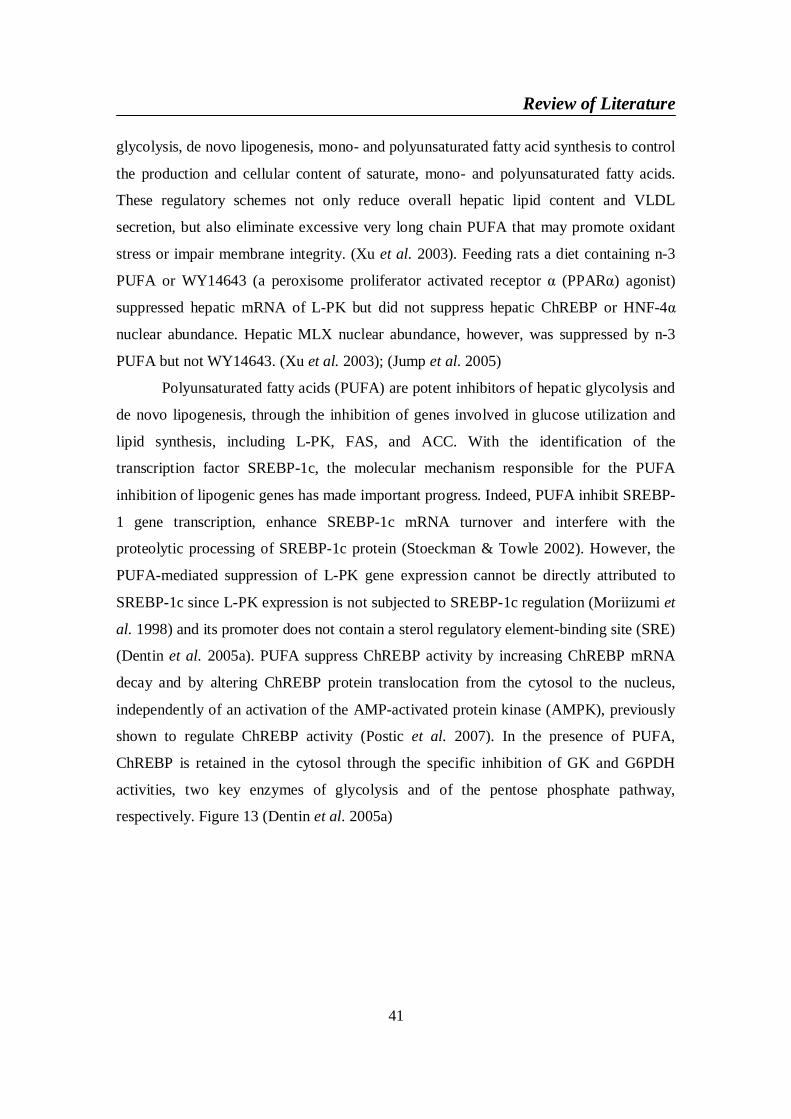
Review of Literature
41
glycolysis, de novo lipogenesis, mono- and polyunsaturated fatty acid synthesis to control
the production and cellular content of saturate, mono- and polyunsaturated fatty acids.
These regulatory schemes not only reduce overall hepatic lipid content and VLDL
secretion, but also eliminate excessive very long chain PUFA that may promote oxidant
stress or impair membrane integrity. (Xu et al. 2003). Feeding rats a diet containing n-3
PUFA or WY14643 (a peroxisome proliferator activated receptor (PPAR ) agonist)
suppressed hepatic mRNA of L-PK but did not suppress hepatic ChREBP or HNF-4
nuclear abundance. Hepatic MLX nuclear abundance, however, was suppressed by n-3
PUFA but not WY14643. (Xu et al. 2003); (Jump et al. 2005)
Polyunsaturated fatty acids (PUFA) are potent inhibitors of hepatic glycolysis and
de novo lipogenesis, through the inhibition of genes involved in glucose utilization and
lipid synthesis, including L-PK, FAS, and ACC. With the identification of the
transcription factor SREBP-1c, the molecular mechanism responsible for the PUFA
inhibition of lipogenic genes has made important progress. Indeed, PUFA inhibit SREBP-
1 gene transcription, enhance SREBP-1c mRNA turnover and interfere with the
proteolytic processing of SREBP-1c protein (Stoeckman & Towle 2002). However, the
PUFA-mediated suppression of L-PK gene expression cannot be directly attributed to
SREBP-1c since L-PK expression is not subjected to SREBP-1c regulation (Moriizumi et
al. 1998) and its promoter does not contain a sterol regulatory element-binding site (SRE)
(Dentin et al. 2005a). PUFA suppress ChREBP activity by increasing ChREBP mRNA
decay and by altering ChREBP protein translocation from the cytosol to the nucleus,
independently of an activation of the AMP-activated protein kinase (AMPK), previously
shown to regulate ChREBP activity (Postic et al. 2007). In the presence of PUFA,
ChREBP is retained in the cytosol through the specific inhibition of GK and G6PDH
activities, two key enzymes of glycolysis and of the pentose phosphate pathway,
respectively. Figure 13 (Dentin et al. 2005a)
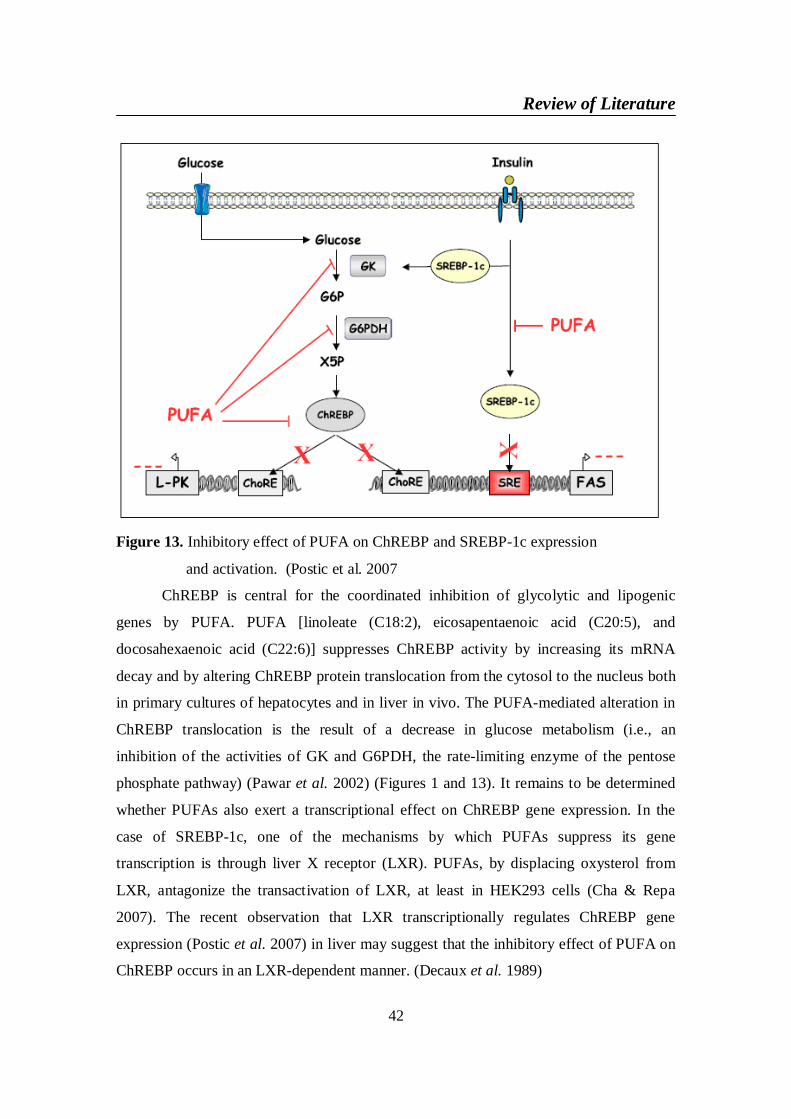
Review of Literature
42
Figure 13. Inhibitory effect of PUFA on ChREBP and SREBP-1c expression
and activation. (Postic et al. 2007
ChREBP is central for the coordinated inhibition of glycolytic and lipogenic
genes by PUFA. PUFA [linoleate (C18:2), eicosapentaenoic acid (C20:5), and
docosahexaenoic acid (C22:6)] suppresses ChREBP activity by increasing its mRNA
decay and by altering ChREBP protein translocation from the cytosol to the nucleus both
in primary cultures of hepatocytes and in liver in vivo. The PUFA-mediated alteration in
ChREBP translocation is the result of a decrease in glucose metabolism (i.e., an
inhibition of the activities of GK and G6PDH, the rate-limiting enzyme of the pentose
phosphate pathway) (Pawar et al. 2002) (Figures 1 and 13). It remains to be determined
whether PUFAs also exert a transcriptional effect on ChREBP gene expression. In the
case of SREBP-1c, one of the mechanisms by which PUFAs suppress its gene
transcription is through liver X receptor (LXR). PUFAs, by displacing oxysterol from
LXR, antagonize the transactivation of LXR, at least in HEK293 cells (Cha & Repa
2007). The recent observation that LXR transcriptionally regulates ChREBP gene
expression (Postic et al. 2007) in liver may suggest that the inhibitory effect of PUFA on
ChREBP occurs in an LXR-dependent manner. (Decaux et al. 1989)
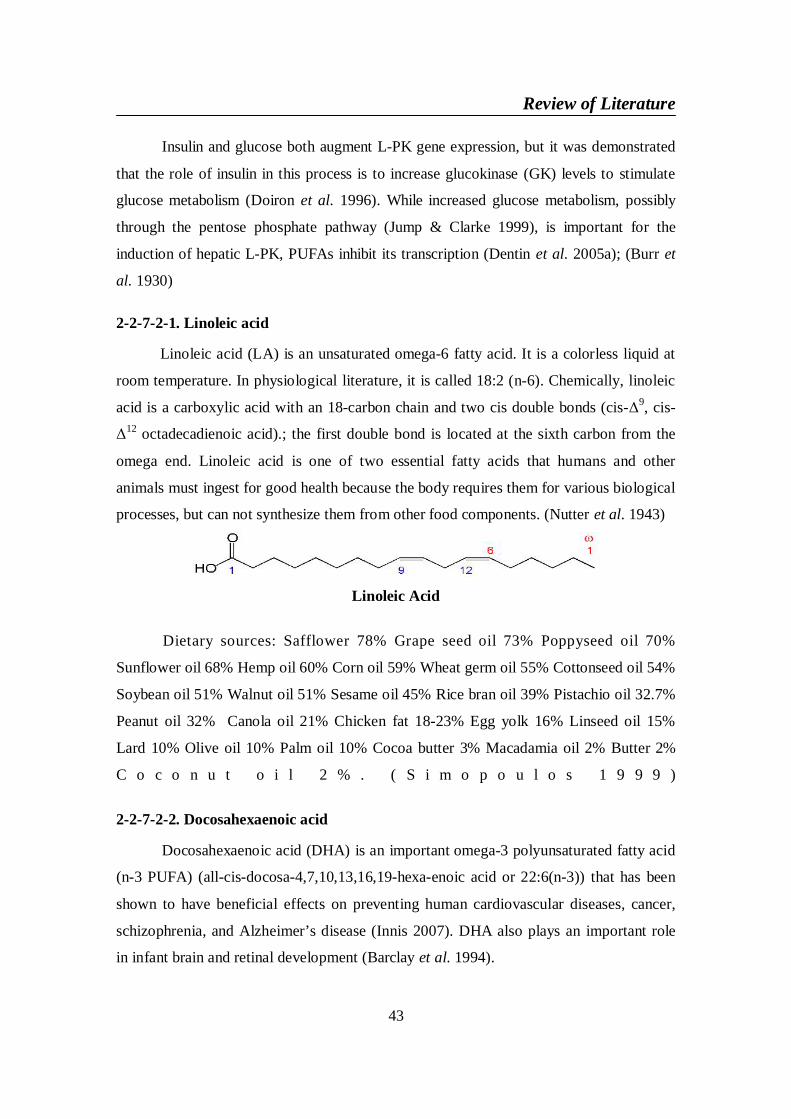
Review of Literature
43
Insulin and glucose both augment L-PK gene expression, but it was demonstrated
that the role of insulin in this process is to increase glucokinase (GK) levels to stimulate
glucose metabolism (Doiron et al. 1996). While increased glucose metabolism, possibly
through the pentose phosphate pathway (Jump & Clarke 1999), is important for the
induction of hepatic L-PK, PUFAs inhibit its transcription (Dentin et al. 2005a); (Burr et
al. 1930)
2-2-7-2-1. Linoleic acid
Linoleic acid (LA) is an unsaturated omega-6 fatty acid. It is a colorless liquid at
room temperature. In physiological literature, it is called 18:2 (n-6). Chemically, linoleic
acid is a carboxylic acid with an 18-carbon chain and two cis double bonds (cis- 9, cis-12 octadecadienoic acid).; the first double bond is located at the sixth carbon from the
omega end. Linoleic acid is one of two essential fatty acids that humans and other
animals must ingest for good health because the body requires them for various biological
processes, but can not synthesize them from other food components. (Nutter et al. 1943)
Linoleic Acid
Dietary sources: Safflower 78% Grape seed oil 73% Poppyseed oil 70%
Sunflower oil 68% Hemp oil 60% Corn oil 59% Wheat germ oil 55% Cottonseed oil 54%
Soybean oil 51% Walnut oil 51% Sesame oil 45% Rice bran oil 39% Pistachio oil 32.7%
Peanut oil 32% Canola oil 21% Chicken fat 18-23% Egg yolk 16% Linseed oil 15%
Lard 10% Olive oil 10% Palm oil 10% Cocoa butter 3% Macadamia oil 2% Butter 2%
C o c o n u t o i l 2 % . ( S i m o p o u l o s 1 9 9 9 )
2-2-7-2-2. Docosahexaenoic acid
Docosahexaenoic acid (DHA) is an important omega-3 polyunsaturated fatty acid
(n-3 PUFA) (all-cis-docosa-4,7,10,13,16,19-hexa-enoic acid or 22:6(n-3)) that has been
shown to have beneficial effects on preventing human cardiovascular diseases, cancer,
schizophrenia, and Alzheimer’s disease (Innis 2007). DHA also plays an important role
in infant brain and retinal development (Barclay et al. 1994).
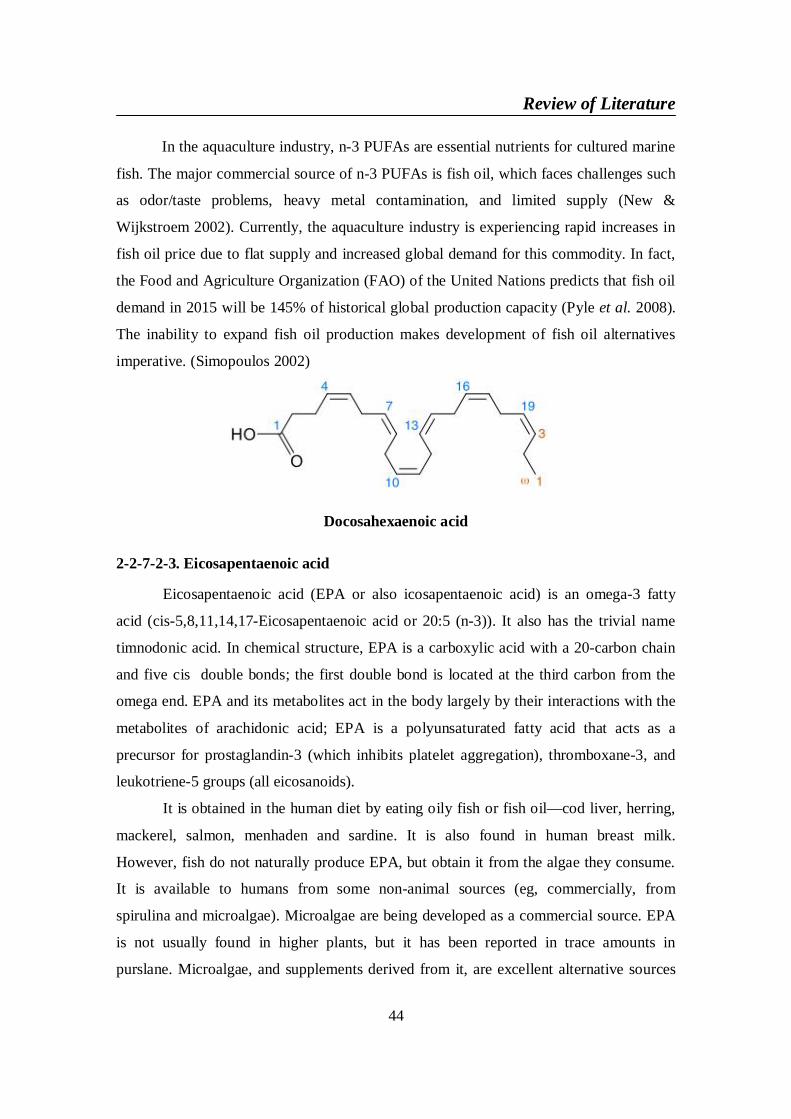
Review of Literature
44
In the aquaculture industry, n-3 PUFAs are essential nutrients for cultured marine
fish. The major commercial source of n-3 PUFAs is fish oil, which faces challenges such
as odor/taste problems, heavy metal contamination, and limited supply (New &
Wijkstroem 2002). Currently, the aquaculture industry is experiencing rapid increases in
fish oil price due to flat supply and increased global demand for this commodity. In fact,
the Food and Agriculture Organization (FAO) of the United Nations predicts that fish oil
demand in 2015 will be 145% of historical global production capacity (Pyle et al. 2008).
The inability to expand fish oil production makes development of fish oil alternatives
imperative. (Simopoulos 2002)
Docosahexaenoic acid
2-2-7-2-3. Eicosapentaenoic acid
Eicosapentaenoic acid (EPA or also icosapentaenoic acid) is an omega-3 fatty
acid (cis-5,8,11,14,17-Eicosapentaenoic acid or 20:5 (n-3)). It also has the trivial name
timnodonic acid. In chemical structure, EPA is a carboxylic acid with a 20-carbon chain
and five cis double bonds; the first double bond is located at the third carbon from the
omega end. EPA and its metabolites act in the body largely by their interactions with the
metabolites of arachidonic acid; EPA is a polyunsaturated fatty acid that acts as a
precursor for prostaglandin-3 (which inhibits platelet aggregation), thromboxane-3, and
leukotriene-5 groups (all eicosanoids).
It is obtained in the human diet by eating oily fish or fish oil—cod liver, herring,
mackerel, salmon, menhaden and sardine. It is also found in human breast milk.
However, fish do not naturally produce EPA, but obtain it from the algae they consume.
It is available to humans from some non-animal sources (eg, commercially, from
spirulina and microalgae). Microalgae are being developed as a commercial source. EPA
is not usually found in higher plants, but it has been reported in trace amounts in
purslane. Microalgae, and supplements derived from it, are excellent alternative sources
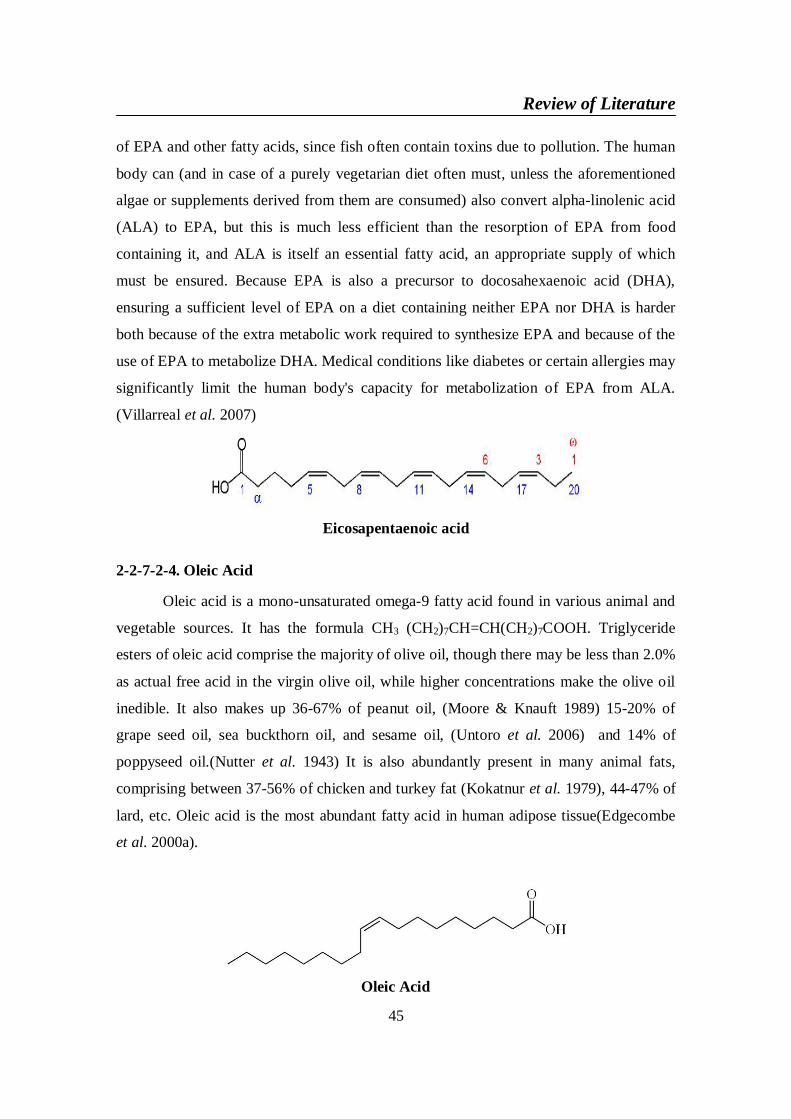
Review of Literature
45
of EPA and other fatty acids, since fish often contain toxins due to pollution. The human
body can (and in case of a purely vegetarian diet often must, unless the aforementioned
algae or supplements derived from them are consumed) also convert alpha-linolenic acid
(ALA) to EPA, but this is much less efficient than the resorption of EPA from food
containing it, and ALA is itself an essential fatty acid, an appropriate supply of which
must be ensured. Because EPA is also a precursor to docosahexaenoic acid (DHA),
ensuring a sufficient level of EPA on a diet containing neither EPA nor DHA is harder
both because of the extra metabolic work required to synthesize EPA and because of the
use of EPA to metabolize DHA. Medical conditions like diabetes or certain allergies may
significantly limit the human body's capacity for metabolization of EPA from ALA.
(Villarreal et al. 2007)
Eicosapentaenoic acid
2-2-7-2-4. Oleic Acid
Oleic acid is a mono-unsaturated omega-9 fatty acid found in various animal and
vegetable sources. It has the formula CH3 (CH2)7CH=CH(CH2)7COOH. Triglyceride
esters of oleic acid comprise the majority of olive oil, though there may be less than 2.0%
as actual free acid in the virgin olive oil, while higher concentrations make the olive oil
inedible. It also makes up 36-67% of peanut oil, (Moore & Knauft 1989) 15-20% of
grape seed oil, sea buckthorn oil, and sesame oil, (Untoro et al. 2006) and 14% of
poppyseed oil.(Nutter et al. 1943) It is also abundantly present in many animal fats,
comprising between 37-56% of chicken and turkey fat (Kokatnur et al. 1979), 44-47% of
lard, etc. Oleic acid is the most abundant fatty acid in human adipose tissue(Edgecombe
et al. 2000a).
Oleic Acid
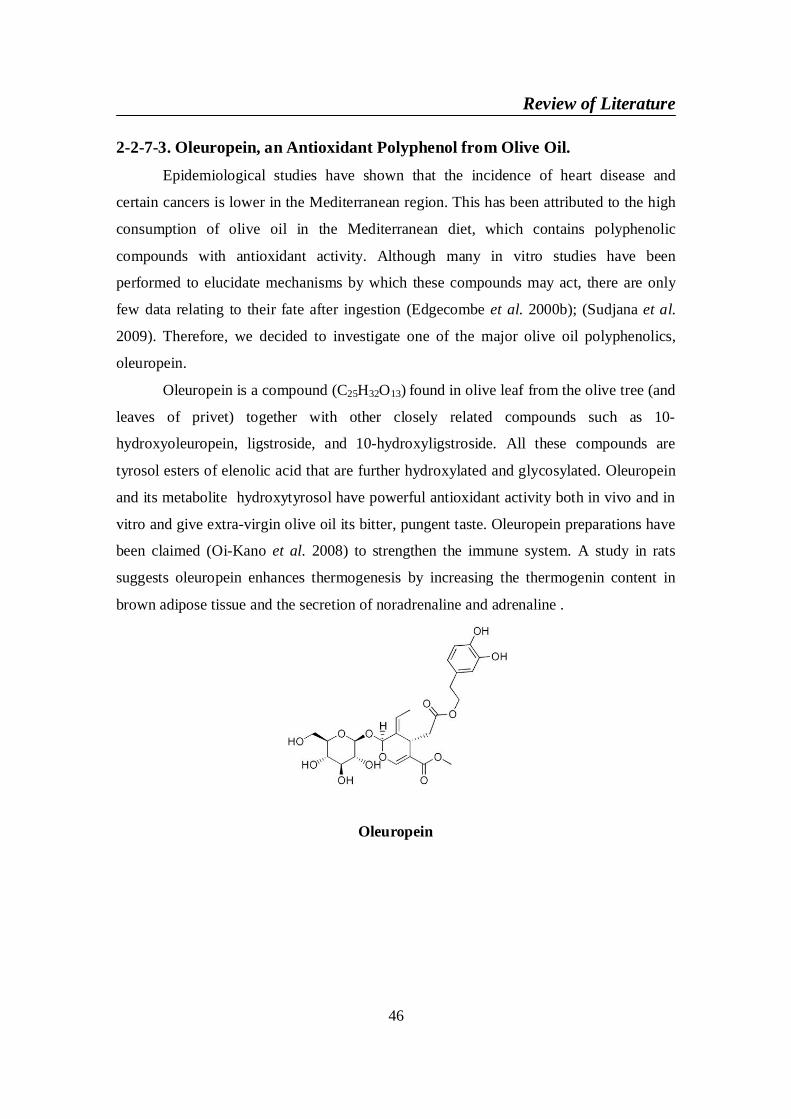
Review of Literature
46
2-2-7-3. Oleuropein, an Antioxidant Polyphenol from Olive Oil.Epidemiological studies have shown that the incidence of heart disease and
certain cancers is lower in the Mediterranean region. This has been attributed to the high
consumption of olive oil in the Mediterranean diet, which contains polyphenolic
compounds with antioxidant activity. Although many in vitro studies have been
performed to elucidate mechanisms by which these compounds may act, there are only
few data relating to their fate after ingestion (Edgecombe et al. 2000b); (Sudjana et al.
2009). Therefore, we decided to investigate one of the major olive oil polyphenolics,
oleuropein.
Oleuropein is a compound (C25H32O13) found in olive leaf from the olive tree (and
leaves of privet) together with other closely related compounds such as 10-
hydroxyoleuropein, ligstroside, and 10-hydroxyligstroside. All these compounds are
tyrosol esters of elenolic acid that are further hydroxylated and glycosylated. Oleuropein
and its metabolite hydroxytyrosol have powerful antioxidant activity both in vivo and in
vitro and give extra-virgin olive oil its bitter, pungent taste. Oleuropein preparations have
been claimed (Oi-Kano et al. 2008) to strengthen the immune system. A study in rats
suggests oleuropein enhances thermogenesis by increasing the thermogenin content in
brown adipose tissue and the secretion of noradrenaline and adrenaline .
Oleuropein
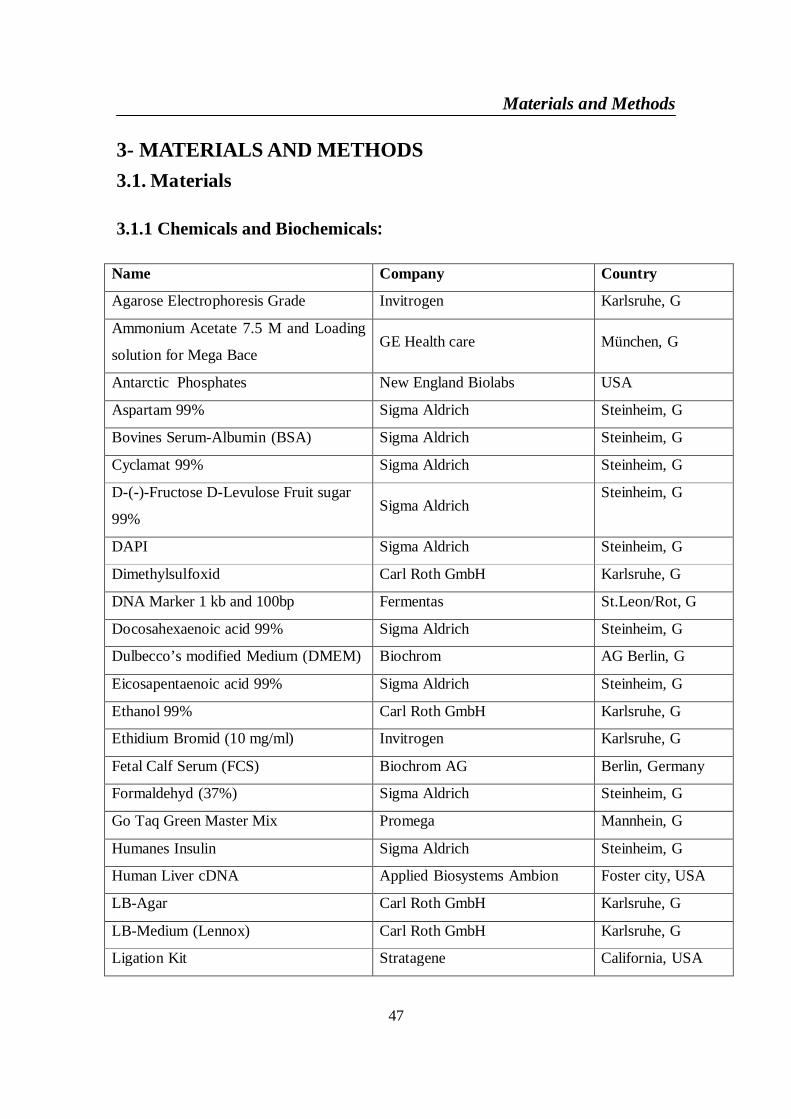
Materials and Methods
47
3- MATERIALS AND METHODS3.1. Materials
3.1.1 Chemicals and Biochemicals:
Name Company Country
Agarose Electrophoresis Grade Invitrogen Karlsruhe, G
Ammonium Acetate 7.5 M and Loading
solution for Mega BaceGE Health care München, G
Antarctic Phosphates New England Biolabs USA
Aspartam 99% Sigma Aldrich Steinheim, G
Bovines Serum-Albumin (BSA) Sigma Aldrich Steinheim, G
Cyclamat 99% Sigma Aldrich Steinheim, G
D-(-)-Fructose D-Levulose Fruit sugar
99%Sigma Aldrich
Steinheim, G
DAPI Sigma Aldrich Steinheim, G
Dimethylsulfoxid Carl Roth GmbH Karlsruhe, G
DNA Marker 1 kb and 100bp Fermentas St.Leon/Rot, G
Docosahexaenoic acid 99% Sigma Aldrich Steinheim, G
Dulbecco’s modified Medium (DMEM) Biochrom AG Berlin, G
Eicosapentaenoic acid 99% Sigma Aldrich Steinheim, G
Ethanol 99% Carl Roth GmbH Karlsruhe, G
Ethidium Bromid (10 mg/ml) Invitrogen Karlsruhe, G
Fetal Calf Serum (FCS) Biochrom AG Berlin, Germany
Formaldehyd (37%) Sigma Aldrich Steinheim, G
Go Taq Green Master Mix Promega Mannhein, G
Humanes Insulin Sigma Aldrich Steinheim, G
Human Liver cDNA Applied Biosystems Ambion Foster city, USA
LB-Agar Carl Roth GmbH Karlsruhe, G
LB-Medium (Lennox) Carl Roth GmbH Karlsruhe, G
Ligation Kit Stratagene California, USA
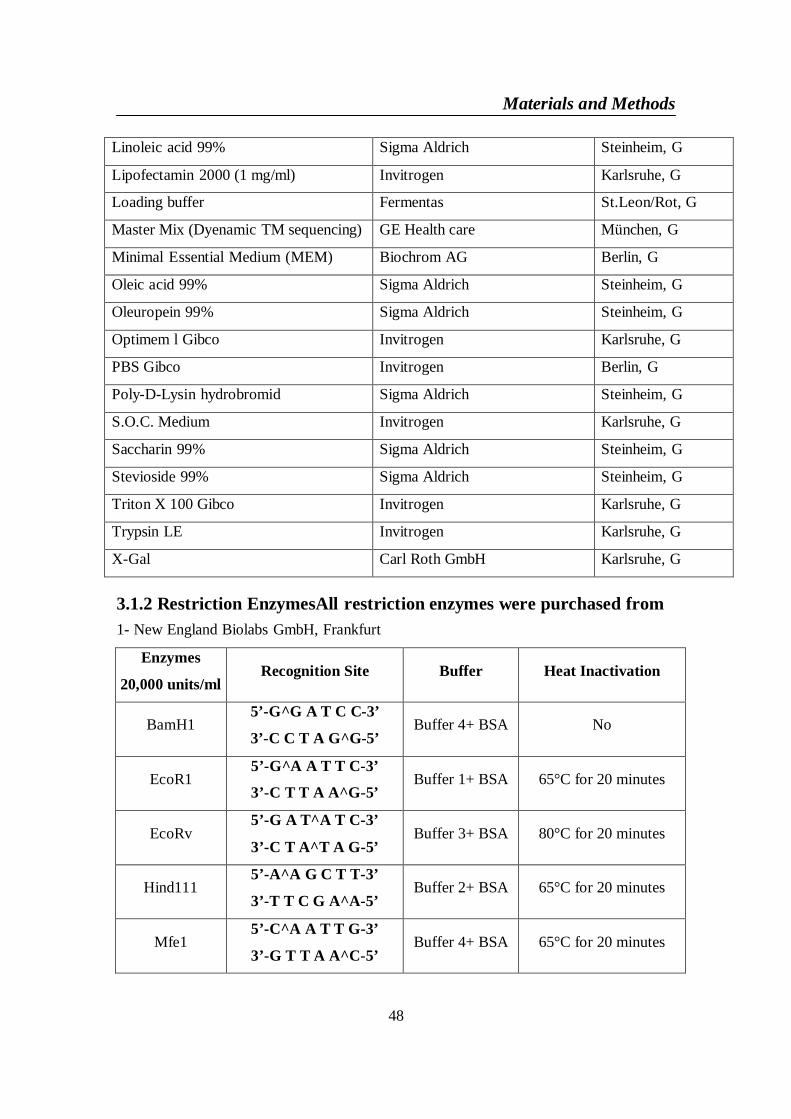
Materials and Methods
48
Linoleic acid 99% Sigma Aldrich Steinheim, G
Lipofectamin 2000 (1 mg/ml) Invitrogen Karlsruhe, G
Loading buffer Fermentas St.Leon/Rot, G
Master Mix (Dyenamic TM sequencing) GE Health care München, G
Minimal Essential Medium (MEM) Biochrom AG Berlin, G
Oleic acid 99% Sigma Aldrich Steinheim, G
Oleuropein 99% Sigma Aldrich Steinheim, G
Optimem l Gibco Invitrogen Karlsruhe, G
PBS Gibco Invitrogen Berlin, G
Poly-D-Lysin hydrobromid Sigma Aldrich Steinheim, G
S.O.C. Medium Invitrogen Karlsruhe, G
Saccharin 99% Sigma Aldrich Steinheim, G
Stevioside 99% Sigma Aldrich Steinheim, G
Triton X 100 Gibco Invitrogen Karlsruhe, G
Trypsin LE Invitrogen Karlsruhe, G
X-Gal Carl Roth GmbH Karlsruhe, G
3.1.2 Restriction EnzymesAll restriction enzymes were purchased from1- New England Biolabs GmbH, Frankfurt
Enzymes
20,000 units/mlRecognition Site Buffer Heat Inactivation
BamH15’-G^G A T C C-3’
3’-C C T A G^G-5’Buffer 4+ BSA No
EcoR15’-G^A A T T C-3’
3’-C T T A A^G-5’Buffer 1+ BSA 65°C for 20 minutes
EcoRv5’-G A T^A T C-3’
3’-C T A^T A G-5’Buffer 3+ BSA 80°C for 20 minutes
Hind1115’-A^A G C T T-3’
3’-T T C G A^A-5’Buffer 2+ BSA 65°C for 20 minutes
Mfe15’-C^A A T T G-3’
3’-G T T A A^C-5’Buffer 4+ BSA 65°C for 20 minutes
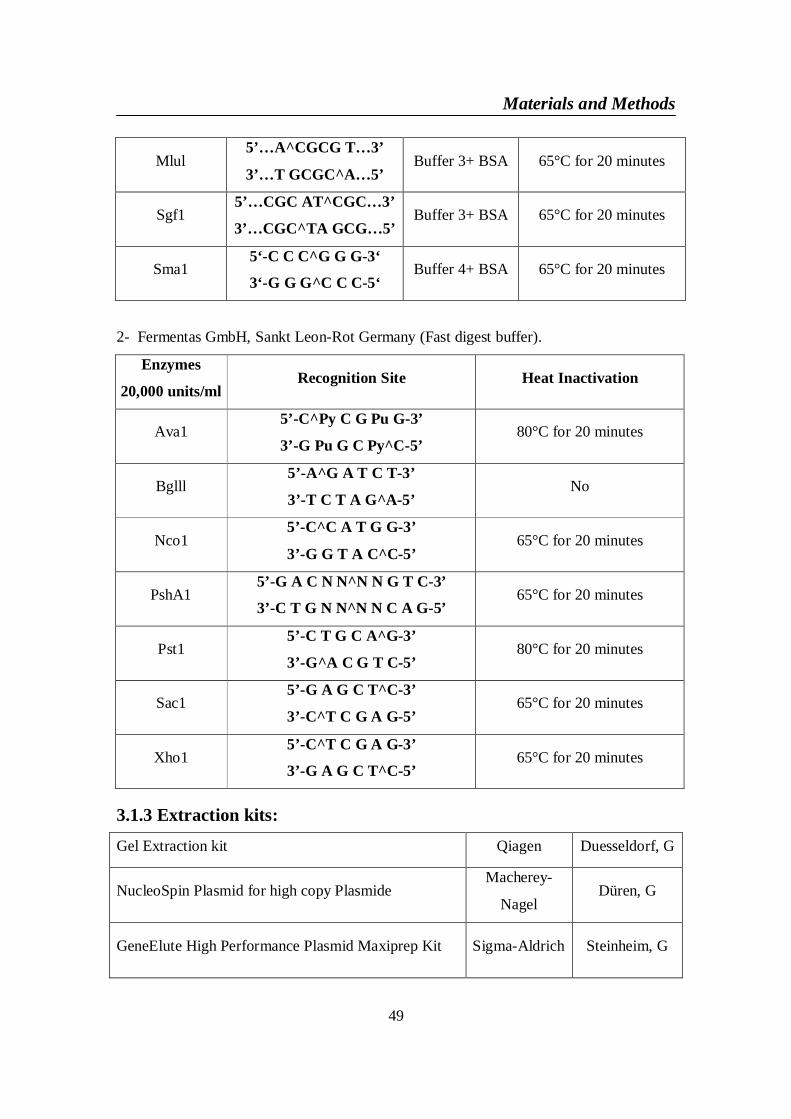
Materials and Methods
49
Mlul5’…A^CGCG T…3’
3’…T GCGC^A…5’Buffer 3+ BSA 65°C for 20 minutes
Sgf15’…CGC AT^CGC…3’
3’…CGC^TA GCG…5’Buffer 3+ BSA 65°C for 20 minutes
Sma15‘-C C C^G G G-3‘
3‘-G G G^C C C-5‘Buffer 4+ BSA 65°C for 20 minutes
2- Fermentas GmbH, Sankt Leon-Rot Germany (Fast digest buffer).
Enzymes
20,000 units/mlRecognition Site Heat Inactivation
Ava15’-C^Py C G Pu G-3’
3’-G Pu G C Py^C-5’80°C for 20 minutes
Bglll5’-A^G A T C T-3’
3’-T C T A G^A-5’No
Nco15’-C^C A T G G-3’
3’-G G T A C^C-5’65°C for 20 minutes
PshA15’-G A C N N^N N G T C-3’
3’-C T G N N^N N C A G-5’65°C for 20 minutes
Pst15’-C T G C A^G-3’
3’-G^A C G T C-5’80°C for 20 minutes
Sac15’-G A G C T^C-3’
3’-C^T C G A G-5’65°C for 20 minutes
Xho15’-C^T C G A G-3’
3’-G A G C T^C-5’65°C for 20 minutes
3.1.3 Extraction kits:
Gel Extraction kit Qiagen Duesseldorf, G
NucleoSpin Plasmid for high copy PlasmideMacherey-
NagelDüren, G
GeneElute High Performance Plasmid Maxiprep Kit Sigma-Aldrich Steinheim, G
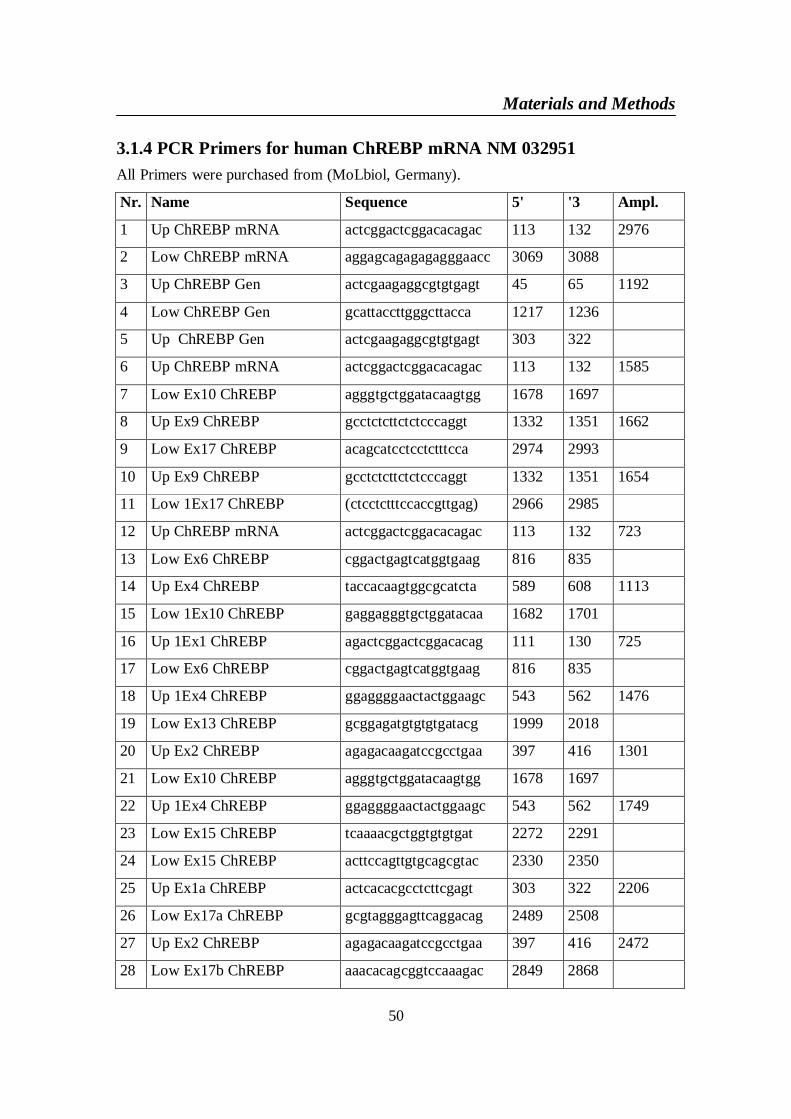
Materials and Methods
50
3.1.4 PCR Primers for human ChREBP mRNA NM 032951All Primers were purchased from (MoLbiol, Germany).
Nr. Name Sequence 5' '3 Ampl.
1 Up ChREBP mRNA actcggactcggacacagac 113 132 2976
2 Low ChREBP mRNA aggagcagagagagggaacc 3069 3088
3 Up ChREBP Gen actcgaagaggcgtgtgagt 45 65 1192
4 Low ChREBP Gen gcattaccttgggcttacca 1217 1236
5 Up ChREBP Gen actcgaagaggcgtgtgagt 303 322
6 Up ChREBP mRNA actcggactcggacacagac 113 132 1585
7 Low Ex10 ChREBP agggtgctggatacaagtgg 1678 1697
8 Up Ex9 ChREBP gcctctcttctctcccaggt 1332 1351 1662
9 Low Ex17 ChREBP acagcatcctcctctttcca 2974 2993
10 Up Ex9 ChREBP gcctctcttctctcccaggt 1332 1351 1654
11 Low 1Ex17 ChREBP (ctcctctttccaccgttgag) 2966 2985
12 Up ChREBP mRNA actcggactcggacacagac 113 132 723
13 Low Ex6 ChREBP cggactgagtcatggtgaag 816 835
14 Up Ex4 ChREBP taccacaagtggcgcatcta 589 608 1113
15 Low 1Ex10 ChREBP gaggagggtgctggatacaa 1682 1701
16 Up 1Ex1 ChREBP agactcggactcggacacag 111 130 725
17 Low Ex6 ChREBP cggactgagtcatggtgaag 816 835
18 Up 1Ex4 ChREBP ggaggggaactactggaagc 543 562 1476
19 Low Ex13 ChREBP gcggagatgtgtgtgatacg 1999 2018
20 Up Ex2 ChREBP agagacaagatccgcctgaa 397 416 1301
21 Low Ex10 ChREBP agggtgctggatacaagtgg 1678 1697
22 Up 1Ex4 ChREBP ggaggggaactactggaagc 543 562 1749
23 Low Ex15 ChREBP tcaaaacgctggtgtgtgat 2272 2291
24 Low Ex15 ChREBP acttccagttgtgcagcgtac 2330 2350
25 Up Ex1a ChREBP actcacacgcctcttcgagt 303 322 2206
26 Low Ex17a ChREBP gcgtagggagttcaggacag 2489 2508
27 Up Ex2 ChREBP agagacaagatccgcctgaa 397 416 2472
28 Low Ex17b ChREBP aaacacagcggtccaaagac 2849 2868
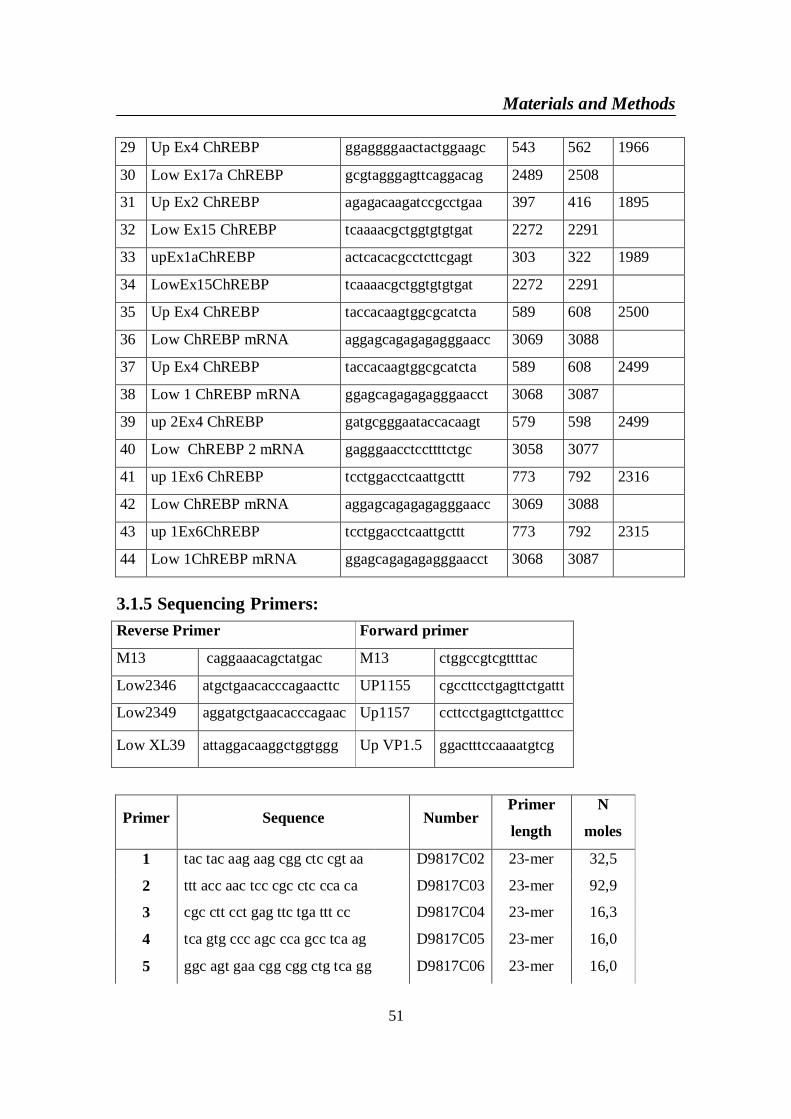
Materials and Methods
51
29 Up Ex4 ChREBP ggaggggaactactggaagc 543 562 1966
30 Low Ex17a ChREBP gcgtagggagttcaggacag 2489 2508
31 Up Ex2 ChREBP agagacaagatccgcctgaa 397 416 1895
32 Low Ex15 ChREBP tcaaaacgctggtgtgtgat 2272 2291
33 upEx1aChREBP actcacacgcctcttcgagt 303 322 1989
34 LowEx15ChREBP tcaaaacgctggtgtgtgat 2272 2291
35 Up Ex4 ChREBP taccacaagtggcgcatcta 589 608 2500
36 Low ChREBP mRNA aggagcagagagagggaacc 3069 3088
37 Up Ex4 ChREBP taccacaagtggcgcatcta 589 608 2499
38 Low 1 ChREBP mRNA ggagcagagagagggaacct 3068 3087
39 up 2Ex4 ChREBP gatgcgggaataccacaagt 579 598 2499
40 Low ChREBP 2 mRNA gagggaacctccttttctgc 3058 3077
41 up 1Ex6 ChREBP tcctggacctcaattgcttt 773 792 2316
42 Low ChREBP mRNA aggagcagagagagggaacc 3069 3088
43 up 1Ex6ChREBP tcctggacctcaattgcttt 773 792 2315
44 Low 1ChREBP mRNA ggagcagagagagggaacct 3068 3087
3.1.5 Sequencing Primers:Reverse Primer Forward primer
M13 caggaaacagctatgac M13 ctggccgtcgttttac
Low2346 atgctgaacacccagaacttc UP1155 cgccttcctgagttctgattt
Low2349 aggatgctgaacacccagaac Up1157 ccttcctgagttctgatttcc
Low XL39 attaggacaaggctggtggg Up VP1.5 ggactttccaaaatgtcg
Primer Sequence NumberPrimer
length
N
moles
1 tac tac aag aag cgg ctc cgt aa D9817C02 23-mer 32,5
2 ttt acc aac tcc cgc ctc cca ca D9817C03 23-mer 92,9
3 cgc ctt cct gag ttc tga ttt cc D9817C04 23-mer 16,3
4 tca gtg ccc agc cca gcc tca ag D9817C05 23-mer 16,0
5 ggc agt gaa cgg cgg ctg tca gg D9817C06 23-mer 16,0
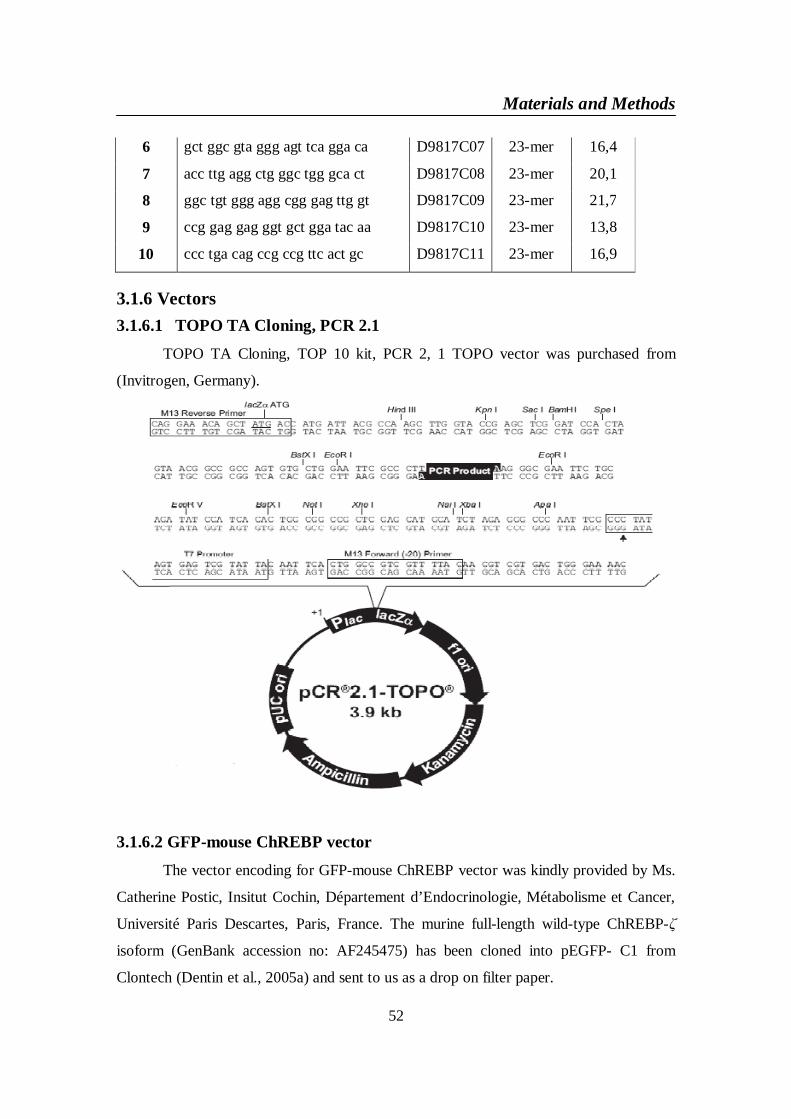
Materials and Methods
52
6 gct ggc gta ggg agt tca gga ca D9817C07 23-mer 16,4
7 acc ttg agg ctg ggc tgg gca ct D9817C08 23-mer 20,1
8 ggc tgt ggg agg cgg gag ttg gt D9817C09 23-mer 21,7
9 ccg gag gag ggt gct gga tac aa D9817C10 23-mer 13,8
10 ccc tga cag ccg ccg ttc act gc D9817C11 23-mer 16,9
3.1.6 Vectors3.1.6.1 TOPO TA Cloning, PCR 2.1
TOPO TA Cloning, TOP 10 kit, PCR 2, 1 TOPO vector was purchased from
(Invitrogen, Germany).
3.1.6.2 GFP-mouse ChREBP vector
The vector encoding for GFP-mouse ChREBP vector was kindly provided by Ms.
Catherine Postic, Insitut Cochin, Département d’Endocrinologie, Métabolisme et Cancer,
Université Paris Descartes, Paris, France. The murine full-length wild-type ChREBP-
isoform (GenBank accession no: AF245475) has been cloned into pEGFP- C1 from
Clontech (Dentin et al., 2005a) and sent to us as a drop on filter paper.
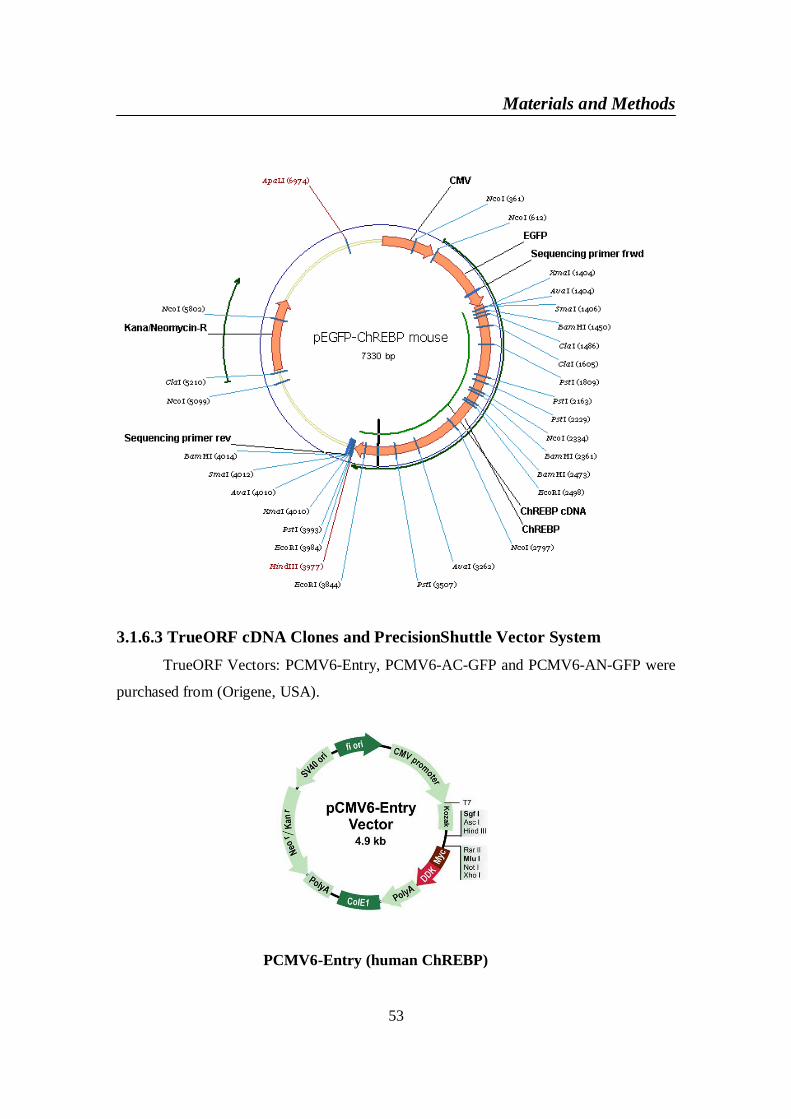
Materials and Methods
53
3.1.6.3 TrueORF cDNA Clones and PrecisionShuttle Vector SystemTrueORF Vectors: PCMV6-Entry, PCMV6-AC-GFP and PCMV6-AN-GFP were
purchased from (Origene, USA).
PCMV6-Entry (human ChREBP)
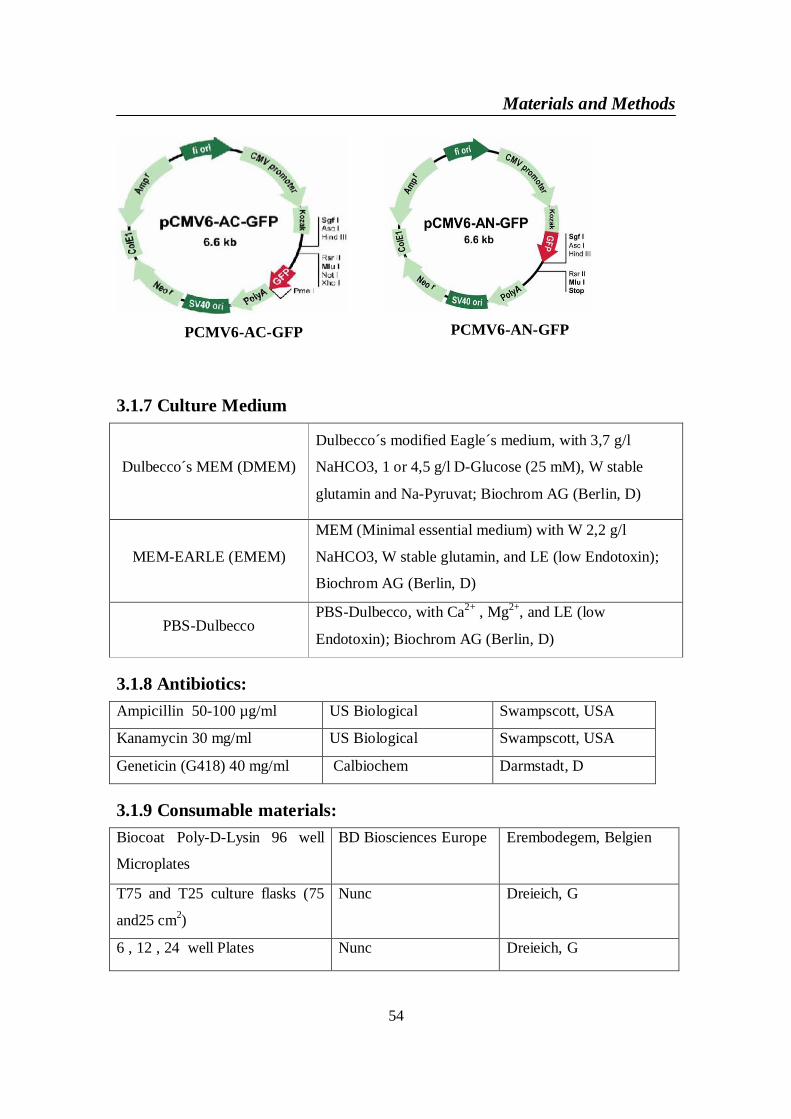
Materials and Methods
54
PCMV6-AC-GFP PCMV6-AN-GFP
3.1.7 Culture Medium
Dulbecco´s MEM (DMEM)
Dulbecco´s modified Eagle´s medium, with 3,7 g/l
NaHCO3, 1 or 4,5 g/l D-Glucose (25 mM), W stable
glutamin and Na-Pyruvat; Biochrom AG (Berlin, D)
MEM-EARLE (EMEM)
MEM (Minimal essential medium) with W 2,2 g/l
NaHCO3, W stable glutamin, and LE (low Endotoxin);
Biochrom AG (Berlin, D)
PBS-DulbeccoPBS-Dulbecco, with Ca2+ , Mg2+, and LE (low
Endotoxin); Biochrom AG (Berlin, D)
3.1.8 Antibiotics:Ampicillin 50-100 µg/ml US Biological Swampscott, USA
Kanamycin 30 mg/ml US Biological Swampscott, USA
Geneticin (G418) 40 mg/ml Calbiochem Darmstadt, D
3.1.9 Consumable materials:Biocoat Poly-D-Lysin 96 well
Microplates
BD Biosciences Europe Erembodegem, Belgien
T75 and T25 culture flasks (75
and25 cm2)
Nunc Dreieich, G
6 , 12 , 24 well Plates Nunc Dreieich, G
Materials and Methods
55
96 well PCR Plates Applied Biosciences Darmstadt, G
Petri dishes (100 mm) Nunc Dreieich, G
3.1.10 Instruments and machinesMicrowave Bosch GmbH Stuttgart , G
Vortex Shaker VWR international GmbH Darmstadt , G
Deep freezing storage device
(with liquid nitrogen)Taylor – Wharton Theodore, Alabama USA
Gel Electrophoresis Appratus
Live Technologies Horizon 58 Gibco BRL Gaithersburg , USA
Water Bath FS2 Haake Thermo Haake GmbH Karlsruhe, G
Mixing Block MB-102 Biozym scientific GmbHOldendorf, Germany
Water Bath FS2 Haake
Shaker Incubator CH-4103 Infors AG Bottmingen,G
T Gradient Thermo cycler Biometra Goettingen, G
Master Cycler 5330 Eppendorf Hamburg, G
Micro Centrifuge 5415 C Eppendorf Hamburg, G
Reprostar ll UV light CAMAG Berlin, G
BD Pathway 435 System BD Biosciences Erembodegem, Bel
Horizontal
Gelelektrophoresekammer
(Modell 200)
Gibco, Invitrogen Karlsruhe, G
Inkubator Heraeus 6000 Heraeus Instruments Hanau, G
Kryobehälter (air liquid) Tec Lab Königsstein, G
Light microscope Olympus Hamburg, G
Steril bank HF48 Gelaire Burladingen, G
Steril bank Lamin Air 2448 Heraeus Instruments Hanau, G
Thermomixer 5436 Eppendorf Hamburg, G
Universal 320 centrifuge Hettich Thüringen, G
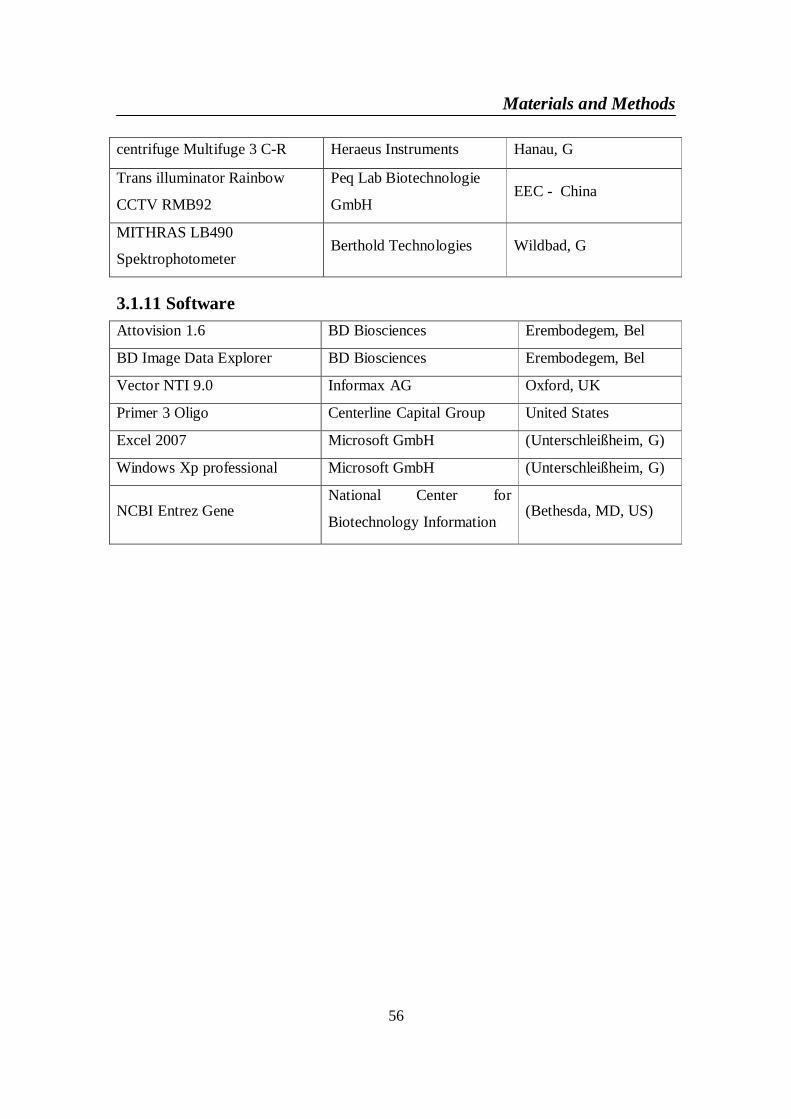
Materials and Methods
56
centrifuge Multifuge 3 C-R Heraeus Instruments Hanau, G
Trans illuminator Rainbow
CCTV RMB92
Peq Lab Biotechnologie
GmbHEEC - China
MITHRAS LB490
SpektrophotometerBerthold Technologies Wildbad, G
3.1.11 SoftwareAttovision 1.6 BD Biosciences Erembodegem, Bel
BD Image Data Explorer BD Biosciences Erembodegem, Bel
Vector NTI 9.0 Informax AG Oxford, UK
Primer 3 Oligo Centerline Capital Group United States
Excel 2007 Microsoft GmbH (Unterschleißheim, G)
Windows Xp professional Microsoft GmbH (Unterschleißheim, G)
NCBI Entrez GeneNational Center for
Biotechnology Information(Bethesda, MD, US)
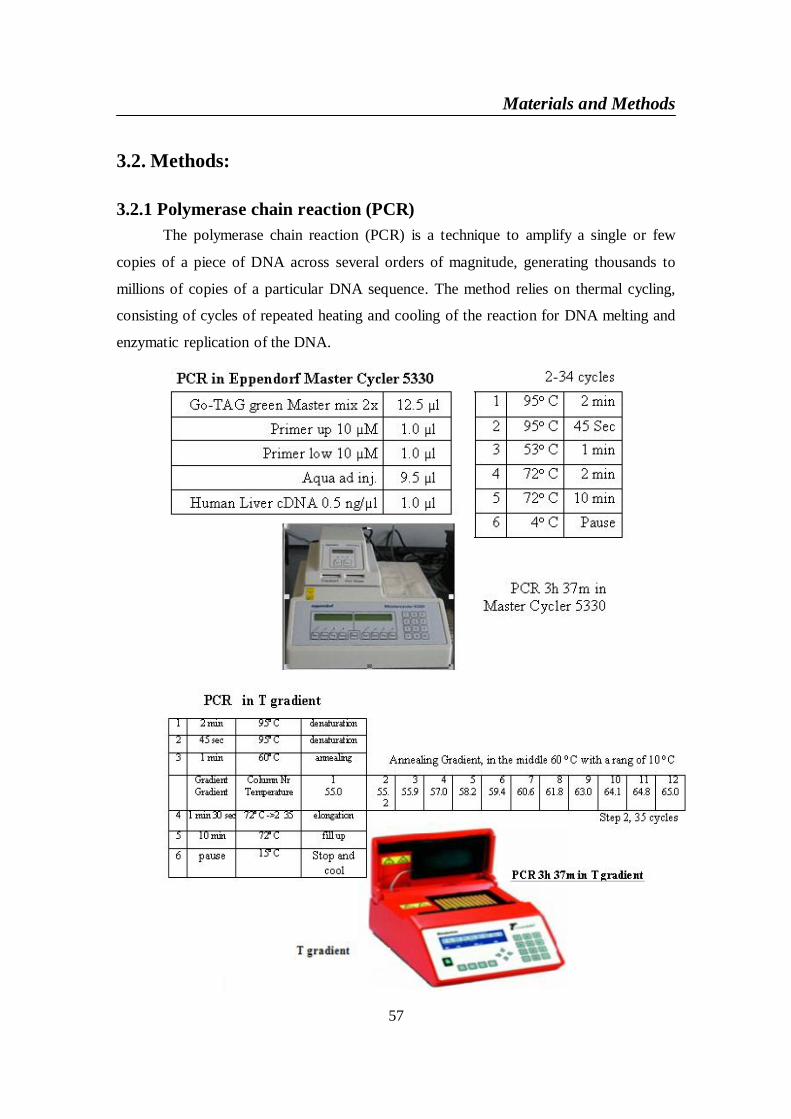
Materials and Methods
57
3.2. Methods:
3.2.1 Polymerase chain reaction (PCR)The polymerase chain reaction (PCR) is a technique to amplify a single or few
copies of a piece of DNA across several orders of magnitude, generating thousands to
millions of copies of a particular DNA sequence. The method relies on thermal cycling,
consisting of cycles of repeated heating and cooling of the reaction for DNA melting and
enzymatic replication of the DNA.

Materials and Methods
58
T Gradient
3.2.2 Agarose gel electrophoresisAgarose gel electrophoresis is a method used to separate DNA molecules by size.
This is achieved by moving negatively charged nucleic acid molecules through an
agarose matrix with an electric field (electrophoresis). Shorter molecules move faster and
migrate farther than longer ones. The most common dye used to make DNA or RNA
bands visible for agarose gel electrophoresis is ethidium bromide (EtBr). It fluoresces
under UV light when intercalated into DNA. By running DNA through an EtBr-treated
gel and visualizing it with UV light, any band containing more than ~20 ng DNA
becomes distinctly visible. DNA fragments were separated in 1 % agarose gels via
agarose gel electrophoresis. To this end, 20 ml TAE buffer were supplied with 0.2 g
agarose and heated until agarose was melted in a microwave (180W for 1min 30sec).
Gels were supplemented with 0.5 g/ml EtBr. 5 l of the samples were mixed with 1 l
loading buffer and separated at 75 V. 3 l 1kb ladder (Fermentas) were used to identify
the sizes of the separated DNA bands that were visualised with UV light.
Materials and Methods
59
10xTAE buffer:
· 48.4 g Tris base
· 14.8 g EDTA_H2O
· 32.8 g sodium acetate, anhydrous
· 34 g glacial acetic acid
· added to 1 l with H2O
· pH = 7.8
Loading buffer:
· 0.25 % bromophenol blue
· 0.25 % xylencyanol
· 30 % glycerol
Ethidium bromide:
· 10 mg/ml in H2O
3.2.3 DNA ExtractionFragment was excised from the agarose gel with a clean, sharp scalpel, the gel
slice was weighted in a colorless tube, then buffer QG was added to gel at ratio 3:1,
sample was incubated at 50°C for 10 min, the tube was mixed by vortex every 2-3 min
during the incubation. After the gel slice had dissolved completely, isopropanol was
added to the sample with same volume of gel (1:1) and mixed, a QIA quick spin column
was placed in a provided 2 ml collection tube, the sample was applied to the QIA quick
column, and centrifuged for 1 min. The flow-through was discarded and QIA quick
column was placed in the same collection tube, 0.5 ml of buffer QG was added to QIA
quick column and centrifuged for 1 min, then 0, 75 ml of buffer PE was added to QIA
quick column and centrifuged for 1 min. The flow- through discarded and the QIA quick
column was centrifuged for an additional 1 min, QIA quick column was placed into a
clean 1.5 ml micro centrifuge tube. DNA was eluted by 50µl of EB buffer; finally the
DNA was stored at -20°C until used.
3.2.4 DNA TransformationThe transformation is the process of the admission of DNA Plasmid in bacteria.
This method is used to multiply small quantities of DNA Plasmid, transformation can
occur chemically through heat shock.
Materials and Methods
60
3.2.5 Heat shock transformation with E.coliTOPO TA cloning used by adding 4 l fresh PCR product, 1 l salt solution (1.2
M NaCl, 0.06 M MgCl2) and 1 l TOPO vector in 1.5 ml micro centrifuge tube, the
reaction was mixed gently and incubated for 30 minutes at room temperature (22-23°C)
then the tube was placed in ice. One shot competent E. coli, continued (top 10) was used
by adding 2 l TOPO cloning reaction into a vial of one shot chemically competent E.
coli with a sterile pipette tip and mixed gently. The cells/plasmid mix was incubated in
ice for 5 minutes. The sample was heated for 30 seconds at 42°C without shaking.
Immediately, the tubes were transferred to ice, 250 l of S.O.C. medium was added, the
tube was caped tightly and shacked horizontally at 200 rpm at a 37°C in shaking
incubator for 1 hour. 35µl of X-Gal was added in every plate to indicate whether a cell
expresses the -galactosidase enzyme, which is encoded by the lacZ gene, in a technique
called blue/white screening and incubated at 37°C for 10 min. 10 or 50 l from the
transformation reaction was spread on a pre-warmed selective agar plate with ampicillin
or Kanamycin to ensure even spreading of small volumes, 20 µl of S.O.C. medium was
added to the transformation mixture. The plates were incubated overnight at 37°C.
Colonies from each plate were picked and cultured overnight in LB medium containing 1
g/ml ampicillin or 30 mg/ml Kanamycin at 37°C in shaking incubator.
S.O.C. – Medium: 2.0 % Trypton
0.5 % yeast extract
10 mM NaCl
2, 5 mM KCl
10 mM MgCl2
10 mM MgSO4
20 mM Glucose
LB Agar: 10 g/l Trypton
5 g/l Hefeeextrakt
5 g/l Natriumchlorid
15 g/l Agar
PH = 7
Materials and Methods
61
LB-Medium (Lennox):
10 g/l Trypton
5 g/l yeast extract
5 g/l Natriumchlorid
PH = 7
3.2.6 Isolation of DNA Plasmid
3.2.6.1 DNA Mini preparation
1.5 ml of E. coli LB culture was centrifuged for 1 min at 11,000 x g, the
supernatant was discarded and removed as much of the supernatant as possible. 250 l
buffer A1 was added and re-suspend the cell pellet by Vigorous vortexing. Then, 250 l
buffer A2 was added and the samples were mixed gently by inverting the tube 6 times
and incubated at room temperature for a maximum of 5 min, 300 l buffer A3 was added
and mixed gently by inverting the tube 6 times without vortex. The tubes were
centrifuged for 5 min at 11,000 x g at room temperature. The supernatant was placed in a
2 ml NucleoSpin column collecting tube and centrifuged for 1 min at 11,000 x g., then
the flow through was discarded. Washing with 500 l pre-warmed AW buffer (50°C) and
a centrifugation (1 min; 11,000 x g) before proceeding with washing buffer A4. The
NucleoSpin plasmid column was placed back into the 2 ml collecting tube and 600 l A4
buffer was added and centrifuged for 1 min at 11,000 x g., the flow-through was
discarded, then centrifugation for 2 min at 11,000 x g. The NucleoSpin plasmid column
was placed in a 1.5 ml micro-centrifuge tube and 50 l buffer AE was added and
incubated 1 min at room temperature then centrifugation for 1 min at 11,000 x g, finally
the plasmid stored at -20°C until used.
3.2.6.2 DNA Maxi preparation
For preparation of high amounts of plasmid DNA, 150 ml LB medium
supplemented with ampicillin or Kanamycin were inoculated with 150 l liquid culture of
an E. coli JM109 clone that was checked for the correct vector by restriction analysis.
Cultures were incubated in shaking incubator at 37 °C over night. Plasmid was extracted
via the Kit GenElute High Performance Plasmid Maxi prep Kit (Sigma) .150 ml of an
overnight culture was pelleted at 5,000 X g, 10 min. supernatant was discarded. Cells
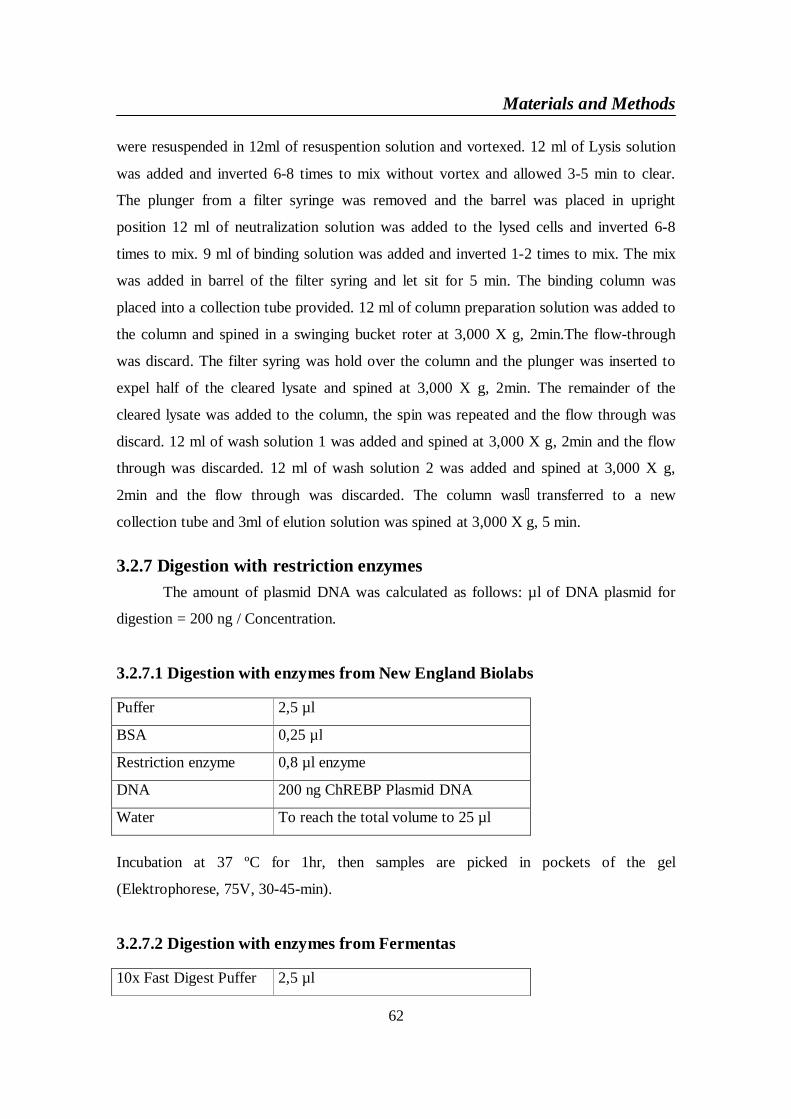
Materials and Methods
62
were resuspended in 12ml of resuspention solution and vortexed. 12 ml of Lysis solution
was added and inverted 6-8 times to mix without vortex and allowed 3-5 min to clear.
The plunger from a filter syringe was removed and the barrel was placed in upright
position 12 ml of neutralization solution was added to the lysed cells and inverted 6-8
times to mix. 9 ml of binding solution was added and inverted 1-2 times to mix. The mix
was added in barrel of the filter syring and let sit for 5 min. The binding column was
placed into a collection tube provided. 12 ml of column preparation solution was added to
the column and spined in a swinging bucket roter at 3,000 X g, 2min.The flow-through
was discard. The filter syring was hold over the column and the plunger was inserted to
expel half of the cleared lysate and spined at 3,000 X g, 2min. The remainder of the
cleared lysate was added to the column, the spin was repeated and the flow through was
discard. 12 ml of wash solution 1 was added and spined at 3,000 X g, 2min and the flow
through was discarded. 12 ml of wash solution 2 was added and spined at 3,000 X g,
2min and the flow through was discarded. The column was transferred to a new
collection tube and 3ml of elution solution was spined at 3,000 X g, 5 min.
3.2.7 Digestion with restriction enzymesThe amount of plasmid DNA was calculated as follows: µl of DNA plasmid for
digestion = 200 ng / Concentration.
3.2.7.1 Digestion with enzymes from New England Biolabs
Incubation at 37 ºC for 1hr, then samples are picked in pockets of the gel
(Elektrophorese, 75V, 30-45-min).
3.2.7.2 Digestion with enzymes from Fermentas
Puffer 2,5 µl
BSA 0,25 µl
Restriction enzyme 0,8 µl enzyme
DNA 200 ng ChREBP Plasmid DNA
Water To reach the total volume to 25 µl
10x Fast Digest Puffer 2,5 µl
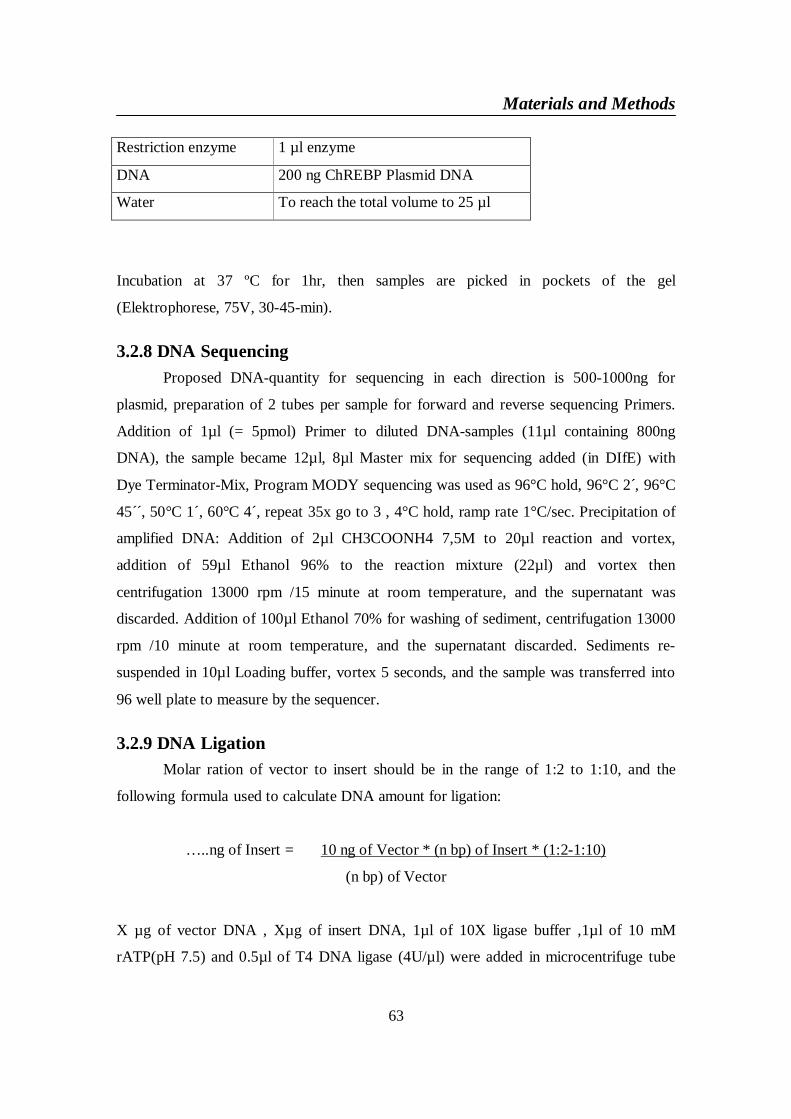
Materials and Methods
63
Incubation at 37 ºC for 1hr, then samples are picked in pockets of the gel
(Elektrophorese, 75V, 30-45-min).
3.2.8 DNA SequencingProposed DNA-quantity for sequencing in each direction is 500-1000ng for
plasmid, preparation of 2 tubes per sample for forward and reverse sequencing Primers.
Addition of 1µl (= 5pmol) Primer to diluted DNA-samples (11µl containing 800ng
DNA), the sample became 12µl, 8µl Master mix for sequencing added (in DIfE) with
Dye Terminator-Mix, Program MODY sequencing was used as 96°C hold, 96°C 2 ,́ 96°C
45´´, 50°C 1´, 60°C 4´, repeat 35x go to 3 , 4°C hold, ramp rate 1°C/sec. Precipitation of
amplified DNA: Addition of 2µl CH3COONH4 7,5M to 20µl reaction and vortex,
addition of 59µl Ethanol 96% to the reaction mixture (22µl) and vortex then
centrifugation 13000 rpm /15 minute at room temperature, and the supernatant was
discarded. Addition of 100µl Ethanol 70% for washing of sediment, centrifugation 13000
rpm /10 minute at room temperature, and the supernatant discarded. Sediments re-
suspended in 10µl Loading buffer, vortex 5 seconds, and the sample was transferred into
96 well plate to measure by the sequencer.
3.2.9 DNA LigationMolar ration of vector to insert should be in the range of 1:2 to 1:10, and the
following formula used to calculate DNA amount for ligation:
…..ng of Insert = 10 ng of Vector * (n bp) of Insert * (1:2-1:10)
(n bp) of Vector
X µg of vector DNA , Xµg of insert DNA, 1µl of 10X ligase buffer ,1µl of 10 mM
rATP(pH 7.5) and 0.5µl of T4 DNA ligase (4U/µl) were added in microcentrifuge tube
Restriction enzyme 1 µl enzyme
DNA 200 ng ChREBP Plasmid DNA
Water To reach the total volume to 25 µl
Materials and Methods
64
and the volume was completed to 10µl by sterile water. The sample of ligation reaction
was incubated at 4°C overnight and then transformation.
3.2.10 Vector Encoding for GFP- Labelled Mouse ChREBPIn order to visualise nucleo-cytoplasmatic translocation of the transcription
factors ChREBP the cDNA sequences of the murine full-length wild-type ChREBP-
isoform (GenBank accession no: AF245475) was cloned into pEGFP-C1 vectors, thus
coupling ChREBP to the C-terminus of EGFP (a variant of green fluorescent protein).
The vector encoding for GFP-ChREBP was kindly provided by Ms. Catherine Postic
Insitut Cochin, Département d’Endocrinologie, Métabolisme et Cancer, Université Paris
Descartes, Paris, France. The vector was sent to us as a drop on filter paper. The piece of
paper containing plasmid DNA was cut out and supplied with 100 l BE-Buffer to extract
DNA. Plasmid DNA was stored at 4 °C until transformation of competent E. coli JM109
cells in order to multiply the plasmid DNA.
3.2.11 Transformation of Competent E.coli JM 109 with MouseChREBP
For transformation, E. coli JM109 cells made competent with CaCl2, KCl, and
MnCl2 were used. 100 l of competent E. coli JM109 were supplied with 1 l ChREBP
plasmid DNA (41 ng) .Cells was incubated on ice for 30 min. A heat shock was
performed at 42 °C for 30 s to allow DNA uptake into cells. After incubating cells on ice
for 2 minutes, 400 l SOC medium were added to each transformation reaction and
incubated shaking for 1 h at 37 °C. 100 l of the transformation reactions were plated on
agar plates supplemented with kanamycin (final concentration: 30 g/ml). Thus, clones
were selected for the presence of ChREBP vector, as they contain a kanamycin resistance
gene. Plates were incubated over night at 37 °C.
After transformation of E. coli JM109, 4 – 8 colonies were checked for the
content of the desired plasmid. To this end, the chosen colonies were grown over night in
15 ml LB medium (Lennox) supplemented with kanamycin (30 g/ml) at 37 °C and 180
rpm. Plasmids were extracted with Mini preparation NucleoSpin Plasmid kit (Macherey-
Nagel) according to the manufacturer’s instructions for high-copy plasmids.
Success of plasmid preparations was proven by measuring DNA concentration
spectrophotometrically. The identities of the isolated plasmid were checked again via
Materials and Methods
65
restriction digest. ChREBP is analyzed with EcoR1 and BamH1, then maxipreparation
for mouse ChREBP were done.
3.2.12 Cell Culture3.2.12.1 Cell lines and their cultural terms
For cell culture U2OS (humane Osteosarcoma cells, ATCC Nr.: HTB-96, P29),
HUH7 (human Hepatoma cells from Dr. Billicke, Charite, Campus Virchow medical
center) and HepG2 cells (human Hepatoma cells, No. ATCC: HB-8065) were used, The
HUH7,U2OS were cultured in T75 culture flasks with 25 ml Dulbecco’s Modified Eagle
Medium (DMEM) ; 25 mM glucose supplemented with 10 % Fetal Calf Serum (FCS).
The HepG2 cells were cultured in T75 cultural flasks with 20 ml essential medium
(MEM; 5 mms of glucose, 10% FCS). Cells were incubated at 37 °C, 5% CO2 and> 95%
of air humidity.
3.2.12.2 Cells passaging and freezingFor cell passage or long-term storage, cells were grown in T75 cultural flasks with
20 ml essential medium (MEM; 5 mms of glucose, 10% FCS) to a density of 80 %
confluence. Culture medium was aspirated completely and cells were incubated with 3 ml
Trypsin LE at 37 °C for 5 minutes to promote detachment of cells from the flask bottom.
Cells were taken up in 9 ml culture medium with 10% FCS to deactivate trypsin and
pelleted at 450 x g for 5 minutes. Supernatant was aspirated and cells were resuspended
in 2 ml new culture medium for passage or 1 ml freezing medium (DMEM with 20 %
FCS and 10 % DMSO) and slowly cooled to -80 °C to avoid cell damage. Afterwards
their storage occurred with -196 °C in liquid nitrogen. For cell passage 0.5* 106 cells
were seeded into new culture flasks with 25 ml DMEM and medium was changed after 2
h to remove DMSO. Culture medium was changed every 3 day. For cell freezing, cells
diluted in freezing medium were stored in cryotubes and transferred into a freezing
container, which contains isopropanol, thus allowing a slow cooling down (approx. 1 °C
per minute) to -80 °C
3.2.12.3 Cells Counting
Thoma-counting chamber was used for counting of the cells. After addition of 10
µl of the suitable cell suspendion on the placees intended on the counting chamber cells
were examined under the microscope light in tenfold enlargement. Cells were counted in
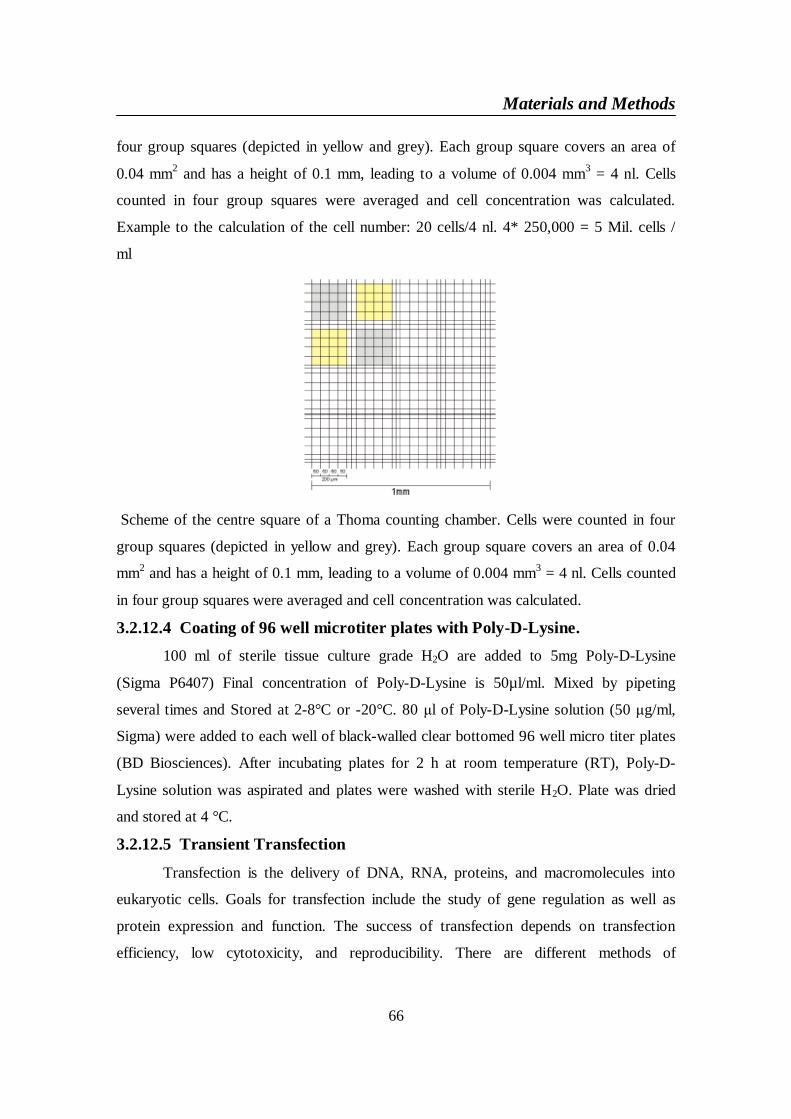
Materials and Methods
66
four group squares (depicted in yellow and grey). Each group square covers an area of
0.04 mm2 and has a height of 0.1 mm, leading to a volume of 0.004 mm3 = 4 nl. Cells
counted in four group squares were averaged and cell concentration was calculated.
Example to the calculation of the cell number: 20 cells/4 nl. 4* 250,000 = 5 Mil. cells /
ml
Scheme of the centre square of a Thoma counting chamber. Cells were counted in four
group squares (depicted in yellow and grey). Each group square covers an area of 0.04
mm2 and has a height of 0.1 mm, leading to a volume of 0.004 mm3 = 4 nl. Cells counted
in four group squares were averaged and cell concentration was calculated.
3.2.12.4 Coating of 96 well microtiter plates with Poly-D-Lysine.100 ml of sterile tissue culture grade H2O are added to 5mg Poly-D-Lysine
(Sigma P6407) Final concentration of Poly-D-Lysine is 50µl/ml. Mixed by pipeting
several times and Stored at 2-8°C or -20°C. 80 l of Poly-D-Lysine solution (50 g/ml,
Sigma) were added to each well of black-walled clear bottomed 96 well micro titer plates
(BD Biosciences). After incubating plates for 2 h at room temperature (RT), Poly-D-
Lysine solution was aspirated and plates were washed with sterile H2O. Plate was dried
and stored at 4 °C.
3.2.12.5 Transient Transfection
Transfection is the delivery of DNA, RNA, proteins, and macromolecules into
eukaryotic cells. Goals for transfection include the study of gene regulation as well as
protein expression and function. The success of transfection depends on transfection
efficiency, low cytotoxicity, and reproducibility. There are different methods of
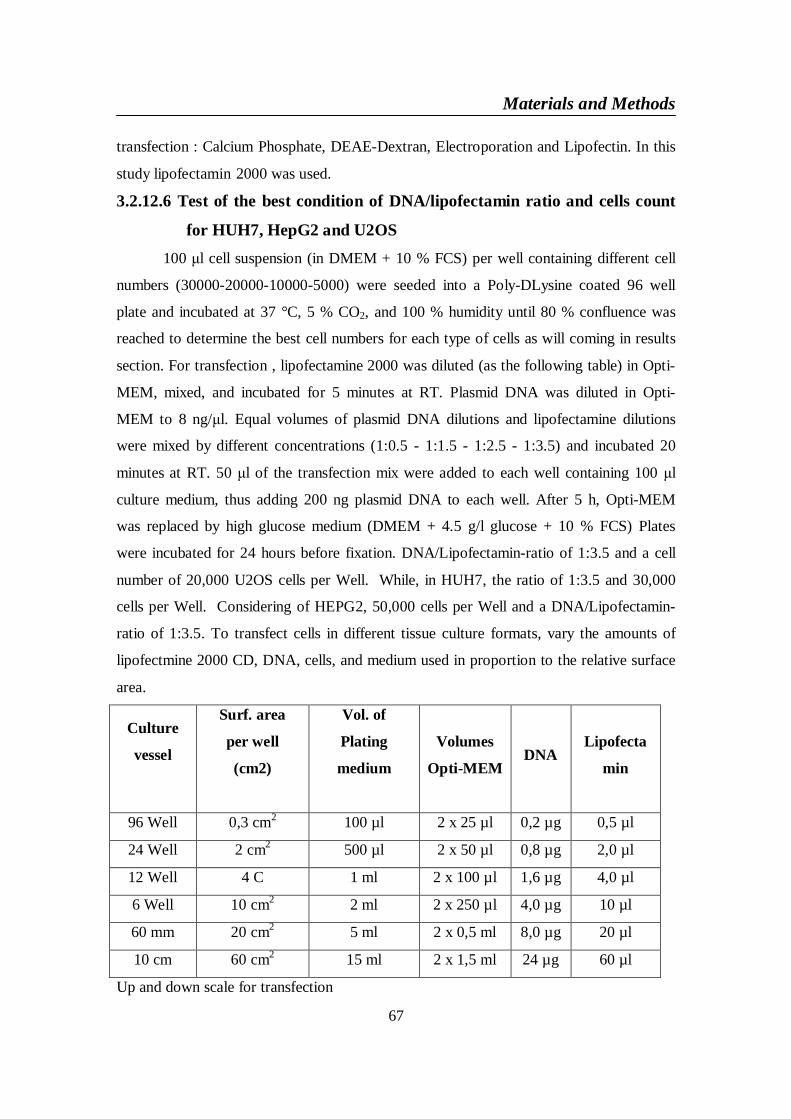
Materials and Methods
67
transfection : Calcium Phosphate, DEAE-Dextran, Electroporation and Lipofectin. In this
study lipofectamin 2000 was used.
3.2.12.6 Test of the best condition of DNA/lipofectamin ratio and cells count
for HUH7, HepG2 and U2OS
100 l cell suspension (in DMEM + 10 % FCS) per well containing different cell
numbers (30000-20000-10000-5000) were seeded into a Poly-DLysine coated 96 well
plate and incubated at 37 °C, 5 % CO2, and 100 % humidity until 80 % confluence was
reached to determine the best cell numbers for each type of cells as will coming in results
section. For transfection , lipofectamine 2000 was diluted (as the following table) in Opti-
MEM, mixed, and incubated for 5 minutes at RT. Plasmid DNA was diluted in Opti-
MEM to 8 ng/ l. Equal volumes of plasmid DNA dilutions and lipofectamine dilutions
were mixed by different concentrations (1:0.5 - 1:1.5 - 1:2.5 - 1:3.5) and incubated 20
minutes at RT. 50 l of the transfection mix were added to each well containing 100 l
culture medium, thus adding 200 ng plasmid DNA to each well. After 5 h, Opti-MEM
was replaced by high glucose medium (DMEM + 4.5 g/l glucose + 10 % FCS) Plates
were incubated for 24 hours before fixation. DNA/Lipofectamin-ratio of 1:3.5 and a cell
number of 20,000 U2OS cells per Well. While, in HUH7, the ratio of 1:3.5 and 30,000
cells per Well. Considering of HEPG2, 50,000 cells per Well and a DNA/Lipofectamin-
ratio of 1:3.5. To transfect cells in different tissue culture formats, vary the amounts of
lipofectmine 2000 CD, DNA, cells, and medium used in proportion to the relative surface
area.
Culture
vessel
Surf. area
per well
(cm2)
Vol. of
Plating
medium
Volumes
Opti-MEMDNA
Lipofecta
min
96 Well 0,3 cm2 100 µl 2 x 25 µl 0,2 µg 0,5 µl
24 Well 2 cm2 500 µl 2 x 50 µl 0,8 µg 2,0 µl
12 Well 4 C 1 ml 2 x 100 µl 1,6 µg 4,0 µl
6 Well 10 cm2 2 ml 2 x 250 µl 4,0 µg 10 µl
60 mm 20 cm2 5 ml 2 x 0,5 ml 8,0 µg 20 µl
10 cm 60 cm2 15 ml 2 x 1,5 ml 24 µg 60 µl
Up and down scale for transfection
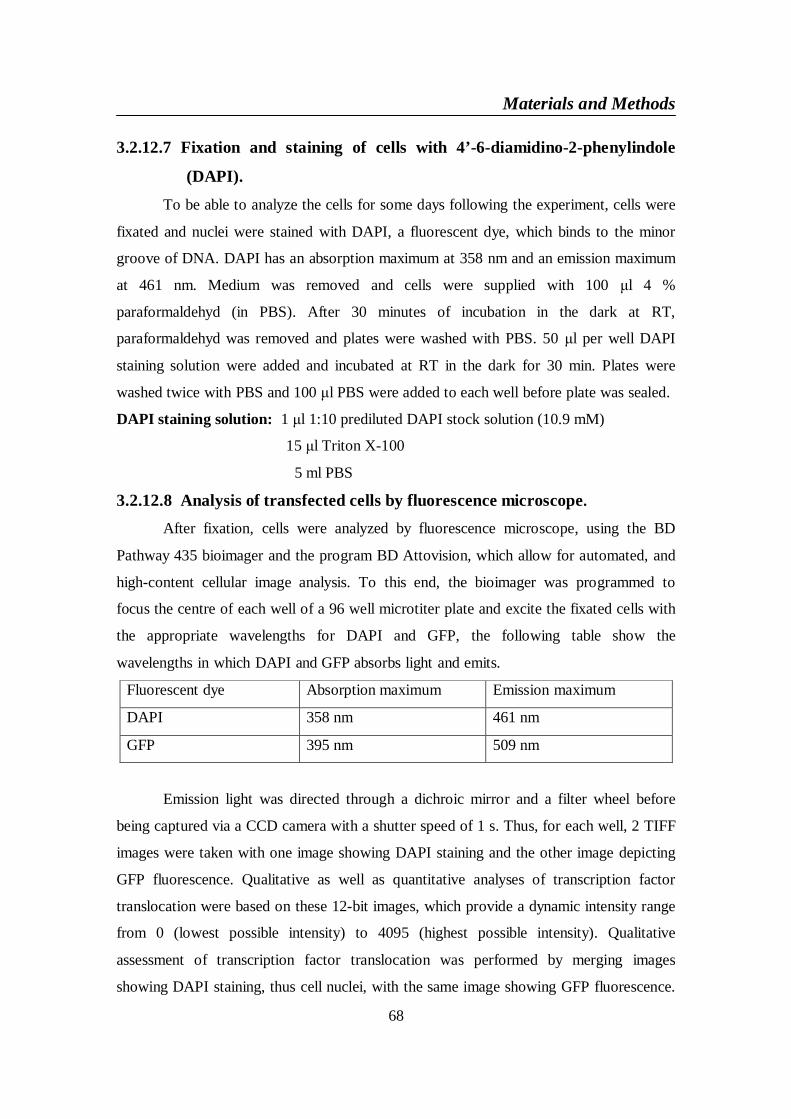
Materials and Methods
68
3.2.12.7 Fixation and staining of cells with 4’-6-diamidino-2-phenylindole
(DAPI).
To be able to analyze the cells for some days following the experiment, cells were
fixated and nuclei were stained with DAPI, a fluorescent dye, which binds to the minor
groove of DNA. DAPI has an absorption maximum at 358 nm and an emission maximum
at 461 nm. Medium was removed and cells were supplied with 100 l 4 %
paraformaldehyd (in PBS). After 30 minutes of incubation in the dark at RT,
paraformaldehyd was removed and plates were washed with PBS. 50 l per well DAPI
staining solution were added and incubated at RT in the dark for 30 min. Plates were
washed twice with PBS and 100 l PBS were added to each well before plate was sealed.
DAPI staining solution: 1 l 1:10 prediluted DAPI stock solution (10.9 mM)
15 l Triton X-100
5 ml PBS
3.2.12.8 Analysis of transfected cells by fluorescence microscope.
After fixation, cells were analyzed by fluorescence microscope, using the BD
Pathway 435 bioimager and the program BD Attovision, which allow for automated, and
high-content cellular image analysis. To this end, the bioimager was programmed to
focus the centre of each well of a 96 well microtiter plate and excite the fixated cells with
the appropriate wavelengths for DAPI and GFP, the following table show the
wavelengths in which DAPI and GFP absorbs light and emits.
Fluorescent dye Absorption maximum Emission maximum
DAPI 358 nm 461 nm
GFP 395 nm 509 nm
Emission light was directed through a dichroic mirror and a filter wheel before
being captured via a CCD camera with a shutter speed of 1 s. Thus, for each well, 2 TIFF
images were taken with one image showing DAPI staining and the other image depicting
GFP fluorescence. Qualitative as well as quantitative analyses of transcription factor
translocation were based on these 12-bit images, which provide a dynamic intensity range
from 0 (lowest possible intensity) to 4095 (highest possible intensity). Qualitative
assessment of transcription factor translocation was performed by merging images
showing DAPI staining, thus cell nuclei, with the same image showing GFP fluorescence.
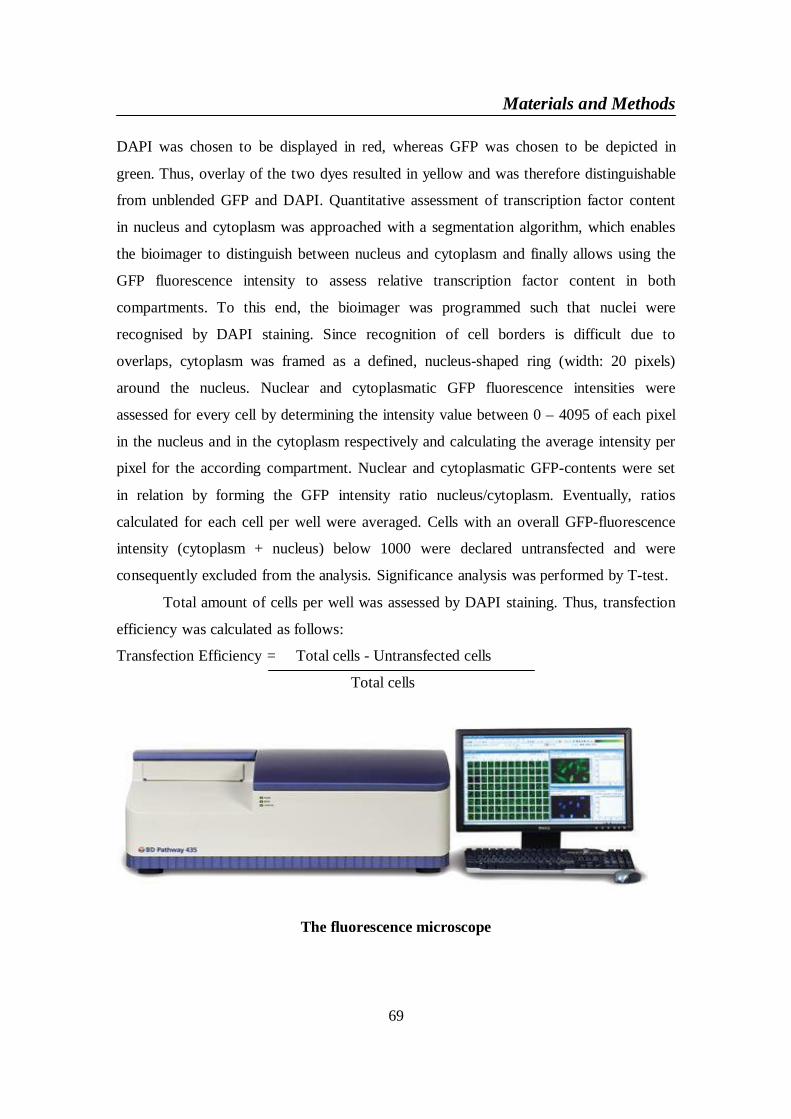
Materials and Methods
69
DAPI was chosen to be displayed in red, whereas GFP was chosen to be depicted in
green. Thus, overlay of the two dyes resulted in yellow and was therefore distinguishable
from unblended GFP and DAPI. Quantitative assessment of transcription factor content
in nucleus and cytoplasm was approached with a segmentation algorithm, which enables
the bioimager to distinguish between nucleus and cytoplasm and finally allows using the
GFP fluorescence intensity to assess relative transcription factor content in both
compartments. To this end, the bioimager was programmed such that nuclei were
recognised by DAPI staining. Since recognition of cell borders is difficult due to
overlaps, cytoplasm was framed as a defined, nucleus-shaped ring (width: 20 pixels)
around the nucleus. Nuclear and cytoplasmatic GFP fluorescence intensities were
assessed for every cell by determining the intensity value between 0 – 4095 of each pixel
in the nucleus and in the cytoplasm respectively and calculating the average intensity per
pixel for the according compartment. Nuclear and cytoplasmatic GFP-contents were set
in relation by forming the GFP intensity ratio nucleus/cytoplasm. Eventually, ratios
calculated for each cell per well were averaged. Cells with an overall GFP-fluorescence
intensity (cytoplasm + nucleus) below 1000 were declared untransfected and were
consequently excluded from the analysis. Significance analysis was performed by T-test.
Total amount of cells per well was assessed by DAPI staining. Thus, transfection
efficiency was calculated as follows:
Transfection Efficiency = Total cells - Untransfected cells
Total cells
The fluorescence microscope
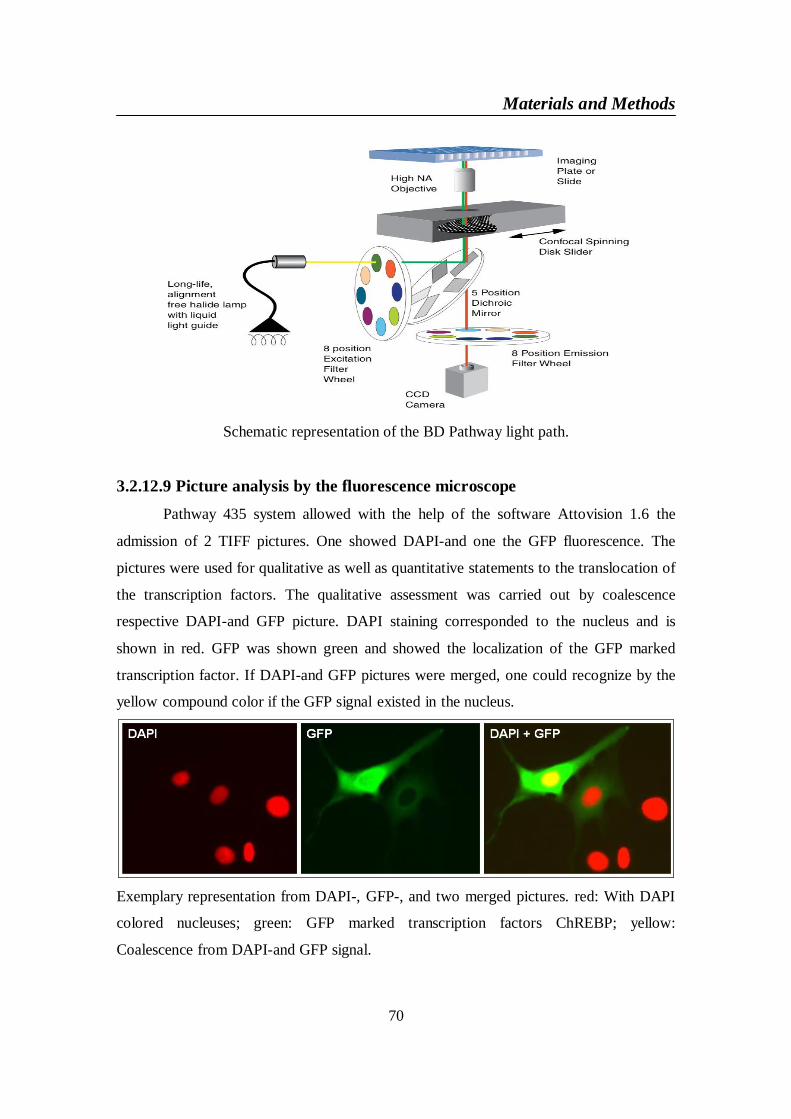
Materials and Methods
70
Schematic representation of the BD Pathway light path.
3.2.12.9 Picture analysis by the fluorescence microscopePathway 435 system allowed with the help of the software Attovision 1.6 the
admission of 2 TIFF pictures. One showed DAPI-and one the GFP fluorescence. The
pictures were used for qualitative as well as quantitative statements to the translocation of
the transcription factors. The qualitative assessment was carried out by coalescence
respective DAPI-and GFP picture. DAPI staining corresponded to the nucleus and is
shown in red. GFP was shown green and showed the localization of the GFP marked
transcription factor. If DAPI-and GFP pictures were merged, one could recognize by the
yellow compound color if the GFP signal existed in the nucleus.
Exemplary representation from DAPI-, GFP-, and two merged pictures. red: With DAPI
colored nucleuses; green: GFP marked transcription factors ChREBP; yellow:
Coalescence from DAPI-and GFP signal.
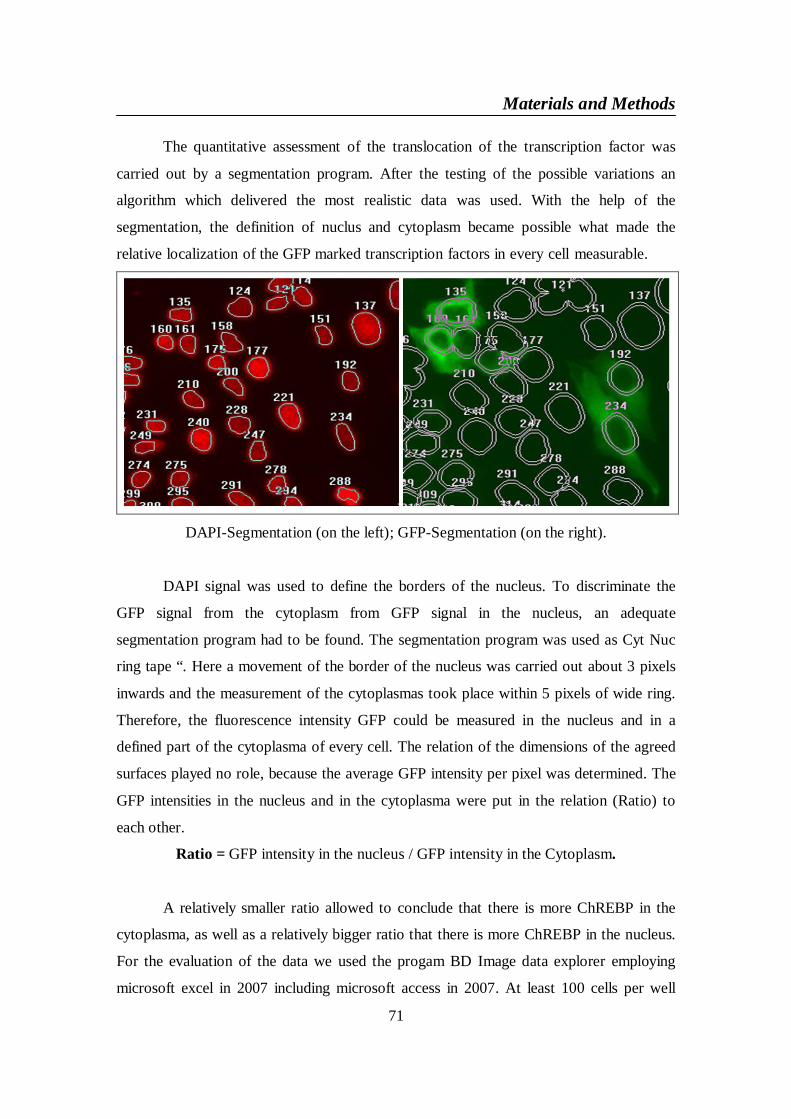
Materials and Methods
71
The quantitative assessment of the translocation of the transcription factor was
carried out by a segmentation program. After the testing of the possible variations an
algorithm which delivered the most realistic data was used. With the help of the
segmentation, the definition of nuclus and cytoplasm became possible what made the
relative localization of the GFP marked transcription factors in every cell measurable.
DAPI-Segmentation (on the left); GFP-Segmentation (on the right).
DAPI signal was used to define the borders of the nucleus. To discriminate the
GFP signal from the cytoplasm from GFP signal in the nucleus, an adequate
segmentation program had to be found. The segmentation program was used as Cyt Nuc
ring tape “. Here a movement of the border of the nucleus was carried out about 3 pixels
inwards and the measurement of the cytoplasmas took place within 5 pixels of wide ring.
Therefore, the fluorescence intensity GFP could be measured in the nucleus and in a
defined part of the cytoplasma of every cell. The relation of the dimensions of the agreed
surfaces played no role, because the average GFP intensity per pixel was determined. The
GFP intensities in the nucleus and in the cytoplasma were put in the relation (Ratio) to
each other.
Ratio = GFP intensity in the nucleus / GFP intensity in the Cytoplasm.
A relatively smaller ratio allowed to conclude that there is more ChREBP in the
cytoplasma, as well as a relatively bigger ratio that there is more ChREBP in the nucleus.
For the evaluation of the data we used the progam BD Image data explorer employing
microsoft excel in 2007 including microsoft access in 2007. At least 100 cells per well
Materials and Methods
72
were evaluated and the average of the ratios was determined. If the sum of the GFP
intensities was in the nucleus and cytoplasma smaller than 1000 these cells were not
evaluated as transfected and were excluded from the calculation.
3.2.12.10 Glucose and insulin stimulation
Around the effect of high glucose and insulin on the translocation of the
transcription factor (ChREBP). After 5 h of the transfection DNA / lipofectamin (1: 2.5)
in HUH7, HepG2 and U2OS the Medium was changed to DMEM containing 5 mM
Glucose and 2% FCS. Next morning cells were on starvation with 5mM Glucose and 0%
FCS for 1 h and then stimulated with 25mM Glucose and 100 nM Insulin for 2 hours.
Finally, cells were fixed and analyzed fluorescence microscope.
3.2.12.11 The effect of sweeteners on the translocation of h.ChREBPFructose, aspartame, natrium cyclamate, saccharin and stevioside were used at
different concentrations with or without insulin as following:
Fructose 5mM 25mM
Aspartame, Cyclamate, Saccharin 0.1mM 1mM
Stevioside 10µM 100µM
3.2.12.12 The effect of PUFAs on the translocation of h.ChREBP
Docosahexaenoic, Eicosapentaenoic, Linoleic, Oleic acid and Oleuropein were
purchased from Sigma Aldrich at 99% concentration. We prepared 52.8 mM PUFAs by
dissolving in NaOH 50 mM. BSA was arrived as 30% solution (4.5mM), we prepared
1.1 and 0.825 mM BSA by dissolving in water.
1 part PUFAs (52.8mM) + 3 parts BSA (1.1mM) = Ratio PUFAs / BSA =16 First stock
1 part first stock + 3 parts BSA (0.825mM) =Ratio PUFAs / BSA = 4 Second stock
we used 0.825 mM BSA to prepare the second stock because the final concentration of
BSA after adding the PUFAs in first stock became 0.825mM.
For experiments using PUFAs, the cells were transfected for 5 h then the Medium
was changed to DMEM containing 5 mM Glucose and 2% FCS overnight. Cells were
starvated with 5mM Glucose and 0% FCS for 1 h then the medium was changed to a
serum-free medium containing 25 mM glucose, 100 nM insulin, and different
concentration of albumin-bound oleate [C18:1 (n-9)], linoleate [C18:2 (n-6)], EPA
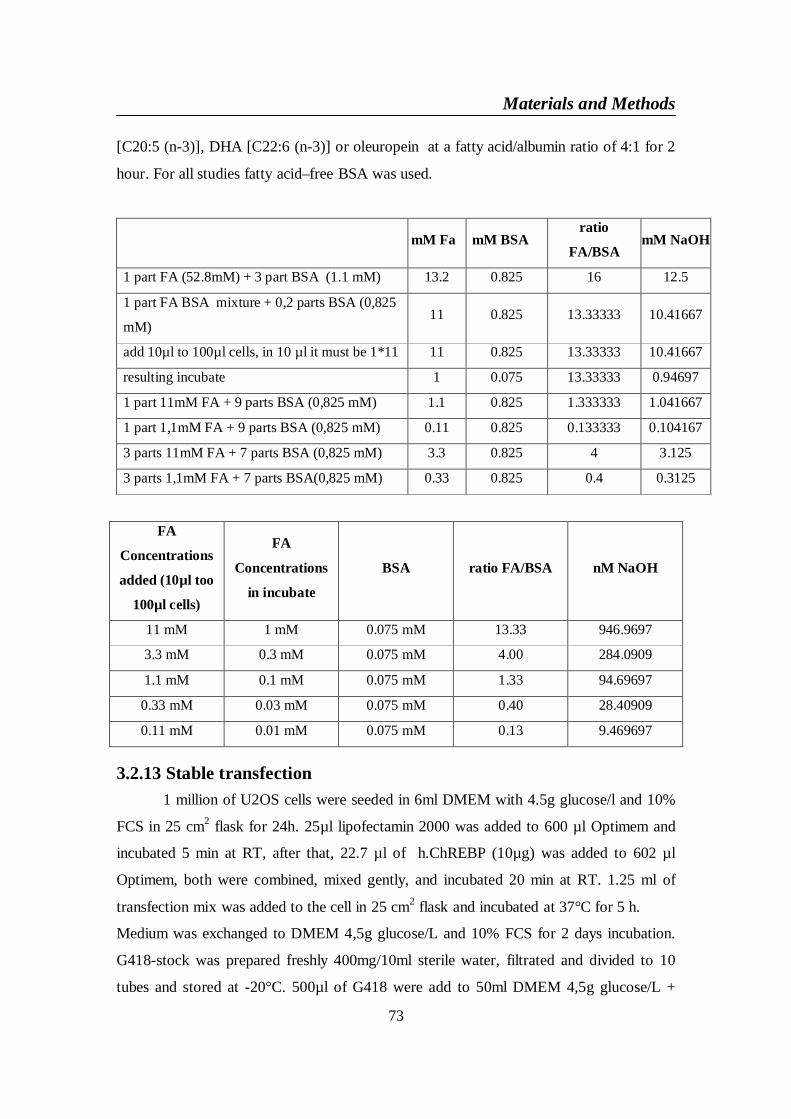
Materials and Methods
73
[C20:5 (n-3)], DHA [C22:6 (n-3)] or oleuropein at a fatty acid/albumin ratio of 4:1 for 2
hour. For all studies fatty acid–free BSA was used.
mM Fa mM BSAratio
FA/BSAmM NaOH
1 part FA (52.8mM) + 3 part BSA (1.1 mM) 13.2 0.825 16 12.5
1 part FA BSA mixture + 0,2 parts BSA (0,825
mM)11 0.825 13.33333 10.41667
add 10µl to 100µl cells, in 10 µl it must be 1*11 11 0.825 13.33333 10.41667
resulting incubate 1 0.075 13.33333 0.94697
1 part 11mM FA + 9 parts BSA (0,825 mM) 1.1 0.825 1.333333 1.041667
1 part 1,1mM FA + 9 parts BSA (0,825 mM) 0.11 0.825 0.133333 0.104167
3 parts 11mM FA + 7 parts BSA (0,825 mM) 3.3 0.825 4 3.125
3 parts 1,1mM FA + 7 parts BSA(0,825 mM) 0.33 0.825 0.4 0.3125
FA
Concentrations
added (10µl too
100µl cells)
FA
Concentrations
in incubate
BSA ratio FA/BSA nM NaOH
11 mM 1 mM 0.075 mM 13.33 946.9697
3.3 mM 0.3 mM 0.075 mM 4.00 284.0909
1.1 mM 0.1 mM 0.075 mM 1.33 94.69697
0.33 mM 0.03 mM 0.075 mM 0.40 28.40909
0.11 mM 0.01 mM 0.075 mM 0.13 9.469697
3.2.13 Stable transfection1 million of U2OS cells were seeded in 6ml DMEM with 4.5g glucose/l and 10%
FCS in 25 cm2 flask for 24h. 25µl lipofectamin 2000 was added to 600 µl Optimem and
incubated 5 min at RT, after that, 22.7 µl of h.ChREBP (10µg) was added to 602 µl
Optimem, both were combined, mixed gently, and incubated 20 min at RT. 1.25 ml of
transfection mix was added to the cell in 25 cm2 flask and incubated at 37°C for 5 h.
Medium was exchanged to DMEM 4,5g glucose/L and 10% FCS for 2 days incubation.
G418-stock was prepared freshly 400mg/10ml sterile water, filtrated and divided to 10
tubes and stored at -20°C. 500µl of G418 were add to 50ml DMEM 4,5g glucose/L +
Materials and Methods
74
FCS10% . The medium exchanged to DMEM+10%FCS+400µg/ml G418 for 3 days two
times. After 7 days, splitting and dilution of by G418 selected cells was done by
trypsination Cells were seeded in 100µl DMEM+10% FCS+400µg/ml G418 per well in a
96 well plate. The medium was exchanged to DMEM+10%FCS+400µg/ml G418 every 3
days. Some wells in the 96-well plate appeared about 80% confluent. Those cells were
trypsinized with each 20µl Tryp-LE for 5min at 37°C, stopped by adding of 150µl
DMEM+10%FCS+G418 400µg/ml, and transfered into 12 well plates with 1ml
DMEM+10%FCS+G418. The cells were passaged from 12 wells to 6 wells by adding
250µl Tryp-LE in every well for 5min at 37°C. Then 1 ml medium and centrifugation at
490g for 5 min, resuspension of sedimented cells in each 1ml medium and seeded in 6
well plate which has 1ml of DMEM+10%FCS+G418 400µg/ml. Exchange of medium
with DMEM+10%FCS+400µg/ml G418 every 3 days . 6-well plates were trypsinized
with 500µl Try-LE in every well for 5min at 37°C, 2ml DMEM+FSC 10% add, then
centrifugation at 490g for 5 min, resuspension of sedimented cells in each 5ml
DMEM+10%FCS+G418 400µg/ml for T25-flasks, 100µl transferred in 96-well (coated
plate) for control of GFP after fixation and DAPI-staining.. Cells were fixed, stained with
DAPI and measured with fluorescence microscope. Imaging for Dapi and GFP and make
merge between them had done to select some wells more than 80% density and
transferred these wells from 25 cm2 flasks to 75 cm2 flasks till 80% density. Cells from
75 cm2 Flasks were freezed in Kryo-vials DMEM (4,5g Glucose/L) +20% FCS+10%
DMSO+G418 400µg/ml.
3.2.14 Statistical analysisThe significance of the results was determined in Excel 2007 by means of the
student´s t tests (Paired). The errors bars correspond to the standard error of mean
(SEM). Differences were considered statistically significant at P< 0.05. The statistical
significance between the measurement results of the effect of sweeteners and PUFAs,
were tested by the program PASW statistics 18, general liner model (repeated measure).
Differences were considered statistically significant at P< 0.05.
Results and Discussion
75
4- RESULTS AND DISCUSSIONCarbohydrate-responsive element–binding protein (ChREBP) was shown to play
a pivotal role in the induction of glycolytic and lipogenic genes by glucose (Dentin et al.
2004), (Iizuka et al. 2004) by its capacity to bind to the ChoRE present in promoters of
these target genes (Stoeckman et al. 2004), (Ishii et al. 2004). ChREBP is expressed in
liver and is responsive to the nutritional state (Dentin et al. 2005a). Liver-specific
inhibition of ChREBP improves hepatic steatosis and insulin resistance in obese ob/ob
mice. Since ChREBP cellular localization is a determinant of its functional activity, a
better knowledge of the mechanisms involved in regulating its nucleo-cytoplasmic
shuttling and/or its post-translational activation is crucial in both physiology and
physiopathology (Postic et al. 2007).
First I tried to clone the human ChREBP (NCBI Reference Sequences
NM_032951 and NT_007758.11) in a GFP expression vector by multiple PCRs using
human liver cDNA as template and a set of primer pairs. With this human ChREBP-GFP
vector I wanted to test the influence of the different dietary elements on the activation
and translocation of human ChREBP from cytoplasm to the nucleus.
Second, I tried to test the influence of the different dietary elements on the
translocation of mouse GFP-ChREBP. The vector encoding for GFP-ChREBP was
kindly provided by Ms. Catherine Postic, Insitut Cochin, Département d’ Endocrinologie,
Métabolisme et Cancer, Université Paris Descartes, Paris, France. The murine full-
length wild-type ChREBP- isoform (GenBank accession no: AF245475) has been
cloned into pEGFP-C1 from Clontech (Dentin et al. 2005a) and sent to us as a drop on
filter paper.
Third, I used human ChREBP, TrueORF cDNA Clones and Precision Shuttle
Vector. AC, AN GFP vectors and human ChREBP were purchased from Origene
company to construct a human ChREBP-GFP vector. With this construct I tested the
influence of different fatty acids on this regulation which appears to be scarcely
investigated. This signal transduction is of utmost importance for concepts of nutrition. If
hepatic lipogenesis is inhabitable by n3 and n6 fatty acids, their intake should influence
the development of fatty liver. This would be of relevance especially for diabetics with
impaired glucose tolerance. Comparing monounsaturated fatty acids with polyunsaturated
fatty acids, the polyunsaturated fatty acids may be more important. The action of
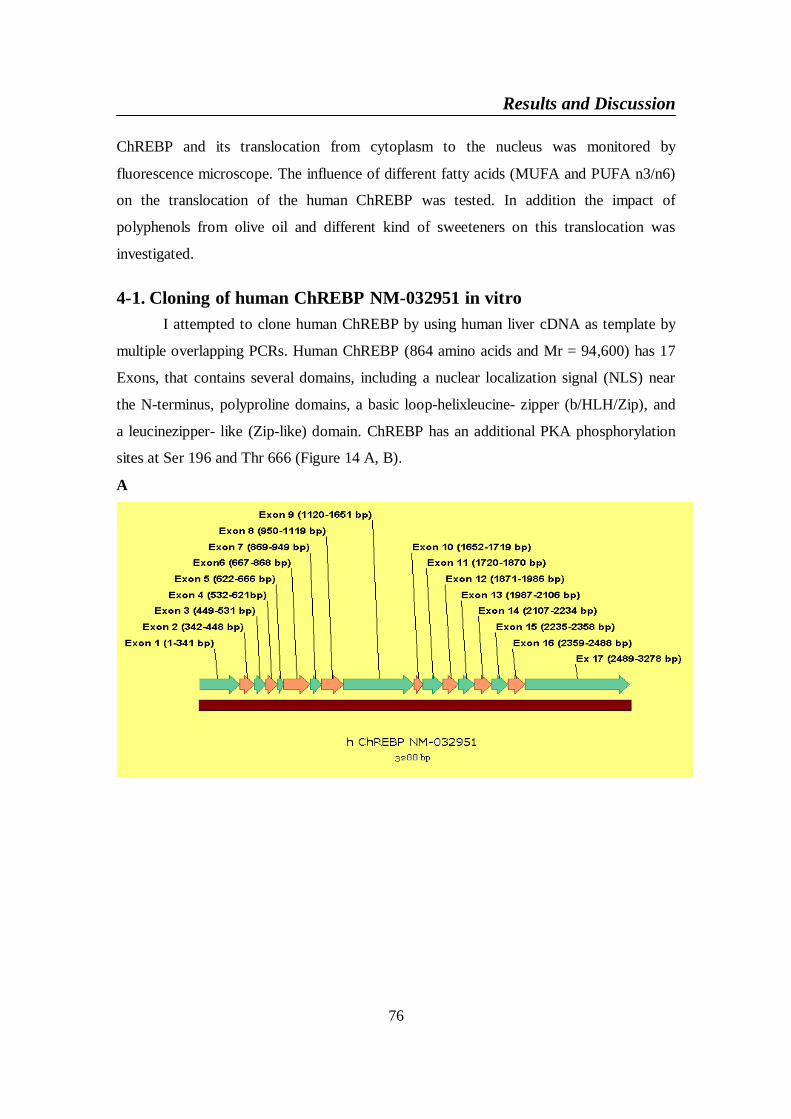
Results and Discussion
76
ChREBP and its translocation from cytoplasm to the nucleus was monitored by
fluorescence microscope. The influence of different fatty acids (MUFA and PUFA n3/n6)
on the translocation of the human ChREBP was tested. In addition the impact of
polyphenols from olive oil and different kind of sweeteners on this translocation was
investigated.
4-1. Cloning of human ChREBP NM-032951 in vitroI attempted to clone human ChREBP by using human liver cDNA as template by
multiple overlapping PCRs. Human ChREBP (864 amino acids and Mr = 94,600) has 17
Exons, that contains several domains, including a nuclear localization signal (NLS) near
the N-terminus, polyproline domains, a basic loop-helixleucine- zipper (b/HLH/Zip), and
a leucinezipper- like (Zip-like) domain. ChREBP has an additional PKA phosphorylation
sites at Ser 196 and Thr 666 (Figure 14 A, B).
A
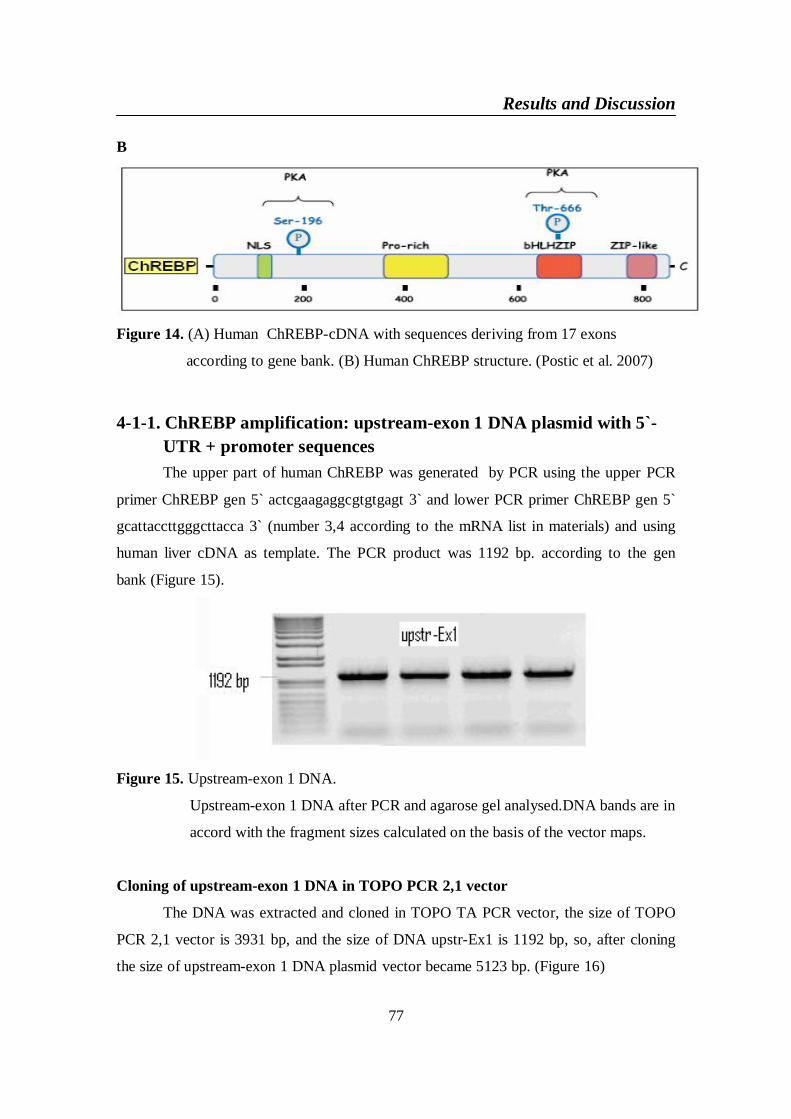
Results and Discussion
77
B
Figure 14. (A) Human ChREBP-cDNA with sequences deriving from 17 exons
according to gene bank. (B) Human ChREBP structure. (Postic et al. 2007)
4-1-1. ChREBP amplification: upstream-exon 1 DNA plasmid with 5`-UTR + promoter sequencesThe upper part of human ChREBP was generated by PCR using the upper PCR
primer ChREBP gen 5` actcgaagaggcgtgtgagt 3` and lower PCR primer ChREBP gen 5`
gcattaccttgggcttacca 3` (number 3,4 according to the mRNA list in materials) and using
human liver cDNA as template. The PCR product was 1192 bp. according to the gen
bank (Figure 15).
Figure 15. Upstream-exon 1 DNA.
Upstream-exon 1 DNA after PCR and agarose gel analysed.DNA bands are in
accord with the fragment sizes calculated on the basis of the vector maps.
Cloning of upstream-exon 1 DNA in TOPO PCR 2,1 vector
The DNA was extracted and cloned in TOPO TA PCR vector, the size of TOPO
PCR 2,1 vector is 3931 bp, and the size of DNA upstr-Ex1 is 1192 bp, so, after cloning
the size of upstream-exon 1 DNA plasmid vector became 5123 bp. (Figure 16)
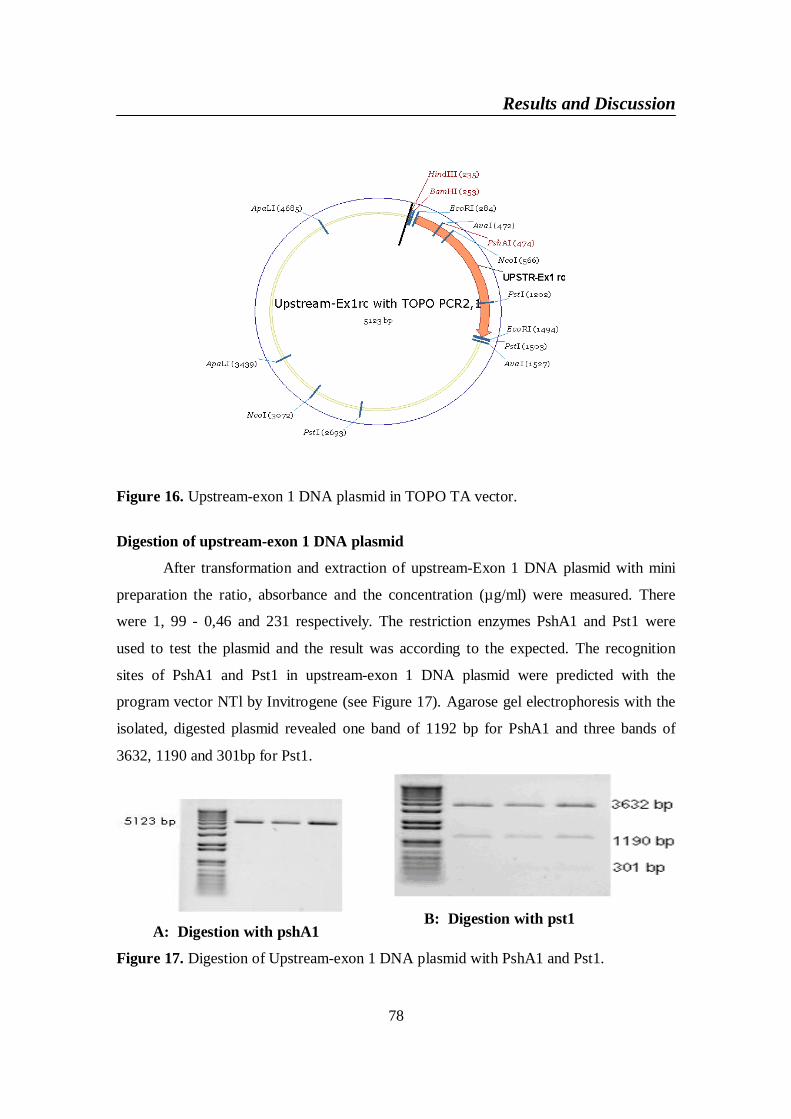
Results and Discussion
78
Figure 16. Upstream-exon 1 DNA plasmid in TOPO TA vector.
Digestion of upstream-exon 1 DNA plasmid
After transformation and extraction of upstream-Exon 1 DNA plasmid with mini
preparation the ratio, absorbance and the concentration (µg/ml) were measured. There
were 1, 99 - 0,46 and 231 respectively. The restriction enzymes PshA1 and Pst1 were
used to test the plasmid and the result was according to the expected. The recognition
sites of PshA1 and Pst1 in upstream-exon 1 DNA plasmid were predicted with the
program vector NTl by Invitrogene (see Figure 17). Agarose gel electrophoresis with the
isolated, digested plasmid revealed one band of 1192 bp for PshA1 and three bands of
3632, 1190 and 301bp for Pst1.
A: Digestion with pshA1 B: Digestion with pst1
Figure 17. Digestion of Upstream-exon 1 DNA plasmid with PshA1 and Pst1.
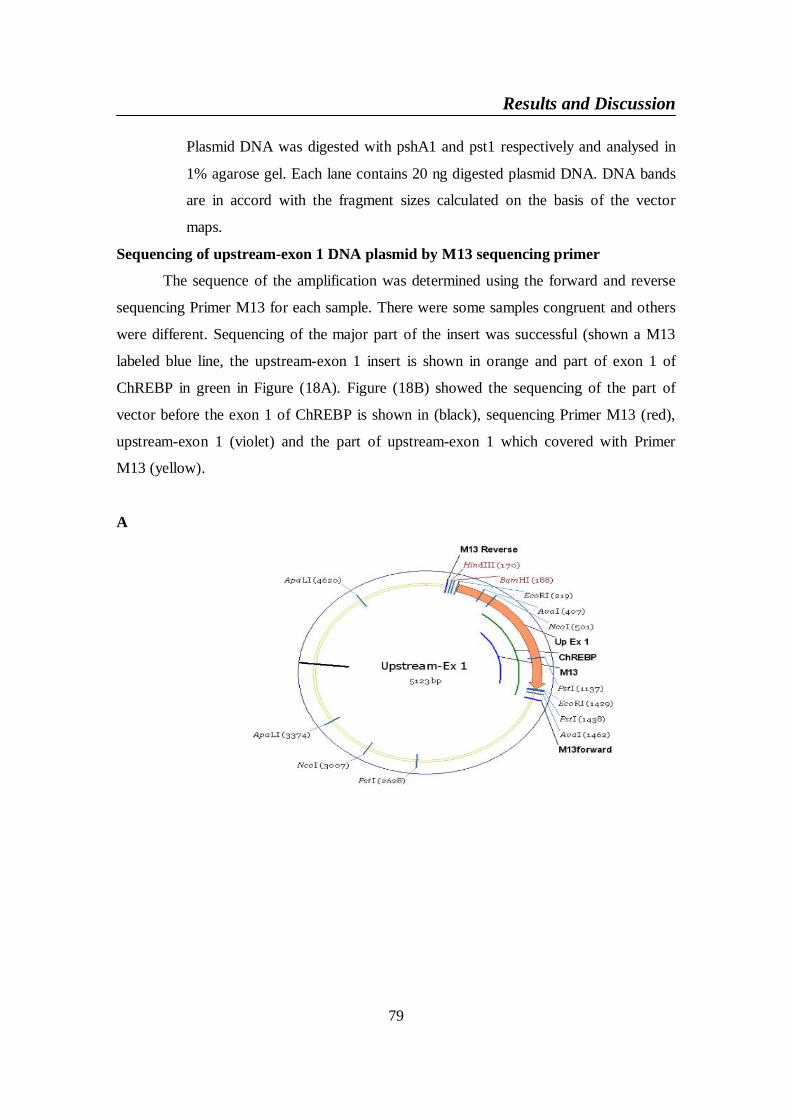
Results and Discussion
79
Plasmid DNA was digested with pshA1 and pst1 respectively and analysed in
1% agarose gel. Each lane contains 20 ng digested plasmid DNA. DNA bands
are in accord with the fragment sizes calculated on the basis of the vector
maps.
Sequencing of upstream-exon 1 DNA plasmid by M13 sequencing primer
The sequence of the amplification was determined using the forward and reverse
sequencing Primer M13 for each sample. There were some samples congruent and others
were different. Sequencing of the major part of the insert was successful (shown a M13
labeled blue line, the upstream-exon 1 insert is shown in orange and part of exon 1 of
ChREBP in green in Figure (18A). Figure (18B) showed the sequencing of the part of
vector before the exon 1 of ChREBP is shown in (black), sequencing Primer M13 (red),
upstream-exon 1 (violet) and the part of upstream-exon 1 which covered with Primer
M13 (yellow).
A
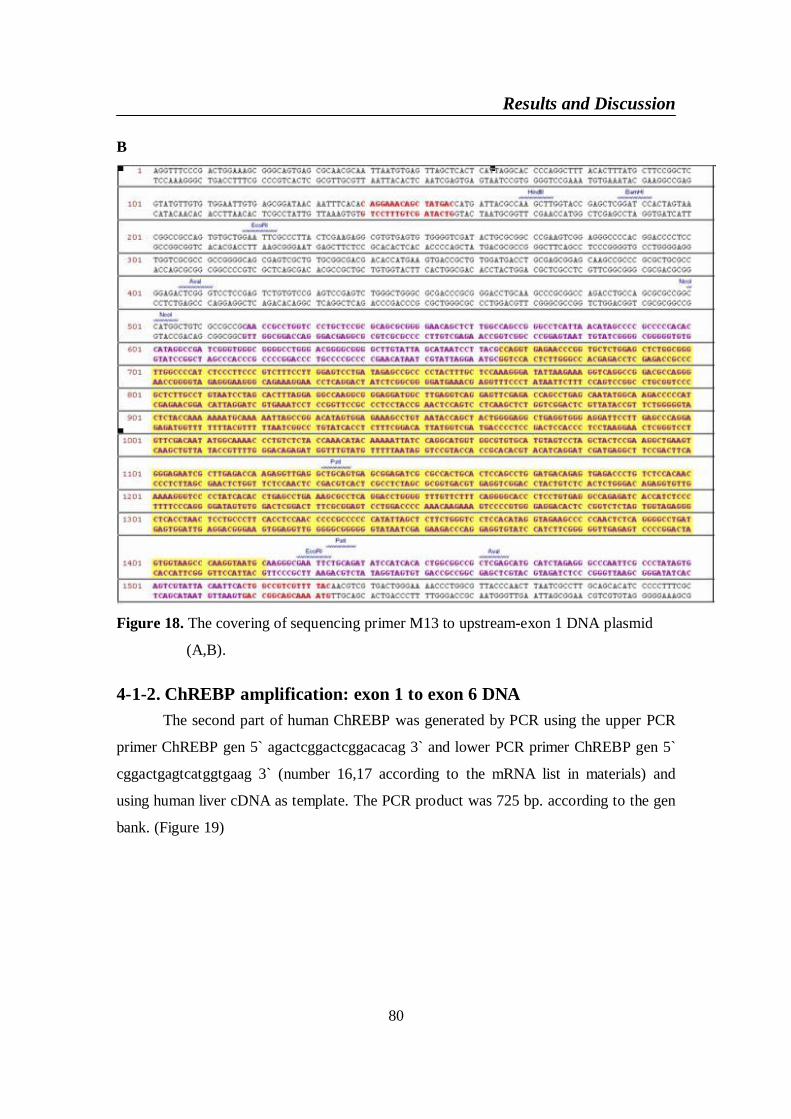
Results and Discussion
80
B
Figure 18. The covering of sequencing primer M13 to upstream-exon 1 DNA plasmid
(A,B).
4-1-2. ChREBP amplification: exon 1 to exon 6 DNAThe second part of human ChREBP was generated by PCR using the upper PCR
primer ChREBP gen 5` agactcggactcggacacag 3` and lower PCR primer ChREBP gen 5`
cggactgagtcatggtgaag 3` (number 16,17 according to the mRNA list in materials) and
using human liver cDNA as template. The PCR product was 725 bp. according to the gen
bank. (Figure 19)
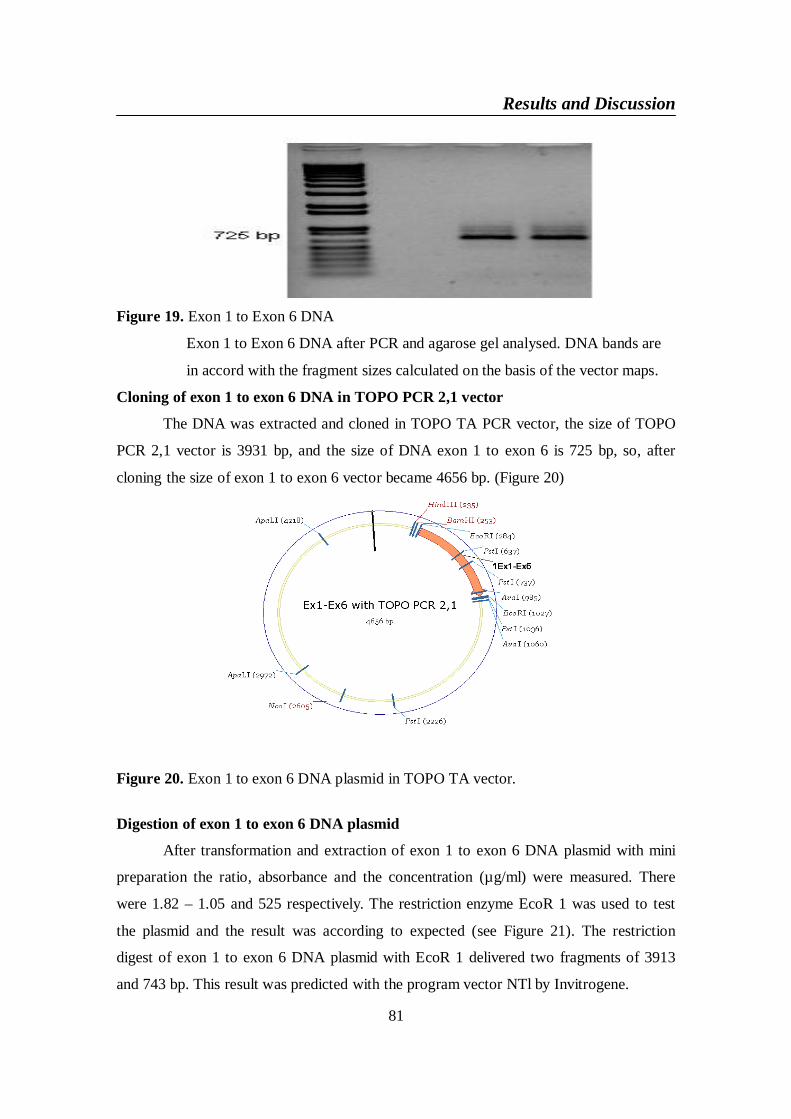
Results and Discussion
81
Figure 19. Exon 1 to Exon 6 DNA
Exon 1 to Exon 6 DNA after PCR and agarose gel analysed. DNA bands are
in accord with the fragment sizes calculated on the basis of the vector maps.
Cloning of exon 1 to exon 6 DNA in TOPO PCR 2,1 vector
The DNA was extracted and cloned in TOPO TA PCR vector, the size of TOPO
PCR 2,1 vector is 3931 bp, and the size of DNA exon 1 to exon 6 is 725 bp, so, after
cloning the size of exon 1 to exon 6 vector became 4656 bp. (Figure 20)
Figure 20. Exon 1 to exon 6 DNA plasmid in TOPO TA vector.
Digestion of exon 1 to exon 6 DNA plasmid
After transformation and extraction of exon 1 to exon 6 DNA plasmid with mini
preparation the ratio, absorbance and the concentration (µg/ml) were measured. There
were 1.82 – 1.05 and 525 respectively. The restriction enzyme EcoR 1 was used to test
the plasmid and the result was according to expected (see Figure 21). The restriction
digest of exon 1 to exon 6 DNA plasmid with EcoR 1 delivered two fragments of 3913
and 743 bp. This result was predicted with the program vector NTl by Invitrogene.
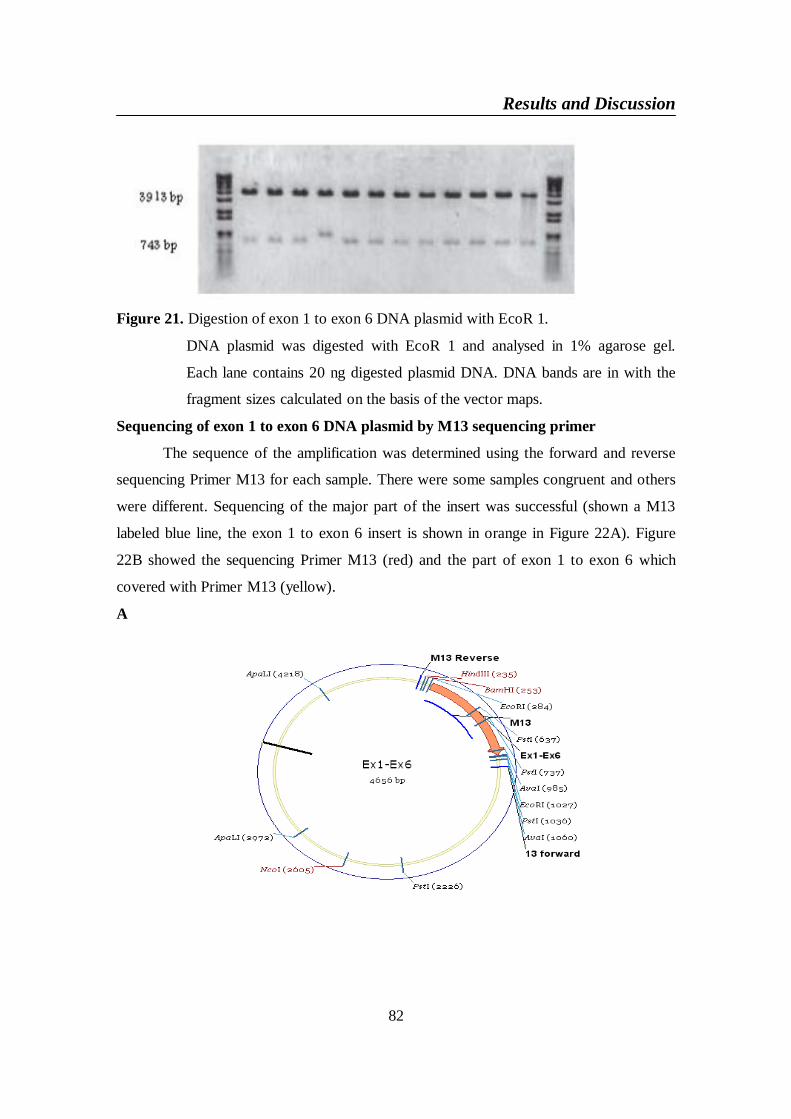
Results and Discussion
82
Figure 21. Digestion of exon 1 to exon 6 DNA plasmid with EcoR 1.
DNA plasmid was digested with EcoR 1 and analysed in 1% agarose gel.
Each lane contains 20 ng digested plasmid DNA. DNA bands are in with the
fragment sizes calculated on the basis of the vector maps.
Sequencing of exon 1 to exon 6 DNA plasmid by M13 sequencing primer
The sequence of the amplification was determined using the forward and reverse
sequencing Primer M13 for each sample. There were some samples congruent and others
were different. Sequencing of the major part of the insert was successful (shown a M13
labeled blue line, the exon 1 to exon 6 insert is shown in orange in Figure 22A). Figure
22B showed the sequencing Primer M13 (red) and the part of exon 1 to exon 6 which
covered with Primer M13 (yellow).
A
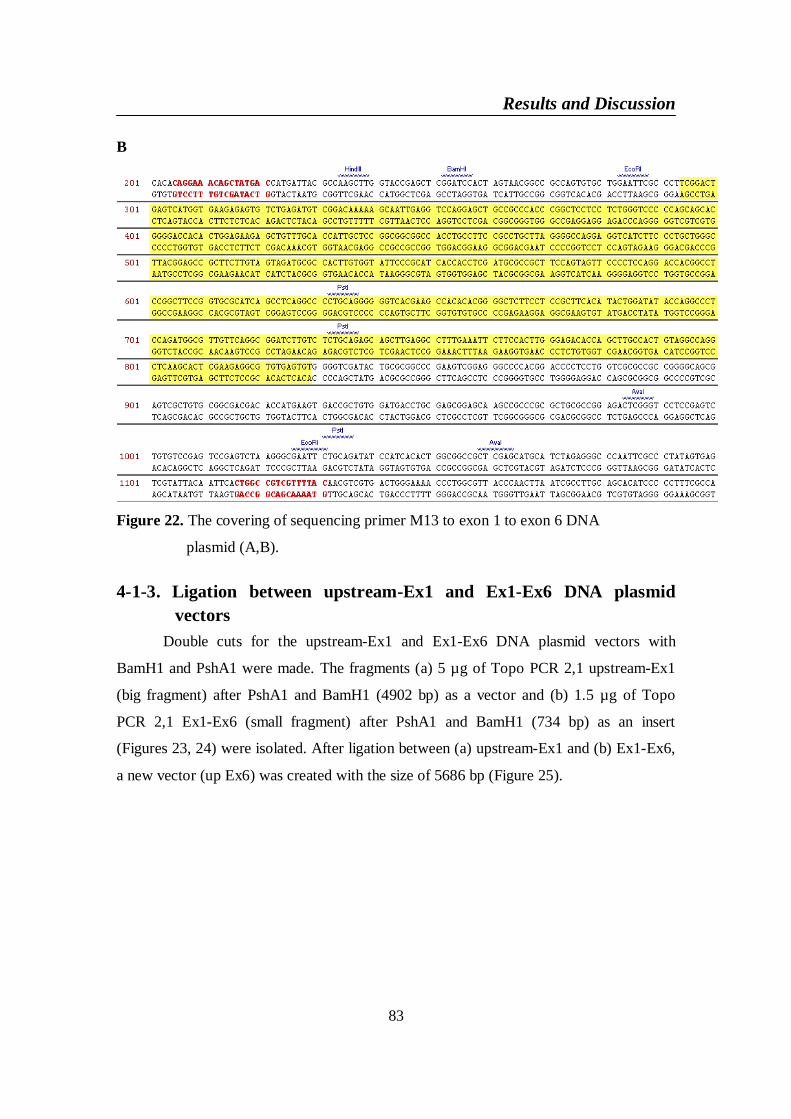
Results and Discussion
83
B
Figure 22. The covering of sequencing primer M13 to exon 1 to exon 6 DNA
plasmid (A,B).
4-1-3. Ligation between upstream-Ex1 and Ex1-Ex6 DNA plasmidvectors
Double cuts for the upstream-Ex1 and Ex1-Ex6 DNA plasmid vectors with
BamH1 and PshA1 were made. The fragments (a) 5 µg of Topo PCR 2,1 upstream-Ex1
(big fragment) after PshA1 and BamH1 (4902 bp) as a vector and (b) 1.5 µg of Topo
PCR 2,1 Ex1-Ex6 (small fragment) after PshA1 and BamH1 (734 bp) as an insert
(Figures 23, 24) were isolated. After ligation between (a) upstream-Ex1 and (b) Ex1-Ex6,
a new vector (up Ex6) was created with the size of 5686 bp (Figure 25).
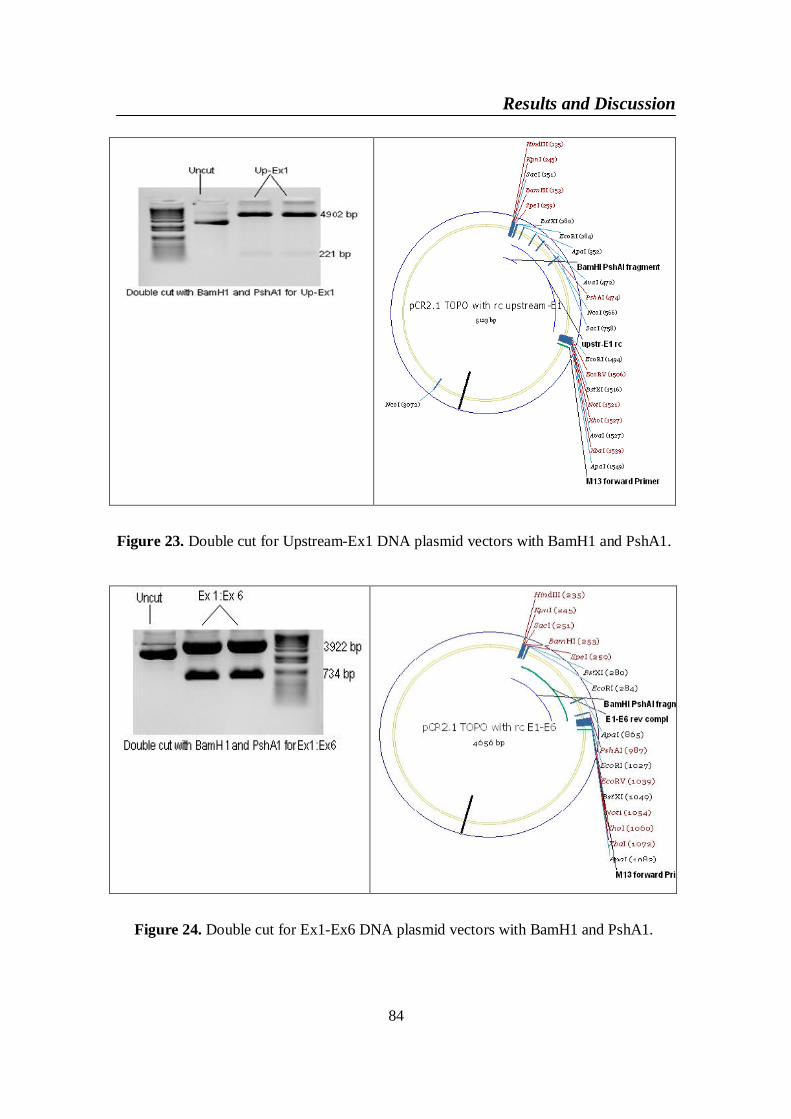
Results and Discussion
84
Figure 23. Double cut for Upstream-Ex1 DNA plasmid vectors with BamH1 and PshA1.
Figure 24. Double cut for Ex1-Ex6 DNA plasmid vectors with BamH1 and PshA1.
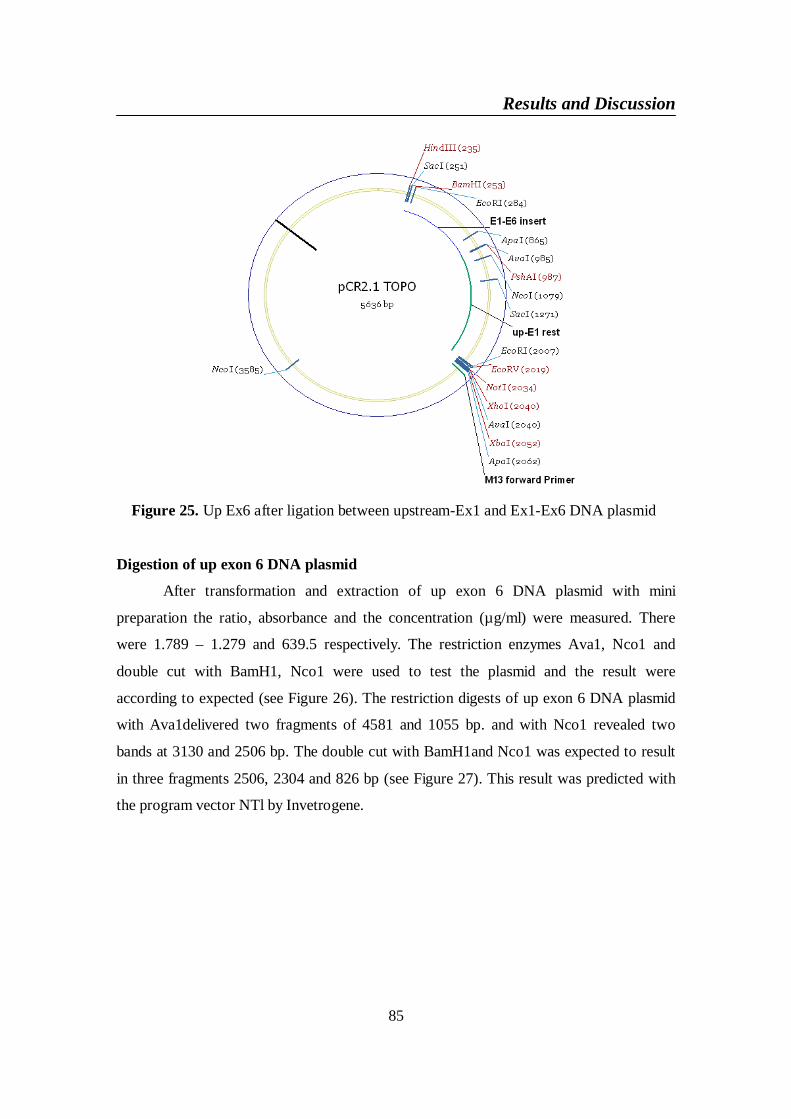
Results and Discussion
85
Figure 25. Up Ex6 after ligation between upstream-Ex1 and Ex1-Ex6 DNA plasmid
Digestion of up exon 6 DNA plasmid
After transformation and extraction of up exon 6 DNA plasmid with mini
preparation the ratio, absorbance and the concentration (µg/ml) were measured. There
were 1.789 – 1.279 and 639.5 respectively. The restriction enzymes Ava1, Nco1 and
double cut with BamH1, Nco1 were used to test the plasmid and the result were
according to expected (see Figure 26). The restriction digests of up exon 6 DNA plasmid
with Ava1delivered two fragments of 4581 and 1055 bp. and with Nco1 revealed two
bands at 3130 and 2506 bp. The double cut with BamH1and Nco1 was expected to result
in three fragments 2506, 2304 and 826 bp (see Figure 27). This result was predicted with
the program vector NTl by Invetrogene.
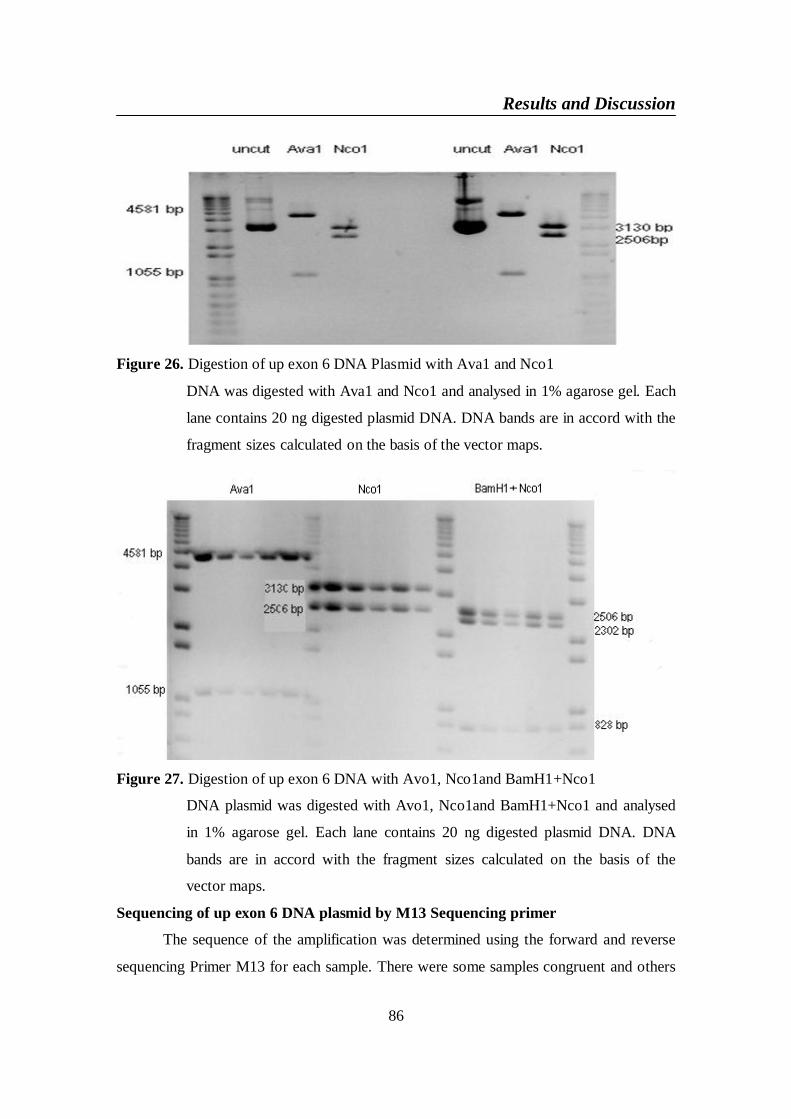
Results and Discussion
86
Figure 26. Digestion of up exon 6 DNA Plasmid with Ava1 and Nco1
DNA was digested with Ava1 and Nco1 and analysed in 1% agarose gel. Each
lane contains 20 ng digested plasmid DNA. DNA bands are in accord with the
fragment sizes calculated on the basis of the vector maps.
Figure 27. Digestion of up exon 6 DNA with Avo1, Nco1and BamH1+Nco1
DNA plasmid was digested with Avo1, Nco1and BamH1+Nco1 and analysed
in 1% agarose gel. Each lane contains 20 ng digested plasmid DNA. DNA
bands are in accord with the fragment sizes calculated on the basis of the
vector maps.
Sequencing of up exon 6 DNA plasmid by M13 Sequencing primer
The sequence of the amplification was determined using the forward and reverse
sequencing Primer M13 for each sample. There were some samples congruent and others
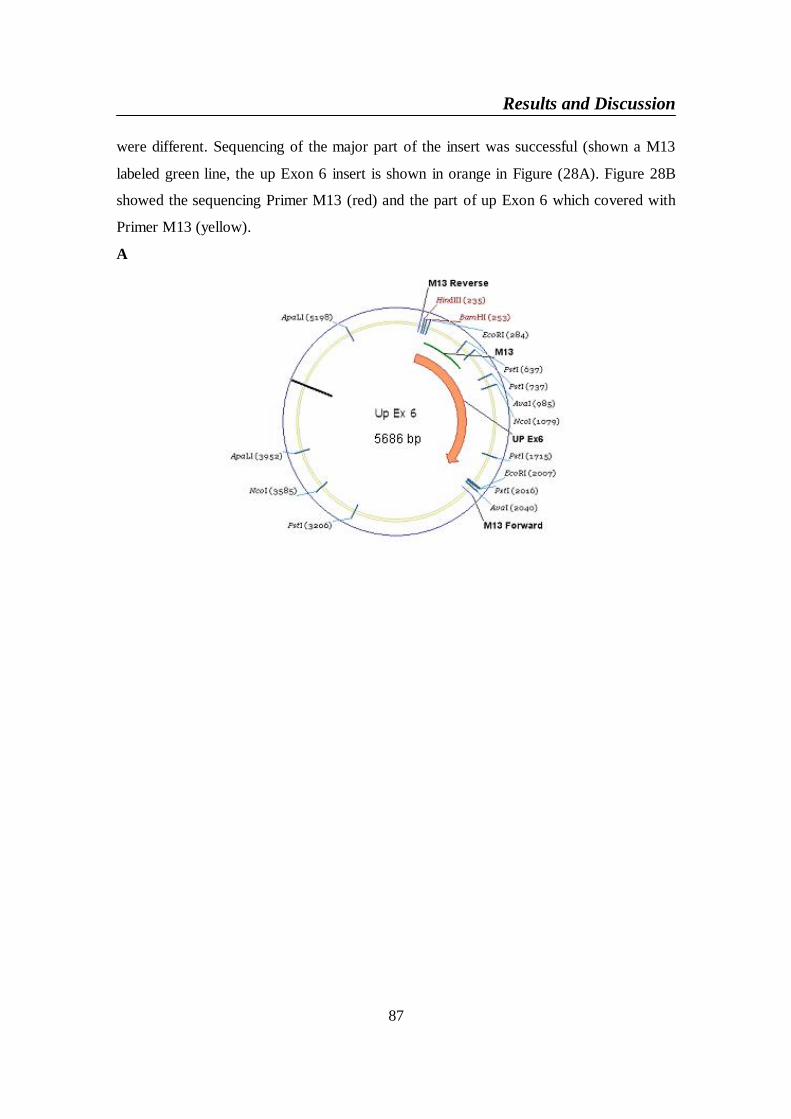
Results and Discussion
87
were different. Sequencing of the major part of the insert was successful (shown a M13
labeled green line, the up Exon 6 insert is shown in orange in Figure (28A). Figure 28B
showed the sequencing Primer M13 (red) and the part of up Exon 6 which covered with
Primer M13 (yellow).
A
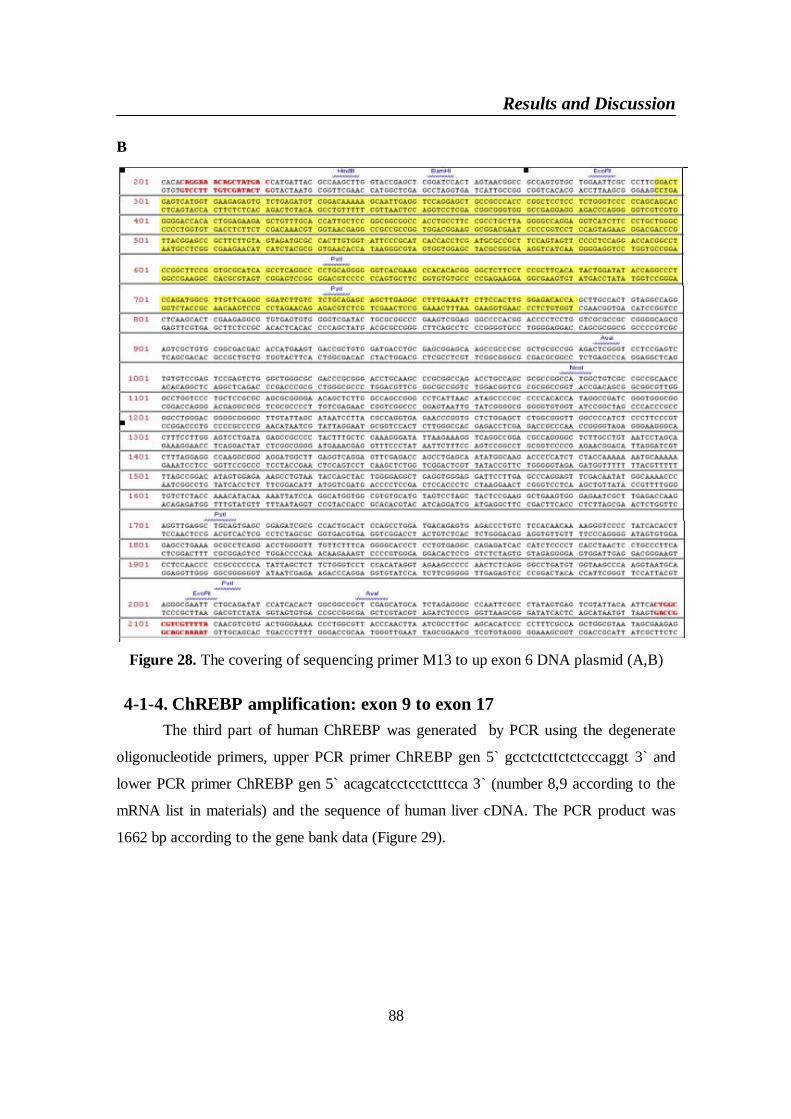
Results and Discussion
88
B
Figure 28. The covering of sequencing primer M13 to up exon 6 DNA plasmid (A,B)
4-1-4. ChREBP amplification: exon 9 to exon 17The third part of human ChREBP was generated by PCR using the degenerate
oligonucleotide primers, upper PCR primer ChREBP gen 5` gcctctcttctctcccaggt 3` and
lower PCR primer ChREBP gen 5` acagcatcctcctctttcca 3` (number 8,9 according to the
mRNA list in materials) and the sequence of human liver cDNA. The PCR product was
1662 bp according to the gene bank data (Figure 29).
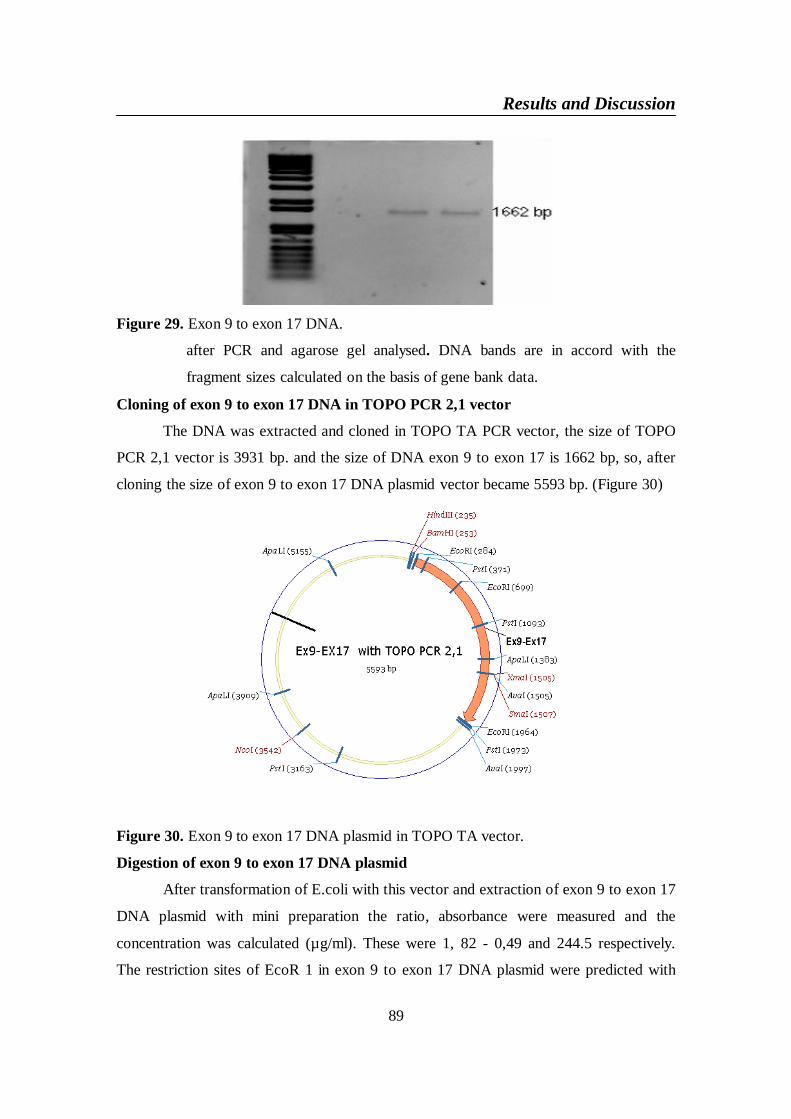
Results and Discussion
89
Figure 29. Exon 9 to exon 17 DNA.
after PCR and agarose gel analysed. DNA bands are in accord with the
fragment sizes calculated on the basis of gene bank data.
Cloning of exon 9 to exon 17 DNA in TOPO PCR 2,1 vector
The DNA was extracted and cloned in TOPO TA PCR vector, the size of TOPO
PCR 2,1 vector is 3931 bp. and the size of DNA exon 9 to exon 17 is 1662 bp, so, after
cloning the size of exon 9 to exon 17 DNA plasmid vector became 5593 bp. (Figure 30)
Figure 30. Exon 9 to exon 17 DNA plasmid in TOPO TA vector.
Digestion of exon 9 to exon 17 DNA plasmid
After transformation of E.coli with this vector and extraction of exon 9 to exon 17
DNA plasmid with mini preparation the ratio, absorbance were measured and the
concentration was calculated (µg/ml). These were 1, 82 - 0,49 and 244.5 respectively.
The restriction sites of EcoR 1 in exon 9 to exon 17 DNA plasmid were predicted with
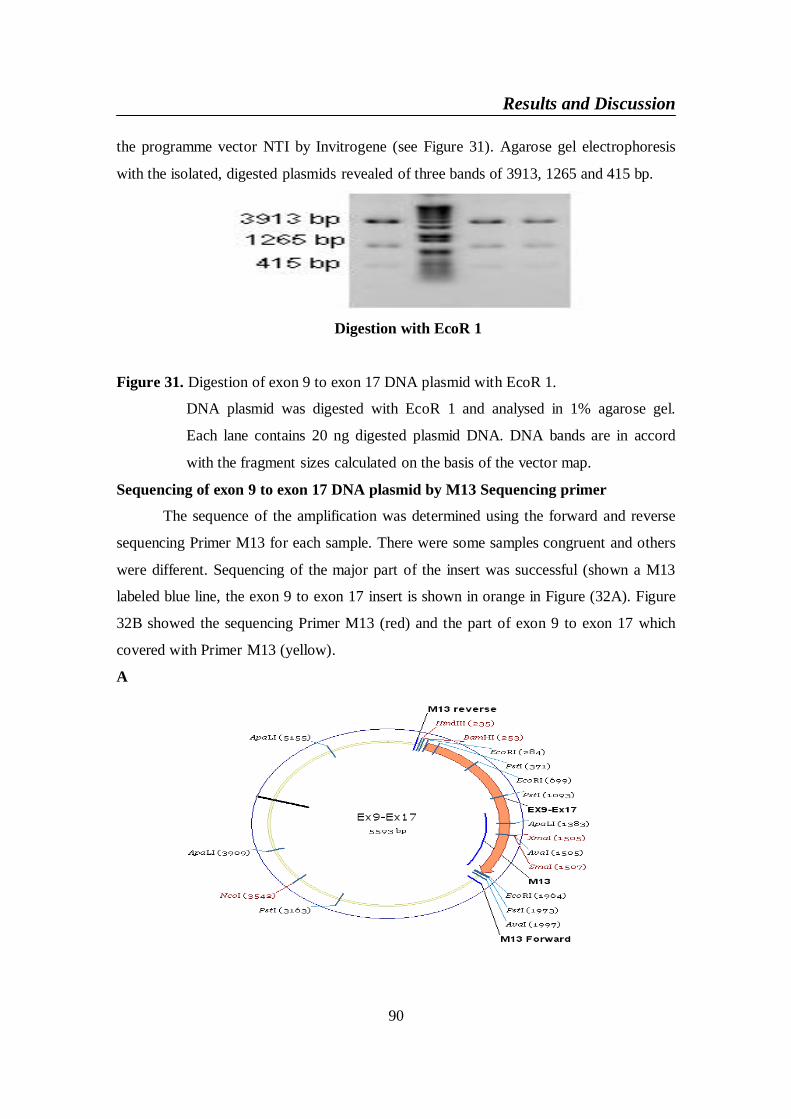
Results and Discussion
90
the programme vector NTI by Invitrogene (see Figure 31). Agarose gel electrophoresis
with the isolated, digested plasmids revealed of three bands of 3913, 1265 and 415 bp.
Figure 31. Digestion of exon 9 to exon 17 DNA plasmid with EcoR 1.
DNA plasmid was digested with EcoR 1 and analysed in 1% agarose gel.
Each lane contains 20 ng digested plasmid DNA. DNA bands are in accord
with the fragment sizes calculated on the basis of the vector map.
Sequencing of exon 9 to exon 17 DNA plasmid by M13 Sequencing primer
The sequence of the amplification was determined using the forward and reverse
sequencing Primer M13 for each sample. There were some samples congruent and others
were different. Sequencing of the major part of the insert was successful (shown a M13
labeled blue line, the exon 9 to exon 17 insert is shown in orange in Figure (32A). Figure
32B showed the sequencing Primer M13 (red) and the part of exon 9 to exon 17 which
covered with Primer M13 (yellow).
A
Digestion with EcoR 1
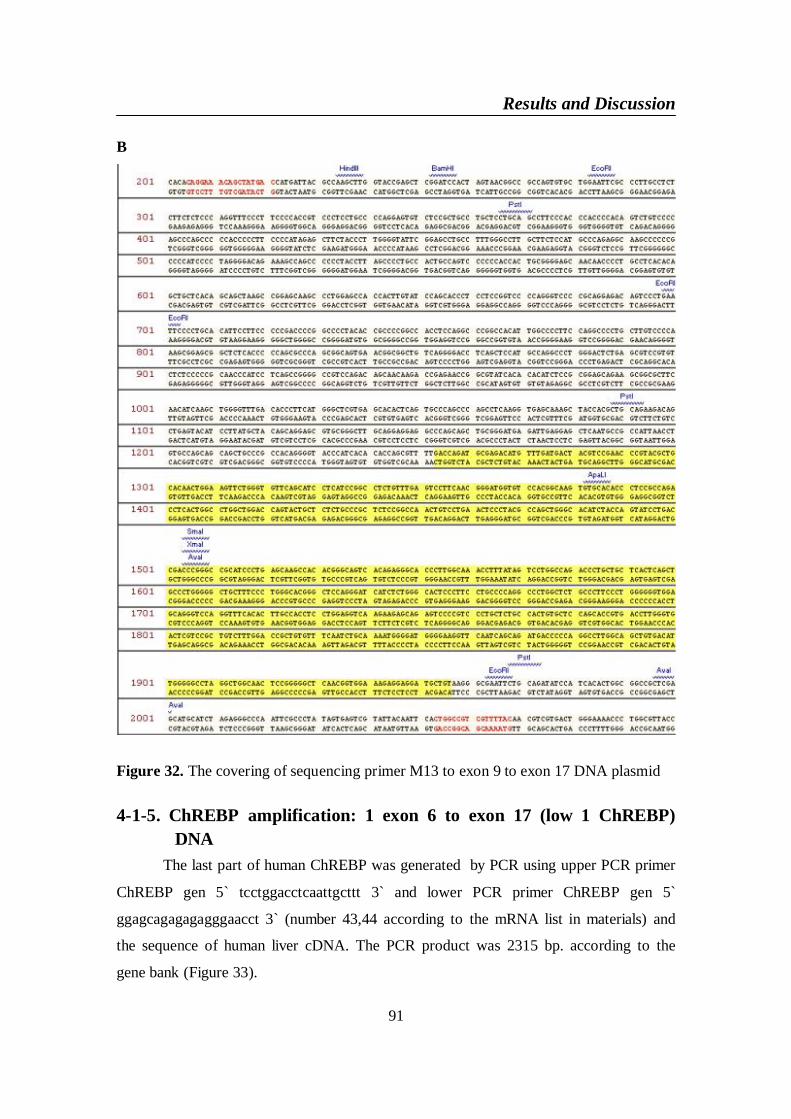
Results and Discussion
91
B
Figure 32. The covering of sequencing primer M13 to exon 9 to exon 17 DNA plasmid
4-1-5. ChREBP amplification: 1 exon 6 to exon 17 (low 1 ChREBP)DNA
The last part of human ChREBP was generated by PCR using upper PCR primer
ChREBP gen 5` tcctggacctcaattgcttt 3` and lower PCR primer ChREBP gen 5`
ggagcagagagagggaacct 3` (number 43,44 according to the mRNA list in materials) and
the sequence of human liver cDNA. The PCR product was 2315 bp. according to the
gene bank (Figure 33).
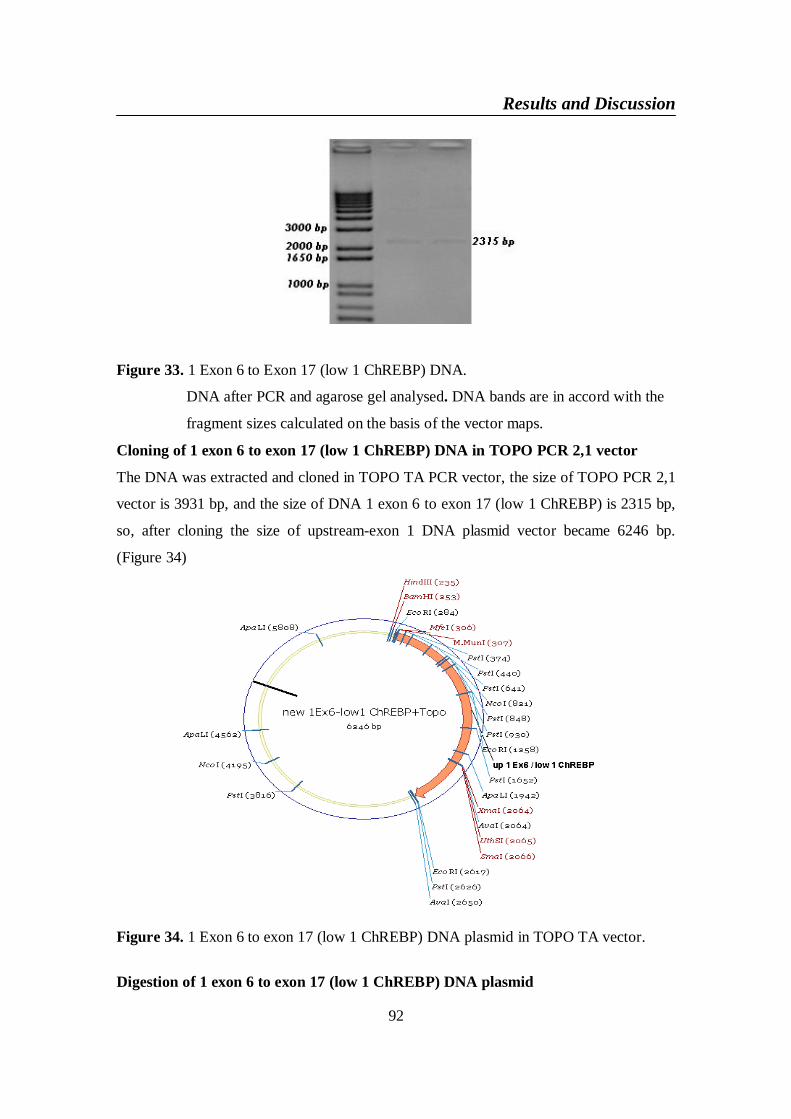
Results and Discussion
92
Figure 33. 1 Exon 6 to Exon 17 (low 1 ChREBP) DNA.
DNA after PCR and agarose gel analysed. DNA bands are in accord with the
fragment sizes calculated on the basis of the vector maps.
Cloning of 1 exon 6 to exon 17 (low 1 ChREBP) DNA in TOPO PCR 2,1 vector
The DNA was extracted and cloned in TOPO TA PCR vector, the size of TOPO PCR 2,1
vector is 3931 bp, and the size of DNA 1 exon 6 to exon 17 (low 1 ChREBP) is 2315 bp,
so, after cloning the size of upstream-exon 1 DNA plasmid vector became 6246 bp.
(Figure 34)
Figure 34. 1 Exon 6 to exon 17 (low 1 ChREBP) DNA plasmid in TOPO TA vector.
Digestion of 1 exon 6 to exon 17 (low 1 ChREBP) DNA plasmid
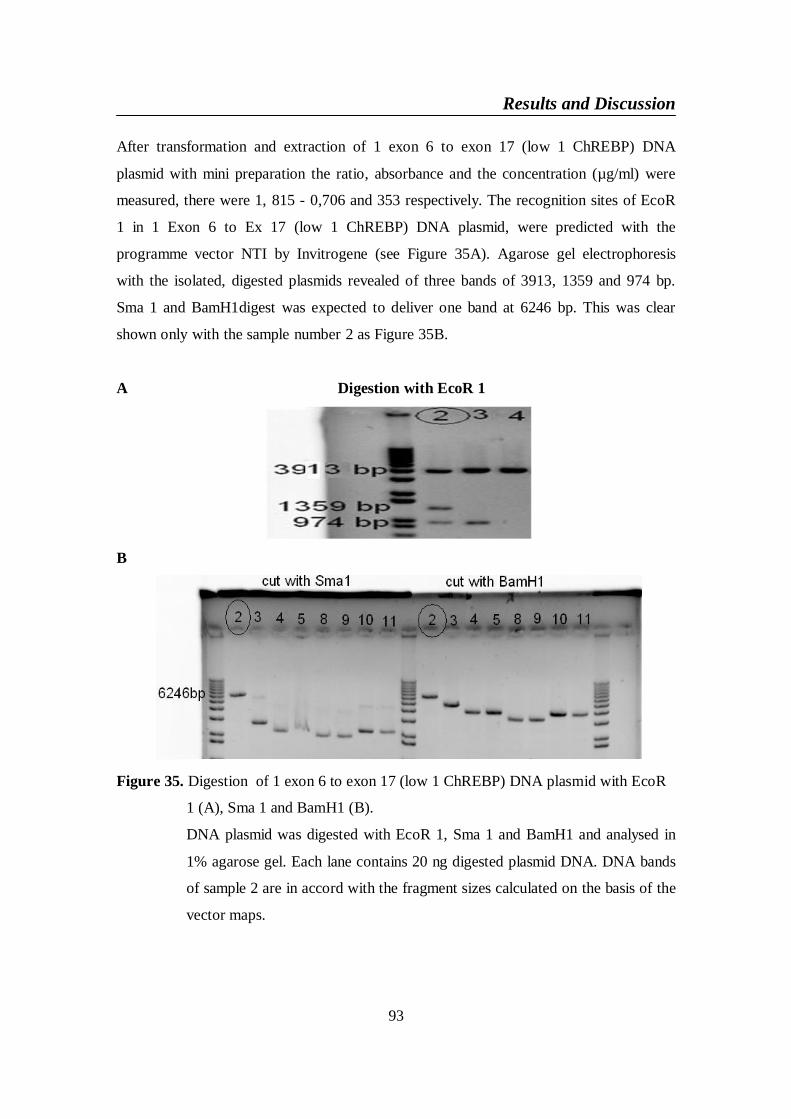
Results and Discussion
93
After transformation and extraction of 1 exon 6 to exon 17 (low 1 ChREBP) DNA
plasmid with mini preparation the ratio, absorbance and the concentration (µg/ml) were
measured, there were 1, 815 - 0,706 and 353 respectively. The recognition sites of EcoR
1 in 1 Exon 6 to Ex 17 (low 1 ChREBP) DNA plasmid, were predicted with the
programme vector NTI by Invitrogene (see Figure 35A). Agarose gel electrophoresis
with the isolated, digested plasmids revealed of three bands of 3913, 1359 and 974 bp.
Sma 1 and BamH1digest was expected to deliver one band at 6246 bp. This was clear
shown only with the sample number 2 as Figure 35B.
Figure 35. Digestion of 1 exon 6 to exon 17 (low 1 ChREBP) DNA plasmid with EcoR
1 (A), Sma 1 and BamH1 (B).
DNA plasmid was digested with EcoR 1, Sma 1 and BamH1 and analysed in
1% agarose gel. Each lane contains 20 ng digested plasmid DNA. DNA bands
of sample 2 are in accord with the fragment sizes calculated on the basis of the
vector maps.
A Digestion with EcoR 1
B
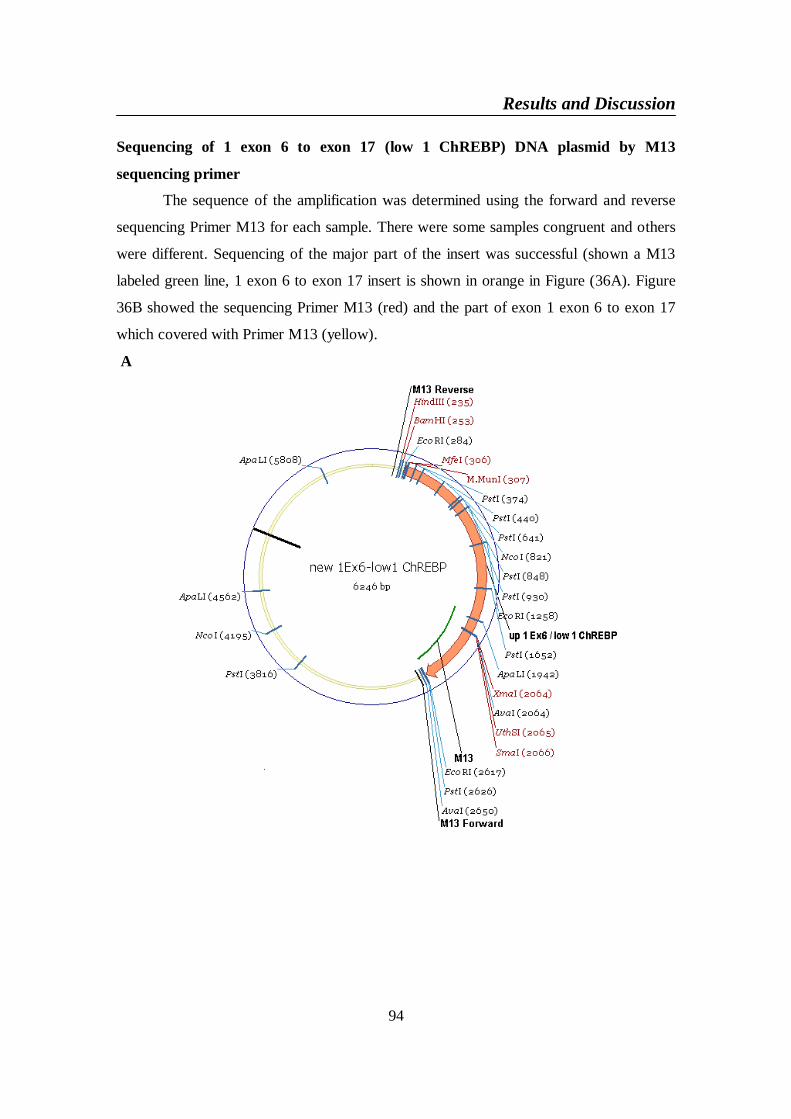
Results and Discussion
94
Sequencing of 1 exon 6 to exon 17 (low 1 ChREBP) DNA plasmid by M13
sequencing primer
The sequence of the amplification was determined using the forward and reverse
sequencing Primer M13 for each sample. There were some samples congruent and others
were different. Sequencing of the major part of the insert was successful (shown a M13
labeled green line, 1 exon 6 to exon 17 insert is shown in orange in Figure (36A). Figure
36B showed the sequencing Primer M13 (red) and the part of exon 1 exon 6 to exon 17
which covered with Primer M13 (yellow).
A
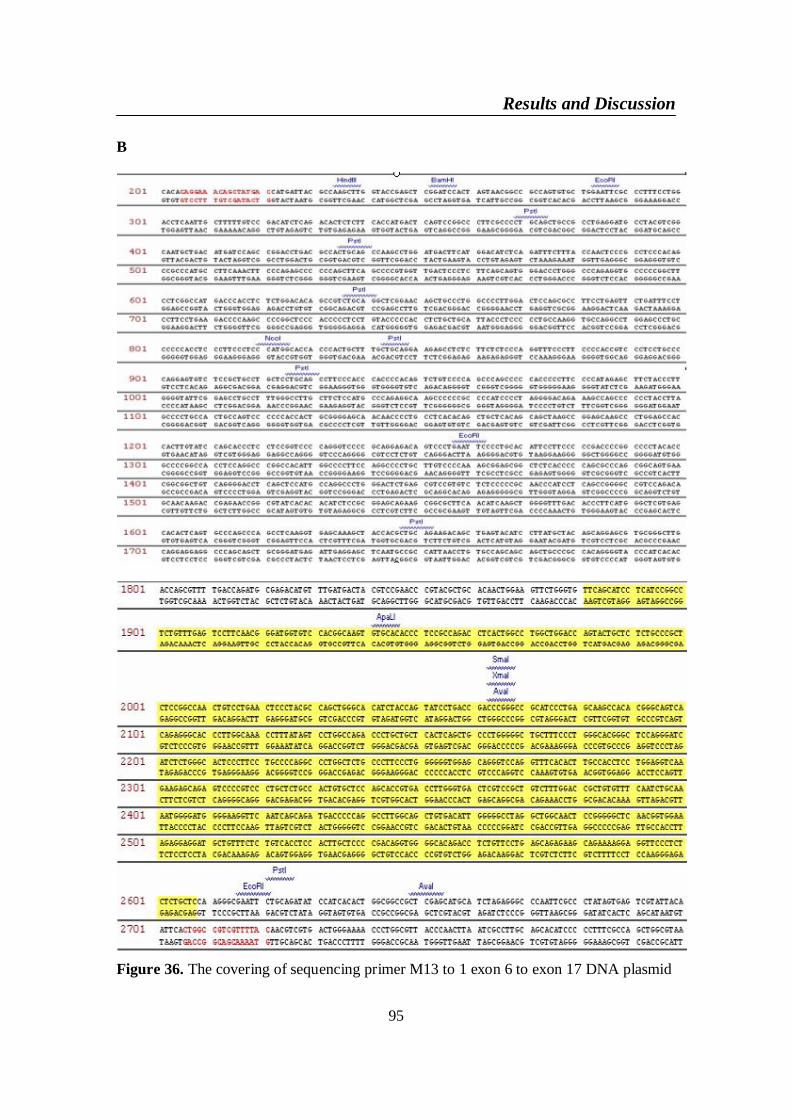
Results and Discussion
95
B
Figure 36. The covering of sequencing primer M13 to 1 exon 6 to exon 17 DNA plasmid
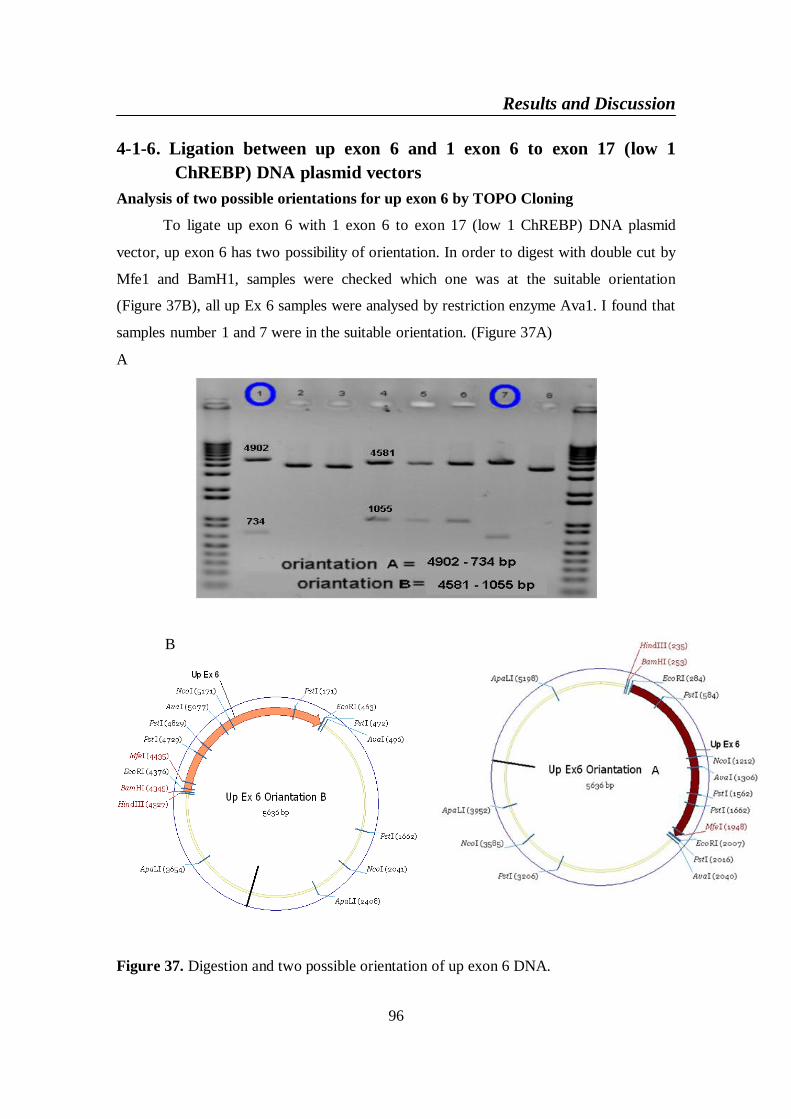
Results and Discussion
96
4-1-6. Ligation between up exon 6 and 1 exon 6 to exon 17 (low 1ChREBP) DNA plasmid vectors
Analysis of two possible orientations for up exon 6 by TOPO Cloning
To ligate up exon 6 with 1 exon 6 to exon 17 (low 1 ChREBP) DNA plasmid
vector, up exon 6 has two possibility of orientation. In order to digest with double cut by
Mfe1 and BamH1, samples were checked which one was at the suitable orientation
(Figure 37B), all up Ex 6 samples were analysed by restriction enzyme Ava1. I found that
samples number 1 and 7 were in the suitable orientation. (Figure 37A)
A
B
Figure 37. Digestion and two possible orientation of up exon 6 DNA.
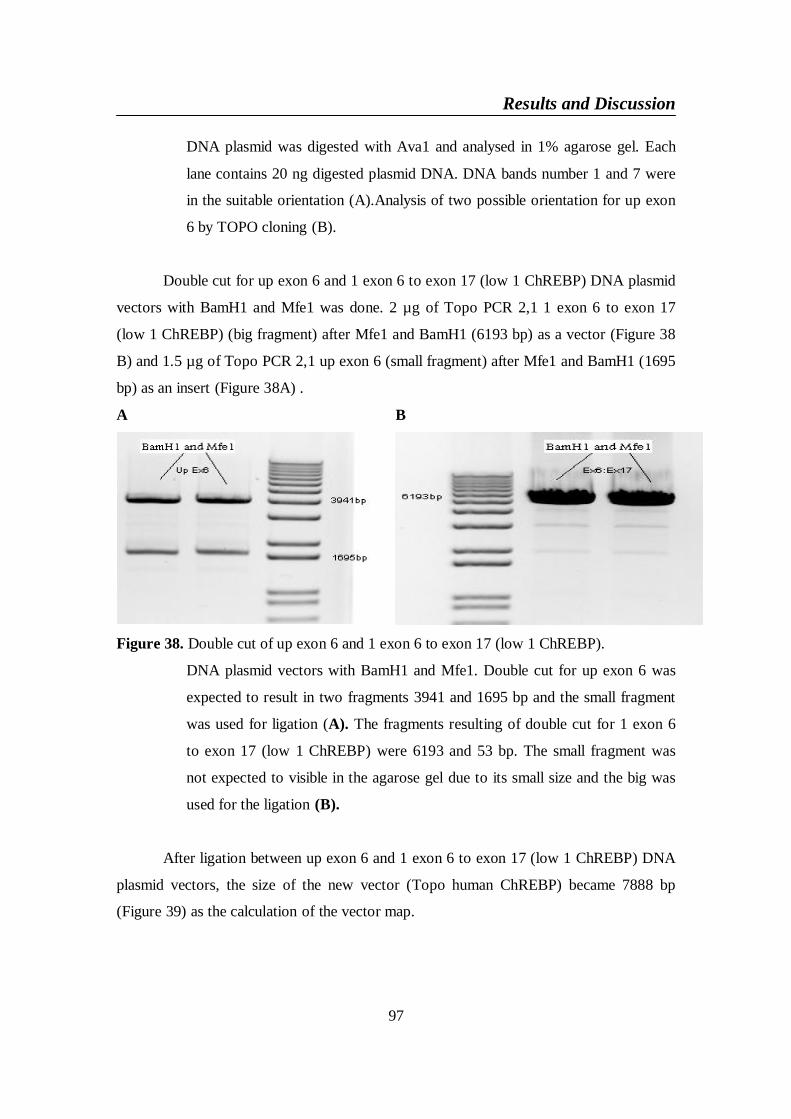
Results and Discussion
97
DNA plasmid was digested with Ava1 and analysed in 1% agarose gel. Each
lane contains 20 ng digested plasmid DNA. DNA bands number 1 and 7 were
in the suitable orientation (A).Analysis of two possible orientation for up exon
6 by TOPO cloning (B).
Double cut for up exon 6 and 1 exon 6 to exon 17 (low 1 ChREBP) DNA plasmid
vectors with BamH1 and Mfe1 was done. 2 µg of Topo PCR 2,1 1 exon 6 to exon 17
(low 1 ChREBP) (big fragment) after Mfe1 and BamH1 (6193 bp) as a vector (Figure 38
B) and 1.5 µg of Topo PCR 2,1 up exon 6 (small fragment) after Mfe1 and BamH1 (1695
bp) as an insert (Figure 38A) .
A B
Figure 38. Double cut of up exon 6 and 1 exon 6 to exon 17 (low 1 ChREBP).
DNA plasmid vectors with BamH1 and Mfe1. Double cut for up exon 6 was
expected to result in two fragments 3941 and 1695 bp and the small fragment
was used for ligation (A). The fragments resulting of double cut for 1 exon 6
to exon 17 (low 1 ChREBP) were 6193 and 53 bp. The small fragment was
not expected to visible in the agarose gel due to its small size and the big was
used for the ligation (B).
After ligation between up exon 6 and 1 exon 6 to exon 17 (low 1 ChREBP) DNA
plasmid vectors, the size of the new vector (Topo human ChREBP) became 7888 bp
(Figure 39) as the calculation of the vector map.
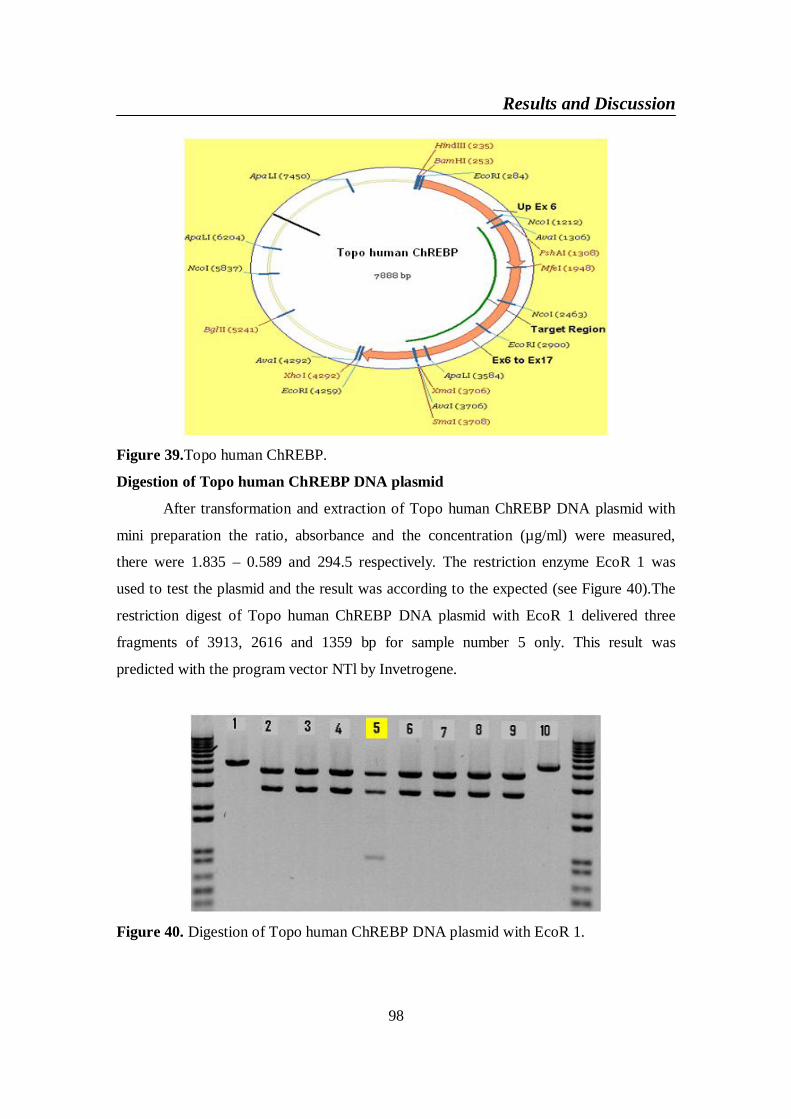
Results and Discussion
98
Figure 39.Topo human ChREBP.
Digestion of Topo human ChREBP DNA plasmid
After transformation and extraction of Topo human ChREBP DNA plasmid with
mini preparation the ratio, absorbance and the concentration (µg/ml) were measured,
there were 1.835 – 0.589 and 294.5 respectively. The restriction enzyme EcoR 1 was
used to test the plasmid and the result was according to the expected (see Figure 40).The
restriction digest of Topo human ChREBP DNA plasmid with EcoR 1 delivered three
fragments of 3913, 2616 and 1359 bp for sample number 5 only. This result was
predicted with the program vector NTl by Invetrogene.
Figure 40. Digestion of Topo human ChREBP DNA plasmid with EcoR 1.
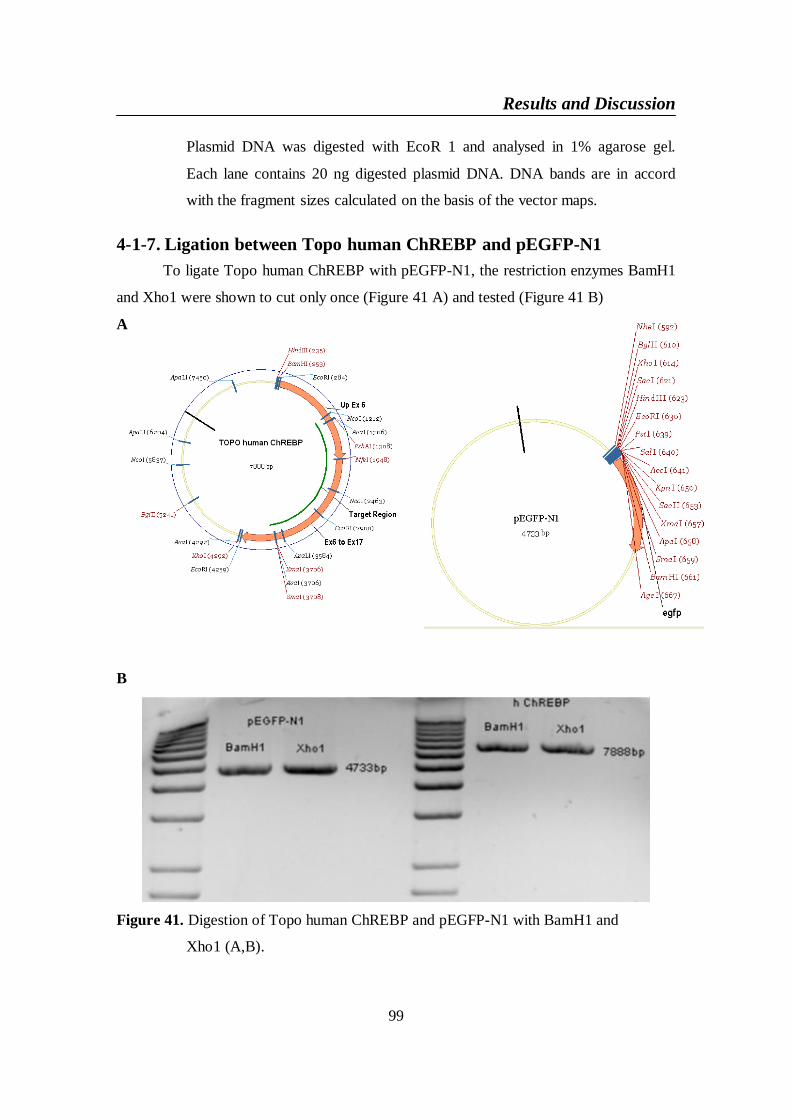
Results and Discussion
99
Plasmid DNA was digested with EcoR 1 and analysed in 1% agarose gel.
Each lane contains 20 ng digested plasmid DNA. DNA bands are in accord
with the fragment sizes calculated on the basis of the vector maps.
4-1-7. Ligation between Topo human ChREBP and pEGFP-N1To ligate Topo human ChREBP with pEGFP-N1, the restriction enzymes BamH1
and Xho1 were shown to cut only once (Figure 41 A) and tested (Figure 41 B)
A
B
Figure 41. Digestion of Topo human ChREBP and pEGFP-N1 with BamH1 and
Xho1 (A,B).
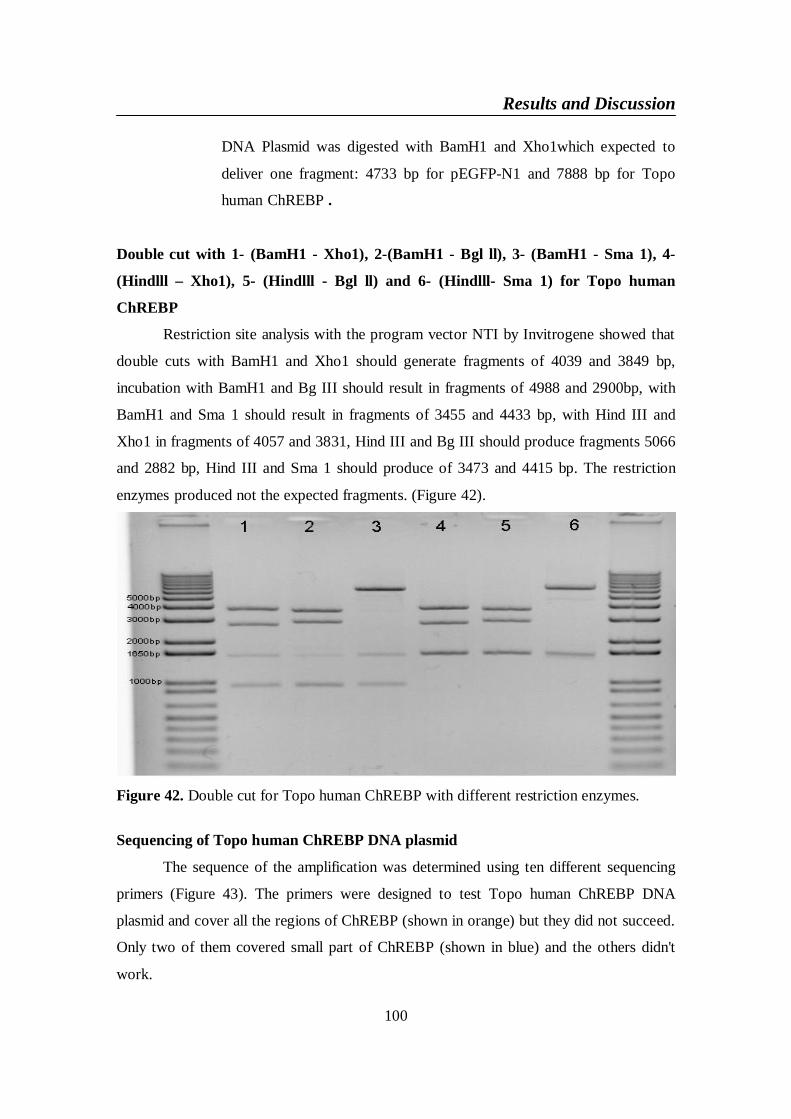
Results and Discussion
100
DNA Plasmid was digested with BamH1 and Xho1which expected to
deliver one fragment: 4733 bp for pEGFP-N1 and 7888 bp for Topo
human ChREBP .
Double cut with 1- (BamH1 - Xho1), 2-(BamH1 - Bgl ll), 3- (BamH1 - Sma 1), 4-
(Hindlll – Xho1), 5- (Hindlll - Bgl ll) and 6- (Hindlll- Sma 1) for Topo human
ChREBP
Restriction site analysis with the program vector NTI by Invitrogene showed that
double cuts with BamH1 and Xho1 should generate fragments of 4039 and 3849 bp,
incubation with BamH1 and Bg III should result in fragments of 4988 and 2900bp, with
BamH1 and Sma 1 should result in fragments of 3455 and 4433 bp, with Hind III and
Xho1 in fragments of 4057 and 3831, Hind III and Bg III should produce fragments 5066
and 2882 bp, Hind III and Sma 1 should produce of 3473 and 4415 bp. The restriction
enzymes produced not the expected fragments. (Figure 42).
Figure 42. Double cut for Topo human ChREBP with different restriction enzymes.
Sequencing of Topo human ChREBP DNA plasmid
The sequence of the amplification was determined using ten different sequencing
primers (Figure 43). The primers were designed to test Topo human ChREBP DNA
plasmid and cover all the regions of ChREBP (shown in orange) but they did not succeed.
Only two of them covered small part of ChREBP (shown in blue) and the others didn't
work.
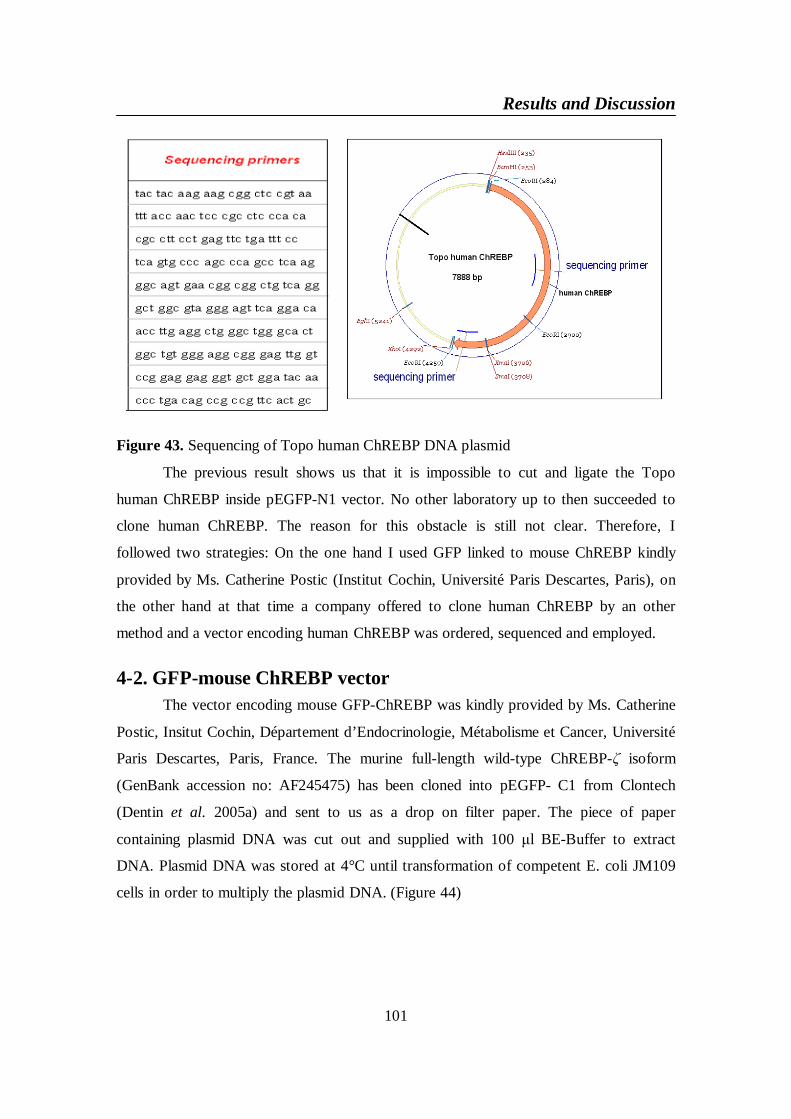
Results and Discussion
101
Figure 43. Sequencing of Topo human ChREBP DNA plasmid
The previous result shows us that it is impossible to cut and ligate the Topo
human ChREBP inside pEGFP-N1 vector. No other laboratory up to then succeeded to
clone human ChREBP. The reason for this obstacle is still not clear. Therefore, I
followed two strategies: On the one hand I used GFP linked to mouse ChREBP kindly
provided by Ms. Catherine Postic (Institut Cochin, Université Paris Descartes, Paris), on
the other hand at that time a company offered to clone human ChREBP by an other
method and a vector encoding human ChREBP was ordered, sequenced and employed.
4-2. GFP-mouse ChREBP vectorThe vector encoding mouse GFP-ChREBP was kindly provided by Ms. Catherine
Postic, Insitut Cochin, Département d’Endocrinologie, Métabolisme et Cancer, Université
Paris Descartes, Paris, France. The murine full-length wild-type ChREBP- isoform
(GenBank accession no: AF245475) has been cloned into pEGFP- C1 from Clontech
(Dentin et al. 2005a) and sent to us as a drop on filter paper. The piece of paper
containing plasmid DNA was cut out and supplied with 100 l BE-Buffer to extract
DNA. Plasmid DNA was stored at 4°C until transformation of competent E. coli JM109
cells in order to multiply the plasmid DNA. (Figure 44)
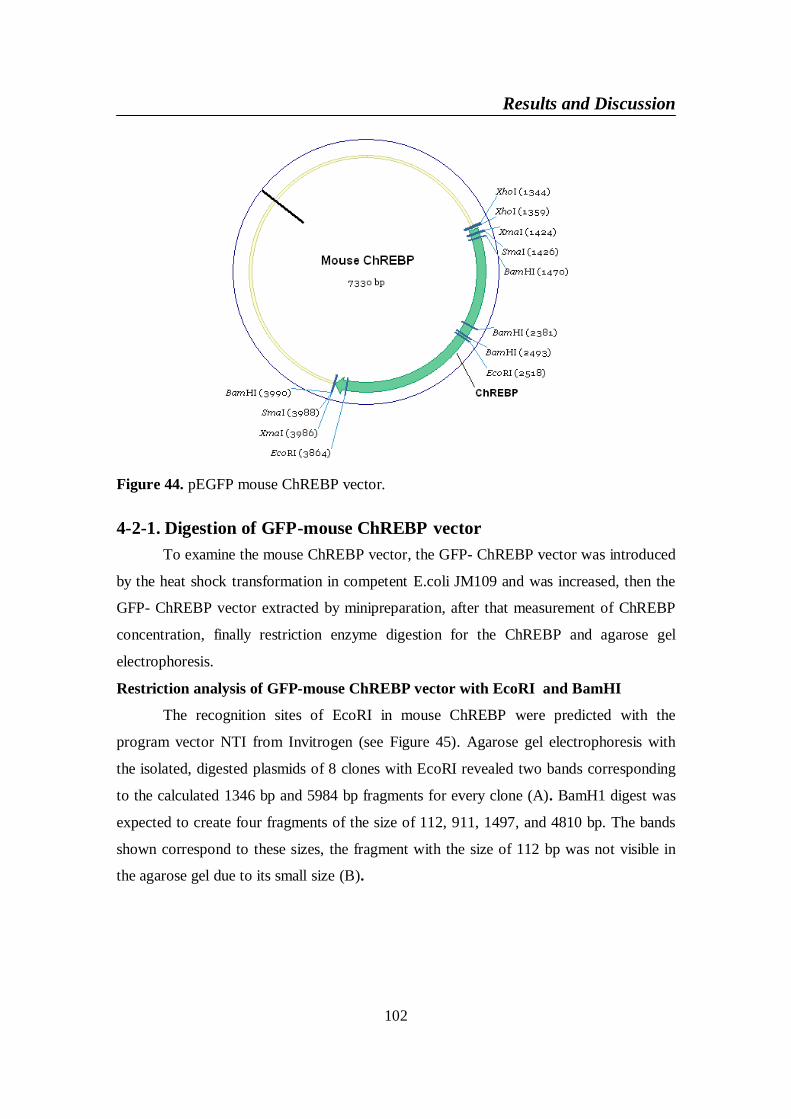
Results and Discussion
102
Figure 44. pEGFP mouse ChREBP vector.
4-2-1. Digestion of GFP-mouse ChREBP vectorTo examine the mouse ChREBP vector, the GFP- ChREBP vector was introduced
by the heat shock transformation in competent E.coli JM109 and was increased, then the
GFP- ChREBP vector extracted by minipreparation, after that measurement of ChREBP
concentration, finally restriction enzyme digestion for the ChREBP and agarose gel
electrophoresis.
Restriction analysis of GFP-mouse ChREBP vector with EcoRI and BamHI
The recognition sites of EcoRI in mouse ChREBP were predicted with the
program vector NTI from Invitrogen (see Figure 45). Agarose gel electrophoresis with
the isolated, digested plasmids of 8 clones with EcoRI revealed two bands corresponding
to the calculated 1346 bp and 5984 bp fragments for every clone (A). BamH1 digest was
expected to create four fragments of the size of 112, 911, 1497, and 4810 bp. The bands
shown correspond to these sizes, the fragment with the size of 112 bp was not visible in
the agarose gel due to its small size (B).
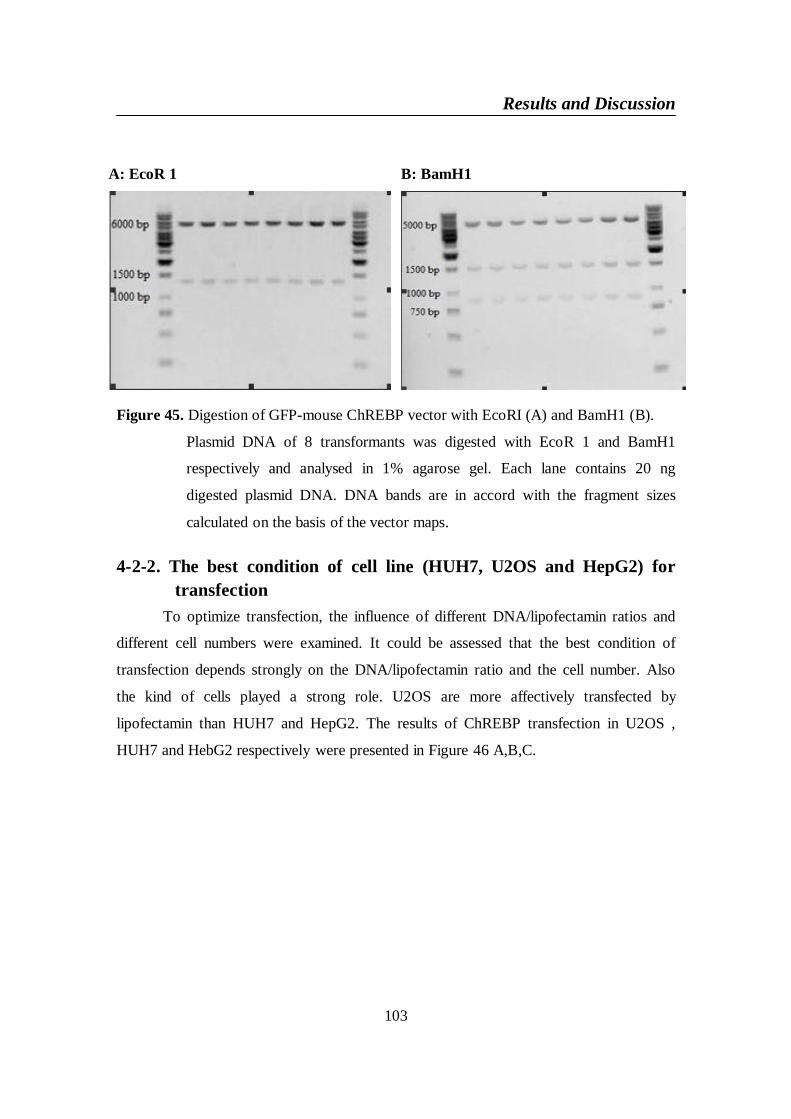
Results and Discussion
103
Figure 45. Digestion of GFP-mouse ChREBP vector with EcoRI (A) and BamH1 (B).
Plasmid DNA of 8 transformants was digested with EcoR 1 and BamH1
respectively and analysed in 1% agarose gel. Each lane contains 20 ng
digested plasmid DNA. DNA bands are in accord with the fragment sizes
calculated on the basis of the vector maps.
4-2-2. The best condition of cell line (HUH7, U2OS and HepG2) fortransfection
To optimize transfection, the influence of different DNA/lipofectamin ratios and
different cell numbers were examined. It could be assessed that the best condition of
transfection depends strongly on the DNA/lipofectamin ratio and the cell number. Also
the kind of cells played a strong role. U2OS are more affectively transfected by
lipofectamin than HUH7 and HepG2. The results of ChREBP transfection in U2OS ,
HUH7 and HebG2 respectively were presented in Figure 46 A,B,C.
A: EcoR 1 B: BamH1
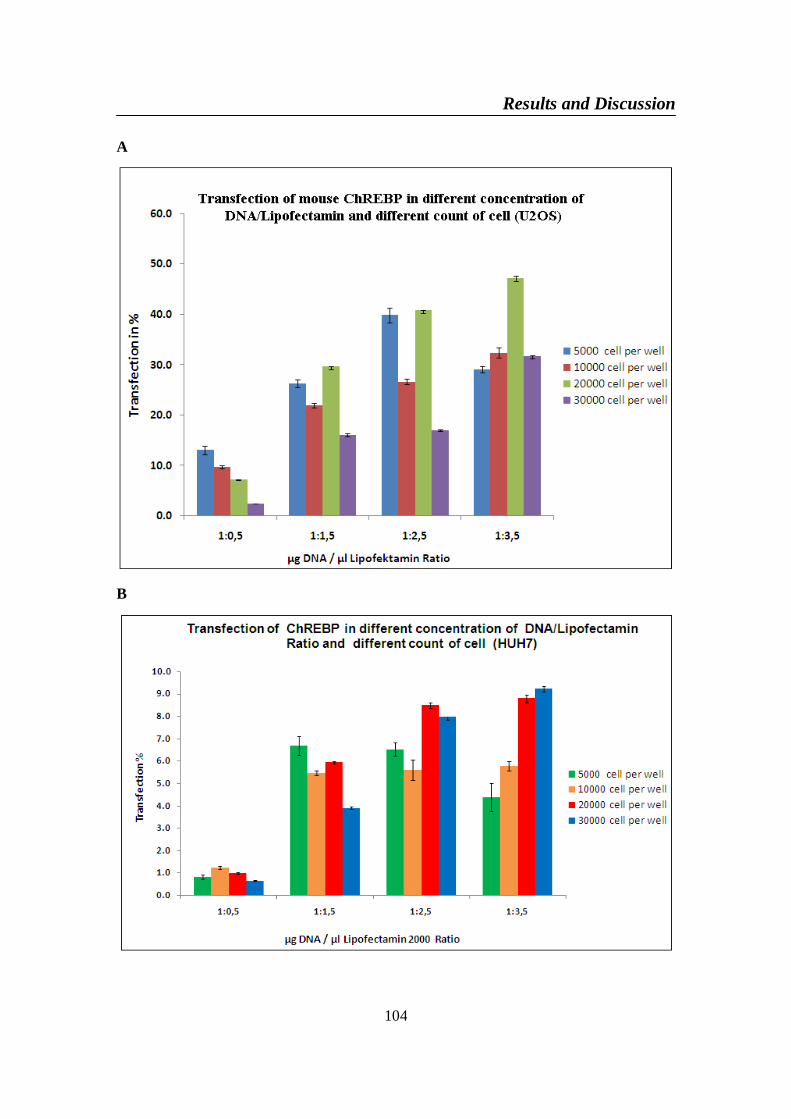
Results and Discussion
104
A
B
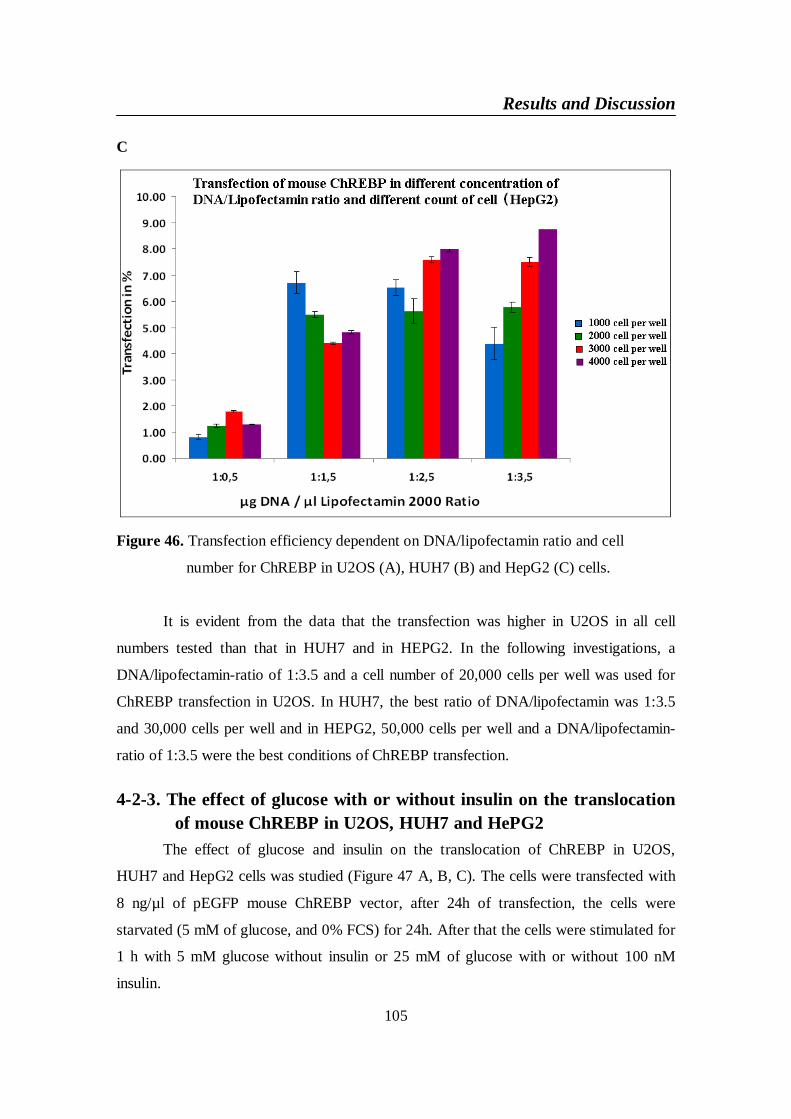
Results and Discussion
105
C
Figure 46. Transfection efficiency dependent on DNA/lipofectamin ratio and cell
number for ChREBP in U2OS (A), HUH7 (B) and HepG2 (C) cells.
It is evident from the data that the transfection was higher in U2OS in all cell
numbers tested than that in HUH7 and in HEPG2. In the following investigations, a
DNA/lipofectamin-ratio of 1:3.5 and a cell number of 20,000 cells per well was used for
ChREBP transfection in U2OS. In HUH7, the best ratio of DNA/lipofectamin was 1:3.5
and 30,000 cells per well and in HEPG2, 50,000 cells per well and a DNA/lipofectamin-
ratio of 1:3.5 were the best conditions of ChREBP transfection.
4-2-3. The effect of glucose with or without insulin on the translocationof mouse ChREBP in U2OS, HUH7 and HePG2
The effect of glucose and insulin on the translocation of ChREBP in U2OS,
HUH7 and HepG2 cells was studied (Figure 47 A, B, C). The cells were transfected with
8 ng/µl of pEGFP mouse ChREBP vector, after 24h of transfection, the cells were
starvated (5 mM of glucose, and 0% FCS) for 24h. After that the cells were stimulated for
1 h with 5 mM glucose without insulin or 25 mM of glucose with or without 100 nM
insulin.
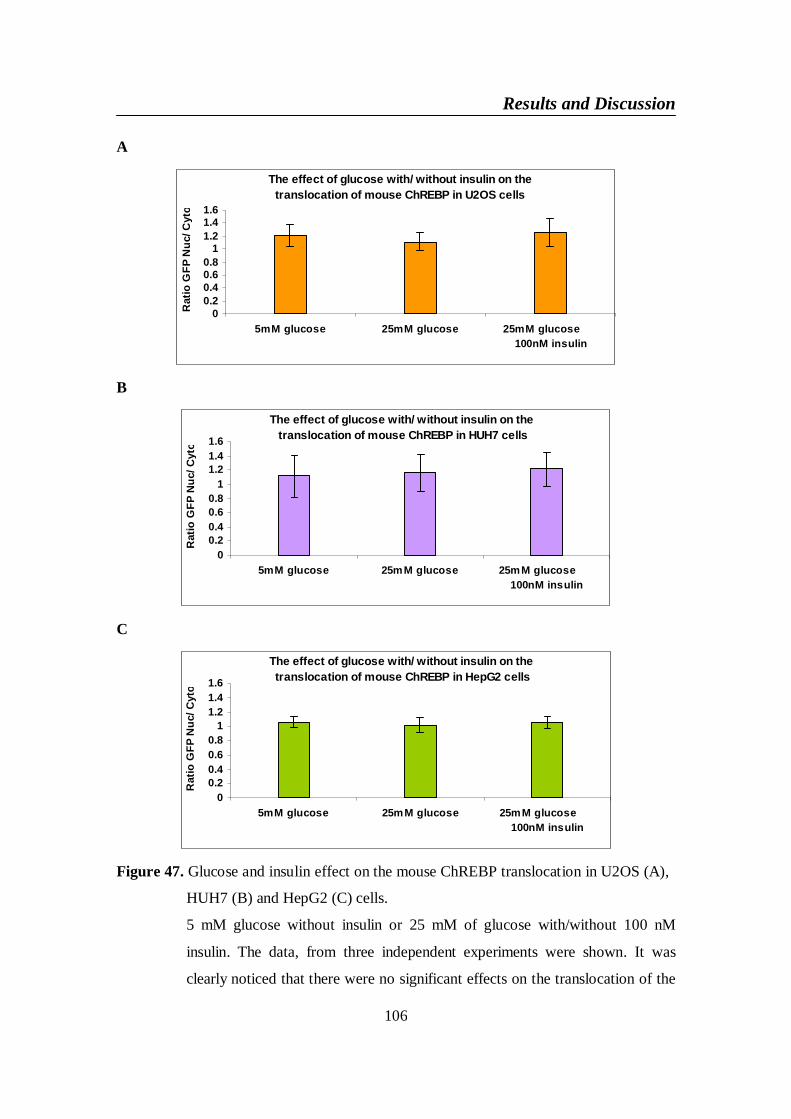
Results and Discussion
106
A
The effect of glucose with/ without insulin on thetranslocation of mouse ChREBP in U2OS cells
00.20.40.60.8
11.21.41.6
5mM glucose 25mM glucose 25mM glucose100nM insulin
Rat
io G
FP N
uc/ C
yto
B
The effect of glucose with/ without insulin on thetranslocation of mouse ChREBP in HUH7 cells
00.20.40.60.8
11.21.41.6
5mM glucose 25mM glucose 25mM glucose100nM insulin
Rat
io G
FP N
uc/ C
yto
C
The effect of glucose with/ without insulin on thetranslocation of mouse ChREBP in HepG2 cells
00.20.40.60.8
11.21.41.6
5mM glucose 25mM glucose 25mM glucose100nM insulin
Rat
io G
FP N
uc/ C
yto
Figure 47. Glucose and insulin effect on the mouse ChREBP translocation in U2OS (A),
HUH7 (B) and HepG2 (C) cells.
5 mM glucose without insulin or 25 mM of glucose with/without 100 nM
insulin. The data, from three independent experiments were shown. It was
clearly noticed that there were no significant effects on the translocation of the
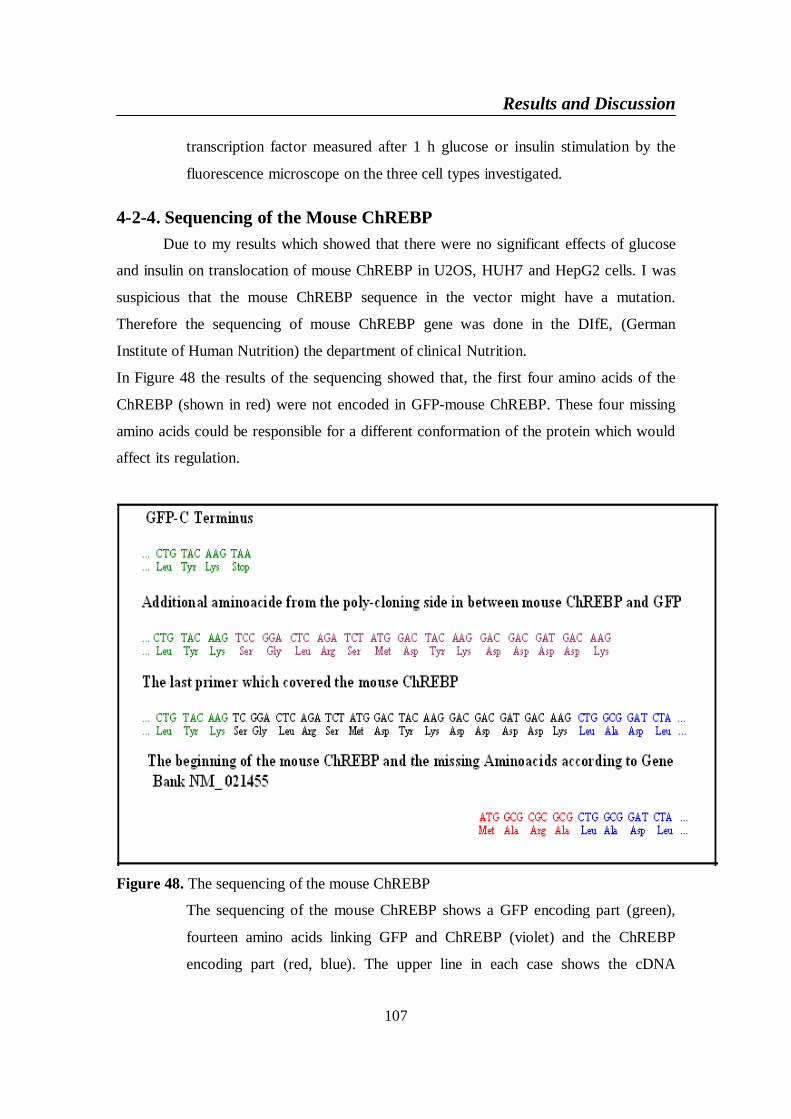
Results and Discussion
107
transcription factor measured after 1 h glucose or insulin stimulation by the
fluorescence microscope on the three cell types investigated.
4-2-4. Sequencing of the Mouse ChREBPDue to my results which showed that there were no significant effects of glucose
and insulin on translocation of mouse ChREBP in U2OS, HUH7 and HepG2 cells. I was
suspicious that the mouse ChREBP sequence in the vector might have a mutation.
Therefore the sequencing of mouse ChREBP gene was done in the DIfE, (German
Institute of Human Nutrition) the department of clinical Nutrition.
In Figure 48 the results of the sequencing showed that, the first four amino acids of the
ChREBP (shown in red) were not encoded in GFP-mouse ChREBP. These four missing
amino acids could be responsible for a different conformation of the protein which would
affect its regulation.
Figure 48. The sequencing of the mouse ChREBP
The sequencing of the mouse ChREBP shows a GFP encoding part (green),
fourteen amino acids linking GFP and ChREBP (violet) and the ChREBP
encoding part (red, blue). The upper line in each case shows the cDNA
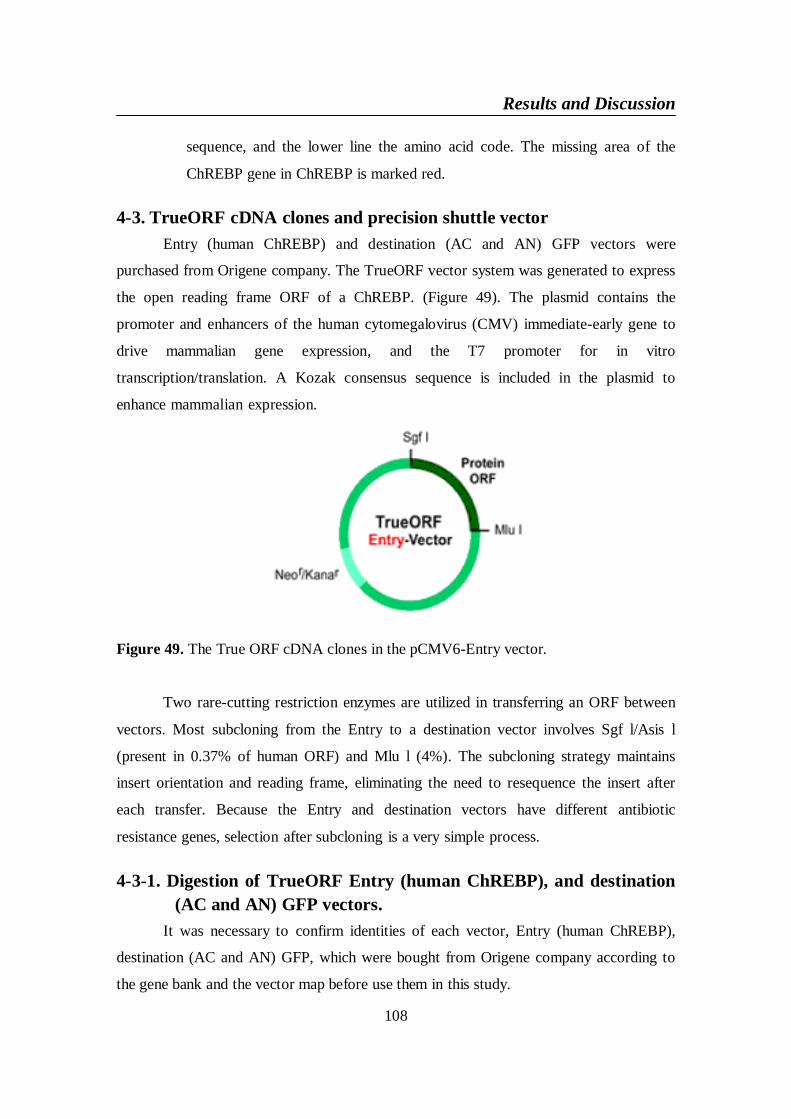
Results and Discussion
108
sequence, and the lower line the amino acid code. The missing area of the
ChREBP gene in ChREBP is marked red.
4-3. TrueORF cDNA clones and precision shuttle vectorEntry (human ChREBP) and destination (AC and AN) GFP vectors were
purchased from Origene company. The TrueORF vector system was generated to express
the open reading frame ORF of a ChREBP. (Figure 49). The plasmid contains the
promoter and enhancers of the human cytomegalovirus (CMV) immediate-early gene to
drive mammalian gene expression, and the T7 promoter for in vitro
transcription/translation. A Kozak consensus sequence is included in the plasmid to
enhance mammalian expression.
Figure 49. The True ORF cDNA clones in the pCMV6-Entry vector.
Two rare-cutting restriction enzymes are utilized in transferring an ORF between
vectors. Most subcloning from the Entry to a destination vector involves Sgf l/Asis l
(present in 0.37% of human ORF) and Mlu l (4%). The subcloning strategy maintains
insert orientation and reading frame, eliminating the need to resequence the insert after
each transfer. Because the Entry and destination vectors have different antibiotic
resistance genes, selection after subcloning is a very simple process.
4-3-1. Digestion of TrueORF Entry (human ChREBP), and destination(AC and AN) GFP vectors.
It was necessary to confirm identities of each vector, Entry (human ChREBP),
destination (AC and AN) GFP, which were bought from Origene company according to
the gene bank and the vector map before use them in this study.
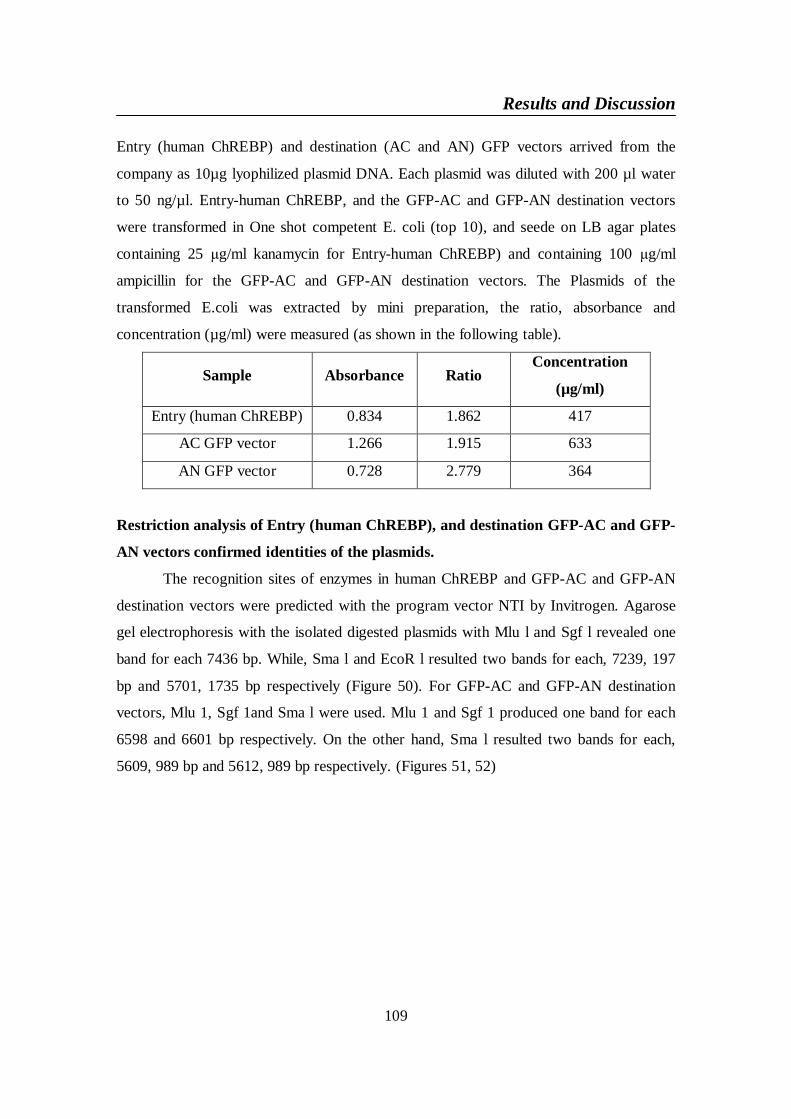
Results and Discussion
109
Entry (human ChREBP) and destination (AC and AN) GFP vectors arrived from the
company as 10µg lyophilized plasmid DNA. Each plasmid was diluted with 200 µl water
to 50 ng/µl. Entry-human ChREBP, and the GFP-AC and GFP-AN destination vectors
were transformed in One shot competent E. coli (top 10), and seede on LB agar plates
containing 25 g/ml kanamycin for Entry-human ChREBP) and containing 100 g/ml
ampicillin for the GFP-AC and GFP-AN destination vectors. The Plasmids of the
transformed E.coli was extracted by mini preparation, the ratio, absorbance and
concentration (µg/ml) were measured (as shown in the following table).
Sample Absorbance RatioConcentration
(µg/ml)
Entry (human ChREBP) 0.834 1.862 417
AC GFP vector 1.266 1.915 633
AN GFP vector 0.728 2.779 364
Restriction analysis of Entry (human ChREBP), and destination GFP-AC and GFP-
AN vectors confirmed identities of the plasmids.
The recognition sites of enzymes in human ChREBP and GFP-AC and GFP-AN
destination vectors were predicted with the program vector NTI by Invitrogen. Agarose
gel electrophoresis with the isolated digested plasmids with Mlu l and Sgf l revealed one
band for each 7436 bp. While, Sma l and EcoR l resulted two bands for each, 7239, 197
bp and 5701, 1735 bp respectively (Figure 50). For GFP-AC and GFP-AN destination
vectors, Mlu 1, Sgf 1and Sma l were used. Mlu 1 and Sgf 1 produced one band for each
6598 and 6601 bp respectively. On the other hand, Sma l resulted two bands for each,
5609, 989 bp and 5612, 989 bp respectively. (Figures 51, 52)
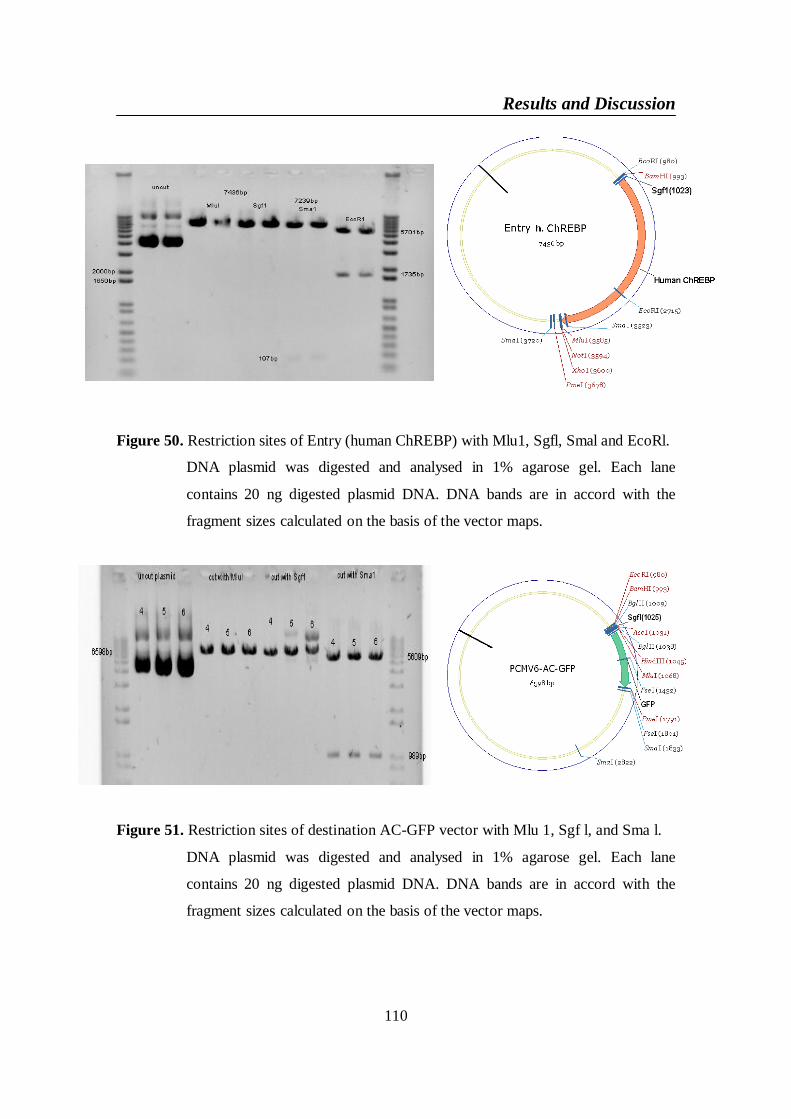
Results and Discussion
110
Figure 50. Restriction sites of Entry (human ChREBP) with Mlu1, Sgfl, Smal and EcoRl.
DNA plasmid was digested and analysed in 1% agarose gel. Each lane
contains 20 ng digested plasmid DNA. DNA bands are in accord with the
fragment sizes calculated on the basis of the vector maps.
Figure 51. Restriction sites of destination AC-GFP vector with Mlu 1, Sgf l, and Sma l.
DNA plasmid was digested and analysed in 1% agarose gel. Each lane
contains 20 ng digested plasmid DNA. DNA bands are in accord with the
fragment sizes calculated on the basis of the vector maps.
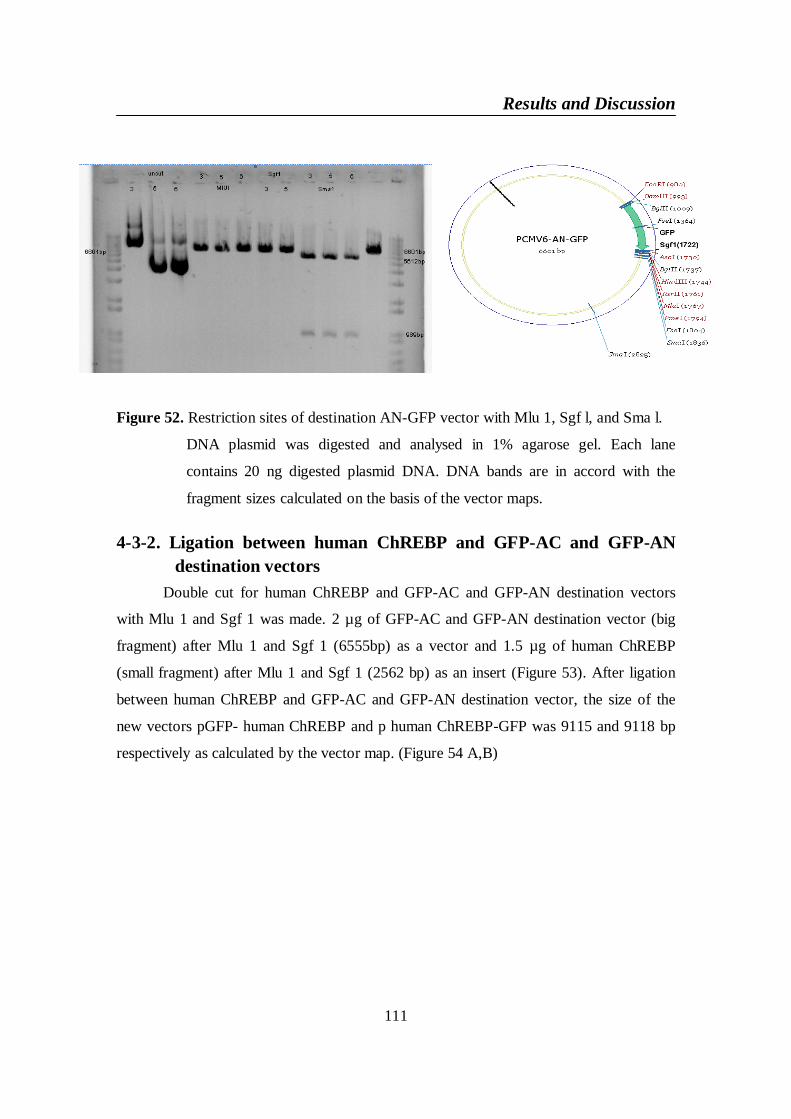
Results and Discussion
111
Figure 52. Restriction sites of destination AN-GFP vector with Mlu 1, Sgf l, and Sma l.
DNA plasmid was digested and analysed in 1% agarose gel. Each lane
contains 20 ng digested plasmid DNA. DNA bands are in accord with the
fragment sizes calculated on the basis of the vector maps.
4-3-2. Ligation between human ChREBP and GFP-AC and GFP-ANdestination vectors
Double cut for human ChREBP and GFP-AC and GFP-AN destination vectors
with Mlu 1 and Sgf 1 was made. 2 µg of GFP-AC and GFP-AN destination vector (big
fragment) after Mlu 1 and Sgf 1 (6555bp) as a vector and 1.5 µg of human ChREBP
(small fragment) after Mlu 1 and Sgf 1 (2562 bp) as an insert (Figure 53). After ligation
between human ChREBP and GFP-AC and GFP-AN destination vector, the size of the
new vectors pGFP- human ChREBP and p human ChREBP-GFP was 9115 and 9118 bp
respectively as calculated by the vector map. (Figure 54 A,B)
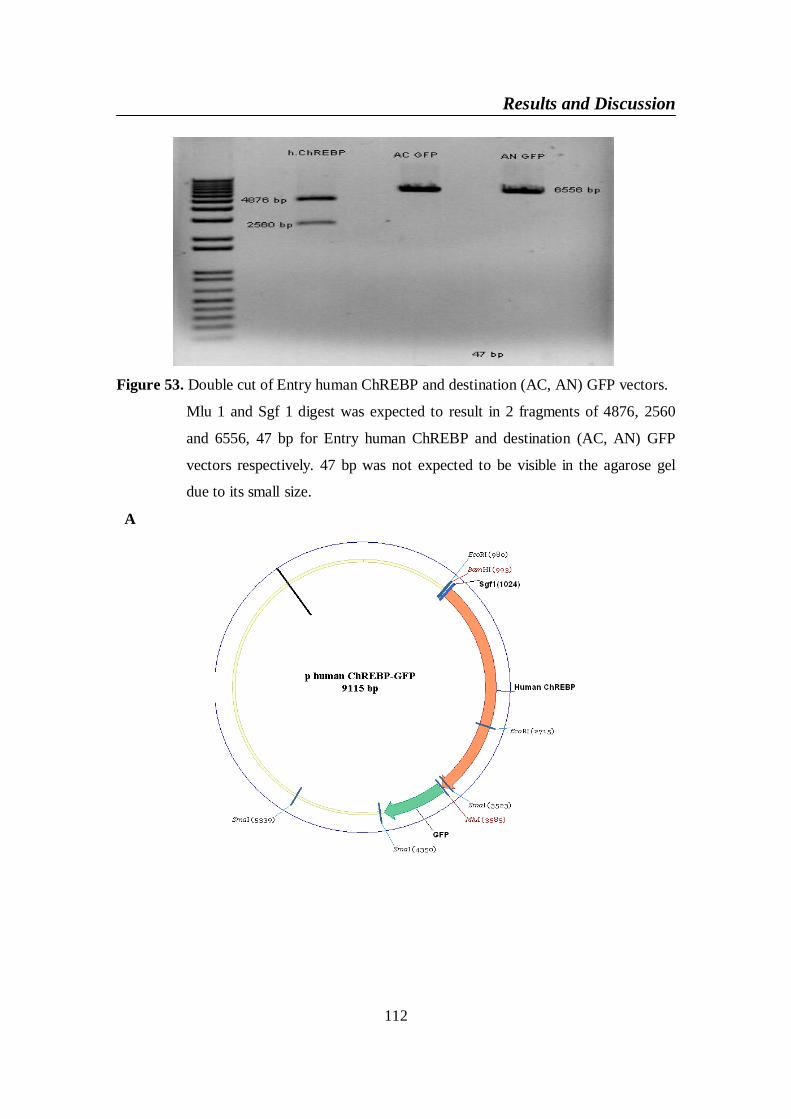
Results and Discussion
112
Figure 53. Double cut of Entry human ChREBP and destination (AC, AN) GFP vectors.
Mlu 1 and Sgf 1 digest was expected to result in 2 fragments of 4876, 2560
and 6556, 47 bp for Entry human ChREBP and destination (AC, AN) GFP
vectors respectively. 47 bp was not expected to be visible in the agarose gel
due to its small size.
A
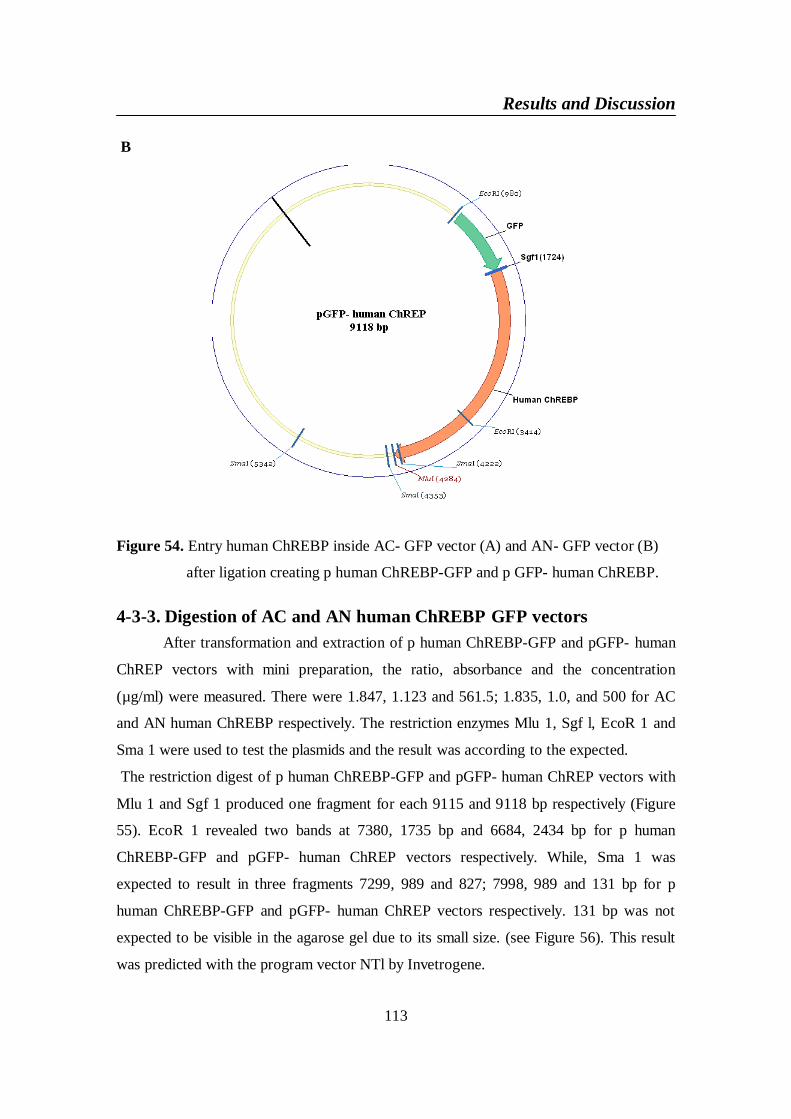
Results and Discussion
113
B
Figure 54. Entry human ChREBP inside AC- GFP vector (A) and AN- GFP vector (B)
after ligation creating p human ChREBP-GFP and p GFP- human ChREBP.
4-3-3. Digestion of AC and AN human ChREBP GFP vectorsAfter transformation and extraction of p human ChREBP-GFP and pGFP- human
ChREP vectors with mini preparation, the ratio, absorbance and the concentration
(µg/ml) were measured. There were 1.847, 1.123 and 561.5; 1.835, 1.0, and 500 for AC
and AN human ChREBP respectively. The restriction enzymes Mlu 1, Sgf l, EcoR 1 and
Sma 1 were used to test the plasmids and the result was according to the expected.
The restriction digest of p human ChREBP-GFP and pGFP- human ChREP vectors with
Mlu 1 and Sgf 1 produced one fragment for each 9115 and 9118 bp respectively (Figure
55). EcoR 1 revealed two bands at 7380, 1735 bp and 6684, 2434 bp for p human
ChREBP-GFP and pGFP- human ChREP vectors respectively. While, Sma 1 was
expected to result in three fragments 7299, 989 and 827; 7998, 989 and 131 bp for p
human ChREBP-GFP and pGFP- human ChREP vectors respectively. 131 bp was not
expected to be visible in the agarose gel due to its small size. (see Figure 56). This result
was predicted with the program vector NTl by Invetrogene.
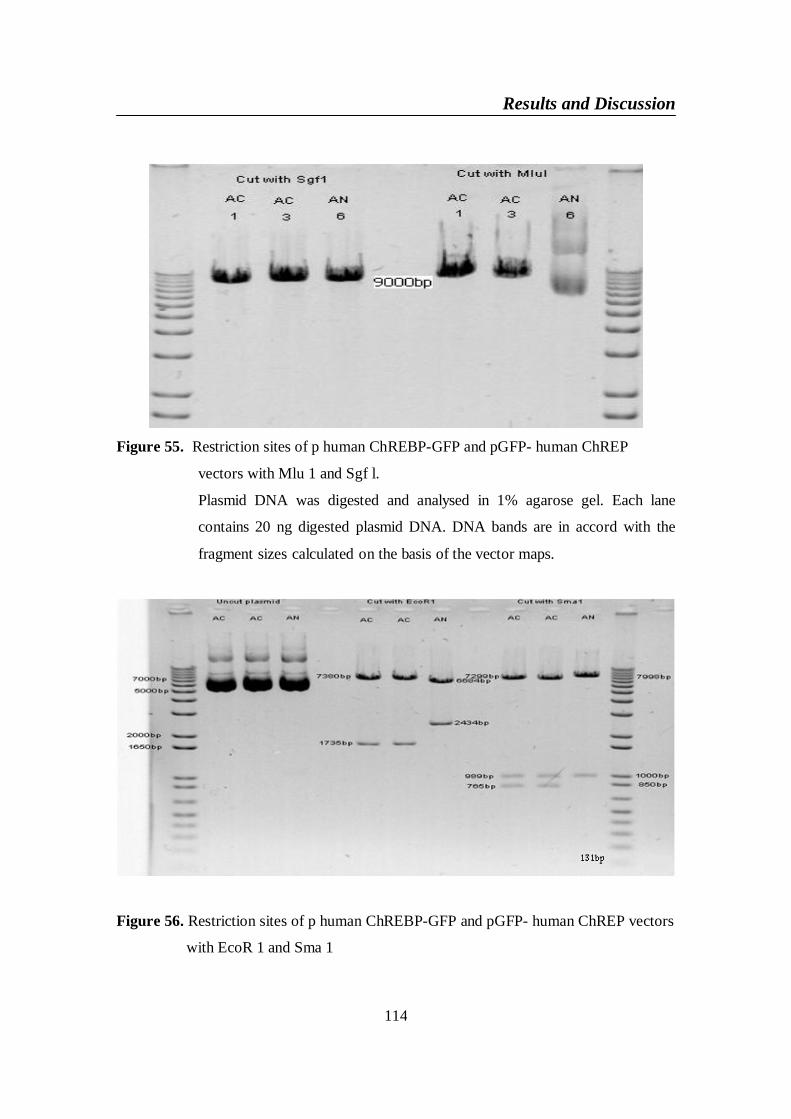
Results and Discussion
114
Figure 55. Restriction sites of p human ChREBP-GFP and pGFP- human ChREP
vectors with Mlu 1 and Sgf l.
Plasmid DNA was digested and analysed in 1% agarose gel. Each lane
contains 20 ng digested plasmid DNA. DNA bands are in accord with the
fragment sizes calculated on the basis of the vector maps.
Figure 56. Restriction sites of p human ChREBP-GFP and pGFP- human ChREP vectors
with EcoR 1 and Sma 1
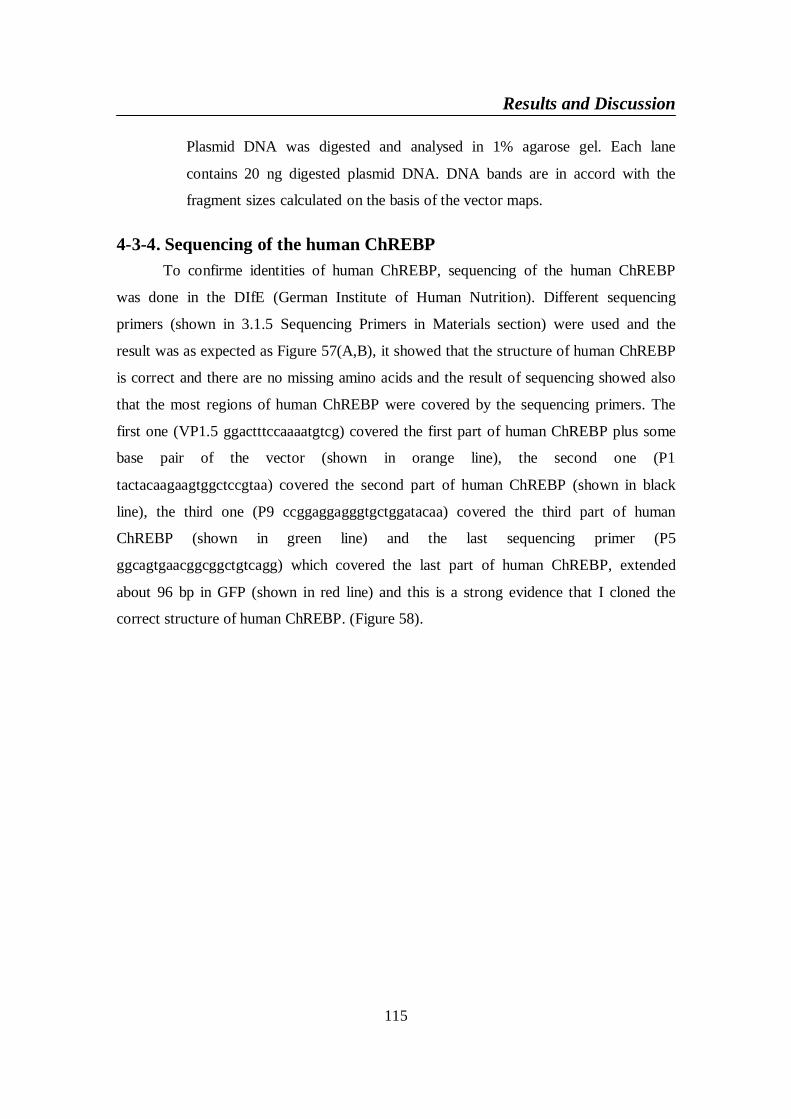
Results and Discussion
115
Plasmid DNA was digested and analysed in 1% agarose gel. Each lane
contains 20 ng digested plasmid DNA. DNA bands are in accord with the
fragment sizes calculated on the basis of the vector maps.
4-3-4. Sequencing of the human ChREBPTo confirme identities of human ChREBP, sequencing of the human ChREBP
was done in the DIfE (German Institute of Human Nutrition). Different sequencing
primers (shown in 3.1.5 Sequencing Primers in Materials section) were used and the
result was as expected as Figure 57(A,B), it showed that the structure of human ChREBP
is correct and there are no missing amino acids and the result of sequencing showed also
that the most regions of human ChREBP were covered by the sequencing primers. The
first one (VP1.5 ggactttccaaaatgtcg) covered the first part of human ChREBP plus some
base pair of the vector (shown in orange line), the second one (P1
tactacaagaagtggctccgtaa) covered the second part of human ChREBP (shown in black
line), the third one (P9 ccggaggagggtgctggatacaa) covered the third part of human
ChREBP (shown in green line) and the last sequencing primer (P5
ggcagtgaacggcggctgtcagg) which covered the last part of human ChREBP, extended
about 96 bp in GFP (shown in red line) and this is a strong evidence that I cloned the
correct structure of human ChREBP. (Figure 58).
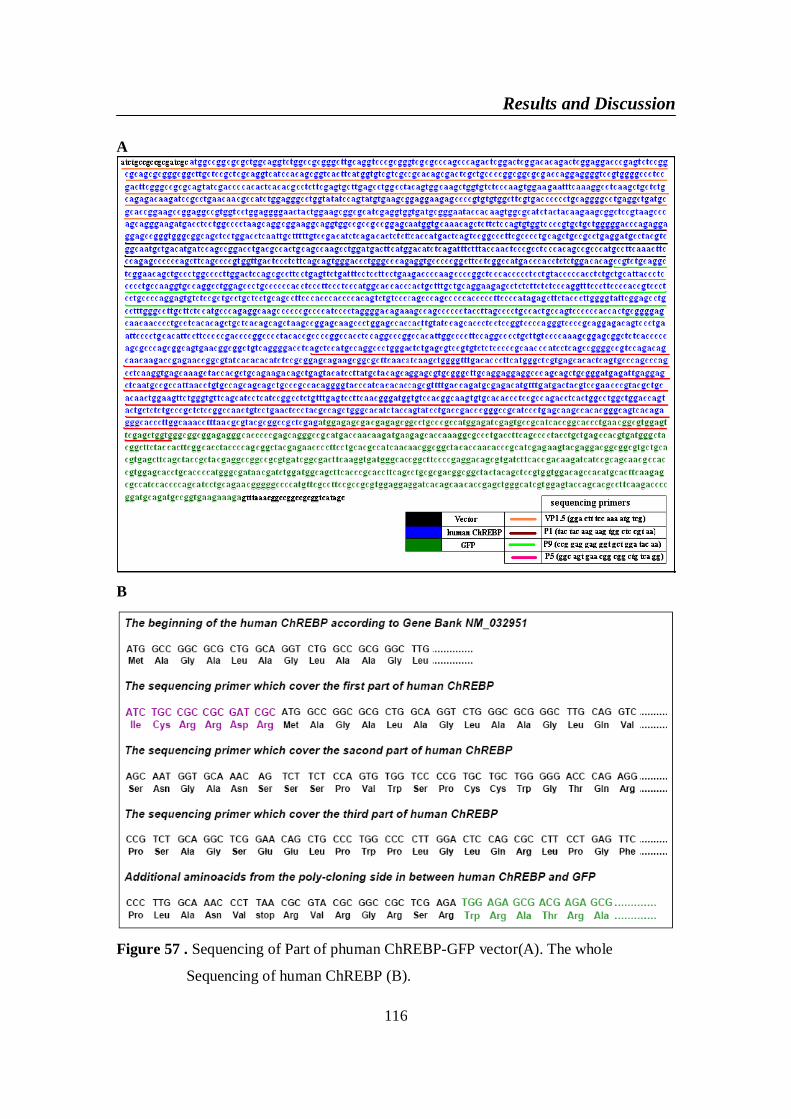
Results and Discussion
116
A
B
Figure 57 . Sequencing of Part of phuman ChREBP-GFP vector(A). The whole
Sequencing of human ChREBP (B).
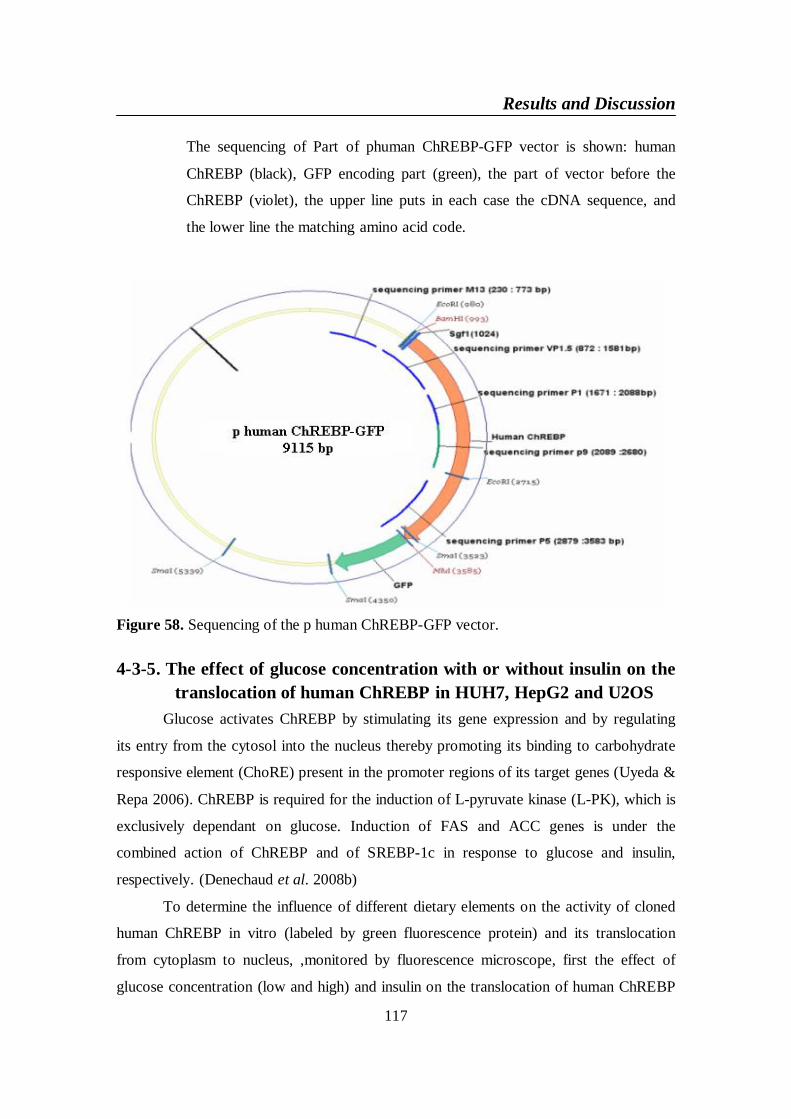
Results and Discussion
117
The sequencing of Part of phuman ChREBP-GFP vector is shown: human
ChREBP (black), GFP encoding part (green), the part of vector before the
ChREBP (violet), the upper line puts in each case the cDNA sequence, and
the lower line the matching amino acid code.
Figure 58. Sequencing of the p human ChREBP-GFP vector.
4-3-5. The effect of glucose concentration with or without insulin on thetranslocation of human ChREBP in HUH7, HepG2 and U2OS
Glucose activates ChREBP by stimulating its gene expression and by regulating
its entry from the cytosol into the nucleus thereby promoting its binding to carbohydrate
responsive element (ChoRE) present in the promoter regions of its target genes (Uyeda &
Repa 2006). ChREBP is required for the induction of L-pyruvate kinase (L-PK), which is
exclusively dependant on glucose. Induction of FAS and ACC genes is under the
combined action of ChREBP and of SREBP-1c in response to glucose and insulin,
respectively. (Denechaud et al. 2008b)
To determine the influence of different dietary elements on the activity of cloned
human ChREBP in vitro (labeled by green fluorescence protein) and its translocation
from cytoplasm to nucleus, ,monitored by fluorescence microscope, first the effect of
glucose concentration (low and high) and insulin on the translocation of human ChREBP
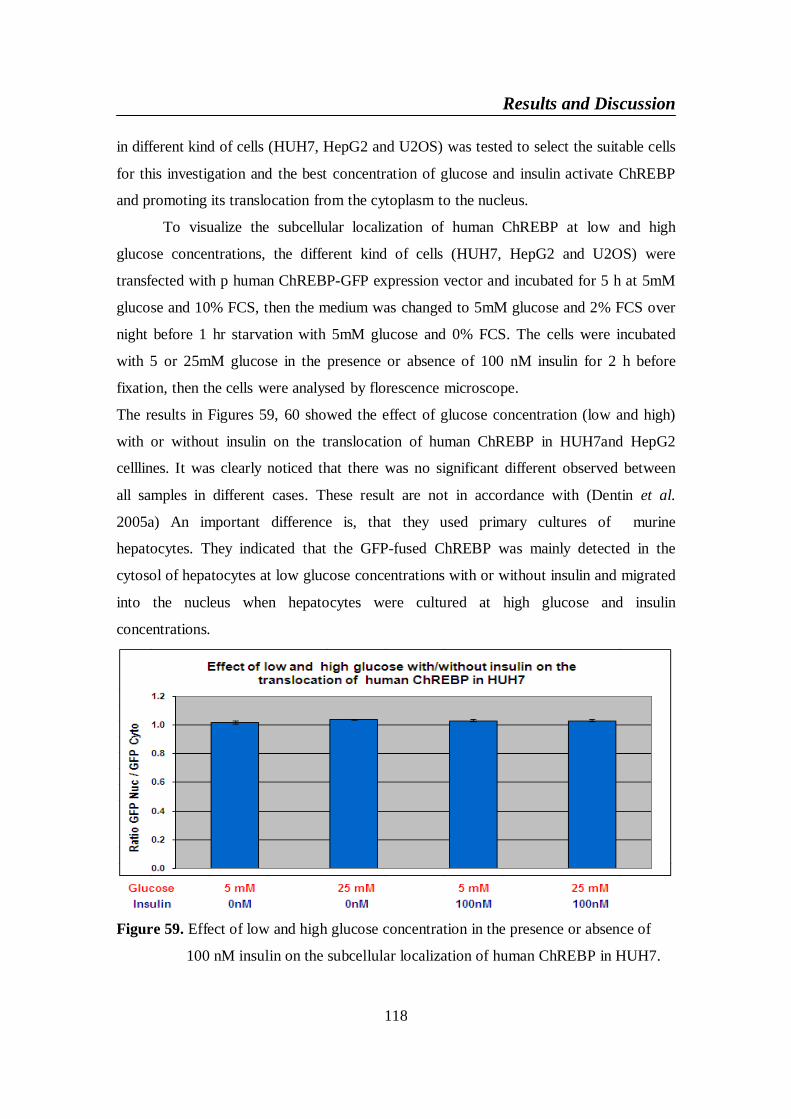
Results and Discussion
118
in different kind of cells (HUH7, HepG2 and U2OS) was tested to select the suitable cells
for this investigation and the best concentration of glucose and insulin activate ChREBP
and promoting its translocation from the cytoplasm to the nucleus.
To visualize the subcellular localization of human ChREBP at low and high
glucose concentrations, the different kind of cells (HUH7, HepG2 and U2OS) were
transfected with p human ChREBP-GFP expression vector and incubated for 5 h at 5mM
glucose and 10% FCS, then the medium was changed to 5mM glucose and 2% FCS over
night before 1 hr starvation with 5mM glucose and 0% FCS. The cells were incubated
with 5 or 25mM glucose in the presence or absence of 100 nM insulin for 2 h before
fixation, then the cells were analysed by florescence microscope.
The results in Figures 59, 60 showed the effect of glucose concentration (low and high)
with or without insulin on the translocation of human ChREBP in HUH7and HepG2
celllines. It was clearly noticed that there was no significant different observed between
all samples in different cases. These result are not in accordance with (Dentin et al.
2005a) An important difference is, that they used primary cultures of murine
hepatocytes. They indicated that the GFP-fused ChREBP was mainly detected in the
cytosol of hepatocytes at low glucose concentrations with or without insulin and migrated
into the nucleus when hepatocytes were cultured at high glucose and insulin
concentrations.
Figure 59. Effect of low and high glucose concentration in the presence or absence of
100 nM insulin on the subcellular localization of human ChREBP in HUH7.
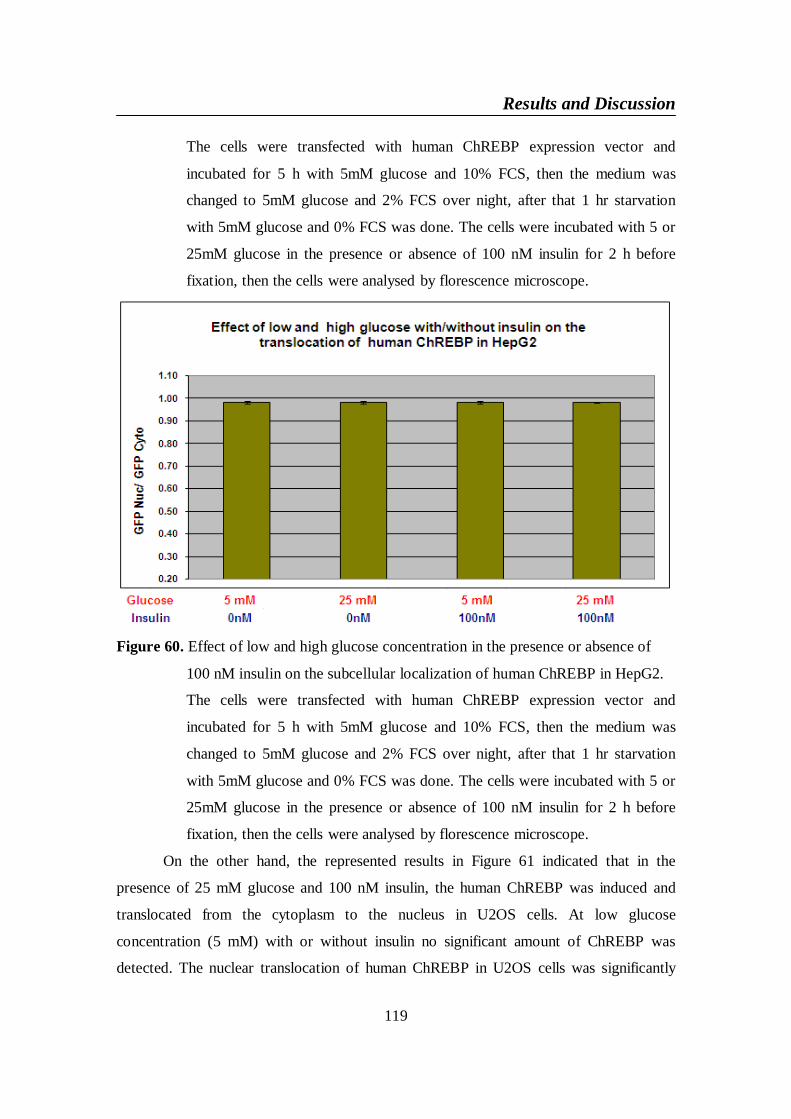
Results and Discussion
119
The cells were transfected with human ChREBP expression vector and
incubated for 5 h with 5mM glucose and 10% FCS, then the medium was
changed to 5mM glucose and 2% FCS over night, after that 1 hr starvation
with 5mM glucose and 0% FCS was done. The cells were incubated with 5 or
25mM glucose in the presence or absence of 100 nM insulin for 2 h before
fixation, then the cells were analysed by florescence microscope.
Figure 60. Effect of low and high glucose concentration in the presence or absence of
100 nM insulin on the subcellular localization of human ChREBP in HepG2.
The cells were transfected with human ChREBP expression vector and
incubated for 5 h with 5mM glucose and 10% FCS, then the medium was
changed to 5mM glucose and 2% FCS over night, after that 1 hr starvation
with 5mM glucose and 0% FCS was done. The cells were incubated with 5 or
25mM glucose in the presence or absence of 100 nM insulin for 2 h before
fixation, then the cells were analysed by florescence microscope.
On the other hand, the represented results in Figure 61 indicated that in the
presence of 25 mM glucose and 100 nM insulin, the human ChREBP was induced and
translocated from the cytoplasm to the nucleus in U2OS cells. At low glucose
concentration (5 mM) with or without insulin no significant amount of ChREBP was
detected. The nuclear translocation of human ChREBP in U2OS cells was significantly
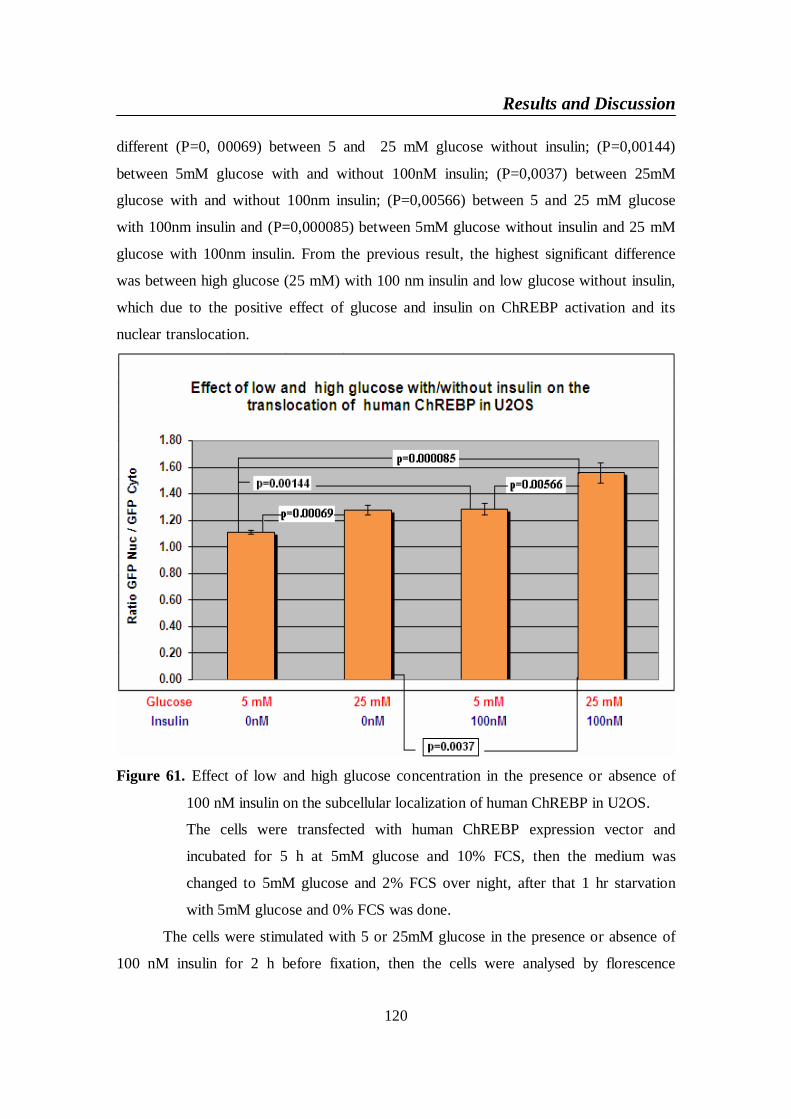
Results and Discussion
120
different (P=0, 00069) between 5 and 25 mM glucose without insulin; (P=0,00144)
between 5mM glucose with and without 100nM insulin; (P=0,0037) between 25mM
glucose with and without 100nm insulin; (P=0,00566) between 5 and 25 mM glucose
with 100nm insulin and (P=0,000085) between 5mM glucose without insulin and 25 mM
glucose with 100nm insulin. From the previous result, the highest significant difference
was between high glucose (25 mM) with 100 nm insulin and low glucose without insulin,
which due to the positive effect of glucose and insulin on ChREBP activation and its
nuclear translocation.
Figure 61. Effect of low and high glucose concentration in the presence or absence of
100 nM insulin on the subcellular localization of human ChREBP in U2OS.
The cells were transfected with human ChREBP expression vector and
incubated for 5 h at 5mM glucose and 10% FCS, then the medium was
changed to 5mM glucose and 2% FCS over night, after that 1 hr starvation
with 5mM glucose and 0% FCS was done.
The cells were stimulated with 5 or 25mM glucose in the presence or absence of
100 nM insulin for 2 h before fixation, then the cells were analysed by florescence
Results and Discussion
121
microscope. These results are coincide with (Dentin et al. 2005a), who reported that
incubation of hepatocytes with glucose and insulin led to a 4.5-fold increase in ChREBP
content in the cytosol, leading to its translocation to the nucleus (Dentin et al. 2005a).
Compatible findings were observed by (Denechaud et al. 2008b) who mentioned that
when overnight-fasted mice were refed a high-carbohydrate (HCHO) diet for 18 h,
ChREBP phosphorylation on Ser196 was low and ChREBP protein was predominantly
located in the nucleus (Denechaud et al. 2008a). He et al. (He et al. 2004) reported that in
the presence of 25 mM glucose, the mRNA level of ChREBP was dramatically induced
during adipogenesis in 3T3-L1 preadipocyte. At a lower glucose concentration (5 mM)
no significant amount of ChREBP mRNA was detectable (He et al. 2004).
Several recent studies suggested that high ambient glucose, insulin, PPAR
agonist, liver X receptor and polyunsaturated fatty acids may affect ChREBP mRNA
expression levels (Denechaud et al. 2008b). Interestingly, liver X receptors have been
shown to directly stimulate ChREBP mRNA expression in addition to their known
regulation of lipogenesis through SREBP-1c and FAS (Yahagi et al. 2002). Furthermore,
in ob/ob mice, a well-characterized genetic model of obesity, insulin resistance, and
hyperinsulinemia, ChREBP expression level is substantially higher, suggesting a
potential role of insulin in stimulating ChREBP production (Dentin et al. 2006a); (Sirek
et al. 2009).
4-3-6. The effect of fructose and some artificial sweeteners on thetranslocation of human ChREBP in U2OS cells
4-3-6-1. Fructose
A diet high in fructose induces metabolic syndrome including insulin resistance,
hypertriglyceridemia and hypertension in animal models (Hwang et al. 1987), and shows
similar effects in humans (Stanhope et al. 2009). Liver is the major site of fructose
metabolism (McGuinness & Cherrington 2003). Because fructose enters the
glycolytic/gluconeogenic pathway as trioses in liver, metabolizing fructose requires
simultaneous activation of part of glycolysis, de novo lipogenesis, part of
gluconeogenesis and glycogen synthesis. An increase in both insulin and glucose
concentrations is required for most glycolytic/lipogenic genes to be fully expressed in the
liver. Carbohydrate response element-binding protein (ChREBP) is activated in high
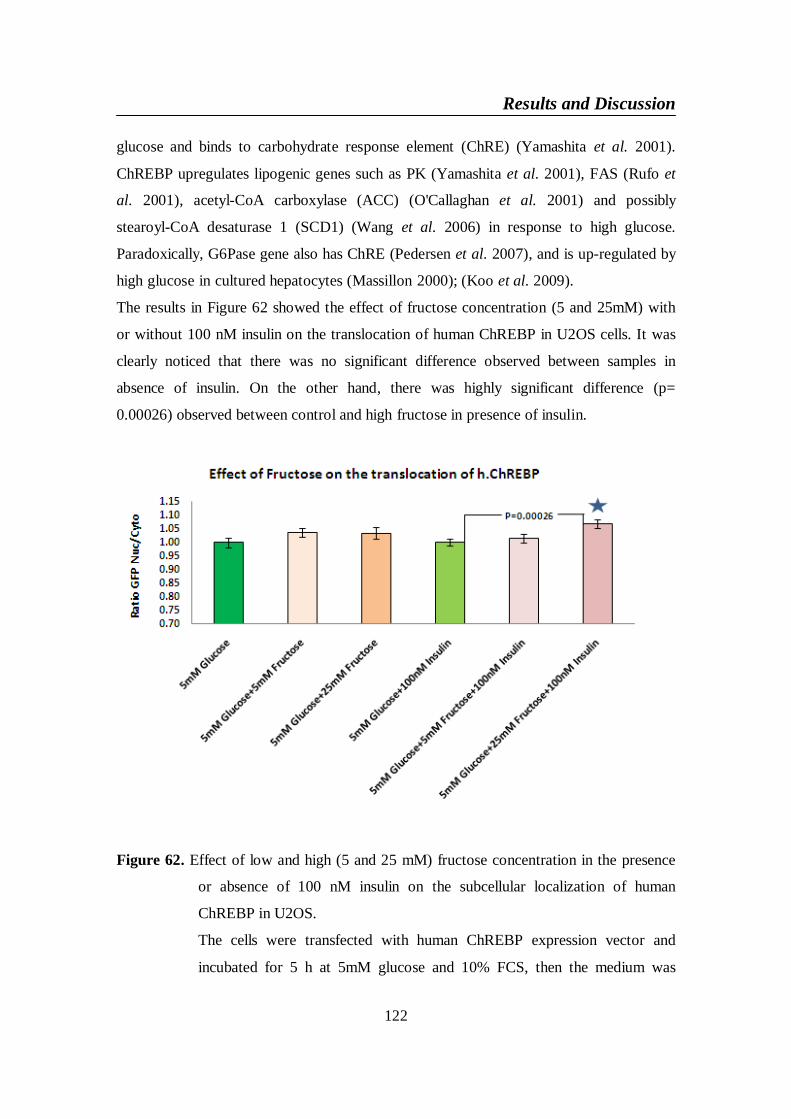
Results and Discussion
122
glucose and binds to carbohydrate response element (ChRE) (Yamashita et al. 2001).
ChREBP upregulates lipogenic genes such as PK (Yamashita et al. 2001), FAS (Rufo et
al. 2001), acetyl-CoA carboxylase (ACC) (O'Callaghan et al. 2001) and possibly
stearoyl-CoA desaturase 1 (SCD1) (Wang et al. 2006) in response to high glucose.
Paradoxically, G6Pase gene also has ChRE (Pedersen et al. 2007), and is up-regulated by
high glucose in cultured hepatocytes (Massillon 2000); (Koo et al. 2009).
The results in Figure 62 showed the effect of fructose concentration (5 and 25mM) with
or without 100 nM insulin on the translocation of human ChREBP in U2OS cells. It was
clearly noticed that there was no significant difference observed between samples in
absence of insulin. On the other hand, there was highly significant difference (p=
0.00026) observed between control and high fructose in presence of insulin.
Figure 62. Effect of low and high (5 and 25 mM) fructose concentration in the presence
or absence of 100 nM insulin on the subcellular localization of human
ChREBP in U2OS.
The cells were transfected with human ChREBP expression vector and
incubated for 5 h at 5mM glucose and 10% FCS, then the medium was
Results and Discussion
123
changed to 5mM glucose and 2% FCS over night, after that 1 hr starvation
with 5mM glucose and 0% FCS was done. The cells were stimulated with 5
and 25 mM fructose in the presence or absence of 100 nm insulin for 2 h
before fixation, then the cells were analysed by florescence microscope.
These results are compatible to in vivo investigations by Koo et al. (Koo et al.
2009) study, they indicated that ChREBP is regulated at multiple levels. High glucose
and insulin concentration stimulates ChREBP gene expression both in vitro and in vivo
(Dentin et al. 2004). In Koo et al (2009) study, dietary fructose modestly increased
ChREBP gene expression compared to dietary glucose although the increase did not
reach statistical difference. The data showed that, ChREBP increased its DNA binding
activity by fructose feeding, Dietary fructose induced PK, FAS and G6Pase genes (Koo
et al. 2008), all of which possess ChRE in their promoter region, suggesting ChREBP
may mediate the fructose effects on these genes. Furthermore, mice with ChREBP gene
deletion displayed severe sucrose/ fructose intolerance, suggesting a critical role of
ChREBP in fructose metabolism. (Iizuka et al. 2004)
4-3-6-2. The artificial sweeteners (cyclamate, aspartame, saccharine and
stevioside)
First discovered in the late 19th century in the United States, saccharin (and later
cyclamate, aspartame, and sucralose) enabled individuals to experience sweet tastes in
food with dramatic reductions in caloric consumption over nutritive sweeteners. Between
1890 and 1930, saccharin was the only artificial sweetener produced in the United States,
and its consumption was limited to diabetics who eschewed sugar for medical reasons.
Beginning in the 1950s with saccharin and cyclamates, extending to aspartame in the
early 1980s, and now with sucralose, chemical sweeteners have found a primary market
among consumers who could consume nutritive sweeteners, but choose not to, in order to
lose weight or maintain weight. This shift in consumer practices can be linked to three
marketplace shifts: (a) the development of second-generation sweeteners, such as
cyclamates and aspartame and improved saccharin blends that improved the taste of
artificially sweetened products; (b) the rise in popularity of dieting and diet programs
among americans in the late 20th century; and (c) the improved marketing and branding
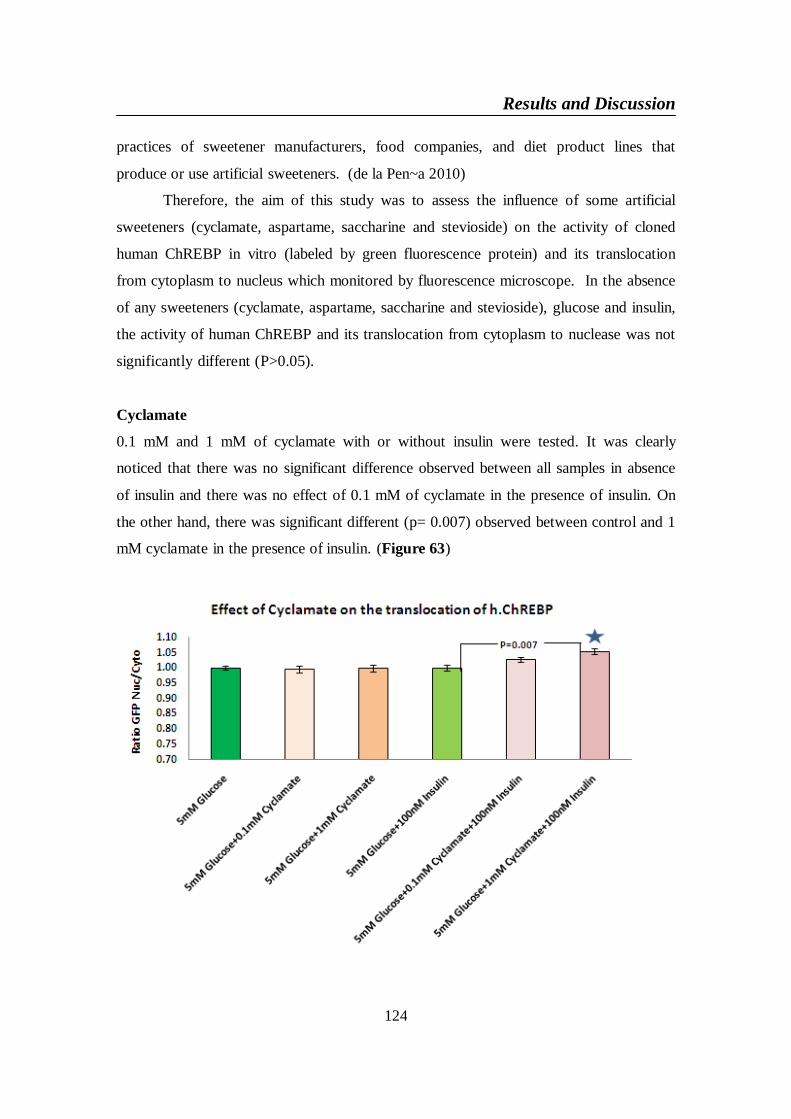
Results and Discussion
124
practices of sweetener manufacturers, food companies, and diet product lines that
produce or use artificial sweeteners. (de la Pen~a 2010)
Therefore, the aim of this study was to assess the influence of some artificial
sweeteners (cyclamate, aspartame, saccharine and stevioside) on the activity of cloned
human ChREBP in vitro (labeled by green fluorescence protein) and its translocation
from cytoplasm to nucleus which monitored by fluorescence microscope. In the absence
of any sweeteners (cyclamate, aspartame, saccharine and stevioside), glucose and insulin,
the activity of human ChREBP and its translocation from cytoplasm to nuclease was not
significantly different (P>0.05).
Cyclamate
0.1 mM and 1 mM of cyclamate with or without insulin were tested. It was clearly
noticed that there was no significant difference observed between all samples in absence
of insulin and there was no effect of 0.1 mM of cyclamate in the presence of insulin. On
the other hand, there was significant different (p= 0.007) observed between control and 1
mM cyclamate in the presence of insulin. (Figure 63)
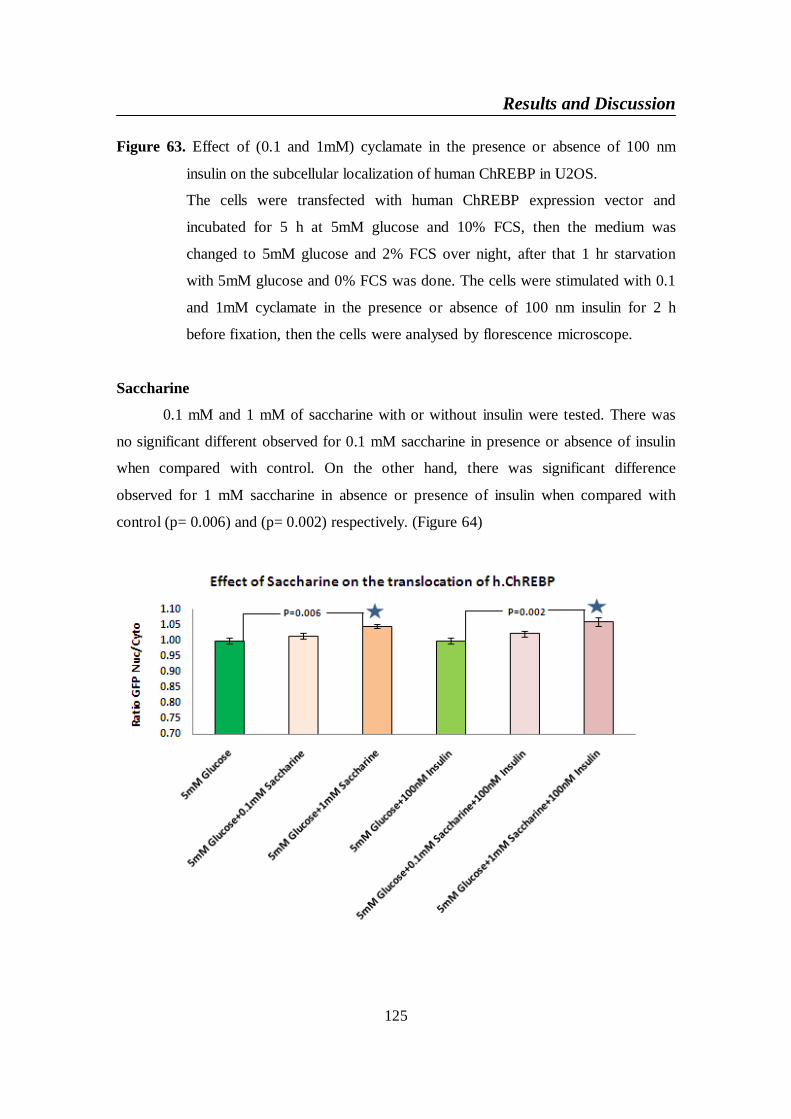
Results and Discussion
125
Figure 63. Effect of (0.1 and 1mM) cyclamate in the presence or absence of 100 nm
insulin on the subcellular localization of human ChREBP in U2OS.
The cells were transfected with human ChREBP expression vector and
incubated for 5 h at 5mM glucose and 10% FCS, then the medium was
changed to 5mM glucose and 2% FCS over night, after that 1 hr starvation
with 5mM glucose and 0% FCS was done. The cells were stimulated with 0.1
and 1mM cyclamate in the presence or absence of 100 nm insulin for 2 h
before fixation, then the cells were analysed by florescence microscope.
Saccharine
0.1 mM and 1 mM of saccharine with or without insulin were tested. There was
no significant different observed for 0.1 mM saccharine in presence or absence of insulin
when compared with control. On the other hand, there was significant difference
observed for 1 mM saccharine in absence or presence of insulin when compared with
control (p= 0.006) and (p= 0.002) respectively. (Figure 64)
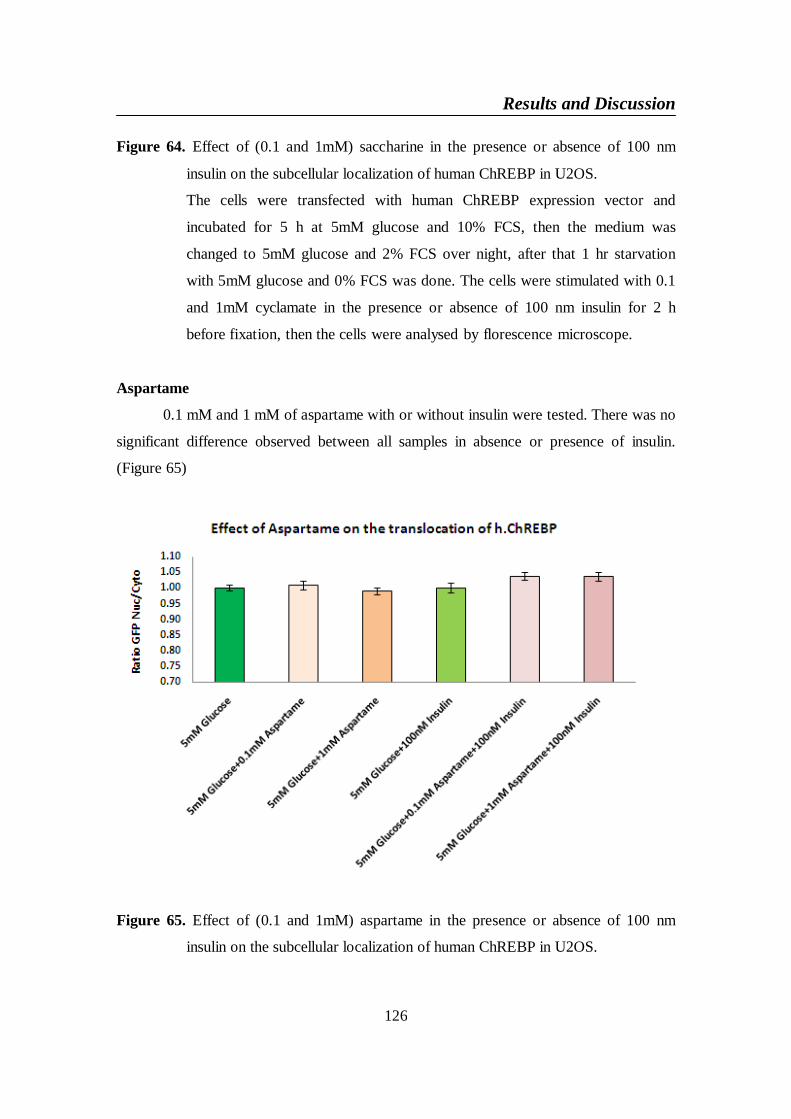
Results and Discussion
126
Figure 64. Effect of (0.1 and 1mM) saccharine in the presence or absence of 100 nm
insulin on the subcellular localization of human ChREBP in U2OS.
The cells were transfected with human ChREBP expression vector and
incubated for 5 h at 5mM glucose and 10% FCS, then the medium was
changed to 5mM glucose and 2% FCS over night, after that 1 hr starvation
with 5mM glucose and 0% FCS was done. The cells were stimulated with 0.1
and 1mM cyclamate in the presence or absence of 100 nm insulin for 2 h
before fixation, then the cells were analysed by florescence microscope.
Aspartame
0.1 mM and 1 mM of aspartame with or without insulin were tested. There was no
significant difference observed between all samples in absence or presence of insulin.
(Figure 65)
Figure 65. Effect of (0.1 and 1mM) aspartame in the presence or absence of 100 nm
insulin on the subcellular localization of human ChREBP in U2OS.
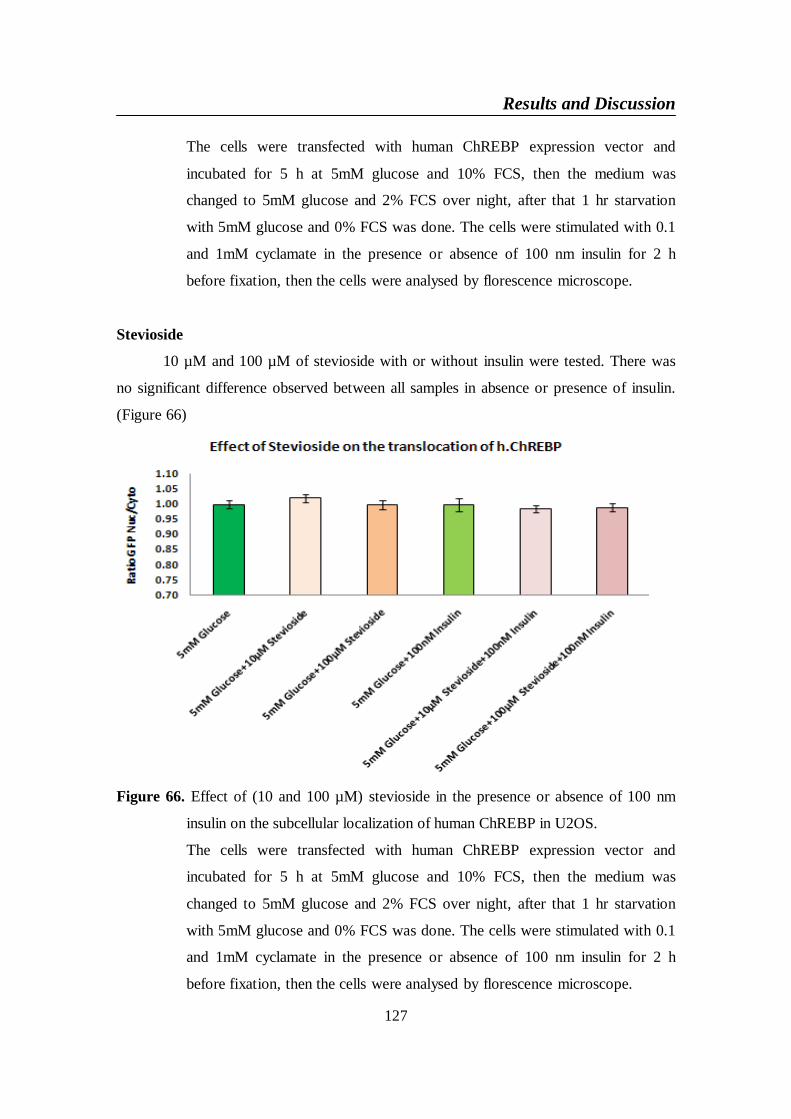
Results and Discussion
127
The cells were transfected with human ChREBP expression vector and
incubated for 5 h at 5mM glucose and 10% FCS, then the medium was
changed to 5mM glucose and 2% FCS over night, after that 1 hr starvation
with 5mM glucose and 0% FCS was done. The cells were stimulated with 0.1
and 1mM cyclamate in the presence or absence of 100 nm insulin for 2 h
before fixation, then the cells were analysed by florescence microscope.
Stevioside
10 µM and 100 µM of stevioside with or without insulin were tested. There was
no significant difference observed between all samples in absence or presence of insulin.
(Figure 66)
Figure 66. Effect of (10 and 100 µM) stevioside in the presence or absence of 100 nm
insulin on the subcellular localization of human ChREBP in U2OS.
The cells were transfected with human ChREBP expression vector and
incubated for 5 h at 5mM glucose and 10% FCS, then the medium was
changed to 5mM glucose and 2% FCS over night, after that 1 hr starvation
with 5mM glucose and 0% FCS was done. The cells were stimulated with 0.1
and 1mM cyclamate in the presence or absence of 100 nm insulin for 2 h
before fixation, then the cells were analysed by florescence microscope.
Results and Discussion
128
The present results document that sodium cyclamate and sodium saccharine
increased the translocation of ChREBP from cytoplasm to the nucleus, in opposite to
aspartame and stevioside that show no effects. No information was so far available on the
effect of artificial sweeteners on the activity and the translocation of ChREBP from
cytoplasm to the nuclease in vitro.
4-3-7. The effect of polyunsaturated fatty acids (PUFAs) on thetranslocation of human ChREBP in U2OS cells
Polyunsaturated fatty acids (PUFAs) are potent inhibitors of hepatic glycolysis
and de novo lipogenesis, through the inhibition of transactivation of genes involved in
glucose utilization and lipid synthesis, including L-pyruvate kinase (L-PK), fatty acid
synthase (FAS), and acetyl-CoA carboxylase (ACC). By regulating these pathways,
PUFAs promote a shift from fatty acid synthesis and storage to oxidation (Jump & Clarke
1999). Carbohydrate-responsive element–binding protein 1 (ChREBP) was shown to play
a pivotal role in the induction of glycolytic and lipogenic genes by glucose (Dentin et al.
2004) by its capacity to bind to the ChoRE present in promoters of these target genes
(Ishii et al. 2004). ChREBP is expressed in liver and is responsive to the nutritional state.
In agreement with (Kawaguchi et al. 2001) study, the GFP-human ChREBP was
mainly detected in the cytosol of U2OS at low glucose concentrations with or without
insulin and migrated into the nucleus when U2OS were cultured at high glucose and
insulin concentrations (Figure 67). The GFP-human ChREBP also showed appropriate
nuclear translocation when U2OS were cultured at high glucose and insulin
concentrations and in the presence of Docosahexaenoic acid (DHA) at all different
concentrations. These results was not in accordance with (Dentin et al. 2005a) who
reported that DHA suppressed ChREBP activity and its translocation, and this difference
in results may be due to using U2OS cells in my study which caused lack of some
essential hepatic enzymes.
In contrast, PUFAs (linoleic acid and eicosapentanoic acid (EPA)) markedly
inhibited nuclear translocation of the GFP-human ChREBP at all concentrations but
highly significantly (p= 0.0183) at 10 µM with EPA. It was noticed that the inhibition of
nuclear translocation of the GFP-human ChREBP decreased with the increase of PUFAs
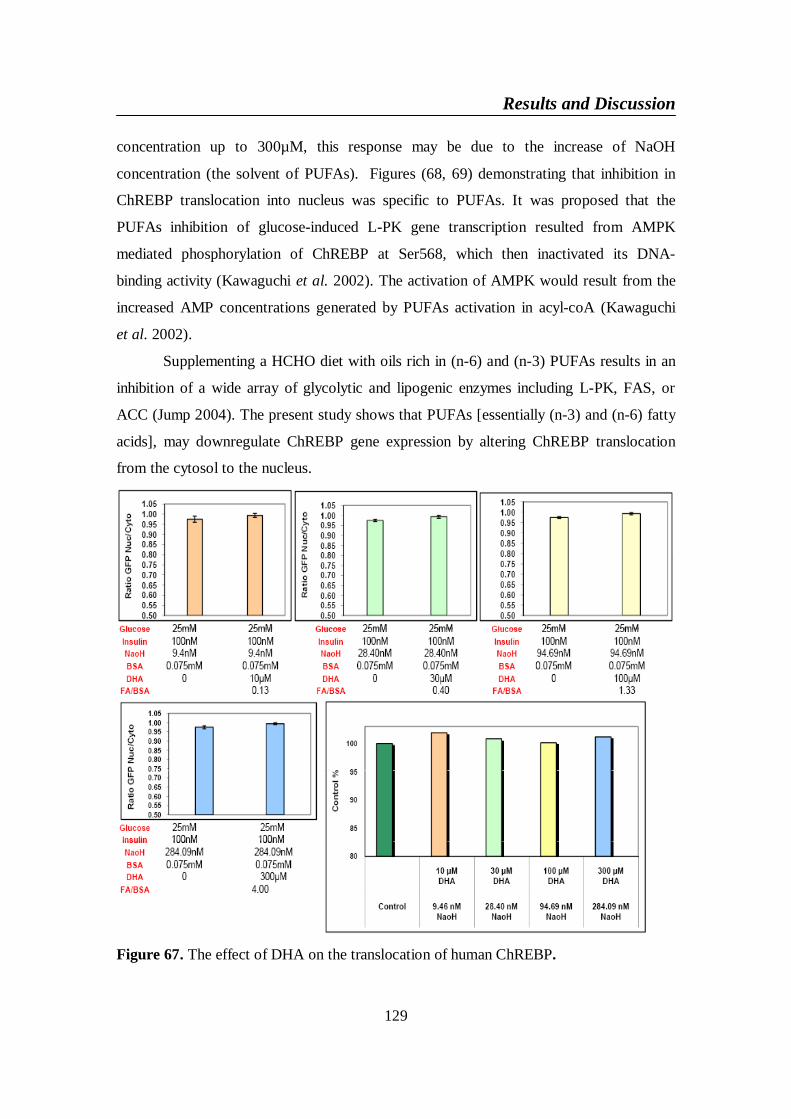
Results and Discussion
129
concentration up to 300µM, this response may be due to the increase of NaOH
concentration (the solvent of PUFAs). Figures (68, 69) demonstrating that inhibition in
ChREBP translocation into nucleus was specific to PUFAs. It was proposed that the
PUFAs inhibition of glucose-induced L-PK gene transcription resulted from AMPK
mediated phosphorylation of ChREBP at Ser568, which then inactivated its DNA-
binding activity (Kawaguchi et al. 2002). The activation of AMPK would result from the
increased AMP concentrations generated by PUFAs activation in acyl-coA (Kawaguchi
et al. 2002).
Supplementing a HCHO diet with oils rich in (n-6) and (n-3) PUFAs results in an
inhibition of a wide array of glycolytic and lipogenic enzymes including L-PK, FAS, or
ACC (Jump 2004). The present study shows that PUFAs [essentially (n-3) and (n-6) fatty
acids], may downregulate ChREBP gene expression by altering ChREBP translocation
from the cytosol to the nucleus.
Figure 67. The effect of DHA on the translocation of human ChREBP.
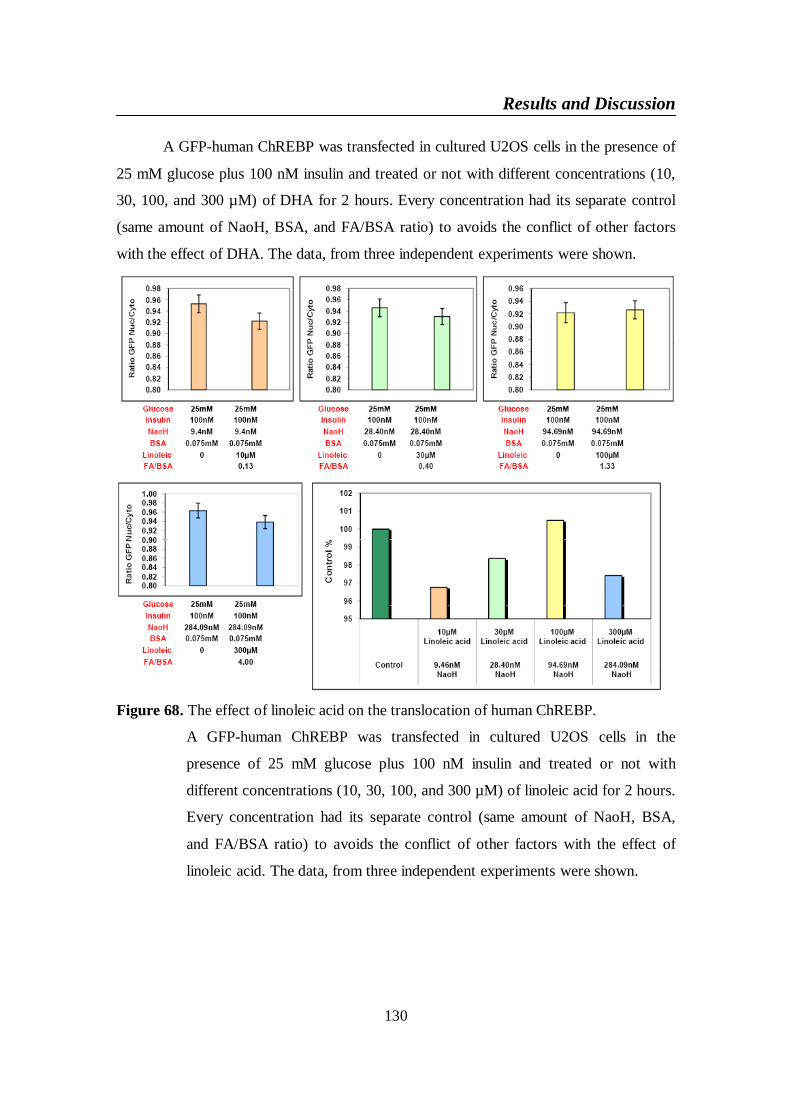
Results and Discussion
130
A GFP-human ChREBP was transfected in cultured U2OS cells in the presence of
25 mM glucose plus 100 nM insulin and treated or not with different concentrations (10,
30, 100, and 300 µM) of DHA for 2 hours. Every concentration had its separate control
(same amount of NaoH, BSA, and FA/BSA ratio) to avoids the conflict of other factors
with the effect of DHA. The data, from three independent experiments were shown.
Figure 68. The effect of linoleic acid on the translocation of human ChREBP.
A GFP-human ChREBP was transfected in cultured U2OS cells in the
presence of 25 mM glucose plus 100 nM insulin and treated or not with
different concentrations (10, 30, 100, and 300 µM) of linoleic acid for 2 hours.
Every concentration had its separate control (same amount of NaoH, BSA,
and FA/BSA ratio) to avoids the conflict of other factors with the effect of
linoleic acid. The data, from three independent experiments were shown.
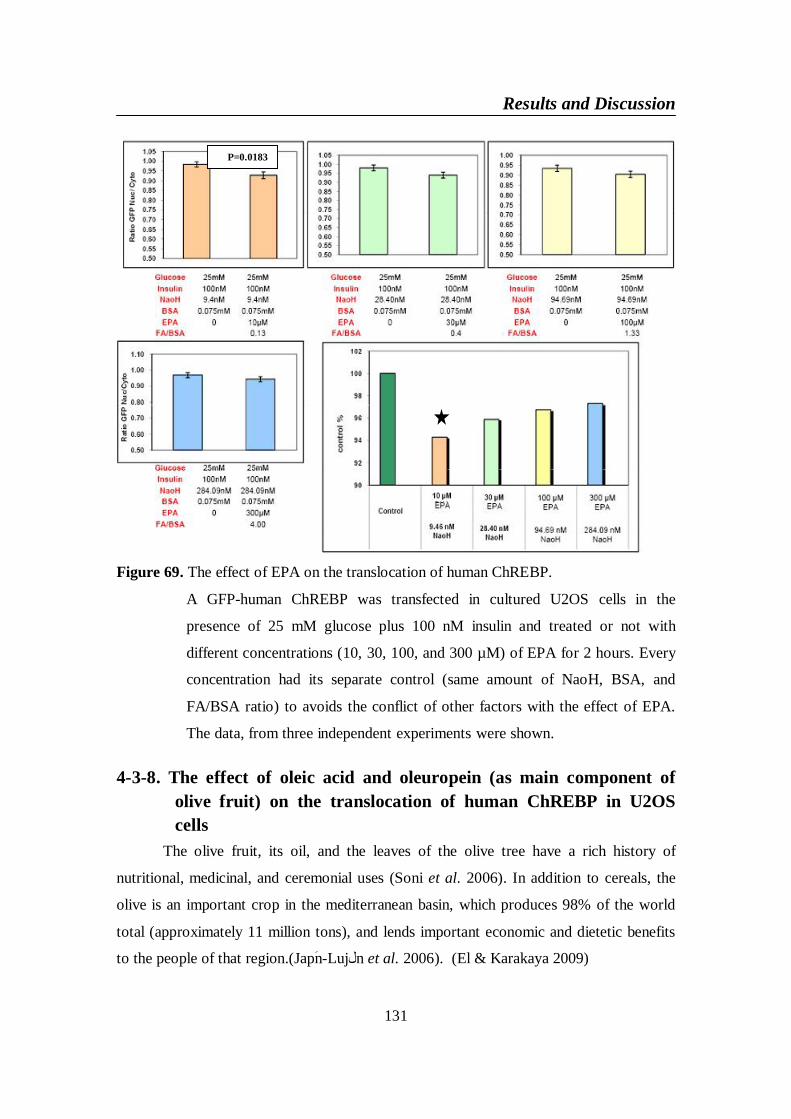
Results and Discussion
131
Figure 69. The effect of EPA on the translocation of human ChREBP.
A GFP-human ChREBP was transfected in cultured U2OS cells in the
presence of 25 mM glucose plus 100 nM insulin and treated or not with
different concentrations (10, 30, 100, and 300 µM) of EPA for 2 hours. Every
concentration had its separate control (same amount of NaoH, BSA, and
FA/BSA ratio) to avoids the conflict of other factors with the effect of EPA.
The data, from three independent experiments were shown.
4-3-8. The effect of oleic acid and oleuropein (as main component ofolive fruit) on the translocation of human ChREBP in U2OScells
The olive fruit, its oil, and the leaves of the olive tree have a rich history of
nutritional, medicinal, and ceremonial uses (Soni et al. 2006). In addition to cereals, the
olive is an important crop in the mediterranean basin, which produces 98% of the world
total (approximately 11 million tons), and lends important economic and dietetic benefits
to the people of that region.(Japn-Luj n et al. 2006). (El & Karakaya 2009)
P=0.0183
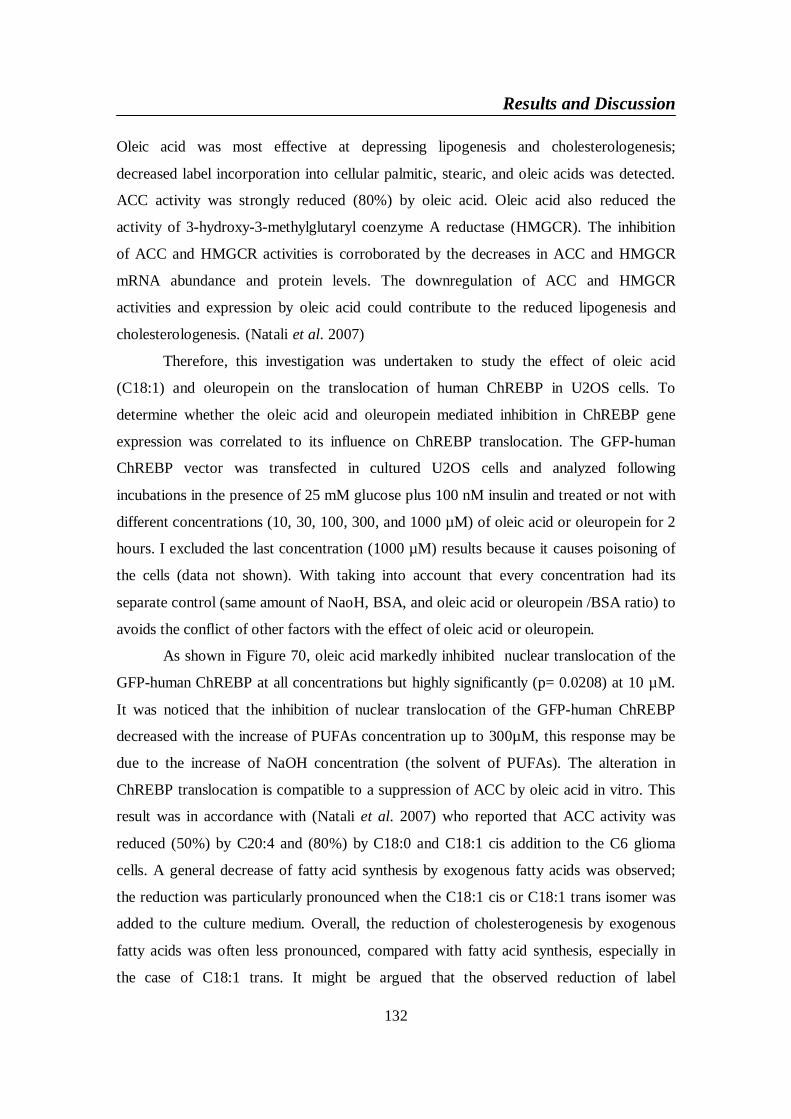
Results and Discussion
132
Oleic acid was most effective at depressing lipogenesis and cholesterologenesis;
decreased label incorporation into cellular palmitic, stearic, and oleic acids was detected.
ACC activity was strongly reduced (80%) by oleic acid. Oleic acid also reduced the
activity of 3-hydroxy-3-methylglutaryl coenzyme A reductase (HMGCR). The inhibition
of ACC and HMGCR activities is corroborated by the decreases in ACC and HMGCR
mRNA abundance and protein levels. The downregulation of ACC and HMGCR
activities and expression by oleic acid could contribute to the reduced lipogenesis and
cholesterologenesis. (Natali et al. 2007)
Therefore, this investigation was undertaken to study the effect of oleic acid
(C18:1) and oleuropein on the translocation of human ChREBP in U2OS cells. To
determine whether the oleic acid and oleuropein mediated inhibition in ChREBP gene
expression was correlated to its influence on ChREBP translocation. The GFP-human
ChREBP vector was transfected in cultured U2OS cells and analyzed following
incubations in the presence of 25 mM glucose plus 100 nM insulin and treated or not with
different concentrations (10, 30, 100, 300, and 1000 µM) of oleic acid or oleuropein for 2
hours. I excluded the last concentration (1000 µM) results because it causes poisoning of
the cells (data not shown). With taking into account that every concentration had its
separate control (same amount of NaoH, BSA, and oleic acid or oleuropein /BSA ratio) to
avoids the conflict of other factors with the effect of oleic acid or oleuropein.
As shown in Figure 70, oleic acid markedly inhibited nuclear translocation of the
GFP-human ChREBP at all concentrations but highly significantly (p= 0.0208) at 10 µM.
It was noticed that the inhibition of nuclear translocation of the GFP-human ChREBP
decreased with the increase of PUFAs concentration up to 300µM, this response may be
due to the increase of NaOH concentration (the solvent of PUFAs). The alteration in
ChREBP translocation is compatible to a suppression of ACC by oleic acid in vitro. This
result was in accordance with (Natali et al. 2007) who reported that ACC activity was
reduced (50%) by C20:4 and (80%) by C18:0 and C18:1 cis addition to the C6 glioma
cells. A general decrease of fatty acid synthesis by exogenous fatty acids was observed;
the reduction was particularly pronounced when the C18:1 cis or C18:1 trans isomer was
added to the culture medium. Overall, the reduction of cholesterogenesis by exogenous
fatty acids was often less pronounced, compared with fatty acid synthesis, especially in
the case of C18:1 trans. It might be argued that the observed reduction of label
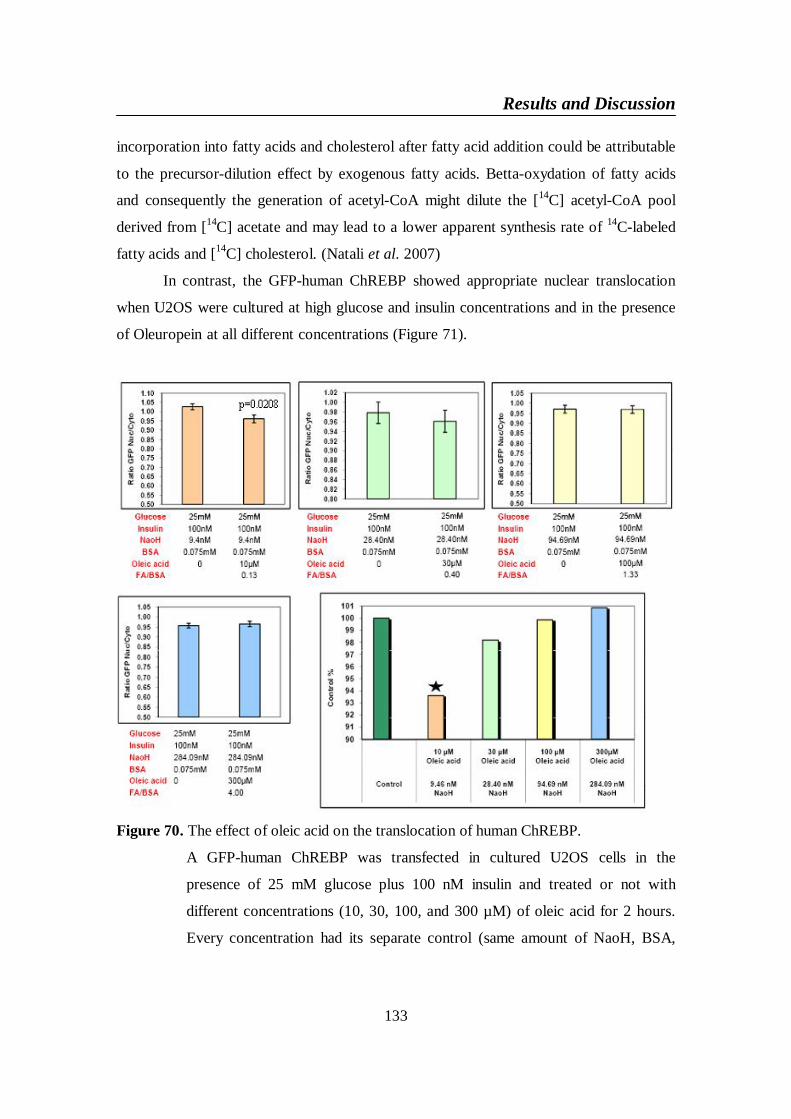
Results and Discussion
133
incorporation into fatty acids and cholesterol after fatty acid addition could be attributable
to the precursor-dilution effect by exogenous fatty acids. Betta-oxydation of fatty acids
and consequently the generation of acetyl-CoA might dilute the [14C] acetyl-CoA pool
derived from [14C] acetate and may lead to a lower apparent synthesis rate of 14C-labeled
fatty acids and [14C] cholesterol. (Natali et al. 2007)
In contrast, the GFP-human ChREBP showed appropriate nuclear translocation
when U2OS were cultured at high glucose and insulin concentrations and in the presence
of Oleuropein at all different concentrations (Figure 71).
Figure 70. The effect of oleic acid on the translocation of human ChREBP.
A GFP-human ChREBP was transfected in cultured U2OS cells in the
presence of 25 mM glucose plus 100 nM insulin and treated or not with
different concentrations (10, 30, 100, and 300 µM) of oleic acid for 2 hours.
Every concentration had its separate control (same amount of NaoH, BSA,
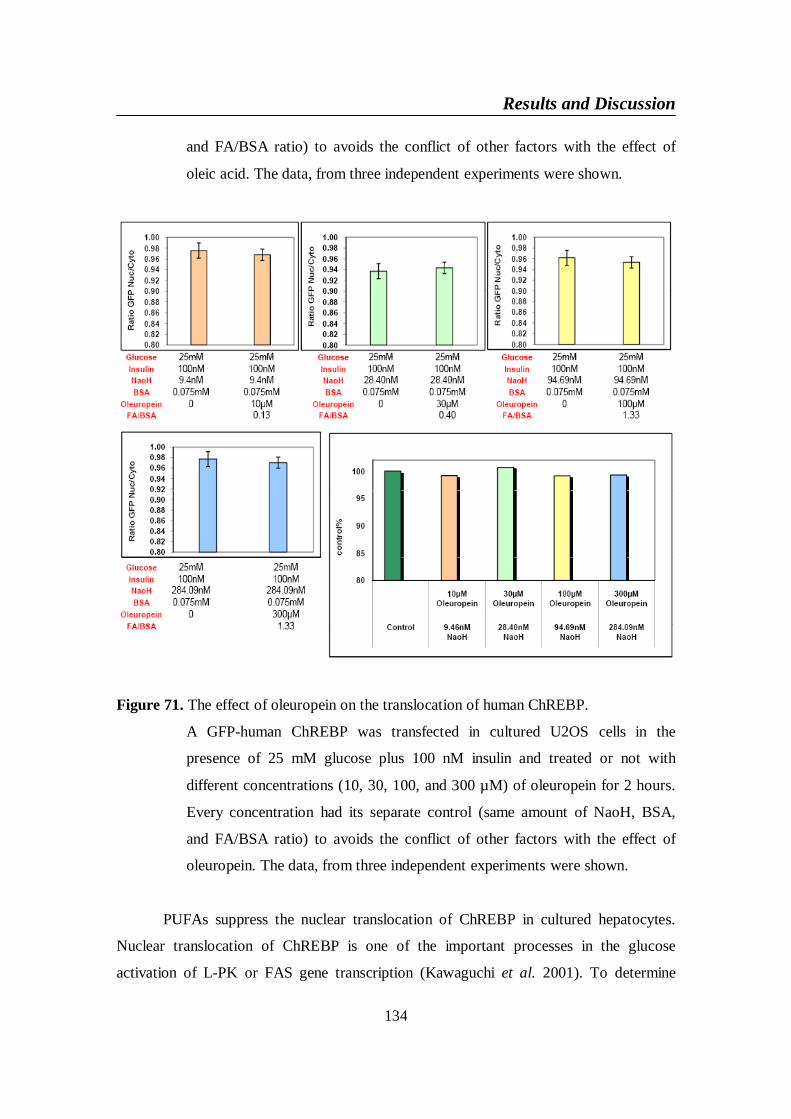
Results and Discussion
134
and FA/BSA ratio) to avoids the conflict of other factors with the effect of
oleic acid. The data, from three independent experiments were shown.
Figure 71. The effect of oleuropein on the translocation of human ChREBP.
A GFP-human ChREBP was transfected in cultured U2OS cells in the
presence of 25 mM glucose plus 100 nM insulin and treated or not with
different concentrations (10, 30, 100, and 300 µM) of oleuropein for 2 hours.
Every concentration had its separate control (same amount of NaoH, BSA,
and FA/BSA ratio) to avoids the conflict of other factors with the effect of
oleuropein. The data, from three independent experiments were shown.
PUFAs suppress the nuclear translocation of ChREBP in cultured hepatocytes.
Nuclear translocation of ChREBP is one of the important processes in the glucose
activation of L-PK or FAS gene transcription (Kawaguchi et al. 2001). To determine
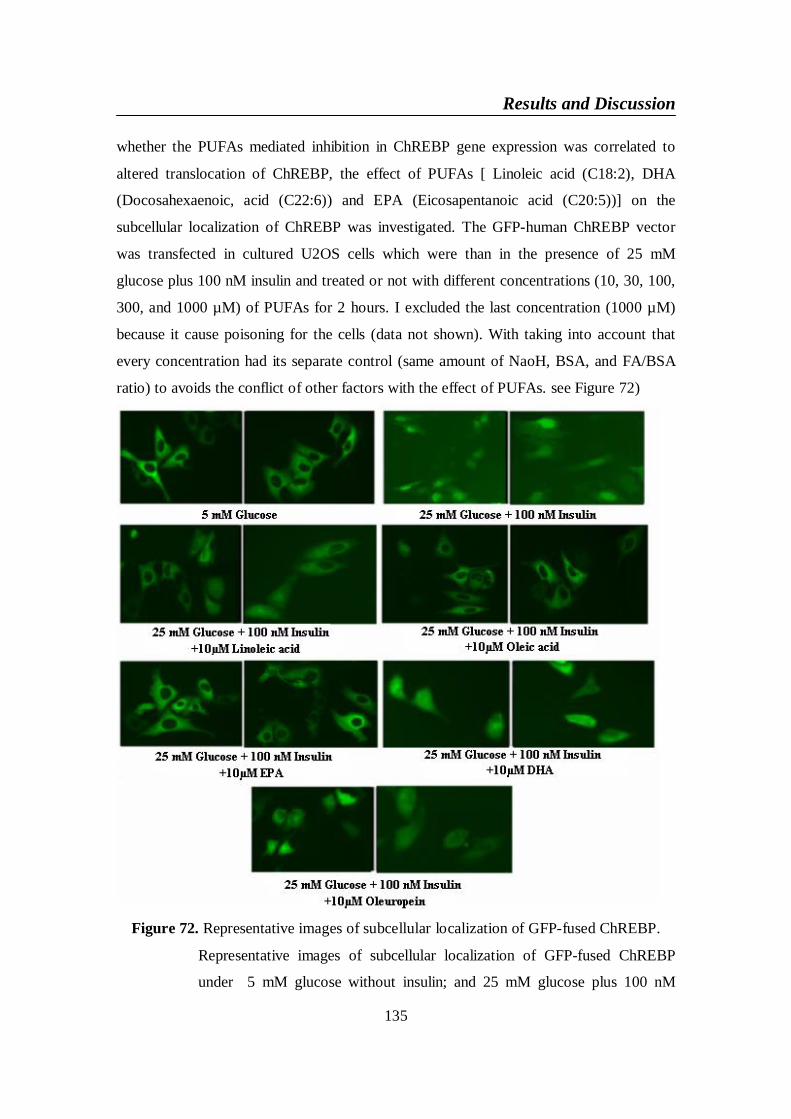
Results and Discussion
135
whether the PUFAs mediated inhibition in ChREBP gene expression was correlated to
altered translocation of ChREBP, the effect of PUFAs [ Linoleic acid (C18:2), DHA
(Docosahexaenoic, acid (C22:6)) and EPA (Eicosapentanoic acid (C20:5))] on the
subcellular localization of ChREBP was investigated. The GFP-human ChREBP vector
was transfected in cultured U2OS cells which were than in the presence of 25 mM
glucose plus 100 nM insulin and treated or not with different concentrations (10, 30, 100,
300, and 1000 µM) of PUFAs for 2 hours. I excluded the last concentration (1000 µM)
because it cause poisoning for the cells (data not shown). With taking into account that
every concentration had its separate control (same amount of NaoH, BSA, and FA/BSA
ratio) to avoids the conflict of other factors with the effect of PUFAs. see Figure 72)
Figure 72. Representative images of subcellular localization of GFP-fused ChREBP.
Representative images of subcellular localization of GFP-fused ChREBP
under 5 mM glucose without insulin; and 25 mM glucose plus 100 nM
Results and Discussion
136
insulin with or without 10 µM of albumin-bound of DHA [C22:6 (n-3)],
linoleic acid [C18:2 (n-6)], EPA [C20:5]
4-3-9. U2OS stable transfection with h. ChREBPStable transfection is the type of transfection where genetic material that is
introduced into a cell is retained beyond reproduction. Transfection is the process in
which foreign DNA is introduced into eukaryotic cells through chemically-created
"gates" in the cell membrane. Only stable transfections allow the new DNA to be
reproduced when the cell divides to create daughter cells. Stable transfections that are
experimentally useful are induced by co-transfecting another gene that can give the cell a
selection advantage, typically resistance to a particular antibiotic. After mitosis, the cells
produced are exposed to the antibiotic. The cells with tranfected with the corresponding
antibiotic resistance gene will survive, while most of the normal cells will die. After
many rounds of mitosis and antibiotic, only cells with the expressed resistance gene will
survive. Stable transfections are at the core of gene therapy. Only through a stable
transfection can a faulty gene be permanently replaced. The generation of stably-
transfected cell lines is essential for a wide range of applications, such as gene function
studies (Grimm 2004), drug discovery assays or the production of recombinant proteins.
In contrast to transient expression, stable expression allows long term, as well as defined
and reproducible, expression of the gene of interest. (Wurm 2004). I succeeded to
generate stable transfection cell line by transfection of U2OS cells with the p human
ChREBP-GFP vector that also encodes for neomycin phosphotransferase gene.
Transfected cells that express neomycin phosphotransferase were selected by medium
supplemented with G418 antibiotic. Cultures were propagated in which about 80% of the
stable transfected cells showed GFP expression. Because GFP is 3`to ChREBP in the use
p human ChREBP-GFP the expression of GFP predicts the espression of human ChREBP
(Figure 73).
This stable cell line should have the virtues of better reproducible resuts. The use
of these cells will enable to save the time and costs because no additional transfections
are necessary.
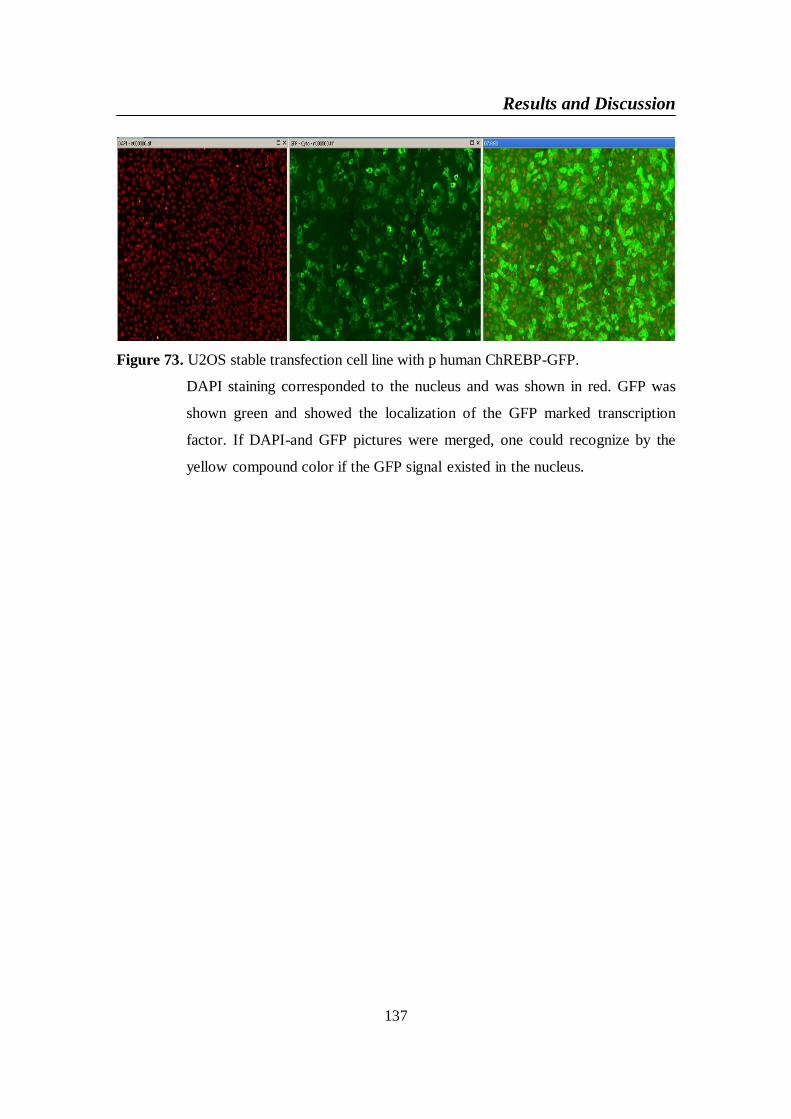
Results and Discussion
137
Figure 73. U2OS stable transfection cell line with p human ChREBP-GFP.
DAPI staining corresponded to the nucleus and was shown in red. GFP was
shown green and showed the localization of the GFP marked transcription
factor. If DAPI-and GFP pictures were merged, one could recognize by the
yellow compound color if the GFP signal existed in the nucleus.
Conclusion
138
5- CONCLUSIONIn the context of the regulation of lipid metabolism in liver, the role of the
transcription factor carbohydrate responsive element binding protein (ChREBP) was
investigated. ChREBP is important for the regulation of glycolysis, lipogenesis and
inhibition of mitochondrial beta-oxidation. ChREBP has a pivotal role in the control of
these pathways. This signal transduction is of utmost importance for concepts of
nutrition. If hepatic lipogenesis is inhabitable by n3 and n6 fatty acids, their intake should
influence the development of fatty liver.
First I tried to clone human ChREBP in a Green Fluorescent Protein (GFP)
encoding vector but I did not succeed Figures (42, 43). So, I tried to test the influence of
the different dietary elements on the translocation of mouse GFP-ChREBP which kindly
provided by Ms. Catherine Postic, Insitut Cochin, Département d’ Endocrinologie,
Métabolisme et Cancer, Université Paris Descartes, Paris, France. I noticed that there
were no significant effects of glucose and insulin on translocation of mouse ChREBP in
U2OS, HUH7 and HepG2 cells. The results of the sequencing showed that, the first four
amino acids of the mouse ChREBP were not encoded in the GFP-mouse ChREBP vector.
These four missing amino acids could be the responsible for a different conformation of
the protein which would affect its regulation Figure (48).
Finally, I succeeded to construct an expression vector coding for GFP tagged
human ChREBP using a human ChREBP cDNA vector created by OriGene Technologies
and an expression vector encoding GFP Figures (57, 58). With this construct I tested the
influence of different dietary elements on this regulation that is scarcely investigated. The
action of ChREBP and its translocation from cytoplasm to the nucleus was monitored by
fluorescence microscope. The influence of different fatty acids (MUFA and PUFA n3/n6)
on the translocation of the human ChREBP was tested. In addition the impact of
polyphenols from olive oil and different kind of sweeteners on this translocation was
examined.
My in vitro results demonstrate that in the presence of 25 mM glucose and 100
nM insulin, the human ChREBP translocated from the cytoplasm to the nucleus in U2OS
cells (P=0.005). At low glucose concentration (5 mM) with or without insulin no
significant amount of ChREBP in the nucleus was notable Figure (61). There was
Conclusion
139
no significant difference observed between low fructose (5mM) with or without 100 nM
insulin and high fructose (25mM) without insulin. On the other hand, there was highly
significant difference (p= 0.00026) observed between control and high fructose
in presence of insulin Figure (62). 0.1 and 1 mM of cyclamate, saccharine and aspartame
with or without insulin were tested. There was no significant difference observed
between all samples in absence of insulin except with 1 mM saccharine (p= 0.006)
and there was no effect of concentration 0.1 mM for all substances and 1 mM of
aspartame in the presence of insulin. On the other hand, there was significant difference
(p= 0.007) and (p= 0.002) observed between control and 1 mM cyclamate and saccharine
respectively, in the presence of insulin (Figures 63, 64 and 65). Figure (66) showed that
there was no significant effect of 10 µM and 100 µM of stevioside in absence or
presence of insulin.
From the present study, it can be concluded that there was no significant effect of
docosahexaenoic acid and oleuropein on nuclear translocation of the GFP-human
ChREBP at all concentrations tested (10, 30, 100, and 300 µM) Figures (67, 71). In
contrast, linoleic, eicosapentanoic and oleic acids markedly inhibited nuclear
translocation of the p human ChREBP- GFP at all concentrations but significantly (p=
0.0183 and 0.0208) at 10 µM for eicosapentanoic and oleic acids respectively, Figures
68, 69, and 70).
From the previous results, the replacement of sugar by artificial sweeteners
(aspartame and stevioside) in the diet may be of importance in liver disease. Dietary fish
oil might be useful for preventing fatty liver disease because it contains n-3 fatty acids,
such as eicosapentaenoic acid. A Mediterranean diet has been proposed for the
prevention of metabolic syndrome. The major part of its beneficial effect is a high supply
of energy coming from monounsaturated fatty acids (oleic acid), mainly from olive oil
which prevent the translocation of human ChREBP into the nucleus which may prevent
or improve fatty liver disease.
References
140
6- REFERENCESAbdelmalek MF & Diehl AM 2007 Nonalcoholic fatty liver disease as a complication of
insulin resistance. Med Clin North Am. 91 1125-49.
Abid A, Taha O, Nseir W, Farah R GM & Assy N 2009 Soft drink consumption is
associated with fatty liver disease independent of metabolic syndrome. J Hepatol.
51 918-24.
Abu-Elheiga L, Oh W, Kordari P & Wakil SJ 2003 Acetyl-CoA carboxylase 2 mutant
mice are protected against obesity and diabetes induced by high-fat/high-
carbohydrate diets. Proc Natl Acad Sci U S A. 100 10207-12.
Adams LA & Lindor KD 2007 Nonalcoholic fatty liver disease. Ann Epidemiol. 17 863-
9.
Adamson AW, Suchankova G, Rufo C, Nakamura MT & Teran-Garcia M 2006
Hepatocyte nuclear factor-4alpha contributes to carbohydrate-induced
transcriptional activation of hepatic fatty acid synthase. Biochem J. 399 285-95.
Agius L, Peak M & Van Schaftingen E 1995 The regulatory protein of glucokinase binds
to the hepatocyte matrix, but, unlike glucokinase, does not translocate during
substrate stimulation. Biochem J. 309 711-3.
Ahmed FE & Thomas DB 1992 Assessment of the Carcinogenicity of the Nonnutritive
Sweetener Cyclamate. Critical Reviews in Toxicology 22 81-118.
Ahmed MH & Byrne CD 2007 Modulation of sterol regulatory element binding proteins
(SREBPs) as potential treatments for non-alcoholic fatty liver disease (NAFLD).
Drug Discov Today. 12 740-7.
Angulo P 2002 Nonalcoholic fatty liver disease. N Engl J Med. 346 1221-31.
Assy N, Nasser G, Kamayse I, Nseir W, Beniashvili Z, Djibre A & Grosovski M 2008
Soft drink consumption linked with fatty liver in the absence of traditional risk
factors. Can J Gastroenterol. 22 811-6.
Audreith LF & Sveda M 1944 Preparation and Properties of Some N-Substituted
Sulfamic Acids. J.Org.Chem. 9 89-101.
Barclay WR, Meager KM & Abril JR 1994 Heterotrophic production of long-chain
omega-3-fatty-acids utilizing algae and algae-like microorganisms. Journal of
Applied Phycology 6 123-129.
References
141
Barlattani M 1970 Rassegne sintetiche di terapia. II problema dei ciclamati. CI Terap 52
565.
Billin AN, Eilers AL, Coulter KL, Logan JS & Ayer DE 2000 MondoA, a novel basic
helix-loop-helix-leucine zipper transcriptional activator that constitutes a positive
branch of a max-like network. Mol Cell Biol. 20 8845-54.
Bollen M, Keppens S & Stalmans W 1998 Specific features of glycogen metabolism in
the liver. Biochem J. 336 19-31.
Botolin D, Wang Y, Christian B & Jump DB 2006 Docosahexaneoic acid (22:6,n-3)
regulates rat hepatocyte SREBP-1 nuclear abundance by Erk- and 26S
proteasome-dependent pathways. J Lipid Res. 47 181-92.
Brahmachari G, Mandal LC, Roy R, Mondal S & Brahmachari AK 2010 Stevioside and
Related Compounds – Molecules of Pharmaceutical Promise A Critical Overview.
Arch Pharm (Weinheim). 344 5-19.
Brown MS & Goldstein JL 1997 The SREBP pathway: regulation of cholesterol
metabolism by proteolysis of a membrane-bound transcription factor. Cell. 89
331-40.
Brown RJ, Walter M & Rother KI 2009 Ingestion of diet soda before a glucose load
augments glucagon-like peptide-1 secretion. Diabetes Care. 32 2184-6.
Browning JD & Horton JD 2004 Molecular mediators of hepatic steatosis and liver
injury. J Clin Invest. 114 147-152.
Burke SJ, Collier JJ & Scott DK 2009 cAMP opposes the glucose-mediated induction of
the L-PK gene by preventing the recruitment of a complex containing ChREBP,
HNF4{alpha}, and CBP. FASEB J 23 2855-65.
Burnett L 2007 SWEETNESS LITE?: ARTIFICIAL SWEETENER CONTROVERSIES
FROM SACCHARIN TO SUCRALOSE. In Satisfaction of the Winter 2007 Food
and Drug Law Course Requirement, pp 1-25. Ed L Burnett. Harvard Law School.
Burr GO, Burr MM & Miller E 1930 On the nature and role of the fatty acids essential in
nutrition. Journal of Biological Chemistry 86 587.
Cairo S, Merla G, Urbinati F, Ballabio A & Reymond A 2001 WBSCR14, a gene
mapping to the Williams--Beuren syndrome deleted region, is a new member of
the Mlx transcription factor network. Hum.Mol Genet 10 617-627.
References
142
Carmen GY & Victor SM 2006 Signalling mechanisms regulating lipolysis. Cell Signal.
18 401-8.
Ceriello A 2000 Oxidative stress and glycemic regulation. Metabolism. 49 27-9.
Cha JY & Repa JJ 2007 The liver X receptor (LXR) and hepatic lipogenesis. The
carbohydrate-response element-binding protein is a target gene of LXR. J
Biol.Chem. 282 743-751.
Charlton M. 2004 Nonalcoholic fatty liver disease: a review of current understanding and
future impact. Clin Gastroenterol Hepatol. 2 1048-1058.
Chatsudthipong V & Muanprasat C 2009 Stevioside and related compounds: therapeutic
benefits beyond sweetness. Pharmacol.Ther. 121 41-54.
Chaudhry J, Ghosh NN, Roy K & Chandra R 2007 Antihyperglycemic effect of a new
thiazolidinedione analogue and its role in ameliorating oxidative stress in alloxan-
induced diabetic rats. Life Sciences 80 1135-42.
Chen G, Liang G, Ou J, Goldstein JL & Brown MS 2004 Central role for liver X receptor
in insulin-mediated activation of Srebp-1c transcription and stimulation of fatty
acid synthesis in liver. Proc.Natl.Acad.Sci U S.A 101 11245-11250.
Cho E, Spiegelman D, Hunter DJ, Chen WY, Stampfer MJ, Colditz GA & Willett WC
2003 Premenopausal fat intake and risk of breast cancer. J Natl Cancer Inst. 95
1079-85.
Choi YH, Kim I, Yoon KD, Lee SJ, Kim CY, Yoo KP & et al. 2002 Supercritical fluid
extraction and liquid chromatographic-electrospray mass spectrometric analysis of
stevioside from Stevia rebaudiana leaves. Chromatographia 55 617-20.
Chu K, Miyazaki M, Man WC & Ntambi JM 2006 Stearoyl-coenzyme A desaturase 1
deficiency protects against hypertriglyceridemia and increases plasma high-
density lipoprotein cholesterol induced by liver X receptor activation. Mol Cell
Biol. 26 6786-98.
Clark JM & Diehl AM 2003 Nonalcoholic fatty liver disease: an underrecognized cause
of cryptogenic cirrhosis. JAMA 289 3000-4.
Clarke SD 2004 The multi-dimensional regulation of gene expression by fatty acids:
polyunsaturated fats as nutrient sensors. Curr Opin Lipidol. 15 13-8.
References
143
Coleman RA, Lewin TM, Van Horn CG & Gonzalez-Bar MR 2002 Do long-chain acyl-
CoA synthetases regulate fatty acid entry into synthetic versus degradative
pathways? J Nutr. 132 2123-6.
Colosia AD, Marker AJ, Lange AJ, el-Maghrabi MR, Granner DK, Tauler A, Pilkis J &
Pilkis SJ 1988 Induction of rat liver 6-phosphofructo-2-kinase/fructose-2,6-
bisphosphatase mRNA by refeeding and insulin. J Biol Chem. 263 18669-77.
Cournarie F, Azzout-Marniche D, Foretz M, Guichard C, Ferre P & Foufelle F 1999 The
inhibitory effect of glucose on phosphoenolpyruvate carboxykinase gene
expression in cultured hepatocytes is transcriptional and requires glucose
metabolism. FEBS Letters 460 527-32.
da Silva Xavier G, Rutter GA, Diraison F, Andreolas C & Leclerc I 2006 ChREBP
binding to fatty acid synthase and L-type pyruvate kinase genes is stimulated by
glucose in pancreatic beta-cells. J Lipid Res. 47 2482-91.
Davail S, Rideau N, Bernadet MD, André JM, Guy G & Hoo-Paris R 2005 Effects of
dietary fructose on liver steatosis in overfed mule ducks. Horm Metab Res. 37 32-
5.
de la Pen~a C 2010 Artificial sweetener as a historical window to culturally situated
health. Ann N Y Acad Sci. 1190 159-65.
de Luis O, Valero MC & Jurado LA 2000 WBSCR14, a putative transcription factor gene
deleted in Williams-Beuren syndrome: complete characterisation of the human
gene and the mouse ortholog. Eur.J Hum.Genet 8 215-222.
DE MATOS MA, MARTINS AT & AZOUBEL R 2006 Effects of Sodium Cyclamate on
the Rat Placenta: A Morphometric Study. J.Morphol. 24 137-142.
Decaux JF, Antoine B & Kahn A 1989 Regulation of the expression of the L-type
pyruvate kinase gene in adult rat hepatocytes in primary culture. J Biol Chem. 264
11584-90.
Denechaud PD, Bossard P, Lobaccaro JM, Millatt L, Staels B, Girard J & Postic C 2008a
ChREBP, but not LXRs, is required for the induction of glucose-regulated genes
in mouse liver. Journal of Clinical Investigation 118 956-964.
Denechaud PD, Dentin R, Girard J & Postic C 2008b Role of ChREBP in hepatic
steatosis and insulin resistance. FEBS Letters 582 68-73.
References
144
Dentin R, Benhamed F, Hainault I, Fauveau V, Foufelle F, Dyck JR, Girard J & Postic C
2006a Liver-specific inhibition of ChREBP improves hepatic steatosis and insulin
resistance in ob/ob mice. Diabetes 55 2159-2170.
Dentin R, Benhamed F, Pegorier JP, Foufelle F, Viollet B, Vaulont S, Girard J & Postic
C 2005a Polyunsaturated fatty acids suppress glycolytic and lipogenic genes
through the inhibition of ChREBP nuclear protein translocation. Journal of
Clinical Investigation 115 2843-2854.
Dentin R, Denechaud PD, Benhamed F, Girard J & Postic C 2006b Hepatic gene
regulation by glucose and polyunsaturated fatty acids: a role for ChREBP. J Nutr.
136 1145-1149.
Dentin R, Girard J & Postic C 2005b Carbohydrate responsive element binding protein
(ChREBP) and sterol regulatory element binding protein-1c (SREBP-1c): two key
regulators of glucose metabolism and lipid synthesis in liver. Biochimie 87 81-86.
Dentin R, Pegorier JP, Benhamed F, Foufelle F, Ferre P, Fauveau V, Magnuson MA,
Girard J & Postic C 2004 Hepatic glucokinase is required for the synergistic
action of ChREBP and SREBP-1c on glycolytic and lipogenic gene expression. J
Biol.Chem. 279 20314-20326.
Dhe-Paganon S, Duda K, Iwamoto M, Chi YI & Shoelson SE 2002 Crystal structure of
the HNF4 alpha ligand binding domain in complex with endogenous fatty acid
ligand. J Biol Chem. 277 37973-6.
Dhingra R, Sullivan L, Jacques PF, Wang TJ, Fox CS, Meigs JB, D'Agostino RB,
Gaziano JM & Vasan RS 2007 Soft drink consumption and risk of developing
cardiometabolic risk factors and the metabolic syndrome in middle-aged adults in
the community. Circulation. 116 480-8.
Diaz Guerra MJ, Bergot MO, Martinez A, Cuif MH, Kahn A & Raymondjean M 1993
Functional characterization of the L-type pyruvate kinase gene glucose response
complex. Mol Cell Biol. 13 7725-33.
DiRusso CC, Li H, Darwis D, Watkins PA, Berger J & Black PN 2005 Comparative
biochemical studies of the murine fatty acid transport proteins (FATP) expressed
in yeast. J Biol Chem. 280 16829-37.
References
145
Doiron B, Cuif MH, Chen R & Kahn A 1996 Transcriptional glucose signaling through
the glucose response element is mediated by the pentose phosphate pathway. J
Biol Chem. 271 5321-4.
Donnelly KL, Smith CI, Schwarzenberg SJ, Jessurun J, Boldt MD & Parks EJ 2005
Sources of fatty acids stored in liver and secreted via lipoproteins in patients with
nonalcoholic fatty liver disease. J Clin Invest. 115 1343-51.
Duplus E, Glorian M & Forest C 2000 Fatty acid regulation of gene transcription. J Biol
Chem. 275 30749-52.
Edgecombe SC, Stretch GL & Hayball PJ 2000b Oleuropein, an antioxidant polyphenol
from olive oil, is poorly absorbed from isolated perfused rat intestine. J Nutr. 130
2996-3002.
Edgecombe SC, Stretch GL & Hayball PJ 2000a Oleuropein, an antioxidant polyphenol
from olive oil, is poorly absorbed from isolated perfused rat intestine. J Nutr. 130
2996-3002.
EHHP 2000 Artificial sweeteners – What's out there? Nutrition Notes Newsletter 1 3.
El SN & Karakaya S 2009 Olive tree (Olea europaea) leaves: potential beneficial effects
on human health. Nutr Rev. 67 632-8.
Elkins R 1997 Stavia: Nature's sweetener. Orem: Woodland Publishing.
Elshourbagy NA, Near JC, Kmetz PJ, Sathe GM, Southan C & et al. 1990 Rat ATP
Citrate-Lyase molecular cloning and sequence analysis of A full-length cDNA
and mRNA abundance as a function of diet, organ, and age. The Journal Of
Biological Chemistry 265 1430-1435.
Fahlberg C & Remsen I 1879 Ueber die Oxydation des Orthotoluolsulfamids. Berichte
der deutschen chemischen Gesellschaft 12 469-473.
Ferland A, Brassard P & Poirier P 2007 Is aspartame really safer in reducing the risk of
hypoglycemia during exercise in patients with type 2 diabetes? Diabetes Care. 30
e59.
Ferrannini E & Balkau B 2002 Insulin: in search of a syndrome. Diabet Med. 19 724-9.
Flowers MT, Miyazaki M, Liu X & Ntambi JM 2006 Probing the role of stearoyl-CoA
desaturase-1 in hepatic insulin resistance. J Clin Invest. 116 1478-81.
Foretz M, Guichard C, Ferre P & Foufelle F 1999a Sterol regulatory element binding
protein-1c is a major mediator of insulin action on the hepatic expression of
References
146
glucokinase and lipogenesis-related genes. Proc.Natl.Acad.Sci.U.S.A 96 12737-
12742.
Foretz M, Pacot C, Dugail I, Lemarchand P, Guichard C, Le Liepvre X & et al. 1999b
ADD1/SREBP-1c Is Required in the Activation of Hepatic Lipogenic Gene
Expression by Glucose. Molecular and Cellular Biology 19 3760-8.
Foufelle F & Ferr´e P 2002 New perspectives in the regulation of hepatic glycolytic and
lipogenic genes by insulin and glucose : a role for the transcription factor sterol
regulatory element binding protein-1c. Biochem.J. 366 377-391.
Foufelle F, Girard J & Ferre P 1996 Regulation of lipogenic enzyme expression by
glucose in liver and adipose tissue: a review of the potential cellular and
molecular mechanisms. Adv Enzyme Regul. 36 199-226.
Geuns JM 2003 Stevioside. Phytochemistry 64 913-21.
Gregori C, Guillet-Deniau I, Girard J, Decaux JF & Pichard AL 2006 Insulin regulation
of glucokinase gene expression: evidence against a role for sterol regulatory
element binding protein 1 in primary hepatocytes. FEBS Letters 580 410-4.
Grimm S 2004 The art and design of genetic screens: mammalian culture cells. Nature
Reviews Genetics 5 179-189.
Gumieniczek A 2005 Effects of pioglitazone on hyperglycemia-induced alterations in
antioxidative system in tissues of alloxan-treated diabetic animals. Exp Toxicol
Pathol. 56 321-6.
Hansmannel F, Mordier S & Iynedjian PB 2006 Insulin induction of glucokinase and
fatty acid synthase in hepatocytes: analysis of the roles of sterol-regulatory-
element-binding protein-1c and liver X receptor. Biochem J. 399 275-83.
Hardie DG 1992 Regulation of fatty acid and cholesterol metabolism by the AMP-
activated protein kinase. Biochim Biophys Acta. 1123 231-8.
Hardie DG 2007 AMP-activated/SNF1 protein kinases: conserved guardians of cellular
energy. Nature Reviews Molecular Cell Biology 8 774-785.
Hardie DG & Carling D 1997 The AMP-activated protein kinase--fuel gauge of the
mammalian cell? Eur J Biochem. 246 259-73.
Hardie DG, Carling D & Carlson M 1998 The AMP-activated/SNF1 protein kinase
subfamily: metabolic sensors of the eukaryotic cell? Annu Rev Biochem. 67 821-
55.
References
147
Harris WS 2003 n-3 Long-chain polyunsaturated fatty acids reduce risk of coronary heart
disease death: extending the evidence to the elderly. Am J Clin Nutr. 77 279-80.
Havel PJ 2005 Dietary fructose: implications for dysregulation of energy homeostasis and
lipid/carbohydrate metabolism. Nutr Rev. 63 133-57.
He Z, Jiang T, Wang Z, Levi M & Li J 2004 Modulation of carbohydrate response
element-binding protein gene expression in 3T3-L1 adipocytes and rat adipose
tissue. AJP - Endocrinology and Metabolism 287 E424-E430.
Hertzel AV & Bernlohr DA 2000 The mammalian fatty acid-binding protein multigene
family: molecular and genetic insights into function. Trends Endocrinol Metab. 11
175-80.
Horton JD, Bashmakov Y, Shimomura I & Shimano H 1998 Regulation of sterol
regulatory element binding proteins in livers of fasted and refed mice. Proc Natl
Acad Sci U S A. 95 5987-92.
Hue L 2001 Regulation of Gluconeogenesis in Liver. In The Endocrine System, edn 2, pp
649-657.
Hunt MC & Alexson SE 2002 The role Acyl-CoA thioesterases play in mediating
intracellular lipid metabolism. Prog Lipid Res. 41 99-130.
Hutapae AM, Toskulakao C, Buddhasukh D, Wilairat P & Glinsukon T 1997 Digestion
of Stevioside, a Natural Sweetener, by Various Digestive Enzymes. Journal of
Clinical Biochemistry and Nutrition 23 177-186.
Hwang IS, Ho H, Hoffman BB & Reaven GM 1987 Fructose-induced insulin resistance
and hypertension in rats. Hypertension. 10 512-6.
Iizuka K, Bruick RK, Liang G, Horton JD & Uyeda K 2004 Deficiency of carbohydrate
response element-binding protein (ChREBP) reduces lipogenesis as well as
glycolysis. Proceedings of the National Academy of Sciences 101 7281-7286.
Iizuka K & Horikawa Y 2008 ChREBP: a glucose-activated transcription factor involved
in the development of metabolic syndrome. Endocr J 55 617-624.
Iizuka K, Miller B & Uyeda K 2006 Deficiency of carbohydrate-activated transcription
factor ChREBP prevents obesity and improves plasma glucose control in leptin-
deficient (ob/ob) mice. Am J Physiol Endocrinol Metab. 291 E358-64.
Innis SM 2007 Fatty acids and early human development. Early Hum Dev. 83 761-6.
References
148
Ishii S, Iizuka K, Miller BC & Uyeda K 2004 Carbohydrate response element binding
protein directly promotes lipogenic enzyme gene transcription. Proceedings of the
National Academy of Sciences 101 15597-15602.
Iynedjian PB, Jotterand D, Nouspikel T, Asfari M & Pilot PR 1989 Transcriptional
induction of glucokinase gene by insulin in cultured liver cells and its repression
by the glucagon-cAMP system. J Biol Chem. 264 21824-9.
Iynedjian PB, Ucla C & Mach B 1987 Molecular Cloning of Glucokinase cDNA
DEVELOPMENTAL AND DIETARY REGULATION OF GLUCOKINASE
mRNA IN RAT LIVER. THE JOURNAL OF BIOLOGICAL CHEMISTRY 262
6032-38.
Japn-Luj n R, Luque-Rodr guez JM & Luque de Castro MD 2006 Dynamic ultrasound-
assisted extraction of oleuropein and related biophenols from olive leaves. J
Chromatogr A. 1108 76-82.
JEMAI H, EL FEKI A & SAYADI S 2009 Antidiabetic and Antioxidant Effects of
Hydroxytyrosol and Oleuropein from Olive Leaves in Alloxan-Diabetic Rats. J
Agric Food Chem. 57 8798-804.
Joseph SB, Laffitte BA, Patel PH, Watson MA & Matsukuma KE 2002 Direct and
indirect mechanisms for regulation of fatty acid synthase gene expression by liver
X receptors. J Biol Chem. 277 11019-25.
Julien C, Berthiaume L, Hadj-Tahar A, Rujput AH, Bedard PJ, Di Paolo T, Julien P &
Calon F 2006 Postmortem brain fatty acid profile of levodopa-treated Parkinson
disease patients and parkinsonian monkeys. Neurochem Int. 48 404-414.
Jump DB 2004 Fatty acid regulation of gene transcription. Crit Rev Clin Lab Sci. 41 41-
78.
Jump DB, Botolin D, Wang Y, Xu J, Christian B & Demeure O 2005 Fatty acid
regulation of hepatic gene transcription. J Nutr. 135 2503-6.
Jump DB, Botolin D, Wang Y, Xu J, Demeure O & Christian B 2008 Docosahexaenoic
acid (DHA) and hepatic gene transcription. Chem Phys Lipids. 153 3-13.
Jump DB & Clarke SD 1999 Regulation of gene expression by dietary fat. Annu Rev
Nutr. 19 63-90.
Just T, Pau HW, Engel U & Hummel T 2008 Cephalic phase insulin release in healthy
humans after taste stimulation? Appetite. 51 622-7.
References
149
Kabashima T, Kawaguchi T, Wadzinski BE & Uyeda K 2003 Xylulose 5-phosphate
mediates glucose-induced lipogenesis by xylulose 5-phosphate-activated protein
phosphatase in rat liver. Proc.Natl.Acad.Sci.U.S.A 100 5107-5112.
Kahn BB, Alquier T, Carling D & Hardie DG 2005a AMP-activated protein kinase:
ancient energy gauge provides clues to modern understanding of metabolism. Cell
Metab. 1 15-25.
Kahn R, Buse J, Ferrannini E & Stern M 2005b The metabolic syndrome: time for a
critical appraisal: joint statement from the American Diabetes Association and the
European Association for the Study of Diabetes. Diabetes Care. 28 2289-304.
Kamtchouing P, Kahpui SM, Djomeni Dzeufiet PD, T'edong L, Asongalem EA & Dimoa
T 2004 Anti-diabetic activity of methanol/methylene chloride stem bark extracts
of Terminalia superba and Canarium schweinfurthii on streptozotocin-induced
diabetic rats. J Ethnopharmacol. 104 306-9.
Karaoz E, Gultekin F, Akdogan M, Oncu M & Gokcimen A 2002 Protective role of
melatonin and a combination of vitamin C and vitamin E on lung toxicity induced
by chlorpyrifos-ethyl in rats. Exp Toxicol Pathol. 54 97-108.
Katsurada A, Iritani N, Fukuda H, Matsumura Y, Nishimoto N & et al. 1990 Effects of
nutrients and hormones on transcriptional and post-transcriptional regulation of
acetyl-CoA carboxylase in rat liver. Eur.J.Biochem. 190 435-441.
Katsurada A, Iritani N, Fukuda H, Matsumura Y, Noguchi T & Tanaka T 1989 Effects of
nutrients and insulin on transcriptional and post-transcriptional regulation of
glucose-6-phosphate dehydrogenase synthesis in rat liver. Biochim Biophys Acta
1006 104-110.
Kawaguchi T, Osatomi K, Yamashita H, Kabashima T & Uyeda K 2002 Mechanism for
fatty acid "sparing" effect on glucose-induced transcription: regulation of
carbohydrate-responsive element-binding protein by AMP-activated protein
kinase. J Biol.Chem. 277 3829-3835.
Kawaguchi T, Takenoshita M, Kabashima T & Uyeda K 2001 Glucose and cAMP
regulate the L-type pyruvate kinase gene by phosphorylation/dephosphorylation
of the carbohydrate response element binding protein. Proc.Natl.Acad.Sci.U.S.A
98 13710-13715.
References
150
Kelley DE, Goodpaster BH & Storlien L 2002 Muscle triglyceride and insulin resistance.
Annu Rev Nutr 22 325-46.
Kelley GL, Allan G & Azhar S 2004 High dietary fructose induces a hepatic stress
response resulting in cholesterol and lipid dysregulation. Endocrinology. 145 548-
55.
Kersten S 2001 Mechanisms of nutritional and hormonal regulation of lipogenesis.
EMBO Rep. 2 282-6.
Kim JB, Spotts GD, Halvorsen YD, Shih HM, Ellenberger T, Towle HC & Spiegelman
BM 1995 Dual DNA binding specificity of ADD1/SREBP1 controlled by a single
amino acid in the basic helix-loop-helix domain. Mol Cell Biol. 15 2582-8.
Kim SY, Kim HI, Kim TH, Im SS, Park SK, Lee IK, Kim KS & Ahn YH 2004 SREBP-
1c mediates the insulin-dependent hepatic glucokinase expression. J Biol Chem.
279 30823-9.
Kinghorn AD & Soejarto DD 1985 Current status of stevioside as a sweetening agent for
human use. In Economic and medical plant research, pp 1-52. Eds H Wagner, H
Hikino & NR Farnsworth. London: Academic Press.
Kokatnur MG, Oalmann MC, Johnson WD, Malcom GT & Strong JP 1979 Fatty acid
composition of human adipose tissue from two anatomical sites in a biracial
community. Am J Clin Nutr. 32 2198-205.
Koo HY, Miyashita M, Cho BH & Nakamura MT 2009 Replacing dietary glucose with
fructose increases ChREBP activity and SREBP-1 protein in rat liver nucleus.
Biochem.Biophys.Res Commun.
Koo HY, Wallig MA, Chung BH, Nara TY, Cho BH & Nakamura MT 2008 Dietary
fructose induces a wide range of genes with distinct shift in carbohydrate and lipid
metabolism in fed and fasted rat liver. Biochimica et Biophysica Acta 1782 341-
348.
Koo SH, Dutcher AK & Towle HC 2001 Glucose and insulin function through two
distinct transcription factors to stimulate expression of lipogenic enzyme genes in
liver. J Biol Chem. 276 9437-45.
Kopelman PG 2000 Obesity as a medical problem. Nature. 404 635-43.
Laffitte BA, Chao LC, Li J, Walczak R, Hummasti S & Joseph SB 2003 Activation of
liver X receptor improves glucose tolerance through coordinate regulation of
References
151
glucose metabolism in liver and adipose tissue. Proc Natl Acad Sci U S A. 100
5419-24.
Lazar MA & Willson TM 2007 Sweet dreams for LXR. Cell Metab. 5 159-61.
Lee Y, Wang MY, Kakuma T, Wang ZW, Babcock E, McCorkle K, Higa M, Zhou YT &
Unger RH 2001 Liporegulation in diet-induced obesity. The antisteatotic role of
hyperleptinemia. J Biol Chem. 276 5629-5635.
Letexier D, Peroni O, Pinteur C & Beylot M 2005 In vivo expression of carbohydrate
responsive element binding protein in lean and obese rats. Diabetes Metab 31
558-566.
Liang G, Yang J, Horton JD, Hammer RE, Goldstein JL & Brown MS 2002 Diminished
hepatic response to fasting/refeeding and liver X receptor agonists in mice with
selective deficiency of sterol regulatory element-binding protein-1c. J Biol Chem.
277 9520-8.
Liimatta M, Towle HC, Clarke S & Jump DB 1994 Dietary polyunsaturated fatty acids
interfere with the insulin/glucose activation of L-type pyruvate kinase gene
transcription. Mol Endocrinol. 8 1147-53.
Ma L, Robinson LN & Towle HC 2006 ChREBP*Mlx is the principal mediator of
glucose-induced gene expression in the liver. J Biol.Chem. 281 28721-28730.
Ma L, Sham YY, Walters KJ & Towle HC 2007 A critical role for the loop region of the
basic helix-loop-helix/leucine zipper protein Mlx in DNA binding and glucose-
regulated transcription. Nucleic Acids Res. 35 35-44.
Ma L, Tsatsos NG & Towle HC 2005 Direct role of ChREBP.Mlx in regulating hepatic
glucose-responsive genes. J Biol Chem. 280 12019-27.
Magaa MM & Osborne TF 1996 Two tandem binding sites for sterol regulatory element
binding proteins are required for sterol regulation of fatty-acid synthase promoter.
J Biol Chem. 271 32689-94.
Magnuson BA, Burdock GA, Doull J, Kroes RM, Marsh GM & et al. 2007 Aspartame: a
safety evaluation based on current use levels, regulations, and toxicological and
epidemiological studies. Crit Rev Toxicol. 37 629-727.
Mangelsdorf DJ, Thummel C, Beato M, Herrlich P, Schütz G & et al. 1995 The nuclear
receptor superfamily: the second decade. Cell. 83 835-9.
References
152
Marchesini G, Brizi M, Bianchi G, Tomassetti S, Bugianesi E & et al. 2001 Nonalcoholic
fatty liver disease: a feature of the metabolic syndrome. Diabetes. 50 1844-50.
Marchesini G, Brizi M, Morselli-Labate AM, Bianchi G, Bugianesi E, McCullough AJ,
Forlani G & Melchionda N 1999 Association of nonalcoholic fatty liver disease
with insulin resistance. Am J Med. 107 450-5.
Massillon D 2000 Regulation of the glucose-6-phosphatase gene by glucose occurs by
transcriptional and post-transcriptional mechanisms. Differential effect of glucose
and xylitol. J Biol Chem. 276 4055-62.
Mata de Urquiza A, Liu S, Sjoberg M, Zetterstrom RH, Criffith W, Sjovall J & Perlmann
T 2000 Docosahexaenoic acid, a ligand for the retinoid X receptor in mouse brain.
Science. 290 2140-4.
Matschinsky FM 1996 A lesson in metabolic regulation inspired by the glucokinase
glucose sensor paradigm. Diabetes. 45 223-41.
Matsuzaki H, Daitoku H, Hatta M, Tanaka K & Fukamizu A 2003 Insulin-induced
phosphorylation of FKHR (Foxo1) targets to proteasomal degradation.
Proc.Natl.Acad.Sci.U.S.A 100 11285-11290.
McGuinness OP & Cherrington AD 2003 Effects of fructose on hepatic glucose
metabolism. Curr Opin Clin Nutr Metab Care. 6 441-8.
Meroni G, Cairo S, Merla G, Messali S, Brent R, Ballabio A & Reymond A 2000 Mlx, a
new Max-like bHLHZip family member: the center stage of a novel transcription
factors regulatory pathway? Oncogene. 19 3266-77.
Mezey E 1998 Dietary fat and alcoholic liver disease. Hepatology. 28 901-5.
Miksicek RJ & Towle HC 1983 Use of a cloned cDNA sequence to measure changes in
6-phosphogluconate dehydrogenase mRNA levels caused by thyroid hormone and
dietary carbohydrate. J Biol Chem. 258 9575-9.
Mirbagheri SA, Rashidi A, Abdi S, Saedi D & Abouzari M 2007 Liver: an alarm for the
heart? Liver Int. 27 891-4.
Mitro N, Mak PA, Vargas L, Godio C, Hampton E, Molteni V, Kreusch A & Saez E 2007
The nuclear receptor LXR is a glucose sensor. Nature 445 219-223.
Moore F, Weekes J & Hardie DG 1991 Evidence that AMP triggers phosphorylation as
well as direct allosteric activation of rat liver AMP-activated protein kinase. A
References
153
sensitive mechanism to protect the cell against ATP depletion. Eur J Biochem.
199 691-7.
Moore KM & Knauft DA 1989 The Inheritance of High Oleic Acid in Peanut. The
Journal of Heredity 80 252-253.
Moriizumi S, Gourdon L, Lefrançois-Martinez AM, Kahn A & Raymondjean M 1998
Effect of different basic helix-loop-helix leucine zipper factors on the glucose
response unit of the L-type pyruvate kinase gene. Gene Expr. 7 103-13.
Natali F, Siculella L, Salvati S & Gnoni GV 2007 Oleic acid is a potent inhibitor of fatty
acid and cholesterol synthesis in C6 glioma cells. J Lipid Res. 48 1966-75.
New, M. B. and Wijkstroem, U. N. Use of fishmeal and fish oil in aquafeeds. Further
thoughts on the fishmeal trap. 975, 61. 2002. FAO Fisheries Circular .
Ref Type: Report
Nielsen SJ & Popkin BM 2004 Changes in beverage intake between 1977 and 2001. Am
J Prev Med. 27 205-10.
Nseir W, Nassar F & Assy N 2010 Soft drinks consumption and nonalcoholic fatty liver
disease. World J Gastroenterol 16 2579-2588.
Ntambi JM 1992 Dietary Regulation of Stearoyl-CoA Desaturase 1 Gene Expression in
Mouse Liver. THE JOURNAL OF BIOLOGICAL CHEMISTRY 267 10925-
10930.
Nutter MK, Lockhart EE & Harris RS 1943 The chemical composition of depot fats in
chickens and turkeys. Journal of the American Oil Chemists' Society 20 231-234.
O'Brien RM & Granner DK 1996 Regulation of gene expression by insulin. Physiol Rev.
76 1109-61.
O'Brien RM, Streeper RS, Ayala JE, Stadelmaier BT & Hornbuckle LA 2001 Insulin-
regulated gene expression. Biochem Soc Trans. 29 552-8.
O'Callaghan BL, Koo SH, Wu Y, Freake HC & Towle HC 2001 Glucose regulation of
the acetyl-CoA carboxylase promoter PI in rat hepatocytes. J Biol Chem. 276
16033-9.
Oi-Kano Y, Kawada T, Watanabe T, Koyama F, Watanabe K, Senbongi R & Iwai K
2008 Oleuropein, a phenolic compound in extra virgin olive oil, increases
uncoupling protein 1 content in brown adipose tissue and enhances noradrenaline
and adrenaline secretions in rats. J Nutr Sci Vitaminol 54 363-70.
References
154
Ou J, Tu H, Shan B, Luk A, DeBose-Boyd RA, Bashmakov Y, Goldstein JL & Brown
MS 2001 Unsaturated fatty acids inhibit transcription of the sterol regulatory
element-binding protein-1c (SREBP-1c) gene by antagonizing ligand-dependent
activation of the LXR. Proc Natl Acad Sci U S A. 98 6027-32.
Pape ME, Lopez-Casillas F & Kim KH 1988 Physiological regulation of acetyl-CoA
carboxylase gene expression: effects of diet, diabetes, and lactation on acetyl-CoA
carboxylase mRNA. Arch Biochem Biophys. 267 104-9.
Patton GM, Fasulo JM & Robins SJ 1994 Hepatic phosphatidylcholines: evidence for
synthesis in the rat by extensive reutilization of endogenous acylglycerides. J
Lipid Res. 35 1211-21.
Pawar A, Xu J, Jerks E, Mangelsdorf DJ & Jump DB 2002 Fatty acid regulation of liver
X receptors (LXR) and peroxisome proliferator-activated receptor alpha
(PPARalpha ) in HEK293 cells. J Biol Chem. 277 39243-50.
Pedersen KB, Zhang P, Doumen C, Charbonnet M, Lu D, Newgard CB, Haycock JW,
Lange AJ & Scott DK 2007 The promoter for the gene encoding the catalytic
subunit of rat glucose-6-phosphatase contains two distinct glucose-responsive
regions. AJP - Endocrinology and Metabolism 292 E788-E801.
Petersen KF, Dufour S, Befroy D, Lehrke M, Hendler RE & Shulman GI 2005 Reversal
of Nonalcoholic Hepatic Steatosis, Hepatic Insulin Resistance, and
Hyperglycemia by Moderate Weight Reduction in Patients With Type 2 Diabetes.
Diabetes. 54 603-608.
Petersen KF & Shulman GI 2002 Pathogenesis of skeletal muscle insulin resistance in
type 2 diabetes mellitus. Am J Cardiol. 90 11G-18G.
Postic C, Dentin R, Denechaud PD & Girard J 2007 ChREBP, a Transcriptional
Regulator of Glucose and Lipid Metabolism. Annu.Rev.Nutr. 27 179-192.
Postic C & Girard J 2008 Contribution of de novo fatty acid synthesis to hepatic steatosis
and insulin resistance: lessons from genetically engineered mice. Journal of
Clinical Investigation 118 829-838.
Postic C, Shiota M, Niswender KD, Jetton TL, Chen Y, Moates JM, Shelton KD, Lindner
J, Cherrington AD & Magnuson MA 1999 Dual roles for glucokinase in glucose
homeostasis as determined by liver and pancreatic beta cell-specific gene knock-
outs using Cre recombinase. J Biol.Chem. 274 305-315.
References
155
Prodolliet J & Bruelhart M 1993 Determination of aspartame and its major
decomposition products in foods. J AOAC Int. 76 275-82.
Proszkowiec-Weglarz M, Richards MP, Humphrey BD, Rosebrough RW & McMurtry JP
2009 AMP-activated protein kinase and carbohydrate response element binding
protein: A study of two potential regulatory factors in the hepatic lipogenic
program of broiler chickens. Comp Biochem.Physiol B Biochem.Mol Biol.
Puigserver P, Rhee J, Donovan J, Walkey CJ, Yoon JC, Oriente F, Kitamura Y,
Altomonte J, Dong H, Accili D & Spiegelman BM 2002 Insulin-regulated hepatic
gluconeogenesis through FOXO1-PGC-1alpha interaction. Nature. 423 550-5.
Pyle DJ, Garcia RA & Wen Z 2008 Producing Docosahexaenoic Acid (DHA)-Rich Algae
from Biodiesel-Derived Crude Glycerol: Effects of Impurities on DHA
Production and Algal Biomass Composition. J Agric Food Chem. 56 3933-9.
Rongnoparut P, Verdon CP, Gehnrich SC & Sul HS 1991 Isolation and characterization
of the transcriptionally regulated mouse liver (B-type) phosphofructokinase gene
and its promoter. J Biol Chem. 266 8086-91.
Rufo C, Teran-Garcia M, Nakamura MT, Koo SH, Towle HC & Clarke SD 2001
Involvement of a unique carbohydrate-responsive factor in the glucose regulation
of rat liver fatty-acid synthase gene transcription. J Biol Chem. 276 21969-75.
Saggerson D 2008 Malonyl-CoA, a key signaling molecule in mammalian cells. Annu
Rev Nutr. 28 253-72.
Sain OL & Berman JM 1984 Efectos adversos de edulcorantes en pediatria sacarina y
ciclamato. / Side effects of artificial sweeteners in pediatrics. Sacharin and
cyclamates. Arch.argent.pediatr 82 209-11.
Samuel VT, Liu ZX, Qu X, Elder BD, Bilz S, Befroy D, Romanelli AJ & Shulman GI.
2004 Mechanism of hepatic insulin resistance in non-alcoholic fatty liver disease.
J Biol Chem 279 32345-32353.
Sanal MG 2008 The blind men 'see' the elephant-the many faces of fatty liver disease.
World J Gastroenterol. 14 831-844.
Sasaki K, Cripe TP, Koch SR, Andreone TL, Petersen DD, Beale EG & Granner DK
1984 Multihormonal regulation of phosphoenolpyruvate carboxykinase gene
transcription. The dominant role of insulin. Journal of Biological Chemistry 259
15242-15251.
References
156
Seppala-Lindroos A, Vehkavaara S, Hakkinen AM, Goto T, Westerbacka J, Sovijarvi A,
Halavaara J & Yki-Jarvinen H 2002 Fat accumulation in the liver is associated
with defects in insulin suppression of glucose production and serum free fatty
acids independent of obesity in normal men. J Clin Endocrinol Metab. 87 3023-8.
Shih HM, Liu Z & Towle HC 1995 Two CACGTG motifs with proper spacing dictate the
carbohydrate regulation of hepatic gene transcription. J Biol Chem. 270 21991-7.
Shimomura I, Bashmakov Y, Ikemeto S, Horton JD, Brown MS & Goldstein JL 1999
Insulin selectively increases SREBP-1c mRNA in the livers of rats with
streptozotocin-induced diabetes. Proceedings of the National Academy of
Sciences 96 13656-13661.
Shimomura I, Shimano H, Korn BS, Bashmakov Y & Horton JD 1998 Nuclear sterol
regulatory element-binding proteins activate genes responsible for the entire
program of unsaturated fatty acid biosynthesis in transgenic mouse liver. J Biol
Chem. 273 25299-306.
Simopoulos AP 1999 Essential fatty acids in health and chronic disease. Am J Clin Nutr
70 560S-569S.
Simopoulos AP 2002 Omega-3 fatty acids in wild plants, nuts and seeds. Asia Pacific
Journal of Clinical Nutrition 11 s163-s173.
Sirek AS, Liu L, Naples M, Adeli K, Ng DS & Jin T 2009 Insulin stimulates the
expression of Carbohydrate Response Element Binding Protein (ChREBP) by
attenuating the repressive effect of POU homeodomain protein Oct-1.
Endocrinology.
Soni MG, Burdock GA, Christian MS, Bitler CM & Crea R 2006 Safety assessment of
aqueous olive pulp extract as an antioxidant or antimicrobial agent in foods. Food
Chem Toxicol. 44 903-15.
Stanhope KL, Schwarz JM, Keim NL, Griffen SC & et al. 2009 Consuming fructose-
sweetened, not glucose-sweetened, beverages increases visceral adiposity and
lipids and decreases insulin sensitivity in overweight/obese humans. J Clin Invest.
119 1322-34.
Stegink LD 1987 The aspartame story: a model for the clinical testing of a food additive.
Am J Clin Nutr. 46 204-15.
References
157
Stein SC, Woods A, Jones NA, Davison MD & Carling D 2000 The regulation of AMP-
activated protein kinase by phosphorylation. Biochem J. 345 437-43.
Stoeckman AK, Ma L & Towle HC 2004 Mlx is the functional heteromeric partner of the
carbohydrate response element-binding protein in glucose regulation of lipogenic
enzyme genes. J Biol.Chem. 279 15662-15669.
Stoeckman AK & Towle HC 2002 The role of SREBP-1c in nutritional regulation of
lipogenic enzyme gene expression. J Biol Chem. 277 27029-35.
Sudjana AN, D'Orazio C, Ryan V, Rasool N, Ng J, Islam N, Riley TV & Hammer KA
2009 Antimicrobial activity of commercial Olea europaea (olive) leaf extract. Int
J Antimicrob Agents. 33 461-3.
Suenaga A, Wada T & Ichibagase H 1983 Studies on synthetic sweetening agents. XVIII.
Metabolism of sodium cyclamate. (7). Dicyclohexylamine, a metabolite of
sodium cyclamate in rabbits and rats. Chem Pharm Bull (Tokyo) 31 2079-84.
Tassabehji M 2003 Williams-Beuren syndrome: a challenge for genotype-phenotype
correlations. Hum Mol Genet. 12 R229-37.
Thomas EL, Hamilton G, Patel N, O'Dwyer R, Doré CJ, Goldin RD, Bell JD & Taylor-
Robinson SD 2005 Hepatic triglyceride content and its relation to body adiposity:
a magnetic resonance imaging and proton magnetic resonance spectroscopy study.
Gut. 54 122-127.
Thorens B 1996 Glucose transporters in the regulation of intestinal, renal, and liver
glucose fluxes. Am J Physiol. 270 G541-G553.
Towle HC 2005 Glucose as a regulator of eukaryotic gene transcription. Trends
Endocrinol Metab. 16 489-94.
Tsatsos NG & Towle HC 2006 Glucose activation of ChREBP in hepatocytes occurs via
a two-step mechanism. Biochem.Biophys.Res.Commun. 340 449-456.
Ulven SM, Dalen KT, Gustafsson JA & Nebb HI 2005 LXR is crucial in lipid
metabolism. Prostaglandins Leukot Essent Fatty Acids. 73 59-63.
Unger RH & Orci L 2002 Lipoapoptosis: its mechanism and its diseases. Biochim
Biophys Acta. 1585 202-12.
Untoro J, Schultink W, West CE, Gross R & Hautvast JG 2006 Efficacy of oral iodized
peanut oil is greater than that of iodized poppy seed oil among Indonesian
schoolchildren. Am J Clin Nutr. 84 1208-14.
References
158
Uyeda K & Repa JJ 2006 Carbohydrate response element binding protein, ChREBP, a
transcription factor coupling hepatic glucose utilization and lipid synthesis. Cell
Metab. 4 107-10.
Van Schaftingen E, Detheux M & Veiga da Cunha M 1994 Short-term control of
glucokinase activity: role of a regulatory protein. The FASEB Journal 8 414-9.
Vandercammen A & Van Schaftingen E 1990 The mechanism by which rat liver
glucokinase is inhibited by the regulatory protein. Eur J Biochem. 191 483-489.
Vaulont S, Munnich A, Decaux JF & Kahn A 1986 Transcriptional and post-
transcriptional regulation of L-type pyruvate kinase gene expression in rat liver. J
Biol Chem. 261 7621-5.
Vaulont S, Vasseur-Cognet M & Kahn A 2000 Glucose regulation of gene transcription. J
Biol Chem. 275 31555-8.
Villarreal JE, Lombardini L & Cisneros-Zevallos L 2007 Phytochemical constituents and
antioxidant capacity of different pecan [Carya illinoinensis (Wangenh.) K. Koch]
cultivars. Food Chemistry 102 1241-1249.
Viollet B, Foretz M, Guigas B, Horman S, Dentin R, Bertrand L, Hue L & Andreelli F
2006 Activation of AMP-activated protein kinase in the liver: a new strategy for
the management of metabolic hepatic disorders. The Journal of Physiology 574
41-53.
Viollet B, Guigas B, Leclerc J, Hebrard S, Lantier L, Mounier R, Andreelli F & Foretz M
2009 AMP-activated protein kinase in the regulation of hepatic energy
metabolism: from physiology to therapeutic perspectives. Acta Physiol (Oxf) 196
81-98.
Wang Y, Botolin D, Christian B, Busik C, Xu J & Jump DB 2005 Tissue-specific,
nutritional, and developmental regulation of rat fatty acid elongases. J Lipid Res.
46 706-15.
Wang Y, Botolin D, Xu J, Christian B, Mitchell E, Jayaprakasam B, Nair M, Peters JM,
Busik J, Olson LK & Jump DB 2006 Regulation of hepatic fatty acid elongase
and desaturase expression in diabetes and obesity. Journal of Lipid Research 47
2028-2041.
Weber A, Marie J, Cottreau D, Simon MP, Besmond C, Dreyfus JC & Kahn A 1984
Dietary control of aldolase B and L-type pyruvate kinase mRNAs in rat. Study of
References
159
translational activity and hybridization with cloned cDNA probes. J Biol Chem.
259 1798-802.
Williamson JR & Krebs HA 1961 Acetoacetate as fuel of respiration in the perfused rat
heart. Biochem J. 80 540-7.
Wolfrum C, Borrmann CM, Borchers T & Spener F 2001 Fatty acids and hypolipidemic
drugs regulate peroxisome proliferator-activated receptors alpha - and gamma-
mediated gene expression via liver fatty acid binding protein: a signaling path to
the nucleus. Proc Natl Acad Sci U S A. 98 2323-8.
Wu C, Kang JE, Peng LJ, Li H, Khan SA, Hillard CJ, Okar DA & Lange AJ 2005
Enhancing hepatic glycolysis reduces obesity: differential effects on lipogenesis
depend on site of glycolytic modulation. Cell Metab 2 131-140.
Wurm FM 2004 Production of recombinant protein therapeutics in cultivated mammalian
cells. Nature Biotechnol, 22 1393-1398.
Xu HE, Lambert MH, Montana VG, Parks DJ & Blanchard SG 1999a Molecular
recognition of fatty acids by peroxisome proliferator-activated receptors. Mol
Cell. 3 397-403.
Xu J, Christian B & Jump DB 2003 Regulation of rat hepatic L-pyruvate kinase promoter
composition and activity by glucose, n-3 polyunsaturated fatty acids, and
peroxisome proliferator-activated receptor-alpha agonist. J Biol Chem. 281
18351-62.
Xu J, Nakamura MT, Cho HP & Clarke SD 1999b Sterol regulatory element binding
protein-1 expression is suppressed by dietary polyunsaturated fatty acids. A
mechanism for the coordinate suppression of lipogenic genes by polyunsaturated
fats. J Biol Chem. 274 23577-83.
Yahagi NSH, Hasty AH, Matsuzaka T & Ide T 2002 Absence of sterol regulatory
element-binding protein-1 (SREBP-1) ameliorates fatty livers but not obesity or
insulin resistance in Lep(ob)/Lep(ob) mice. J Biol Chem. 277 19353-7.
Yamamura HI, Lee IP & Dixon RL 1968 Study of the sympathomimetic action of
cyclohexylamine, a possible metabolite of cyclamate. J Pharm Sci. 57 1132-4.
Yamashita H, Takenoshita M, Sakurai M, Bruick RK, Henzel WJ, Shillinglaw W, Arnot
D & Uyeda K 2001 A glucose-responsive transcription factor that regulates
carbohydrate metabolism in the liver. Proc.Natl.Acad.Sci.U.S.A 98 9116-9121.
References
160
Zelcer N & Tontonoz P 2006 Liver X receptors as integrators of metabolic and
inflammatory signaling. J Clin Invest. 116 607-14.
Zhang Y, Yin L & Hillgartner FB 2003 SREBP-1 integrates the actions of thyroid
hormone, insulin, cAMP, and medium-chain fatty acids on ACCalpha
transcription in hepatocytes. J Lipid Res. 44 356-68.