non-farm economy and rural...
TRANSCRIPT
NONNON--FARM ECONOMY ANDFARM ECONOMY AND
RURAL DEVELOPMENTRURAL DEVELOPMENT
Sponsored by
PLANNING COMMISSION GOVERNMENT OF INDIA
NEW DELHI
G.S. MEHTA
GIRI INSTITUTE OF DEVELOPMENT STUDIESGIRI INSTITUTE OF DEVELOPMENT STUDIES Sector ‘O’, Aliganj Housing SchemeSector ‘O’, Aliganj Housing Scheme
LUCKNOW 226 024LUCKNOW 226 024 20022002
Page No.2
PREFACEPREFACE
It has universally been recognized that in a situation where the increasing trend of population and its sizeable addition in labourforce on one hand and increasing fragmentation of land holdings leading to decreasing availability of per household cultivated land area on the other, the agriculture sector alone is expected would hardly be in a position and to create additional employment opportunities according to the existing increasing rate of rural labourforce and to sustain the livelihood of the rural households, even in high growth and the agriculturally potentials states in India. In this context initiating for planning development of various potential rural non-farm activities in general and especially rural industrial activities those who are possessing certain area specific comparative advantage in terms of their development possibilities, has been viewed would be an instrumental approach for reducing the emerging problems of increasing un-employment and poverty in rural areas. At the same time undoubtedly importance of initiating these efforts would be more desirable in economically backward and the hilly states as compared to developed states, because the former groups of states are neither possessing the opportunities of the diversification of farming system nor the expansion of large scale industrial enterprises; hence the problems of poverty and unemployment has reached at more alarming stages in former groups of states than the latter one. It is, therefore, the purpose of the present study has been centered around to examine at the mode of establishing the pattern of growth and the emerging situation of employment, nature of participation of different socio-economic groups of rural households, kinds of backward and forward linkages and factors influencing to the expansion, contribution in providing employment opportunities and the avenues of income at house-level and in sample areas, development potentials and the kinds of problems existing in successful operation and the possibilities of further development and the methodology to be adopted for initiating planning development of various non-farm activities in the state of Uttaranchal. This study has been financially sponsored by the Planning Commission, Government of India, New Delhi. I am grateful to the Commission, especially to Dr. Rohini Nayyar, Advisor, Rural Development, for providing an opportunity to study an important and topical problem of my own research interest by financing the study. The study could be completed as a result of the co-operation of various State Government Departments, particularly of the Rural Development Division, Government of Uttaranchal. I sincerely wish to thank Dr. R.S. Tolia, Principal Secretary and Dr. P.S. Gosai, Additional Secretary Rural Development Division, Uttaranchal, for their valuable co-operation and support as provided in obtaining required secondary data and asking their district and Block Panchayat level officials for facilitating and providing necessary assistance in the collection of primary data from the selected villages for the present study. I wish to express my thanks to Prof. G.P. Mishra, the Director of the Institute of his support and encouragement in completing of the study. I am particularly thankful to my senior colleague Dr. A. Joshi of the Institute for providing valuable suggestions
Page No.3
and comments on the various analytical issues examined. The timely completion of the study was the result of a fine team work displayed by all those associated with the project. Mr. B.S. Koranga, Mr. S.K. Trivedi, Mr. K.S. Deoli, Mr. Ram Karan, Mr. Dinesh Chand and Mr. V.K. Bisht undertook the collection of primary and secondary data and its analysis. Mr. Devanand S, Ms. Geeta Bisht and Ms. Shobha Rani provided the secretarial assistance in all the stages of the project and word processing of the manuscript of the study report. I am grateful to all these colleagues for their valuable assistance.
G S MEHTA Giri Institute of Development Studies Lucknow April 2002
Page No.4
CONTENTS Page No.
PREFACE 2 - 3 CONTENTS 4 – 6 LIST OF TABLES 7– 9
EXECUTIVE SUMMARY 10 – 21
CHAPTER I INTRODUCTION: SCOPE AND METHODOLOGY OF THE STUDY
22 - 47
Determinants and Influencing Factors to the Expansion of Non-Farm Sector The Present Study Nature of Linkages The Objectives of the Study Methodology and the Sample
Setting of the Sample Districts
CHAPTER II STRUCTURE AND GROWTH OF NON-FARM ACTIVIT IES 47 –106
Pattern and Mode of Establishing Non-Farm Activities Changes in the Concentration Sectoral Distribution Concentration at District Level Trends in Growth Growth Performance in Rural and Urban Areas Structure of Non-farm Activities in Different Geographical Areas Changes in the Concentration and Structure Trends in Growth by Geographical Locations Trends in Expansion Entrepreneurship in Non-farm Sector Age Educational Leval Origin of the Enterprises Reasons of Opting for Establishing Present Unit Motivation for Establishment of Non-farm Activities Activity Before Starting Non-farm Activity Occupational Mobility Reasons for Changing Occupations Capital Investment Size of Turnover and Sale Net Earnings
Contribution of rural Development Programme and Implications
Page No.5
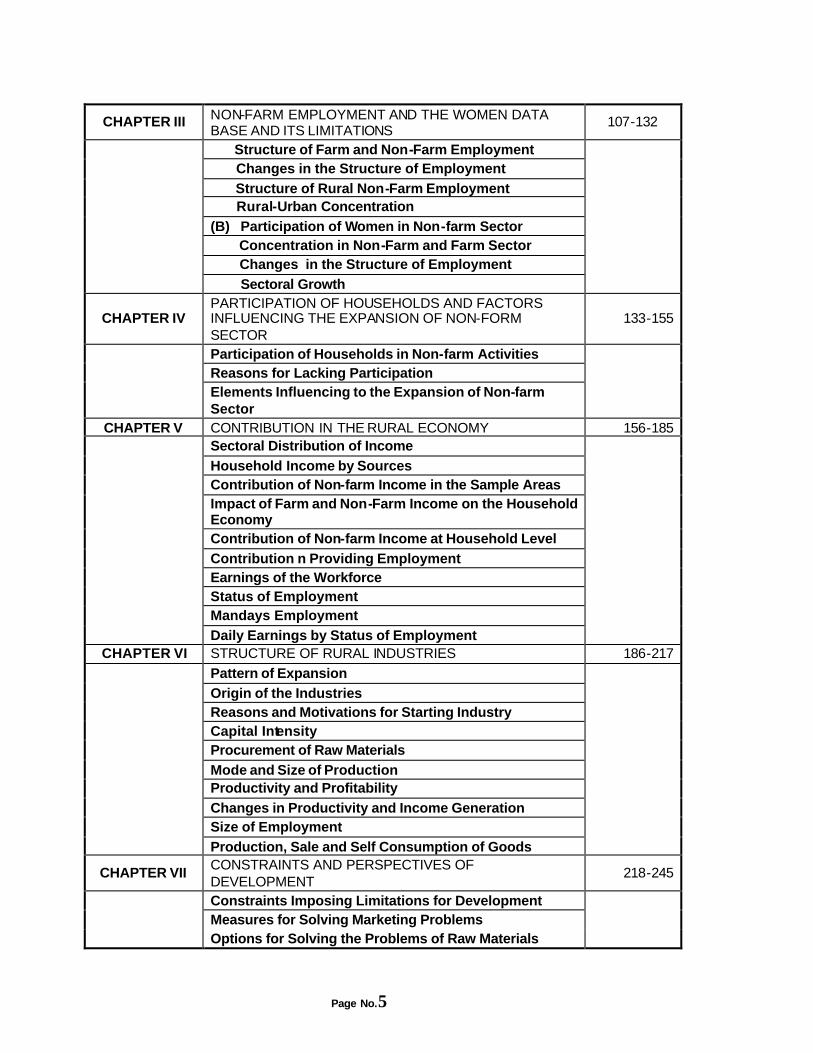
CHAPTER III NON-FARM EMPLOYMENT AND THE WOMEN DATA BASE AND ITS LIMITATIONS
107-132
Structure of Farm and Non-Farm Employment Changes in the Structure of Employment Structure of Rural Non-Farm Employment Rural-Urban Concentration (B) Participation of Women in Non-farm Sector Concentration in Non-Farm and Farm Sector Changes in the Structure of Employment
Sectoral Growth
CHAPTER IV PARTICIPATION OF HOUSEHOLDS AND FACTORS INFLUENCING THE EXPANSION OF NON-FORM SECTOR
133-155
Participation of Households in Non-farm Activities Reasons for Lacking Participation Elements Influencing to the Expansion of Non-farm Sector
CHAPTER V CONTRIBUTION IN THE RURAL ECONOMY 156-185 Sectoral Distribution of Income Household Income by Sources Contribution of Non-farm Income in the Sample Areas Impact of Farm and Non-Farm Income on the Household Economy Contribution of Non-farm Income at Household Level Contribution n Providing Employment Earnings of the Workforce Status of Employment Mandays Employment
Daily Earnings by Status of Employment
CHAPTER VI STRUCTURE OF RURAL INDUSTRIES 186-217
Pattern of Expansion Origin of the Industries Reasons and Motivations for Starting Industry Capital Intensity Procurement of Raw Materials Mode and Size of Production Productivity and Profitability Changes in Productivity and Income Generation Size of Employment
Production, Sale and Self Consumption of Goods
CHAPTER VII CONSTRAINTS AND PERSPECTIVES OF DEVELOPMENT
218-245
Constraints Imposing Limitations for Development Measures for Solving Marketing Problems
Options for Solving the Problems of Raw Materials

Page No.6
Development Perspectives Perceptions of the Enterpreneurs for Planning Expansion
Options for Development
CHAPTER VIII PERCEPTIONS OF HOUSEHOLDS AND THE POLICY RECOMMENDATIONS
246-257
REFERENCES 258-262
Page No.7
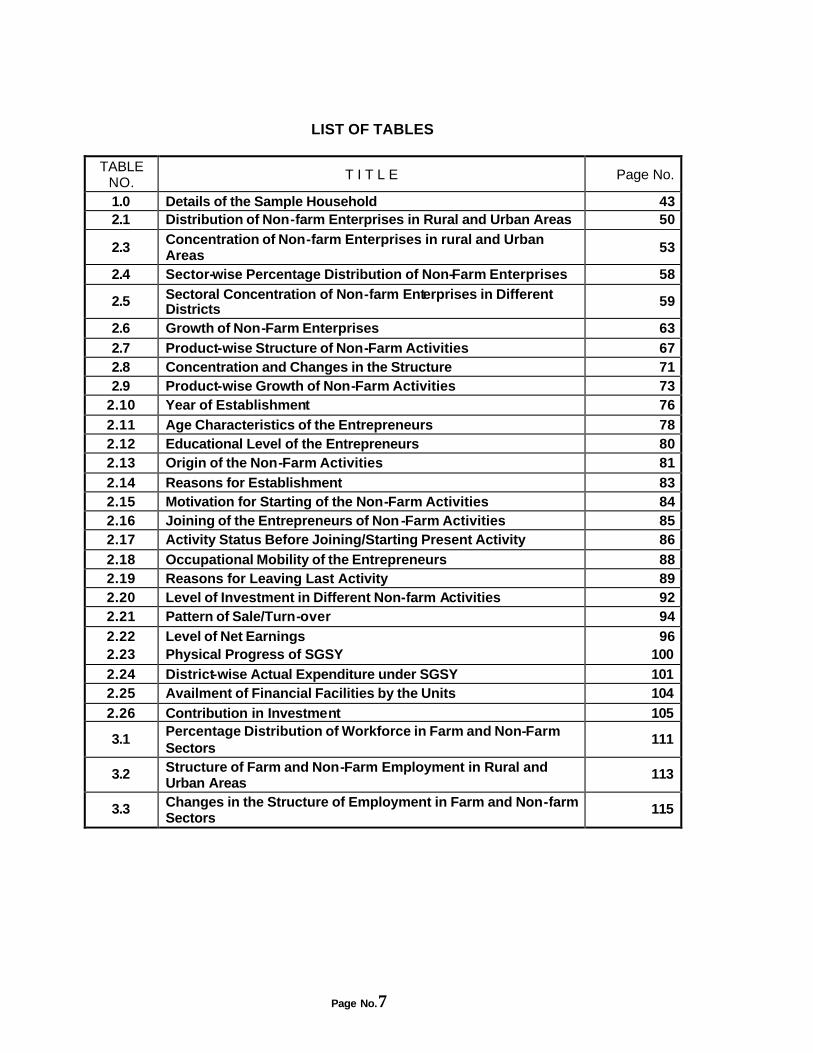
LIST OF TABLES
TABLE
NO. T I T L E Page No.
1.0 Details of the Sample Household 43 2.1 Distribution of Non-farm Enterprises in Rural and Urban Areas 50
2.3 Concentration of Non-farm Enterprises in rural and Urban Areas 53
2.4 Sector-wise Percentage Distribution of Non-Farm Enterprises 58
2.5 Sectoral Concentration of Non-farm Enterprises in Different Districts 59
2.6 Growth of Non-Farm Enterprises 63 2.7 Product-wise Structure of Non-Farm Activities 67 2.8 Concentration and Changes in the Structure 71 2.9 Product-wise Growth of Non-Farm Activities 73
2.10 Year of Establishment 76 2.11 Age Characteristics of the Entrepreneurs 78 2.12 Educational Level of the Entrepreneurs 80 2.13 Origin of the Non-Farm Activities 81 2.14 Reasons for Establishment 83 2.15 Motivation for Starting of the Non-Farm Activities 84 2.16 Joining of the Entrepreneurs of Non-Farm Activities 85 2.17 Activity Status Before Joining/Starting Present Activity 86 2.18 Occupational Mobility of the Entrepreneurs 88 2.19 Reasons for Leaving Last Activity 89 2.20 Level of Investment in Different Non-farm Activities 92 2.21 Pattern of Sale/Turn-over 94 2.22 Level of Net Earnings 96 2.23 Physical Progress of SGSY 100 2.24 District-wise Actual Expenditure under SGSY 101 2.25 Availment of Financial Facilities by the Units 104 2.26 Contribution in Investment 105
3.1 Percentage Distribution of Workforce in Farm and Non-Farm Sectors
111
3.2 Structure of Farm and Non-Farm Employment in Rural and Urban Areas
113
3.3 Changes in the Structure of Employment in Farm and Non-farm Sectors
115
Page No.8
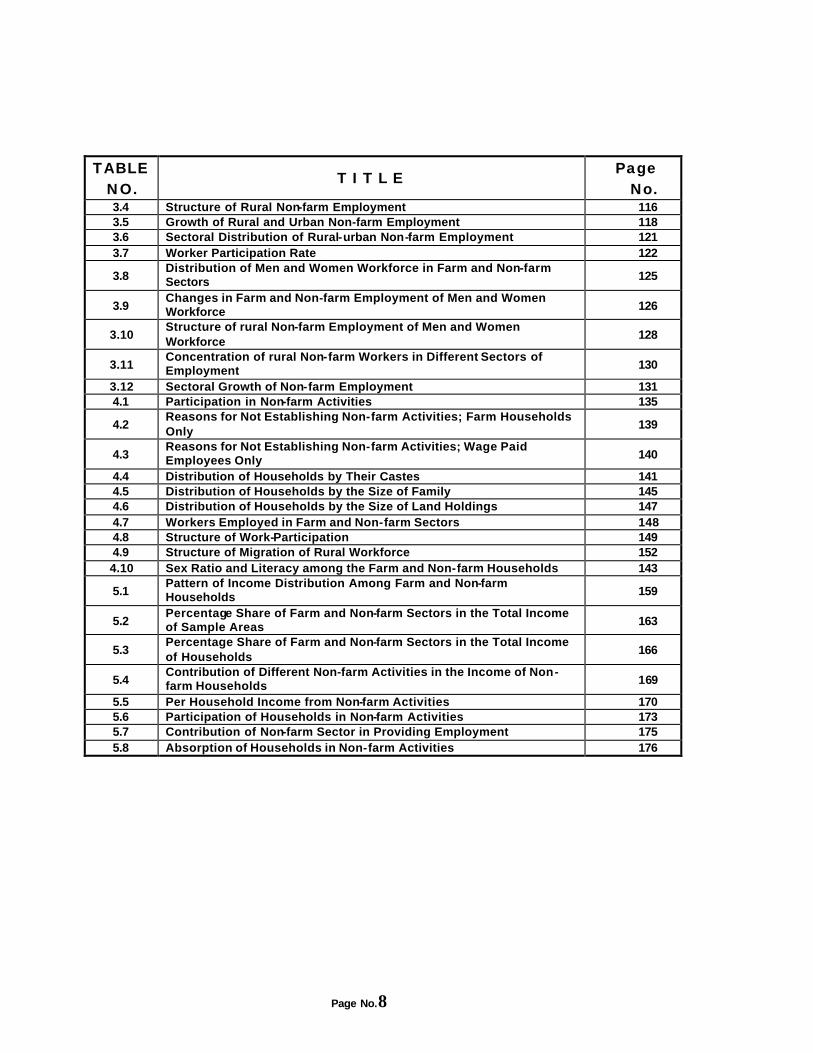
TABLE NO.
T I T L E Page No.
3.4 Structure of Rural Non-farm Employment 116 3.5 Growth of Rural and Urban Non-farm Employment 118 3.6 Sectoral Distribution of Rural-urban Non-farm Employment 121 3.7 Worker Participation Rate 122
3.8 Distribution of Men and Women Workforce in Farm and Non-farm Sectors 125
3.9 Changes in Farm and Non-farm Employment of Men and Women Workforce 126
3.10 Structure of rural Non-farm Employment of Men and Women Workforce
128
3.11 Concentration of rural Non-farm Workers in Different Sectors of Employment 130
3.12 Sectoral Growth of Non-farm Employment 131 4.1 Participation in Non-farm Activities 135
4.2 Reasons for Not Establishing Non-farm Activities; Farm Households Only
139
4.3 Reasons for Not Establishing Non-farm Activities; Wage Paid Employees Only 140
4.4 Distribution of Households by Their Castes 141 4.5 Distribution of Households by the Size of Family 145 4.6 Distribution of Households by the Size of Land Holdings 147 4.7 Workers Employed in Farm and Non-farm Sectors 148 4.8 Structure of Work-Participation 149 4.9 Structure of Migration of Rural Workforce 152 4.10 Sex Ratio and Literacy among the Farm and Non-farm Households 143
5.1 Pattern of Income Distribution Among Farm and Non-farm Households 159
5.2 Percentage Share of Farm and Non-farm Sectors in the Total Income of Sample Areas 163
5.3 Percentage Share of Farm and Non-farm Sectors in the Total Income of Households
166
5.4 Contribution of Different Non-farm Activities in the Income of Non-farm Households 169
5.5 Per Household Income from Non-farm Activities 170 5.6 Participation of Households in Non-farm Activities 173 5.7 Contribution of Non-farm Sector in Providing Employment 175 5.8 Absorption of Households in Non-farm Activities 176
Page No.9
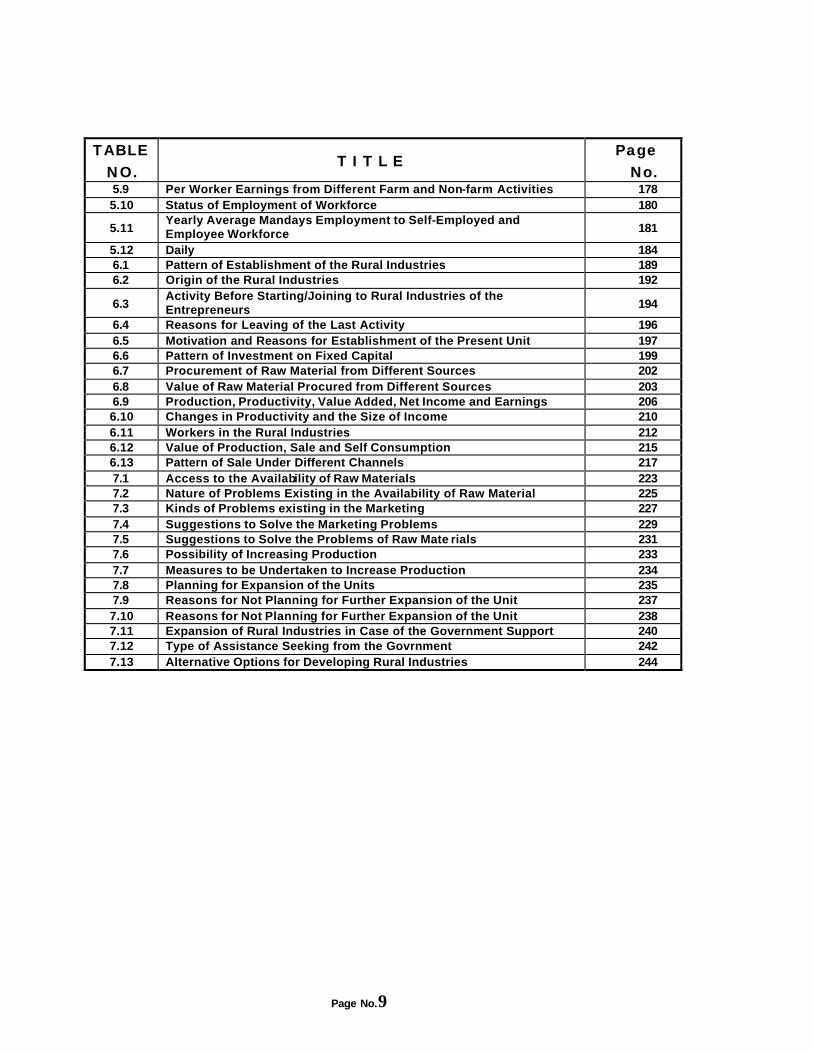
TABLE NO.
T I T L E Page
No. 5.9 Per Worker Earnings from Different Farm and Non-farm Activities 178 5.10 Status of Employment of Workforce 180
5.11 Yearly Average Mandays Employment to Self-Employed and Employee Workforce 181
5.12 Daily 184 6.1 Pattern of Establishment of the Rural Industries 189 6.2 Origin of the Rural Industries 192
6.3 Activity Before Starting/Joining to Rural Industries of the Entrepreneurs 194
6.4 Reasons for Leaving of the Last Activity 196 6.5 Motivation and Reasons for Establishment of the Present Unit 197 6.6 Pattern of Investment on Fixed Capital 199 6.7 Procurement of Raw Material from Different Sources 202 6.8 Value of Raw Material Procured from Different Sources 203 6.9 Production, Productivity, Value Added, Net Income and Earnings 206 6.10 Changes in Productivity and the Size of Income 210 6.11 Workers in the Rural Industries 212 6.12 Value of Production, Sale and Self Consumption 215 6.13 Pattern of Sale Under Different Channels 217 7.1 Access to the Availability of Raw Materials 223 7.2 Nature of Problems Existing in the Availability of Raw Material 225 7.3 Kinds of Problems existing in the Marketing 227 7.4 Suggestions to Solve the Marketing Problems 229 7.5 Suggestions to Solve the Problems of Raw Mate rials 231 7.6 Possibility of Increasing Production 233 7.7 Measures to be Undertaken to Increase Production 234 7.8 Planning for Expansion of the Units 235 7.9 Reasons for Not Planning for Further Expansion of the Unit 237 7.10 Reasons for Not Planning for Further Expansion of the Unit 238 7.11 Expansion of Rural Industries in Case of the Government Support 240 7.12 Type of Assistance Seeking from the Govrnment 242 7.13 Alternative Options for Developing Rural Industries 244
Page No.10
NONNON--FARM FARM ECONOMY AND RURAL ECONOMY AND RURAL DEVELOPMENT DEVELOPMENT
(EXECUTIVE SUMMARY)
INTRODUCTION, OBJECTIVE AND SAMPLE:
It is a universally accepted fact that the agricultural sector is, by itself, incapable of creating additional opportunities of gainful employment in the wake of increasing population. As a result, the impetus for achieving sustained development in rural areas has to pivot around expanding the base of non-farm activities. If such a comprehensive planning approach can be evolved it could provide the solution to the problems of rural areas such as poverty, unemployment and out-migration of the rural work force. The significance of the non-farm sector is even more pronounced in the agriculturally backward and low productivity regions such as the hill districts of Uttaranchal.
The present study was undertaken with the objective of examining the structure, growth, development potentials and the various problems which exists in the functioning of non-farm activities. The study also aims to investigate the possibilities and measures which need to be initiated for developing the non-farm activities for achieving employment and attaining a better quality of life for the people residing in the rural areas of Uttaranchal.
The study is based on primary information collected from district Almora which is a part of Kumaun region and district Pauri which falls under Garhwal region of the state. The two districts were selected since they had a relatively higher concentration of the work force in non-farm sector as per the 1991 Census. From Almora we then selected Kapkote block and Dugadda block from district Pauri. From each of these two blocks we then selected villages representing three categories viz., those located in the valley (low land areas below 500 msl), middle hill areas (between 500 to 1000 msl), and high hill areas (above 1000 msl). A total of 32 villages were thus covered from these two districts and from these villages 3437 households were identified for field survey. Out of these 1335, households were engaged in non-farm activities. Besides the primary information we also collected relevant secondary information from various government offices.
Page No.11
We will now present the main findings of the study based on various aspects of the non-farm sector.
STRUCTURE AND GROWTH: The results of the survey conducted in the 32 selected villages reveals that manufacturing activities, both traditional and non-traditional, form a major part of the non-farm sector in all three locations in general and the high altitude areas in particular. The manufacturing enterprises found in high altitude areas and middle altitude areas are black smithy, basket and mat making, rope making and woollen enterprises and they are based on locally available raw materials. In the low hill area activities such as carpentry, flour milling, tailoring, repairing and servicing units are dominant. However, over the years manufacturing activities in general and traditional household-based activities in paritcular, have been declining. On the other hand, non-farm activities such as trading, service and transportation have been developing over the years and that too in the low and middle hill areas in particular. A major factor affecting the decline in the growth of manufacturing activities is the lack of interest among the younger generation in these activities since they generate low levels of income. The other factor responsible for their plight is the shortages in the locally available raw materials.
It was found that the establishment of rural non-farm enterprises in general, and manufacturing activities in particular, require very low levels of capital investment. The average capital investment in these activities works out to be around Rs.4550 per enterprise. In the case of the service sector it is around Rs.6150 and Rs.17,200 in trading and commercial activities. The highest investment of Rs.3.20 lakhs per unit was found in the transport sector. The turnover of these enterprises has a direct relationship with the level of investment made in any specific enterprise. Consequently households engaged in the transport sector have the maximum turnover. On the whole it was found that all non-farm activities taken together make a profit of around 42 per cent. Highest profit accrues in servicing activities (83 per cent) and is followed by manufacturing activities (65 per cent). A very little contribution of various rural development programmes, especially rural self employment oriented schemes has been visualized in motivating a little over 4 per cent of the households for establishing different non-farm activities through providing financial assistances in the form of subsidy cum loan facilities. Though, in real terms, around 15 per cent of the non-farm households were facilitated through providing financial assistance from different Government Departments, financial institutions and banks to set up their industrial enterprises. Also a little over of 3 per cent of the family members of the non-farm households had availed the vocational training for establishing non-farm activities. However, the role of recently introduced SGSY scheme in creating self-employment opportunities has been almost negligible. So far not any self-help-groups have been formed in the sample villages and the under utilisation of funds which provided for implementation of SGSY has been well recognized in almost the districts of the state.
Page No.12
EMPLOYMENT STRUCTURE: Agriculture and its allied activities employ a major chunk of the total labour force in the different districts of the state. In Uttaranchal the participation of women in the labour force is relatively higher as compared to other states. However, the significance of the non-farm sector, as a potential source of employment generation, has been increasing over the years. In fact, the shift of employment from farm to non-farm sector is quite evident. The share of employment in the farm sector was as high as around 75 per cent during 1971. By 1991 it had declined to around 65.5 per cent. Consequently, the corresponding share of non-farm employment had registered an increase from around 25 to 35 per cent between 1971 and 1991. Male workforce dominates the non-farm sector employment. Out of the total male workers their share in non-farm activities went up from around 37 per cent to 50 per cent between 1971 and 1991. In the case of females, on the other hand, the corresponding increase was from just below 4 per cent in 1971 to around 7 per cent in 1991. However, over the years, the concentration of women workforce has been increasing at much faster rate than the case of their male counterpart in non-farm employment.
In absolute terms it is found that employment has been going up in both farm as well as non-farm activities. However, the growth is faster in the non-farm activities. However, the rate of growth is faster in the non-farm sector and this fact confirms the limitation of the farm sector to be able to consistently absorb the ever-increasing workforce. If we classify the workers in the non-farm sector among different activities, the major concentration is found in the service sector and is followed by the manufacturing sector.
PARTICIPATING HOUSEHPARTICIPATING HOUSEHOLDS AND FACTORS AFFOLDS AND FACTORS AFFECTING ECTING EXPANSION:EXPANSION: The growth of the non-farm sector has been positively influenced by access to locally available raw materials, traditionally developed means of production, lack of employment opportunities in farm activities, improvements in infrastructure facilities such as roads and transport network etc. While the non-farm sector has benefited in general the sector to have ben efited most is the manufacturing sector in the high hill areas. The traditional manufacturing activities in the middle and low-level hills have been adversely affected because of the development of roads. Road development has prompted people to move to the nearby urban locations for better paid jobs. The development of roads has also witnessed a shift in activities from traditional enterprises to the relatively higher earning activities such as trading, transport, tailoring, services and repairing etc. This is so particularly in the middle and low altitude areas. The traditional manufacturing activities of low and middle hills have also been adversely affected by deforestation as well as degradation of natural resources. In fact, certain local resource based units have closed down completely.
Page No.13
The higher altitudes, however, are fortunate and traditional manufacturing activities are still being undertaken. Most of these manufacturing activities are in the hands of scheduled castes except for woollen activities, which have traditionally been the domain of the scheduled tribe households. The average size of the household engaged in the non-farm activities was found to be relatively higher as compared to those engaged in farm activities. Even the work participation rate in non-farm households is higher as compared to farm households. It is also observed that higher the size of the farm, lower is the household participation in non-farm activities.
The non-farm sector, particularly manufacturing activities, have been playing an important role in the process of overall development by providing opportunities of employment to both skilled and unskilled workers. As a result of these employment opportunities the levels of household income have increased.
Despite having a lower size of holdings, the non-farm households are better off economically than the farming households. Taking all the three locations together the average per capita income among non-farm households worked out to be around Rs.4200 while the same was Rs.3090 among farming households. In the case of non-farm households the income generated from non-farm activities was as high as 77 per cent in the high altitude areas and was followed by the middle altitude areas with 70 per cent. In the case of the low altitude areas this share was 54 per cent.
STRUCTURE OF RURAL INDUSTRIES: The existing rural industrial enterprises which constitute the major part of the non-farm sector comprise of both traditional and non-traditional activities. Activities such as blacksmithy, basket making, rope making and wool-based activities thrive on locally available raw materials and constitute the traditional activities. As against these tailoring, comb making, iron and steel works, carpentry, flour milling, service and repair units form the non-traditional activities. In the case of the traditional activities woollen industry has been in the hands of scheduled tribe households while the others are dominated by scheduled castes. As far as the non-traditional activities are concerned they are being run by general as well as SC/ST households. Over three-fourths of the manufacturing activities are traditional activities and are found in each and every geographical area of the state. This is so despite the fact that there has been a declining trend in traditional activities. This is partly so because the households engaged in them are unable to switch over to the more profitable activities because of financial problems. These activities are also thriving because these households possess the requisite skills and since raw material is also available.
The produce of these manufacturing activities is primarily consumed in the rural area itself and most goods do not find a market outside the rural areas. The per unit value of produce is around Rs.14.7 thousand for all units taken together. This average is much lower in traditional units as compared to non-traditional ones. For
Page No.14
example, in basket making the average value of production is around Rs.6830 while in the case of a flourmill it is nearly Rs.23,500.
Over the years the efficiency of different rural industrial enterprises, as seen in terms of their productivity level and contribution to household income, have shown a positive change. However, the extent of change is higher among non-traditional units as compared to traditional units. Even then, one must keep in mind the fact that some of these traditionally manufactured items can be developed effectively if a proper market can be identified for them.
CONSTRAINTS AND PERSPECTIVES OF DEVELOPMENT: The two important factors which have contributed towards the unsatisfactory growth of industrial activities in different geographical locations are the scarcity of locally available raw materials and the inadequate development of an effective marketing network for selling the products of these units. Some of the other factors are outdated techniques of production, decline in local demand, lack of diversification and low levels of production. The households engaged in these activities are aware of their problems and limitations and are looking forward to some assistance from the government since as many as 61 per cent are willing to diversify their products, adopt new techniques and every go in for production of new goods altogether.
POLICY RECOMMENDATIONS: Since the potential of agricultural development in the hills is constrained because of factors like limited availability of arable land, problems of providing irrigation, small and fragmented holdings, terraced fields which limit the scope of mechanization, even increasing pressure of the growing population etc, the only recourse is to develop the non-farm sector keeping in mind environmental considerations, needs of the people, availability of resources, traditional crafts and the skills of the local people. The non-farm sector holds the key to the problems of unemployment, poverty and sustained development. In fact, various non-farm activities already exist in the hills and some of these have been traditional activities of rural households for several generations. However, they have not been given due weightage in the past and so not much efforts were made to strengthen and widen the base of these activities. (i) If the non-farm sector is to be developed effectively then a major role in
achieving this objective can be achieved through the development of the road transport. The development of roads will open up avenues for the marketing of goods and services produced by the rural enterprises on one hand and for the procurement of different raw materials for the traditional as well as non-traditional units on the other. Thus the road network will provide a chain of forward and backward linkages and this will facilitate the development of the sector.
Page No.15
(ii) Since the farm sector is very important and even in 1991 nearly 64.5 per cent of the workforce was engaged in this sector, it is equally important to give due weightage to the development of this sector as well. Therefore, it will be appropriate to introduce an integrated approach for the development of the farm and non-farm sectors by developing common basic necessities and infrastructure facilities thereby ensuring development of both these sectors simultaneously. The agricultural sector can be suitably diversified to provide the necessary inputs for certain identified agro-based industries.
(iii) The focus of rural development programmes should be aimed at promoting
self-employment opportunities rather than wage-paid casual employment. The government can identify non-farm activities for different areas keeping in mind the comparative advantage which a specific area enjoys. The rural people can then be made aware of these activities and government can chalk out suitable schemes for providing technical and financial assistance for setting up such units. Some of the activities which can be promoted for development are:
- diversified farm products, fruits, off-season vegetables, tea, honey, milk, meat, wool and woollen products,
- nature and resources based products herbs and medicines, furniture and wooden products, minor forest produce like bamboo and rattan and natural fibre base products. Activities like tourism and adventure sports, hydropower and ‘panchakkis’’can also be developed.
- handicrafts which are made by skilled men and women with the help of locally available raw materials.
(iv) The land areas under natural forests cover as well as the net cultivated land has been declining in the state. It has given rise to increases in barren and cultivable waste, permanent pastures and grazing land, and fallow land. These categories of lands taken together account for a higher area than the total arable land. The rural people must therefore be encouraged by the government to put this land to optional use as far as possible by introducing aforestation programmes whereby high value commercial plants, trees and groves are planted. In time to come these plants will provide the resource base for various rural enterprises. The present problem related to scarcity of locally available raw materials can thus be dealt with quite effectively. To meet the ongoing crisis of shortage of raw materials the state government can step in and purchase such raw materials from area where there is a surplus and transfer the same to areas of scarcity.
(v) It is equally important to upgrade the traditional techniques of production
which are presently being employed by the rural people. This will provide the much-needed improvements in the productive efficiency of rural enterprises. This will not only lead to increase in output and improvement in the quality of
Page No.16
the output itself. Once the quality of goods improves and total production also goes up these goods may be able to find a market in the urban Centres as well. In any case they will provide to be an attraction to the tourists once the tourism sector is properly developed.
(vi) Last but not least, introduction of additional goods, especially market oriented
articles in the production system and widening marketing opportunities for the products through establishing co-operative marketing societies in and around of the areas where different rural industries are fairly largely concentrated and the sales counters/shops in nearby towns tourist centres and large cities outside state are also some important suggestive measures in favour of developing rural industrial activities in the state.
Page No.17
CHAPTER I
INTRODUCTION : INTRODUCTION : SCOPE AND SCOPE AND METHODOLOGY OF THE SMETHODOLOGY OF THE STUDYTUDY
The economy of rural areas in India is predominantly based on agriculture and other activities related to agriculture sector. Hence an overwhelming majority of rural population is mainly depending on agriculture sector both for its employment and livelihood. At the same time various non-agricultural activities are also playing an important role in providing the opportunities of employment and incomes to the labourforce belonging to both farming and non-farming households. Though, the nature of employment as available either in agricultural or non-agricultural activities is measured for a shorter duration. As per 1981 Census, nearly fifth of the rural workforce (main workers) were reported to be employed in non-agricultural pursuits. And, the National Sample Survey (NSS) estimates that in 1978-79, in terms their usual status, nearly 20 per cent of male workers and around 12 per cent of female workers in rural India are employed in non-agricultural activities (Vaidyanathan 1986).
The rural non-farm economic sector comprises of wide ranging activities which are directly or indirectly associated to and supporting to various agricultural and non-agricultural related economic activities, excluding activities related to the agricultural production, performed in rural areas. The activities related animal husbandry, fishing and hunting, forestry and logging form the part of agriculture sector are commonly included in non-farm sector (Chadha 1993). Other rural non-farm economic activities consist of wide ranging various traditional and modern manufacturing activities, mining and quarrying, construction, trading, transport, storage and communication, hoteling and those are rendering community and personal services.
However, it is very surprising that a very little, in fact, almost negligible attention was devoted in terms of realising the contribution of non-farm sectors in providing employment and incomes to rural households and thus in the overall development perspective of rural areas in most of the developing countries including India, till late 1960s. This situation was partly emerged due to the excessive pre-occupation of most development economists with the two sector model (Chadha 1993) which viewed developing countries having economic structure, i.e., a traditional agriculture sector and a modern industrial sector. Under this model it was expected that modern industrial sector will have the capacity to absorb the rural surplus labours successfully and the agriculture sector would bear the major burnt of growth (Ranis – Feil 1961). Moreover, the dual economic model looked at the traditional sector, including the rural non-farm sector, as a static and isolated; its contribution to the
Page No.18
development of modern economy was considered to be inconsequential (Singh 1993).
In most developing countries, the drawback in the real operation of the dual sector approach was well visualised in terms of adverse terms of trade, raising the problems of unemployment in rural areas, high incidence of out-migration of rural labourforce into urban areas in search of employment and the avenues of incomes, raising concentration of population in towns/cities, resulting unprecendently increasing rate of urbanisation, inequalities in the pattern of income distribution across the regions, between rural and urban areas and even within rural areas among different segements of households. It was during the period of late seventies the significance of rural non-farm activities was well realised in view of addressing the increasing problems of un-employment and poverty situation in most developing countries. Of late, it has universally been recognised that in a situation of unprecedently increasing volume of population and its sizeable addition to labourforce on one hand and increasing fragmentation of land holdings resulting decreasing availability of arable land for cultivation with the farming households on the other, the agriculture sector alone is expected would hardly be in a position to provide gainful employment opportunities to the increasing level of rural labourforce and to sustain the livelihood of the rural households. Even in high growth regions, the potential for further development in agriculture so as to create additional employment opportunities seems to be tapering off. (Mahanjan 1993). In fact a relatively rapid growth of agriculture is unlikely to employ the entire rural labourforce at reasonable levels of productivity and incomes (Papola, 1984). Also, even in a situation of bringing appropriate technological advancement in agriculture sector the rural labourforce cannot be employ fully in agricultural activities in the land scarce countries (Islam 1987).
Considering into account the limited capability of agriculture sector in providing gainful employment to increasing rural labourforce and sustainable income to the farming households it would be necessary to initiate for developing a long term planning approach towards the development of various potential non-farm economic activities. In this context the present exercise is expected would be an instrumental measure not only for creating off farm employment and raising the level of income for rural households particularly small and marginal farmers and landless labourforce within the rural areas itself but it will equally be a greater initiative for bringing reduction in the rate of rural-urban migration of population to a certain extent.
In the past a large numbers of studies have been initiated to examine at various issues related to the structure and growth of non-farm employment, contribution of different rural non-farm economic activities in providing employment and income to the rural households, factors influencing and determining the growth pattern and structure of employment in different non-farm activities, across the states in India. However, relatively a little attention has been devoted towards examining the mode of establishing growth structure, development potentials, nature of problems existing in properly functioning, participation pattern of different communities and the kinds of factors influencing to the promotion, efficiency and growth of different categories of
Page No.19
non-farm activities/establishments in different geographical locations in different states of India. Besides this, a systematic and appropriate information is absolutely lacking about the extent and level of contribution of various non-farm activities in the total income of households and its real contribution in the perspective of regional development. Certainly, a number of studies have been undertaken to look into the contribution of rural industrial component, a most important segment of rural non-farm sector, in the creation of employment and income opportunities for rural population, structure, factors influencing to and the trends in the growth of different product groups of rural industries etc. in different states. (Papola 1982, 1987)), Bhattacharya (1986), Kabra (1992), Pathak (1982), Mathur (1993).
Despite the fact that certain important information is still to be gathered for assessing the size and structure of rural non-farm economic system, even than it has universally been well recognised that non-farm employment in almost the states is consistently increasing over the years. The reflection in the shift of workforce from agriculture sector to non-agriculture sector has been well visualised in almost the states in India. As the consequences of these emerging situations the concentration of workforce in agriculture and its associated activities has consistently been decreasing over the years, though the agriculture sector is, still, a dominant source of employment in rural areas. {Vyas and Mathai (1978), Krishnamurthy (1984), Chadda (1994), Eapen (1994)}. The N.S.S. estimates also show a consistent increase in the share of non-agricultural employment in rural India. Since the share of male workers in both secondary and tertiary sector has been increased significantly between 1972-73 and 1987-88 but it has increased more sharply in tertiary sector than the case of secondary sector. At the same time, according to both N.S.S. and Census data, the share of agriculture workers is showing a declining trend. (Basant and Kumar 1994). However, there exist a quite large regional variations in the ratio of non-agricultural to total employment in rural areas. According to 1981 census, this ratio ranges from around 12.6 per cent in Madhya Pradesh to over 25 per cent in West Bengal and exceptional 52 per cent in Kerala (Vaidyanathan 1986). Consequently over the years, the contribution of agriculture sector in providing income for the rural households has been narrowing down in India. While the share of income generated from non-farm economies has been sharply increasing. A study by Chadha (1993) finds that, at national level, the income generated from primary sector, consisting of agriculture and its associated activities, is steadily declining while the respective share of both Secondary and Tertiary Sector is noted consistently increasing ever since the beginning of planning era. At the same time both the productivity and value added per worker in agriculture sector constitute significantly at much lower level than in the secondary and tertiary sector of economies. As per N.S.S. estimates, in 1977-78, earnings of regular workers in non-agricultural sector were estimated to be around 2.7 per cent higher than in agricultural sector, falling to 2.4 per cent in 1987-88 (Papola 1992). This indicates the fact that the creation of increasing employment opportunities through developing
Page No.20
and expansion of potential non-farm activities would prove an instrumental measure for raising the income levels of households in rural areas.
On the whole, the rural manufacturing sector has been witnessed as a dominant component among the various non-farm activities in terms of providing employment and income opportunities to the rural labourforce, though most rural labourforce do engage on them for shorter duration during the off agricultural season and because of distress. A study by Papola (1992) revealed that manufacturing activities constitute the second largest sector after agriculture and account for over 7 per cent of the total and one third of the non-agricultural employment in rural areas. The possibility of increasing employment opportunities is largely confined in modern categories of non-household manufacturing activities than in the household based traditional one. Since the rate of employment is growing at more faster rate in non-household manufacturing sector than in the household-manufacturing sector in rural areas (Mathur and Pani 1993). Accordingly the income generation potentials and capability of former categories of enterprises are visualised significantly much higher than the case of latter categories of enterprises which is largely seen as a reflection of the differences in the level of investment undertaken among them. The labour productivity in household manufacturing is also found generally at lower level than in non-household manufacturing activities because these activities have continued mainly as part of tradition and use indigenous mode of traditional technologies in the production of goods through using mainly un-paid family labour. However, in spite of low levels of profitability and productivity, such activities continue to exist and in some cases grow because firstly, the involvement of labourforce in these activities is a result of distress and, secondly, there is a demand for their products (Basant and Kumar 1994). On the other, Mathur (1993) pointed out that the expansion of rural industrial activities should be maintained, otherwise it will be rather difficult to overcome from the problems of un-employment in rural areas. In addition to this restructuring of rural industrial enterprises, through upgrading their production technology and changes in product mix, also need a special consideration for strengthening the per worker productivity and increasing the income level of rural households (Visaria and Basant 1994). Because, the possibility is also large that some of the traditional household manufacturing which are playing a dominating role in the absorption of family labourforce and are the important source of supplementing household income along with agricultural income may disappear or the workers engaged in these activities will be able to attain only a precocious margin of subsistence if no efforts are to be made for improving the productivity of these units. In fact, in various states, the traditional household manufacturing households are declining and the modern household enterprises have been increasing both in rural and urban areas (Basant and Kumar 1990).
Page No.21
Determinants and Influencing Factors to the Expansion of Non-Farm Sector The studies carried out in the past have identified a large number of factors to explain the magnitude of growth and development of various non-farm activities in different regions. The pattern of agriculture growth, yield rates and productivity of major food crops, extent of commercialisation of agriculture, distribution and size of operational holdings, growth of literacy, urbanisation, Government policies towards the promotion of non-farm activities, internal and external demand conditions of goods and services produced by this sector and markets etc. are among the most important factors influencing the structure and growth of non-farm sector. However, the role of these factors is found significantly varying among the different state. Agriculture development and commercialisation are assumed positively influence the growth pattern and the structure of non-farm sector in general and especially to the expansion of rural manufacturing activities in particular. The findings of a large numbers of studies have revealed that there is a positive relationship between the growth of agricultural productivity and non-agricultural employment across the regions of the country (Vaidyanathan 1968, Unni 1991, Mahendra Dev 1990, Jayraj 1989) even within the states across the district level (Singh 1989). The growth in agriculture is expected to influence positively the growth pattern and expansion of non-agricultural enterprises, by way of supplying adequate raw materials, creating greater demands for various inputs and allied services raising to local and external demands for consumption goods and creating the possibility of generating surplus for its further investment on different rural non-farm activities especially in activities relating to processing and trade (Hariss 1987). Expectations are that the expansion of non-farm activities so as to raise the income of rural households will lead to attract the surplus labourforce of agriculture to tern into non-farm activities. In fact, the un-employed labourforce and those are no way engaged in agriculture will also find the opportunities to get employment in non-agricultural activities (Vaidyanathan 1986, Bhalla 1990). At the same time, it has also been pointed out that the agricultural development may improve the efficiency of rural non-agricultural enterprises without necessarily increasing their numbers. Thus, the agricultural growth by itself leads to increase in rural non-agricultural employment is not validated. However, the agriculture growth is found to facilitate an improvement in the situation of some rural industrial activities producing goods for general use and are capable of adopting to new pattern of demand (Papola, 1987). Accordingly, it is very difficulty task to ascertain the extent to which the investment on different non-farm activities is financed by agricultural surplus (Visaria and Rakesh, 1994). Moreover, the nature and extent of relationship between the level of agricultural surplus and its investment pattern on non-farm activities could be established in the perspectives of only agriculturally well-developed regions. Such relationship hardly persists in agriculturally backward regions, which are possessing limited arable land and the farming households are owning insufficient holdings for cultivation and the
Page No.22
question of generating agriculture surplus is unlikely existed. In such regions, certain other elements such as access to different infrastructural facilities particularly transport and communication, location of villages and their distance to nearest city/town, nature of local and outside demand and prevailing marketing systems for their products and the Government policy and financing systems towards the expansion of non-farm activities etc. could be seen as the main factors associated to boost the growth of various non-farm enterprises. In addition, the access to various required raw materials, manpower and production technology may also be the major determining factors for the expansion of and stability of various rural non-agriculture enterprises. In stead of the fact that only increase of land productivity may not be a sufficient condition for the emergence of a growth induced non-agriculture sector (Kashyap and Desai 1990). Also, the impact of urbanisation in the expansion of non-farm employment is found not very encouraging factor. For instance study conducted in U.P. revealed that in Western region, an agriculturally and industrially developed region, the relationship seems to be negative whereas it is positive in relatively backward central and eastern region and thus, the role of urbanisation seems to be more complex and region specific (Singh 1994). However, to a certain extent, diversification and commercialization of agriculture through introducing market crops in the farming system and resulting overall increase in the volume of agricultural production can be hypothesized, directly and indirectly shall promote the establishment and expansion pattern of non-farm enterprises in rural areas. The direct impact of increase in agriculture production to the growth of non-farm sector can be sustained by way of supplying more raw material and creating demands for inputs and allied services. The indirect impact can also be visualized in the form of increasing consumption demand and generating surplus for investment (Papola, 1987). Vaidyanathan (1986) and Sankaranayan (1980) also formulated an alternative hypothesis that it is the degree of commercialization of agriculture that determines the development level of non-agricultural activities in rural areas. Another, hypothesis put forward by Vaidyanathan (1986) is that agricultural activity acts as a residual sector so that the rural workforce who are not observed fully in agriculture spice over into non-agricultural activities. According to him, an excess labour situation should lead to a fall in the non-agricultural way relative to the agricultural wage.
Thus, over and above, it has been well documented by the studies undertaken in the past that the growth pattern of different non-farm activities and the extent to which employment is increasing in these activities are, directly or indirectly, influenced and determined by various fundamental factors across the regions. But the nature and level that various identified factors influencing to the structure and growth of these activities tend to vary according to the socio-economic and the pre-locational characteristics of the units in different regions. However, the overall contribution of different non-farm activities, especially the rural manufacturing sector has been well recognised in terms of both providing employment opportunities to the labourforce, thereby reducing the over-pressure of population on land as well as the problems of un-employment, and the generation of income of rural households, especially those possessing smaller size of land holdings or no land for cultivation.
Page No.23
Indeed, glaring shift in the occupational structure of employment in rural economic system has been well visualised in different states partly due to unprecendently increasing trend in the growth of labourforce and incapability of farming system to provide gainful employment to increasing labourforce and, partly due to emerging increasing rate of un-employment and non-availability of other remunerative employment opportunities in other than agricultural activities in rural areas. In this sense, creation of employment opportunities according to the increasing trend of labourforce in rural areas is no more possible only through initiating for development of agriculture sector. Hence the expansion and development of various non-farm activities in general and those who are possessing certain area specific comparative advantages in terms their development possibilities and have greater potential for creating additional employment opportunities and income generation in different regions could possibly be a rather instrumental approach for reducing the emerging problems of increasing un-employment and poverty in rural areas. At the same time, the importance of planning for development of non-farm activities would be more desirable in socio-economically backward regions/states and hilly areas as compared to developed one. Because the former groups of states are largely lacking the potentials of development of both agricultural and large industrial enterprises than the cases of latter category of the states. In addition, the problems of poverty and unemployment have been reached at alarming stages and relatively at much higher level in former groups of states as compared to latter one.
The Present Study Keeping into consideration the growing contribution of non-farm sector in the overall process of rural development, especially in terms of providing employment opportunities and the avenues of income to the labourforce and thus, in bringing improvements in the economic condition of rural households, as experienced in various states of India, the main objective focus of the present study has been centered around on to examine the structure, growth, development potentials and the kinds of problems existing in the properly functioning of various non-farm activities and, finally to investigate about the possibility and measures to be initiated for developing different non-farm activities so that ongoing serious problems of un-employment and poverty in the rural areas of Uttaranchal can be reduced at certain extent. The study is also an attempt to examine the existing structure, trends in growth and the nature of participation of different communities in non-farm employment available in different rural non-farm activities in various regions of the state.
Uttaranchal, situated in the Central Himalayan Zone, is one of the most backward and underdeveloped states of India. The geographical area of Uttaranchal extends for over 53.4 thousand sqr. Kms. and is inhabited by about 8.5 million people. The agricultural and its associated activities, including animal husbandry and fishing are forming the economic base and the main source of employment for labourforce and the livelihood for people in the state. Due to non-availability of adequate employment outside agriculture the pressure of labourforce on the land is already high and is still increasing rapidly. The capacity of land to bear the load of more population is severely limited on account of the generally poor quality of land and its
Page No.24
low productivity in the mountain terrain. The technology used in the farming system is also traditional. The scope of technological upgradation and innovation is limited because the agriculture is largely carried out under rainfed conditions in terraced fields. As over 64 per cent of the cultivated land is lacking the facility of irrigation. The average size of land holdings is also very small accounting for 0.94 hectares. Even the per cultivator average size of land area is only 0.57 hectares and around 88 per cent of the total holdings are in the category of marginal farms. The use of improved agricultural practices such as application of fertilizer pesticides and high yield variety seeds is also ruled out in the farming system due to lacking irrigation facilities. Augmenting water resources and bringing additional land under irrigation are difficult in the present situation of increasing deforestation on one hand and on account of the problems of undulating topography and hard rocky strata in most part of the State, especially in hilly and mountaineous areas. The increase in population leading to an enlargement of the labourforce on the one hand and the inability of agriculture to employ more people gainfully on the other have come to pose a serious problem for the development of the state. To overcome this constraint it is necessary to examine the development and employment potential of different non-farm sectors in the state. Planning for development of various non-farm activities is expected could be a possible alternative approach for creating additional employment opportunities for increasing labourforce and sustaining the livelihood of the households in rural areas of the state. No doubt, the non-farm economy is seen to be developing in an important way in almost the geographical locations of Uttaranchal in recent years. As per the 1991 census, there was a decrease in the percentage of workers in agriculture and allied sector and a corresponding increase in the non-agricultural activities, between 1981 and 1991 percentage of workers in agriculture and allied activities decreased from 69 per cent to nearly 64 per cent while those engaged in tertiary sector increased from 29 per cent to 36 per cent.
The concept of developing various potential non-farm activities and creating gainful employment opportunities in rural areas of Uttaranchal therefore, implies a shift of labourforce from low productive, distress type and subsistence agricultural activities to those that have a higher level of productivity, are more market oriented and sustainable in terms of local resource endowments and market interactions. These shifts are very important in the process of the overall economic development and more relevant for poverty eradication, and sustainable use of natural and human resources. Non-farm activities in the past have been extremely important for the poorer groups because of their limited access to agricultural land and other productive assets. The socio-economically poor segment of population such as Scheduled Caste, Scheduled Tribes and low income groups have traditionally been engaged in various non-farm activities for the past several generations and are still largely employed in most of these categories of activities in rural areas of Uttaranchal. These activities include spinning and weaving of woolen yarns, traditional handicrafts, carpentry, Blacksmithy, oil processing, ringal work, etc.
Nature of Linkages
Page No.25
Existing non-farm activities, particularly household based manufacturing activities, in the rural areas of Uttaranchal are mainly based on locally available raw materials and are generally catering the local demands through supplying the goods and article required for performing agricultural activities, collection of forest products, construction of houses and some household durable while only limited categories of goods such as handicrafts, woolen articles, furniture, etc. are sold in local market as well as outside the state. Initiatives have also been carried out under the various rural development programmes in the past to focus on developing the various categories of non-farm activities already existing in many parts of the region so as to create productive employment opportunities for people living below the poverty line. Certain categories of non-farm activities are traditionally based on maintaining social linkages and system among different social groups of population. Under this system, the Scheduled Caste households have been manufacturing certain goods and articles for the fixed numbers of Upper Caste groups of households and receive certain quantity of foodgrains as produc tion charges, which system called as “Zajmani System”, for the past several centuries. In this sense, various categories of existing non-farm activities in Uttaranchal have various kinds of backward linkages in maintaining traditionally followed local soc ial systems, providing employment and income opportunities to socio-economically poor segments of population so as to improve their socio-economic conditions and the quality of life. The forward linkages of existing non-farm activities are well prevailing in the sense that they are catering the demands of people living outside the state. This is in the form of the supply of locally available natural resources such as forest and mining products, goods and articles manufactured by different local non-farm actictivities, rendering services in transportation and trading of certain goods in markets located within and outside Uttaranchal.
As far as the possibilities of creating additional employment and income opportunities is concerned, it has been observed that the development potentials of various agriculture related off-farm activities such as sericulture, animal husbandry, forestry, social conservation, horticulture and floriculture are quite high. However, not much systematic effort has been made in this direction so far. However, during the recent past, some initiatives have been undertaken for the expansion of tea plantation, and nurseries, floriculture, fiber tees locally known as ‘Semal’ etc. in high altitude areas of the state.
The Objectives of the Study Considering the importance of non-farm sector in the development perspectives of Uttaranchal, in general and realising the expected role of this sector in view of reducing the problems of un-employment and poverty in rural areas of the state, the present study has attempted to examine the following issues:
(1) Mode of establishing the pattern of growth of non-farm activities across the
districts and different geographical locations of the state.
Page No.26
(2) Structure and growth of employment in different non-farm activities and the level of contribution of these activities in providing employment and income opportunities to different socio-economic groups of households.
(3) The extent and nature of participation of different socio-economic groups of
population in different non-farm activities, reasons for lacking participation, differences existing in the socio-economic condition among the households engaged and those who are not engaged in non-farm activities.
(4) Pattern of Investment, mode of production technology, production structure,
marketing systems for disposal of goods, availability pattern of raw material, structure of employment in manufacturing activities. Attempts have also been made to examine the nature of problems existing in the successfully functioning of different non-farm activities and the perceptions of local people regarding the development prospects of different non-farm activities.
(5) Impact and contribution of non-farm activities (I) household economy and (ii) economy of sample areas.
Attempts have also been made in the present study to examine the following hypothesis in order to understand the operational situation of various non-farm activities and also to suggest in detail, about the kinds of approaches could be initiated for developing different categories and types of non-farm activities.
(i) Extent and level of linkages prevailing between the quantum and quality of non-farm activities with poverty and un-employment in different geographical location.
(ii) The changing nature of non-farm activities as we move up along the farm size
continuum.
(iii) The dynamic and market friendly component of the non-farm activities contrasted to the one pursued as a distress phenomenon.
(iv) The constraints that different categories of non-farm activities in general and rural manufacturing in particular are likely to face when the economy opens up further and so on.
Page No.27
Methodology and the Sample Keeping into consideration the fact that there exists significantly a larger variations in the development potentials and growth of different categories of non-farm activities, availability situation of employment opportunities, concentration of workforce in different economic sectors, pattern of income distribution and general socio-economic characteristics of households and certain related issues among the regions of the state, within the region at different district level and even among different geographical locations within a district it was decided to examine the objectives and main issues of the study in both of the regions, Garhwal and Kumaun of the state. We further, decided to select one district from each of the region, which have the highest concentration of non-farm workers among the districts of respective regions. Thus we identified two districts, Almora from Kumaun region and Pauri from Garhwal region. Since as per 1991 Census, in both the districts the concentration of workforce engaged in non-farm sector (excluding registered factories) has been registered significantly much higher than in the remaining districts representing two divisions. Thereafter, one Block from each of the district, which were showing highest level of the concentration of workforce engaged in non-farm activities were choosen for undertaking the detailed study. On this basis, we selected block Kapkote from district Almora and Dugadda block from Pauri. Finally, for the purpose of obtaining certain primary data and information as required for the present study, we selected three categories of villages, viz., those located in the valley (low land areas) areas of below 500 msl., middle hill areas ranging between 500 msl. to 1000 msl. A high hill areas of above 1000 msl. For the purpose of the selection of sample households as the units of carrying out detailed study a listing of all existing households in the sample villages, whether they were involved or not involved in non-farm activities, was undertaken. Some basic information related to the socio-economic indicators, more especially the demographic pattern, size of land holdings, employment and un-employment situation of family members, income by sources, etc. was collected among both the groups of households along with the listing of entire households, such that a detailed analysis may be portrayed to understand the existing socio-economic pattern of rural households in different geographical settings in general and the extent of differences prevailing among these two groups of households in terms of certain social and economic indicators, contribution of non-farm sector in providing employment and income opportunities to the family members of the sample households and the sample areas as a whole. In all we developed three sets of interview schedules for different categories of households, one, for those were not engaged in non-farm activities; two, the households which any of the family members was engaged in non-farm activities as wage paid worker and third the members of the households were associated with non-farm activities in a capacity of self-employed.
Page No.28
TABLE 1.1 DETAILS OF THE SAMPLE HOUSEHOLDS
Households Engaged in NFA
Sl. No.
AREA/DISTRICT
Total Villages
Total House-holds
House-holds Not
Enga-ged in NFA
As wage paid
Emp-loyee
As self Emplo-
yee
Total
A.
PAURI GARHWAL
26
2482
1852
181
449
630
1. HIGH HILLS 10 655 438 69 148 217
2. MIDDLE HILLS 12 906 696 57 153 210
3. LOW HILLS 4 921 718 55 148 705
B.
ALMORA
6
955
250
293
412
203
1. HIGH HILLS 2 332 54 99 179 278
2. MIDDLE HILLS 2 348 146 92 110 202 3. LOW HILLS 2 275 50 102 123 225
TOTAL (ALL AREAS)
32
3437
2102
474
861
1335
1. HIGH HILLS 12 987 492 168 327 495 2. MIDDLE HILLS 14 1254 842 149 263 412
3. LOW HILLS 6 1196 768 157 271 428
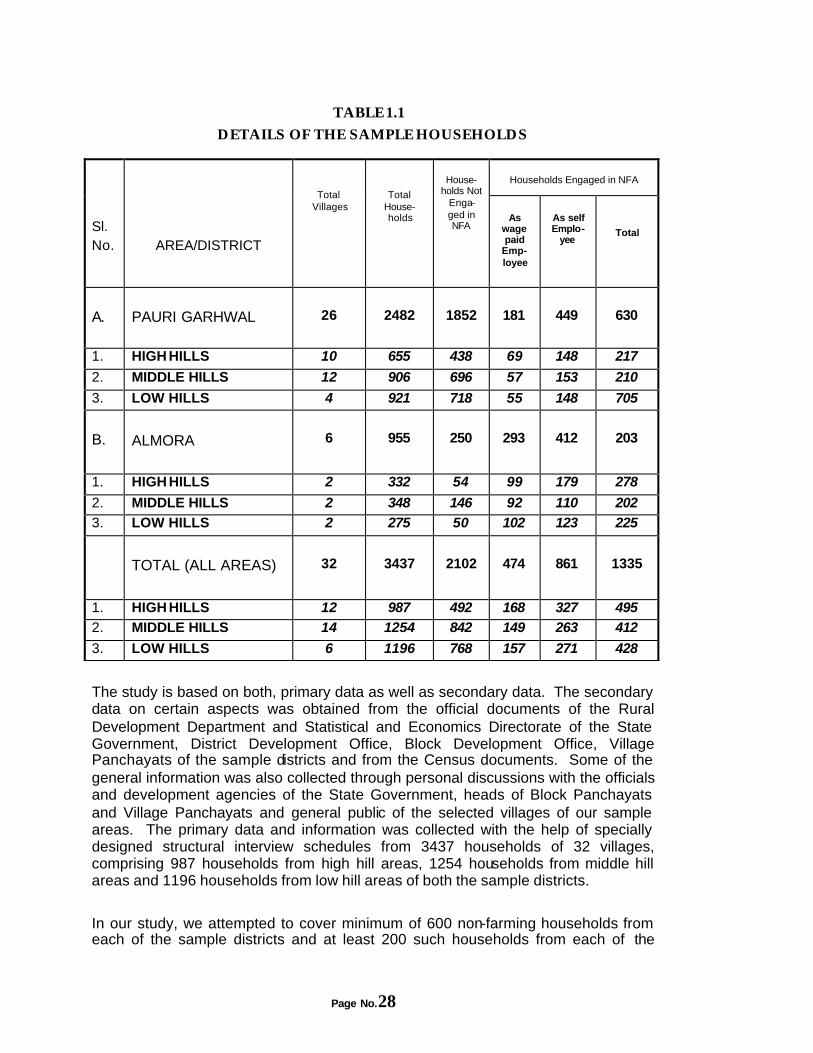
The study is based on both, primary data as well as secondary data. The secondary data on certain aspects was obtained from the official documents of the Rural Development Department and Statistical and Economics Directorate of the State Government, District Development Office, Block Development Office, Village Panchayats of the sample districts and from the Census documents. Some of the general information was also collected through personal discussions with the officials and development agencies of the State Government, heads of Block Panchayats and Village Panchayats and general public of the selected villages of our sample areas. The primary data and information was collected with the help of specially designed structural interview schedules from 3437 households of 32 villages, comprising 987 households from high hill areas, 1254 households from middle hill areas and 1196 households from low hill areas of both the sample districts.
In our study, we attempted to cover minimum of 600 non-farming households from each of the sample districts and at least 200 such households from each of the
Page No.29
geographical locations of both the districts for the purpose of the collection of required necessary information and primary data. It also proposed to cover all the existing households, on census basis, those were not engaged in non-farm activities among the all villages as selected for covering non-farm activities. In all we covered 1335 non-farm households, comprising 630 households from district Pauri of Garhwal division and 750 households from district Almora of Kumaun division for the purpose of examining the objectives and issues of the present study. In addition, the size of sample of the households those were not engaged in non-farm activities is accounted for 2102, consisting of 1852 households from Pauri and 250 households from Almora districts. The details of the numbers of different categories of households and the villages covered in our study are presented in Table 1.1.
Settings of the Sample Districts Since, the problems of poverty and un-employment has been largely emerging in purely hilly and mountainous districts as compared to those districts which a sizeable area is covered by the plains. The latter categories of districts such as Nainital, Haridwar, Udham Singh Nagar and Dehradun are agriculturally more prosperous and industrially more developed than the remaining purely mountainous districts. As the consequences, the opportunities of different categories of productive employment in these four districts are better available than the case of purely hilly districts. It is, therefore, the need for developing potential non-farm activities in purely hilly areas would be more necessary than in non-hilly areas for addressing the existing problems of un-employment and livelihood. Considering these facts in mind we proposed to initiate present study in purely hilly and mountainous areas of districts Pauri and Almora.
The land area available for cultivation of agricultural crops in both the districts is very limited. Over 97 per cent of the holdings in Almora and 81 per cent of the holdings in Pauri are constituting in the category of marginal and small farms. In fact, a large part of the cultivated land area of 91 per cent in Almora and 94 in Pauri is lacking the facility of irrigation and the situation of almost stagnation in the yield rates of the major food crops is well visualised in both the districts (Mehta 1999). The diversification of economy at large scale through developing large industrial sector is rather restricted by the availability of very frequent and sensitive eco-system in both the districts. Thus the possibility of developing more productive sectors, agriculture and industry so as to create additional employment in the sample areas is almost impossible task ahead. At present, the proportion of workforce engaged in various non-farm activities is accounted for only 17.26 per cent in Almora and 27.15 per cent in Pauri. In fact, a significant shift in the concentration of workforce from farm sector to the non-farm economic sectors, mainly in trading and service activities, has been well seen for last over two decades, but, a large majority of workforce is still confined in the agricultural activities for employment and livelihood in the sample districts.
Page No.30
CHAPTER II
STRUCTURE AND GROWTHSTRUCTURE AND GROWTH OF OF NONNON--FARM SECTORFARM SECTOR
In order to overcome from the persisting problems of un-employment, poverty and a high incidence of out-migration of active human resources the diversification of economics from subsistence – centered agriculture to commercialised production of farm and non-farm products has been recognised among the most important alternative options and a necessary policy initiatives. But, at the same time, the scope for large scale diversification of economic activities is severely limited in the purely hilly and mountainous areas of the state, because of a number of factors such as the limited and environmentally sensitive resource base, their spread of useable resources across different and inaccessible terrain, inaccessibility to markets and modern inputs and technology, deficient infrastructure and insufficient energy and high transport costs leading to non-competitiveness of products. Despite the fact that the diversification of economic structure through initiating industrialisation and large-scale production system would adversely effect the ecological system of Uttaranchal, since the most part of it dominated by hilly and mountainous areas. However, initiating development for carrying out small scale production at household level through harnessing certain environmental resources based on traditionally developed indigenous mode of technologies by the local people have been proved no way effect the local ecological system. Since, almost the districts of Uttaranchal possess several locations specific opportunities and comparative advantages for the establishment and expansion of locally available resources based various categories of non-farm economic activities. In fact, activities such as carpentry, rope making, ringal work, spinning and weaving of woolen yarn and a few related manufacturing enterprises have been in operation in only few selected hilly areas of the state for the past several generations. These activities are functioning at household level through using family labourforce and are basically based on locally available raw materials from the forests. Accordingly, a major part of industrial activities in rural areas of almost the districts are mainly as a part of the tradition and they do not form any kind of linkages and integration with the local resources and changing demand pattern. In stead the scheduled caste communities who manufacture and repair various categories of goods sand articles for the domestic use and agricultural purposes of the upper caste households own these units. Increasing accessibility to the facilities of road transport has also provided some extent of opportunities to the local people for establishing commercial activities in the form of retail shops, eating and refreshment units, repairing activities etc. along the roadside during the recent past.
Page No.31
Pattern and Mode of Establishing Non-Farm Activities In the present chapter, attempts have been made to examine the structure, distribution and growth of different categories and product groups of non-farm activities in different geographical locations, rural and urban areas, among the districts and at the state level for the period 1990 and 1998. The data regarding the numbers and types of non-farm activities existing in different geographical locations, i.e., high, middle and low hill areas of the state was not readily available from any secondary sources. Hence the concerned analysis is based on the primary data collected by us from the identified villages for the purpose of the present study. However, the remaining part of analysis is based on data obtained from the third and fourth round of the Economic Surveys.
The Economic Survey, which has been carried out by the State Government, is the only source for providing detailed information regarding the structure of non-farm activities at the state level. Although, the State Government, on the basis of the directions provided by the CSO, has been collecting certain data from the non-farm activities since 1977. So far, four rounds of surveys have been undertaken. But the scope of the first and second economic surveys had been very limited upto the collection of data from such units only who were employing minimum of one hired labour on regular basis. And thus a large numbers of units were not covered. Only the third and fourth Economic Surveys had covered all existing different categories of non-farm enterprises in both rural and urban areas on census basis. Due to certain limitations and inadequacy in the reliability of data which collected during the first and second rounds of economic surveys we, therefore, proposed to confine in analysing the various aspects related to non-farm activities for the period of the two economic surveys of 1990 and 1998. In both the survey periods, the non-farm activities have been categorised into two groups; one as own accounts enterprises and second, the non-farm enterprises. The former categories of units are basically household based enterprises, those are only using the family labourforce in the activities of concerned units while the latter one categories of enterprises include non-household units those are employing minimum of one wage-paid hired labour on a regular basis.
Page No.32
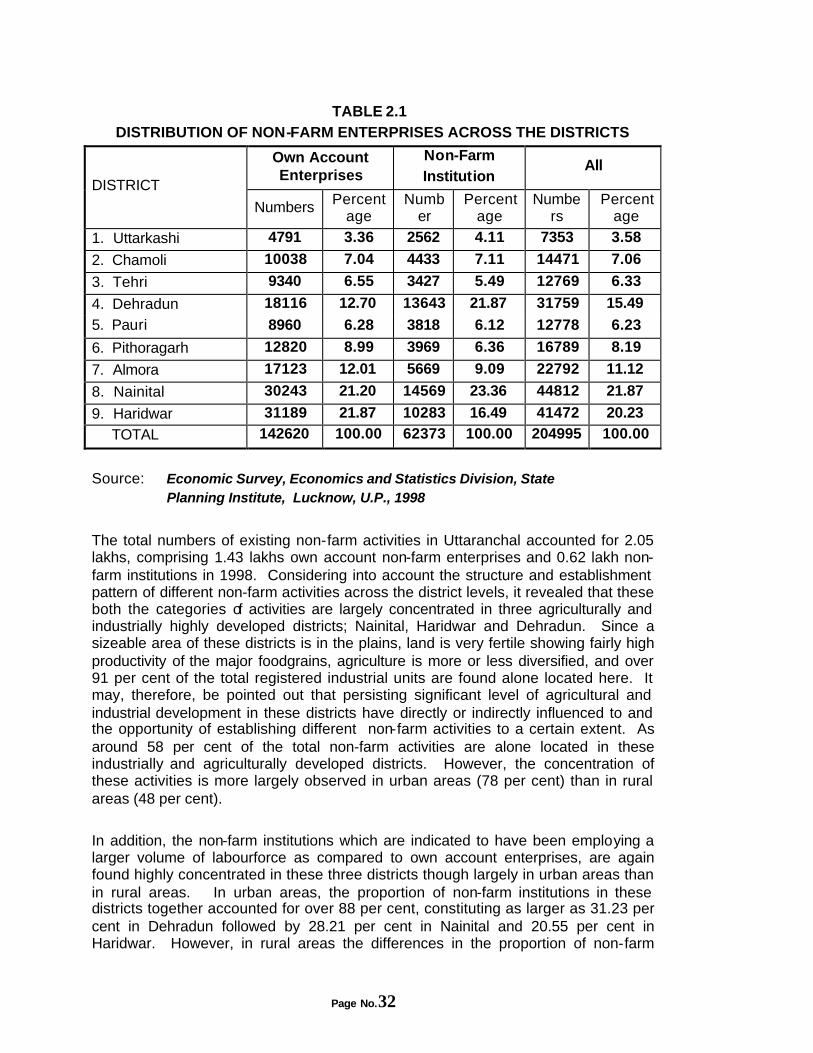
TABLE 2.1 DISTRIBUTION OF NON-FARM ENTERPRISES ACROSS THE DISTRICTS
Own Account Enterprises
Non-Farm Institution
All DISTRICT
Numbers Percentage
Number
Percentage
Numbers
Percentage
1. Uttarkashi 4791 3.36 2562 4.11 7353 3.58
2. Chamoli 10038 7.04 4433 7.11 14471 7.06
3. Tehri 9340 6.55 3427 5.49 12769 6.33
4. Dehradun 18116 12.70 13643 21.87 31759 15.49
5. Pauri 8960 6.28 3818 6.12 12778 6.23
6. Pithoragarh 12820 8.99 3969 6.36 16789 8.19
7. Almora 17123 12.01 5669 9.09 22792 11.12
8. Nainital 30243 21.20 14569 23.36 44812 21.87
9. Haridwar 31189 21.87 10283 16.49 41472 20.23
TOTAL 142620 100.00 62373 100.00 204995 100.00
Source: Economic Survey, Economics and Statistics Division, State
Planning Institute, Lucknow, U.P., 1998
The total numbers of existing non-farm activities in Uttaranchal accounted for 2.05 lakhs, comprising 1.43 lakhs own account non-farm enterprises and 0.62 lakh non-farm institutions in 1998. Considering into account the structure and establishment pattern of different non-farm activities across the district levels, it revealed that these both the categories of activities are largely concentrated in three agriculturally and industrially highly developed districts; Nainital, Haridwar and Dehradun. Since a sizeable area of these districts is in the plains, land is very fertile showing fairly high productivity of the major foodgrains, agriculture is more or less diversified, and over 91 per cent of the total registered industrial units are found alone located here. It may, therefore, be pointed out that persisting significant level of agricultural and industrial development in these districts have directly or indirectly influenced to and the opportunity of establishing different non-farm activities to a certain extent. As around 58 per cent of the total non-farm activities are alone located in these industrially and agriculturally developed districts. However, the concentration of these activities is more largely observed in urban areas (78 per cent) than in rural areas (48 per cent).
In addition, the non-farm institutions which are indicated to have been employing a larger volume of labourforce as compared to own account enterprises, are again found highly concentrated in these three districts though largely in urban areas than in rural areas. In urban areas, the proportion of non-farm institutions in these districts together accounted for over 88 per cent, constituting as larger as 31.23 per cent in Dehradun followed by 28.21 per cent in Nainital and 20.55 per cent in Haridwar. However, in rural areas the differences in the proportion of non-farm
Page No.33
institutions located among different districts are not varying to the extent as is revealed in the cases of urban areas, it varied lowest at 6.47 per cent in Uttarkashi to a highest level at 17.86 per cent in Nainital.
As far as the expansion pattern of own account enterprises is concerned, we again found that over half of the total units are confined in these agro-industrially-developed districts. In fact the concentration of concerned units in urban areas of these districts reaches as larger as 77.74 per cent as against 38.24 per cent in rural areas. In purely hilly and mountainous districts, the expansion of own account units is visualised at highest level in district Almora while a lowest proportion of them are located in Uttarkashi (3.36 per cent). Over and above, the analysis revealed that the expansion of various categories of non-farm activities has taken place at greater extent in the districts of Kumaun division as compared to the districts comprising of Garhwal division. Despite the fact that the availability of various natural and forest resources and thus the opportunities of developing different categories of non-farm activities based on using available resources is larger in high mountainous areas than in the middle and low areas. But, in real terms, the situation in the expansion pattern of various non-farm activities is emerging into a different direction. As the expansion of both own account enterprises and non-farm institutions has largely occurred in low hill areas, in fact in plain part of the district Nainital, Dehradun and Haridwar followed by district like Almora, Pithoragarh and Chamoli while least expansion is visualised in high hilly districts such as Uttarkashi. Thus, over and above accessibility to road transport facilities, the development of market links, level of agricultural and industrial development and the pace of urbanisation are seems to be mainly determining the development and expansion pattern of various non-farm activities though largely for non-manufacturing components of non-farm sector in the State.
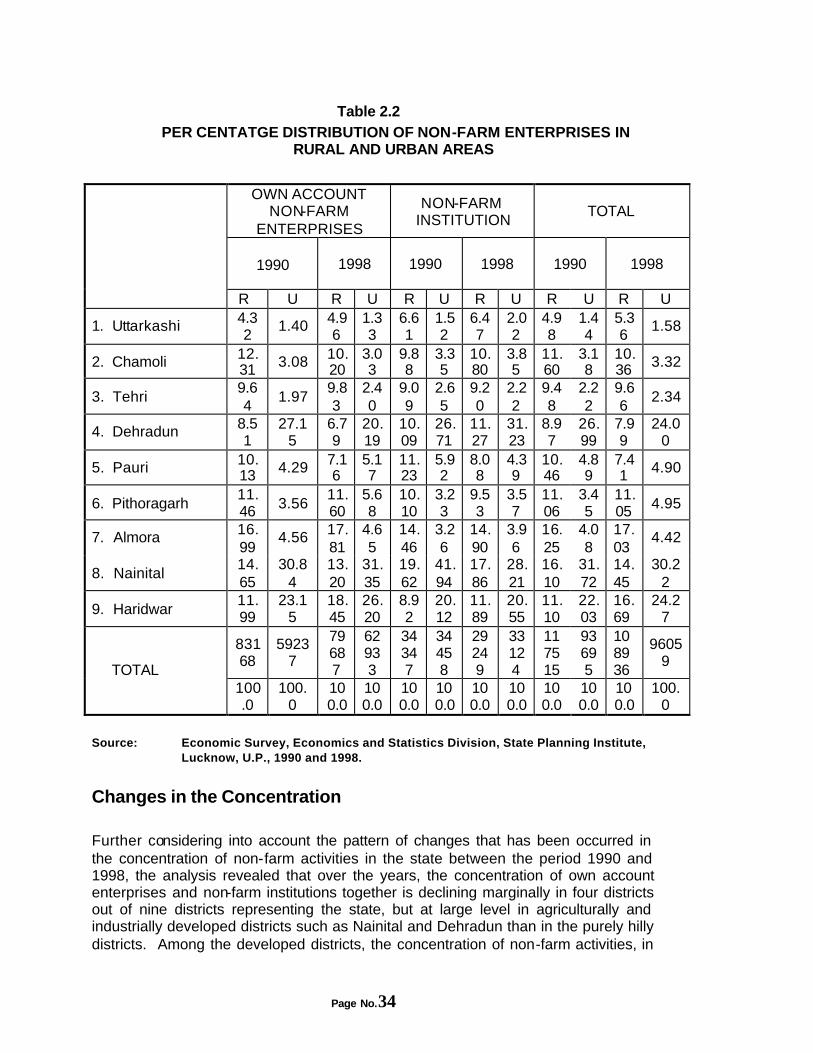
Page No.34
Table 2.2 PER CENTATGE DISTRIBUTION OF NON-FARM ENTERPRISES IN
RURAL AND URBAN AREAS
OWN ACCOUNT NON-FARM
ENTERPRISES
NON-FARM INSTITUTION
TOTAL
1990
1998 1990 1998 1990 1998
R U R U R U R U R U R U
1. Uttarkashi 4.32
1.40 4.96
1.33
6.61
1.52
6.47
2.02
4.98
1.44
5.36
1.58
2. Chamoli 12.31 3.08 10.
20 3.03
9.88
3.35
10.80
3.85
11.60
3.18
10.36 3.32
3. Tehri 9.64
1.97 9.83
2.40
9.09
2.65
9.20
2.22
9.48
2.22
9.66
2.34
4. Dehradun 8.51
27.15
6.79
20.19
10.09
26.71
11.27
31.23
8.97
26.99
7.99
24.00
5. Pauri 10.13 4.29 7.1
6 5.17
11.23
5.92
8.08
4.39
10.46
4.89
7.41 4.90
6. Pithoragarh 11.46 3.56
11.60
5.68
10.10
3.23
9.53
3.57
11.06
3.45
11.05 4.95
7. Almora 16.99
4.56 17.81
4.65
14.46
3.26
14.90
3.96
16.25
4.08
17.03
4.42
8. Nainital 14.65
30.84
13.20
31.35
19.62
41.94
17.86
28.21
16.10
31.72
14.45
30.22
9. Haridwar 11.99
23.15
18.45
26.20
8.92
20.12
11.89
20.55
11.10
22.03
16.69
24.27
83168
59237
79687
62933
34347
34458
29249
33124
117515
93695
108936
96059
TOTAL 100.0
100.0
100.0
100.0
100.0
100.0
100.0
100.0
100.0
100.0
100.0
100.0
Source: Economic Survey, Economics and Statistics Division, State Planning Institute,
Lucknow, U.P., 1990 and 1998.
Changes in the Concentration
Further considering into account the pattern of changes that has been occurred in the concentration of non-farm activities in the state between the period 1990 and 1998, the analysis revealed that over the years, the concentration of own account enterprises and non-farm institutions together is declining marginally in four districts out of nine districts representing the state, but at large level in agriculturally and industrially developed districts such as Nainital and Dehradun than in the purely hilly districts. Among the developed districts, the concentration of non-farm activities, in
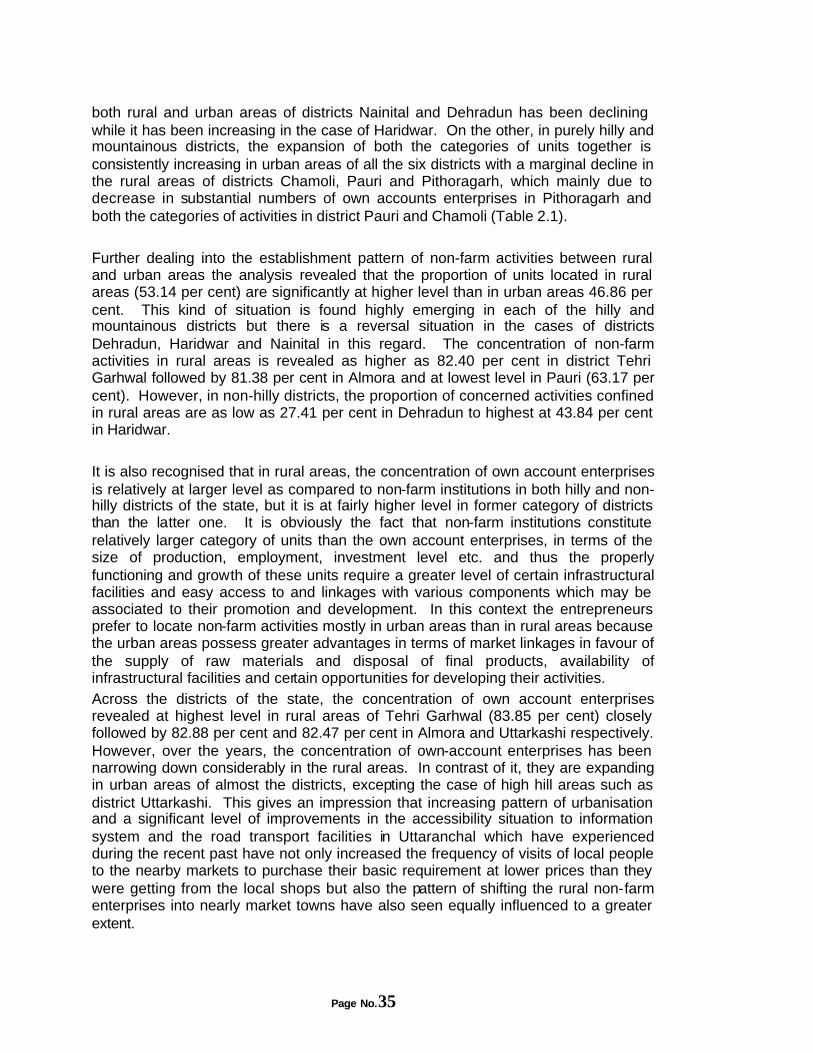
Page No.35
both rural and urban areas of districts Nainital and Dehradun has been declining while it has been increasing in the case of Haridwar. On the other, in purely hilly and mountainous districts, the expansion of both the categories of units together is consistently increasing in urban areas of all the six districts with a marginal decline in the rural areas of districts Chamoli, Pauri and Pithoragarh, which mainly due to decrease in substantial numbers of own accounts enterprises in Pithoragarh and both the categories of activities in district Pauri and Chamoli (Table 2.1).
Further dealing into the establishment pattern of non-farm activities between rural and urban areas the analysis revealed that the proportion of units located in rural areas (53.14 per cent) are significantly at higher level than in urban areas 46.86 per cent. This kind of situation is found highly emerging in each of the hilly and mountainous districts but there is a reversal situation in the cases of districts Dehradun, Haridwar and Nainital in this regard. The concentration of non-farm activities in rural areas is revealed as higher as 82.40 per cent in district Tehri Garhwal followed by 81.38 per cent in Almora and at lowest level in Pauri (63.17 per cent). However, in non-hilly districts, the proportion of concerned activities confined in rural areas are as low as 27.41 per cent in Dehradun to highest at 43.84 per cent in Haridwar. It is also recognised that in rural areas, the concentration of own account enterprises is relatively at larger level as compared to non-farm institutions in both hilly and non-hilly districts of the state, but it is at fairly higher level in former category of districts than the latter one. It is obviously the fact that non-farm institutions constitute relatively larger category of units than the own account enterprises, in terms of the size of production, employment, investment level etc. and thus the properly functioning and growth of these units require a greater level of certain infrastructural facilities and easy access to and linkages with various components which may be associated to their promotion and development. In this context the entrepreneurs prefer to locate non-farm activities mostly in urban areas than in rural areas because the urban areas possess greater advantages in terms of market linkages in favour of the supply of raw materials and disposal of final products, availability of infrastructural facilities and certain opportunities for developing their activities. Across the districts of the state, the concentration of own account enterprises revealed at highest level in rural areas of Tehri Garhwal (83.85 per cent) closely followed by 82.88 per cent and 82.47 per cent in Almora and Uttarkashi respectively. However, over the years, the concentration of own-account enterprises has been narrowing down considerably in the rural areas. In contrast of it, they are expanding in urban areas of almost the districts, excepting the case of high hill areas such as district Uttarkashi. This gives an impression that increasing pattern of urbanisation and a significant level of improvements in the accessibility situation to information system and the road transport facilities in Uttaranchal which have experienced during the recent past have not only increased the frequency of visits of local people to the nearby markets to purchase their basic requirement at lower prices than they were getting from the local shops but also the pattern of shifting the rural non-farm enterprises into nearly market towns have also seen equally influenced to a greater extent.
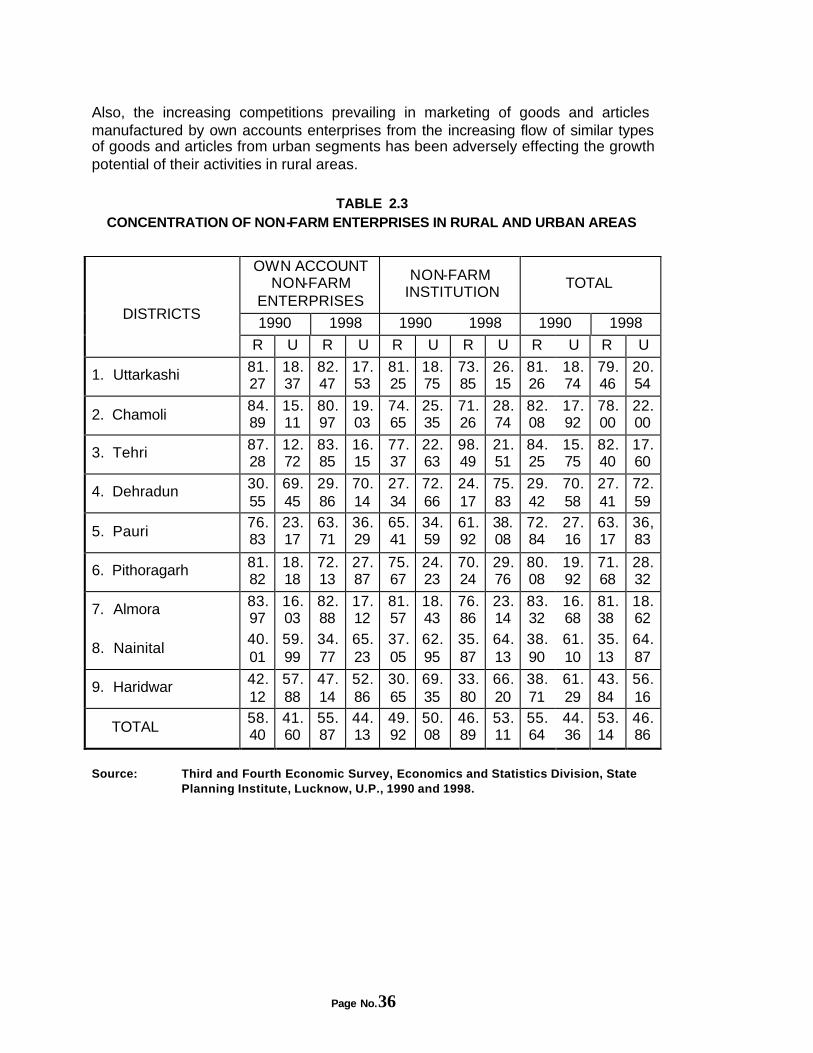
Page No.36
Also, the increasing competitions prevailing in marketing of goods and articles manufactured by own accounts enterprises from the increasing flow of similar types of goods and articles from urban segments has been adversely effecting the growth potential of their activities in rural areas.
TABLE 2.3
CONCENTRATION OF NON-FARM ENTERPRISES IN RURAL AND URBAN AREAS
OWN ACCOUNT NON-FARM
ENTERPRISES
NON-FARM INSTITUTION
TOTAL
1990 1998 1990 1998 1990 1998
DISTRICTS
R U R U R U R U R U R U
1. Uttarkashi 81.27
18.37
82.47
17.53
81.25
18.75
73.85
26.15
81.26
18.74
79.46
20.54
2. Chamoli 84.89
15.11
80.97
19.03
74.65
25.35
71.26
28.74
82.08
17.92
78.00
22.00
3. Tehri 87.28
12.72
83.85
16.15
77.37
22.63
98.49
21.51
84.25
15.75
82.40
17.60
4. Dehradun 30.55
69.45
29.86
70.14
27.34
72.66
24.17
75.83
29.42
70.58
27.41
72.59
5. Pauri 76.83
23.17
63.71
36.29
65.41
34.59
61.92
38.08
72.84
27.16
63.17
36,83
6. Pithoragarh 81.82
18.18
72.13
27.87
75.67
24.23
70.24
29.76
80.08
19.92
71.68
28.32
7. Almora 83.97
16.03
82.88
17.12
81.57
18.43
76.86
23.14
83.32
16.68
81.38
18.62
8. Nainital 40.01
59.99
34.77
65.23
37.05
62.95
35.87
64.13
38.90
61.10
35.13
64.87
9. Haridwar 42.12
57.88
47.14
52.86
30.65
69.35
33.80
66.20
38.71
61.29
43.84
56.16
TOTAL 58.40
41.60
55.87
44.13
49.92
50.08
46.89
53.11
55.64
44.36
53.14
46.86
Source: Third and Fourth Economic Survey, Economics and Statistics Division, State
Planning Institute, Lucknow, U.P., 1990 and 1998.
Page No.37
Sectoral Distribution
The classification of different non-farm activities according to various product groups, indicates that the non-farm sector in the state is dominated by the activities such as retail trading, personnel and community services and to a little extent by manufacturing, refreshment and eating establishments. Though, by and large, different product groups of non-farm activities are evenly distributed in almost the districts of the state. In the existing numbers of various non-farms activities, the activities engaged in retail trade and commerce constitute at highest proportion of 45.33 per cent as against 28 per cent personnel and community services followed by around 14 per cent manufacturing activities and a lowest proportion of 0.03 per cent activities associated to mining and quarrying sector. The domination of trading and commercial activities has been visualised at much larger level in all the districts, though these categories of activities are forming a major share in the total non-farm activities of the three most developed districts, Dehradun (52 per cent), Haridwar (49 per cent) and Nainital (48 per cent). Though, in purely hilly districts the share of trading and commercial activities in the total non-farm activities is as higher as 48.58 per cent in Pauri to lowest at 32.56 per cent in Uttarkashi. On the other hand, the expansion of activities, which are involved in providing personnel and community services, has taken place relatively at greater extent in the districts of purely hilly areas as compared to districts with plain areas. Similar, situation is found emerging in the cases of the development of manufacturing activities among these two groups of districts. As the share of manufacturing activities among the total non-farm activities is found at lowest level in Dehradun (10 per cent) and it constitute 12 per cent and 14 per cent in Nainital and Haridwar respectively. But in purely hilly districts the corresponding figure ranges lowest from 10 per cent for Pauri to highest at 20 per cent for district Almora.
Considering into account the expansion pattern and contribution of three major categories of non-farm activities, i.e. manufacturing, trading and commerce and services, separately and, examining the relationship between the share of trading and commercial activities on one hand and together of services and manufacturing activities on the other in the total numbers of existing non-farm activities across the districts of the state, it appears that the development of agriculture and industrial sector are positively influencing the expansion pattern of trading and commercial activities but their little linkages are establishing in promoting the expansion of manufacturing and service related activities. Since, in agriculturally and industrially developed districts the trading and commercial activities are forming significantly larger share than together of the manufacturing and service related activities among the various existing non-farm activities. However, in agriculturally and industrially backward hilly districts the share of latter categories of activities together is seen comparatively at larger level than the cases of former categories of activities in the total non-farm activities (Table 2.3).
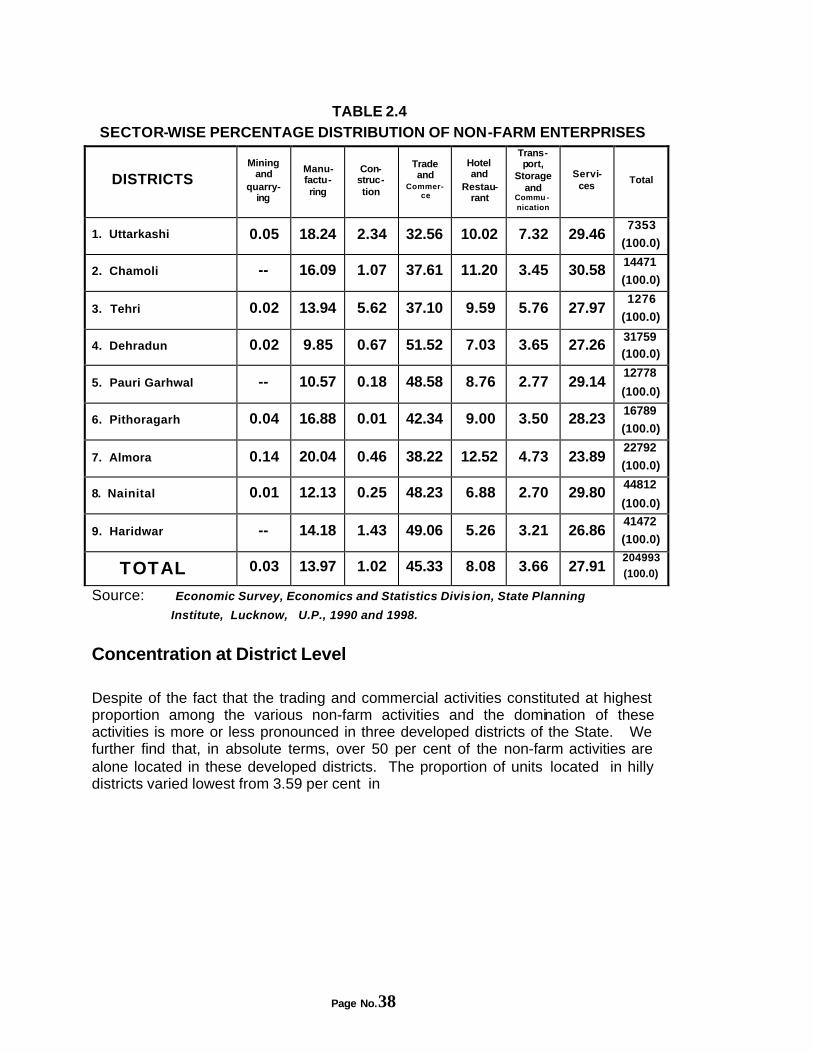
Page No.38
TABLE 2.4 SECTOR-WISE PERCENTAGE DISTRIBUTION OF NON-FARM ENTERPRISES
DISTRICTS Mining
and quarry-
ing
Manu-factu-ring
Con-struc-tion
Trade and
Commer-ce
Hotel and
Restau-rant
Trans-port,
Storage and
Commu -nication
Servi-ces
Total
1. Uttarkashi 0.05 18.24 2.34 32.56 10.02 7.32 29.46 7353
(100.0)
2. Chamoli -- 16.09 1.07 37.61 11.20 3.45 30.58 14471
(100.0)
3. Tehri 0.02 13.94 5.62 37.10 9.59 5.76 27.97 1276
(100.0)
4. Dehradun 0.02 9.85 0.67 51.52 7.03 3.65 27.26 31759 (100.0)
5. Pauri Garhwal -- 10.57 0.18 48.58 8.76 2.77 29.14 12778
(100.0)
6. Pithoragarh 0.04 16.88 0.01 42.34 9.00 3.50 28.23 16789
(100.0)
7. Almora 0.14 20.04 0.46 38.22 12.52 4.73 23.89 22792
(100.0)
8. Nainital 0.01 12.13 0.25 48.23 6.88 2.70 29.80 44812
(100.0)
9. Haridwar -- 14.18 1.43 49.06 5.26 3.21 26.86 41472
(100.0)
TOTAL 0.03 13.97 1.02 45.33 8.08 3.66 27.91 204993 (100.0)
Source: Economic Survey, Economics and Statistics Division, State Planning
Institute, Lucknow, U.P., 1990 and 1998.
Concentration at District Level Despite of the fact that the trading and commercial activities constituted at highest proportion among the various non-farm activities and the domination of these activities is more or less pronounced in three developed districts of the State. We further find that, in absolute terms, over 50 per cent of the non-farm activities are alone located in these developed districts. The proportion of units located in hilly districts varied lowest from 3.59 per cent in
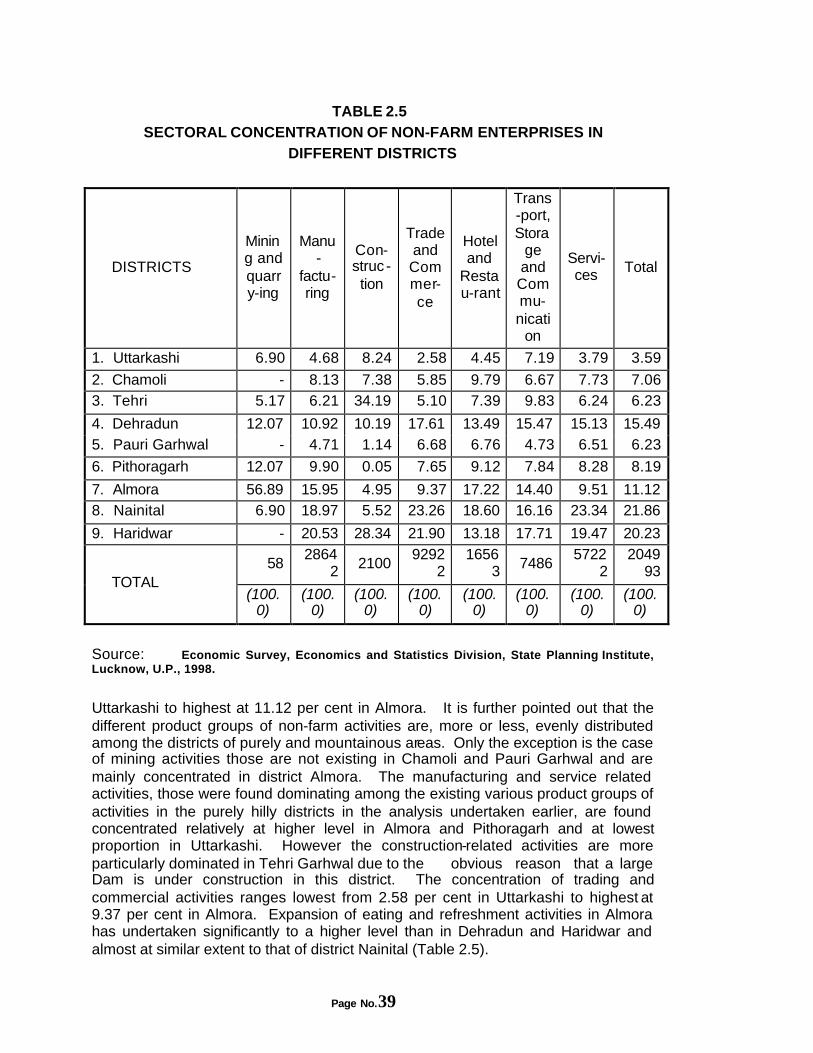
Page No.39
TABLE 2.5 SECTORAL CONCENTRATION OF NON-FARM ENTERPRISES IN
DIFFERENT DISTRICTS
DISTRICTS
Mining and quarry-ing
Manu-
factu-ring
Con-struc -tion
Trade and Commer-ce
Hotel and
Restau-rant
Trans-port, Stora
ge and Commu-nicati
on
Servi-ces Total
1. Uttarkashi 6.90 4.68 8.24 2.58 4.45 7.19 3.79 3.59
2. Chamoli - 8.13 7.38 5.85 9.79 6.67 7.73 7.06 3. Tehri 5.17 6.21 34.19 5.10 7.39 9.83 6.24 6.23
4. Dehradun 12.07 10.92 10.19 17.61 13.49 15.47 15.13 15.49 5. Pauri Garhwal - 4.71 1.14 6.68 6.76 4.73 6.51 6.23
6. Pithoragarh 12.07 9.90 0.05 7.65 9.12 7.84 8.28 8.19
7. Almora 56.89 15.95 4.95 9.37 17.22 14.40 9.51 11.12 8. Nainital 6.90 18.97 5.52 23.26 18.60 16.16 23.34 21.86
9. Haridwar - 20.53 28.34 21.90 13.18 17.71 19.47 20.23
58 2864
2 2100 9292
2 1656
3 7486 5722
2 2049
93 TOTAL
(100.0)
(100.0)
(100.0)
(100.0)
(100.0)
(100.0)
(100.0)
(100.0)
Source: Economic Survey, Economics and Statistics Division, State Planning Institute, Lucknow, U.P., 1998.
Uttarkashi to highest at 11.12 per cent in Almora. It is further pointed out that the different product groups of non-farm activities are, more or less, evenly distributed among the districts of purely and mountainous areas. Only the exception is the case of mining activities those are not existing in Chamoli and Pauri Garhwal and are mainly concentrated in district Almora. The manufacturing and service related activities, those were found dominating among the existing various product groups of activities in the purely hilly districts in the analysis undertaken earlier, are found concentrated relatively at higher level in Almora and Pithoragarh and at lowest proportion in Uttarkashi. However the construction-related activities are more particularly dominated in Tehri Garhwal due to the obvious reason that a large Dam is under construction in this district. The concentration of trading and commercial activities ranges lowest from 2.58 per cent in Uttarkashi to highest at 9.37 per cent in Almora. Expansion of eating and refreshment activities in Almora has undertaken significantly to a higher level than in Dehradun and Haridwar and almost at similar extent to that of district Nainital (Table 2.5).
Page No.40
Trends in Growth In real terms, the total numbers of non-farm activities are largely declining in the state over the years. During the periods, 1980 and 1998, the numbers of all non-farm activities has reduced from 2.11 lack to 2.05, showing an absolute decline of 3.03 per cent points. The decrease in overall numbers of non-farm activities has been reported due to the declining trend in the growth of non-farm enterprises to the tune of 9.34 per cent while the own account enterprises have shown a positive growth rate of 0.15 per cent point during the same period of reference. The own account enterprises and non-farm institution together has shown a declining trends in six out of nine districts with a highest level of decrease in Pauri (24.23 per cent) followed by Chamoli (12.88 per cent) and Dehradun (11.36 per cent). Appreciable growth of these activities is noticed in the district of Haridwar (23.12 per cent) with a marginal increase in Uttarkashi and Pithoragarh. As far as the growth of own account enterprises is concerned, a very high level of growth is again revealed in Haridwar while in remaining two developed districts these activities have been gradually moving out, though relatively at unprecedented level in Dehradun (21.78 per cent) as compared to Nainital (0.66 per cent). In hilly districts, a high rate of negative growth is estimated for Pauri (18 per cent) and Chamoli (16.78 per cent), otherwise in remaining districts these traditional kind of household enterprises have been increasing at least at some extent. Though a highest growth of this categories of units is found in Pithoragarh (10.04 per cent) followed by Uttarkashi (8.49 per cent) and it is around 2 per cent in each Almora and Tehri. This seems that in high hill areas of districts Uttarkashi and Pithoragarh where woolen activities have been traditional household activities of local people for the past several generations are still finding an appreciable opportunities in their development. As the consequences of these phenomena increase of traditional household enterprises in these two districts the overall growth rate of own-account enterprises has shown a positive growth trends in the State during the reference periods.
Further, it is observed that in spite of the positive growth rate that has witnessed of own account enterprises, the non-farm institutions have been largely washing away from most of the districts excepting the case of Dehradun and Haridwar. The highest level of negative growth of these activities is revealed in district Nainital (18.89 per cent) followed by Tehri Garhwal (15.13 per cent).
Growth Performance in Rural and Urban Areas It is striking to note that non-farm activities has been loosing its relative importance in rural areas while a very little growth of 2.52 per cent has been observed in favour of urban area of the state during last one decade. Surprisingly, the expansion of various non-farm activities in urban areas of all the districts, those are in hilly areas has been consistently increasing while they are washing away from the urban areas of two agro-industrially developed districts Nainital and Dehradun. Again, the growth of non-farm sector has been declining in most of the districts, excepting Haridwar and Uttarkashi. This indicates the fact that their does not establish any strong
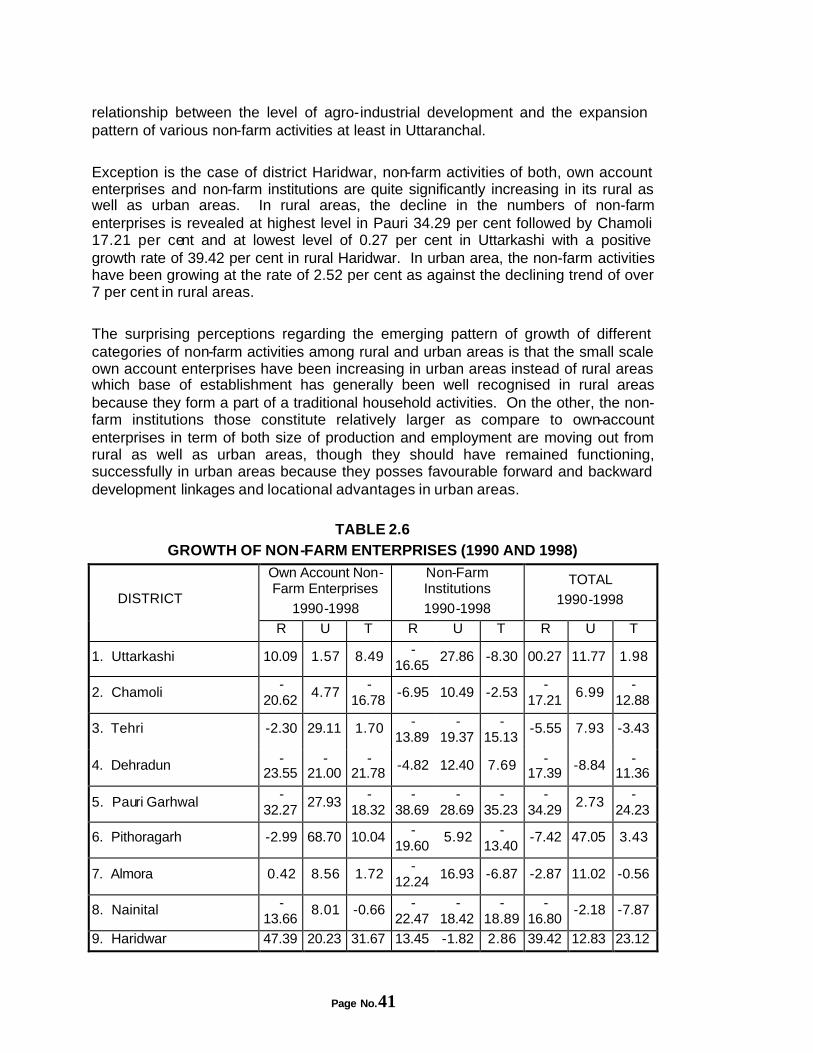
Page No.41
relationship between the level of agro-industrial development and the expansion pattern of various non-farm activities at least in Uttaranchal.
Exception is the case of district Haridwar, non-farm activities of both, own account enterprises and non-farm institutions are quite significantly increasing in its rural as well as urban areas. In rural areas, the decline in the numbers of non-farm enterprises is revealed at highest level in Pauri 34.29 per cent followed by Chamoli 17.21 per cent and at lowest level of 0.27 per cent in Uttarkashi with a positive growth rate of 39.42 per cent in rural Haridwar. In urban area, the non-farm activities have been growing at the rate of 2.52 per cent as against the declining trend of over 7 per cent in rural areas. The surprising perceptions regarding the emerging pattern of growth of different categories of non-farm activities among rural and urban areas is that the small scale own account enterprises have been increasing in urban areas instead of rural areas which base of establishment has generally been well recognised in rural areas because they form a part of a traditional household activities. On the other, the non-farm institutions those constitute relatively larger as compare to own-account enterprises in term of both size of production and employment are moving out from rural as well as urban areas, though they should have remained functioning, successfully in urban areas because they posses favourable forward and backward development linkages and locational advantages in urban areas.
TABLE 2.6
GROWTH OF NON-FARM ENTERPRISES (1990 AND 1998)
Own Account Non-Farm Enterprises
1990-1998
Non-Farm Institutions
1990-1998
TOTAL
1990-1998 DISTRICT
R U T R U T R U T
1. Uttarkashi 10.09 1.57 8.49 -16.65
27.86 -8.30 00.27 11.77 1.98
2. Chamoli -
20.62 4.77
-16.78
-6.95 10.49 -2.53 -
17.21 6.99
-12.88
3. Tehri -2.30 29.11 1.70 -13.89
-19.37
-15.13
-5.55 7.93 -3.43
4. Dehradun -23.55
-21.00
-21.78
-4.82 12.40 7.69 -17.39
-8.84 -11.36
5. Pauri Garhwal -
32.27 27.93
-18.32
-38.69
-28.69
-35.23
-34.29
2.73 -
24.23
6. Pithoragarh -2.99 68.70 10.04 -19.60
5.92 -13.40
-7.42 47.05 3.43
7. Almora 0.42 8.56 1.72 -
12.24 16.93 -6.87 -2.87 11.02 -0.56
8. Nainital -13.66
8.01 -0.66 -22.47
-18.42
-18.89
-16.80
-2.18 -7.87
9. Haridwar 47.39 20.23 31.67 13.45 -1.82 2.86 39.42 12.83 23.12
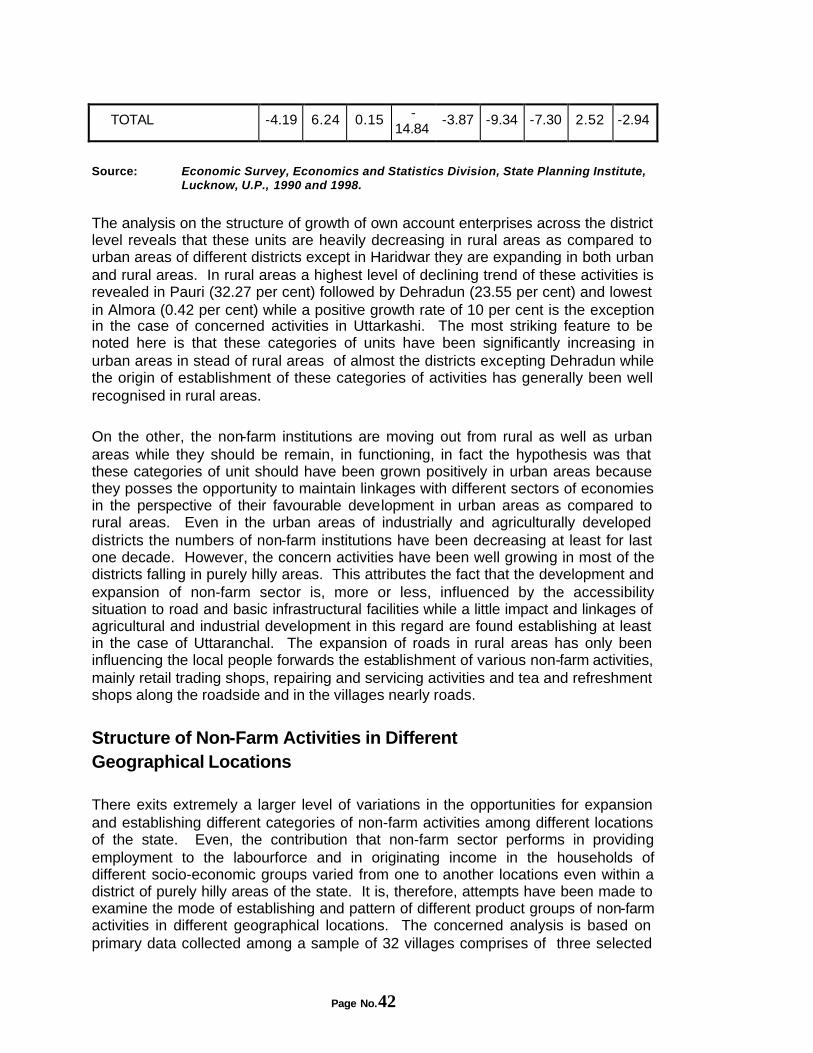
Page No.42
TOTAL -4.19 6.24 0.15 -14.84
-3.87 -9.34 -7.30 2.52 -2.94
Source: Economic Survey, Economics and Statistics Division, State Planning Institute,
Lucknow, U.P., 1990 and 1998.
The analysis on the structure of growth of own account enterprises across the district level reveals that these units are heavily decreasing in rural areas as compared to urban areas of different districts except in Haridwar they are expanding in both urban and rural areas. In rural areas a highest level of declining trend of these activities is revealed in Pauri (32.27 per cent) followed by Dehradun (23.55 per cent) and lowest in Almora (0.42 per cent) while a positive growth rate of 10 per cent is the exception in the case of concerned activities in Uttarkashi. The most striking feature to be noted here is that these categories of units have been significantly increasing in urban areas in stead of rural areas of almost the districts excepting Dehradun while the origin of establishment of these categories of activities has generally been well recognised in rural areas. On the other, the non-farm institutions are moving out from rural as well as urban areas while they should be remain, in functioning, in fact the hypothesis was that these categories of unit should have been grown positively in urban areas because they posses the opportunity to maintain linkages with different sectors of economies in the perspective of their favourable development in urban areas as compared to rural areas. Even in the urban areas of industrially and agriculturally developed districts the numbers of non-farm institutions have been decreasing at least for last one decade. However, the concern activities have been well growing in most of the districts falling in purely hilly areas. This attributes the fact that the development and expansion of non-farm sector is, more or less, influenced by the accessibility situation to road and basic infrastructural facilities while a little impact and linkages of agricultural and industrial development in this regard are found establishing at least in the case of Uttaranchal. The expansion of roads in rural areas has only been influencing the local people forwards the establishment of various non-farm activities, mainly retail trading shops, repairing and servicing activities and tea and refreshment shops along the roadside and in the villages nearly roads.
Structure of Non-Farm Activities in Different Geographical Locations
There exits extremely a larger level of variations in the opportunities for expansion and establishing different categories of non-farm activities among different locations of the state. Even, the contribution that non-farm sector performs in providing employment to the labourforce and in originating income in the households of different socio-economic groups varied from one to another locations even within a district of purely hilly areas of the state. It is, therefore, attempts have been made to examine the mode of establishing and pattern of different product groups of non-farm activities in different geographical locations. The concerned analysis is based on primary data collected among a sample of 32 villages comprises of three selected
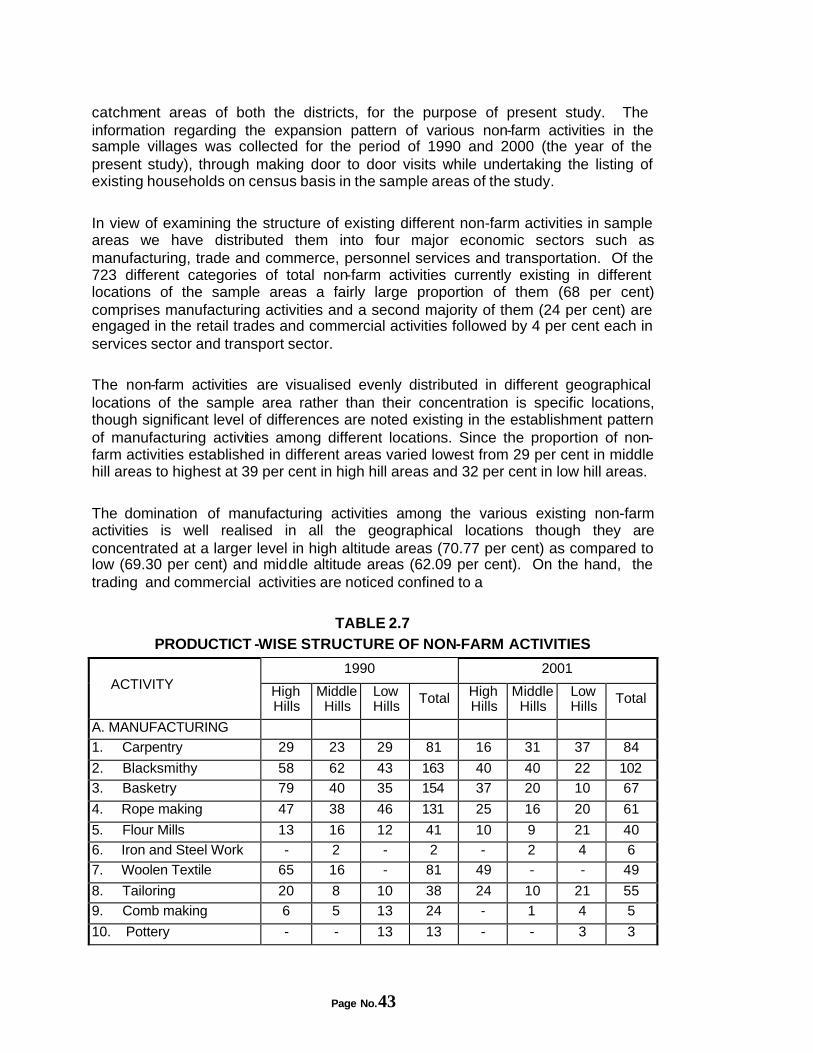
Page No.43
catchment areas of both the districts, for the purpose of present study. The information regarding the expansion pattern of various non-farm activities in the sample villages was collected for the period of 1990 and 2000 (the year of the present study), through making door to door visits while undertaking the listing of existing households on census basis in the sample areas of the study. In view of examining the structure of existing different non-farm activities in sample areas we have distributed them into four major economic sectors such as manufacturing, trade and commerce, personnel services and transportation. Of the 723 different categories of total non-farm activities currently existing in different locations of the sample areas a fairly large proportion of them (68 per cent) comprises manufacturing activities and a second majority of them (24 per cent) are engaged in the retail trades and commercial activities followed by 4 per cent each in services sector and transport sector.
The non-farm activities are visualised evenly distributed in different geographical locations of the sample area rather than their concentration is specific locations, though significant level of differences are noted existing in the establishment pattern of manufacturing activities among different locations. Since the proportion of non-farm activities established in different areas varied lowest from 29 per cent in middle hill areas to highest at 39 per cent in high hill areas and 32 per cent in low hill areas. The domination of manufacturing activities among the various existing non-farm activities is well realised in all the geographical locations though they are concentrated at a larger level in high altitude areas (70.77 per cent) as compared to low (69.30 per cent) and middle altitude areas (62.09 per cent). On the hand, the trading and commercial activities are noticed confined to a
TABLE 2.7
PRODUCTICT -WISE STRUCTURE OF NON-FARM ACTIVITIES
1990 2001 ACTIVITY High
Hills Middle
Hills Low Hills
Total High Hills
Middle Hills
Low Hills
Total
A. MANUFACTURING
1. Carpentry 29 23 29 81 16 31 37 84
2. Blacksmithy 58 62 43 163 40 40 22 102
3. Basketry 79 40 35 154 37 20 10 67
4. Rope making 47 38 46 131 25 16 20 61
5. Flour Mills 13 16 12 41 10 9 21 40
6. Iron and Steel Work - 2 - 2 - 2 4 6
7. Woolen Textile 65 16 - 81 49 - - 49
8. Tailoring 20 8 10 38 24 10 21 55
9. Comb making 6 5 13 24 - 1 4 5
10. Pottery - - 13 13 - - 3 3
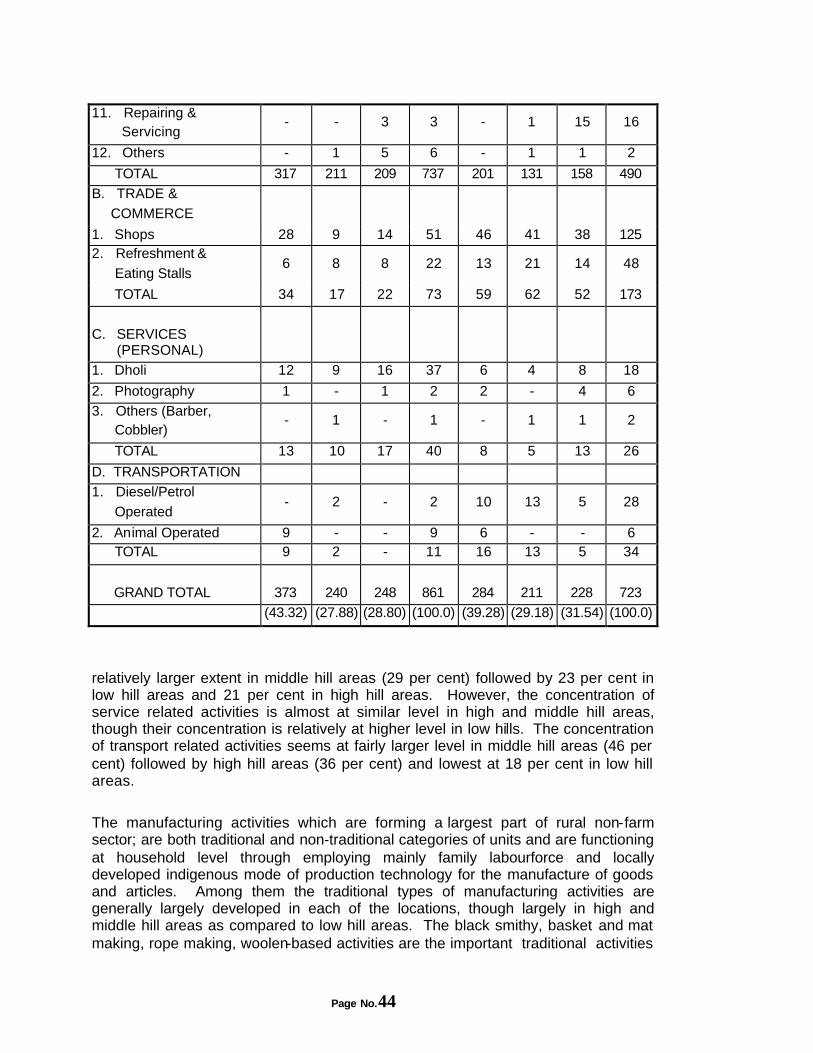
Page No.44
11. Repairing & Servicing
- - 3 3 - 1 15 16
12. Others - 1 5 6 - 1 1 2
TOTAL 317 211 209 737 201 131 158 490
B. TRADE &
COMMERCE
1. Shops 28 9 14 51 46 41 38 125 2. Refreshment &
Eating Stalls 6 8 8 22 13 21 14 48
TOTAL 34 17 22 73 59 62 52 173
C. SERVICES (PERSONAL)
1. Dholi 12 9 16 37 6 4 8 18
2. Photography 1 - 1 2 2 - 4 6
3. Others (Barber, Cobbler)
- 1 - 1 - 1 1 2
TOTAL 13 10 17 40 8 5 13 26
D. TRANSPORTATION
1. Diesel/Petrol
Operated - 2 - 2 10 13 5 28
2. Animal Operated 9 - - 9 6 - - 6 TOTAL 9 2 - 11 16 13 5 34
GRAND TOTAL
373
240
248
861
284
211
228
723
(43.32) (27.88) (28.80) (100.0) (39.28) (29.18) (31.54) (100.0)
relatively larger extent in middle hill areas (29 per cent) followed by 23 per cent in low hill areas and 21 per cent in high hill areas. However, the concentration of service related activities is almost at similar level in high and middle hill areas, though their concentration is relatively at higher level in low hills. The concentration of transport related activities seems at fairly larger level in middle hill areas (46 per cent) followed by high hill areas (36 per cent) and lowest at 18 per cent in low hill areas.
The manufacturing activities which are forming a largest part of rural non-farm sector; are both traditional and non-traditional categories of units and are functioning at household level through employing mainly family labourforce and locally developed indigenous mode of production technology for the manufacture of goods and articles. Among them the traditional types of manufacturing activities are generally largely developed in each of the locations, though largely in high and middle hill areas as compared to low hill areas. The black smithy, basket and mat making, rope making, woolen-based activities are the important traditional activities
Page No.45
of a majority of the households, particularly of scheduled castes households. In rural areas the scheduled castes households have been engaged in the production of various goods and articles as required by the households of upper castes for performing agricultural activities, collection of forest products and certain other purposes for the past several generations. This kind of production linkages and the nature of performing work by scheduled castes for upper caste is locally known as Zajmani system of work relationship. However, the Zajmani system of work relationship has been gradually reducing in most part of the hill areas, particularly in low hill areas. Since, the proportion of traditional manufacturing activities located in low hill areas are only 36 per cent as against 75 per cent in high hill areas and 59 per cent in middle hill areas. In stead the expansion of non-traditional, modern manufacturing activities have been greatly visualised in low hill areas as compared to remaining geographical locations. The carpentry, black smithy, basketry, rope making and tailoring are the dominant manufacturing activities, in terms of its numbers and from the point of providing employment to the family members of the rural households. These all units together constitute over 75 per cent of the total manufacturing activities existing in the sample areas. Also, most of these units, excepting tailoring, are basically using locally available row materials in their production process. However, the carpentry, basketry, rope making, woolen-based activities, comb making and pottery have been the prominent rural household manufacturing activities in the sample areas for last several centuries though these units have reduced in numbers over the years. Over and above it appears that the different categories of manufacturing activities are well spread over in all the geographical locations. The structure, however, differs somewhat with altitude. While some product groups of units, mainly identified dominant activities are evenly functioning in all areas, these are certain product groups of units such as comb making, pottery, Iron work etc. which are confined to certain locations. Similarly, the trading and commercial activities, eating and refreshment units, construction and transportation related activities are also evenly established in almost the areas of the state but are largely concentrated in low hill areas.
Changes in the Concentration and Structure Further, the study attempted to examine that at what extent the changes have been occurring in the concentration of different product groups of manufacturing and other non-farm activities among different locations over the years. It reveals that during the period 1990 and 2000, the pattern of expansion of most of the product groups of manufacturing activities has been declined while it has successfully increased for trading, and transport related activities. Among the various non-farm activities a major increase in the structure of establishment has further been experienced in favour of trading and commercial activities in the state, particularly in middle and low hill areas. Since the per cent share of trading and commercial activities in the total numbers of non-farm activities in middle hills areas has increased from 7.08 per cent in 1990 to 29.38 per cent in 2000 and in low hill areas it increased from 9 per cent to 23 per cent during the same period. The proportion of service related activities has gone down from 4.65 per cent to 3.60 per cent while the share of transport activities
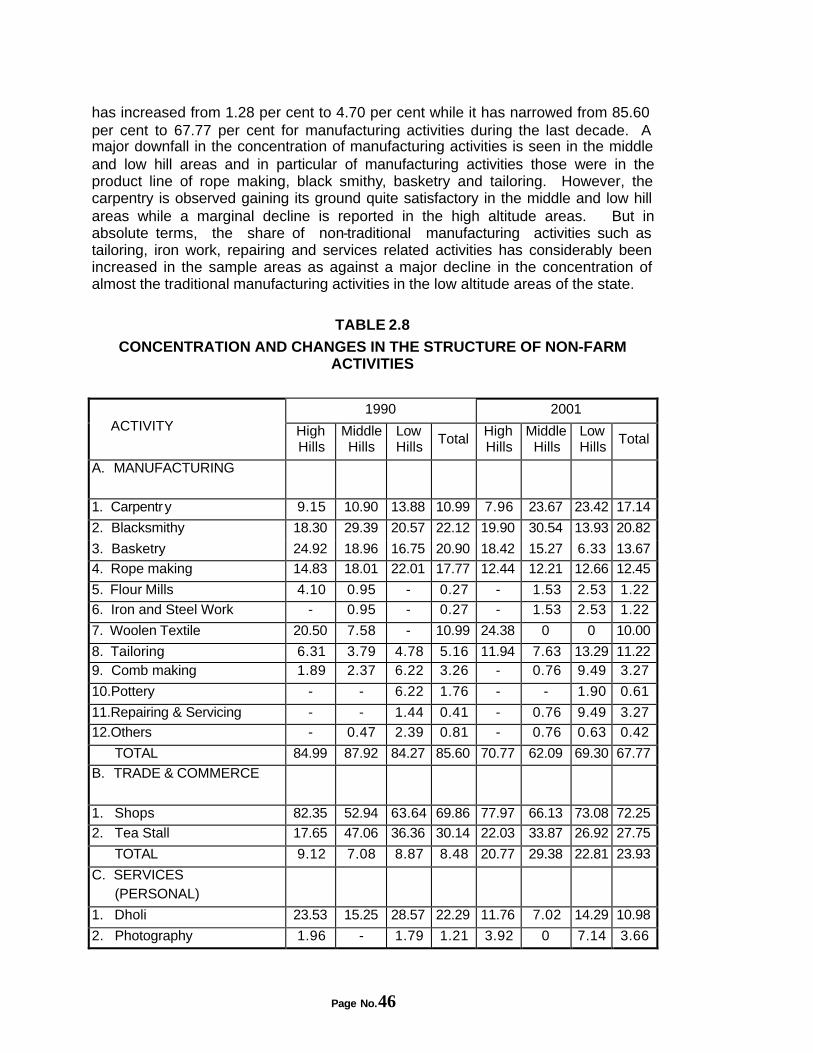
Page No.46
has increased from 1.28 per cent to 4.70 per cent while it has narrowed from 85.60 per cent to 67.77 per cent for manufacturing activities during the last decade. A major downfall in the concentration of manufacturing activities is seen in the middle and low hill areas and in particular of manufacturing activities those were in the product line of rope making, black smithy, basketry and tailoring. However, the carpentry is observed gaining its ground quite satisfactory in the middle and low hill areas while a marginal decline is reported in the high altitude areas. But in absolute terms, the share of non-traditional manufacturing activities such as tailoring, iron work, repairing and services related activities has considerably been increased in the sample areas as against a major decline in the concentration of almost the traditional manufacturing activities in the low altitude areas of the state.
TABLE 2.8
CONCENTRATION AND CHANGES IN THE STRUCTURE OF NON-FARM ACTIVITIES
1990 2001 ACTIVITY High
Hills Middle Hills
Low Hills
Total High Hills
Middle Hills
Low Hills
Total
A. MANUFACTURING
1. Carpentry 9.15 10.90 13.88 10.99 7.96 23.67 23.42 17.14
2. Blacksmithy 18.30 29.39 20.57 22.12 19.90 30.54 13.93 20.82
3. Basketry 24.92 18.96 16.75 20.90 18.42 15.27 6.33 13.67
4. Rope making 14.83 18.01 22.01 17.77 12.44 12.21 12.66 12.45
5. Flour Mills 4.10 0.95 - 0.27 - 1.53 2.53 1.22
6. Iron and Steel Work - 0.95 - 0.27 - 1.53 2.53 1.22
7. Woolen Textile 20.50 7.58 - 10.99 24.38 0 0 10.00
8. Tailoring 6.31 3.79 4.78 5.16 11.94 7.63 13.29 11.22 9. Comb making 1.89 2.37 6.22 3.26 - 0.76 9.49 3.27
10.Pottery - - 6.22 1.76 - - 1.90 0.61
11.Repairing & Servicing - - 1.44 0.41 - 0.76 9.49 3.27
12.Others - 0.47 2.39 0.81 - 0.76 0.63 0.42
TOTAL 84.99 87.92 84.27 85.60 70.77 62.09 69.30 67.77
B. TRADE & COMMERCE
1. Shops 82.35 52.94 63.64 69.86 77.97 66.13 73.08 72.25
2. Tea Stall 17.65 47.06 36.36 30.14 22.03 33.87 26.92 27.75
TOTAL 9.12 7.08 8.87 8.48 20.77 29.38 22.81 23.93
C. SERVICES (PERSONAL)
1. Dholi 23.53 15.25 28.57 22.29 11.76 7.02 14.29 10.98
2. Photography 1.96 - 1.79 1.21 3.92 0 7.14 3.66
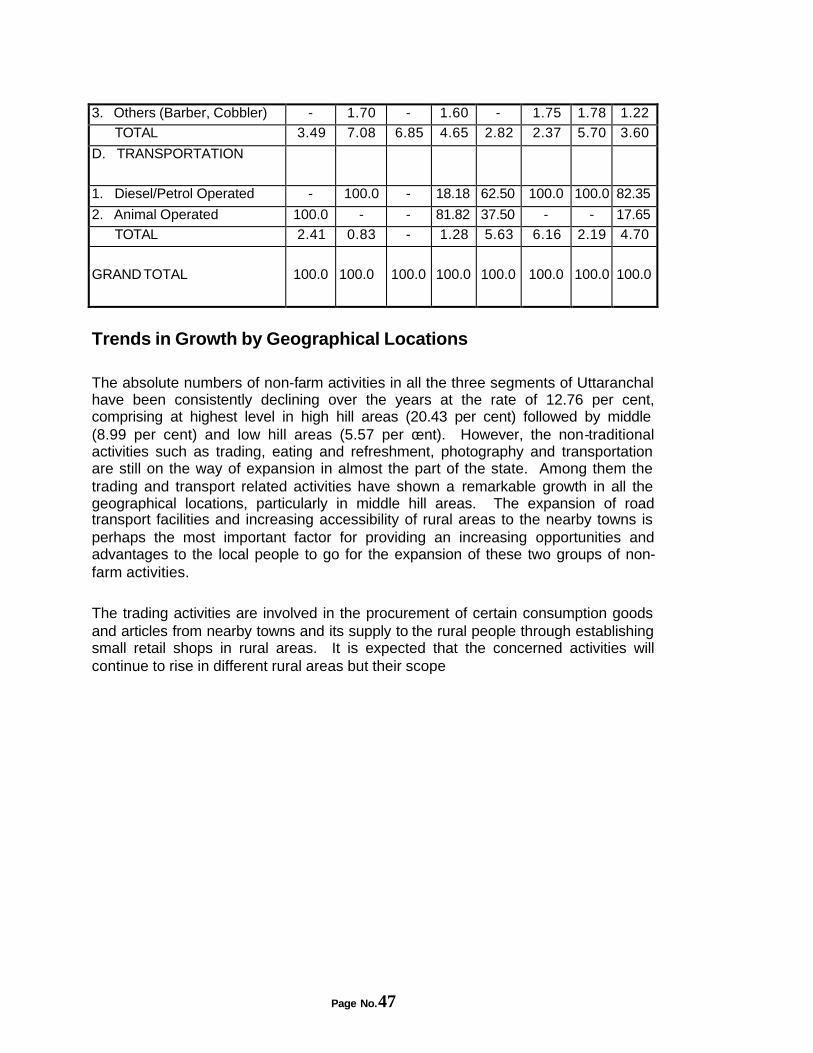
Page No.47
3. Others (Barber, Cobbler) - 1.70 - 1.60 - 1.75 1.78 1.22
TOTAL 3.49 7.08 6.85 4.65 2.82 2.37 5.70 3.60
D. TRANSPORTATION
1. Diesel/Petrol Operated - 100.0 - 18.18 62.50 100.0 100.0 82.35
2. Animal Operated 100.0 - - 81.82 37.50 - - 17.65
TOTAL 2.41 0.83 - 1.28 5.63 6.16 2.19 4.70
GRAND TOTAL
100.0 100.0 100.0 100.0 100.0 100.0 100.0 100.0
Trends in Growth by Geographical Locations The absolute numbers of non-farm activities in all the three segments of Uttaranchal have been consistently declining over the years at the rate of 12.76 per cent, comprising at highest level in high hill areas (20.43 per cent) followed by middle (8.99 per cent) and low hill areas (5.57 per cent). However, the non-traditional activities such as trading, eating and refreshment, photography and transportation are still on the way of expansion in almost the part of the state. Among them the trading and transport related activities have shown a remarkable growth in all the geographical locations, particularly in middle hill areas. The expansion of road transport facilities and increasing accessibility of rural areas to the nearby towns is perhaps the most important factor for providing an increasing opportunities and advantages to the local people to go for the expansion of these two groups of non-farm activities. The trading activities are involved in the procurement of certain consumption goods and articles from nearby towns and its supply to the rural people through establishing small retail shops in rural areas. It is expected that the concerned activities will continue to rise in different rural areas but their scope
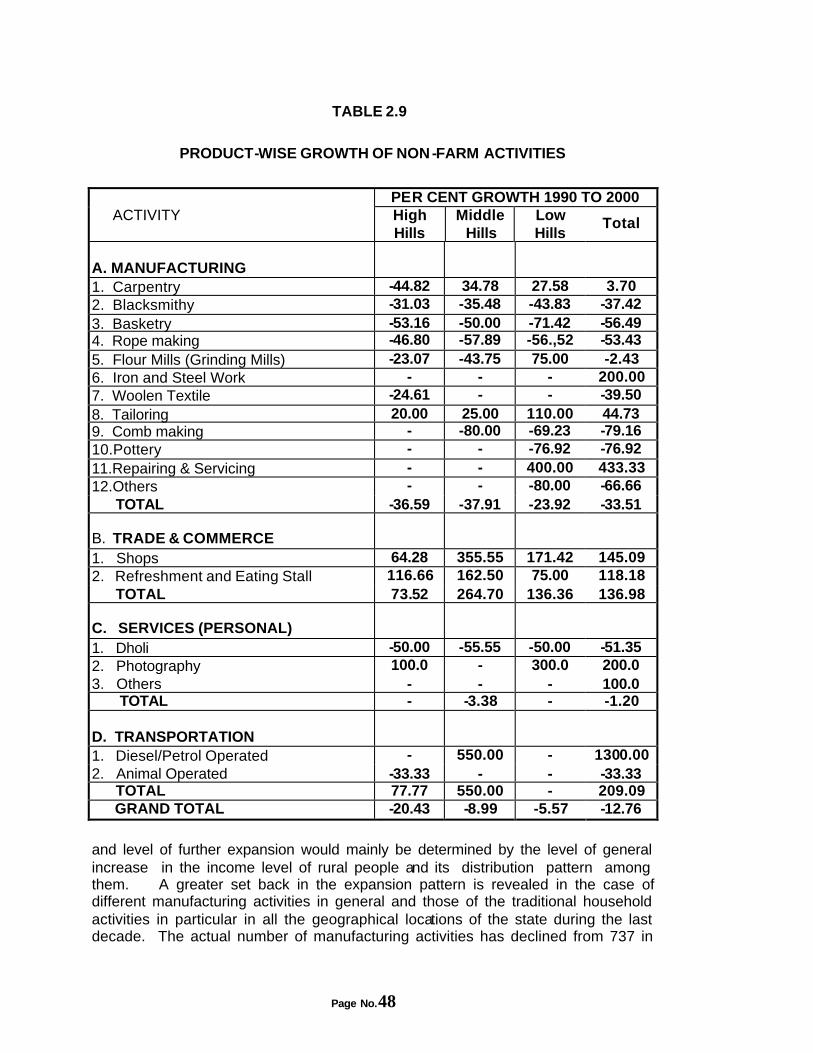
Page No.48
TABLE 2.9
PRODUCT-WISE GROWTH OF NON-FARM ACTIVITIES
PER CENT GROWTH 1990 TO 2000 ACTIVITY High
Hills Middle
Hills Low Hills
Total
A. MANUFACTURING
1. Carpentry -44.82 34.78 27.58 3.70 2. Blacksmithy -31.03 -35.48 -43.83 -37.42 3. Basketry -53.16 -50.00 -71.42 -56.49 4. Rope making -46.80 -57.89 -56.,52 -53.43 5. Flour Mills (Grinding Mills) -23.07 -43.75 75.00 -2.43 6. Iron and Steel Work - - - 200.00 7. Woolen Textile -24.61 - - -39.50 8. Tailoring 20.00 25.00 110.00 44.73 9. Comb making - -80.00 -69.23 -79.16 10.Pottery - - -76.92 -76.92 11.Repairing & Servicing - - 400.00 433.33 12.Others - - -80.00 -66.66 TOTAL -36.59 -37.91 -23.92 -33.51 B. TRADE & COMMERCE
1. Shops 64.28 355.55 171.42 145.09 2. Refreshment and Eating Stall 116.66 162.50 75.00 118.18 TOTAL 73.52 264.70 136.36 136.98 C. SERVICES (PERSONAL)
1. Dholi -50.00 -55.55 -50.00 -51.35 2. Photography 100.0 - 300.0 200.0 3. Others - - - 100.0 TOTAL - -3.38 - -1.20 D. TRANSPORTATION
1. Diesel/Petrol Operated - 550.00 - 1300.00 2. Animal Operated -33.33 - - -33.33 TOTAL 77.77 550.00 - 209.09 GRAND TOTAL -20.43 -8.99 -5.57 -12.76
and level of further expansion would mainly be determined by the level of general increase in the income level of rural people and its distribution pattern among them. A greater set back in the expansion pattern is revealed in the case of different manufacturing activities in general and those of the traditional household activities in particular in all the geographical locations of the state during the last decade. The actual number of manufacturing activities has declined from 737 in
Page No.49
1990 to 490 in 2000, showing an overall negative growth of 33.51 per cent. It is noted that non-traditional modern industrial activities which production system is not based on the locally available raw materials are expanding to a certain extent in different locations, though at larger level in low hill areas. But, the major industrial activities, those were mainly traditional and were basically using the locally available row materials are largely declining in almost the geographical locations but at a surprising rate in low and middle altitude areas.
The carpentry, black smithy, basketary, woolen and rope making activities, those together accounting for over three fourth strength among the total existing non-farm activities have been greatly getting close down in high and middle hill areas. Inadequacy in the supply of basic raw materials from the nearby forests and the lacking interest of new generations to engage in these low earning traditional manufacturing activities are postulated to be the most important factors behind increasingly decreasing trends of the major industrial activities in the rural areas of different geographical locations. Besides, the commodities, which are manufactured through indigenous mode of production technologies and using family unskilled labourforce by the households of basketry, carpentry and woolen activities are facing larger competitions with the similar goods and articles of better quality arriving in the nearby markets from many other villages.
Trends in the Expansion of Non-farm Activities
Further, we have attempted to examine the trends in the growth of establishment, type of entrepreneurship and several issues related to the elements which have influenced the expansion pattern of different categories of non-farm enterprises during the past in the sample areas. The analysis revealed that around one-third of the non-farm activities, largely those confined in manufacturing and service sectors, were established before 1980 and are mainly traditional household level activities. Another second majority of (23 per cent) them were established during 1980-85. But the trend, of establishing rural non-farm activities declined to 11.34 per cent during next five years period, though it picked up further during the period 1990 to 1995 and again after 1995. It has further been pointed out that a majority of manufacturing (45 per cent) and service related professional services (50 per cent) activities were established before 1980 and are still expanding but the trend of expanding of manufacturing activities has been consistently declined untill 1995 with a marginal increase after 1995. While the establishment of service related professional activities has picked up considerably after 1995. However, the existing trading and transport related activities are mainly established after 1980 and the trends of expansion of both the categories of activities has been consistently increasing over the years. In fact, of the total existing activities, a majority of both transport (62 per cent) and trading (34 per cent) activities were recently established in the sample areas. It indicates
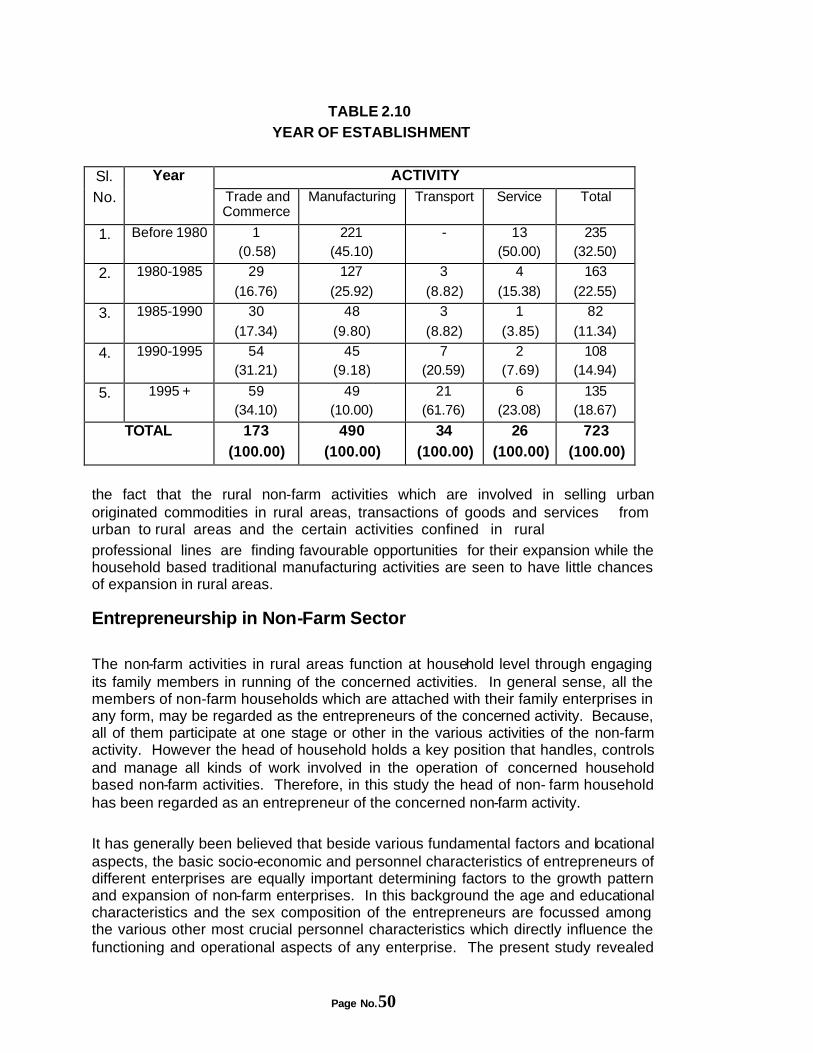
Page No.50
TABLE 2.10 YEAR OF ESTABLISHMENT
Year ACTIVITY Sl. No. Trade and
Commerce Manufacturing Transport Service Total
1. Before 1980 1 (0.58)
221 (45.10)
- 13 (50.00)
235 (32.50)
2. 1980-1985 29
(16.76)
127
(25.92)
3
(8.82)
4
(15.38)
163
(22.55)
3. 1985-1990 30
(17.34)
48
(9.80)
3
(8.82)
1
(3.85)
82
(11.34)
4. 1990-1995 54 (31.21)
45 (9.18)
7 (20.59)
2 (7.69)
108 (14.94)
5. 1995 + 59 (34.10)
49 (10.00)
21 (61.76)
6 (23.08)
135 (18.67)
TOTAL 173 (100.00)
490 (100.00)
34 (100.00)
26 (100.00)
723 (100.00)
the fact that the rural non-farm activities which are involved in selling urban originated commodities in rural areas, transactions of goods and services from urban to rural areas and the certain activities confined in rural professional lines are finding favourable opportunities for their expansion while the household based traditional manufacturing activities are seen to have little chances of expansion in rural areas.
Entrepreneurship in Non-Farm Sector The non-farm activities in rural areas function at household level through engaging its family members in running of the concerned activities. In general sense, all the members of non-farm households which are attached with their family enterprises in any form, may be regarded as the entrepreneurs of the concerned activity. Because, all of them participate at one stage or other in the various activities of the non-farm activity. However the head of household holds a key position that handles, controls and manage all kinds of work involved in the operation of concerned household based non-farm activities. Therefore, in this study the head of non- farm household has been regarded as an entrepreneur of the concerned non-farm activity. It has generally been believed that beside various fundamental factors and locational aspects, the basic socio-economic and personnel characteristics of entrepreneurs of different enterprises are equally important determining factors to the growth pattern and expansion of non-farm enterprises. In this background the age and educational characteristics and the sex composition of the entrepreneurs are focussed among the various other most crucial personnel characteristics which directly influence the functioning and operational aspects of any enterprise. The present study revealed
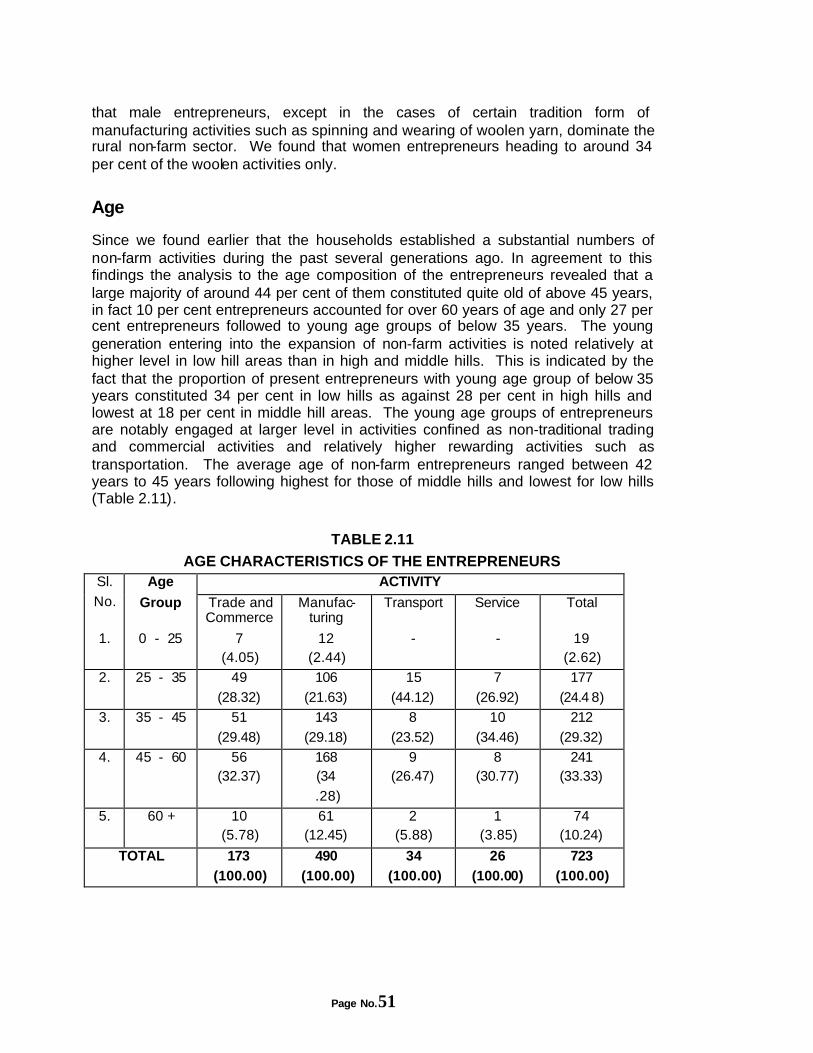
Page No.51
that male entrepreneurs, except in the cases of certain tradition form of manufacturing activities such as spinning and wearing of woolen yarn, dominate the rural non-farm sector. We found that women entrepreneurs heading to around 34 per cent of the woolen activities only.
Age
Since we found earlier that the households established a substantial numbers of non-farm activities during the past several generations ago. In agreement to this findings the analysis to the age composition of the entrepreneurs revealed that a large majority of around 44 per cent of them constituted quite old of above 45 years, in fact 10 per cent entrepreneurs accounted for over 60 years of age and only 27 per cent entrepreneurs followed to young age groups of below 35 years. The young generation entering into the expansion of non-farm activities is noted relatively at higher level in low hill areas than in high and middle hills. This is indicated by the fact that the proportion of present entrepreneurs with young age group of below 35 years constituted 34 per cent in low hills as against 28 per cent in high hills and lowest at 18 per cent in middle hill areas. The young age groups of entrepreneurs are notably engaged at larger level in activities confined as non-traditional trading and commercial activities and relatively higher rewarding activities such as transportation. The average age of non-farm entrepreneurs ranged between 42 years to 45 years following highest for those of middle hills and lowest for low hills (Table 2.11).
TABLE 2.11
AGE CHARACTERISTICS OF THE ENTREPRENEURS Age ACTIVITY Sl.
No. Group Trade and Commerce
Manufac-turing
Transport Service Total
1. 0 - 25 7 (4.05)
12 (2.44)
- - 19 (2.62)
2. 25 - 35 49
(28.32)
106
(21.63)
15
(44.12)
7
(26.92)
177
(24.4 8)
3. 35 - 45 51
(29.48)
143
(29.18)
8
(23.52)
10
(34.46)
212
(29.32)
4. 45 - 60 56 (32.37)
168 (34
.28)
9 (26.47)
8 (30.77)
241 (33.33)
5. 60 + 10 (5.78)
61 (12.45)
2 (5.88)
1 (3.85)
74 (10.24)
TOTAL 173 (100.00)
490 (100.00)
34 (100.00)
26 (100.00)
723 (100.00)
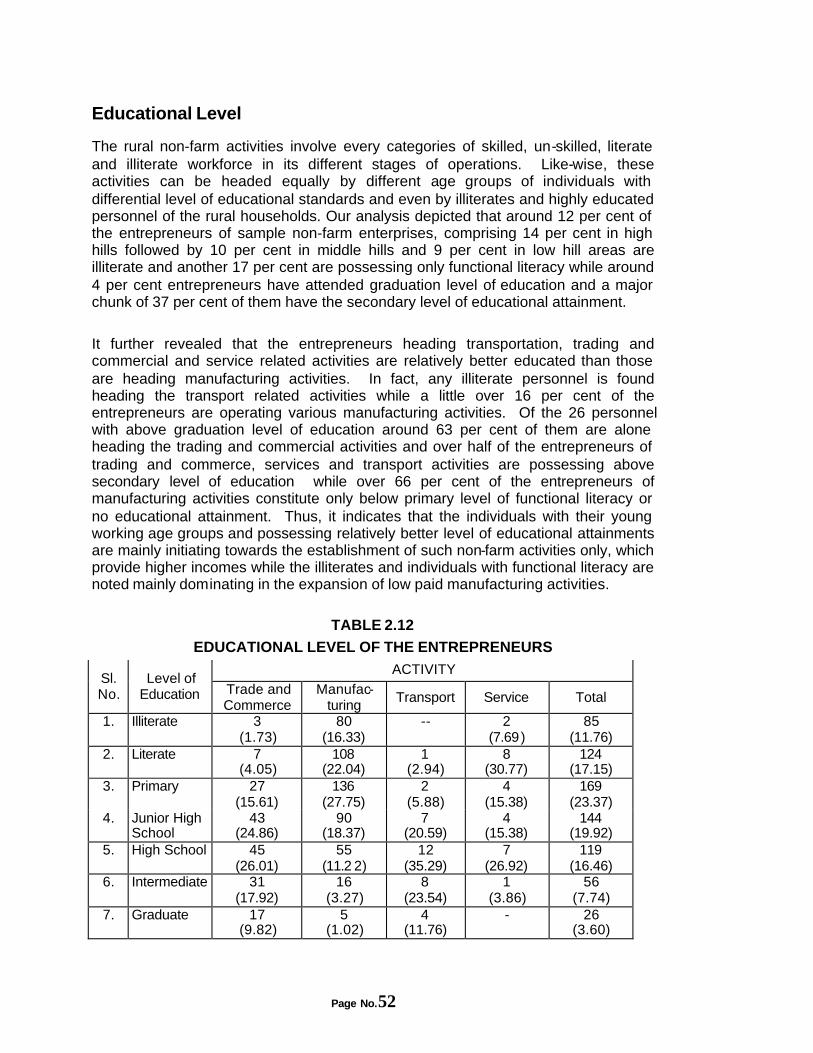
Page No.52
Educational Level
The rural non-farm activities involve every categories of skilled, un-skilled, literate and illiterate workforce in its different stages of operations. Like-wise, these activities can be headed equally by different age groups of individuals with differential level of educational standards and even by illiterates and highly educated personnel of the rural households. Our analysis depicted that around 12 per cent of the entrepreneurs of sample non-farm enterprises, comprising 14 per cent in high hills followed by 10 per cent in middle hills and 9 per cent in low hill areas are illiterate and another 17 per cent are possessing only functional literacy while around 4 per cent entrepreneurs have attended graduation level of education and a major chunk of 37 per cent of them have the secondary level of educational attainment. It further revealed that the entrepreneurs heading transportation, trading and commercial and service related activities are relatively better educated than those are heading manufacturing activities. In fact, any illiterate personnel is found heading the transport related activities while a little over 16 per cent of the entrepreneurs are operating various manufacturing activities. Of the 26 personnel with above graduation level of education around 63 per cent of them are alone heading the trading and commercial activities and over half of the entrepreneurs of trading and commerce, services and transport activities are possessing above secondary level of education while over 66 per cent of the entrepreneurs of manufacturing activities constitute only below primary level of functional literacy or no educational attainment. Thus, it indicates that the individuals with their young working age groups and possessing relatively better level of educational attainments are mainly initiating towards the establishment of such non-farm activities only, which provide higher incomes while the illiterates and individuals with functional literacy are noted mainly dominating in the expansion of low paid manufacturing activities.
TABLE 2.12
EDUCATIONAL LEVEL OF THE ENTREPRENEURS
ACTIVITY Sl. No.
Level of Education Trade and
Commerce Manufac-
turing Transport Service Total
1. Illiterate 3 (1.73)
80 (16.33)
-- 2 (7.69)
85 (11.76)
2. Literate 7 (4.05)
108 (22.04)
1 (2.94)
8 (30.77)
124 (17.15)
3. Primary 27 (15.61)
136 (27.75)
2 (5.88)
4 (15.38)
169 (23.37)
4. Junior High School
43 (24.86)
90 (18.37)
7 (20.59)
4 (15.38)
144 (19.92)
5. High School 45 (26.01)
55 (11.2 2)
12 (35.29)
7 (26.92)
119 (16.46)
6. Intermediate 31 (17.92)
16 (3.27)
8 (23.54)
1 (3.86)
56 (7.74)
7. Graduate 17 (9.82)
5 (1.02)
4 (11.76)
- 26 (3.60)
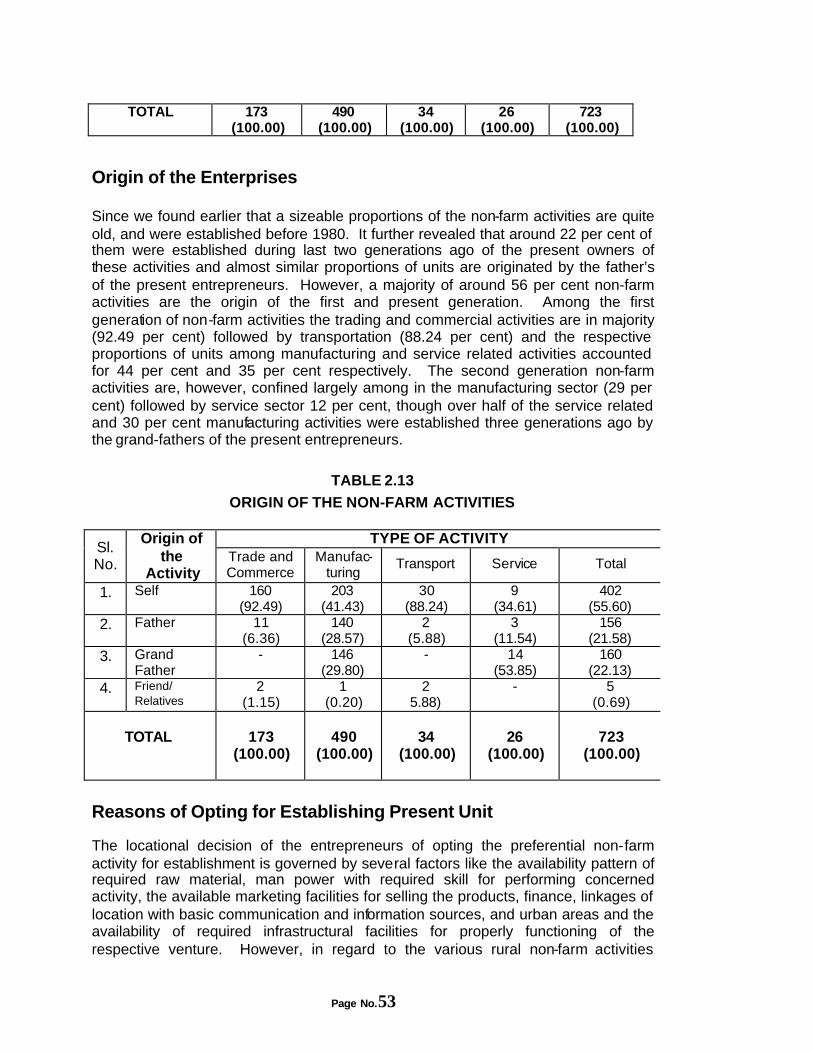
Page No.53
TOTAL 173 (100.00)
490 (100.00)
34 (100.00)
26 (100.00)
723 (100.00)
Origin of the Enterprises
Since we found earlier that a sizeable proportions of the non-farm activities are quite old, and were established before 1980. It further revealed that around 22 per cent of them were established during last two generations ago of the present owners of these activities and almost similar proportions of units are originated by the father’s of the present entrepreneurs. However, a majority of around 56 per cent non-farm activities are the origin of the first and present generation. Among the first generation of non-farm activities the trading and commercial activities are in majority (92.49 per cent) followed by transportation (88.24 per cent) and the respective proportions of units among manufacturing and service related activities accounted for 44 per cent and 35 per cent respectively. The second generation non-farm activities are, however, confined largely among in the manufacturing sector (29 per cent) followed by service sector 12 per cent, though over half of the service related and 30 per cent manufacturing activities were established three generations ago by the grand-fathers of the present entrepreneurs.
TABLE 2.13
ORIGIN OF THE NON-FARM ACTIVITIES
TYPE OF ACTIVITY Sl. No.
Origin of the
Activity Trade and Commerce
Manufac-turing
Transport Service Total
1. Self 160 (92.49)
203 (41.43)
30 (88.24)
9 (34.61)
402 (55.60)
2. Father 11 (6.36)
140 (28.57)
2 (5.88)
3 (11.54)
156 (21.58)
3. Grand Father
- 146 (29.80)
- 14 (53.85)
160 (22.13)
4. Friend/ Relatives
2 (1.15)
1 (0.20)
2 5.88)
- 5 (0.69)
TOTAL
173
(100.00)
490
(100.00)
34
(100.00)
26
(100.00)
723
(100.00)
Reasons of Opting for Establishing Present Unit
The locational decision of the entrepreneurs of opting the preferential non-farm activity for establishment is governed by several factors like the availability pattern of required raw material, man power with required skill for performing concerned activity, the available marketing facilities for selling the products, finance, linkages of location with basic communication and information sources, and urban areas and the availability of required infrastructural facilities for properly functioning of the respective venture. However, in regard to the various rural non-farm activities
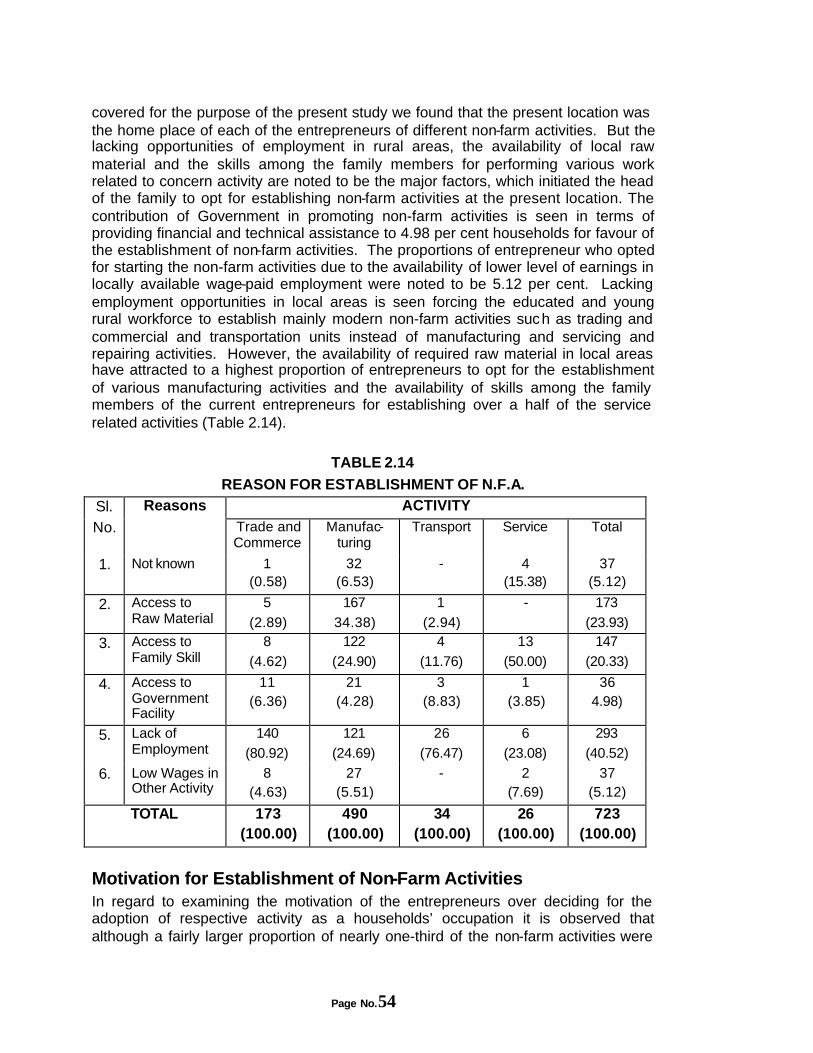
Page No.54
covered for the purpose of the present study we found that the present location was the home place of each of the entrepreneurs of different non-farm activities. But the lacking opportunities of employment in rural areas, the availability of local raw material and the skills among the family members for performing various work related to concern activity are noted to be the major factors, which initiated the head of the family to opt for establishing non-farm activities at the present location. The contribution of Government in promoting non-farm activities is seen in terms of providing financial and technical assistance to 4.98 per cent households for favour of the establishment of non-farm activities. The proportions of entrepreneur who opted for starting the non-farm activities due to the availability of lower level of earnings in locally available wage-paid employment were noted to be 5.12 per cent. Lacking employment opportunities in local areas is seen forcing the educated and young rural workforce to establish mainly modern non-farm activities such as trading and commercial and transportation units instead of manufacturing and servicing and repairing activities. However, the availability of required raw material in local areas have attracted to a highest proportion of entrepreneurs to opt for the establishment of various manufacturing activities and the availability of skills among the family members of the current entrepreneurs for establishing over a half of the service related activities (Table 2.14).
TABLE 2.14
REASON FOR ESTABLISHMENT OF N.F.A. Reasons ACTIVITY Sl.
No. Trade and Commerce
Manufac-turing
Transport Service Total
1. Not known 1 (0.58)
32 (6.53)
- 4 (15.38)
37 (5.12)
2. Access to Raw Material
5
(2.89)
167
34.38)
1
(2.94)
- 173
(23.93)
3. Access to Family Skill
8
(4.62)
122
(24.90)
4
(11.76)
13
(50.00)
147
(20.33)
4. Access to Government Facility
11 (6.36)
21 (4.28)
3 (8.83)
1 (3.85)
36 4.98)
5. Lack of Employment
140
(80.92)
121
(24.69)
26
(76.47)
6
(23.08)
293
(40.52)
6. Low Wages in Other Activity
8 (4.63)
27 (5.51)
- 2 (7.69)
37 (5.12)
TOTAL 173 (100.00)
490 (100.00)
34 (100.00)
26 (100.00)
723 (100.00)
Motivation for Establishment of Non-Farm Activities In regard to examining the motivation of the entrepreneurs over deciding for the adoption of respective activity as a households’ occupation it is observed that although a fairly larger proportion of nearly one-third of the non-farm activities were
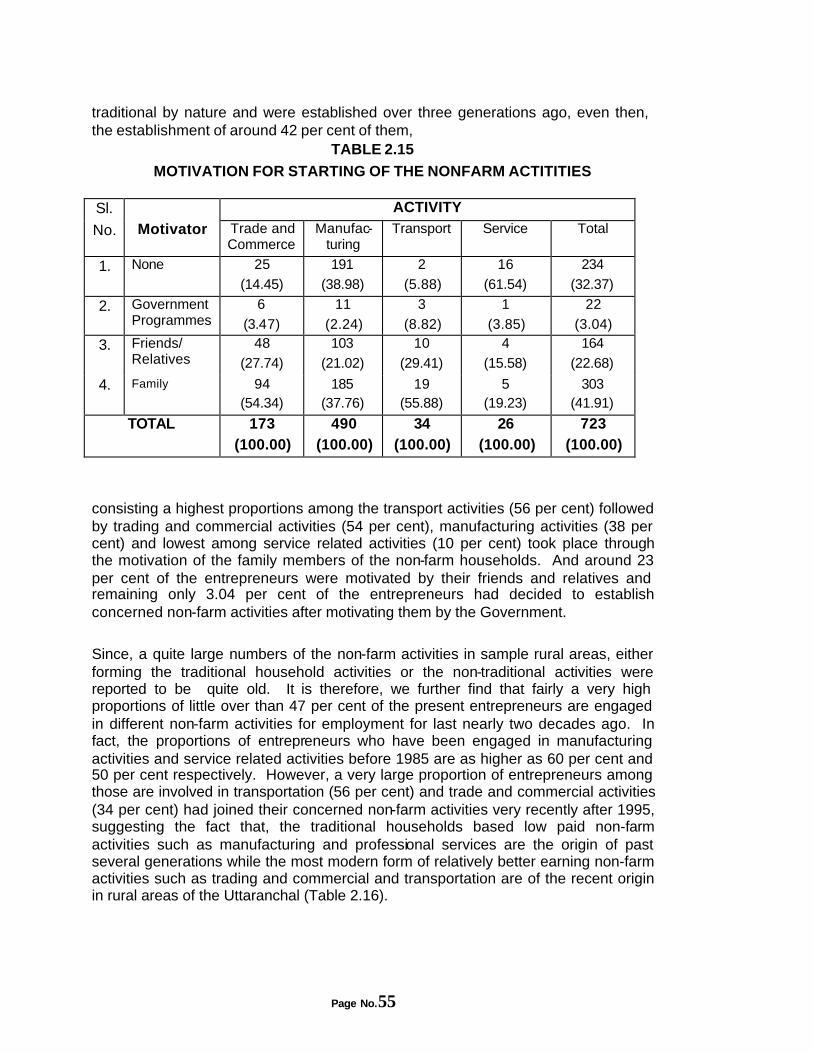
Page No.55
traditional by nature and were established over three generations ago, even then, the establishment of around 42 per cent of them,
TABLE 2.15
MOTIVATION FOR STARTING OF THE NONFARM ACTITITIES
ACTIVITY Sl.
No.
Motivator Trade and Commerce
Manufac-turing
Transport Service Total
1. None 25
(14.45)
191
(38.98)
2
(5.88)
16
(61.54)
234
(32.37)
2. Government Programmes
6
(3.47)
11
(2.24)
3
(8.82)
1
(3.85)
22
(3.04)
3. Friends/ Relatives
48
(27.74)
103
(21.02)
10
(29.41)
4
(15.58)
164
(22.68)
4. Family 94 (54.34)
185 (37.76)
19 (55.88)
5 (19.23)
303 (41.91)
TOTAL 173 (100.00)
490 (100.00)
34 (100.00)
26 (100.00)
723 (100.00)
consisting a highest proportions among the transport activities (56 per cent) followed by trading and commercial activities (54 per cent), manufacturing activities (38 per cent) and lowest among service related activities (10 per cent) took place through the motivation of the family members of the non-farm households. And around 23 per cent of the entrepreneurs were motivated by their friends and relatives and remaining only 3.04 per cent of the entrepreneurs had decided to establish concerned non-farm activities after motivating them by the Government.
Since, a quite large numbers of the non-farm activities in sample rural areas, either forming the traditional household activities or the non-traditional activities were reported to be quite old. It is therefore, we further find that fairly a very high proportions of little over than 47 per cent of the present entrepreneurs are engaged in different non-farm activities for employment for last nearly two decades ago. In fact, the proportions of entrepreneurs who have been engaged in manufacturing activities and service related activities before 1985 are as higher as 60 per cent and 50 per cent respectively. However, a very large proportion of entrepreneurs among those are involved in transportation (56 per cent) and trade and commercial activities (34 per cent) had joined their concerned non-farm activities very recently after 1995, suggesting the fact that, the traditional households based low paid non-farm activities such as manufacturing and professional services are the origin of past several generations while the most modern form of relatively better earning non-farm activities such as trading and commercial and transportation are of the recent origin in rural areas of the Uttaranchal (Table 2.16).
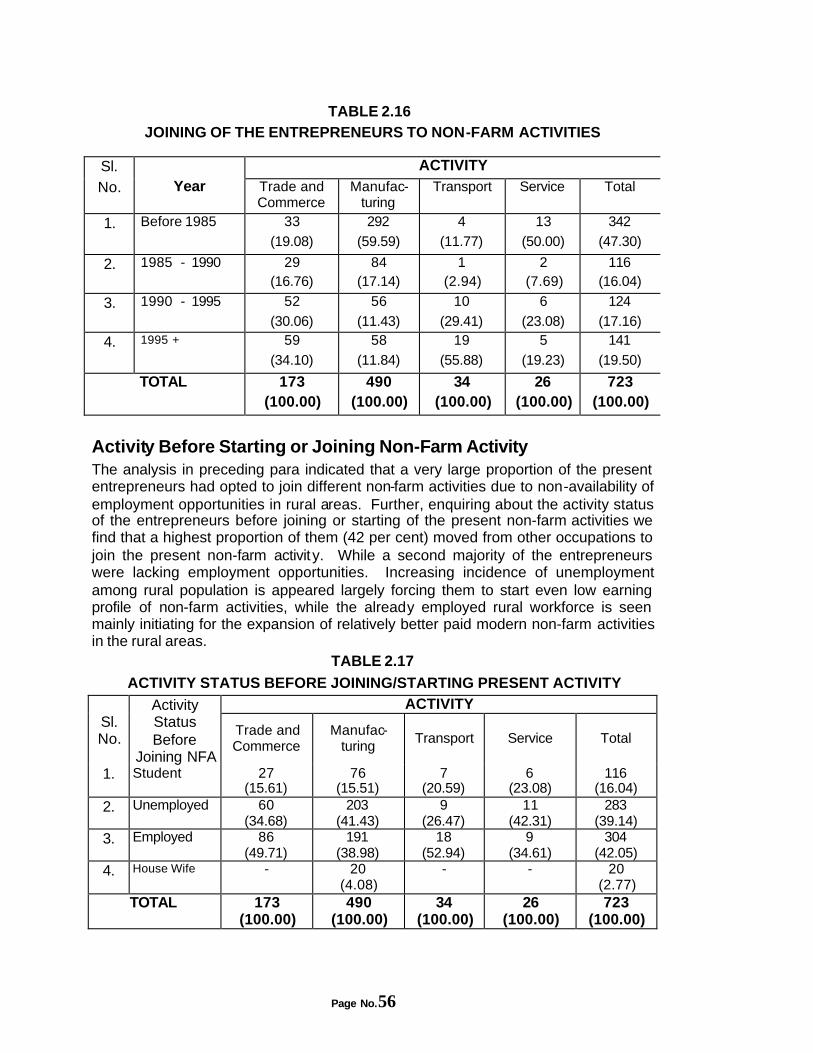
Page No.56
TABLE 2.16
JOINING OF THE ENTREPRENEURS TO NON-FARM ACTIVITIES
ACTIVITY Sl. No.
Year Trade and
Commerce Manufac-
turing Transport Service Total
1. Before 1985
33
(19.08)
292
(59.59)
4
(11.77)
13
(50.00)
342
(47.30)
2. 1985 - 1990 29 (16.76)
84 (17.14)
1 (2.94)
2 (7.69)
116 (16.04)
3. 1990 - 1995 52
(30.06)
56
(11.43)
10
(29.41)
6
(23.08)
124
(17.16)
4. 1995 + 59
(34.10)
58
(11.84)
19
(55.88)
5
(19.23)
141
(19.50)
TOTAL 173 (100.00)
490 (100.00)
34 (100.00)
26 (100.00)
723 (100.00)
Activity Before Starting or Joining Non-Farm Activity The analysis in preceding para indicated that a very large proportion of the present entrepreneurs had opted to join different non-farm activities due to non-availability of employment opportunities in rural areas. Further, enquiring about the activity status of the entrepreneurs before joining or starting of the present non-farm activities we find that a highest proportion of them (42 per cent) moved from other occupations to join the present non-farm activity. While a second majority of the entrepreneurs were lacking employment opportunities. Increasing incidence of unemployment among rural population is appeared largely forcing them to start even low earning profile of non-farm activities, while the already employed rural workforce is seen mainly initiating for the expansion of relatively better paid modern non-farm activities in the rural areas.
TABLE 2.17
ACTIVITY STATUS BEFORE JOINING/STARTING PRESENT ACTIVITY ACTIVITY
Sl. No.
Activity Status Before
Joining NFA
Trade and Commerce
Manufac-turing
Transport Service Total
1. Student 27 (15.61)
76 (15.51)
7 (20.59)
6 (23.08)
116 (16.04)
2. Unemployed 60 (34.68)
203 (41.43)
9 (26.47)
11 (42.31)
283 (39.14)
3. Employed 86 (49.71)
191 (38.98)
18 (52.94)
9 (34.61)
304 (42.05)
4. House Wife - 20 (4.08)
- - 20 (2.77)
TOTAL 173 (100.00)
490 (100.00)
34 (100.00)
26 (100.00)
723 (100.00)
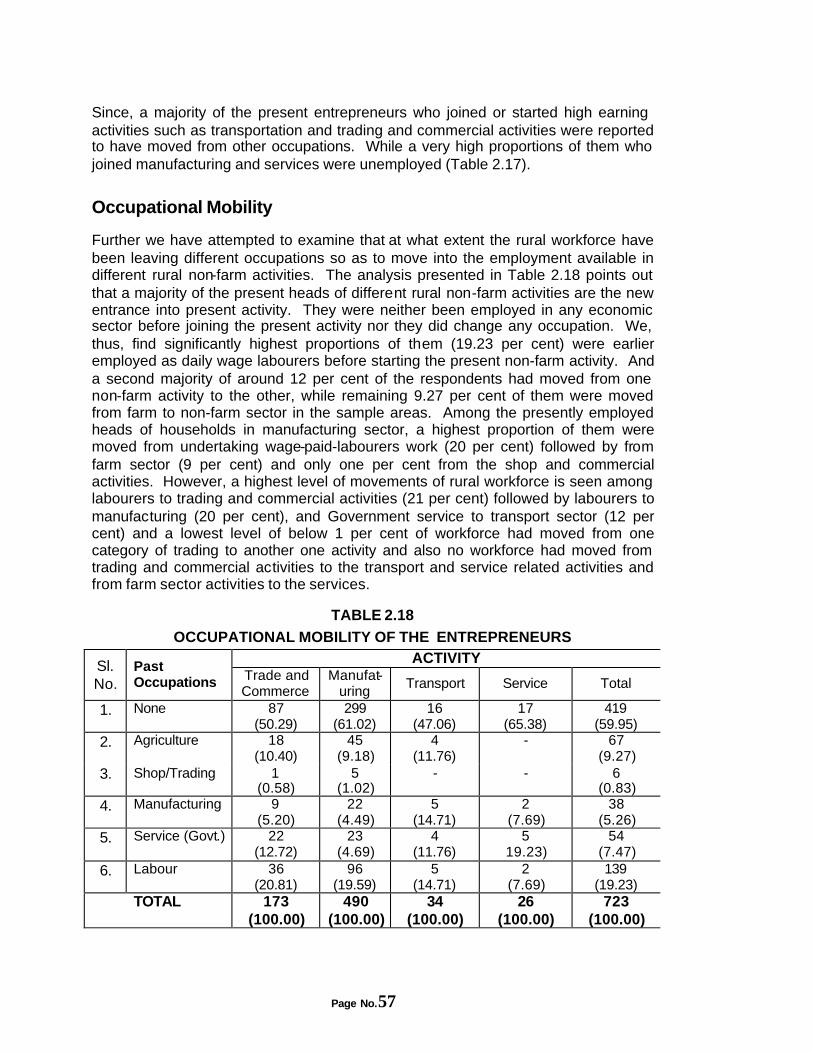
Page No.57
Since, a majority of the present entrepreneurs who joined or started high earning activities such as transportation and trading and commercial activities were reported to have moved from other occupations. While a very high proportions of them who joined manufacturing and services were unemployed (Table 2.17).
Occupational Mobility
Further we have attempted to examine that at what extent the rural workforce have been leaving different occupations so as to move into the employment available in different rural non-farm activities. The analysis presented in Table 2.18 points out that a majority of the present heads of different rural non-farm activities are the new entrance into present activity. They were neither been employed in any economic sector before joining the present activity nor they did change any occupation. We, thus, find significantly highest proportions of them (19.23 per cent) were earlier employed as daily wage labourers before starting the present non-farm activity. And a second majority of around 12 per cent of the respondents had moved from one non-farm activity to the other, while remaining 9.27 per cent of them were moved from farm to non-farm sector in the sample areas. Among the presently employed heads of households in manufacturing sector, a highest proportion of them were moved from undertaking wage-paid-labourers work (20 per cent) followed by from farm sector (9 per cent) and only one per cent from the shop and commercial activities. However, a highest level of movements of rural workforce is seen among labourers to trading and commercial activities (21 per cent) followed by labourers to manufacturing (20 per cent), and Government service to transport sector (12 per cent) and a lowest level of below 1 per cent of workforce had moved from one category of trading to another one activity and also no workforce had moved from trading and commercial activities to the transport and service related activities and from farm sector activities to the services.
TABLE 2.18
OCCUPATIONAL MOBILITY OF THE ENTREPRENEURS ACTIVITY Sl.
No. Past Occupations Trade and
Commerce Manufat-
uring Transport Service Total
1. None 87 (50.29)
299 (61.02)
16 (47.06)
17 (65.38)
419 (59.95)
2. Agriculture 18 (10.40)
45 (9.18)
4 (11.76)
- 67 (9.27)
3. Shop/Trading 1 (0.58)
5 (1.02)
- - 6 (0.83)
4. Manufacturing 9 (5.20)
22 (4.49)
5 (14.71)
2 (7.69)
38 (5.26)
5. Service (Govt.) 22 (12.72)
23 (4.69)
4 (11.76)
5 19.23)
54 (7.47)
6. Labour 36 (20.81)
96 (19.59)
5 (14.71)
2 (7.69)
139 (19.23)
TOTAL 173 (100.00)
490 (100.00)
34 (100.00)
26 (100.00)
723 (100.00)
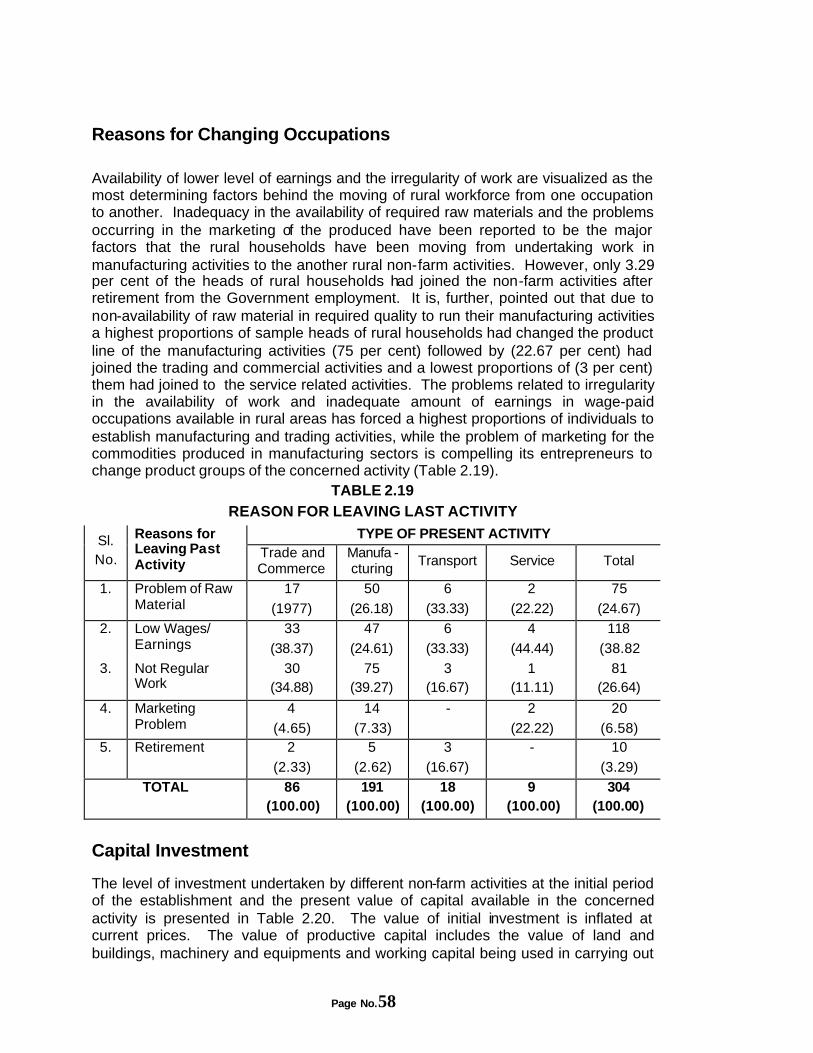
Page No.58
Reasons for Changing Occupations Availability of lower level of earnings and the irregularity of work are visualized as the most determining factors behind the moving of rural workforce from one occupation to another. Inadequacy in the availability of required raw materials and the problems occurring in the marketing of the produced have been reported to be the major factors that the rural households have been moving from undertaking work in manufacturing activities to the another rural non-farm activities. However, only 3.29 per cent of the heads of rural households had joined the non-farm activities after retirement from the Government employment. It is, further, pointed out that due to non-availability of raw material in required quality to run their manufacturing activities a highest proportions of sample heads of rural households had changed the product line of the manufacturing activities (75 per cent) followed by (22.67 per cent) had joined the trading and commercial activities and a lowest proportions of (3 per cent) them had joined to the service related activities. The problems related to irregularity in the availability of work and inadequate amount of earnings in wage-paid occupations available in rural areas has forced a highest proportions of individuals to establish manufacturing and trading activities, while the problem of marketing for the commodities produced in manufacturing sectors is compelling its entrepreneurs to change product groups of the concerned activity (Table 2.19).
TABLE 2.19 REASON FOR LEAVING LAST ACTIVITY
TYPE OF PRESENT ACTIVITY Sl. No.
Reasons for Leaving Past Activity
Trade and Commerce
Manufa -cturing
Transport Service Total
1. Problem of Raw Material
17
(1977)
50
(26.18)
6
(33.33)
2
(22.22)
75
(24.67)
2. Low Wages/ Earnings
33
(38.37)
47
(24.61)
6
(33.33)
4
(44.44)
118
(38.82
3. Not Regular Work
30 (34.88)
75 (39.27)
3 (16.67)
1 (11.11)
81 (26.64)
4. Marketing Problem
4
(4.65)
14
(7.33)
- 2
(22.22)
20
(6.58) 5. Retirement 2
(2.33)
5
(2.62)
3
(16.67)
- 10
(3.29)
TOTAL 86 (100.00)
191 (100.00)
18 (100.00)
9 (100.00)
304 (100.00)
Capital Investment
The level of investment undertaken by different non-farm activities at the initial period of the establishment and the present value of capital available in the concerned activity is presented in Table 2.20. The value of initial investment is inflated at current prices. The value of productive capital includes the value of land and buildings, machinery and equipments and working capital being used in carrying out
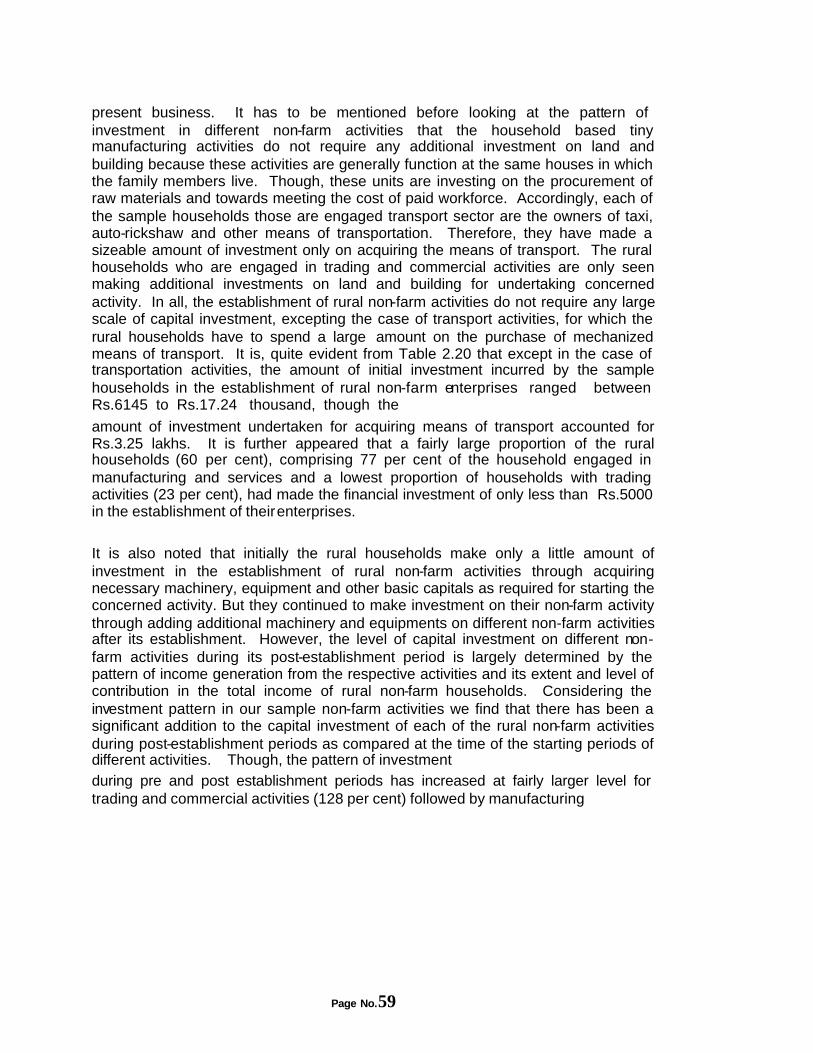
Page No.59
present business. It has to be mentioned before looking at the pattern of investment in different non-farm activities that the household based tiny manufacturing activities do not require any additional investment on land and building because these activities are generally function at the same houses in which the family members live. Though, these units are investing on the procurement of raw materials and towards meeting the cost of paid workforce. Accordingly, each of the sample households those are engaged transport sector are the owners of taxi, auto-rickshaw and other means of transportation. Therefore, they have made a sizeable amount of investment only on acquiring the means of transport. The rural households who are engaged in trading and commercial activities are only seen making additional investments on land and building for undertaking concerned activity. In all, the establishment of rural non-farm activities do not require any large scale of capital investment, excepting the case of transport activities, for which the rural households have to spend a large amount on the purchase of mechanized means of transport. It is, quite evident from Table 2.20 that except in the case of transportation activities, the amount of initial investment incurred by the sample households in the establishment of rural non-farm enterprises ranged between Rs.6145 to Rs.17.24 thousand, though the
amount of investment undertaken for acquiring means of transport accounted for Rs.3.25 lakhs. It is further appeared that a fairly large proportion of the rural households (60 per cent), comprising 77 per cent of the household engaged in manufacturing and services and a lowest proportion of households with trading activities (23 per cent), had made the financial investment of only less than Rs.5000 in the establishment of their enterprises.
It is also noted that initially the rural households make only a little amount of investment in the establishment of rural non-farm activities through acquiring necessary machinery, equipment and other basic capitals as required for starting the concerned activity. But they continued to make investment on their non-farm activity through adding additional machinery and equipments on different non-farm activities after its establishment. However, the level of capital investment on different non-farm activities during its post-establishment period is largely determined by the pattern of income generation from the respective activities and its extent and level of contribution in the total income of rural non-farm households. Considering the investment pattern in our sample non-farm activities we find that there has been a significant addition to the capital investment of each of the rural non-farm activities during post-establishment periods as compared at the time of the starting periods of different activities. Though, the pattern of investment during pre and post establishment periods has increased at fairly larger level for trading and commercial activities (128 per cent) followed by manufacturing
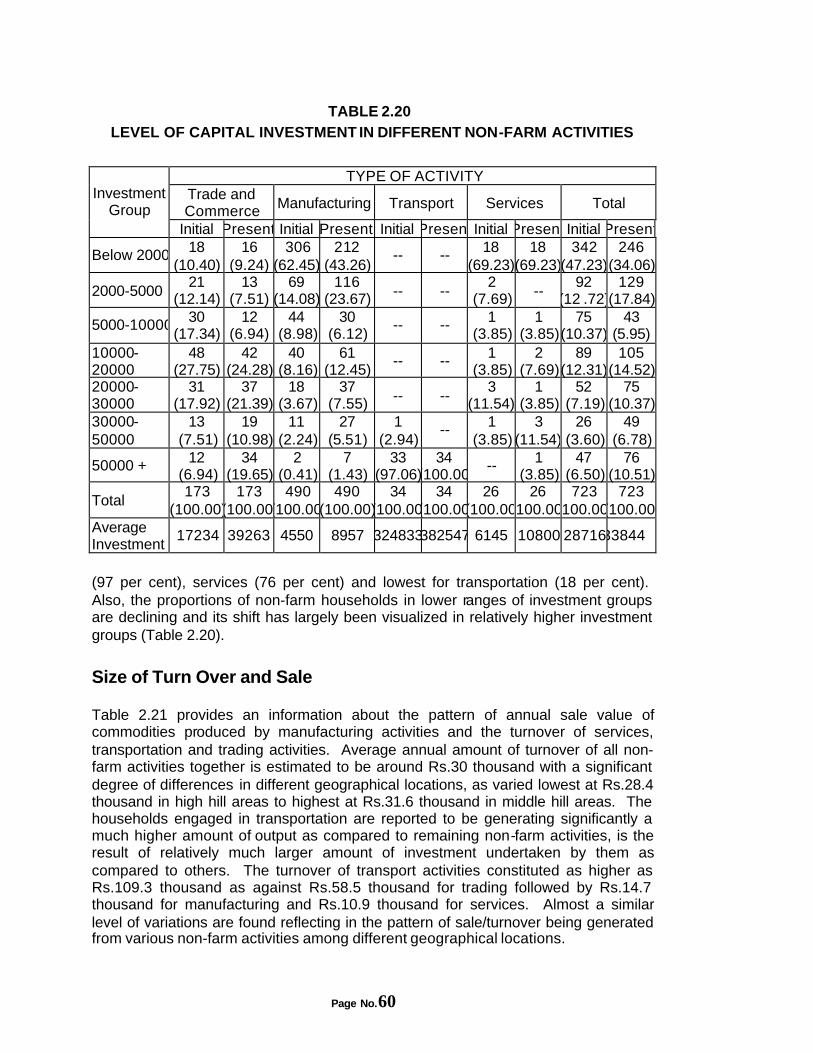
Page No.60
TABLE 2.20 LEVEL OF CAPITAL INVESTMENT IN DIFFERENT NON-FARM ACTIVITIES
TYPE OF ACTIVITY Trade and Commerce Manufacturing Transport Services Total
Investment Group
Initial Present Initial Present Initial Present Initial Present Initial Present
Below 2000 18 (10.40)
16 (9.24)
306 (62.45)
212 (43.26)
-- -- 18 (69.23)
18 (69.23)
342 (47.23)
246 (34.06)
2000-5000 21
(12.14) 13
(7.51) 69
(14.08)116
(23.67) -- -- 2
(7.69) -- 92
(12 .72)129
(17.84)
5000-10000 30 (17.34)
12 (6.94)
44 (8.98)
30 (6.12)
-- -- 1 (3.85)
1 (3.85)
75 (10.37)
43 (5.95)
10000-20000
48 (27.75)
42 (24.28)
40 (8.16)
61 (12.45)
-- -- 1 (3.85)
2 (7.69)
89 (12.31)
105 (14.52)
20000-30000
31 (17.92)
37 (21.39)
18 (3.67)
37 (7.55) -- --
3 (11.54)
1 (3.85)
52 (7.19)
75 (10.37)
30000-50000
13 (7.51)
19 (10.98)
11 (2.24)
27 (5.51)
1 (2.94)
-- 1 (3.85)
3 (11.54)
26 (3.60)
49 (6.78)
50000 + 12 (6.94)
34 (19.65)
2 (0.41)
7 (1.43)
33 (97.06)
34 (100.00)
-- 1 (3.85)
47 (6.50)
76 (10.51)
Total 173
(100.00)173
(100.00)490
(100.00)490
(100.00)34
(100.00)34
(100.00)26
(100.00)26
(100.00)723
(100.00)723
(100.00)Average Investment
17234 39263 4550 8957 324833382547 6145 10800 28716 33844
(97 per cent), services (76 per cent) and lowest for transportation (18 per cent). Also, the proportions of non-farm households in lower ranges of investment groups are declining and its shift has largely been visualized in relatively higher investment groups (Table 2.20).
Size of Turn Over and Sale
Table 2.21 provides an information about the pattern of annual sale value of commodities produced by manufacturing activities and the turnover of services, transportation and trading activities. Average annual amount of turnover of all non-farm activities together is estimated to be around Rs.30 thousand with a significant degree of differences in different geographical locations, as varied lowest at Rs.28.4 thousand in high hill areas to highest at Rs.31.6 thousand in middle hill areas. The households engaged in transportation are reported to be generating significantly a much higher amount of output as compared to remaining non-farm activities, is the result of relatively much larger amount of investment undertaken by them as compared to others. The turnover of transport activities constituted as higher as Rs.109.3 thousand as against Rs.58.5 thousand for trading followed by Rs.14.7 thousand for manufacturing and Rs.10.9 thousand for services. Almost a similar level of variations are found reflecting in the pattern of sale/turnover being generated from various non-farm activities among different geographical locations.
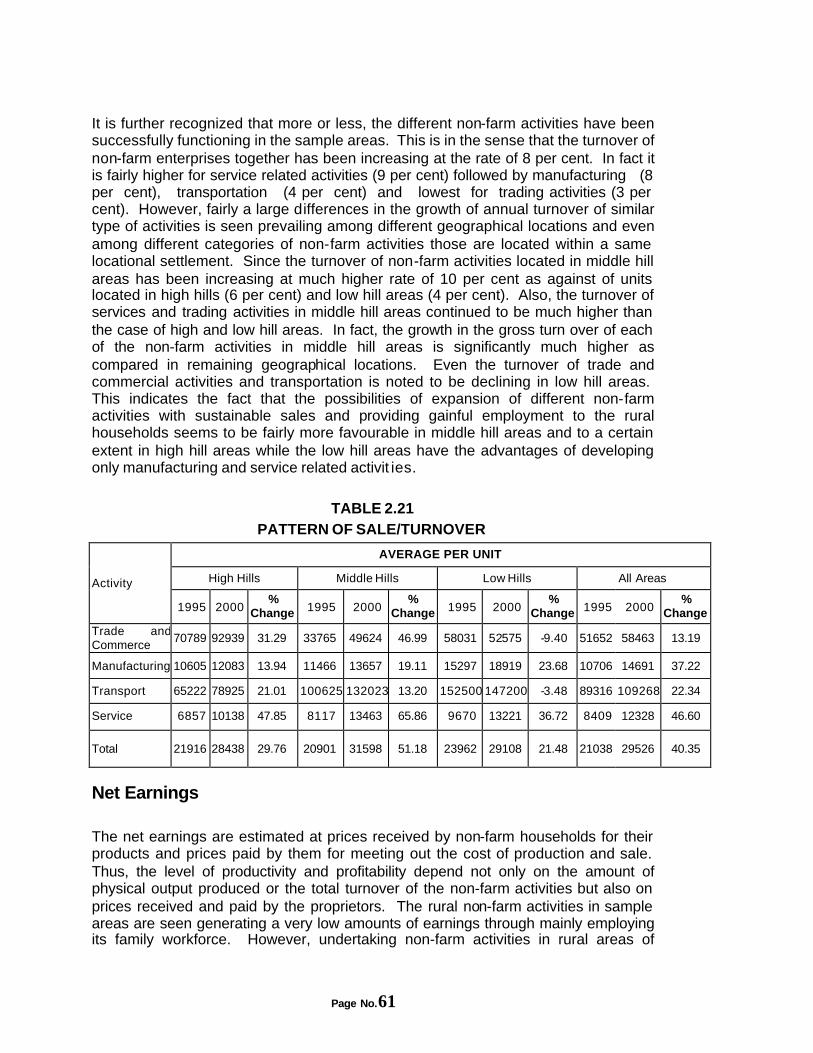
Page No.61
It is further recognized that more or less, the different non-farm activities have been successfully functioning in the sample areas. This is in the sense that the turnover of non-farm enterprises together has been increasing at the rate of 8 per cent. In fact it is fairly higher for service related activities (9 per cent) followed by manufacturing (8 per cent), transportation (4 per cent) and lowest for trading activities (3 per cent). However, fairly a large differences in the growth of annual turnover of similar type of activities is seen prevailing among different geographical locations and even among different categories of non-farm activities those are located within a same locational settlement. Since the turnover of non-farm activities located in middle hill areas has been increasing at much higher rate of 10 per cent as against of units located in high hills (6 per cent) and low hill areas (4 per cent). Also, the turnover of services and trading activities in middle hill areas continued to be much higher than the case of high and low hill areas. In fact, the growth in the gross turn over of each of the non-farm activities in middle hill areas is significantly much higher as compared in remaining geographical locations. Even the turnover of trade and commercial activities and transportation is noted to be declining in low hill areas. This indicates the fact that the possibilities of expansion of different non-farm activities with sustainable sales and providing gainful employment to the rural households seems to be fairly more favourable in middle hill areas and to a certain extent in high hill areas while the low hill areas have the advantages of developing only manufacturing and service related activit ies.
TABLE 2.21
PATTERN OF SALE/TURNOVER
AVERAGE PER UNIT
High Hills Middle Hills Low Hills All Areas Activity
1995 2000 %
Change 1995 2000 %
Change 1995 2000 %
Change 1995 2000 %
Change
Trade and Commerce
70789 92939 31.29 33765 49624 46.99 58031 52575 -9.40 51652 58463 13.19
Manufacturing 10605 12083 13.94 11466 13657 19.11 15297 18919 23.68 10706 14691 37.22
Transport 65222 78925 21.01 100625 132023 13.20 152500 147200 -3.48 89316 109268 22.34
Service 6857 10138 47.85 8117 13463 65.86 9670 13221 36.72 8409 12328 46.60
Total 21916 28438 29.76 20901 31598 51.18 23962 29108 21.48 21038 29526 40.35
Net Earnings The net earnings are estimated at prices received by non-farm households for their products and prices paid by them for meeting out the cost of production and sale. Thus, the level of productivity and profitability depend not only on the amount of physical output produced or the total turnover of the non-farm activities but also on prices received and paid by the proprietors. The rural non-farm activities in sample areas are seen generating a very low amounts of earnings through mainly employing its family workforce. However, undertaking non-farm activities in rural areas of

Page No.62
Uttaranchal is noted to be a very profitable occupation. Since the margin of profit of all non-farm activities together is estimated to be around 42 per cent, consisting fairly higher for services (83 per cent) followed by manufacturing (65 per cent), transportation (51 per cent) and lowest for trading and commercial activities (21 per cent). It may also be pointed out that the input cost of traditional manufacturing activities and certain occupations in services is very minimal because these activities mainly use locally available inputs with minimal or no cost involved in its utilization, is providing significantly higher returns than the non-traditional trading and commercial activities and transport related activities. However, the amount of earnings as being derived from non-traditional activities, i.e. transportation and trading and commercial activities, constituted to be fairly higher than the case of traditional services and manufacturing activities. The rural non-farm households those are engaged in trading and service related activities are noted earning significantly higher amount of incomes in high hill areas as compared to their counterpart in middle and low hill areas. The manufacturing activities are seen providing fairly higher earning to its households in low hill areas as compared to remaining two locations while the amount of income available from transportation seems to be relatively much higher than the case of other non-farm activities in each of the geographical locations.
TABLE 2.22 LEVEL OF NET EARNINGS
AVERAGE PER UNIT
High Hills Middle Hills Low Hills All Areas Activity
1995 2000 %
Change 1995 2000
% Change
1995 2000 %
Change 1995 2000
% Change
Trade and Commerce
12657 13300 5.08 8482 11332 33.60 9808 12619 28.66 10123 12384 22.33
Manufacturing 6251 7656 22.48 6963 9304 33.62 9937 12361 24.39 7585 9601 26.58
Transport 17778 36875 107.42 36313 77346 113.00 72500 61520 -17.85 31342 55974 78.59
Service 6500 10950 68.46 5150 8797 70.82 8370 10629 26.99 6961 10305 48.34
Total 7690 10567 37.41 8516 14034 84.80 10513 13407 27.53 8790 12474 41.91
Similarly, the income of non-farm households those are engaged in transportation is appeared increasing at much faster rate (78.59 per cent) as compared to services (48 per cent), manufacturing (27 per cent) and trading and commercial activities (22.33 per cent). Thus, over and above, it seems that the expansion of transport related activities is taking place at greater extent in almost of the geographical locations. Also the household engaged in different modes of transportation are possibly earning fairly higher amount of income than those are engaged in other rural non-farm activities. But, over a period of time the value of gross turn over as well as the amount of income of non-farm households those are engaged in transportation have been narrowing down, in fact, it is declining to a certain extent in low hill areas, in stead of its significant increase in the household of comprising in middle and high hill areas. This is happening partly due to increased expansion of various means of transportation and partly as a result of the increase of a significant
Page No.63
number of rural households into transport related activities in low hill areas than in remaining locations during the recent past.
Contribution of Rural Development Programmes: In the past, fairly a large numbers of employment oriented programmes and schemes have been launched in the state. Initially Integrated Rural Development Programme was the only scheme introduced for providing self employment opportunities to the rural people during the fourth plan period and the employment oriented schemes such as TRYSEM, IREP, ISB, RCGP, etc. were the main components included with the IRDP. Latter, a number of allied programmes have been added to create the self-employment and casual employment opportunities for the rural poor. Prominent among them were DWCRA, Supply of Improved Toolkits to Rural Artisans, Jawahar Rojgar Yojana, JGSY, Employment Assurance Scheme etc. The multiplicity of programmes has resulted in a lack of proper social intermediation, absence of desired linkages among programmes inter se and the implementation being more concerned with achieving individual programme targets rather than focussing on the substantive issue of sustainable employment creation and income generation. It is, therefore, the Government has decided to restructure the employment oriented progrmames and a new programme known as Swarn Jayanti Gram Swarojgar Yojana (SGSY) was launched in April 1999. The concerned progrmme, covering the all aspects of self-employment such as organizing rural poor to form self help groups and providing the facilities of training, credit, infrastructure, technology know-how, and marketing is the centrally sponsored scheme. The SGSY programme is being funded by both the Central and State Government in the ratio of 75 and 25 respectively. The objective of initiating SGSY scheme has been to facilitate the rural poor households through providing self employment opportunities and various required assistants, in terms of know-how technology and financial assistance, so as to bring them above the poverty line within three years of the implementation of concern programme. The identified beneficiaries to be covered under the SYSY are facilitated by providing income generating assets through a mix of bank credit and Government subsidy cum loan facilities. It is emphasized that before the implementation of the SGSY programme a detailed survey would be undertaken to identify the potential economic activities which possessing various development linkages in different rural areas. Thereafter it has been proposed to prepare a comprehensive project report in specific to each of the identified economic activity. Besides, the review of existing infrastructural facilities and its additional requirement in project areas would be assessed for developing cluster of identified economic activities in rural areas of each of the districts. Involvement of banks and financial institutions for financing groups of beneficiaries and project areas has also been highly appreciated. The SGSY also focuses on providing importance on group approaches with maximizing the participation of rural women on priority basis. The SGSY programme provides 30 per cent amount of the project cost as subsidy with a maximum limit of Rs.7500. However, the limit of subsidy amount exceeds to 50 per cent of the project cost with a maximum amount of Rs.10,000 for the households belonging scheduled castes and scheduled tribes. Since the Swarn Jayanti
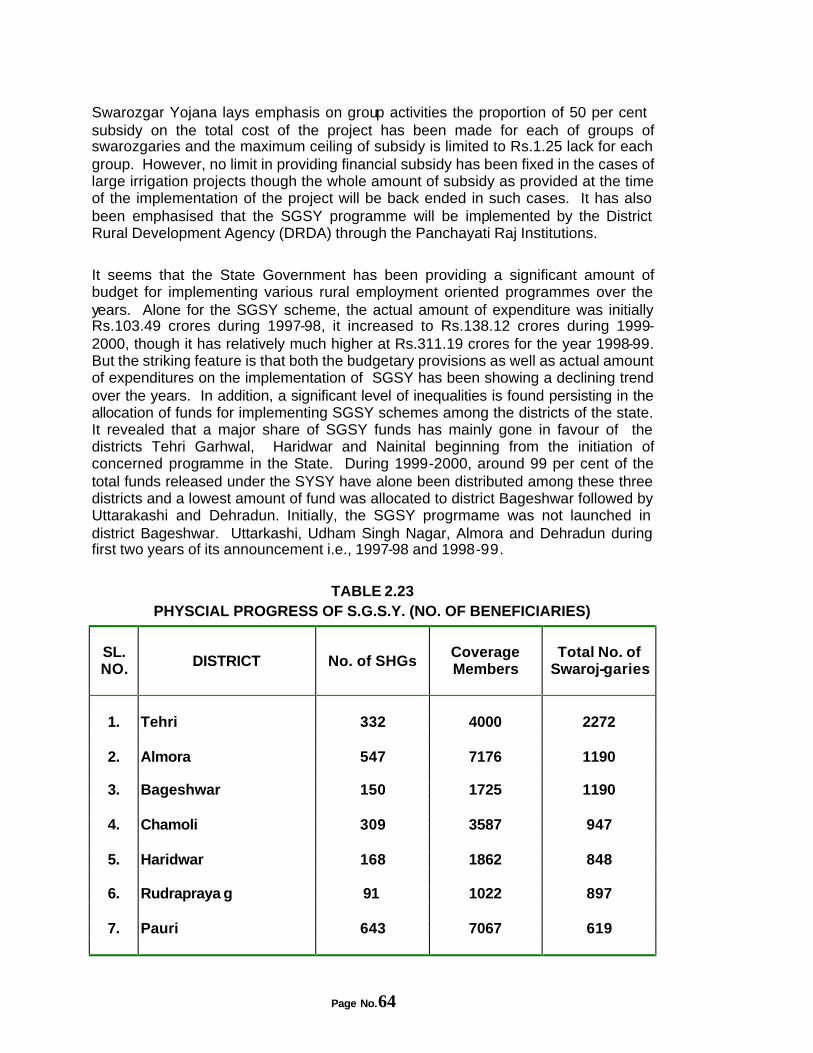
Page No.64
Swarozgar Yojana lays emphasis on group activities the proportion of 50 per cent subsidy on the total cost of the project has been made for each of groups of swarozgaries and the maximum ceiling of subsidy is limited to Rs.1.25 lack for each group. However, no limit in providing financial subsidy has been fixed in the cases of large irrigation projects though the whole amount of subsidy as provided at the time of the implementation of the project will be back ended in such cases. It has also been emphasised that the SGSY programme will be implemented by the District Rural Development Agency (DRDA) through the Panchayati Raj Institutions. It seems that the State Government has been providing a significant amount of budget for implementing various rural employment oriented programmes over the years. Alone for the SGSY scheme, the actual amount of expenditure was initially Rs.103.49 crores during 1997-98, it increased to Rs.138.12 crores during 1999-2000, though it has relatively much higher at Rs.311.19 crores for the year 1998-99. But the striking feature is that both the budgetary provisions as well as actual amount of expenditures on the implementation of SGSY has been showing a declining trend over the years. In addition, a significant level of inequalities is found persisting in the allocation of funds for implementing SGSY schemes among the districts of the state. It revealed that a major share of SGSY funds has mainly gone in favour of the districts Tehri Garhwal, Haridwar and Nainital beginning from the initiation of concerned programme in the State. During 1999-2000, around 99 per cent of the total funds released under the SYSY have alone been distributed among these three districts and a lowest amount of fund was allocated to district Bageshwar followed by Uttarakashi and Dehradun. Initially, the SGSY progrmame was not launched in district Bageshwar. Uttarkashi, Udham Singh Nagar, Almora and Dehradun during first two years of its announcement i.e., 1997-98 and 1998-99.
TABLE 2.23
PHYSCIAL PROGRESS OF S.G.S.Y. (NO. OF BENEFICIARIES)
SL. NO.
DISTRICT No. of SHGs Coverage Members
Total No. of Swaroj-garies
1. Tehri 332 4000 2272
2. Almora 547 7176 1190
3. Bageshwar 150 1725 1190
4. Chamoli 309 3587 947
5. Haridwar 168 1862 848
6. Rudrapraya g 91 1022 897
7. Pauri 643 7067 619
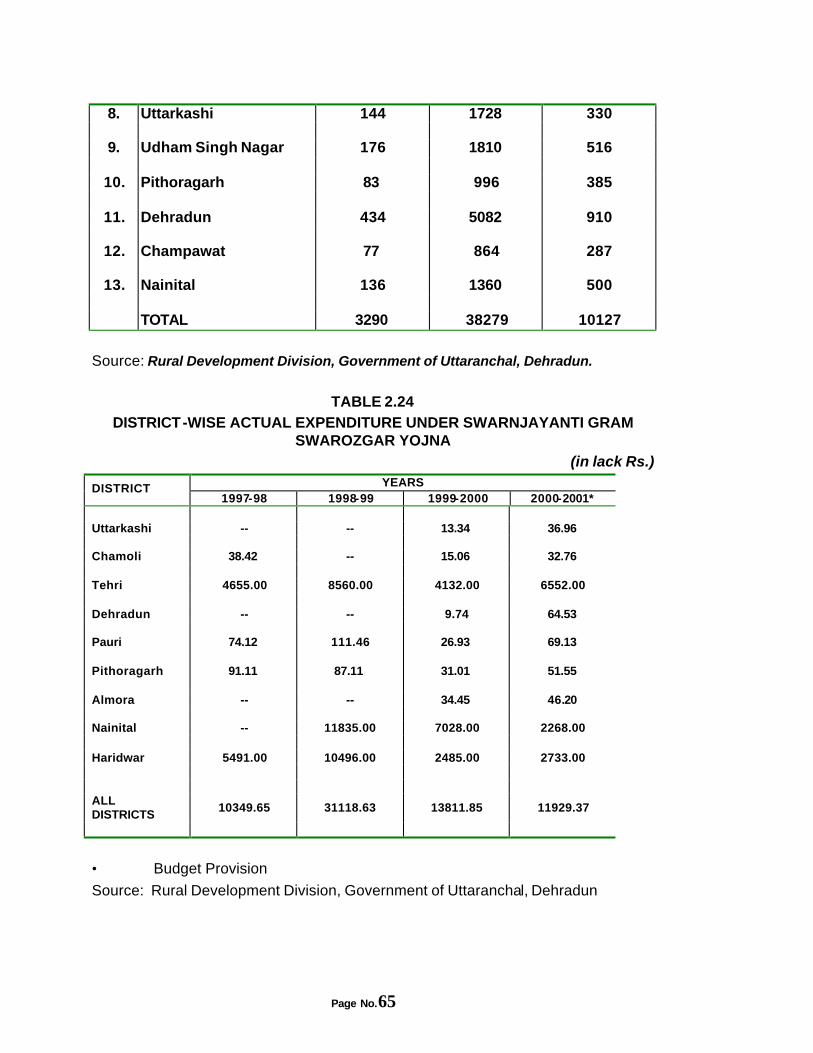
Page No.65
8. Uttarkashi 144 1728 330
9. Udham Singh Nagar 176 1810 516
10. Pithoragarh 83 996 385
11. Dehradun 434 5082 910
12. Champawat 77 864 287
13. Nainital 136 1360 500 TOTAL 3290 38279 10127
Source: Rural Development Division, Government of Uttaranchal, Dehradun.
TABLE 2.24 DISTRICT-WISE ACTUAL EXPENDITURE UNDER SWARNJAYANTI GRAM
SWAROZGAR YOJNA (in lack Rs.)
YEARS DISTRICT 1997-98 1998-99 1999-2000 2000-2001*
Uttarkashi -- -- 13.34 36.96 Chamoli 38.42 -- 15.06 32.76 Tehri 4655.00 8560.00 4132.00 6552.00 Dehradun -- -- 9.74 64.53 Pauri 74.12 111.46 26.93 69.13 Pithoragarh 91.11 87.11 31.01 51.55 Almora -- -- 34.45 46.20 Nainital -- 11835.00 7028.00 2268.00 Haridwar 5491.00 10496.00 2485.00 2733.00 ALL DISTRICTS
10349.65 31118.63 13811.85 11929.37
• Budget Provision
Source: Rural Development Division, Government of Uttaranchal, Dehradun
Page No.66
Implications:
The village Panchayats have been given the responsibility for implementing the SGSY scheme in their villages while the funds are released by the DRDA to the village Panchayats. However, under-utilization of funds as allocated by the state government to the DRDA has been well recognized in both the sample districts. It primarily due to the fact that the identification of potential economic activities and projects to be covered under the SGSY took a longer duration. During the initial period of the initiation of SGSY, the sample districts had been in a position to utilise only around one third of the funds allocated to them; though during the next year, 200-2001, the efficiency of funds utilisation was marginally increased and it picked up to 43.32 per cent.
As far as the implementation pattern of SGSY in rural areas of Uttaranchal and its impact on the creation of additional non-farm employment opportunities is concerned the official documents of the State Government claimed that in all 3290 self help groups have been so far formed and 10127 rural people have been provided the benefit of self-employment opportunities during the period 2000-2001. The total strength of the members of SHG’s accounted for over 38 thousand. A highest numbers of SHG’s were found formed in district Pauri (643) followed by Almora (547) and Dehradun (434). A very high priority has also been provided to maximise the partnership of disadvantage groups of communities such as scheduled castes/scheduled tribes, handicrafts and women through involving them with the SHG’s as its active members. Among the total coverage members the representation of women constituted as higher as around 48 per cent followed by scheduled castes/scheduled tribes (30 per cent). However, the achievement level of forming self help groups and the beneficiaries covered in providing self employment opportunities under SGSY have remained far behind the level of target was fixed for different years, beginning from the initiation of concerned programme in the state. A negligible contribution of SGSY in promoting non-farm employment opportunities for rural labourforce has been well visualised in the village studies. It was reported by the Pradhans of sample village Panchayats that their village Panchayats had not been so far identified for launching the concerned programme. In fact, a significant proportions of the Pradhans were not aware about the SGSY preogramme and basic objectives of its implementation. Most village Panchayats were only engaged in the implementation of JGSY through providing wage-paid casual employment rather than self-employment opportunities to the identified beneficiaries. Inquiring from the officials of the sample Block Panchayats we found that only 30 SHG’s in Dugadda block of Pauri district and 100 SHG’s in Kapkote block of Bageshwar district have been so far formed.
However, at least some degree of contribution of the past self-employment oriented programmes, such as ISB, TRYSEM, SITRA, EAS etc. has been well recognised in not only providing training and entrepreneurship ability, capital subsidy and the facility of loan for establishing different non-farm activities but also in motivating rural people for setting up of the enterprises. As indicated in the proceeding analysis that
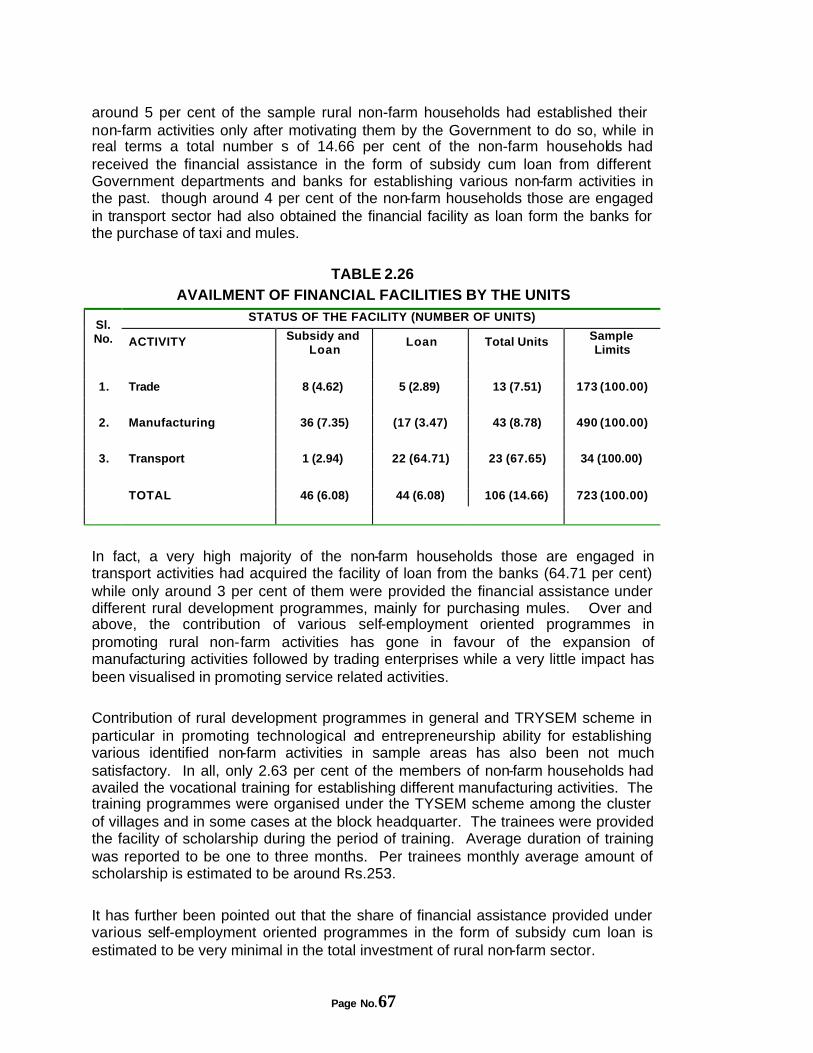
Page No.67
around 5 per cent of the sample rural non-farm households had established their non-farm activities only after motivating them by the Government to do so, while in real terms a total number s of 14.66 per cent of the non-farm households had received the financial assistance in the form of subsidy cum loan from different Government departments and banks for establishing various non-farm activities in the past. though around 4 per cent of the non-farm households those are engaged in transport sector had also obtained the financial facility as loan form the banks for the purchase of taxi and mules.
TABLE 2.26 AVAILMENT OF FINANCIAL FACILITIES BY THE UNITS
STATUS OF THE FACILITY (NUMBER OF UNITS) Sl. No. ACTIVITY Subsidy and
Loan Loan Total Units Sample
Limits
1. Trade 8 (4.62) 5 (2.89) 13 (7.51) 173 (100.00)
2. Manufacturing 36 (7.35) (17 (3.47) 43 (8.78) 490 (100.00)
3. Transport 1 (2.94) 22 (64.71) 23 (67.65) 34 (100.00)
TOTAL 46 (6.08) 44 (6.08) 106 (14.66) 723 (100.00)
In fact, a very high majority of the non-farm households those are engaged in transport activities had acquired the facility of loan from the banks (64.71 per cent) while only around 3 per cent of them were provided the financial assistance under different rural development programmes, mainly for purchasing mules. Over and above, the contribution of various self-employment oriented programmes in promoting rural non-farm activities has gone in favour of the expansion of manufacturing activities followed by trading enterprises while a very little impact has been visualised in promoting service related activities. Contribution of rural development programmes in general and TRYSEM scheme in particular in promoting technological and entrepreneurship ability for establishing various identified non-farm activities in sample areas has also been not much satisfactory. In all, only 2.63 per cent of the members of non-farm households had availed the vocational training for establishing different manufacturing activities. The training programmes were organised under the TYSEM scheme among the cluster of villages and in some cases at the block headquarter. The trainees were provided the facility of scholarship during the period of training. Average duration of training was reported to be one to three months. Per trainees monthly average amount of scholarship is estimated to be around Rs.253.
It has further been pointed out that the share of financial assistance provided under various self-employment oriented programmes in the form of subsidy cum loan is estimated to be very minimal in the total investment of rural non-farm sector.
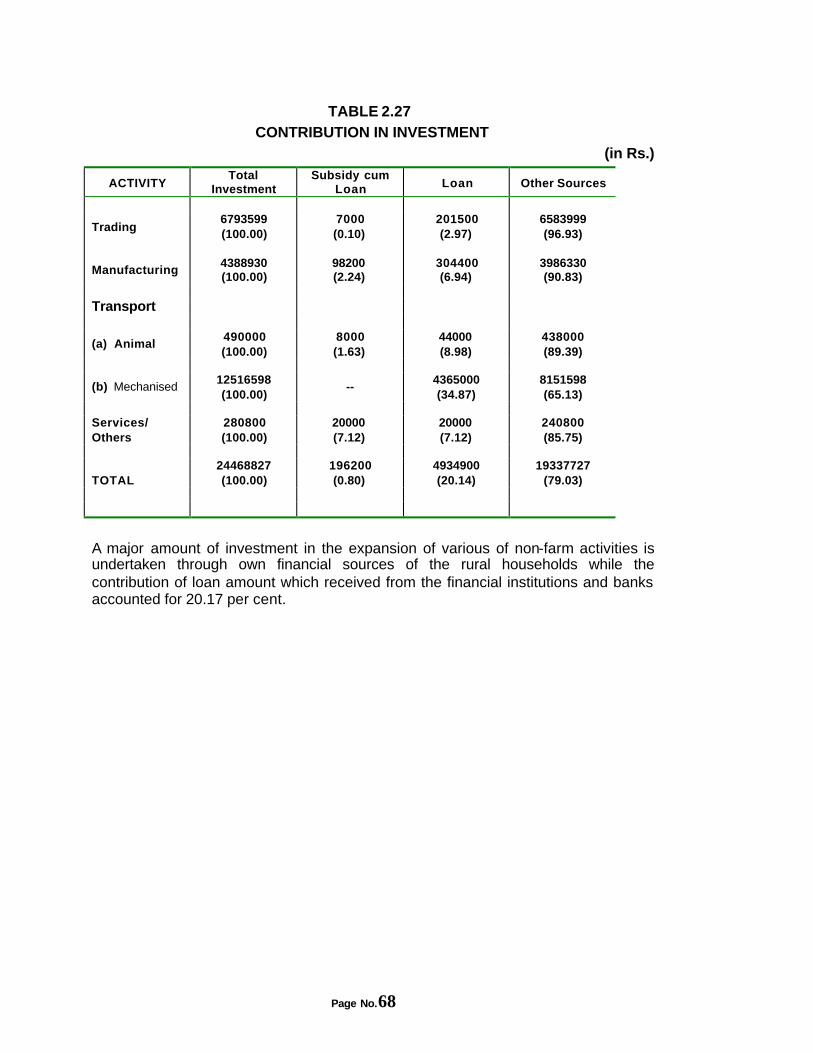
Page No.68
TABLE 2.27 CONTRIBUTION IN INVESTMENT
(in Rs.)
ACTIVITY Total
Investment Subsidy cum
Loan Loan Other Sources
Trading 6793599 (100.00)
7000 (0.10)
201500 (2.97)
6583999 (96.93)
Manufacturing 4388930 (100.00)
98200 (2.24)
304400 (6.94)
3986330 (90.83)
Transport
(a) Animal 490000 (100.00)
8000 (1.63)
44000 (8.98)
438000 (89.39)
(b) Mechanised 12516598 (100.00)
-- 4365000 (34.87)
8151598 (65.13)
Services/ Others
280800 (100.00)
20000 (7.12)
20000 (7.12)
240800 (85.75)
TOTAL
24468827 (100.00)
196200 (0.80)
4934900 (20.14)
19337727 (79.03)
A major amount of investment in the expansion of various of non-farm activities is undertaken through own financial sources of the rural households while the contribution of loan amount which received from the financial institutions and banks accounted for 20.17 per cent.
Page No.69
CHAPTER III
NONNON--FARM EMPLOYMENT FARM EMPLOYMENT AND THE WOMENAND THE WOMEN
The size and structure of rural non-farm sector can be measured in terms of (a) number and size of establishments (b) income and earnings and (c) employment. In the preceding analysis we have already examined the structure and mode of establishing the growth pattern of different product groups of manufacturing and non-manufacturing non-farm activities at different geographical locations, across the districts and at the state level of Uttaranchal. However the measurement of the structure of non-farm sector and its contribution to the rural economy of the state on the basis of income and earning generated from different non-farm activities have been examined on the basis of our sample data because of the non-availability of secondary data on income as being derived from different economic sectors at the state level. So far, the estimates of income have been calculated for primary and secondary sectors only while it is lacking for tertiary sector economies for both districts and State level of Uttaranchal.
Data Base and Its Limitations
The employment figures are available though special surveys undertaken by N.S.S. and the population census. The N.S.S. has been conducting the surveys on various diverse socio-economic aspects, including the survey of employment situation through using a fairly scientific methodology since 1972-73. The data collected by the N.S.S. during its different rounds of surveys are rich enough to through considerable light on non-farm component of employment (Chadha 1993). However, we lacked the concerned data of employment for the Uttaranchal through NSS reports because the NSS reports provide only the state level data instead of district-wise data on the structure and sectoral distribution of employment. Since the Uttaranchal State is originated very recently with the division of the U.P. therefore the respective data is available only for U.P. State in stead of Uttaranchal. Thus the population census are the only sources for obtaining the district-wise data on the structure of employment in different sectors. However, there are certain limitations in using the employment data from different census documents. Since it is widely known that many definitional and conceptual modifications were effected in one census after the other so that one is bound to discover diverse conceptual absurdities if the population data were to be used without making qualified adjustments in some cases (Chadha 1993),
Broadly speaking the employment data for the years 1981 and 1991 is more or less comparable in the sense that in both the census as the concept and definition used for the classification of workers is almost similar. In both the census the work force has been divided into two groups one, main workers and two, marginal workers.
Page No.70
And the sectoral distribution of workforce has been carried out in the case of main workers only. However, in the 1991, the definition and methodology used for inclusion of women in the categories or work force in rural areas is somewhat different than it was used during the other census periods. By and large the comparability of employment data has been limited mainly for examining the work-participation rates for the census years 1961 and 1971,either for male or female workforce. However, the 1961 workforce adjusted as per Census Resurveyed on Economic Questions, 1974 seems to be comparable with that of 1971 in the case of male workers. In the case of female workers the comparability cannot be maintained even after adjustment. As far as the comparison of 1971 and 1981 work participation is concerned the differences are quite narrow in the case of male workers (Singh 1994). However, the problems of comparability are relatively less acute for the remaining set of data (Visaria 1984). The main and secondary workers of 1971 may be comparable to the main and marginal workers of 1981 and 1991. In other words the main workers of 1971, 1981 and 1991 are comparable to a certain extent. Neverthless, it is, pointed out that the recording of secondary workers in 1971 was not done seriously leading to under estimation of such workers (Seal 1981, Unni 1989). It has also been argued that the comparability of workforce employed in different rural non-farm activities is not generally effected as marginal workers are likely to be predominant in the agricultural sector (Sinha 1982).
In the light of certain reasons and explanations imposed in using employment data from the census documents of different years our analysis on examining the work participation rates of workers shall be confined only for the years 1981 and 1991 for both male and female workers and it is limited for male workers for 1971. However, the examination of issues related to the structure and changes in the pattern of employment in non-farm and farm sector and the trends in the sectoral composition of the work force is carried out through obtaining required employment data from the census documents for the year 1971, 1981 and 1991.
Section (A) Structure of Farm and Non-farm Employment :
As indicated earlier, the agricultural and its related activities are forming the economic base of the State. Hence, these activities are the main sources of providing employment opportunities to the workforce and the avenues of income to the households in different districts of the State. Still, over three fourth of the work force is engaged in performing different agricultural work in the state. However, over the year, the concentration of workforce on agricultural activity has been consistently declining in the state. And the shift of workforce from agricultural to non-agricultural has been quite significant in each of the districts of the state. In other words, the concentration of workforce in productive economic sectors, confined in primary and secondary sectors has been narrowing down and its shift has subsequently been visualized in tertiary sector of economies, particularly in informal sector economies in different districts (Mehta 1999). Distribution of workers into farm and non-farm sectors revealed that the concentration of workforce in farm sector stands at a highest level in Tehri, closely followed by Chamoli and Uttarkashi while the non-farm employment is noticed confined largely in Dehradun and Nainital in all the last three
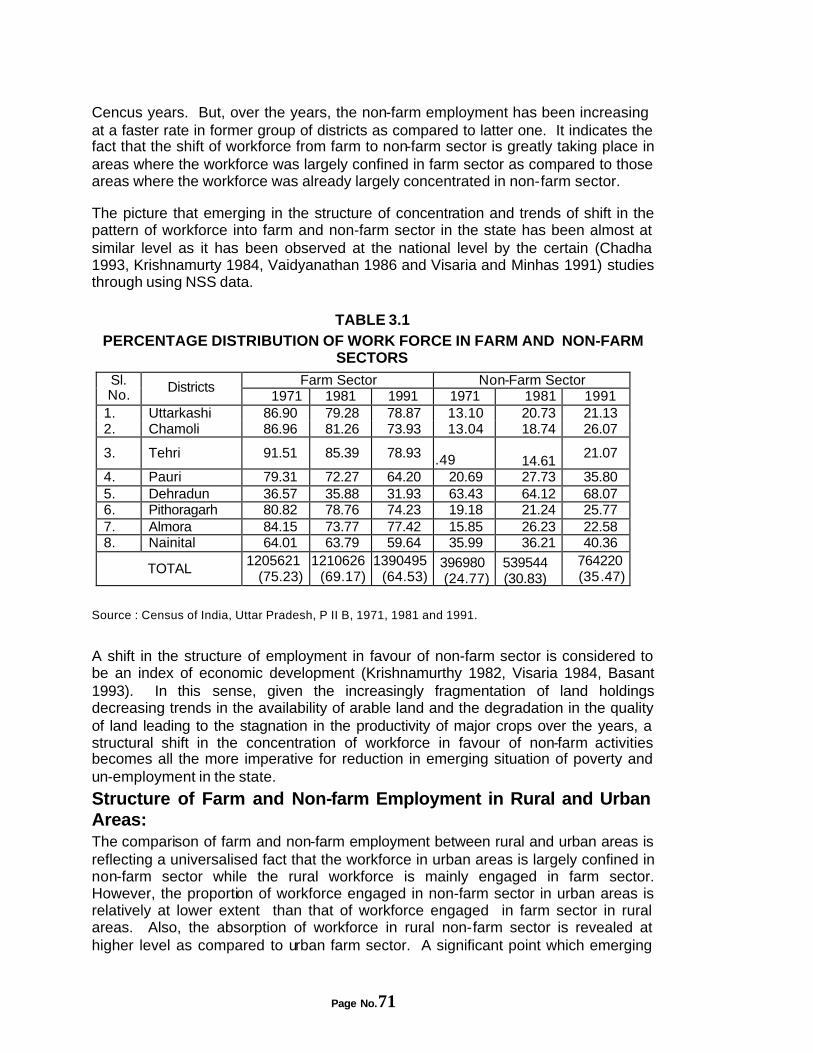
Page No.71
Cencus years. But, over the years, the non-farm employment has been increasing at a faster rate in former group of districts as compared to latter one. It indicates the fact that the shift of workforce from farm to non-farm sector is greatly taking place in areas where the workforce was largely confined in farm sector as compared to those areas where the workforce was already largely concentrated in non-farm sector.
The picture that emerging in the structure of concentration and trends of shift in the pattern of workforce into farm and non-farm sector in the state has been almost at similar level as it has been observed at the national level by the certain (Chadha 1993, Krishnamurty 1984, Vaidyanathan 1986 and Visaria and Minhas 1991) studies through using NSS data.
TABLE 3.1 PERCENTAGE DISTRIBUTION OF WORK FORCE IN FARM AND NON-FARM
SECTORS
Farm Sector Non-Farm Sector Sl. No.
Districts 1971 1981 1991 1971 1981 1991
1. Uttarkashi 86.90 79.28 78.87 13.10 20.73 21.13 2. Chamoli 86.96 81.26 73.93 13.04 18.74 26.07
3. Tehri 91.51 85.39 78.93
8.49 14.61 21.07
4. Pauri 79.31 72.27 64.20 20.69 27.73 35.80 5. Dehradun 36.57 35.88 31.93 63.43 64.12 68.07 6. Pithoragarh 80.82 78.76 74.23 19.18 21.24 25.77 7. Almora 84.15 73.77 77.42 15.85 26.23 22.58 8. Nainital 64.01 63.79 59.64 35.99 36.21 40.36
TOTAL 1205621 (75.23)
1210626 (69.17)
1390495 (64.53)
396980 (24.77)
539544 (30.83)
764220 (35.47)
Source : Census of India, Uttar Pradesh, P II B, 1971, 1981 and 1991.
A shift in the structure of employment in favour of non-farm sector is considered to be an index of economic development (Krishnamurthy 1982, Visaria 1984, Basant 1993). In this sense, given the increasingly fragmentation of land holdings decreasing trends in the availability of arable land and the degradation in the quality of land leading to the stagnation in the productivity of major crops over the years, a structural shift in the concentration of workforce in favour of non-farm activities becomes all the more imperative for reduction in emerging situation of poverty and un-employment in the state.
Structure of Farm and Non-farm Employment in Rural and Urban Areas: The comparison of farm and non-farm employment between rural and urban areas is reflecting a universalised fact that the workforce in urban areas is largely confined in non-farm sector while the rural workforce is mainly engaged in farm sector. However, the proportion of workforce engaged in non-farm sector in urban areas is relatively at lower extent than that of workforce engaged in farm sector in rural areas. Also, the absorption of workforce in rural non-farm sector is revealed at higher level as compared to urban farm sector. A significant point which emerging
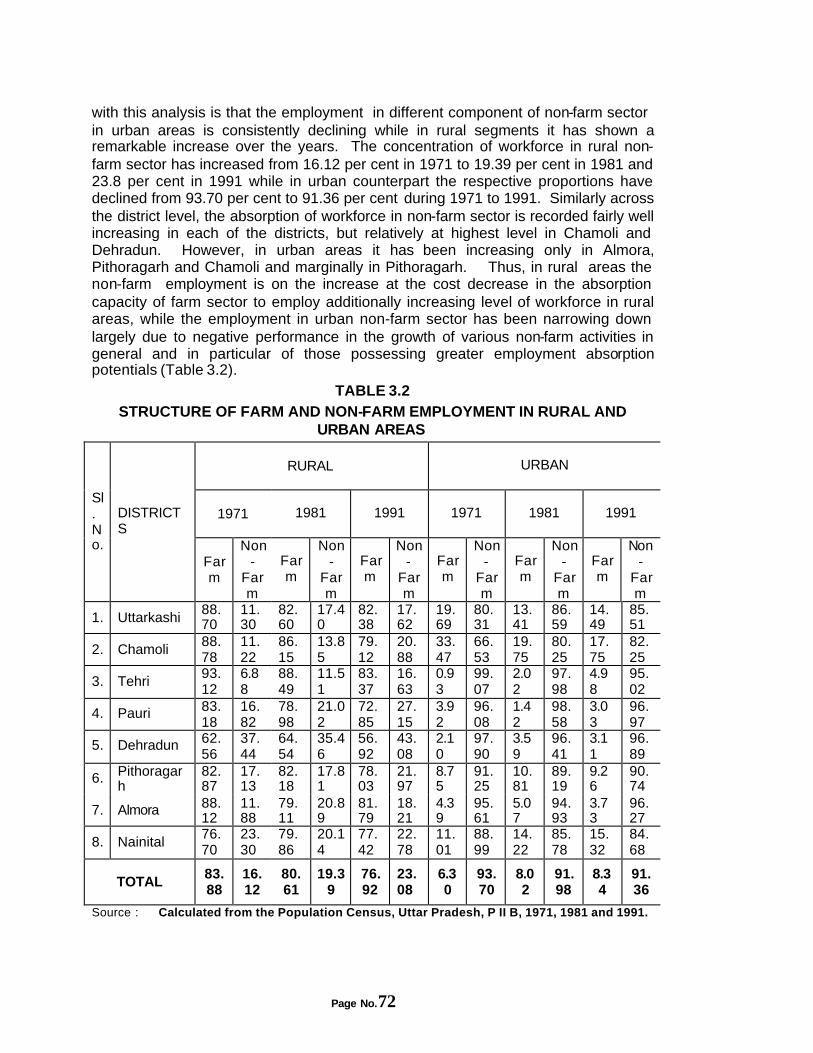
Page No.72
with this analysis is that the employment in different component of non-farm sector in urban areas is consistently declining while in rural segments it has shown a remarkable increase over the years. The concentration of workforce in rural non-farm sector has increased from 16.12 per cent in 1971 to 19.39 per cent in 1981 and 23.8 per cent in 1991 while in urban counterpart the respective proportions have declined from 93.70 per cent to 91.36 per cent during 1971 to 1991. Similarly across the district level, the absorption of workforce in non-farm sector is recorded fairly well increasing in each of the districts, but relatively at highest level in Chamoli and Dehradun. However, in urban areas it has been increasing only in Almora, Pithoragarh and Chamoli and marginally in Pithoragarh. Thus, in rural areas the non-farm employment is on the increase at the cost decrease in the absorption capacity of farm sector to employ additionally increasing level of workforce in rural areas, while the employment in urban non-farm sector has been narrowing down largely due to negative performance in the growth of various non-farm activities in general and in particular of those possessing greater employment absorption potentials (Table 3.2).
TABLE 3.2 STRUCTURE OF FARM AND NON-FARM EMPLOYMENT IN RURAL AND
URBAN AREAS
RURAL
URBAN
1971
1981 1991 1971 1981 1991
Sl. No.
DISTRICTS
Farm
Non-
Farm
Farm
Non-
Farm
Farm
Non-
Farm
Farm
Non-
Farm
Farm
Non-
Farm
Farm
Non-
Farm
1. Uttarkashi 88.70
11.30
82.60
17.40
82.38
17.62
19.69
80.31
13.41
86.59
14.49
85.51
2. Chamoli 88.78
11.22
86.15
13.85
79.12
20.88
33.47
66.53
19.75
80.25
17.75
82.25
3. Tehri 93.12
6.88
88.49
11.51
83.37
16.63
0.93
99.07
2.02
97.98
4.98
95.02
4. Pauri 83.18
16.82
78.98
21.02
72.85
27.15
3.92
96.08
1.42
98.58
3.03
96.97
5. Dehradun 62.56
37.44
64.54
35.46
56.92
43.08
2.10
97.90
3.59
96.41
3.11
96.89
6. Pithoragarh
82.87
17.13
82.18
17.81
78.03
21.97
8.75
91.25
10.81
89.19
9.26
90.74
7. Almora 88.12
11.88
79.11
20.89
81.79
18.21
4.39
95.61
5.07
94.93
3.73
96.27
8. Nainital 76.70
23.30
79.86
20.14
77.42
22.78
11.01
88.99
14.22
85.78
15.32
84.68
TOTAL 83.88
16.12
80.61
19.39
76.92
23.08
6.30
93.70
8.02
91.98
8.34
91.36
Source : Calculated from the Population Census, Uttar Pradesh, P II B, 1971, 1981 and 1991.
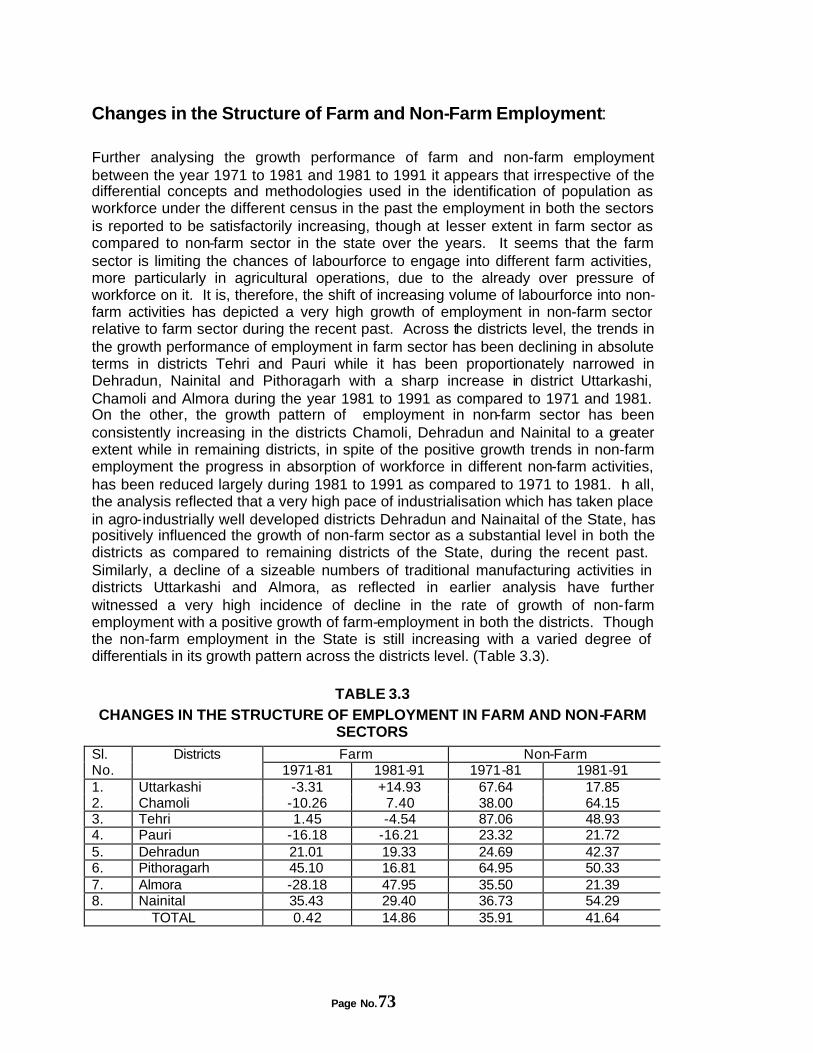
Page No.73
Changes in the Structure of Farm and Non-Farm Employment: Further analysing the growth performance of farm and non-farm employment between the year 1971 to 1981 and 1981 to 1991 it appears that irrespective of the differential concepts and methodologies used in the identification of population as workforce under the different census in the past the employment in both the sectors is reported to be satisfactorily increasing, though at lesser extent in farm sector as compared to non-farm sector in the state over the years. It seems that the farm sector is limiting the chances of labourforce to engage into different farm activities, more particularly in agricultural operations, due to the already over pressure of workforce on it. It is, therefore, the shift of increasing volume of labourforce into non-farm activities has depicted a very high growth of employment in non-farm sector relative to farm sector during the recent past. Across the districts level, the trends in the growth performance of employment in farm sector has been declining in absolute terms in districts Tehri and Pauri while it has been proportionately narrowed in Dehradun, Nainital and Pithoragarh with a sharp increase in district Uttarkashi, Chamoli and Almora during the year 1981 to 1991 as compared to 1971 and 1981. On the other, the growth pattern of employment in non-farm sector has been consistently increasing in the districts Chamoli, Dehradun and Nainital to a greater extent while in remaining districts, in spite of the positive growth trends in non-farm employment the progress in absorption of workforce in different non-farm activities, has been reduced largely during 1981 to 1991 as compared to 1971 to 1981. In all, the analysis reflected that a very high pace of industrialisation which has taken place in agro-industrially well developed districts Dehradun and Nainaital of the State, has positively influenced the growth of non-farm sector as a substantial level in both the districts as compared to remaining districts of the State, during the recent past. Similarly, a decline of a sizeable numbers of traditional manufacturing activities in districts Uttarkashi and Almora, as reflected in earlier analysis have further witnessed a very high incidence of decline in the rate of growth of non-farm employment with a positive growth of farm-employment in both the districts. Though the non-farm employment in the State is still increasing with a varied degree of differentials in its growth pattern across the districts level. (Table 3.3).
TABLE 3.3 CHANGES IN THE STRUCTURE OF EMPLOYMENT IN FARM AND NON-FARM
SECTORS
Farm Non-Farm Sl. No.
Districts 1971-81 1981-91 1971-81 1981-91
1. Uttarkashi -3.31 +14.93 67.64 17.85 2. Chamoli -10.26 7.40 38.00 64.15 3. Tehri 1.45 -4.54 87.06 48.93 4. Pauri -16.18 -16.21 23.32 21.72 5. Dehradun 21.01 19.33 24.69 42.37 6. Pithoragarh 45.10 16.81 64.95 50.33 7. Almora -28.18 47.95 35.50 21.39 8. Nainital 35.43 29.40 36.73 54.29
TOTAL 0.42 14.86 35.91 41.64
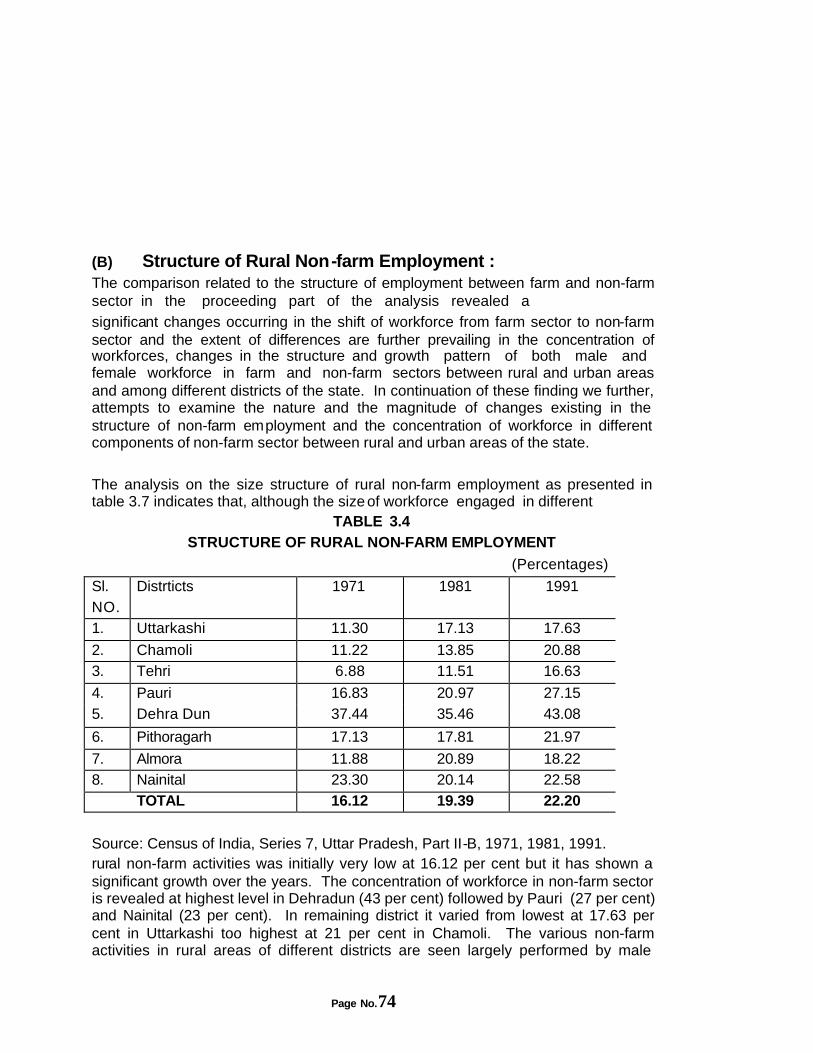
Page No.74
(B) Structure of Rural Non-farm Employment : The comparison related to the structure of employment between farm and non-farm sector in the proceeding part of the analysis revealed a significant changes occurring in the shift of workforce from farm sector to non-farm sector and the extent of differences are further prevailing in the concentration of workforces, changes in the structure and growth pattern of both male and female workforce in farm and non-farm sectors between rural and urban areas and among different districts of the state. In continuation of these finding we further, attempts to examine the nature and the magnitude of changes existing in the structure of non-farm employment and the concentration of workforce in different components of non-farm sector between rural and urban areas of the state.
The analysis on the size structure of rural non-farm employment as presented in table 3.7 indicates that, although the size of workforce engaged in different
TABLE 3.4 STRUCTURE OF RURAL NON-FARM EMPLOYMENT
(Percentages)
Sl. NO.
Distrticts 1971 1981 1991
1. Uttarkashi 11.30 17.13 17.63
2. Chamoli 11.22 13.85 20.88 3. Tehri 6.88 11.51 16.63
4. Pauri 16.83 20.97 27.15 5. Dehra Dun 37.44 35.46 43.08
6. Pithoragarh 17.13 17.81 21.97
7. Almora 11.88 20.89 18.22 8. Nainital 23.30 20.14 22.58 TOTAL 16.12 19.39 22.20
Source: Census of India, Series 7, Uttar Pradesh, Part II-B, 1971, 1981, 1991. rural non-farm activities was initially very low at 16.12 per cent but it has shown a significant growth over the years. The concentration of workforce in non-farm sector is revealed at highest level in Dehradun (43 per cent) followed by Pauri (27 per cent) and Nainital (23 per cent). In remaining district it varied from lowest at 17.63 per cent in Uttarkashi too highest at 21 per cent in Chamoli. The various non-farm activities in rural areas of different districts are seen largely performed by male
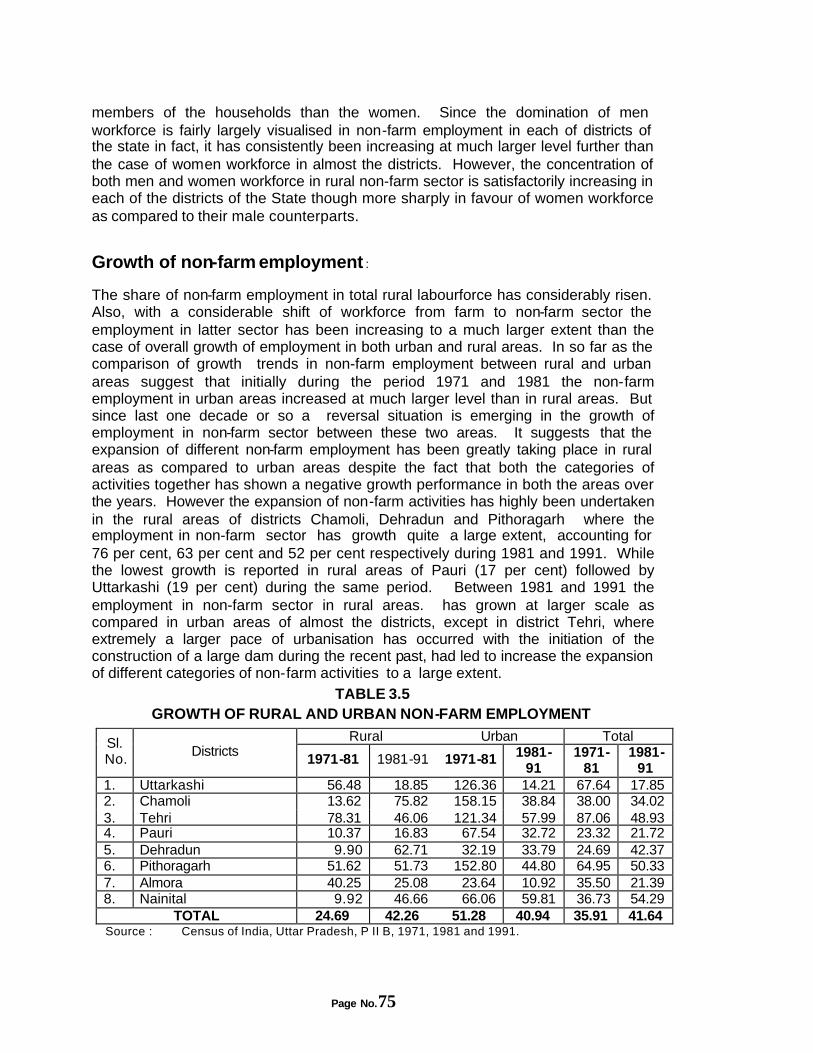
Page No.75
members of the households than the women. Since the domination of men workforce is fairly largely visualised in non-farm employment in each of districts of the state in fact, it has consistently been increasing at much larger level further than the case of women workforce in almost the districts. However, the concentration of both men and women workforce in rural non-farm sector is satisfactorily increasing in each of the districts of the State though more sharply in favour of women workforce as compared to their male counterparts.
Growth of non-farm employment :
The share of non-farm employment in total rural labourforce has considerably risen. Also, with a considerable shift of workforce from farm to non-farm sector the employment in latter sector has been increasing to a much larger extent than the case of overall growth of employment in both urban and rural areas. In so far as the comparison of growth trends in non-farm employment between rural and urban areas suggest that initially during the period 1971 and 1981 the non-farm employment in urban areas increased at much larger level than in rural areas. But since last one decade or so a reversal situation is emerging in the growth of employment in non-farm sector between these two areas. It suggests that the expansion of different non-farm employment has been greatly taking place in rural areas as compared to urban areas despite the fact that both the categories of activities together has shown a negative growth performance in both the areas over the years. However the expansion of non-farm activities has highly been undertaken in the rural areas of districts Chamoli, Dehradun and Pithoragarh where the employment in non-farm sector has growth quite a large extent, accounting for 76 per cent, 63 per cent and 52 per cent respectively during 1981 and 1991. While the lowest growth is reported in rural areas of Pauri (17 per cent) followed by Uttarkashi (19 per cent) during the same period. Between 1981 and 1991 the employment in non-farm sector in rural areas. has grown at larger scale as compared in urban areas of almost the districts, except in district Tehri, where extremely a larger pace of urbanisation has occurred with the initiation of the construction of a large dam during the recent past, had led to increase the expansion of different categories of non-farm activities to a large extent.
TABLE 3.5 GROWTH OF RURAL AND URBAN NON-FARM EMPLOYMENT
Rural Urban Total Sl. No.
Districts 1971-81 1981-91 1971-81 1981-91
1971-81
1981-91
1. Uttarkashi 56.48 18.85 126.36 14.21 67.64 17.85 2. Chamoli 13.62 75.82 158.15 38.84 38.00 34.02 3. Tehri 78.31 46.06 121.34 57.99 87.06 48.93 4. Pauri 10.37 16.83 67.54 32.72 23.32 21.72 5. Dehradun 9.90 62.71 32.19 33.79 24.69 42.37 6. Pithoragarh 51.62 51.73 152.80 44.80 64.95 50.33 7. Almora 40.25 25.08 23.64 10.92 35.50 21.39 8. Nainital 9.92 46.66 66.06 59.81 36.73 54.29
TOTAL 24.69 42.26 51.28 40.94 35.91 41.64 Source : Census of India, Uttar Pradesh, P II B, 1971, 1981 and 1991.

Page No.76
However, in absolute terms, the growth pattern of non-farm employment in rural areas of districts Tehri, Uttarkashi and Almora has marginally declined during 1981 to 1991 as compared to the period 1971-1981 while a highest level of increase is recorded in districts Dehradun followed by Chamoli, Nainital and Pauri. The reasons such as increase in the size of rural labourforce in farming households on one hand and, the inability of farm sector to accommodate increasing labourforce and to generate income as per the requirements of farming households on the other hand are assumed as the major reasons behind the increasing concentration and the shift of rural workforce in the rural non-farm sector.
Sectoral Concentration of Non-Farm Workers:
In the last analysis, a major shift of workforce, however was, well recognised from farm to non-farm sector in each of the districts of the State. This phenomenon needs to be examined further, in detail so as to find out about what are the main components/ activities confined in non-farm sector those are favourably influencing the concentration and growth pattern of rural workforce over the years, in the context of drawing some concrete policy perspectives for developing different non-farm activities.
Rural-Urban Concentration:
The classification of workforce into different components of non-farm sector postulates that both in urban and rural areas, the workforce is largely concentrated in service sector which include Government sector employment and personnel and community services but it largely constitutes of personal and community services in rural areas. However the proportion of workforce confined in services is reported to be significantly at higher level in rural areas as compared to urban areas and also, it has been increasing more sharply in former areas than in the latter areas over the years. The manufacturing, trade and commerce and construction activities are the another main components of non-farm sector employment in both rural and urban areas. However, the trading and manufacturing together are forming second most groups of non-farm activities after the services, which are employing little over one fourth of the urban workforce. The share of agriculture based non-farm activities such as livestock, fishing, hunting and forestry in providing employment is noted significantly at higher level in rural areas as compared to urban segments. Also the concentration of workforce in these activities is on the increase in both the segments is significantly increasing over the years. Further, the concentration of workforce in manufacturing sector, both household and non-household groups , is reported to be declining in both urban and rural areas at almost the similar pattern but it has shown at least some extent of improvement in trading and commercial activities in both the areas during the last two decades or so. In rural areas itself, the traditional household manufacturing activities seems to be moving away at a much larger extent than the non-household manufacturing activities as a result the concentration of workforce has declined to a much higher level in the former category of activities with a marginal decline of around one per cent point in latter category of activities (Table 3.6).
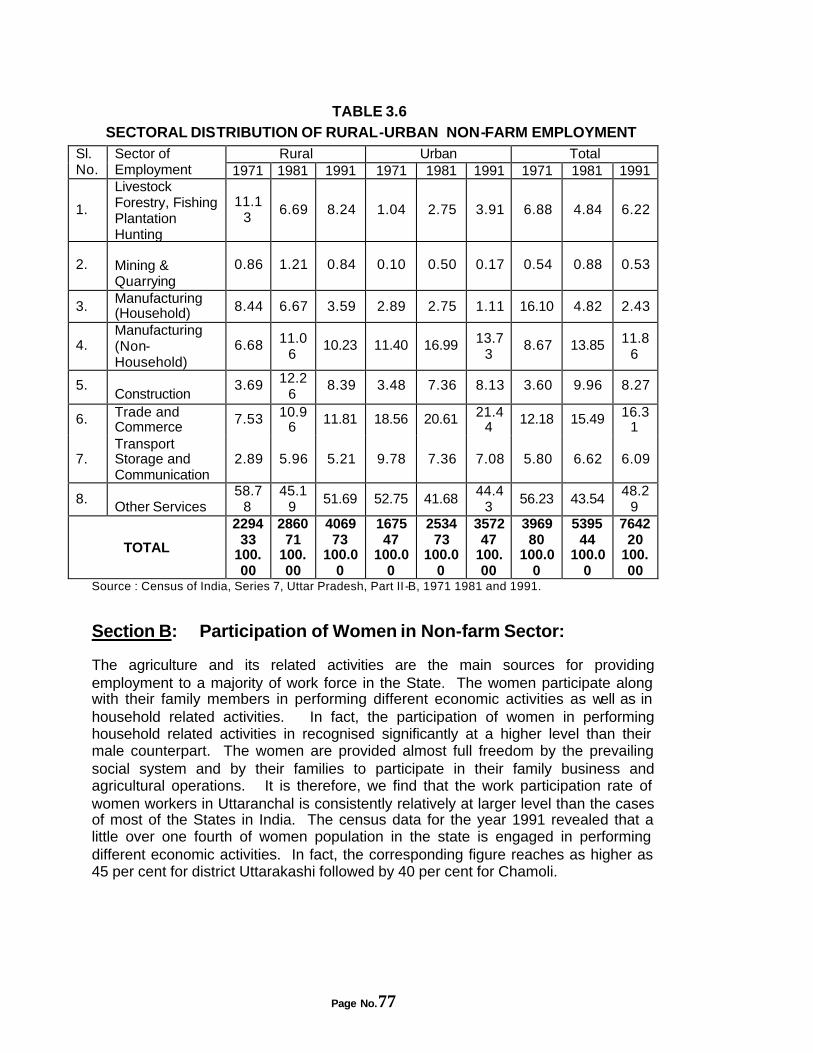
Page No.77
TABLE 3.6 SECTORAL DISTRIBUTION OF RURAL-URBAN NON-FARM EMPLOYMENT
Rural Urban Total Sl. No.
Sector of Employment 1971 1981 1991 1971 1981 1991 1971 1981 1991
1.
Livestock Forestry, Fishing Plantation Hunting
11.13
6.69 8.24 1.04 2.75 3.91 6.88 4.84 6.22
2. Mining & Quarrying
0.86 1.21 0.84 0.10 0.50 0.17 0.54 0.88 0.53
3. Manufacturing (Household) 8.44 6.67 3.59 2.89 2.75 1.11 16.10 4.82 2.43
4. Manufacturing (Non-Household)
6.68 11.06
10.23 11.40 16.99 13.73
8.67 13.85 11.86
5. Construction
3.69 12.26
8.39 3.48 7.36 8.13 3.60 9.96 8.27
6. Trade and Commerce
7.53 10.96
11.81 18.56 20.61 21.44
12.18 15.49 16.31
7. Transport Storage and Communication
2.89 5.96 5.21 9.78 7.36 7.08 5.80 6.62 6.09
8. Other Services
58.78
45.19
51.69 52.75 41.68 44.4
3 56.23 43.54
48.29
TOTAL
229433
100.00
286071
100.00
406973
100.00
167547
100.00
253473
100.00
357247
100.00
396980
100.00
539544
100.00
764220
100.00
Source : Census of India, Series 7, Uttar Pradesh, Part II -B, 1971 1981 and 1991.
Section B: Participation of Women in Non-farm Sector:
The agriculture and its related activities are the main sources for providing employment to a majority of work force in the State. The women participate along with their family members in performing different economic activities as well as in household related activities. In fact, the participation of women in performing household related activities in recognised significantly at a higher level than their male counterpart. The women are provided almost full freedom by the prevailing social system and by their families to participate in their family business and agricultural operations. It is therefore, we find that the work participation rate of women workers in Uttaranchal is consistently relatively at larger level than the cases of most of the States in India. The census data for the year 1991 revealed that a little over one fourth of women population in the state is engaged in performing different economic activities. In fact, the corresponding figure reaches as higher as 45 per cent for district Uttarakashi followed by 40 per cent for Chamoli.
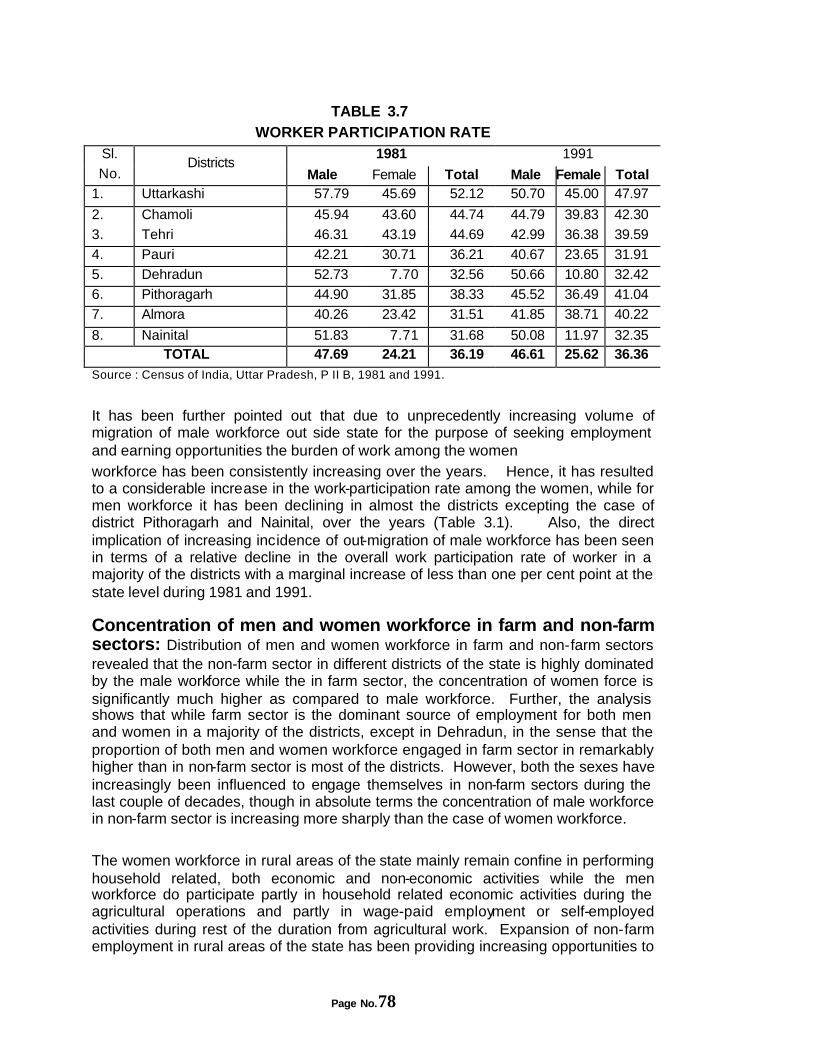
Page No.78
TABLE 3.7 WORKER PARTICIPATION RATE
1981 1991 Sl.
No. Districts
Male Female Total Male Female Total 1. Uttarkashi 57.79 45.69 52.12 50.70 45.00 47.97
2. Chamoli 45.94 43.60 44.74 44.79 39.83 42.30
3. Tehri 46.31 43.19 44.69 42.99 36.38 39.59
4. Pauri 42.21 30.71 36.21 40.67 23.65 31.91
5. Dehradun 52.73 7.70 32.56 50.66 10.80 32.42
6. Pithoragarh 44.90 31.85 38.33 45.52 36.49 41.04
7. Almora 40.26 23.42 31.51 41.85 38.71 40.22
8. Nainital 51.83 7.71 31.68 50.08 11.97 32.35 TOTAL 47.69 24.21 36.19 46.61 25.62 36.36
Source : Census of India, Uttar Pradesh, P II B, 1981 and 1991.
It has been further pointed out that due to unprecedently increasing volume of migration of male workforce out side state for the purpose of seeking employment and earning opportunities the burden of work among the women workforce has been consistently increasing over the years. Hence, it has resulted to a considerable increase in the work-participation rate among the women, while for men workforce it has been declining in almost the districts excepting the case of district Pithoragarh and Nainital, over the years (Table 3.1). Also, the direct implication of increasing incidence of out-migration of male workforce has been seen in terms of a relative decline in the overall work participation rate of worker in a majority of the districts with a marginal increase of less than one per cent point at the state level during 1981 and 1991.
Concentration of men and women workforce in farm and non-farm sectors: Distribution of men and women workforce in farm and non-farm sectors revealed that the non-farm sector in different districts of the state is highly dominated by the male workforce while the in farm sector, the concentration of women force is significantly much higher as compared to male workforce. Further, the analysis shows that while farm sector is the dominant source of employment for both men and women in a majority of the districts, except in Dehradun, in the sense that the proportion of both men and women workforce engaged in farm sector in remarkably higher than in non-farm sector is most of the districts. However, both the sexes have increasingly been influenced to engage themselves in non-farm sectors during the last couple of decades, though in absolute terms the concentration of male workforce in non-farm sector is increasing more sharply than the case of women workforce. The women workforce in rural areas of the state mainly remain confine in performing household related, both economic and non-economic activities while the men workforce do participate partly in household related economic activities during the agricultural operations and partly in wage-paid employment or self-employed activities during rest of the duration from agricultural work. Expansion of non-farm employment in rural areas of the state has been providing increasing opportunities to
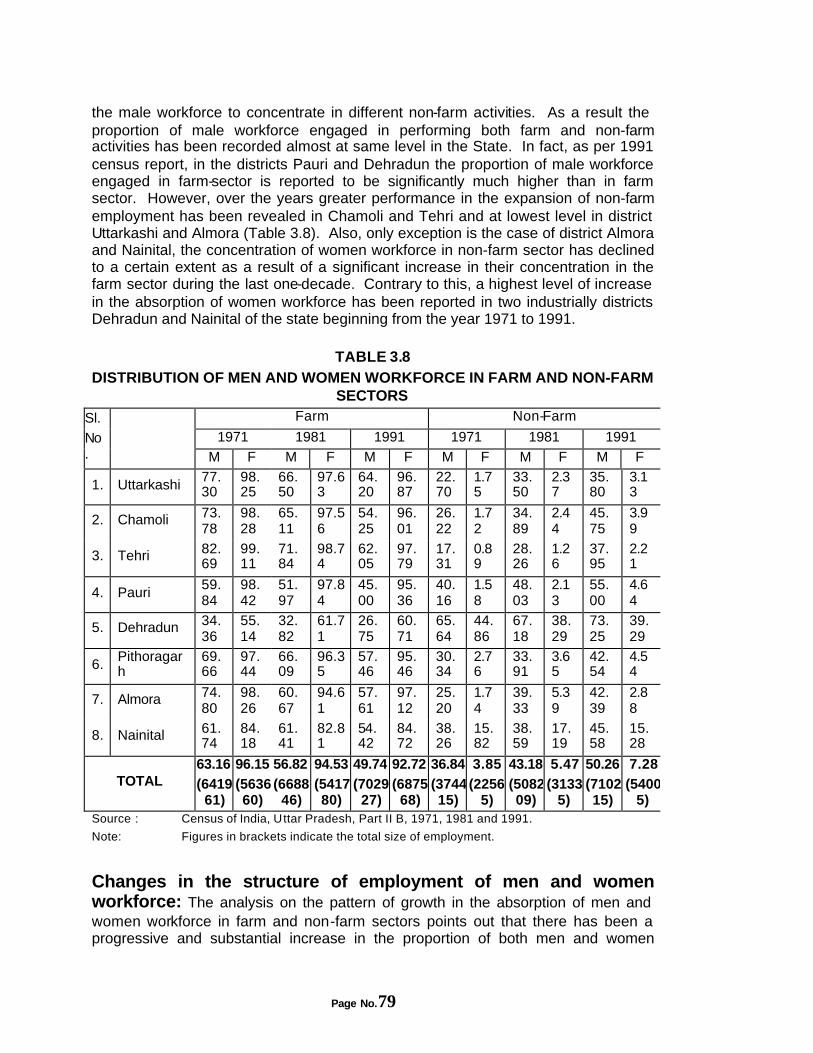
Page No.79
the male workforce to concentrate in different non-farm activities. As a result the proportion of male workforce engaged in performing both farm and non-farm activities has been recorded almost at same level in the State. In fact, as per 1991 census report, in the districts Pauri and Dehradun the proportion of male workforce engaged in farm-sector is reported to be significantly much higher than in farm sector. However, over the years greater performance in the expansion of non-farm employment has been revealed in Chamoli and Tehri and at lowest level in district Uttarkashi and Almora (Table 3.8). Also, only exception is the case of district Almora and Nainital, the concentration of women workforce in non-farm sector has declined to a certain extent as a result of a significant increase in their concentration in the farm sector during the last one-decade. Contrary to this, a highest level of increase in the absorption of women workforce has been reported in two industrially districts Dehradun and Nainital of the state beginning from the year 1971 to 1991.
TABLE 3.8 DISTRIBUTION OF MEN AND WOMEN WORKFORCE IN FARM AND NON-FARM
SECTORS Farm Non-Farm
1971 1981 1991 1971 1981 1991 Sl.
No.
M F M F M F M F M F M F
1. Uttarkashi 77.30
98.25
66.50
97.63
64.20
96.87
22.70
1.75
33.50
2.37
35.80
3.13
2. Chamoli 73.78
98.28
65.11
97.56
54.25
96.01
26.22
1.72
34.89
2.44
45.75
3.99
3. Tehri 82.69
99.11
71.84
98.74
62.05
97.79
17.31
0.89
28.26
1.26
37.95
2.21
4. Pauri 59.84
98.42
51.97
97.84
45.00
95.36
40.16
1.58
48.03
2.13
55.00
4.64
5. Dehradun 34.36
55.14
32.82
61.71
26.75
60.71
65.64
44.86
67.18
38.29
73.25
39.29
6. Pithoragarh
69.66
97.44
66.09
96.35
57.46
95.46
30.34
2.76
33.91
3.65
42.54
4.54
7. Almora 74.80
98.26
60.67
94.61
57.61
97.12
25.20
1.74
39.33
5.39
42.39
2.88
8. Nainital 61.74
84.18
61.41
82.81
54.42
84.72
38.26
15.82
38.59
17.19
45.58
15.28
TOTAL 63.16(6419
61)
96.15(563660)
56.82 (6688
46)
94.53 (541780)
49.74(7029
27)
92.72(6875
68)
36.84(374415)
3.85 (2256
5)
43.18(508209)
5.47 (3133
5)
50.26 (710215)
7.28 (5400
5) Source : Census of India, Uttar Pradesh, Part II B, 1971, 1981 and 1991.
Note: Figures in brackets indicate the total size of employment.
Changes in the structure of employment of men and women workforce: The analysis on the pattern of growth in the absorption of men and women workforce in farm and non-farm sectors points out that there has been a progressive and substantial increase in the proportion of both men and women
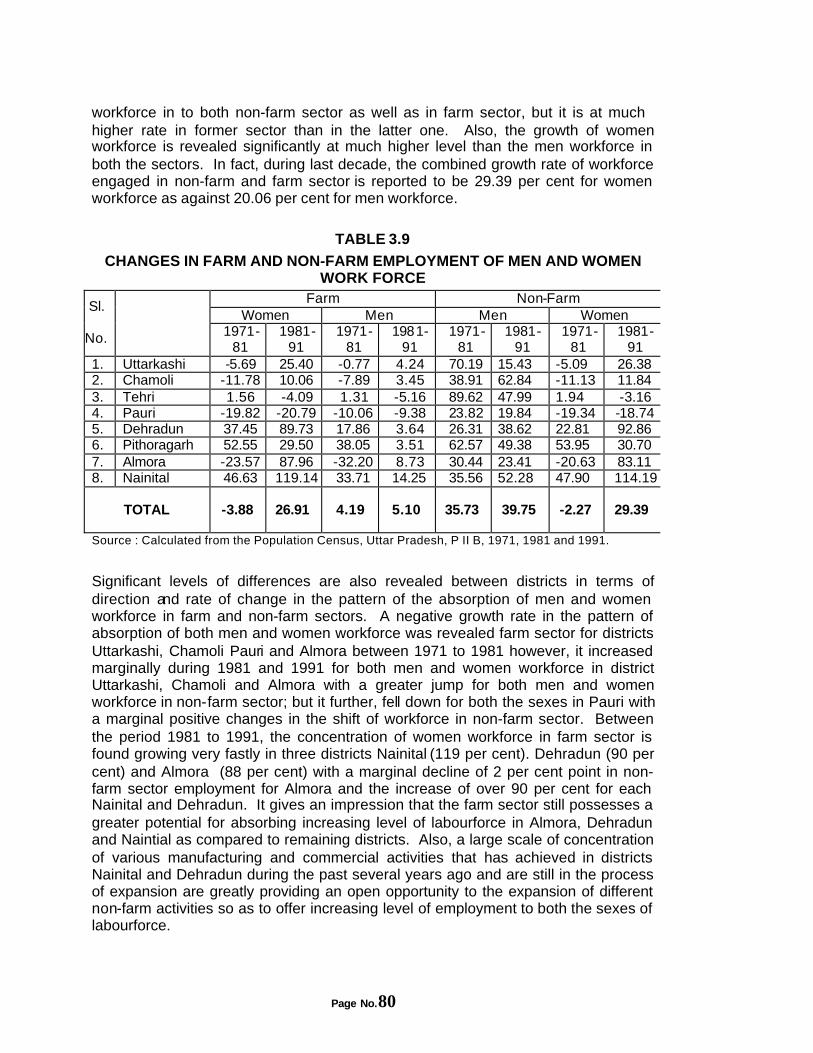
Page No.80
workforce in to both non-farm sector as well as in farm sector, but it is at much higher rate in former sector than in the latter one. Also, the growth of women workforce is revealed significantly at much higher level than the men workforce in both the sectors. In fact, during last decade, the combined growth rate of workforce engaged in non-farm and farm sector is reported to be 29.39 per cent for women workforce as against 20.06 per cent for men workforce.
TABLE 3.9
CHANGES IN FARM AND NON-FARM EMPLOYMENT OF MEN AND WOMEN WORK FORCE
Farm Non-Farm Women Men Men Women
Sl. No.
1971-
81 1981-
91 1971-
81 1981-
91 1971-
81 1981-
91 1971-
81 1981-
91 1. Uttarkashi -5.69 25.40 -0.77 4.24 70.19 15.43 -5.09 26.38 2. Chamoli -11.78 10.06 -7.89 3.45 38.91 62.84 -11.13 11.84 3. Tehri 1.56 -4.09 1.31 -5.16 89.62 47.99 1.94 -3.16 4. Pauri -19.82 -20.79 -10.06 -9.38 23.82 19.84 -19.34 -18.74 5. Dehradun 37.45 89.73 17.86 3.64 26.31 38.62 22.81 92.86 6. Pithoragarh 52.55 29.50 38.05 3.51 62.57 49.38 53.95 30.70 7. Almora -23.57 87.96 -32.20 8.73 30.44 23.41 -20.63 83.11 8. Nainital 46.63 119.14 33.71 14.25 35.56 52.28 47.90 114.19
TOTAL -3.88 26.91 4.19 5.10 35.73 39.75 -2.27 29.39
Source : Calculated from the Population Census, Uttar Pradesh, P II B, 1971, 1981 and 1991.
Significant levels of differences are also revealed between districts in terms of direction and rate of change in the pattern of the absorption of men and women workforce in farm and non-farm sectors. A negative growth rate in the pattern of absorption of both men and women workforce was revealed farm sector for districts Uttarkashi, Chamoli Pauri and Almora between 1971 to 1981 however, it increased marginally during 1981 and 1991 for both men and women workforce in district Uttarkashi, Chamoli and Almora with a greater jump for both men and women workforce in non-farm sector; but it further, fell down for both the sexes in Pauri with a marginal positive changes in the shift of workforce in non-farm sector. Between the period 1981 to 1991, the concentration of women workforce in farm sector is found growing very fastly in three districts Nainital (119 per cent). Dehradun (90 per cent) and Almora (88 per cent) with a marginal decline of 2 per cent point in non-farm sector employment for Almora and the increase of over 90 per cent for each Nainital and Dehradun. It gives an impression that the farm sector still possesses a greater potential for absorbing increasing level of labourforce in Almora, Dehradun and Naintial as compared to remaining districts. Also, a large scale of concentration of various manufacturing and commercial activities that has achieved in districts Nainital and Dehradun during the past several years ago and are still in the process of expansion are greatly providing an open opportunity to the expansion of different non-farm activities so as to offer increasing level of employment to both the sexes of labourforce.
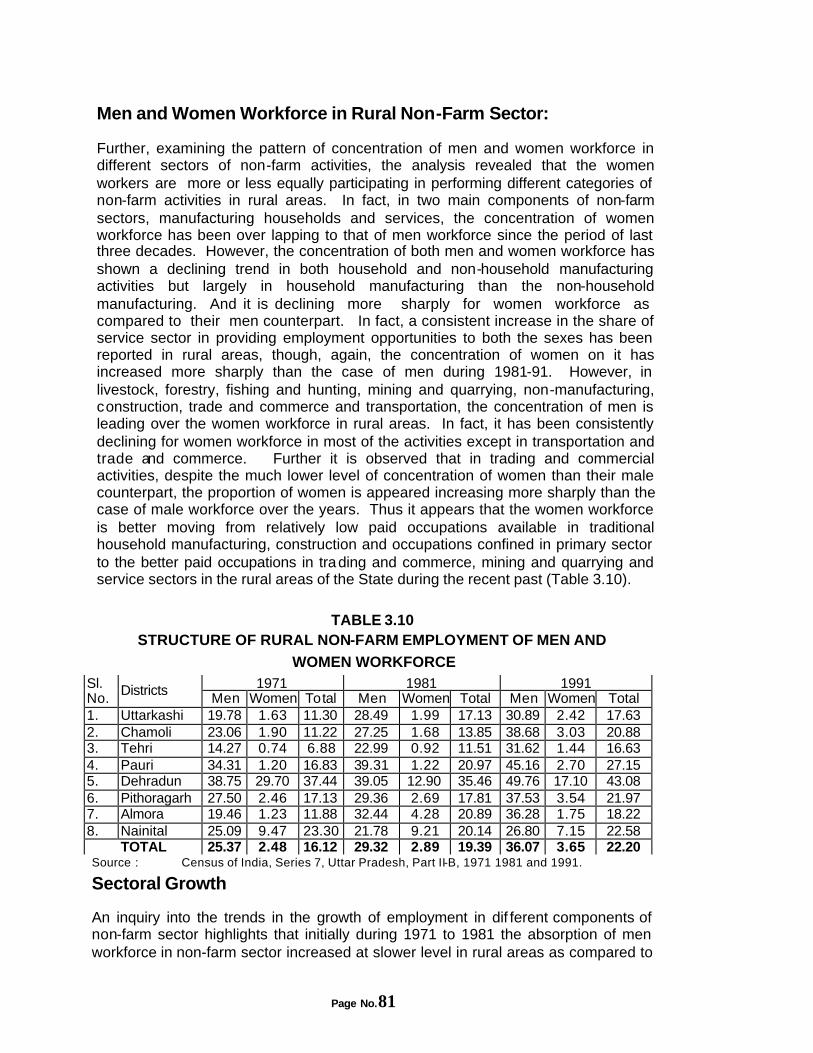
Page No.81
Men and Women Workforce in Rural Non-Farm Sector:
Further, examining the pattern of concentration of men and women workforce in different sectors of non-farm activities, the analysis revealed that the women workers are more or less equally participating in performing different categories of non-farm activities in rural areas. In fact, in two main components of non-farm sectors, manufacturing households and services, the concentration of women workforce has been over lapping to that of men workforce since the period of last three decades. However, the concentration of both men and women workforce has shown a declining trend in both household and non-household manufacturing activities but largely in household manufacturing than the non-household manufacturing. And it is declining more sharply for women workforce as compared to their men counterpart. In fact, a consistent increase in the share of service sector in providing employment opportunities to both the sexes has been reported in rural areas, though, again, the concentration of women on it has increased more sharply than the case of men during 1981-91. However, in livestock, forestry, fishing and hunting, mining and quarrying, non-manufacturing, construction, trade and commerce and transportation, the concentration of men is leading over the women workforce in rural areas. In fact, it has been consistently declining for women workforce in most of the activities except in transportation and trade and commerce. Further it is observed that in trading and commercial activities, despite the much lower level of concentration of women than their male counterpart, the proportion of women is appeared increasing more sharply than the case of male workforce over the years. Thus it appears that the women workforce is better moving from relatively low paid occupations available in traditional household manufacturing, construction and occupations confined in primary sector to the better paid occupations in trading and commerce, mining and quarrying and service sectors in the rural areas of the State during the recent past (Table 3.10).
TABLE 3.10 STRUCTURE OF RURAL NON-FARM EMPLOYMENT OF MEN AND
WOMEN WORKFORCE 1971 1981 1991 Sl.
No. Districts
Men Women Total Men Women Total Men Women Total 1. Uttarkashi 19.78 1.63 11.30 28.49 1.99 17.13 30.89 2.42 17.63 2. Chamoli 23.06 1.90 11.22 27.25 1.68 13.85 38.68 3.03 20.88 3. Tehri 14.27 0.74 6.88 22.99 0.92 11.51 31.62 1.44 16.63 4. Pauri 34.31 1.20 16.83 39.31 1.22 20.97 45.16 2.70 27.15 5. Dehradun 38.75 29.70 37.44 39.05 12.90 35.46 49.76 17.10 43.08 6. Pithoragarh 27.50 2.46 17.13 29.36 2.69 17.81 37.53 3.54 21.97 7. Almora 19.46 1.23 11.88 32.44 4.28 20.89 36.28 1.75 18.22 8. Nainital 25.09 9.47 23.30 21.78 9.21 20.14 26.80 7.15 22.58
TOTAL 25.37 2.48 16.12 29.32 2.89 19.39 36.07 3.65 22.20 Source : Census of India, Series 7, Uttar Pradesh, Part II-B, 1971 1981 and 1991.
Sectoral Growth
An inquiry into the trends in the growth of employment in dif ferent components of non-farm sector highlights that initially during 1971 to 1981 the absorption of men workforce in non-farm sector increased at slower level in rural areas as compared to
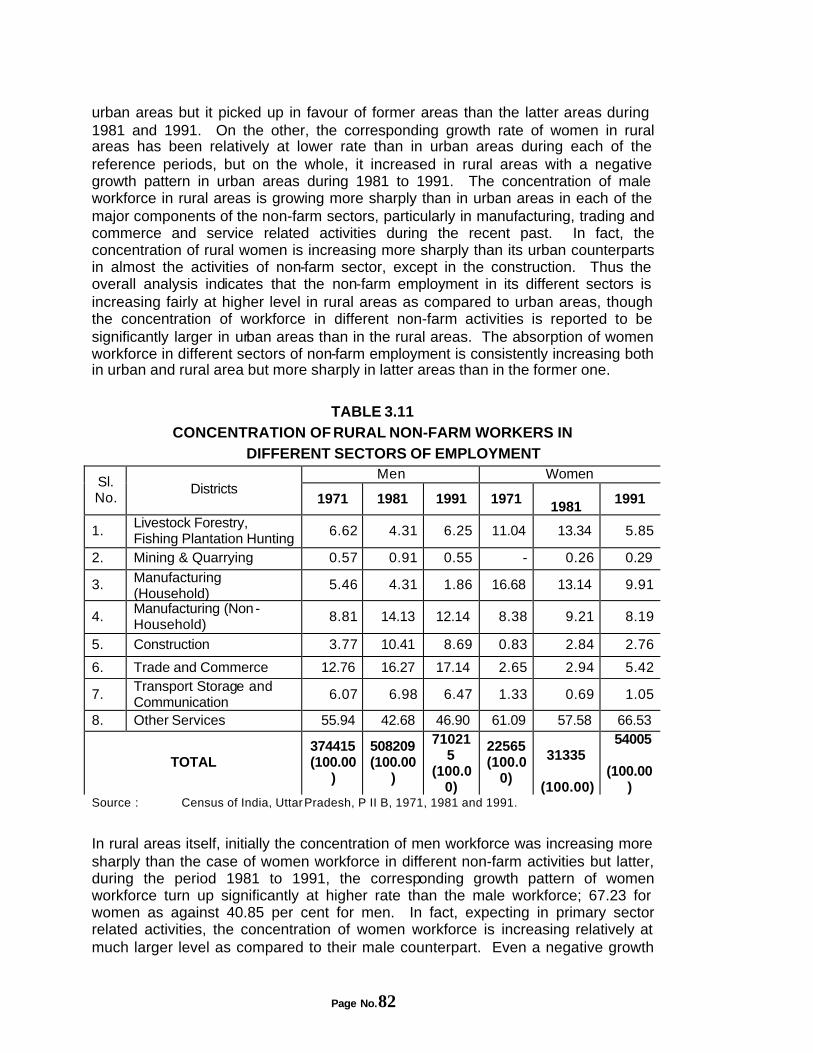
Page No.82
urban areas but it picked up in favour of former areas than the latter areas during 1981 and 1991. On the other, the corresponding growth rate of women in rural areas has been relatively at lower rate than in urban areas during each of the reference periods, but on the whole, it increased in rural areas with a negative growth pattern in urban areas during 1981 to 1991. The concentration of male workforce in rural areas is growing more sharply than in urban areas in each of the major components of the non-farm sectors, particularly in manufacturing, trading and commerce and service related activities during the recent past. In fact, the concentration of rural women is increasing more sharply than its urban counterparts in almost the activities of non-farm sector, except in the construction. Thus the overall analysis indicates that the non-farm employment in its different sectors is increasing fairly at higher level in rural areas as compared to urban areas, though the concentration of workforce in different non-farm activities is reported to be significantly larger in urban areas than in the rural areas. The absorption of women workforce in different sectors of non-farm employment is consistently increasing both in urban and rural area but more sharply in latter areas than in the former one.
TABLE 3.11
CONCENTRATION OF RURAL NON-FARM WORKERS IN DIFFERENT SECTORS OF EMPLOYMENT
Men Women Sl. No.
Districts 1971 1981 1991 1971
1981 1991
1. Livestock Forestry, Fishing Plantation Hunting
6.62 4.31 6.25 11.04 13.34 5.85
2. Mining & Quarrying 0.57 0.91 0.55 - 0.26 0.29
3. Manufacturing (Household)
5.46 4.31 1.86 16.68 13.14 9.91
4. Manufacturing (Non-Household)
8.81 14.13 12.14 8.38 9.21 8.19
5. Construction 3.77 10.41 8.69 0.83 2.84 2.76
6. Trade and Commerce 12.76 16.27 17.14 2.65 2.94 5.42
7. Transport Storage and Communication
6.07 6.98 6.47 1.33 0.69 1.05
8. Other Services 55.94 42.68 46.90 61.09 57.58 66.53
TOTAL 374415 (100.00
)
508209 (100.00
)
710215
(100.00)
22565 (100.0
0)
31335
(100.00)
54005
(100.00)
Source : Census of India, Uttar Pradesh, P II B, 1971, 1981 and 1991.
In rural areas itself, initially the concentration of men workforce was increasing more sharply than the case of women workforce in different non-farm activities but latter, during the period 1981 to 1991, the corresponding growth pattern of women workforce turn up significantly at higher rate than the male workforce; 67.23 for women as against 40.85 per cent for men. In fact, expecting in primary sector related activities, the concentration of women workforce is increasing relatively at much larger level as compared to their male counterpart. Even a negative growth
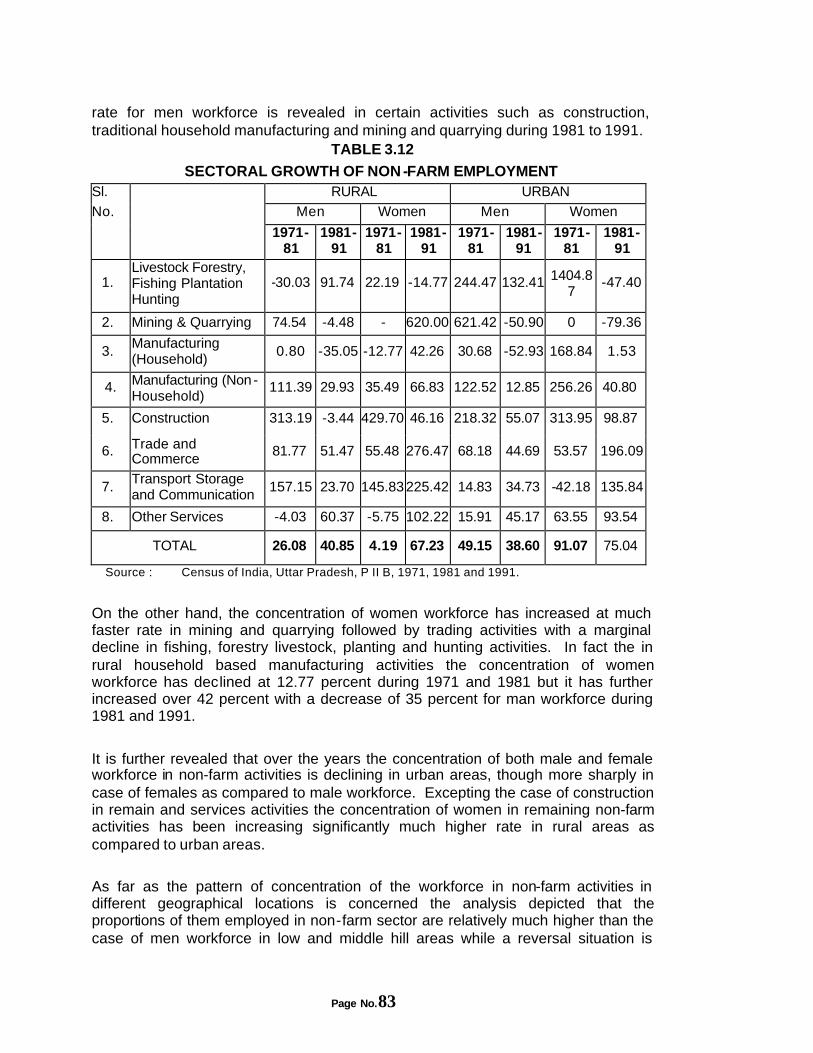
Page No.83
rate for men workforce is revealed in certain activities such as construction, traditional household manufacturing and mining and quarrying during 1981 to 1991.
TABLE 3.12
SECTORAL GROWTH OF NON -FARM EMPLOYMENT RURAL URBAN
Men Women Men Women
Sl.
No.
1971-81
1981-91
1971-81
1981-91
1971-81
1981-91
1971-81
1981-91
1. Livestock Forestry, Fishing Plantation Hunting
-30.03 91.74 22.19 -14.77 244.47 132.41 1404.87
-47.40
2. Mining & Quarrying 74.54 -4.48 - 620.00 621.42 -50.90 0 -79.36
3. Manufacturing (Household)
0.80 -35.05 -12.77 42.26 30.68 -52.93 168.84 1.53
4. Manufacturing (Non-Household)
111.39 29.93 35.49 66.83 122.52 12.85 256.26 40.80
5. Construction 313.19 -3.44 429.70 46.16 218.32 55.07 313.95 98.87
6. Trade and Commerce
81.77 51.47 55.48 276.47 68.18 44.69 53.57 196.09
7. Transport Storage and Communication
157.15 23.70 145.83 225.42 14.83 34.73 -42.18 135.84
8. Other Services -4.03 60.37 -5.75 102.22 15.91 45.17 63.55 93.54
TOTAL 26.08 40.85 4.19 67.23 49.15 38.60 91.07 75.04
Source : Census of India, Uttar Pradesh, P II B, 1971, 1981 and 1991.
On the other hand, the concentration of women workforce has increased at much faster rate in mining and quarrying followed by trading activities with a marginal decline in fishing, forestry livestock, planting and hunting activities. In fact the in rural household based manufacturing activities the concentration of women workforce has declined at 12.77 percent during 1971 and 1981 but it has further increased over 42 percent with a decrease of 35 percent for man workforce during 1981 and 1991.
It is further revealed that over the years the concentration of both male and female workforce in non-farm activities is declining in urban areas, though more sharply in case of females as compared to male workforce. Excepting the case of construction in remain and services activities the concentration of women in remaining non-farm activities has been increasing significantly much higher rate in rural areas as compared to urban areas.
As far as the pattern of concentration of the workforce in non-farm activities in different geographical locations is concerned the analysis depicted that the proportions of them employed in non-farm sector are relatively much higher than the case of men workforce in low and middle hill areas while a reversal situation is
Page No.84
emerging in high hill areas. However, in absolute terms, the men workforce is highly dominated in non-farm employment in each of the geographical locations (Table 5.7). The concentration of women workforce is largely seen in certain numbers of occupations confined in traditional household manufacturing livestock, forestry, plantation and services activities. However, a very small size of women workforce is formal employed in construction activities in low hill areas.
Page No.85
CHAPTER IV
PARTICIPATION OF HOUPARTICIPATION OF HOUSEHOLDS SEHOLDS AND FACTORS INFLUENCAND FACTORS INFLUENCING THE ING THE
EXPANSION OF NONEXPANSION OF NON--FARFARM SECTORM SECTOR A clear-cut prevailing differences in the process of overall economic development have universally been recognised directly or indirectly influencing to the extent of inequalities in the availability situation of different categories of employment opportunities among the districts, and within the districts in different geographical locations of the State. The districts Dehradun, Nainital and Haridwar, which almost the area fall in the plains, are acquiring a stable and conducive base for the development of both agricultural and industrial sector, more largely than the case of remaining districts. Thus, the increasing pace of industrial and agricultural development in these districts have positively been influencing the pace of development and expansion of various rural non-farm economic ac tivities in one hand and the creation of employment opportunities for different categories of skilled and un-skilled labourforce on the other.
We also found in the last chapters that the different categories and product groups of non-farm activities are highly confined in these three developed districts and are expanding further to a certain extent. As the consequences, these developed districts were commanding an overwhelming edge over the remaining hilly and mountainous districts in terms of the absorption of workforce in different components and product groups of non-farm sectors. In view of above pattern of differences prevailing in the availability situation and the possibility of creating additional employment opportunities among the purely hilly and non-hilly districts the necessity of planning for the expansion and development of different potential non-farm activities so as to create additional employment opportunities shall be more desirable in the latter categories of districts as compared to the former one. Evens within the hilly districts, significant level of differences are existing in the development potential of different categories and product groups of non-farm activities among different geographical locations. In this context, the present study proposed to examine the emerging situation and development potentials of different non-farm activities in general and the manufacturing activities in particular in different geographical locations of the purely hilly and mountainous areas of Uttaranchal. It has to be mentioned here that the foregoing analysis on examining the various issues of non-farm sector is purely
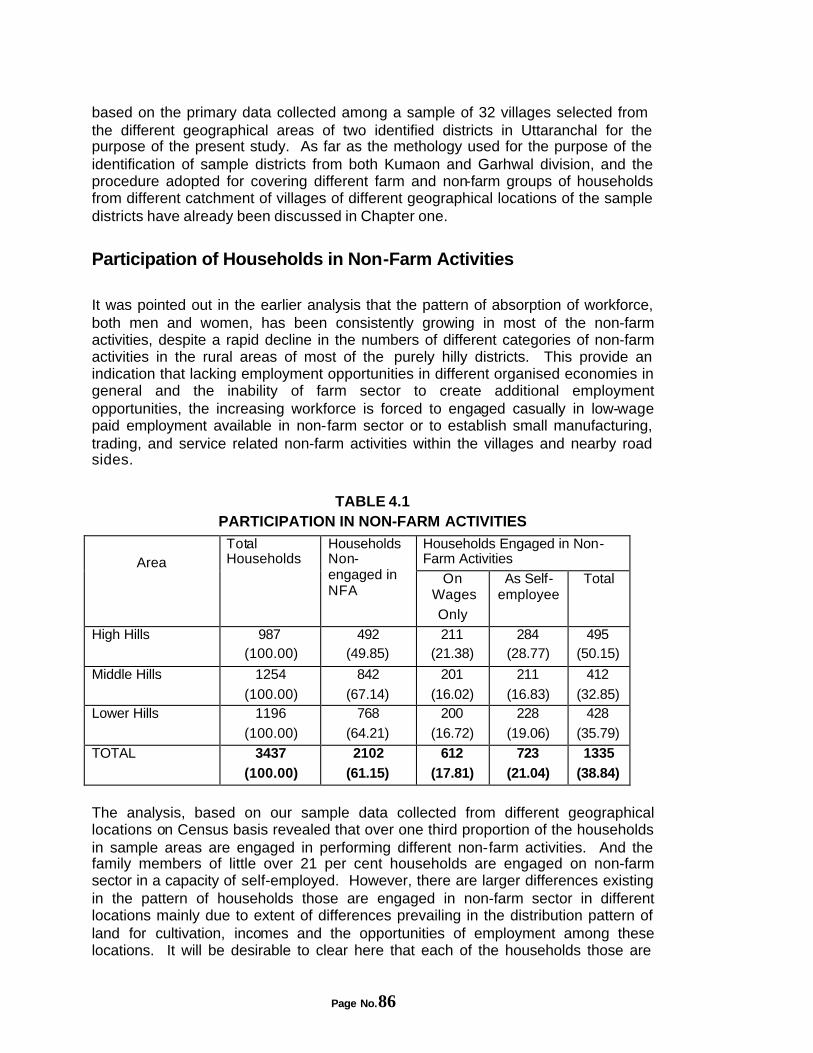
Page No.86
based on the primary data collected among a sample of 32 villages selected from the different geographical areas of two identified districts in Uttaranchal for the purpose of the present study. As far as the methology used for the purpose of the identification of sample districts from both Kumaon and Garhwal division, and the procedure adopted for covering different farm and non-farm groups of households from different catchment of villages of different geographical locations of the sample districts have already been discussed in Chapter one.
Participation of Households in Non-Farm Activities It was pointed out in the earlier analysis that the pattern of absorption of workforce, both men and women, has been consistently growing in most of the non-farm activities, despite a rapid decline in the numbers of different categories of non-farm activities in the rural areas of most of the purely hilly districts. This provide an indication that lacking employment opportunities in different organised economies in general and the inability of farm sector to create additional employment opportunities, the increasing workforce is forced to engaged casually in low-wage paid employment available in non-farm sector or to establish small manufacturing, trading, and service related non-farm activities within the villages and nearby road sides.
TABLE 4.1 PARTICIPATION IN NON-FARM ACTIVITIES
Households Engaged in Non-Farm Activities
Area
Total Households
Households Non-engaged in NFA
On Wages
Only
As Self-employee
Total
High Hills 987 (100.00)
492 (49.85)
211 (21.38)
284 (28.77)
495 (50.15)
Middle Hills 1254
(100.00)
842
(67.14)
201
(16.02)
211
(16.83)
412
(32.85) Lower Hills 1196
(100.00)
768
(64.21)
200
(16.72)
228
(19.06)
428
(35.79)
TOTAL 3437 (100.00)
2102 (61.15)
612 (17.81)
723 (21.04)
1335 (38.84)
The analysis, based on our sample data collected from different geographical locations on Census basis revealed that over one third proportion of the households in sample areas are engaged in performing different non-farm activities. And the family members of little over 21 per cent households are engaged on non-farm sector in a capacity of self-employed. However, there are larger differences existing in the pattern of households those are engaged in non-farm sector in different locations mainly due to extent of differences prevailing in the distribution pattern of land for cultivation, incomes and the opportunities of employment among these locations. It will be desirable to clear here that each of the households those are
Page No.87
covered for the purpose of our study are owning at least some parcel of land for cultivation, though a significant level of inequalities are found existing in the size of land available among them and the quality of land available in different locations. The cultivated land in low hill areas is mainly situated in valley areas and is recognised more fertile than it is available in middle and high hill areas as a result the land in former area is recognised more suitable for growing different traditional and high value commercial crops as compared to latter areas. Also the proportion of cultivated land area possessing the facility of irrigation is reported to be relatively much higher in low hill areas than in the remaining two locations. On the other, the high hill areas are possessing greater advantages and niche over the middle and low hill areas in terms of the availability of a variety of natural resources in abundance from the nearby forests which provide them a wider opportunity for establishing different types of natural resources based manufacturing activities in its various locations. While the households of low and middle hill areas have the opportunities for the expansion of various non-manufacturing activities because there has been a sufficient level of improvements in the expansion of road transport facilities and other infrastructural facilities in rural areas of these locations during the recent past. However, analysing the pattern of expansion of different non-farm activities in various locations of our sample areas, it depicted that the availability situation of different natural resources for the purpose of the establishment of various resources based non-farm activities are playing a more important role as compared to the accessibility situation to various infrastructural facilities especially road transportation and marketing facilities, in the expansion pattern of different non-farm activities. It is well evidenced by the fact that in high mountain areas the proportions of households engaged in non-farm activities both as self employed and as wage paid workers are reported significantly much higher than the case of low and middle hill areas. In fact, the proportion of households those have established different categories of non-farm activities are found highest significantly higher in hill areas (28.77 per cent) followed by low hill areas (19.06 per cent) and lowest in middle hill areas (16.83 per cent).
Reasons for Lacking Participation in the Expansion of Non-Farm Activities
Further we have attempted to examine about the reason behind the lacking, participation of both farming households and the household which family members are engaged in non-farm sector as wage labourers in the expansion and establishment of different non-farm activities in various locations. The poor economic background of a majority of the farming households is reported to be restricting them for the expansion and establishment of various non-farm activities in each of three locations of the State. A second majority of the farming households, largely in low hill areas (48 per cent), are although, deriving to establish non-farm activities but they lacked proper knowledge about the identification of potential and sustainable activities to be established in the respective location. Also, over 78 per cent of the farming households in low hill areas are not taking any initiative for favour
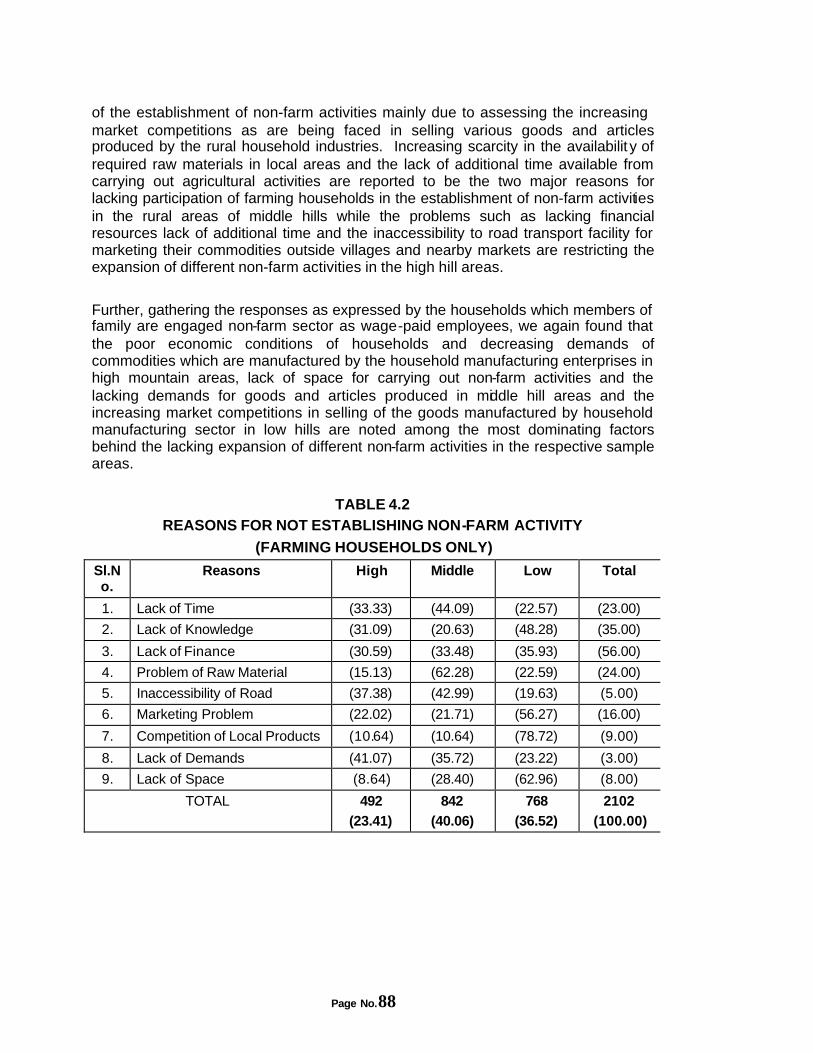
Page No.88
of the establishment of non-farm activities mainly due to assessing the increasing market competitions as are being faced in selling various goods and articles produced by the rural household industries. Increasing scarcity in the availabilit y of required raw materials in local areas and the lack of additional time available from carrying out agricultural activities are reported to be the two major reasons for lacking participation of farming households in the establishment of non-farm activities in the rural areas of middle hills while the problems such as lacking financial resources lack of additional time and the inaccessibility to road transport facility for marketing their commodities outside villages and nearby markets are restricting the expansion of different non-farm activities in the high hill areas.
Further, gathering the responses as expressed by the households which members of family are engaged non-farm sector as wage-paid employees, we again found that the poor economic conditions of households and decreasing demands of commodities which are manufactured by the household manufacturing enterprises in high mountain areas, lack of space for carrying out non-farm activities and the lacking demands for goods and articles produced in middle hill areas and the increasing market competitions in selling of the goods manufactured by household manufacturing sector in low hills are noted among the most dominating factors behind the lacking expansion of different non-farm activities in the respective sample areas.
TABLE 4.2
REASONS FOR NOT ESTABLISHING NON-FARM ACTIVITY
(FARMING HOUSEHOLDS ONLY)
Sl.No.
Reasons High Middle Low Total
1. Lack of Time (33.33) (44.09) (22.57) (23.00)
2. Lack of Knowledge (31.09) (20.63) (48.28) (35.00)
3. Lack of Finance (30.59) (33.48) (35.93) (56.00)
4. Problem of Raw Material (15.13) (62.28) (22.59) (24.00)
5. Inaccessibility of Road (37.38) (42.99) (19.63) (5.00)
6. Marketing Problem (22.02) (21.71) (56.27) (16.00)
7. Competition of Local Products (10.64) (10.64) (78.72) (9.00)
8. Lack of Demands (41.07) (35.72) (23.22) (3.00)
9. Lack of Space (8.64) (28.40) (62.96) (8.00)
TOTAL 492 (23.41)
842 (40.06)
768 (36.52)
2102 (100.00)
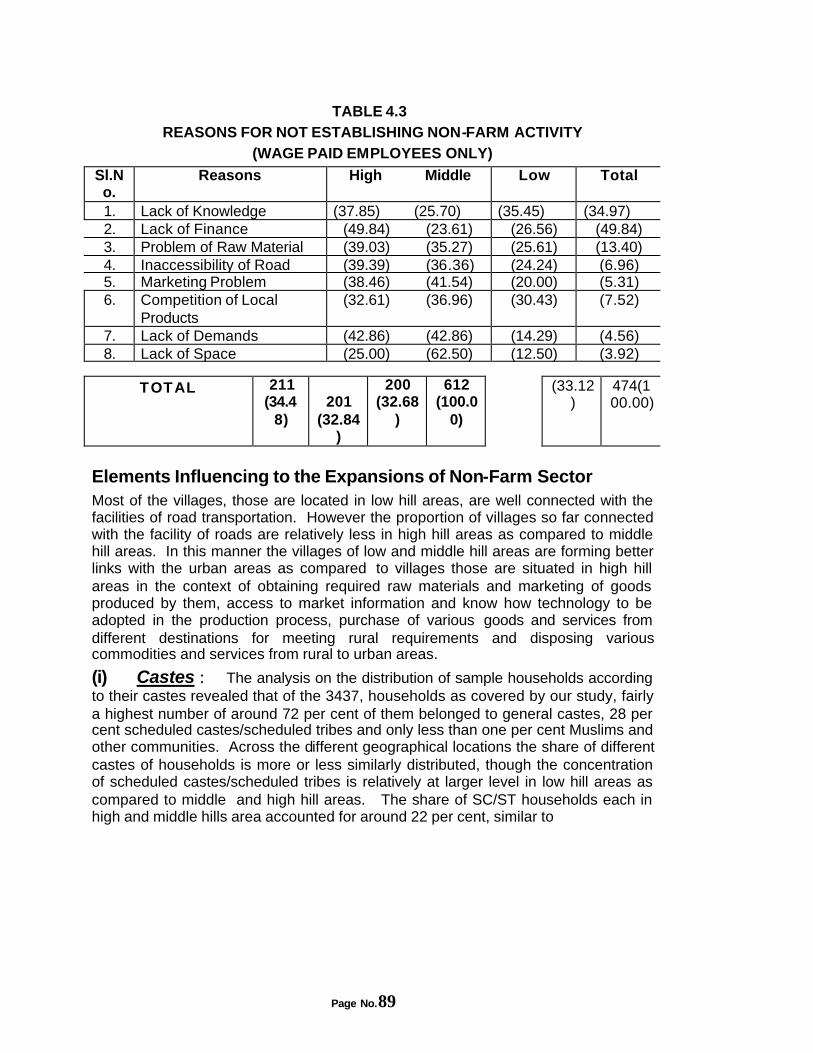
Page No.89
TABLE 4.3 REASONS FOR NOT ESTABLISHING NON-FARM ACTIVITY
(WAGE PAID EMPLOYEES ONLY)
Sl.No.
Reasons High Middle Low Total
1. Lack of Knowledge (37.85) (25.70) (35.45) (34.97) 2. Lack of Finance (49.84) (23.61) (26.56) (49.84) 3. Problem of Raw Material (39.03) (35.27) (25.61) (13.40) 4. Inaccessibility of Road (39.39) (36.36) (24.24) (6.96) 5. Marketing Problem (38.46) (41.54) (20.00) (5.31) 6. Competition of Local
Products (32.61) (36.96) (30.43) (7.52)
7. Lack of Demands (42.86) (42.86) (14.29) (4.56) 8. Lack of Space (25.00) (62.50) (12.50) (3.92)
TOTAL 211 (34.4
8)
201
(32.84)
200 (32.68
)
612 (100.0
0)
(33.12)
474(100.00)
Elements Influencing to the Expansions of Non-Farm Sector Most of the villages, those are located in low hill areas, are well connected with the facilities of road transportation. However the proportion of villages so far connected with the facility of roads are relatively less in high hill areas as compared to middle hill areas. In this manner the villages of low and middle hill areas are forming better links with the urban areas as compared to villages those are situated in high hill areas in the context of obtaining required raw materials and marketing of goods produced by them, access to market information and know how technology to be adopted in the production process, purchase of various goods and services from different destinations for meeting rural requirements and disposing various commodities and services from rural to urban areas.
(i) Castes : The analysis on the distribution of sample households according to their castes revealed that of the 3437, households as covered by our study, fairly a highest number of around 72 per cent of them belonged to general castes, 28 per cent scheduled castes/scheduled tribes and only less than one per cent Muslims and other communities. Across the different geographical locations the share of different castes of households is more or less similarly distributed, though the concentration of scheduled castes/scheduled tribes is relatively at larger level in low hill areas as compared to middle and high hill areas. The share of SC/ST households each in high and middle hills area accounted for around 22 per cent, similar to
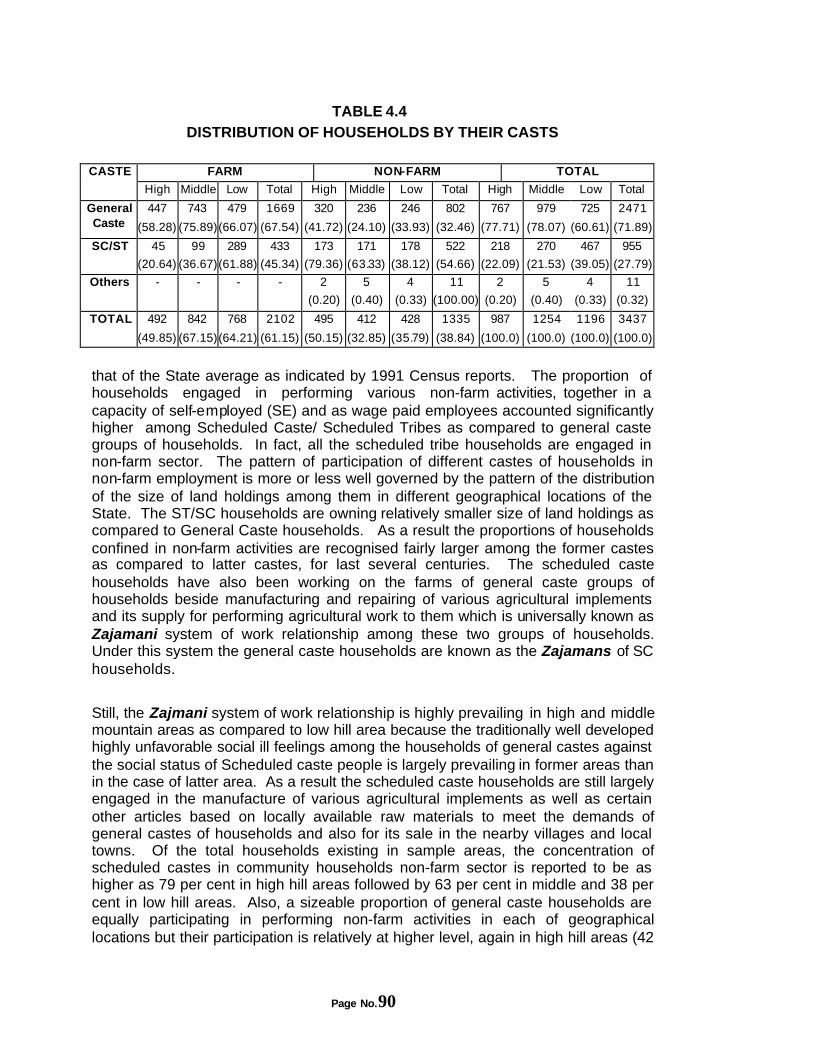
Page No.90
TABLE 4.4 DISTRIBUTION OF HOUSEHOLDS BY THEIR CASTS
FARM NON-FARM TOTAL CASTE
High Middle Low Total High Middle Low Total High Middle Low Total
General Caste
447
(58.28)
743
(75.89)
479
(66.07)
1669
(67.54)
320
(41.72)
236
(24.10)
246
(33.93)
802
(32.46)
767
(77.71)
979
(78.07)
725
(60.61)
2471
(71.89)
SC/ST 45
(20.64)
99
(36.67)
289
(61.88)
433
(45.34)
173
(79.36)
171
(63.33)
178
(38.12)
522
(54.66)
218
(22.09)
270
(21.53)
467
(39.05)
955
(27.79)
Others - - - - 2
(0.20)
5
(0.40)
4
(0.33)
11
(100.00)
2
(0.20)
5
(0.40)
4
(0.33)
11
(0.32)
TOTAL 492
(49.85)
842
(67.15)
768
(64.21)
2102
(61.15)
495
(50.15)
412
(32.85)
428
(35.79)
1335
(38.84)
987
(100.0)
1254
(100.0)
1196
(100.0)
3437
(100.0)
that of the State average as indicated by 1991 Census reports. The proportion of households engaged in performing various non-farm activities, together in a capacity of self-employed (SE) and as wage paid employees accounted significantly higher among Scheduled Caste/ Scheduled Tribes as compared to general caste groups of households. In fact, all the scheduled tribe households are engaged in non-farm sector. The pattern of participation of different castes of households in non-farm employment is more or less well governed by the pattern of the distribution of the size of land holdings among them in different geographical locations of the State. The ST/SC households are owning relatively smaller size of land holdings as compared to General Caste households. As a result the proportions of households confined in non-farm activities are recognised fairly larger among the former castes as compared to latter castes, for last several centuries. The scheduled caste households have also been working on the farms of general caste groups of households beside manufacturing and repairing of various agricultural implements and its supply for performing agricultural work to them which is universally known as Zajamani system of work relationship among these two groups of households. Under this system the general caste households are known as the Zajamans of SC households.
Still, the Zajmani system of work relationship is highly prevailing in high and middle mountain areas as compared to low hill area because the traditionally well developed highly unfavorable social ill feelings among the households of general castes against the social status of Scheduled caste people is largely prevailing in former areas than in the case of latter area. As a result the scheduled caste households are still largely engaged in the manufacture of various agricultural implements as well as certain other articles based on locally available raw materials to meet the demands of general castes of households and also for its sale in the nearby villages and local towns. Of the total households existing in sample areas, the concentration of scheduled castes in community households non-farm sector is reported to be as higher as 79 per cent in high hill areas followed by 63 per cent in middle and 38 per cent in low hill areas. Also, a sizeable proportion of general caste households are equally participating in performing non-farm activities in each of geographical locations but their participation is relatively at higher level, again in high hill areas (42
Page No.91
per cent) followed by low hill areas (33 per cent) and at lowest level in middle hill areas (24 per cent) indicating the fact that the overall participation of rural households in undertaking non-farm activities is fairly larger in high mountain areas and it narrowed down from middle to low altitude areas of the State. Thus, it may be quite evidently highlighted that the channel of traditional social relationship which was developed on the basis of castes and Zajmani system among different castes of households in the rural areas during last several generations ago, has been a very influencing instrument in favour of the expansion of non-farm sector in different locations of the State. Still, the process of developing various non-farm activities based on concerned social system is quite prevalent in almost the locations of the State but it has largely been varying among different areas mainly due to prevailing differences in the social system, culture and economic conditions of households in rural areas of different geographical locations. At the same time the changing structure of rural-urban continuum as visualised in relation to increasing supply of similar type of good quality commodities from urban to rural areas, as a result of improvements that has undertaken in the accessibility situation to road transport facilities has also been adversely effecting the expansion pattern of non-farm activities in different rural areas, particularly in middle and low hill areas. But, still, the traditionally developed rural social system has been quite largely playing a significant role in the expansion pattern of non-farm sector in the rural areas of high hills.
(ii) Size of Family: The average size of family in the sample areas consists of 5.25 members. However, the family size of households those are engaged in non-farm sector is recorded relatively larger as compared to farm households. Also, distributing the sample households according to different size groups of family members it appears that in the category of highest family size, comprising above 8 members, the proportion of households these are engaged in non-farm sector is significantly larger than the case of farm households. At the same time, in the lowest group of less than 5 family members the proportion of former category of households is again higher than the latter group of households, though the average size of family members of non-farm households is indicated to be fairly quite larger as compared to households those are not engaged in non-farm sector in each of the geographical locations. (Table 4.5), indicating the fact that availability of limited land for cultivation along with low per capita income available in large size of family is forcing its family workforce to participate increasingly in non-farm activities so as to contribute incomes for maintaining their livelihoods. However, the amount of income generated from agricultural activities seems to be sufficiently meeting the basic requirements of relatively lower size of families. As a result the participation of its family members in non-farm employment is noted relatively at lower proportion as compared to those belonging to higher size of families. Thus, we reach at the conclusion that, increase in the size of family is positively largely influencing the participation rate of its members in different non-farm activities so as to generate at least some amount of income for supplementing to the income originated from farm sector and other sources, such as remittances available from migrant family members.
TABLE 4.5
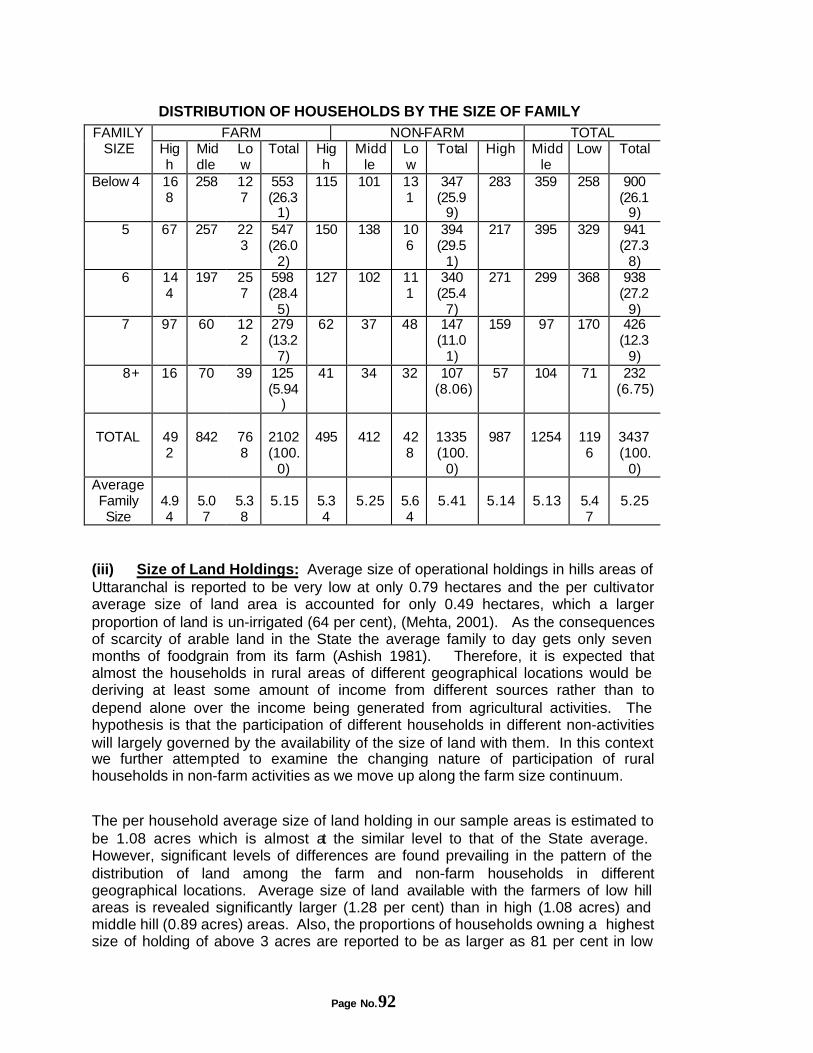
Page No.92
DISTRIBUTION OF HOUSEHOLDS BY THE SIZE OF FAMILY FARM NON-FARM TOTAL FAMILY
SIZE
High
Middle
Low
Total High
Middle
Low
Total High Middle
Low Total
Below 4 168
258 127
553 (26.3
1)
115 101 131
347 (25.9
9)
283 359 258 900 (26.1
9) 5 67 257 22
3 547 (26.0
2)
150 138 106
394 (29.5
1)
217 395 329 941 (27.3
8) 6 14
4 197 25
7 598 (28.4
5)
127 102 111
340 (25.4
7)
271 299 368 938 (27.2
9) 7 97 60 12
2 279 (13.2
7)
62 37 48 147 (11.0
1)
159 97 170 426 (12.3
9) 8+ 16 70 39 125
(5.94)
41 34 32 107 (8.06)
57 104 71 232 (6.75)
TOTAL
492
842
768
2102 (100.
0)
495
412
428
1335 (100.
0)
987
1254
1196
3437 (100.
0) Average Family Size
4.94
5.07
5.38
5.15
5.34
5.25
5.64
5.41
5.14
5.13
5.47
5.25
(iii) Size of Land Holdings: Average size of operational holdings in hills areas of Uttaranchal is reported to be very low at only 0.79 hectares and the per cultivator average size of land area is accounted for only 0.49 hectares, which a larger proportion of land is un-irrigated (64 per cent), (Mehta, 2001). As the consequences of scarcity of arable land in the State the average family to day gets only seven months of foodgrain from its farm (Ashish 1981). Therefore, it is expected that almost the households in rural areas of different geographical locations would be deriving at least some amount of income from different sources rather than to depend alone over the income being generated from agricultural activities. The hypothesis is that the participation of different households in different non-activities will largely governed by the availability of the size of land with them. In this context we further attempted to examine the changing nature of participation of rural households in non-farm activities as we move up along the farm size continuum.
The per household average size of land holding in our sample areas is estimated to be 1.08 acres which is almost at the similar level to that of the State average. However, significant levels of differences are found prevailing in the pattern of the distribution of land among the farm and non-farm households in different geographical locations. Average size of land available with the farmers of low hill areas is revealed significantly larger (1.28 per cent) than in high (1.08 acres) and middle hill (0.89 acres) areas. Also, the proportions of households owning a highest size of holding of above 3 acres are reported to be as larger as 81 per cent in low
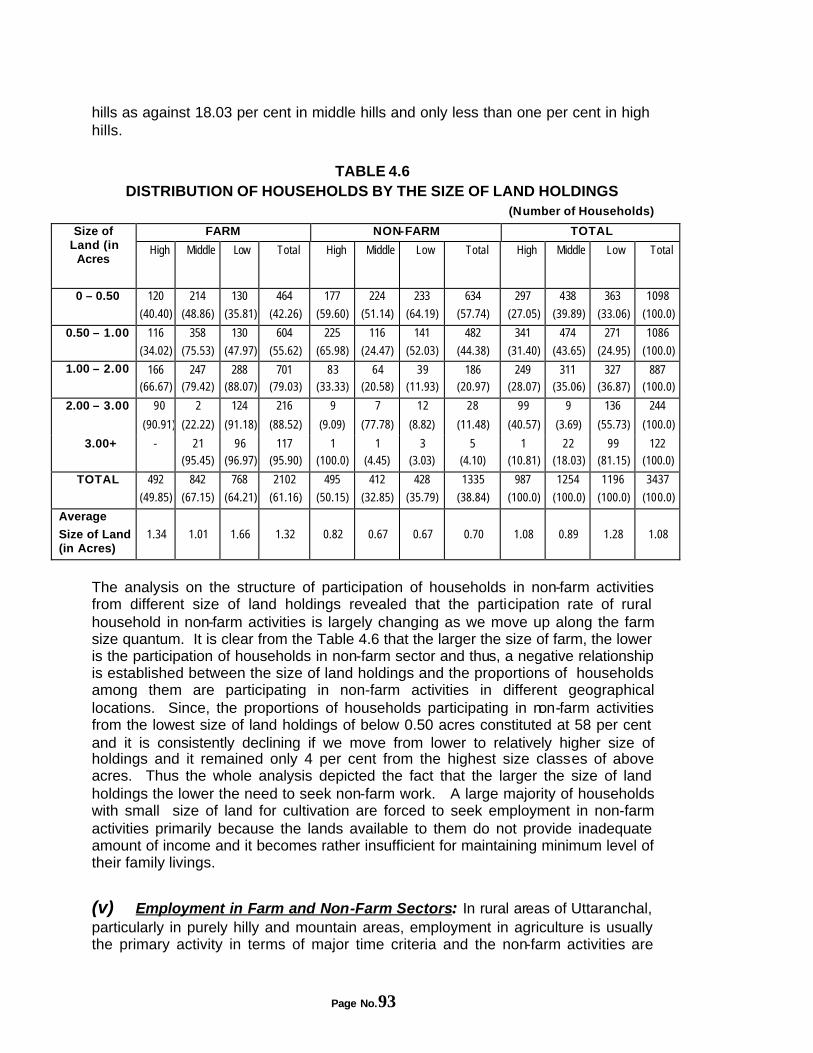
Page No.93
hills as against 18.03 per cent in middle hills and only less than one per cent in high hills.
TABLE 4.6 DISTRIBUTION OF HOUSEHOLDS BY THE SIZE OF LAND HOLDINGS
(Number of Households)
FARM NON-FARM TOTAL Size of Land (in
Acres
High Middle Low Total High Middle Low Total High Middle Low Total
0 – 0.50 120 (40.40)
214 (48.86)
130 (35.81)
464 (42.26)
177 (59.60)
224 (51.14)
233 (64.19)
634 (57.74)
297 (27.05)
438 (39.89)
363 (33.06)
1098 (100.0)
0.50 – 1.00 116 (34.02)
358 (75.53)
130 (47.97)
604 (55.62)
225 (65.98)
116 (24.47)
141 (52.03)
482 (44.38)
341 (31.40)
474 (43.65)
271 (24.95)
1086 (100.0)
1.00 – 2.00 166 (66.67)
247 (79.42)
288 (88.07)
701 (79.03)
83 (33.33)
64 (20.58)
39 (11.93)
186 (20.97)
249 (28.07)
311 (35.06)
327 (36.87)
887 (100.0)
2.00 – 3.00
90 (90.91)
2 (22.22)
124 (91.18)
216 (88.52)
9 (9.09)
7 (77.78)
12 (8.82)
28 (11.48)
99 (40.57)
9 (3.69)
136 (55.73)
244 (100.0)
3.00+ - 21 (95.45)
96 (96.97)
117 (95.90)
1 (100.0)
1 (4.45)
3 (3.03)
5 (4.10)
1 (10.81)
22 (18.03)
99 (81.15)
122 (100.0)
TOTAL 492 (49.85)
842 (67.15)
768 (64.21)
2102 (61.16)
495 (50.15)
412 (32.85)
428 (35.79)
1335 (38.84)
987 (100.0)
1254 (100.0)
1196 (100.0)
3437 (100.0)
Average
Size of Land (in Acres)
1.34
1.01
1.66
1.32
0.82
0.67
0.67
0.70
1.08
0.89
1.28
1.08
The analysis on the structure of participation of households in non-farm activities from different size of land holdings revealed that the participation rate of rural household in non-farm activities is largely changing as we move up along the farm size quantum. It is clear from the Table 4.6 that the larger the size of farm, the lower is the participation of households in non-farm sector and thus, a negative relationship is established between the size of land holdings and the proportions of households among them are participating in non-farm activities in different geographical locations. Since, the proportions of households participating in non-farm activities from the lowest size of land holdings of below 0.50 acres constituted at 58 per cent and it is consistently declining if we move from lower to relatively higher size of holdings and it remained only 4 per cent from the highest size classes of above acres. Thus the whole analysis depicted the fact that the larger the size of land holdings the lower the need to seek non-farm work. A large majority of households with small size of land for cultivation are forced to seek employment in non-farm activities primarily because the lands available to them do not provide inadequate amount of income and it becomes rather insufficient for maintaining minimum level of their family livings.
(v) Employment in Farm and Non-Farm Sectors: In rural areas of Uttaranchal, particularly in purely hilly and mountain areas, employment in agriculture is usually the primary activity in terms of major time criteria and the non-farm activities are
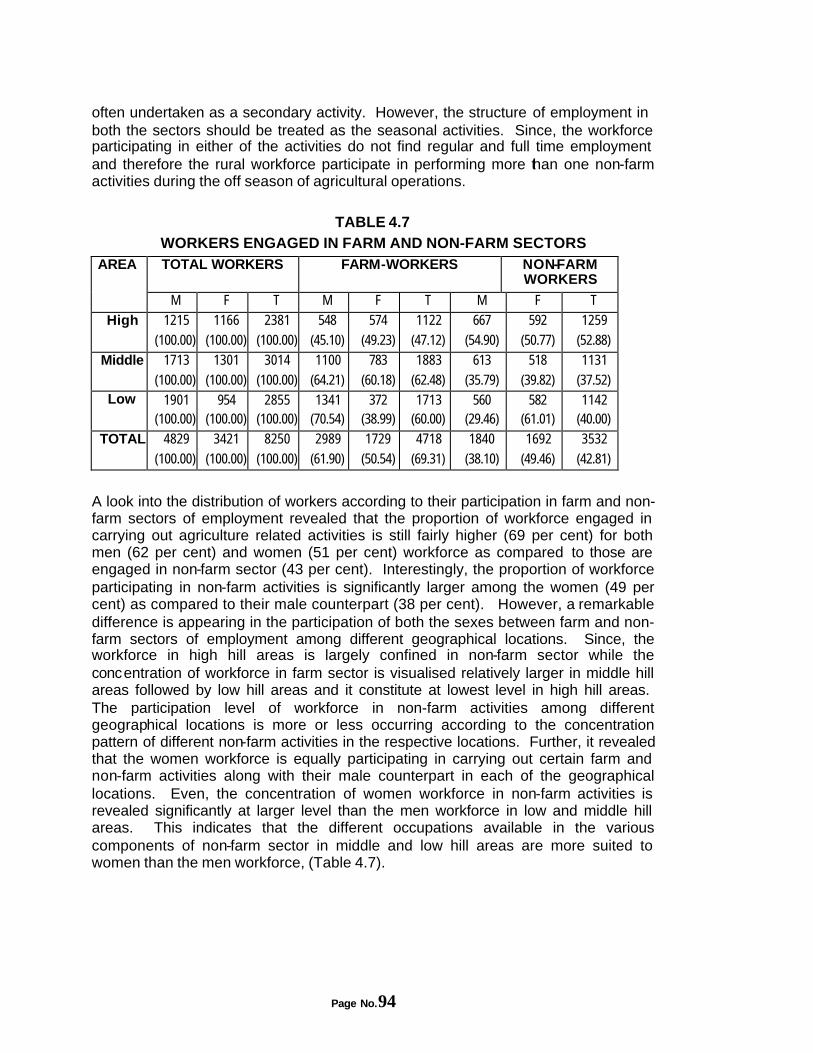
Page No.94
often undertaken as a secondary activity. However, the structure of employment in both the sectors should be treated as the seasonal activities. Since, the workforce participating in either of the activities do not find regular and full time employment and therefore the rural workforce participate in performing more than one non-farm activities during the off season of agricultural operations.
TABLE 4.7 WORKERS ENGAGED IN FARM AND NON-FARM SECTORS TOTAL WORKERS FARM-WORKERS NON-FARM
WORKERS AREA
M F T M F T M F T
High 1215 (100.00)
1166 (100.00)
2381 (100.00)
548 (45.10)
574 (49.23)
1122 (47.12)
667 (54.90)
592 (50.77)
1259 (52.88)
Middle 1713 (100.00)
1301 (100.00)
3014 (100.00)
1100 (64.21)
783 (60.18)
1883 (62.48)
613 (35.79)
518 (39.82)
1131 (37.52)
Low 1901 (100.00)
954 (100.00)
2855 (100.00)
1341 (70.54)
372 (38.99)
1713 (60.00)
560 (29.46)
582 (61.01)
1142 (40.00)
TOTAL 4829 (100.00)
3421 (100.00)
8250 (100.00)
2989 (61.90)
1729 (50.54)
4718 (69.31)
1840 (38.10)
1692 (49.46)
3532 (42.81)
A look into the distribution of workers according to their participation in farm and non-farm sectors of employment revealed that the proportion of workforce engaged in carrying out agriculture related activities is still fairly higher (69 per cent) for both men (62 per cent) and women (51 per cent) workforce as compared to those are engaged in non-farm sector (43 per cent). Interestingly, the proportion of workforce participating in non-farm activities is significantly larger among the women (49 per cent) as compared to their male counterpart (38 per cent). However, a remarkable difference is appearing in the participation of both the sexes between farm and non-farm sectors of employment among different geographical locations. Since, the workforce in high hill areas is largely confined in non-farm sector while the concentration of workforce in farm sector is visualised relatively larger in middle hill areas followed by low hill areas and it constitute at lowest level in high hill areas. The participation level of workforce in non-farm activities among different geographical locations is more or less occurring according to the concentration pattern of different non-farm activities in the respective locations. Further, it revealed that the women workforce is equally participating in carrying out certain farm and non-farm activities along with their male counterpart in each of the geographical locations. Even, the concentration of women workforce in non-farm activities is revealed significantly at larger level than the men workforce in low and middle hill areas. This indicates that the different occupations available in the various components of non-farm sector in middle and low hill areas are more suited to women than the men workforce, (Table 4.7).
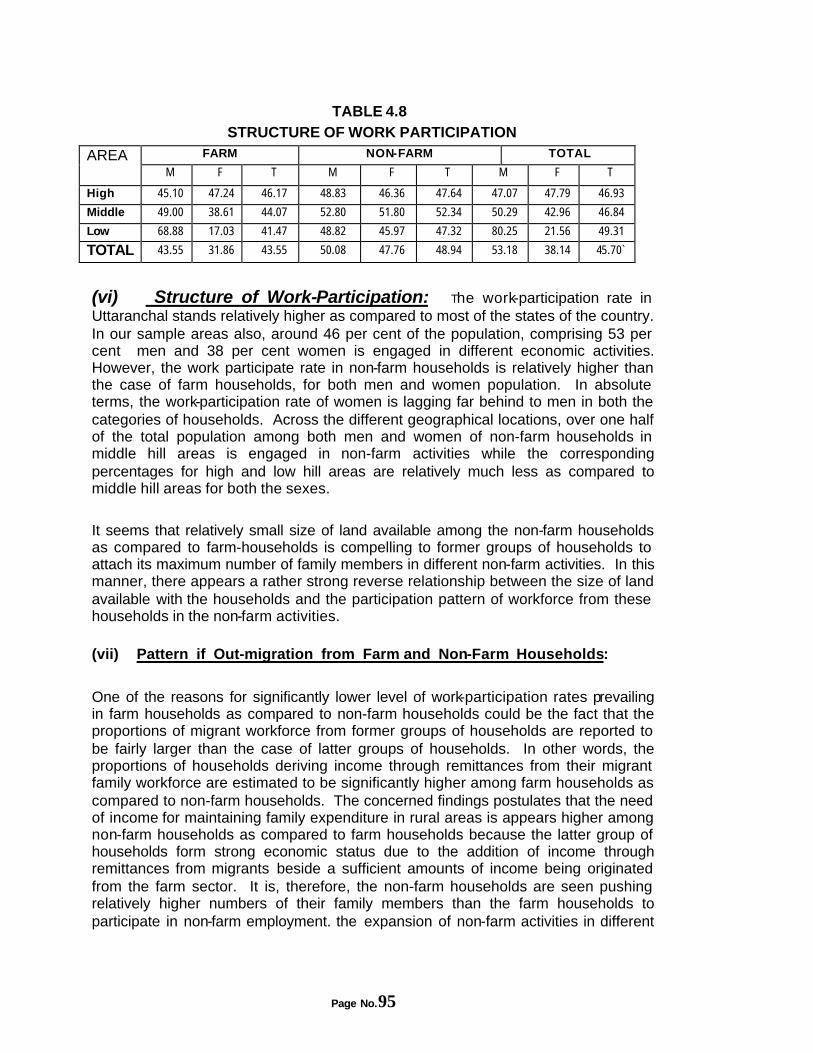
Page No.95
TABLE 4.8 STRUCTURE OF WORK PARTICIPATION
FARM NON-FARM TOTAL AREA M F T M F T M F T
High 45.10 47.24 46.17 48.83 46.36 47.64 47.07 47.79 46.93 Middle 49.00 38.61 44.07 52.80 51.80 52.34 50.29 42.96 46.84 Low 68.88 17.03 41.47 48.82 45.97 47.32 80.25 21.56 49.31
TOTAL 43.55 31.86 43.55 50.08 47.76 48.94 53.18 38.14 45.70 ̀
(vi) Structure of Work-Participation: The work-participation rate in Uttaranchal stands relatively higher as compared to most of the states of the country. In our sample areas also, around 46 per cent of the population, comprising 53 per cent men and 38 per cent women is engaged in different economic activities. However, the work participate rate in non-farm households is relatively higher than the case of farm households, for both men and women population. In absolute terms, the work-participation rate of women is lagging far behind to men in both the categories of households. Across the different geographical locations, over one half of the total population among both men and women of non-farm households in middle hill areas is engaged in non-farm activities while the corresponding percentages for high and low hill areas are relatively much less as compared to middle hill areas for both the sexes. It seems that relatively small size of land available among the non-farm households as compared to farm-households is compelling to former groups of households to attach its maximum number of family members in different non-farm activities. In this manner, there appears a rather strong reverse relationship between the size of land available with the households and the participation pattern of workforce from these households in the non-farm activities.
(vii) Pattern if Out-migration from Farm and Non-Farm Households:
One of the reasons for significantly lower level of work-participation rates prevailing in farm households as compared to non-farm households could be the fact that the proportions of migrant workforce from former groups of households are reported to be fairly larger than the case of latter groups of households. In other words, the proportions of households deriving income through remittances from their migrant family workforce are estimated to be significantly higher among farm households as compared to non-farm households. The concerned findings postulates that the need of income for maintaining family expenditure in rural areas is appears higher among non-farm households as compared to farm households because the latter group of households form strong economic status due to the addition of income through remittances from migrants beside a sufficient amounts of income being originated from the farm sector. It is, therefore, the non-farm households are seen pushing relatively higher numbers of their family members than the farm households to participate in non-farm employment. the expansion of non-farm activities in different
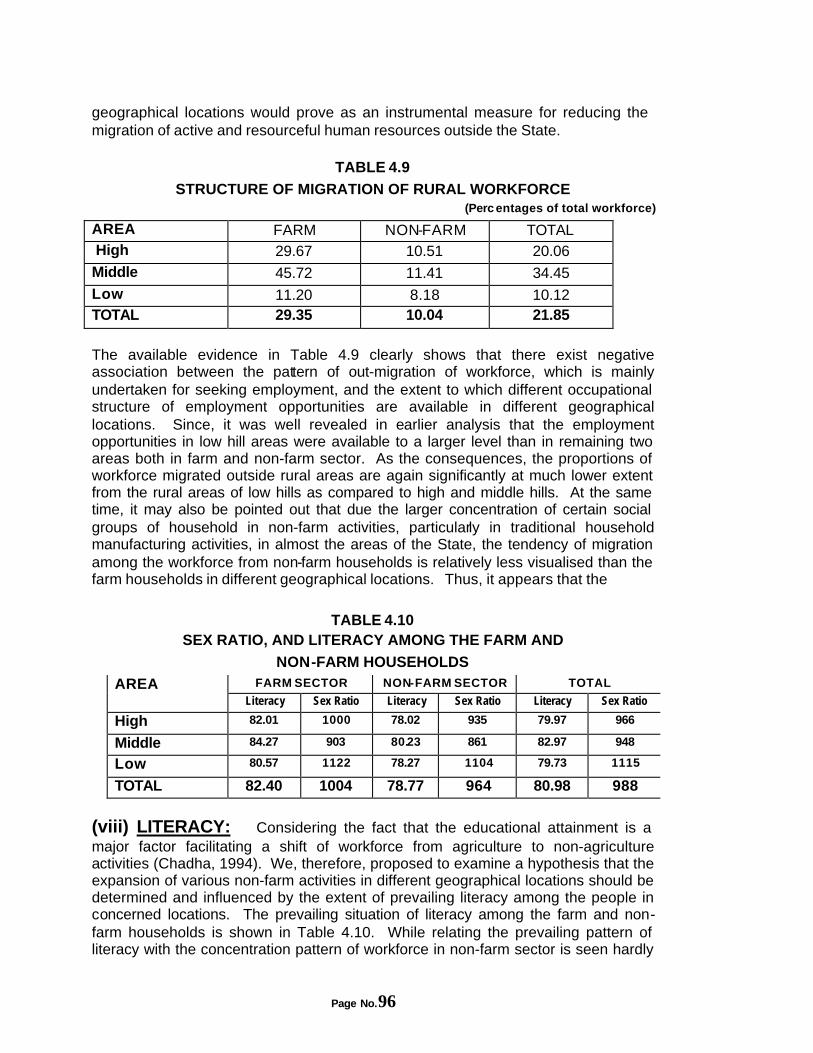
Page No.96
geographical locations would prove as an instrumental measure for reducing the migration of active and resourceful human resources outside the State.
TABLE 4.9
STRUCTURE OF MIGRATION OF RURAL WORKFORCE (Perc entages of total workforce)
AREA FARM NON-FARM TOTAL High 29.67 10.51 20.06 Middle 45.72 11.41 34.45 Low 11.20 8.18 10.12 TOTAL 29.35 10.04 21.85
The available evidence in Table 4.9 clearly shows that there exist negative association between the pattern of out-migration of workforce, which is mainly undertaken for seeking employment, and the extent to which different occupational structure of employment opportunities are available in different geographical locations. Since, it was well revealed in earlier analysis that the employment opportunities in low hill areas were available to a larger level than in remaining two areas both in farm and non-farm sector. As the consequences, the proportions of workforce migrated outside rural areas are again significantly at much lower extent from the rural areas of low hills as compared to high and middle hills. At the same time, it may also be pointed out that due the larger concentration of certain social groups of household in non-farm activities, particularly in traditional household manufacturing activities, in almost the areas of the State, the tendency of migration among the workforce from non-farm households is relatively less visualised than the farm households in different geographical locations. Thus, it appears that the
TABLE 4.10 SEX RATIO, AND LITERACY AMONG THE FARM AND
NON-FARM HOUSEHOLDS FARM SECTOR NON-FARM SECTOR TOTAL AREA
Literacy Sex Ratio Literacy Sex Ratio Literacy Sex Ratio
High 82.01 1000 78.02 935 79.97 966
Middle 84.27 903 80.23 861 82.97 948
Low 80.57 1122 78.27 1104 79.73 1115
TOTAL 82.40 1004 78.77 964 80.98 988
(viii) LITERACY: Considering the fact that the educational attainment is a major factor facilitating a shift of workforce from agriculture to non-agriculture activities (Chadha, 1994). We, therefore, proposed to examine a hypothesis that the expansion of various non-farm activities in different geographical locations should be determined and influenced by the extent of prevailing literacy among the people in concerned locations. The prevailing situation of literacy among the farm and non-farm households is shown in Table 4.10. While relating the prevailing pattern of literacy with the concentration pattern of workforce in non-farm sector is seen hardly
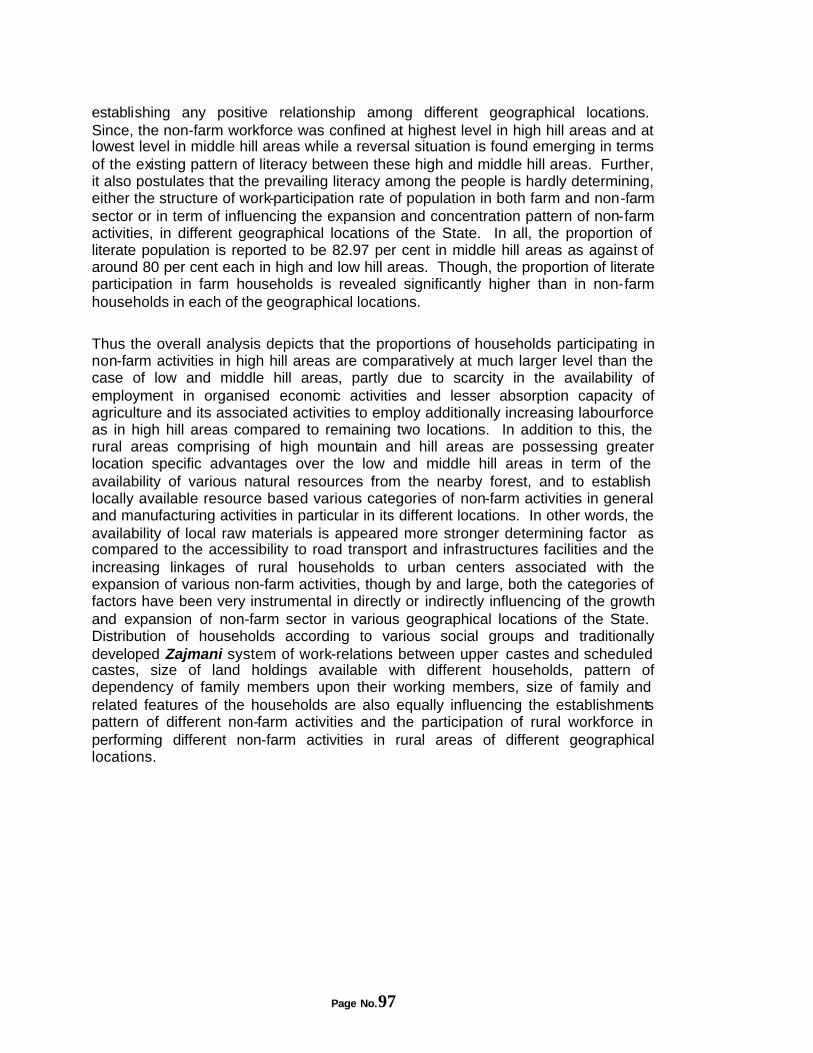
Page No.97
establishing any positive relationship among different geographical locations. Since, the non-farm workforce was confined at highest level in high hill areas and at lowest level in middle hill areas while a reversal situation is found emerging in terms of the existing pattern of literacy between these high and middle hill areas. Further, it also postulates that the prevailing literacy among the people is hardly determining, either the structure of work-participation rate of population in both farm and non-farm sector or in term of influencing the expansion and concentration pattern of non-farm activities, in different geographical locations of the State. In all, the proportion of literate population is reported to be 82.97 per cent in middle hill areas as against of around 80 per cent each in high and low hill areas. Though, the proportion of literate participation in farm households is revealed significantly higher than in non-farm households in each of the geographical locations. Thus the overall analysis depicts that the proportions of households participating in non-farm activities in high hill areas are comparatively at much larger level than the case of low and middle hill areas, partly due to scarcity in the availability of employment in organised economic activities and lesser absorption capacity of agriculture and its associated activities to employ additionally increasing labourforce as in high hill areas compared to remaining two locations. In addition to this, the rural areas comprising of high mountain and hill areas are possessing greater location specific advantages over the low and middle hill areas in term of the availability of various natural resources from the nearby forest, and to establish locally available resource based various categories of non-farm activities in general and manufacturing activities in particular in its different locations. In other words, the availability of local raw materials is appeared more stronger determining factor as compared to the accessibility to road transport and infrastructures facilities and the increasing linkages of rural households to urban centers associated with the expansion of various non-farm activities, though by and large, both the categories of factors have been very instrumental in directly or indirectly influencing of the growth and expansion of non-farm sector in various geographical locations of the State. Distribution of households according to various social groups and traditionally developed Zajmani system of work-relations between upper castes and scheduled castes, size of land holdings available with different households, pattern of dependency of family members upon their working members, size of family and related features of the households are also equally influencing the establishments pattern of different non-farm activities and the participation of rural workforce in performing different non-farm activities in rural areas of different geographical locations.
Page No.98
CHAPTER VCHAPTER V
CONTRIBUTION IN THE CONTRIBUTION IN THE RURAL ECONOMYRURAL ECONOMY
The non-farm sector is performing an important role in the overall economy of the state in term of both providing employment opportunity to different categories of skilled and unskilled labourforce and contributing in the incomes of both farm and non-farm households. In fact, the contribution of non-farm sector has been consistently increasing in the creation of additional employment and the generation of income in different geographical locations over the years due to decreasing man-land ratio and an overall decline in the net cultivated land area, beside a considerable decline in per capita net domestic production being originated from agriculture and related activities. The consequences of these all-adverse performances of farming economies have universally been well recognised in terms of a significant decline in the concentration of workforce in agriculture and allied activities and its subsequent shift in non-farm sector during the recent past.
However, the contribution of various components of non-farm sector in general and its manufacturing segment in particular in the process of overall development, especially in terms of creating employment and the generation of income, has been realised at much below the level of its actual expectations in different areas. This largely due to inadequate initiatives undertaken for the exploitation of various advantages and niche based opportunities that are available in favour of developing variety of non-farm activities in different locations of the state under the past-development plans. Besides, several fundamental problems as experienced in terms of lacking improvements in the production technologies, accessibility to the facilities of road transports and required infrastructures, continuing concentration towards the production of limited numbers of commodities based on fulfilling only the local demands for last several centuries, lacking development in the quality and designs of products and related features were also been equally responsible factors behind the slow growth of a numbers of non-farm activities and its lesser extent of contribution in the rural economy of the state. It can be obviously seen that almost the rural households, especially in hilly and mountainous areas of the state, are obtaining a sizeable amount of income from other than agricultural activities, either through engaging its family workforce in different non-farm occupations within rural areas itself or motivating them to migrate outside rural areas in near by towns so as to supplement in the incomes of the households through sending remittances. The real situation which presently emerging is that although almost the households are engaged in the agricultural activities therefore the farming is emphasized as the prime occupation of the workforce of almost the households in rural areas of the state. But the non-

Page No.99
agricultural activities are seen providing significantly much higher amount of income as compared to income originated from agricultural activities in the total incomes of the households. Distribution of Income : A review of the pattern of income distribution among the households representing different geographical locations is presented in Table 5.1 There are significant differences in both per household and per capita income distribution between the farm and non-farm households and also, between the rural households of different locations. The per household income is estimated to be Rs. 18482, and it varied highest from Rs.19.91 thousand to lowest at Rs.17.30 thousand between the households located in middle and low hill areas respectively. The PCI accounted for Rs.3519, which again stands relatively higher in middle hill areas as compared to high and low hill areas. Also, the per household as well as per capita income of non-farm households is estimated to be significantly much higher than the case of farm households in each of geographical locations. This mainly due to the obvious fact that, first, the farming households are deriving income from only two sources namely; farm sector and as remittances from the migrants family workforce while the non-farming households are noted deriving a sizeable amount of earnings from the various categories of non-farm activities, besides from agricultural activities and through remittances from the migrant family members. Also, the proportion of workforce engaged in performing different economic activities in rural areas was revealed rather higher among the non-farm households as compared to farm households, though a marginal differences in favour of latter groups of households was revealed in the proportion of migrants to total workforce.
TABLE 5.1
PATTERN OF INCOME DISTRIBUTION AMONG FARM AND NON-FARM HOUSEHOLDS
Farm Non-farm Total Income
group (year) H i g h
i d d l L o w
o t a l H i g h
i d d l L o w
o t a l H i g h
i d d l L o w
o t a l
<10000 209 (42.48)
367 (43.59)
212 (27.60)
788 (37.49)
61 (12.32)
37 (8.98)
27 (6.31)
125 (9.36)
270 (27.36)
404 (32.22)
239 (19.98)
913 (26.51)
10000-20000 182 (36.99)
257 (30.52)
375 (48.83)
814 (38.73)
297 (60.00)
234 (56.80)
260 (60.75)
791 (59.25)
479 (48.53)
491 (39.15)
635 (53.09)
1605 (46.70)
20000-30000 78 (15.85)
75 (8.91)
117 (15.23)
270 (12.84)
80 (16.16)
63 (15.29)
83 (19.39)
226 (16.93)
158 (16.01)
138 (11.00)
200 (16.72)
496 (14.43)
30000-40000 8 (1.63)
77 (9.14)
17 (2.21)
102 (4.85)
19 (3.84)
28 (6.80)
24 (5.61)
71 (5.32)
27 (2.74)
105 (8.37)
41 (3.43)
173 (5.03)
40000-50000 4 (0.81
65 (7.72)
36 (4.69)
105 (5.00)
13 (2.63)
14 (3.40)
10 (2.33)
37 (21.77)
17 (1.72)
79 (6.30)
46 (3.85)
142 (4.13)
50000+ 11 (2.24)
1 (0.12)
11 (1.42)
23 (1.09)
25 (5.05)
36 (8.74)
24 (5.61)
85 (6.37)
36 (3.65)
37 (2.95)
35 (2.92)
108 (3.14)
Total 492 (100.00)
842 (100.00)
786 (100.00)
2102 (100.00)
495 (100.00)
412 (100.00)
428 (100.00)
1335 (100.00)
987 (100.00
1254 (100.00
1196 (100.00)
3437 (100.00)
Average Income (Rs.) per Household
16380
18122
13165
15903
19800
23569
24726
22542
18095
19912
17302
18482
Per capita income Rs.
3316
3571
2447
3085
3708
4494
4386
4170
3521
3881
3162
3519
Distribution of households according to different income groups revealed that a highest proportions of the households of over 73 per cent, comprising 76 per cent
Page No.100
among the farm households and 64 per cent among the non-farm households are confined in lowest income group range of below Rs.2000. And only little over than 7 per cent of the households are in the highest income group of above Rs.4, 000 though, the proportion of households in respective income range are relatively higher in middle hill areas and in particular among the non-farm households. Moreover, it appears that the inequality in the pattern of income distribution among the households is largely prevailing between different locations and also between the households those are engaged in farm and non-farm activities. But the non-farm households are better placed as compared to farm households in terms of their economic situation is concerned and the extent of inequalities emerging in the pattern of income distribution among the households in different locations.
Household Income by Source : Further in Table 5.2 we have estimated the per households average net amount of income as derived by them from different farm and non-farm activities and from other sources, such as remittances from the migrants family members and the income received in the form of pension by the retired family members during the reference period of the present study. The farm households are seen deriving certain amount of income from only the limited sources such as farming activities, pension and remittances from migrant family members. However, the sources of income of non-farm households are significantly much higher than the farm households. The working family members of non-farm households do engage in numbers of non-farm activities in the capacity of self-employed as well as wage paid casual workers, besides working in farming activities while the working family members of farm households only concentrate in the activities of own farms rather than to join in non-farm activities even during the off season of the agricultural operations. In fact, they prefer to migrate outside for seeking employment rather than to participate in locally available wage-paid employment, even the earning and the status of occupations available in rural areas are comparatively better than as are available at the places of migration, partly because of a largely developed inferiority complexes among themselves against the joining of certain categories of wage-paid employment in rural areas and partly due to the fact that most of the rural non-farm activities have been traditionally performed by only a particular social groups of households for the past several generations.
The income of a household consisted of the earnings summed over the diverse sources of employment plus rent payment received, if any, for leasing out land and other assets plus all transfer payments (e.g. pensions, gifts and remittances received). (Chadha 1994). The amount of income derived by the households as remittances from migrant workforce and as pension by the retired family members in favour of services they rendered in the past could be included as a part of non-farm income. Since, each of the migrant workforce those are contributing to the household incomes through remittances are employed in urban areas, largely in defence and Government services, and the retired personal those are receiving pension were earlier mostly migrants and were working with the defense and Government Services. Practically the amount of pension, which they are currently deriving, is the outcome of services they rendered for non-farm sector. In this manner the income earned through pension and remittances is the income derived
Page No.101
from urban non-farm sector and thus, this income could also be treated as a part of non-farm income.
According to our estimates the per household annual average amount of income in the sample areas accounted for Rs.18.48 thousand. And the economic condition of households located in middle hill areas seems relatively more sound as compared to those located in high and low hill areas. The actual amount of income being generated from agricultural and its associated activities is appeared relatively much less as compared to non-farm sector in each of the geographical locations. Per household income from farm sector is estimated to be Rs.6016 as against Rs.12376 from non-farm sector and it varied largely among the rural areas of different geographical locations.
Contribution of Non-farm Income in the Sample Area: Since every household is possessing at least some cultivated land. As a result, each of the households in Uttaranchal is engaged in different agricultural operations and is generating at least some amounts of income from it. Hence, the income estimated for farm sector is the combined income of both farm and non-farm households. In sample areas, the contribution of income originated from non-farm sector in the total income derived from different sources accounted for around 76 per cent though it varied largely among different locations. Since in the proceeding analysis the non-farm activities were found highly concentrated in rural areas of high hills followed by low hills and at lowest level in middle hills. We further finds that the contribution of income generated from the non-farm sector is more or less originated at a similar pattern as revealed in terms of the concentration of non-farm activities among different geographical locations. The proportion of income derived from farm sector is, however, significantly at highest level in rural areas of low hill areas as compared to middle and high hill areas, though its share follows at much lower level than the case of non-farm sector in each of the geographical locations. The share of earnings that the household deriving in the form of pension of their family members and as remittances from the migrant workforce has also been noted very high in different geographical locations. However, the combined contribution of pension and remittances in the total income generated in rural areas of middle hill areas is found fairly higher (42 per cent) as compared to high (36 per cent) and low (22 per cent) hill areas.
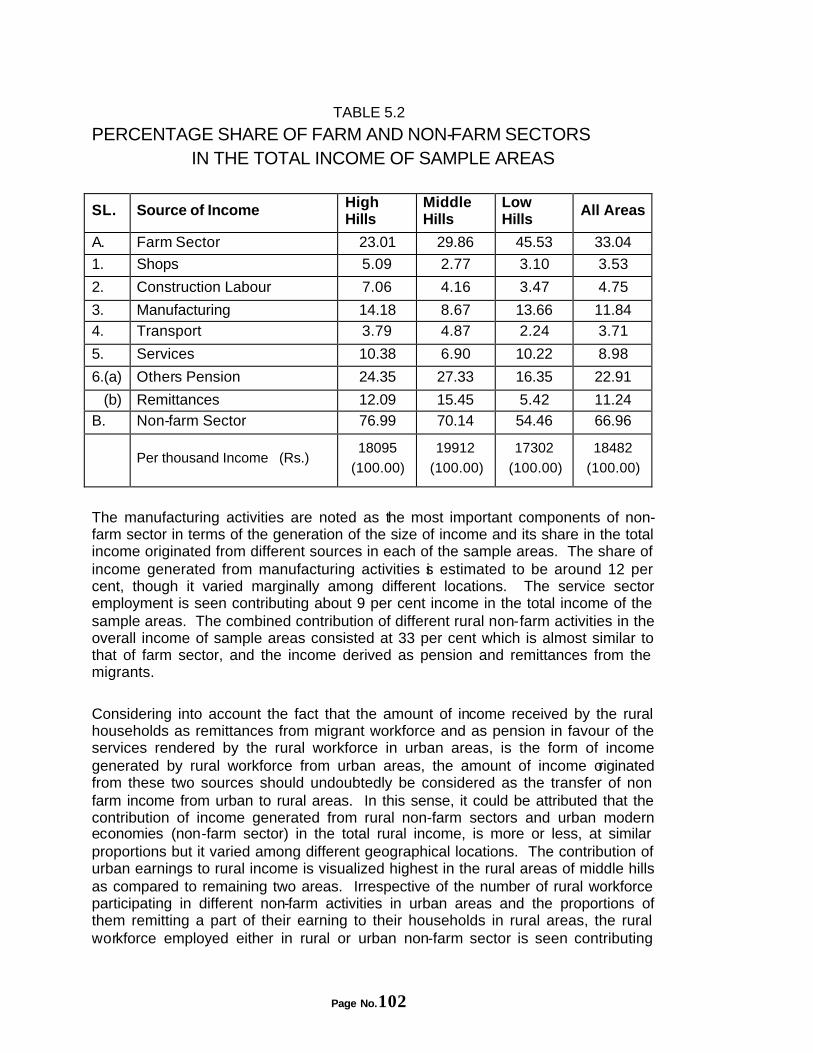
Page No.102
TABLE 5.2
PERCENTAGE SHARE OF FARM AND NON-FARM SECTORS IN THE TOTAL INCOME OF SAMPLE AREAS
SL. Source of Income High Hills
Middle Hills
Low Hills
All Areas
A. Farm Sector 23.01 29.86 45.53 33.04
1. Shops 5.09 2.77 3.10 3.53
2. Construction Labour 7.06 4.16 3.47 4.75
3. Manufacturing 14.18 8.67 13.66 11.84 4. Transport 3.79 4.87 2.24 3.71
5. Services 10.38 6.90 10.22 8.98
6.(a) Others Pension 24.35 27.33 16.35 22.91
(b) Remittances 12.09 15.45 5.42 11.24 B. Non-farm Sector 76.99 70.14 54.46 66.96
Per thousand Income (Rs.) 18095
(100.00)
19912
(100.00)
17302
(100.00)
18482
(100.00)
The manufacturing activities are noted as the most important components of non-farm sector in terms of the generation of the size of income and its share in the total income originated from different sources in each of the sample areas. The share of income generated from manufacturing activities is estimated to be around 12 per cent, though it varied marginally among different locations. The service sector employment is seen contributing about 9 per cent income in the total income of the sample areas. The combined contribution of different rural non-farm activities in the overall income of sample areas consisted at 33 per cent which is almost similar to that of farm sector, and the income derived as pension and remittances from the migrants. Considering into account the fact that the amount of income received by the rural households as remittances from migrant workforce and as pension in favour of the services rendered by the rural workforce in urban areas, is the form of income generated by rural workforce from urban areas, the amount of income originated from these two sources should undoubtedly be considered as the transfer of non farm income from urban to rural areas. In this sense, it could be attributed that the contribution of income generated from rural non-farm sectors and urban modern economies (non-farm sector) in the total rural income, is more or less, at similar proportions but it varied among different geographical locations. The contribution of urban earnings to rural income is visualized highest in the rural areas of middle hills as compared to remaining two areas. Irrespective of the number of rural workforce participating in different non-farm activities in urban areas and the proportions of them remitting a part of their earning to their households in rural areas, the rural workforce employed either in rural or urban non-farm sector is seen contributing
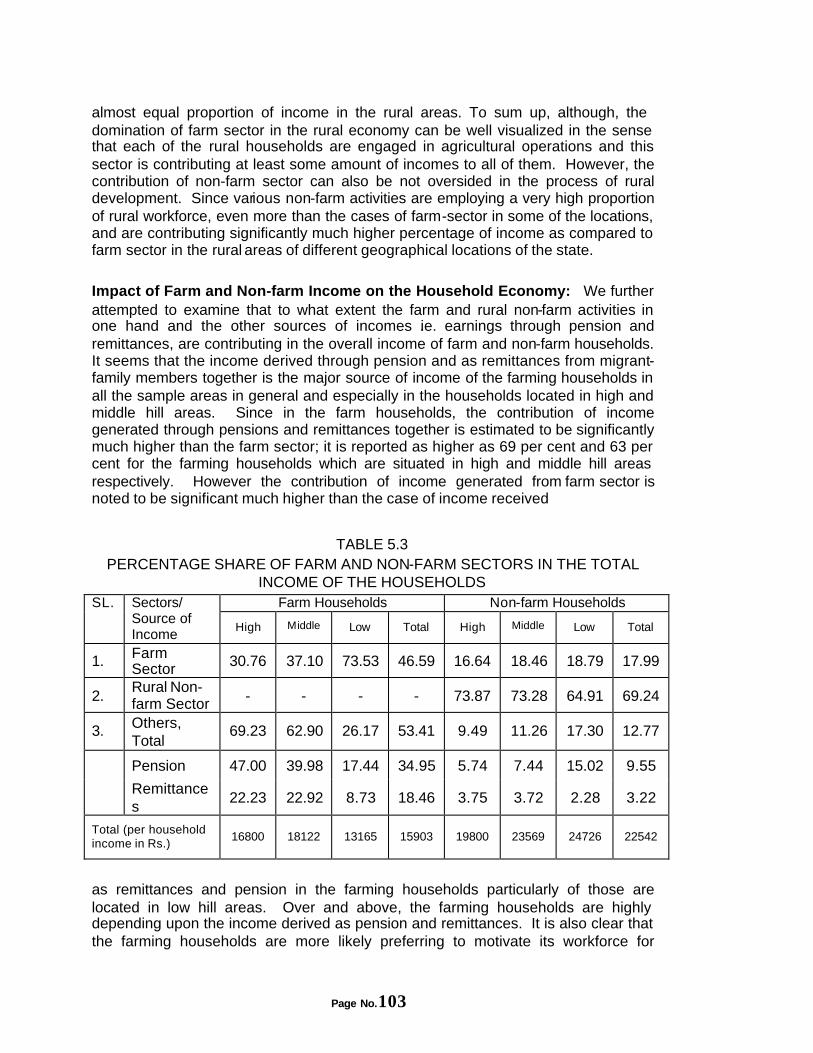
Page No.103
almost equal proportion of income in the rural areas. To sum up, although, the domination of farm sector in the rural economy can be well visualized in the sense that each of the rural households are engaged in agricultural operations and this sector is contributing at least some amount of incomes to all of them. However, the contribution of non-farm sector can also be not oversided in the process of rural development. Since various non-farm activities are employing a very high proportion of rural workforce, even more than the cases of farm-sector in some of the locations, and are contributing significantly much higher percentage of income as compared to farm sector in the rural areas of different geographical locations of the state. Impact of Farm and Non-farm Income on the Household Economy: We further attempted to examine that to what extent the farm and rural non-farm activities in one hand and the other sources of incomes i.e. earnings through pension and remittances, are contributing in the overall income of farm and non-farm households. It seems that the income derived through pension and as remittances from migrant-family members together is the major source of income of the farming households in all the sample areas in general and especially in the households located in high and middle hill areas. Since in the farm households, the contribution of income generated through pensions and remittances together is estimated to be significantly much higher than the farm sector; it is reported as higher as 69 per cent and 63 per cent for the farming households which are situated in high and middle hill areas respectively. However the contribution of income generated from farm sector is noted to be significant much higher than the case of income received
TABLE 5.3
PERCENTAGE SHARE OF FARM AND NON-FARM SECTORS IN THE TOTAL INCOME OF THE HOUSEHOLDS
Farm Households Non-farm Households SL. Sectors/ Source of Income
High Middle Low Total High Middle Low Total
1. Farm Sector 30.76 37.10 73.53 46.59 16.64 18.46 18.79 17.99
2. Rural Non-farm Sector - - - - 73.87 73.28 64.91 69.24
3. Others, Total
69.23 62.90 26.17 53.41 9.49 11.26 17.30 12.77
Pension 47.00 39.98 17.44 34.95 5.74 7.44 15.02 9.55
Remittances
22.23 22.92 8.73 18.46 3.75 3.72 2.28 3.22
Total (per household income in Rs.)
16800 18122 13165 15903 19800 23569 24726 22542
as remittances and pension in the farming households particularly of those are located in low hill areas. Over and above, the farming households are highly depending upon the income derived as pension and remittances. It is also clear that the farming households are more likely preferring to motivate its workforce for
Page No.104
migration outside villages in search of remunerative employment opportunities rather than to motivate them to engage in rural non-farm activities during the period of off season of agricultural operations.
The rural non-farm activities are noted playing a very important role in terms of the contribution of income in a large number of households in almost the rural areas of different locations. Since, the share of non-farm income in the total income of households generated from different sources is accounted for 69.24 per cent, though the level and extent of its contribution is found varied among different geographical locations. The share of non-farm in the income of households those are located in high altitude areas is as higher as 73.87 per cent but it narrowed at 70.28 per cent for middle hill areas and reaches at the lowest level at 64.91 per cent for low hill areas. The contribution of farm-sector in the income of non-farm households is estimated to be only around 18 per cent and it is more or less at similar proportion for the households of different geographical locations. The amount of income generated through remittances and in the form of pension together is contributing only 12.77 per cent, in the income of non-farm households, though it varied largely for the households of different geographical locations, being highest in low hill areas (17 per cent) followed by 11 per cent in middle and 9 per cent in high hill areas. Largely existing inequalities in the pattern of the distribution of cultivated land among the households seems to be highly reducing the share of farm sectors in the total income of households among those are located in different geographical locations even among those of the same location. But the availability of limited available land for cultivation among the households is compelling to its workforce to participate in different non-farm employment and generate income to contribute for maintaining the livings of its households. However, the households owing relatively larger size of holdings, are even not in a position to meet their minimum food and other household requirements, from the farms. Therefore they are forcing to its surplus workforce to migrate outside rural areas for seeking employment in urban areas rather than to engage in rural non-farm economies (Table 5.3).
Contribution of Non-farm Income: Further an attempt has been carried out to examine the pattern of contribution of different non-farm activities in the overall income as being generated from rural non-farm sector in different geographically locations. Annually, on an average a non-farm household is generating around Rs.15.6 thousand from engaging its family workforce in performing different non-farm activities within the rural areas, though it is marginally varying from lowest at Rs.14.53 thousand to highest at Rs.16.59 thousand for the households located in high and middle hill areas respectively. The manufacturing activities are indicated to the most dominating components of non-farm sector in each of the geographical locations in term of its percentage share in the overall income of the households, which they are generating from different non-farm employment. Since the manufacturing activities are contributing around 36 per cent of income in the overall non-farm income of the households; though its share is follows at highest level in the rural areas of low hills (41.80 per cent)
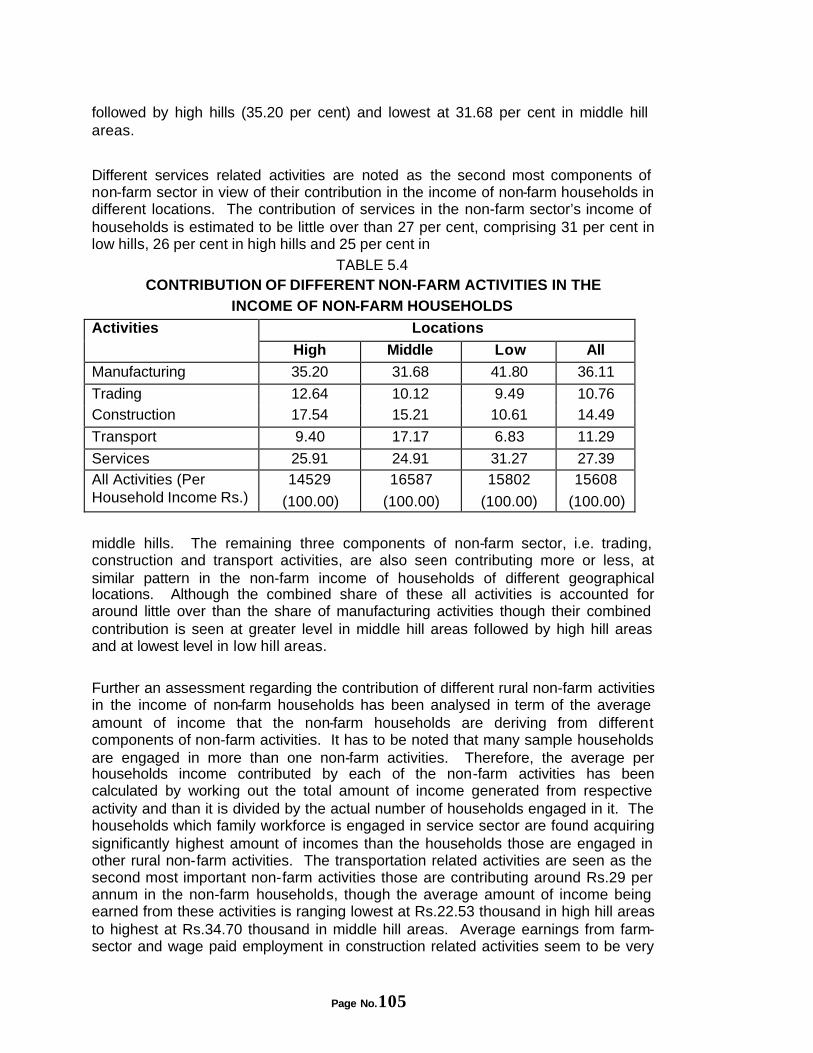
Page No.105
followed by high hills (35.20 per cent) and lowest at 31.68 per cent in middle hill areas.
Different services related activities are noted as the second most components of non-farm sector in view of their contribution in the income of non-farm households in different locations. The contribution of services in the non-farm sector’s income of households is estimated to be little over than 27 per cent, comprising 31 per cent in low hills, 26 per cent in high hills and 25 per cent in
TABLE 5.4 CONTRIBUTION OF DIFFERENT NON-FARM ACTIVITIES IN THE
INCOME OF NON-FARM HOUSEHOLDS
Locations Activities
High Middle Low All
Manufacturing 35.20 31.68 41.80 36.11
Trading 12.64 10.12 9.49 10.76 Construction 17.54 15.21 10.61 14.49
Transport 9.40 17.17 6.83 11.29
Services 25.91 24.91 31.27 27.39 All Activities (Per Household Income Rs.)
14529
(100.00)
16587
(100.00)
15802
(100.00)
15608
(100.00)
middle hills. The remaining three components of non-farm sector, i.e. trading, construction and transport activities, are also seen contributing more or less, at similar pattern in the non-farm income of households of different geographical locations. Although the combined share of these all activities is accounted for around little over than the share of manufacturing activities though their combined contribution is seen at greater level in middle hill areas followed by high hill areas and at lowest level in low hill areas.
Further an assessment regarding the contribution of different rural non-farm activities in the income of non-farm households has been analysed in term of the average amount of income that the non-farm households are deriving from different components of non-farm activities. It has to be noted that many sample households are engaged in more than one non-farm activities. Therefore, the average per households income contributed by each of the non-farm activities has been calculated by working out the total amount of income generated from respective activity and than it is divided by the actual number of households engaged in it. The households which family workforce is engaged in service sector are found acquiring significantly highest amount of incomes than the households those are engaged in other rural non-farm activities. The transportation related activities are seen as the second most important non-farm activities those are contributing around Rs.29 per annum in the non-farm households, though the average amount of income being earned from these activities is ranging lowest at Rs.22.53 thousand in high hill areas to highest at Rs.34.70 thousand in middle hill areas. Average earnings from farm-sector and wage paid employment in construction related activities seem to be very
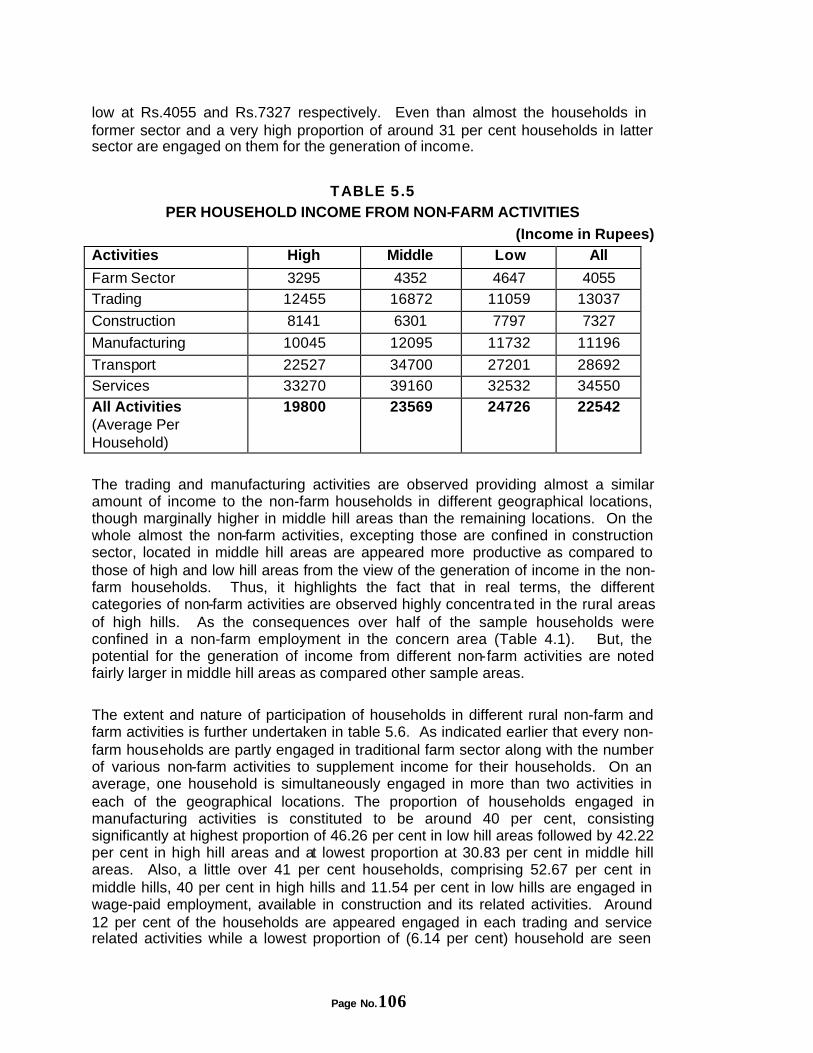
Page No.106
low at Rs.4055 and Rs.7327 respectively. Even than almost the households in former sector and a very high proportion of around 31 per cent households in latter sector are engaged on them for the generation of income.
TABLE 5.5 PER HOUSEHOLD INCOME FROM NON-FARM ACTIVITIES
(Income in Rupees) Activities High Middle Low All
Farm Sector 3295 4352 4647 4055 Trading 12455 16872 11059 13037
Construction 8141 6301 7797 7327
Manufacturing 10045 12095 11732 11196
Transport 22527 34700 27201 28692 Services 33270 39160 32532 34550 All Activities (Average Per Household)
19800 23569 24726 22542
The trading and manufacturing activities are observed providing almost a similar amount of income to the non-farm households in different geographical locations, though marginally higher in middle hill areas than the remaining locations. On the whole almost the non-farm activities, excepting those are confined in construction sector, located in middle hill areas are appeared more productive as compared to those of high and low hill areas from the view of the generation of income in the non-farm households. Thus, it highlights the fact that in real terms, the different categories of non-farm activities are observed highly concentra ted in the rural areas of high hills. As the consequences over half of the sample households were confined in a non-farm employment in the concern area (Table 4.1). But, the potential for the generation of income from different non-farm activities are noted fairly larger in middle hill areas as compared other sample areas. The extent and nature of participation of households in different rural non-farm and farm activities is further undertaken in table 5.6. As indicated earlier that every non-farm households are partly engaged in traditional farm sector along with the number of various non-farm activities to supplement income for their households. On an average, one household is simultaneously engaged in more than two activities in each of the geographical locations. The proportion of households engaged in manufacturing activities is constituted to be around 40 per cent, consisting significantly at highest proportion of 46.26 per cent in low hill areas followed by 42.22 per cent in high hill areas and at lowest proportion at 30.83 per cent in middle hill areas. Also, a little over 41 per cent households, comprising 52.67 per cent in middle hills, 40 per cent in high hills and 11.54 per cent in low hills are engaged in wage-paid employment, available in construction and its related activities. Around 12 per cent of the households are appeared engaged in each trading and service related activities while a lowest proportion of (6.14 per cent) household are seen
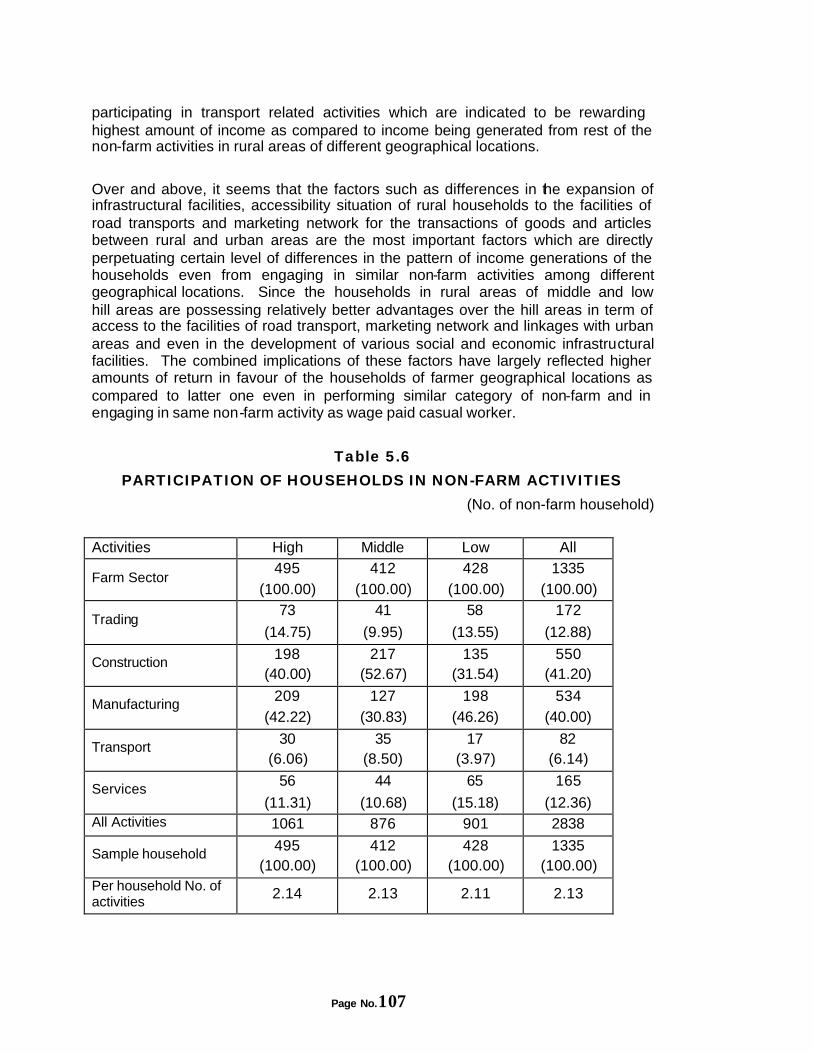
Page No.107
participating in transport related activities which are indicated to be rewarding highest amount of income as compared to income being generated from rest of the non-farm activities in rural areas of different geographical locations.
Over and above, it seems that the factors such as differences in the expansion of infrastructural facilities, accessibility situation of rural households to the facilities of road transports and marketing network for the transactions of goods and articles between rural and urban areas are the most important factors which are directly perpetuating certain level of differences in the pattern of income generations of the households even from engaging in similar non-farm activities among different geographical locations. Since the households in rural areas of middle and low hill areas are possessing relatively better advantages over the hill areas in term of access to the facilities of road transport, marketing network and linkages with urban areas and even in the development of various social and economic infrastructural facilities. The combined implications of these factors have largely reflected higher amounts of return in favour of the households of farmer geographical locations as compared to latter one even in performing similar category of non-farm and in engaging in same non-farm activity as wage paid casual worker.
Table 5.6 PARTICIPATION OF HOUSEHOLDS IN NON-FARM ACTIVITIES
(No. of non-farm household)
Activities High Middle Low All
Farm Sector 495
(100.00) 412
(100.00) 428
(100.00) 1335
(100.00)
Trading 73
(14.75)
41
(9.95)
58
(13.55)
172
(12.88)
Construction 198
(40.00) 217
(52.67) 135
(31.54) 550
(41.20)
Manufacturing 209
(42.22) 127
(30.83) 198
(46.26) 534
(40.00)
Transport 30
(6.06) 35
(8.50) 17
(3.97) 82
(6.14)
Services 56
(11.31)
44
(10.68)
65
(15.18)
165
(12.36) All Activities 1061 876 901 2838
Sample household 495
(100.00) 412
(100.00) 428
(100.00) 1335
(100.00) Per household No. of activities
2.14 2.13 2.11 2.13
Page No.108
Similarly, the households those are engaged in different non-arm activities as the self-employed are generating significantly higher amount of income as compared to those are employed as wage-paid casual workers. And the relatively higher amounts of returns as derived by the households through engaging in certain non-farm activities such as transport services and trading related activities are the outcome of the relatively higher amount of investment undertaken by them in the expansion of concern non-farm activities. Thus, providing increasing investment on the expansion and development of various potential non-farm activities could be a suggestive methodology for increasing the incomes of non-farm household in rural areas. However, the expectation from the part of rural households for creating additional investment on the expansion and development of different area specific potential non-farm activities are rather minimal because a majority of them are not in a position to generate sufficient income from different sources even for maintaining their minimum standard of livings. The Government intervention in this regard, through initiating for development of a comprehensive plan approach toward the expansion of certain non-farm activities, which are possessing area specific advantages in terms of their development, would be a rather more instrumented suggestive measure.
Contribution in Providing Employment Opportunities : Over the years, the importance of non-farm employment has been gaining increasing very fastly in the rural areas of almost the developing countries including India. Since the concentration of rural workforce in farm sector economies has been rapidly declining and its direct shift in non-farm employment has empirically been visualized in these countries (Islam 1986) Vaidyanathan (1986) Vyas and Mathai (1978) and Chadda (1993). Similar situation has also been found emerging in the structure of employment in different districts of Uttaranchal. However, still the workforce in rural areas of different geographical locations in largely confined in agriculture and related activities due to lesser extent of growth in the availability of employment opportunities in other economic activities. The contribution of non-farm sector in providing employment opportunities in different geographical locations is largely varying in the State because of largely existing inequalities in the availability pattern of employment in different economic sectors, distribution of cultivated land and the variations in the fertility and productivity of land, which interacting to a larger differences in per household and per hectare returns of crop production among different rural areas. In all, the proportion of workforce engaged in different non-farm activities is estimated to be 42.81 per cent, consisting of 49.46 per cent women as against 38.10 male workforce.
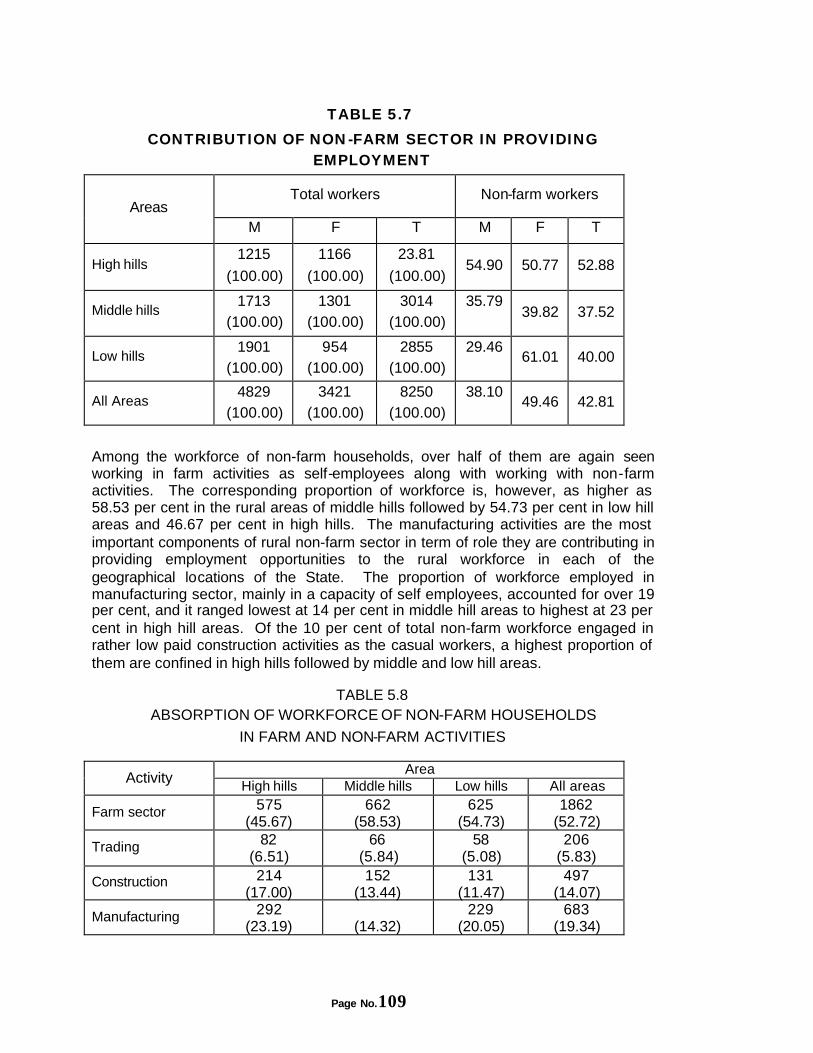
Page No.109
TABLE 5.7 CONTRIBUTION OF NON-FARM SECTOR IN PROVIDING
EMPLOYMENT
Total workers Non-farm workers Areas
M F T M F T
High hills 1215
(100.00)
1166
(100.00)
23.81
(100.00) 54.90 50.77 52.88
Middle hills 1713
(100.00) 1301
(100.00) 3014
(100.00) 35.79
39.82 37.52
Low hills 1901
(100.00) 954
(100.00) 2855
(100.00) 29.46
61.01 40.00
All Areas 4829
(100.00) 3421
(100.00) 8250
(100.00) 38.10
49.46 42.81
Among the workforce of non-farm households, over half of them are again seen working in farm activities as self-employees along with working with non-farm activities. The corresponding proportion of workforce is, however, as higher as 58.53 per cent in the rural areas of middle hills followed by 54.73 per cent in low hill areas and 46.67 per cent in high hills. The manufacturing activities are the most important components of rural non-farm sector in term of role they are contributing in providing employment opportunities to the rural workforce in each of the geographical locations of the State. The proportion of workforce employed in manufacturing sector, mainly in a capacity of self employees, accounted for over 19 per cent, and it ranged lowest at 14 per cent in middle hill areas to highest at 23 per cent in high hill areas. Of the 10 per cent of total non-farm workforce engaged in rather low paid construction activities as the casual workers, a highest proportion of them are confined in high hills followed by middle and low hill areas.
TABLE 5.8 ABSORPTION OF WORKFORCE OF NON-FARM HOUSEHOLDS
IN FARM AND NON-FARM ACTIVITIES
Area Activity
High hills Middle hills Low hills All areas
Farm sector 575 (45.67)
662 (58.53)
625 (54.73)
1862 (52.72)
Trading 82 (6.51)
66 (5.84)
58 (5.08)
206 (5.83)
Construction 214 (17.00)
152 (13.44)
131 (11.47)
497 (14.07)
Manufacturing 292 (23.19)
(14.32)
229 (20.05)
683 (19.34)
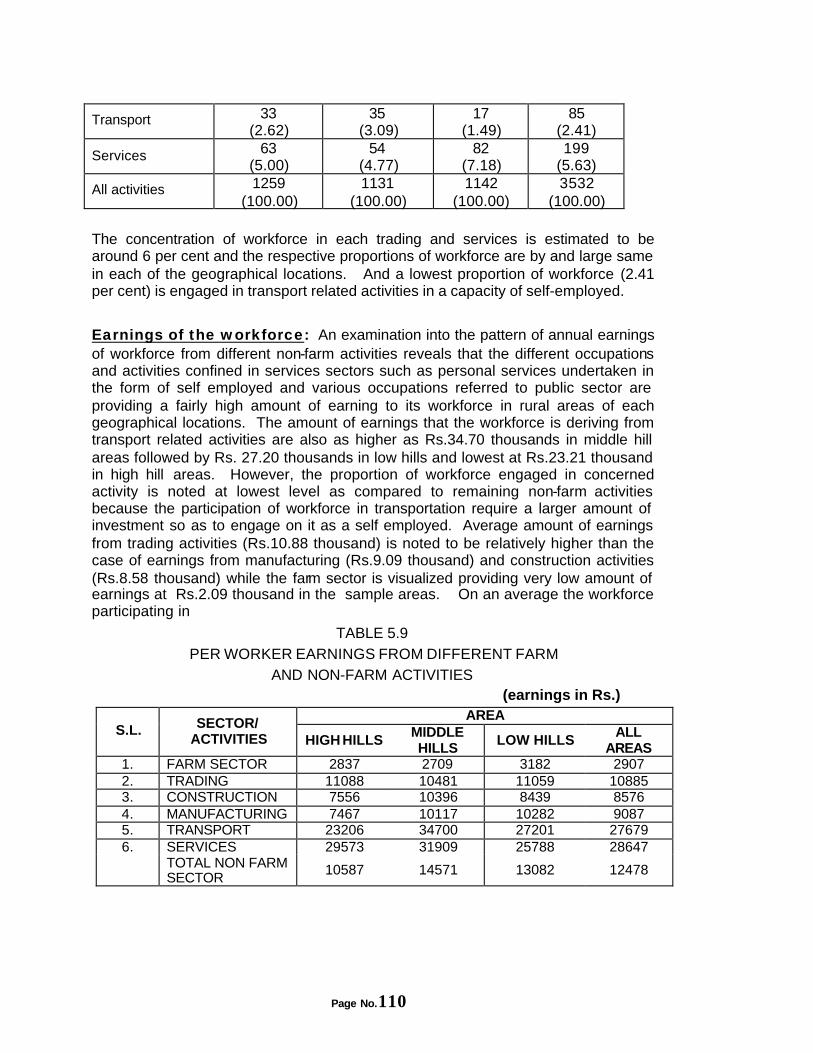
Page No.110
Transport 33 (2.62)
35 (3.09)
17 (1.49)
85 (2.41)
Services 63 (5.00)
54 (4.77)
82 (7.18)
199 (5.63)
All activities 1259 (100.00)
1131 (100.00)
1142 (100.00)
3532 (100.00)
The concentration of workforce in each trading and services is estimated to be around 6 per cent and the respective proportions of workforce are by and large same in each of the geographical locations. And a lowest proportion of workforce (2.41 per cent) is engaged in transport related activities in a capacity of self-employed.
Earnings of the workforce: An examination into the pattern of annual earnings of workforce from different non-farm activities reveals that the different occupations and activities confined in services sectors such as personal services undertaken in the form of self employed and various occupations referred to public sector are providing a fairly high amount of earning to its workforce in rural areas of each geographical locations. The amount of earnings that the workforce is deriving from transport related activities are also as higher as Rs.34.70 thousands in middle hill areas followed by Rs. 27.20 thousands in low hills and lowest at Rs.23.21 thousand in high hill areas. However, the proportion of workforce engaged in concerned activity is noted at lowest level as compared to remaining non-farm activities because the participation of workforce in transportation require a larger amount of investment so as to engage on it as a self employed. Average amount of earnings from trading activities (Rs.10.88 thousand) is noted to be relatively higher than the case of earnings from manufacturing (Rs.9.09 thousand) and construction activities (Rs.8.58 thousand) while the farm sector is visualized providing very low amount of earnings at Rs.2.09 thousand in the sample areas. On an average the workforce participating in
TABLE 5.9 PER WORKER EARNINGS FROM DIFFERENT FARM
AND NON-FARM ACTIVITIES (earnings in Rs.)
AREA S.L. SECTOR/
ACTIVITIES HIGH HILLS MIDDLE HILLS LOW HILLS ALL
AREAS 1. FARM SECTOR 2837 2709 3182 2907 2. TRADING 11088 10481 11059 10885 3. CONSTRUCTION 7556 10396 8439 8576 4. MANUFACTURING 7467 10117 10282 9087 5. TRANSPORT 23206 34700 27201 27679 6. SERVICES 29573 31909 25788 28647 TOTAL NON FARM
SECTOR 10587 14571 13082 12478
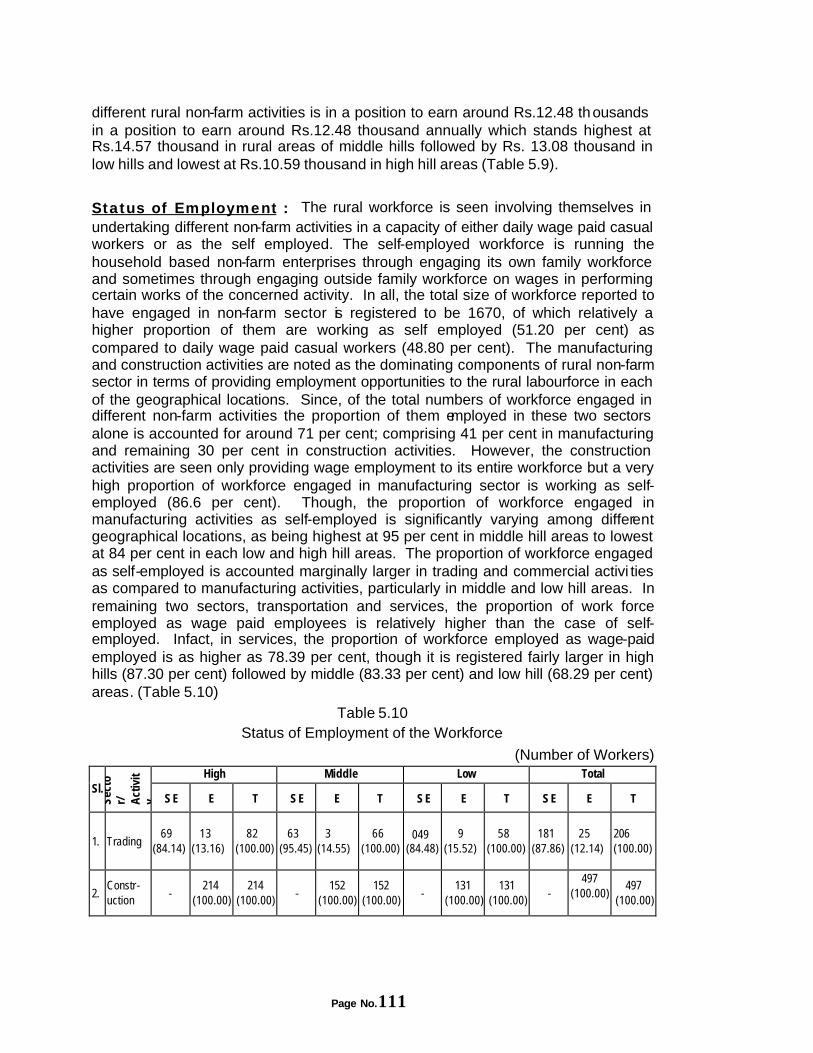
Page No.111
different rural non-farm activities is in a position to earn around Rs.12.48 thousands in a position to earn around Rs.12.48 thousand annually which stands highest at Rs.14.57 thousand in rural areas of middle hills followed by Rs. 13.08 thousand in low hills and lowest at Rs.10.59 thousand in high hill areas (Table 5.9).
Status of Employment : The rural workforce is seen involving themselves in undertaking different non-farm activities in a capacity of either daily wage paid casual workers or as the self employed. The self-employed workforce is running the household based non-farm enterprises through engaging its own family workforce and sometimes through engaging outside family workforce on wages in performing certain works of the concerned activity. In all, the total size of workforce reported to have engaged in non-farm sector is registered to be 1670, of which relatively a higher proportion of them are working as self employed (51.20 per cent) as compared to daily wage paid casual workers (48.80 per cent). The manufacturing and construction activities are noted as the dominating components of rural non-farm sector in terms of providing employment opportunities to the rural labourforce in each of the geographical locations. Since, of the total numbers of workforce engaged in different non-farm activities the proportion of them employed in these two sectors alone is accounted for around 71 per cent; comprising 41 per cent in manufacturing and remaining 30 per cent in construction activities. However, the construction activities are seen only providing wage employment to its entire workforce but a very high proportion of workforce engaged in manufacturing sector is working as self-employed (86.6 per cent). Though, the proportion of workforce engaged in manufacturing activities as self-employed is significantly varying among different geographical locations, as being highest at 95 per cent in middle hill areas to lowest at 84 per cent in each low and high hill areas. The proportion of workforce engaged as self-employed is accounted marginally larger in trading and commercial activi ties as compared to manufacturing activities, particularly in middle and low hill areas. In remaining two sectors, transportation and services, the proportion of work force employed as wage paid employees is relatively higher than the case of self-employed. Infact, in services, the proportion of workforce employed as wage-paid employed is as higher as 78.39 per cent, though it is registered fairly larger in high hills (87.30 per cent) followed by middle (83.33 per cent) and low hill (68.29 per cent) areas. (Table 5.10)
Table 5.10 Status of Employment of the Workforce
(Number of Workers) High Middle Low Total
Sl.
Sect
or/ Ac
tivit
y S E E T S E E T S E E T S E E T
1. Trading 69 (84.14)
13 (13.16)
82 (100.00)
63 (95.45)
3 (14.55)
66 (100.00)
049 (84.48)
9 (15.52)
58 (100.00)
181 (87.86)
25 (12.14)
206 (100.00)
2. Constr-uction -
214 (100.00)
214 (100.00) -
152 (100.00)
152 (100.00) -
131 (100.00)
131 (100.00) -
497 (100.00)
497 (100.00)
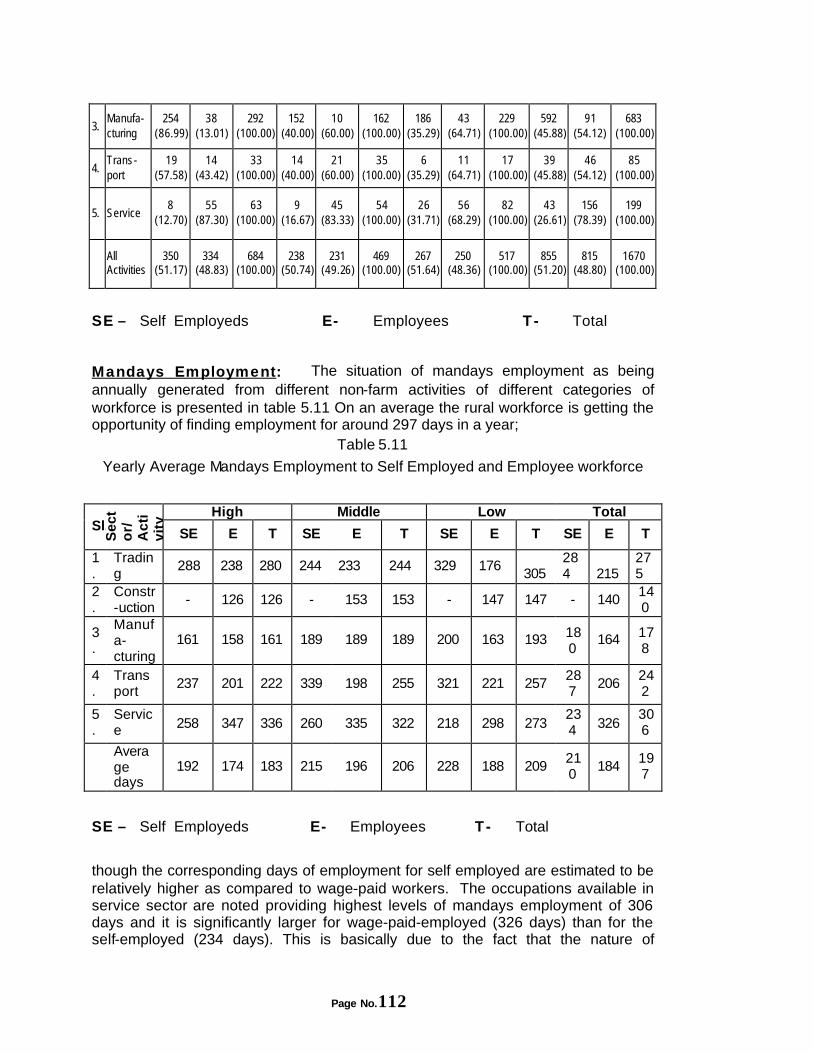
Page No.112
3. Manufa-cturing
254 (86.99)
38 (13.01)
292 (100.00)
152 (40.00)
10 (60.00)
162 (100.00)
186 (35.29)
43 (64.71)
229 (100.00)
592 (45.88)
91 (54.12)
683 (100.00)
4. Trans- port
19 (57.58)
14 (43.42)
33 (100.00)
14 (40.00)
21 (60.00)
35 (100.00)
6 (35.29)
11 (64.71)
17 (100.00)
39 (45.88)
46 (54.12)
85 (100.00)
5. Service 8
(12.70) 55
(87.30) 63
(100.00) 9
(16.67) 45
(83.33) 54
(100.00) 26
(31.71) 56
(68.29) 82
(100.00) 43
(26.61) 156
(78.39) 199
(100.00)
All Activities
350 (51.17)
334 (48.83)
684 (100.00)
238 (50.74)
231 (49.26)
469 (100.00)
267 (51.64)
250 (48.36)
517 (100.00)
855 (51.20)
815 (48.80)
1670 (100.00)
SE – Self Employeds E- Employees T- Total
Mandays Employment: The situation of mandays employment as being annually generated from different non-farm activities of different categories of workforce is presented in table 5.11 On an average the rural workforce is getting the opportunity of finding employment for around 297 days in a year;
Table 5.11
Yearly Average Mandays Employment to Self Employed and Employee workforce
High Middle Low Total
Sl.
Sec
to
r/
Act
ivi
ty
SE E T SE E T SE E T SE E T
1.
Trading
288 238 280 244 233 244 329 176 305
284
215
275
2.
Constr-uction
- 126 126 - 153 153 - 147 147 - 140 140
3.
Manufa-cturing
161 158 161 189 189 189 200 163 193 180
164 178
4.
Transport
237 201 222 339 198 255 321 221 257 287
206 242
5.
Service 258 347 336 260 335 322 218 298 273
234 326
306
Average days
192 174 183 215 196 206 228 188 209 210
184 197
SE – Self Employeds E- Employees T- Total
though the corresponding days of employment for self employed are estimated to be relatively higher as compared to wage-paid workers. The occupations available in service sector are noted providing highest levels of mandays employment of 306 days and it is significantly larger for wage-paid-employed (326 days) than for the self-employed (234 days). This is basically due to the fact that the nature of
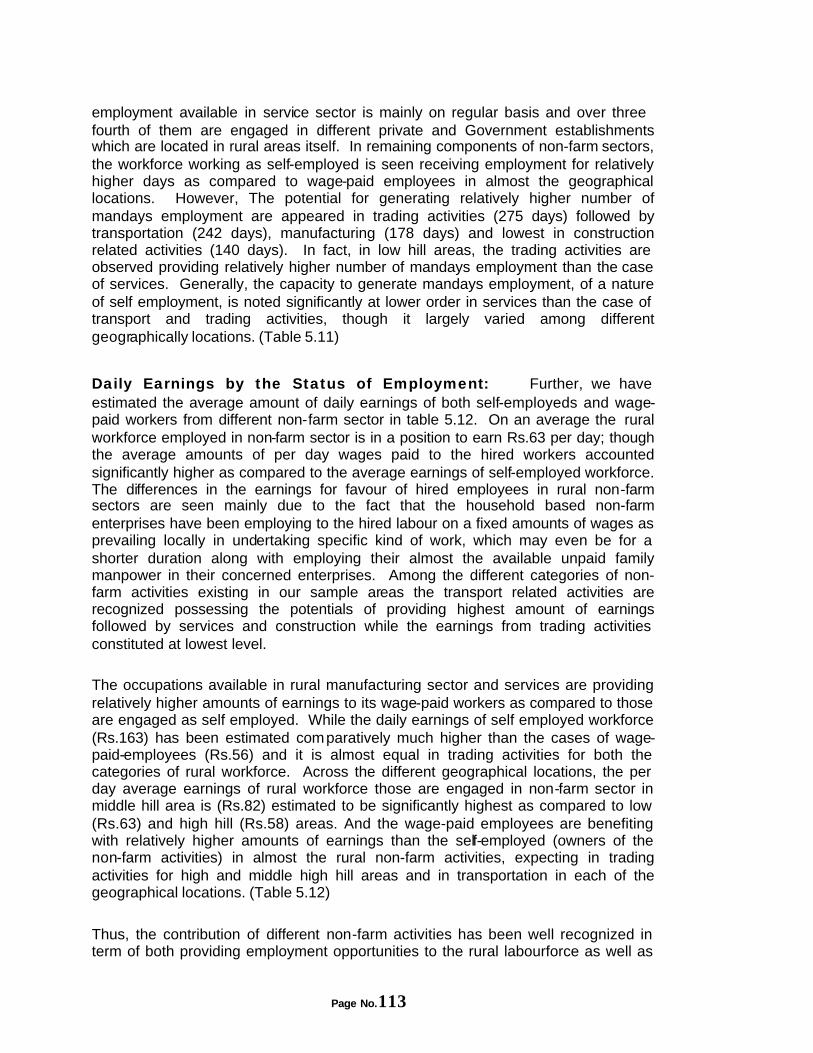
Page No.113
employment available in service sector is mainly on regular basis and over three fourth of them are engaged in different private and Government establishments which are located in rural areas itself. In remaining components of non-farm sectors, the workforce working as self-employed is seen receiving employment for relatively higher days as compared to wage-paid employees in almost the geographical locations. However, The potential for generating relatively higher number of mandays employment are appeared in trading activities (275 days) followed by transportation (242 days), manufacturing (178 days) and lowest in construction related activities (140 days). In fact, in low hill areas, the trading activities are observed providing relatively higher number of mandays employment than the case of services. Generally, the capacity to generate mandays employment, of a nature of self employment, is noted significantly at lower order in services than the case of transport and trading activities, though it largely varied among different geographically locations. (Table 5.11)
Daily Earnings by the Status of Employment: Further, we have estimated the average amount of daily earnings of both self-employeds and wage-paid workers from different non-farm sector in table 5.12. On an average the rural workforce employed in non-farm sector is in a position to earn Rs.63 per day; though the average amounts of per day wages paid to the hired workers accounted significantly higher as compared to the average earnings of self-employed workforce. The differences in the earnings for favour of hired employees in rural non-farm sectors are seen mainly due to the fact that the household based non-farm enterprises have been employing to the hired labour on a fixed amounts of wages as prevailing locally in undertaking specific kind of work, which may even be for a shorter duration along with employing their almost the available unpaid family manpower in their concerned enterprises. Among the different categories of non-farm activities existing in our sample areas the transport related activities are recognized possessing the potentials of providing highest amount of earnings followed by services and construction while the earnings from trading activities constituted at lowest level. The occupations available in rural manufacturing sector and services are providing relatively higher amounts of earnings to its wage-paid workers as compared to those are engaged as self employed. While the daily earnings of self employed workforce (Rs.163) has been estimated comparatively much higher than the cases of wage-paid-employees (Rs.56) and it is almost equal in trading activities for both the categories of rural workforce. Across the different geographical locations, the per day average earnings of rural workforce those are engaged in non-farm sector in middle hill area is (Rs.82) estimated to be significantly highest as compared to low (Rs.63) and high hill (Rs.58) areas. And the wage-paid employees are benefiting with relatively higher amounts of earnings than the self-employed (owners of the non-farm activities) in almost the rural non-farm activities, expecting in trading activities for high and middle high hill areas and in transportation in each of the geographical locations. (Table 5.12) Thus, the contribution of different non-farm activities has been well recognized in term of both providing employment opportunities to the rural labourforce as well as
Page No.114
its share in the total income of the non-farm households. The per capital income of non-farm households is reflected comparatively much higher than the farm households in different geographical locations mainly due to higher level of work-participation rate, and a relatively much higher share of
Table 5.12 Daily Earnings of Employees and Self Employed Workforce
High Middle Low Total
Sl.
Sec
to
r/
Act
ivity
SE E T SE E T SE E T SE E T
1. Trading
40 38 39 44
33
43 38 45 36 40
40 40
2. Constr-uction
- 63 63 - 75 75 - 72 72 - 70 70
3. Manufa-cturing
43 54 45 47 60 47 46 64 49 45 60 47
4. Transport
110 64 92 212 48 136 166 59 106 163
56 114
5. Service 40 93 88 42 108 99 65 105 95 54 101 94
Average days
47 71 58 61 82 71 49 81 63 51 77 63
SE – Self Employeds E- Employees T- Total
income generated from rural non-farm sector than the farm sectors and amount of remittances available from the migrant family member in the farmer categories of households than the latter one. In all the rural non-farm sector is observed contributing significantly higher proportion of income than the farm sector and income generated through remittances from migrant workforce in rural areas of each of the geographical locations, though at relatively much level in high hill areas followed by middle and low hill areas. Over and above the share of farm sector in the total income derived from different sources in sample areas stands very low, particularly in those households which family members are currently engaged in different non-farm activities. As the consequences the non-farm households are largely dependent on the incomes generated from non-farm sector which share is estimated to be around three fourth of the income derived from different sources in the sample areas. The rural workforce from non-farm households is observed participate in more than one non-farm employment. The emerging situation is that the proportion of rural workforce , which is engaged in non-farm employment, is considerably much higher than the case of farm sector in different geographical locations though, the rural manufacturing activities are indicated to have relatively larger potential in favour of providing employment opportunities in different areas. So over 40 per cent of the sample households are presently involved in the manufacturing of various goods and articles partly for satisfying the local demands and partly selling them outside concerned villages.
Page No.115
CHAPTER VI
STRUCTURE OF RURAL STRUCTURE OF RURAL INDUSTRIESINDUSTRIES
It was well depicted in the preceding analysis that the rural manufacturing activities are largely dominating among various non-farm activities in terms of its size, providing employment to rural labourforce and the generation of income in the non-farm households in different geographical locations. It is also the fact that the expansion of the avenues of industrial employment within rural areas has generally been recognised one of the major ways for diversifying the rural economy (Mathur 1993) and to promote the absorption of surplus agricultural labour (Lipton 1982). Moreover, in regions like Uttaranchal where the possibility of developing farming economy are rather limited and the agricultural activities are not in a position to generate additional employment opportunities for increasing rural labourforce, the expansion of rural industrial activities becomes rather crucial and important to address the problem of increasing incidence of un-employment and poverty in these areas. In this context, an attempt has been made separately, in the present chapter, to examine the structure, trends in growth, level of investment, absorption pattern of labourforce and issues related to the overall emerging situation and problems existing in the properly functioning and the possibilities for expansion of different product groups of rural manufacturing activities in different geographical locations. As indicated already in the second chapter that the existing manufacturing activities which are forming a largest part of rural non-farm sector, constituting both traditional and non-traditional categories of units. The black smithy, basket making, matting, rope making, woollen based enterprises, comprises of traditional form of activities, while, tailoring, comb making, iron and steel work, flour mill, repairing and servicing constitute the kinds of non-traditional manufacturing activities. The households belonging to certain social groups as part of village economic and social structure undertake all these traditional rural industries from generation to generation. The carpentry and Blacksmithy households are engaged in the manufacture and repair of the tools and equipments for traditional agricultural activities while the Basketary and rope making enterprises are purely based on raw materials available in local forests, are manufacturing a variety of baskets, mats and ropes respectively, for the purpose of the collection of forest products. The rural households for storing foodgrains also use the baskets and various other domestic items and the mats are used for performing agricultural activities.
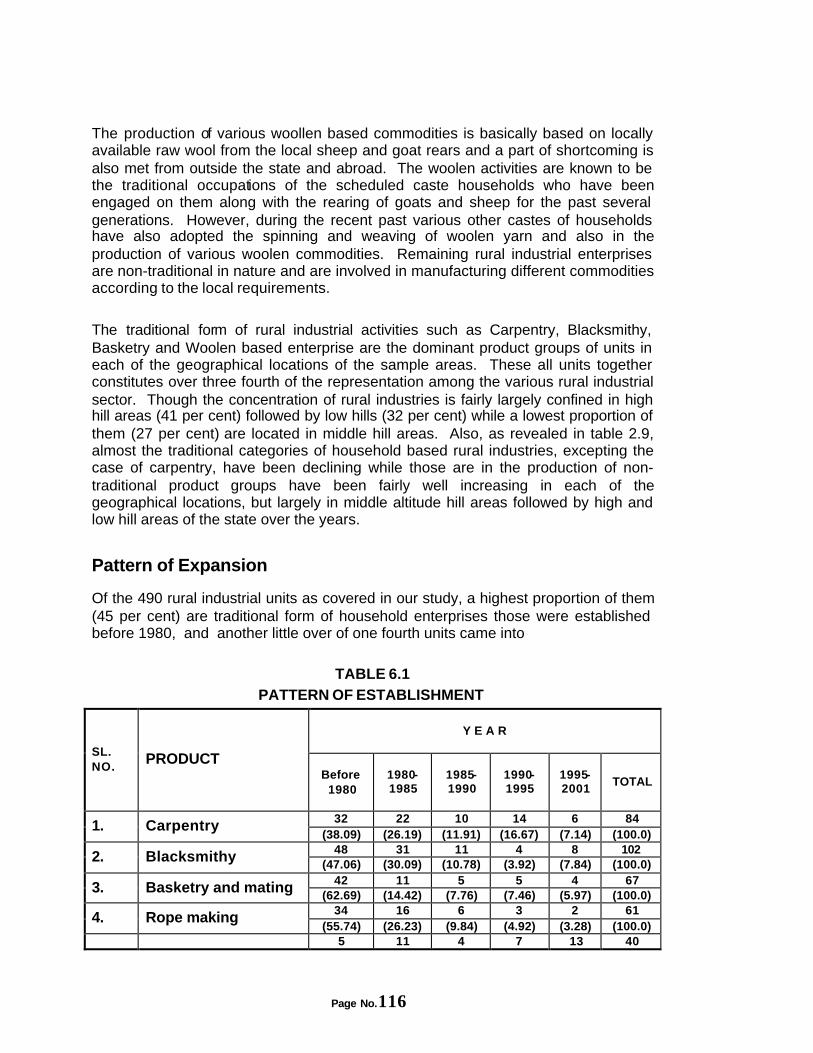
Page No.116
The production of various woollen based commodities is basically based on locally available raw wool from the local sheep and goat rears and a part of shortcoming is also met from outside the state and abroad. The woolen activities are known to be the traditional occupations of the scheduled caste households who have been engaged on them along with the rearing of goats and sheep for the past several generations. However, during the recent past various other castes of households have also adopted the spinning and weaving of woolen yarn and also in the production of various woolen commodities. Remaining rural industrial enterprises are non-traditional in nature and are involved in manufacturing different commodities according to the local requirements.
The traditional form of rural industrial activities such as Carpentry, Blacksmithy, Basketry and Woolen based enterprise are the dominant product groups of units in each of the geographical locations of the sample areas. These all units together constitutes over three fourth of the representation among the various rural industrial sector. Though the concentration of rural industries is fairly largely confined in high hill areas (41 per cent) followed by low hills (32 per cent) while a lowest proportion of them (27 per cent) are located in middle hill areas. Also, as revealed in table 2.9, almost the traditional categories of household based rural industries, excepting the case of carpentry, have been declining while those are in the production of non-traditional product groups have been fairly well increasing in each of the geographical locations, but largely in middle altitude hill areas followed by high and low hill areas of the state over the years.
Pattern of Expansion
Of the 490 rural industrial units as covered in our study, a highest proportion of them (45 per cent) are traditional form of household enterprises those were established before 1980, and another little over of one fourth units came into
TABLE 6.1
PATTERN OF ESTABLISHMENT
Y E A R
SL. NO.
PRODUCT Before
1980
1980-1985
1985-1990
1990-1995
1995-2001
TOTAL
32 22 10 14 6 84 1. Carpentry (38.09) (26.19) (11.91) (16.67) (7.14) (100.0)
48 31 11 4 8 102 2. Blacksmithy (47.06) (30.09) (10.78) (3.92) (7.84) (100.0)
42 11 5 5 4 67 3. Basketry and mating (62.69) (14.42) (7.76) (7.46) (5.97) (100.0)
34 16 6 3 2 61 4. Rope making (55.74) (26.23) (9.84) (4.92) (3.28) (100.0)
5 11 4 7 13 40

Page No.117
5. Flour Mills 5 11 4 7 13 40
5. Flour Mills (12.50) (27.50) (10.00) (17.50) (32.50
) (100.0)
40 9 - - - 49 6. Woolen Textiles (81.63) (18.37) (100.0)
11 18 10 7 9 55 7. Tailoring
(20.00) (32.73) (18.18) (12.73) (16.37
) (100.0)
9 9 2 5 7 32 8.
(28.13) (28.13) (6.25) (15.63) (21.88
) (100.0)
221 127 48 45 49 490
(45.10) (25.92) (9.80) (8.18) (10.00
) (100.0)
Note: Others include – repairing and servicing activities
existence during the next five year period but the pattern of expansion of rural industrial activities slashed largely during 1985 to 1990, though it picked up sharply after 1990-95 but at much lower extent as compared to pre 1985 periods. Considering into account the table 2.9 and table 6.1, it seems that the households those were traditionally engaged in rural manufacturing activities for the past several generations have been discontinuing to remain engaged on them further due to one or other reasons but the process of adopting rural manufacturing activities as the source of household income is seen still continuing through starting and joining of the other rural households, though at a smaller extent. However, over the years the proportions of households opting for the expansion of traditional form of industries in general and those are basically based on locally available raw materials in particular are noted to be relatively at lower level than the case of households initiating for the expansion of modern type of units such as tailoring, flour mills and repairing and servicing units.
Origin of the Industries Since a fairly high proportions of rural industrial units are traditional and were established during past several generations ago. Even, among the non-traditional units a majority of them were established during last several years ago. It is, therefore, we further find that a fairly high numbers of the rural industries (49 per cent) are inherited by the present owners from their fathers. However, significantly a highest proportions of the units were established by the present entrepreneurs (41 per cent) followed by 30 per cent were established more than three generations ago and remaining 29 per cent were started by the fathers of the present entrepreneurs. Among the industrial units those were quite old and were established three generations ago, a fairly large proportion of them are confined in the product line of woolen (51 per cent) and activities such as Blacksmithy (37 per cent) rope making (36 per cent) and basketry and matting (33 per cent) while the first generation entrepreneurs are largely initiating for the expansion of repairing and servicing activities, flour mills and tailoring activities. This indicates that despite a significant
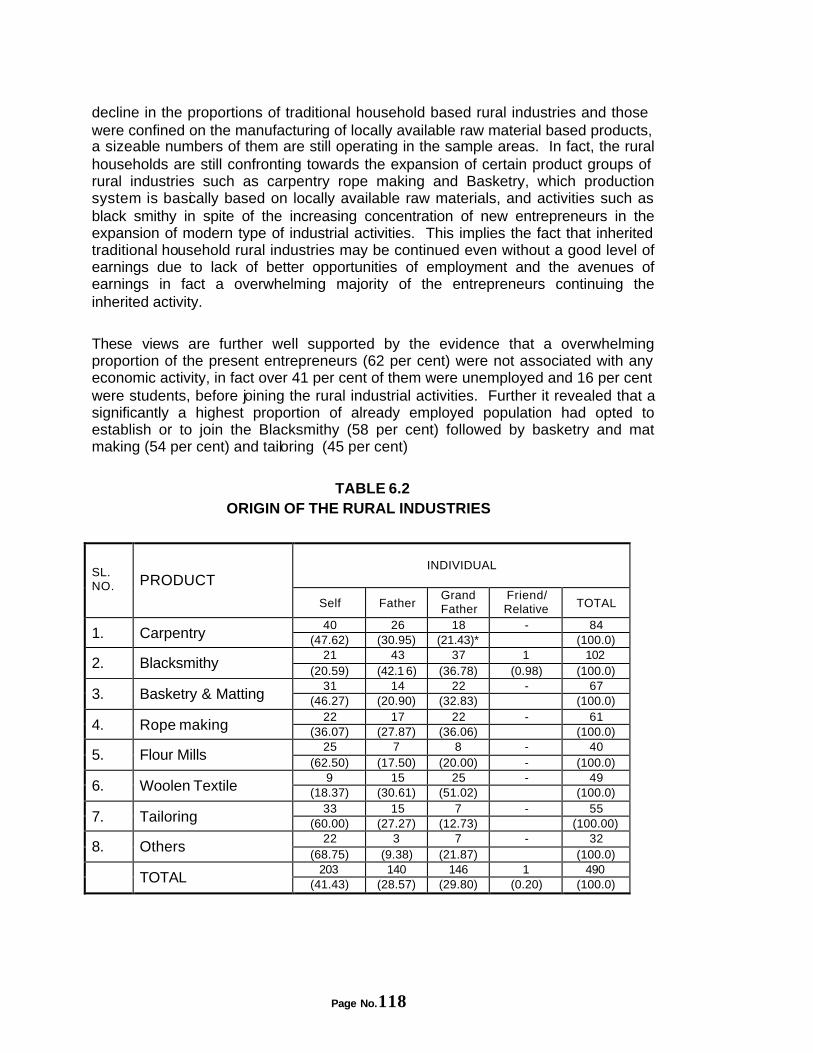
Page No.118
decline in the proportions of traditional household based rural industries and those were confined on the manufacturing of locally available raw material based products, a sizeable numbers of them are still operating in the sample areas. In fact, the rural households are still confronting towards the expansion of certain product groups of rural industries such as carpentry rope making and Basketry, which production system is basically based on locally available raw materials, and activities such as black smithy in spite of the increasing concentration of new entrepreneurs in the expansion of modern type of industrial activities. This implies the fact that inherited traditional household rural industries may be continued even without a good level of earnings due to lack of better opportunities of employment and the avenues of earnings in fact a overwhelming majority of the entrepreneurs continuing the inherited activity. These views are further well supported by the evidence that a overwhelming proportion of the present entrepreneurs (62 per cent) were not associated with any economic activity, in fact over 41 per cent of them were unemployed and 16 per cent were students, before joining the rural industrial activities. Further it revealed that a significantly a highest proportion of already employed population had opted to establish or to join the Blacksmithy (58 per cent) followed by basketry and mat making (54 per cent) and tailoring (45 per cent)
TABLE 6.2 ORIGIN OF THE RURAL INDUSTRIES
INDIVIDUAL
SL. NO. PRODUCT
Self Father Grand Father
Friend/ Relative TOTAL
40 26 18 - 84 1. Carpentry (47.62) (30.95) (21.43)* (100.0)
21 43 37 1 102 2. Blacksmithy
(20.59) (42.1 6) (36.78) (0.98) (100.0) 31 14 22 - 67
3. Basketry & Matting (46.27) (20.90) (32.83) (100.0) 22 17 22 - 61
4. Rope making (36.07) (27.87) (36.06) (100.0) 25 7 8 - 40
5. Flour Mills (62.50) (17.50) (20.00) - (100.0)
9 15 25 - 49 6. Woolen Textile (18.37) (30.61) (51.02) (100.0)
33 15 7 - 55 7. Tailoring (60.00) (27.27) (12.73) (100.00)
22 3 7 - 32 8. Others
(68.75) (9.38) (21.87) (100.0) 203 140 146 1 490
TOTAL (41.43) (28.57) (29.80) (0.20) (100.0)
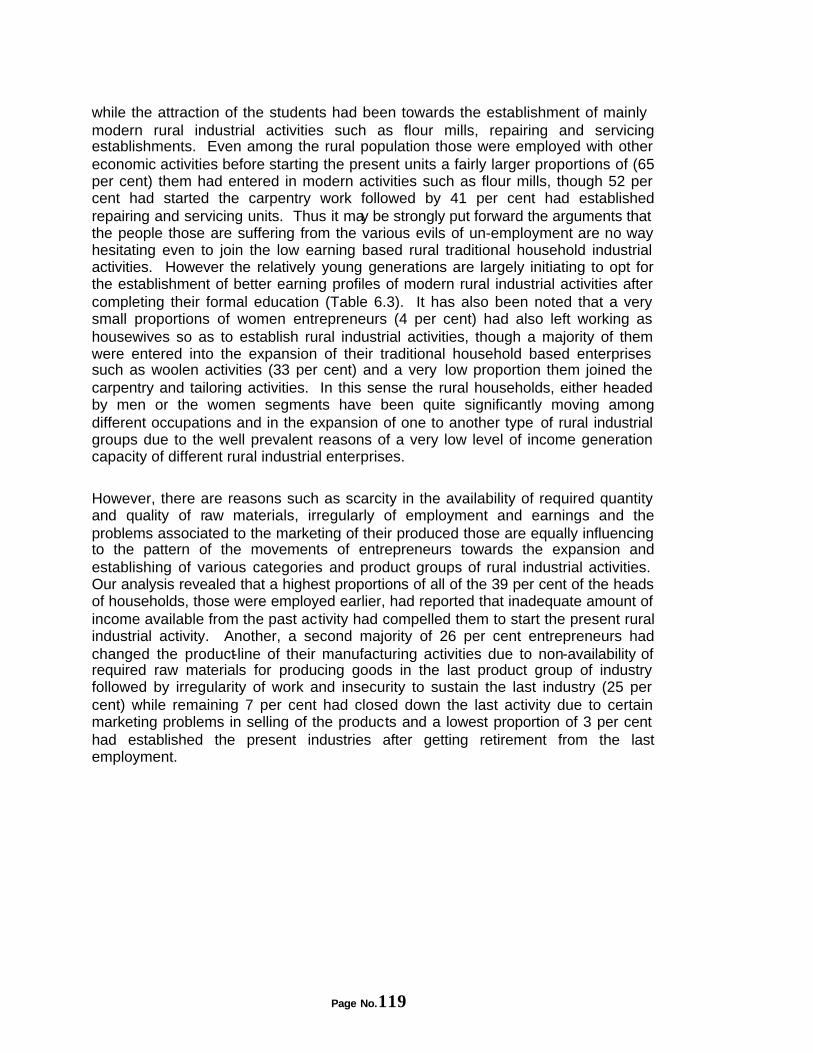
Page No.119
while the attraction of the students had been towards the establishment of mainly modern rural industrial activities such as flour mills, repairing and servicing establishments. Even among the rural population those were employed with other economic activities before starting the present units a fairly larger proportions of (65 per cent) them had entered in modern activities such as flour mills, though 52 per cent had started the carpentry work followed by 41 per cent had established repairing and servicing units. Thus it may be strongly put forward the arguments that the people those are suffering from the various evils of un-employment are no way hesitating even to join the low earning based rural traditional household industrial activities. However the relatively young generations are largely initiating to opt for the establishment of better earning profiles of modern rural industrial activities after completing their formal education (Table 6.3). It has also been noted that a very small proportions of women entrepreneurs (4 per cent) had also left working as housewives so as to establish rural industrial activities, though a majority of them were entered into the expansion of their traditional household based enterprises such as woolen activities (33 per cent) and a very low proportion them joined the carpentry and tailoring activities. In this sense the rural households, either headed by men or the women segments have been quite significantly moving among different occupations and in the expansion of one to another type of rural industrial groups due to the well prevalent reasons of a very low level of income generation capacity of different rural industrial enterprises. However, there are reasons such as scarcity in the availability of required quantity and quality of raw materials, irregularly of employment and earnings and the problems associated to the marketing of their produced those are equally influencing to the pattern of the movements of entrepreneurs towards the expansion and establishing of various categories and product groups of rural industrial activities. Our analysis revealed that a highest proportions of all of the 39 per cent of the heads of households, those were employed earlier, had reported that inadequate amount of income available from the past activity had compelled them to start the present rural industrial activity. Another, a second majority of 26 per cent entrepreneurs had changed the product-line of their manufacturing activities due to non-availability of required raw materials for producing goods in the last product group of industry followed by irregularity of work and insecurity to sustain the last industry (25 per cent) while remaining 7 per cent had closed down the last activity due to certain marketing problems in selling of the products and a lowest proportion of 3 per cent had established the present industries after getting retirement from the last employment.
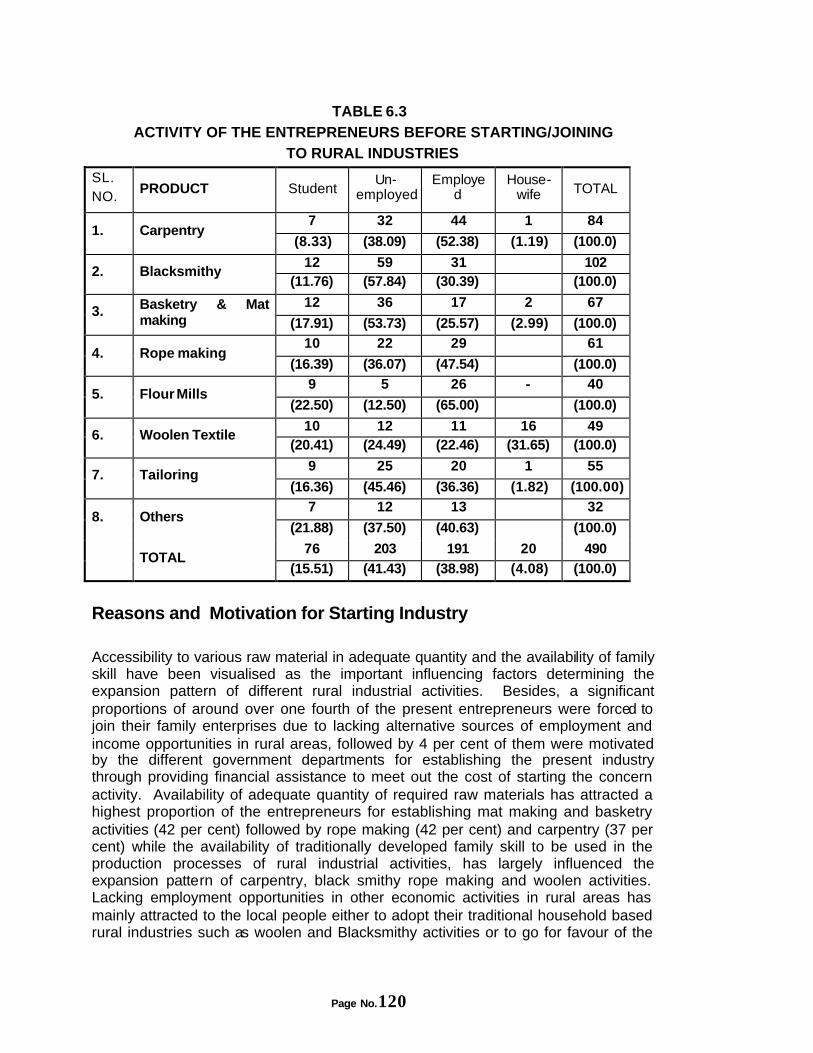
Page No.120
TABLE 6.3 ACTIVITY OF THE ENTREPRENEURS BEFORE STARTING/JOINING
TO RURAL INDUSTRIES
SL. NO.
PRODUCT Student Un-
employed Employe
d House-
wife TOTAL
7 32 44 1 84 1. Carpentry
(8.33) (38.09) (52.38) (1.19) (100.0)
12 59 31 102 2. Blacksmithy
(11.76) (57.84) (30.39) (100.0)
12 36 17 2 67 3. Basketry & Mat
making (17.91) (53.73) (25.57) (2.99) (100.0) 10 22 29 61
4. Rope making (16.39) (36.07) (47.54) (100.0)
9 5 26 - 40 5. Flour Mills
(22.50) (12.50) (65.00) (100.0)
10 12 11 16 49 6. Woolen Textile
(20.41) (24.49) (22.46) (31.65) (100.0)
9 25 20 1 55 7. Tailoring
(16.36) (45.46) (36.36) (1.82) (100.00) 7 12 13 32
8. Others (21.88) (37.50) (40.63) (100.0)
76 203 191 20 490 TOTAL
(15.51) (41.43) (38.98) (4.08) (100.0)
Reasons and Motivation for Starting Industry
Accessibility to various raw material in adequate quantity and the availability of family skill have been visualised as the important influencing factors determining the expansion pattern of different rural industrial activities. Besides, a significant proportions of around over one fourth of the present entrepreneurs were forced to join their family enterprises due to lacking alternative sources of employment and income opportunities in rural areas, followed by 4 per cent of them were motivated by the different government departments for establishing the present industry through providing financial assistance to meet out the cost of starting the concern activity. Availability of adequate quantity of required raw materials has attracted a highest proportion of the entrepreneurs for establishing mat making and basketry activities (42 per cent) followed by rope making (42 per cent) and carpentry (37 per cent) while the availability of traditionally developed family skill to be used in the production processes of rural industrial activities, has largely influenced the expansion pattern of carpentry, black smithy rope making and woolen activities. Lacking employment opportunities in other economic activities in rural areas has mainly attracted to the local people either to adopt their traditional household based rural industries such as woolen and Blacksmithy activities or to go for favour of the
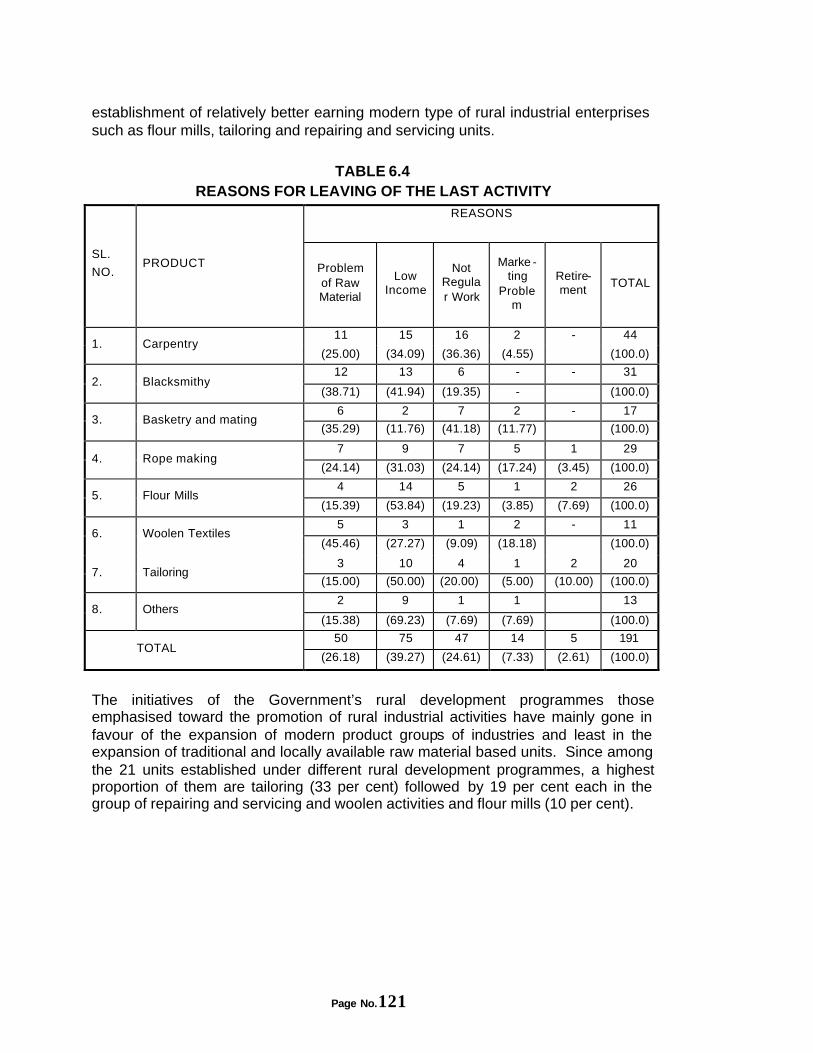
Page No.121
establishment of relatively better earning modern type of rural industrial enterprises such as flour mills, tailoring and repairing and servicing units.
TABLE 6.4 REASONS FOR LEAVING OF THE LAST ACTIVITY
REASONS
SL.
NO.
PRODUCT
Problem of Raw Material
Low Income
Not Regular Work
Marke -ting
Problem
Retire-ment
TOTAL
11 15 16 2 - 44 1. Carpentry
(25.00) (34.09) (36.36) (4.55) (100.0)
12 13 6 - - 31 2. Blacksmithy
(38.71) (41.94) (19.35) - (100.0)
6 2 7 2 - 17 3. Basketry and mating
(35.29) (11.76) (41.18) (11.77) (100.0)
7 9 7 5 1 29 4. Rope making
(24.14) (31.03) (24.14) (17.24) (3.45) (100.0)
4 14 5 1 2 26 5. Flour Mills
(15.39) (53.84) (19.23) (3.85) (7.69) (100.0)
5 3 1 2 - 11 6. Woolen Textiles
(45.46) (27.27) (9.09) (18.18) (100.0)
3 10 4 1 2 20 7. Tailoring
(15.00) (50.00) (20.00) (5.00) (10.00) (100.0)
2 9 1 1 13 8. Others
(15.38) (69.23) (7.69) (7.69) (100.0)
50 75 47 14 5 191 TOTAL
(26.18) (39.27) (24.61) (7.33) (2.61) (100.0)
The initiatives of the Government’s rural development programmes those emphasised toward the promotion of rural industrial activities have mainly gone in favour of the expansion of modern product groups of industries and least in the expansion of traditional and locally available raw material based units. Since among the 21 units established under different rural development programmes, a highest proportion of them are tailoring (33 per cent) followed by 19 per cent each in the group of repairing and servicing and woolen activities and flour mills (10 per cent).
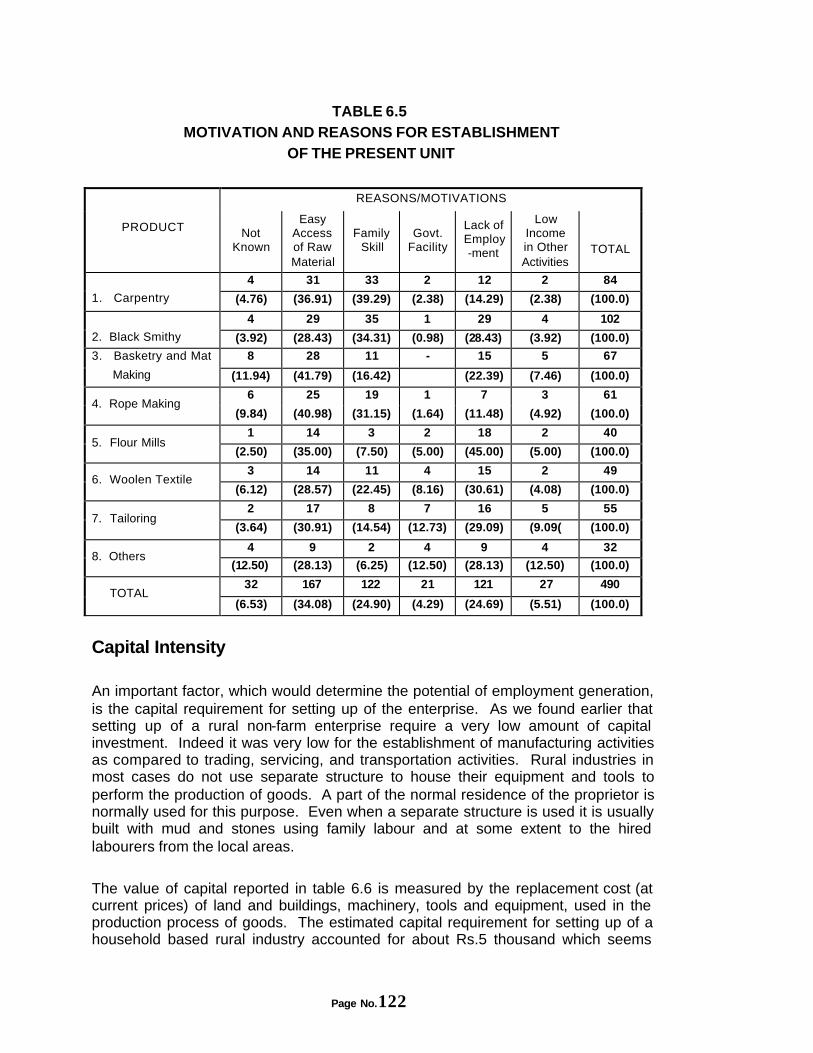
Page No.122
TABLE 6.5 MOTIVATION AND REASONS FOR ESTABLISHMENT
OF THE PRESENT UNIT
REASONS/MOTIVATIONS
PRODUCT
Not
Known
Easy Access of Raw Material
Family Skill
Govt. Facility
Lack of Employ-ment
Low Income in Other Activities
TOTAL
4 31 33 2 12 2 84
1. Carpentry (4.76) (36.91) (39.29) (2.38) (14.29) (2.38) (100.0)
4 29 35 1 29 4 102
2. Black Smithy (3.92) (28.43) (34.31) (0.98) (28.43) (3.92) (100.0)
8 28 11 - 15 5 67 3. Basketry and Mat
Making (11.94) (41.79) (16.42) (22.39) (7.46) (100.0)
6 25 19 1 7 3 61 4. Rope Making
(9.84) (40.98) (31.15) (1.64) (11.48) (4.92) (100.0)
1 14 3 2 18 2 40 5. Flour Mills
(2.50) (35.00) (7.50) (5.00) (45.00) (5.00) (100.0)
3 14 11 4 15 2 49 6. Woolen Textile
(6.12) (28.57) (22.45) (8.16) (30.61) (4.08) (100.0)
2 17 8 7 16 5 55 7. Tailoring
(3.64) (30.91) (14.54) (12.73) (29.09) (9.09( (100.0)
4 9 2 4 9 4 32 8. Others
(12.50) (28.13) (6.25) (12.50) (28.13) (12.50) (100.0)
32 167 122 21 121 27 490 TOTAL
(6.53) (34.08) (24.90) (4.29) (24.69) (5.51) (100.0)
Capital Intensity
An important factor, which would determine the potential of employment generation, is the capital requirement for setting up of the enterprise. As we found earlier that setting up of a rural non-farm enterprise require a very low amount of capital investment. Indeed it was very low for the establishment of manufacturing activities as compared to trading, servicing, and transportation activities. Rural industries in most cases do not use separate structure to house their equipment and tools to perform the production of goods. A part of the normal residence of the proprietor is normally used for this purpose. Even when a separate structure is used it is usually built with mud and stones using family labour and at some extent to the hired labourers from the local areas.
The value of capital reported in table 6.6 is measured by the replacement cost (at current prices) of land and buildings, machinery, tools and equipment, used in the production process of goods. The estimated capital requirement for setting up of a household based rural industry accounted for about Rs.5 thousand which seems
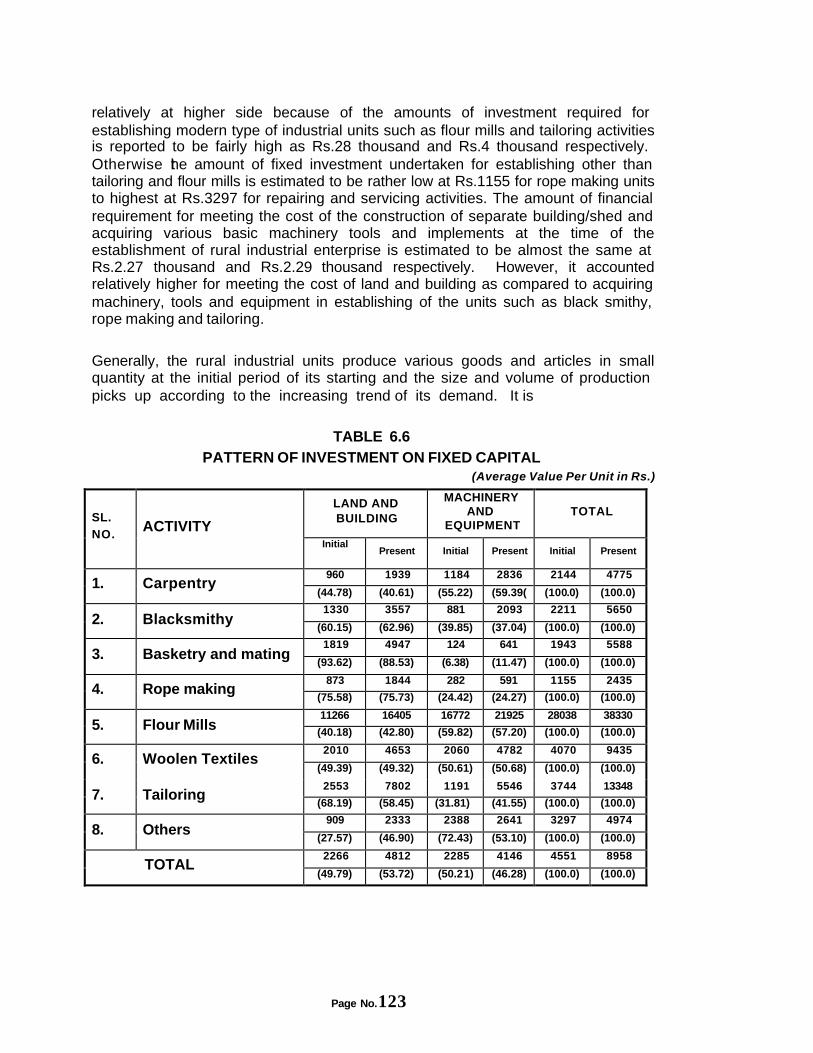
Page No.123
relatively at higher side because of the amounts of investment required for establishing modern type of industrial units such as flour mills and tailoring activities is reported to be fairly high as Rs.28 thousand and Rs.4 thousand respectively. Otherwise the amount of fixed investment undertaken for establishing other than tailoring and flour mills is estimated to be rather low at Rs.1155 for rope making units to highest at Rs.3297 for repairing and servicing activities. The amount of financial requirement for meeting the cost of the construction of separate building/shed and acquiring various basic machinery tools and implements at the time of the establishment of rural industrial enterprise is estimated to be almost the same at Rs.2.27 thousand and Rs.2.29 thousand respectively. However, it accounted relatively higher for meeting the cost of land and building as compared to acquiring machinery, tools and equipment in establishing of the units such as black smithy, rope making and tailoring. Generally, the rural industrial units produce various goods and articles in small quantity at the initial period of its starting and the size and volume of production picks up according to the increasing trend of its demand. It is
TABLE 6.6 PATTERN OF INVESTMENT ON FIXED CAPITAL
(Average Value Per Unit in Rs.)
LAND AND BUILDING
MACHINERY AND
EQUIPMENT TOTAL
SL. NO.
ACTIVITY Initial
Present Initial Present Initial Present
960 1939 1184 2836 2144 4775 1. Carpentry
(44.78) (40.61) (55.22) (59.39( (100.0) (100.0)
1330 3557 881 2093 2211 5650 2. Blacksmithy
(60.15) (62.96) (39.85) (37.04) (100.0) (100.0)
1819 4947 124 641 1943 5588 3. Basketry and mating
(93.62) (88.53) (6.38) (11.47) (100.0) (100.0)
873 1844 282 591 1155 2435 4. Rope making
(75.58) (75.73) (24.42) (24.27) (100.0) (100.0)
11266 16405 16772 21925 28038 38330 5. Flour Mills (40.18) (42.80) (59.82) (57.20) (100.0) (100.0)
2010 4653 2060 4782 4070 9435 6. Woolen Textiles
(49.39) (49.32) (50.61) (50.68) (100.0) (100.0)
2553 7802 1191 5546 3744 13348 7. Tailoring
(68.19) (58.45) (31.81) (41.55) (100.0) (100.0)
909 2333 2388 2641 3297 4974 8. Others
(27.57) (46.90) (72.43) (53.10) (100.0) (100.0)
2266 4812 2285 4146 4551 8958 TOTAL
(49.79) (53.72) (50.21) (46.28) (100.0) (100.0)
Page No.124
therefore, initially a very small amount of finances are required for establishing of the different industrial units while the industrial units have to make additional financial investments for acquiring additional machines , tools and equipment with the increase of the size of production to meet the increasing local demands of the various products. And thus, the trends in further investment in fixed capital of rural industrial enterprises largely depends on the level of increasing trend in the overall size of production and the level of additions to the net income of the entrepreneurs from the concerned activity. Comparing the level of financial investment as undertaken during the period of starting and at present of various rural industrial units, it seems that the volume of production in each of the category of industrial units has been significantly increasing over the years. As the consequences the level of the present value of financial investment of different rural industrial together has increased nearly two folds as compared to the value of initial investment. A highest level of addition in acquiring machinery tools and other equipment has been visualised in the cases of tailoring (four folds) followed by basketry and mat making (188 per cent) black smithy (156 per cent), woolen activities (144 per cent) carpentry (123 per cent) and lowest at 37 per cent for flour mills followed by 51 per cent for repairing and servicing activities. It indicates that over the years the volume of production of traditional household based industrial activities has been increasing significantly at much higher level than the case of modern type of industrial activities; though during the recent past, the value of production as well as net earning from modern industrial units have been increasing more sharply than the case of traditional household based rural industries.
Procurement of Raw Materials Access to and the availability pattern of different required raw material are among the most important factors which determine and influence the level of productivity and income and thus the overall development prospects of the manufacturing activities. It has generally been accepted that there has been a substantial decrease in the numbers of rural industrial units which were engaged in the manufacture of different type of rural raw material based products, even after the announcement and introduction of several protective measures to accelerate the development of rural manufacturing activities under the various planned development strategies in the past. But decrease in the availability and inadequately supply of the required raw materials are universally acknowledged as the major factors responsible for the closer of a majority of these rural industries.
Most of the rural industrial units in the state are more or less dependent on the local supply of raw materials. The carpentry, basketry, mat making, rope making and woolen activities are the major rural industrial units which prospects of development are basically based on the availability of raw material in nearby forests and in other local areas. The woolen activities are using only raw wool in the production of different woolen products. The goat and sheep rearers locally meet the demand of raw wool. In fact, a majority of the households those are engaged in woolen activities are also traditionally involved in the rearing of goats and sheep in the high hill areas of the state. However, during the recent past, the shortage of local wool is
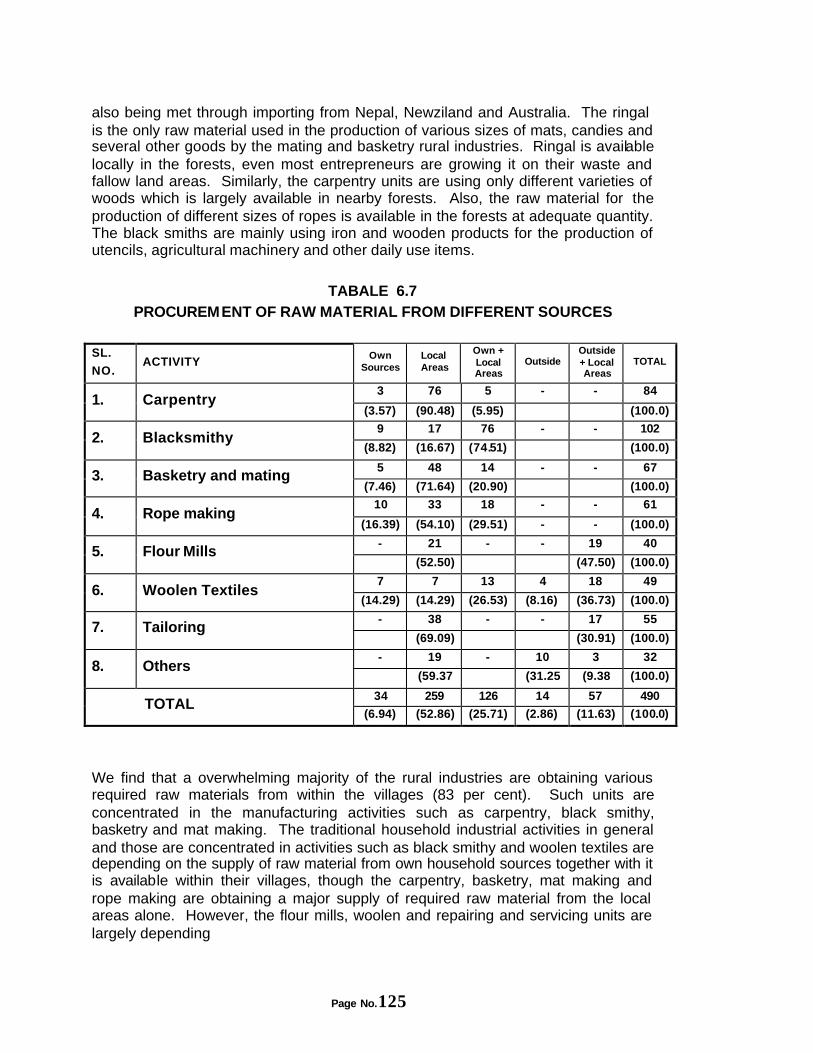
Page No.125
also being met through importing from Nepal, Newziland and Australia. The ringal is the only raw material used in the production of various sizes of mats, candies and several other goods by the mating and basketry rural industries. Ringal is available locally in the forests, even most entrepreneurs are growing it on their waste and fallow land areas. Similarly, the carpentry units are using only different varieties of woods which is largely available in nearby forests. Also, the raw material for the production of different sizes of ropes is available in the forests at adequate quantity. The black smiths are mainly using iron and wooden products for the production of utencils, agricultural machinery and other daily use items.
TABALE 6.7 PROCUREMENT OF RAW MATERIAL FROM DIFFERENT SOURCES
SL.
NO. ACTIVITY
Own Sources
Local Areas
Own + Local Areas
Outside Outside + Local Areas
TOTAL
3 76 5 - - 84 1. Carpentry
(3.57) (90.48) (5.95) (100.0)
9 17 76 - - 102 2. Blacksmithy
(8.82) (16.67) (74.51) (100.0)
5 48 14 - - 67 3. Basketry and mating
(7.46) (71.64) (20.90) (100.0)
10 33 18 - - 61 4. Rope making
(16.39) (54.10) (29.51) - - (100.0)
- 21 - - 19 40 5. Flour Mills
(52.50) (47.50) (100.0)
7 7 13 4 18 49 6. Woolen Textiles
(14.29) (14.29) (26.53) (8.16) (36.73) (100.0)
- 38 - - 17 55 7. Tailoring
(69.09) (30.91) (100.0)
- 19 - 10 3 32 8. Others
(59.37 (31.25 (9.38 (100.0)
34 259 126 14 57 490 TOTAL
(6.94) (52.86) (25.71) (2.86) (11.63) (100.0)
We find that a overwhelming majority of the rural industries are obtaining various required raw materials from within the villages (83 per cent). Such units are concentrated in the manufacturing activities such as carpentry, black smithy, basketry and mat making. The traditional household industrial activities in general and those are concentrated in activities such as black smithy and woolen textiles are depending on the supply of raw material from own household sources together with it is available within their villages, though the carpentry, basketry, mat making and rope making are obtaining a major supply of required raw material from the local areas alone. However, the flour mills, woolen and repairing and servicing units are largely depending
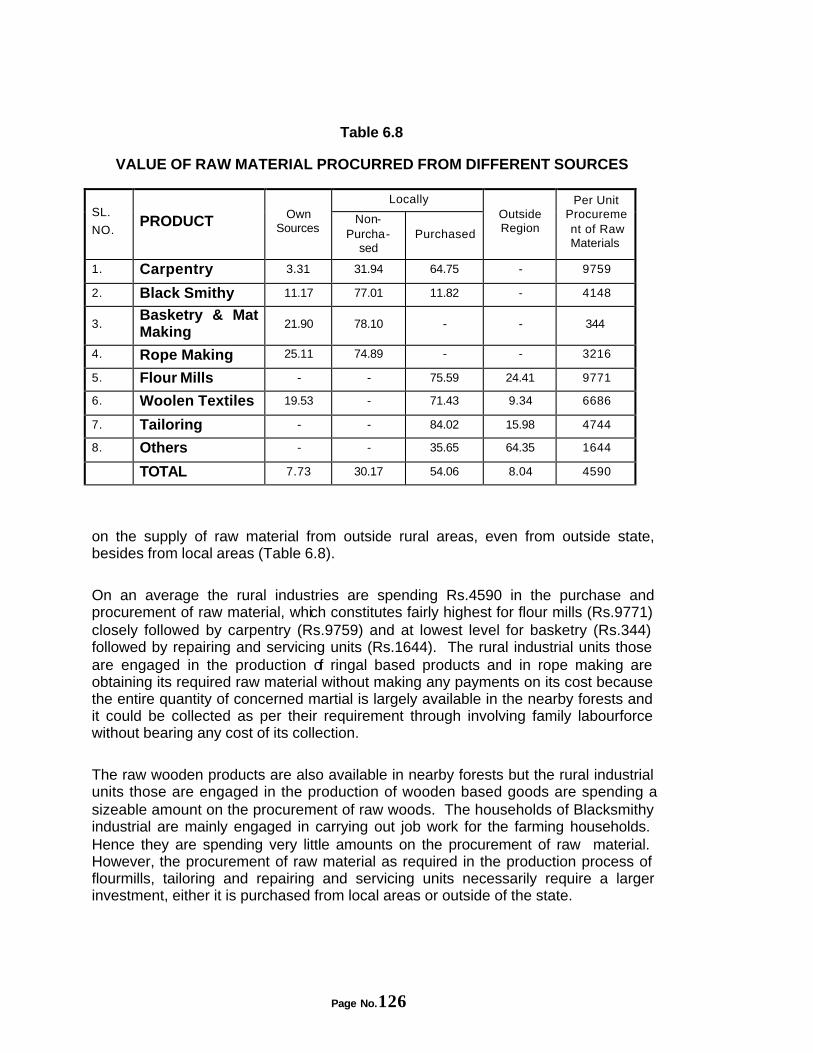
Page No.126
Table 6.8
VALUE OF RAW MATERIAL PROCURRED FROM DIFFERENT SOURCES
Locally SL.
NO. PRODUCT Own
Sources Non-
Purcha-sed
Purchased
Outside Region
Per Unit Procurement of Raw Materials
1. Carpentry 3.31 31.94 64.75 - 9759
2. Black Smithy 11.17 77.01 11.82 - 4148
3. Basketry & Mat Making
21.90 78.10 - - 344
4. Rope Making 25.11 74.89 - - 3216
5. Flour Mills - - 75.59 24.41 9771
6. Woolen Textiles 19.53 - 71.43 9.34 6686
7. Tailoring - - 84.02 15.98 4744
8. Others - - 35.65 64.35 1644
TOTAL 7.73 30.17 54.06 8.04 4590
on the supply of raw material from outside rural areas, even from outside state, besides from local areas (Table 6.8).
On an average the rural industries are spending Rs.4590 in the purchase and procurement of raw material, which constitutes fairly highest for flour mills (Rs.9771) closely followed by carpentry (Rs.9759) and at lowest level for basketry (Rs.344) followed by repairing and servicing units (Rs.1644). The rural industrial units those are engaged in the production of ringal based products and in rope making are obtaining its required raw material without making any payments on its cost because the entire quantity of concerned martial is largely available in the nearby forests and it could be collected as per their requirement through involving family labourforce without bearing any cost of its collection.
The raw wooden products are also available in nearby forests but the rural industrial units those are engaged in the production of wooden based goods are spending a sizeable amount on the procurement of raw woods. The households of Blacksmithy industrial are mainly engaged in carrying out job work for the farming households. Hence they are spending very little amounts on the procurement of raw material. However, the procurement of raw material as required in the production process of flourmills, tailoring and repairing and servicing units necessarily require a larger investment, either it is purchased from local areas or outside of the state.
Page No.127
Mode and Size of Production The size and volume of production of various goods and articles that is undertaken by rural industrial enterprises is largely governed by the level and extent of the demands, requirements and the purchasing power of the local people. To a certain extent it also depends on the level of the necessity and essentiality for satisfying their basic needs. Also, the adoption of the primitive and obsolete technology in the production process further limits the volume of production of these traditional household basis enterprises. Because the goods and articles produced by rural industrial enterprises hardly find any markets outside rural areas.
It has to be indicated here that the carpentry households are engaged in the production of various wood based furniture and goods required for the construction of houses. These activities are performed by both upper caste and scheduled castes/scheduled tribe groups of households. The Blacksmithy scheduled castes of households are engaged in the manufacturing and repairing of various agricultural machineries and tools and certain other equipment which are used for cutting grasses and leaves of trees for feeding animals and procurement of forest products for their own use and according to the demands of certain upper castes households which are known their Zajamans. Moreover, in remaining activities both upper and lower caste groups of households are equally participating for last several generations. The basketry and mating households are engaged in the production of different sizes and categories of mats, baskets, candies and various other articles as per the requirement of local people. The raw materials for the manufacturing of ropes, mats and baskets are locally available. The scheduled tribes social groups of households are mainly engaged in the woolen activities for the last several centuries. The main articles which are being produced by them are different size of shawls, Pankhi, Chutkas, Thulmas, sweaters and various handicraft products which size and quantum of production is based on the demands of both local people as well as outside rural areas. The size of production of different rural industrial units has been estimated only the tune of Rs.14.7 thousand. In fact it is much lower level for traditional type of household enterprises, particularly of basketry (Rs.6831), rope making (Rs.9274) and black smithy (Rs.11291), though it is highest for modern type of enterprises related to servicing and repairing units (Rs.25 thousand) and flour mills (Rs.23.5 thousand).
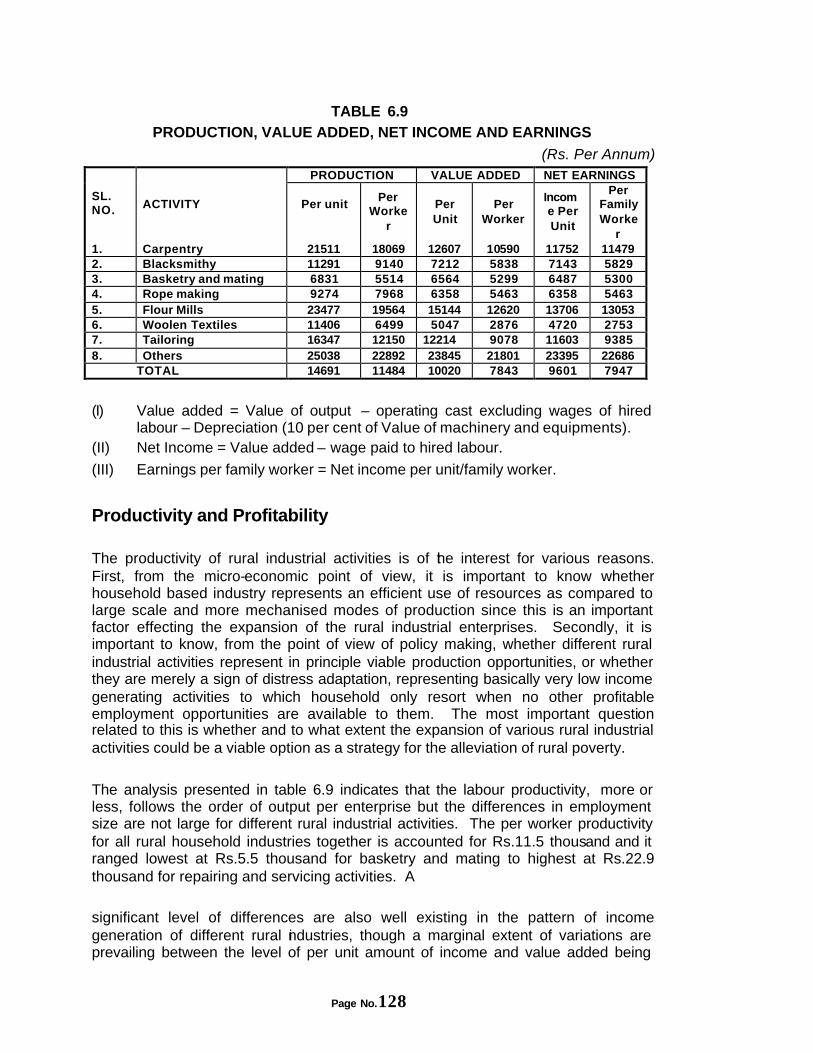
Page No.128
TABLE 6.9 PRODUCTION, VALUE ADDED, NET INCOME AND EARNINGS
(Rs. Per Annum) PRODUCTION VALUE ADDED NET EARNINGS
SL. NO.
ACTIVITY Per unit
Per Worke
r
Per Unit
Per Worker
Income Per Unit
Per Family Worke
r 1. Carpentry 21511 18069 12607 10590 11752 11479 2. Blacksmithy 11291 9140 7212 5838 7143 5829 3. Basketry and mating 6831 5514 6564 5299 6487 5300 4. Rope making 9274 7968 6358 5463 6358 5463 5. Flour Mills 23477 19564 15144 12620 13706 13053 6. Woolen Textiles 11406 6499 5047 2876 4720 2753 7. Tailoring 16347 12150 12214 9078 11603 9385 8. Others 25038 22892 23845 21801 23395 22686 TOTAL 14691 11484 10020 7843 9601 7947
(I) Value added = Value of output – operating cast excluding wages of hired labour – Depreciation (10 per cent of Value of machinery and equipments).
(II) Net Income = Value added – wage paid to hired labour.
(III) Earnings per family worker = Net income per unit/family worker.
Productivity and Profitability The productivity of rural industrial activities is of the interest for various reasons. First, from the micro-economic point of view, it is important to know whether household based industry represents an efficient use of resources as compared to large scale and more mechanised modes of production since this is an important factor effecting the expansion of the rural industrial enterprises. Secondly, it is important to know, from the point of view of policy making, whether different rural industrial activities represent in principle viable production opportunities, or whether they are merely a sign of distress adaptation, representing basically very low income generating activities to which household only resort when no other profitable employment opportunities are available to them. The most important question related to this is whether and to what extent the expansion of various rural industrial activities could be a viable option as a strategy for the alleviation of rural poverty. The analysis presented in table 6.9 indicates that the labour productivity, more or less, follows the order of output per enterprise but the differences in employment size are not large for different rural industrial activities. The per worker productivity for all rural household industries together is accounted for Rs.11.5 thousand and it ranged lowest at Rs.5.5 thousand for basketry and mating to highest at Rs.22.9 thousand for repairing and servicing activities. A significant level of differences are also well existing in the pattern of income generation of different rural industries, though a marginal extent of variations are prevailing between the level of per unit amount of income and value added being
Page No.129
generated from different industries, because most rural industries are no way hiring any paid worker and are running with employing their family workforce only.
Similarly, with a very high raw material content, which is basically obtained from local forests without any cost in the cases of most rural industries, the per unit value added to output ratio is turn out at much higher rate of over 68 per cent. In fact the corresponding ratio is resulted to be as higher as 96 per cent for basketry and mating units closely followed by repairing and servicing activities (95 per cent) though it stands lowest for woolen activities (44 per cent) followed by carpentry (59 per cent). Due to differences in employment size, the ratio of value added per worker to output for carpentry has reduced significantly at much higher level than the remaining rural industries, and it followed fairly larger for repairing and servicing activities (Rs.21801) followed by flour mills (Rs.12620) and carpentry (Rs.10590) and lowest for woolen activities (Rs.2876). Further it has been recognised that due to lower level of absorption of hired labours in rural industrial activities the differences between value added and income turn out to be at very lower extent as compared to the differences in the ratio of value added to output. The ratio of per unit value added to net income for different industries together is accounted for 96 per cent, though the corresponding ratio ranged between 90 per cent to 100 per cent, respectively for flour mills and rope making units. Further, the earning per household worker is estimated to be around Rs.8 thousand and the household workers those are engaged in modern type of industrial units such as flour mills and repairing and servicing are generating fairly much larger amount of earnings as compared to those are engaged in traditional form of household based rural industries. Given the fact that most industrial units in rural areas are carried out as household enterprises with a main objective of earnings a livelihood, and that, a majority of household workers are working on full time basis making them as the principle occupation and source of household income. As found earlier in table 5.4, over 36 per cent of the income of the households are being derived from the rural manufacturing activities. If one takes the figure of Rs.14000 per household per annum as the minimum to get the poverty line, an income of Rs.9601 per enterprise or Rs.7947 per household worker would be considered as the minimum from the concerned industrial activity to make the household to cross the absolute poverty line. It may also be pointed out that the rural industrial activities are largely contributing in the incomes of different rural households those are engaged on them along with the amount of income generated from farm activities so as to cross the absolute poverty line. In this sense initiating for diversification of rural industrial activities through introducing market oriented goods and articles in production system and bring improvement in the quality of the product would be a most important instrumental measure for increasing the income of rural households.
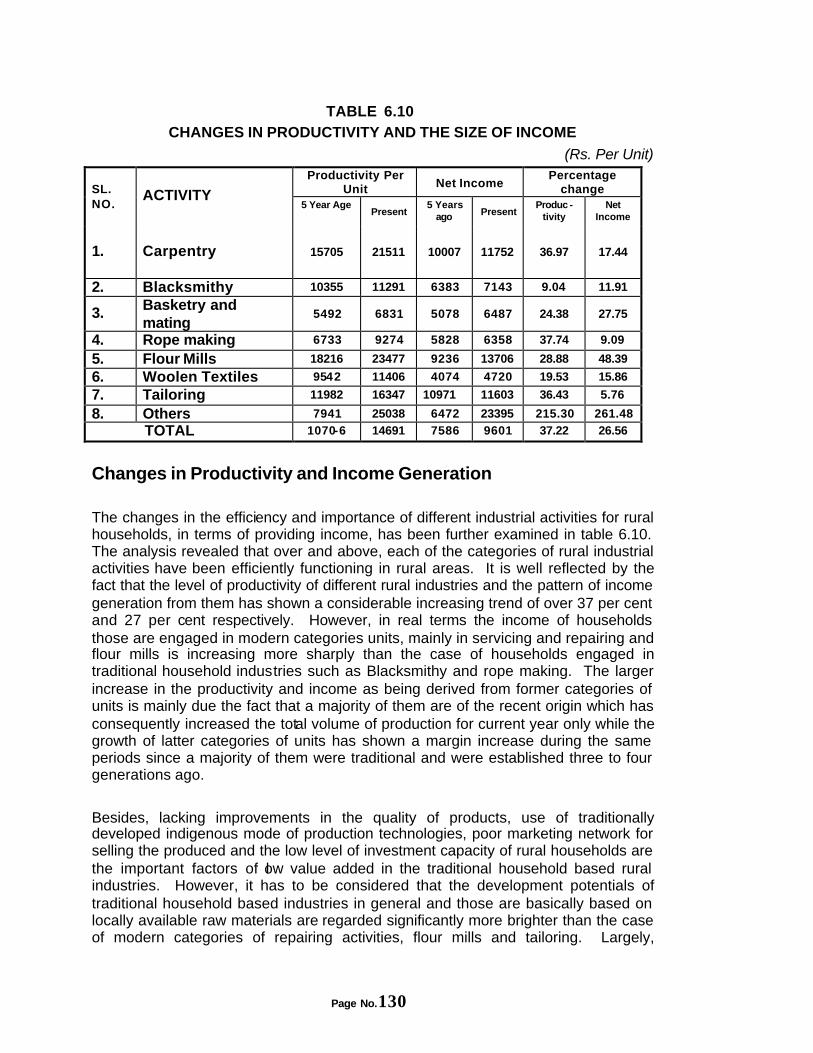
Page No.130
TABLE 6.10 CHANGES IN PRODUCTIVITY AND THE SIZE OF INCOME
(Rs. Per Unit) Productivity Per
Unit Net Income Percentage
change SL. NO.
ACTIVITY 5 Year Age
Present 5 Years
ago Present Produc -
tivity Net
Income
1. Carpentry
15705 21511 10007 11752 36.97 17.44
2. Blacksmithy 10355 11291 6383 7143 9.04 11.91
3. Basketry and mating
5492 6831 5078 6487 24.38 27.75
4. Rope making 6733 9274 5828 6358 37.74 9.09
5. Flour Mills 18216 23477 9236 13706 28.88 48.39
6. Woolen Textiles 9542 11406 4074 4720 19.53 15.86
7. Tailoring 11982 16347 10971 11603 36.43 5.76
8. Others 7941 25038 6472 23395 215.30 261.48
TOTAL 1070-6 14691 7586 9601 37.22 26.56
Changes in Productivity and Income Generation
The changes in the efficiency and importance of different industrial activities for rural households, in terms of providing income, has been further examined in table 6.10. The analysis revealed that over and above, each of the categories of rural industrial activities have been efficiently functioning in rural areas. It is well reflected by the fact that the level of productivity of different rural industries and the pattern of income generation from them has shown a considerable increasing trend of over 37 per cent and 27 per cent respectively. However, in real terms the income of households those are engaged in modern categories units, mainly in servicing and repairing and flour mills is increasing more sharply than the case of households engaged in traditional household industries such as Blacksmithy and rope making. The larger increase in the productivity and income as being derived from former categories of units is mainly due the fact that a majority of them are of the recent origin which has consequently increased the total volume of production for current year only while the growth of latter categories of units has shown a margin increase during the same periods since a majority of them were traditional and were established three to four generations ago.
Besides, lacking improvements in the quality of products, use of traditionally developed indigenous mode of production technologies, poor marketing network for selling the produced and the low level of investment capacity of rural households are the important factors of low value added in the traditional household based rural industries. However, it has to be considered that the development potentials of traditional household based industries in general and those are basically based on locally available raw materials are regarded significantly more brighter than the case of modern categories of repairing activities, flour mills and tailoring. Largely,
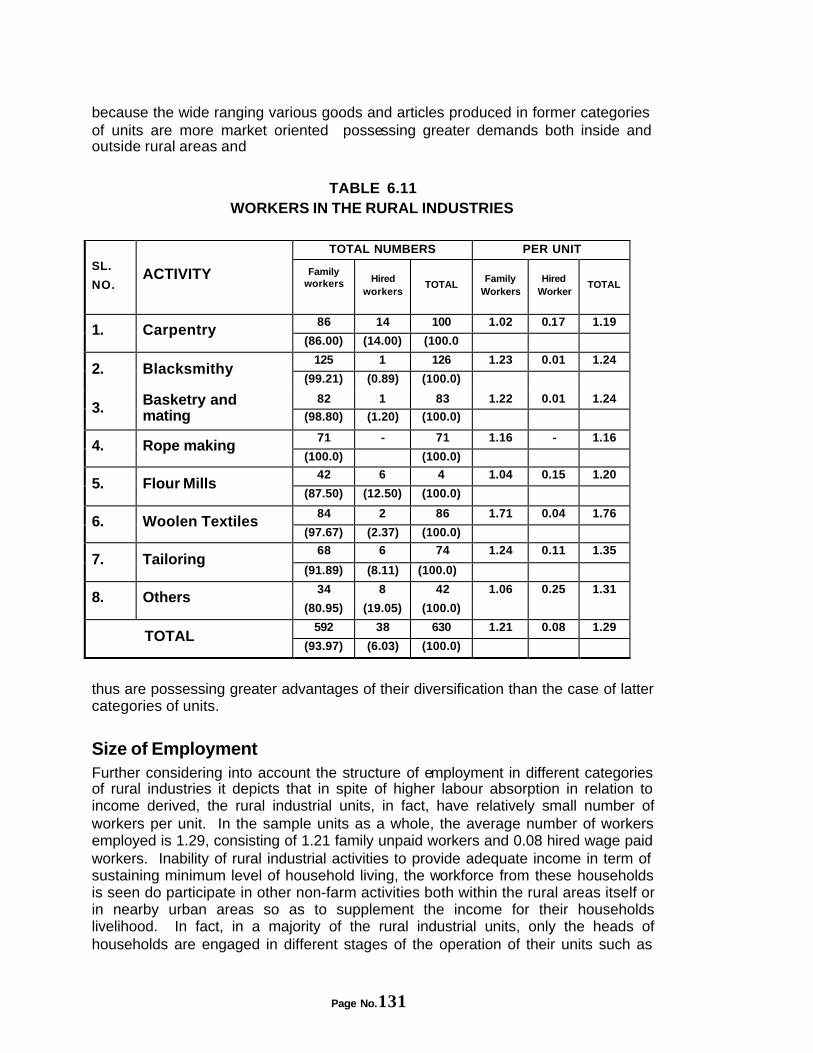
Page No.131
because the wide ranging various goods and articles produced in former categories of units are more market oriented possessing greater demands both inside and outside rural areas and
TABLE 6.11
WORKERS IN THE RURAL INDUSTRIES
TOTAL NUMBERS PER UNIT SL.
NO.
ACTIVITY Family workers
Hired workers
TOTAL Family
Workers Hired
Worker TOTAL
86 14 100 1.02 0.17 1.19 1. Carpentry
(86.00) (14.00) (100.0
125 1 126 1.23 0.01 1.24 2. Blacksmithy
(99.21) (0.89) (100.0)
82 1 83 1.22 0.01 1.24 3. Basketry and
mating (98.80) (1.20) (100.0)
71 - 71 1.16 - 1.16 4. Rope making
(100.0) (100.0)
42 6 4 1.04 0.15 1.20 5. Flour Mills
(87.50) (12.50) (100.0)
84 2 86 1.71 0.04 1.76 6. Woolen Textiles
(97.67) (2.37) (100.0)
68 6 74 1.24 0.11 1.35 7. Tailoring
(91.89) (8.11) (100.0)
34 8 42 1.06 0.25 1.31 8. Others
(80.95) (19.05) (100.0)
592 38 630 1.21 0.08 1.29 TOTAL
(93.97) (6.03) (100.0)
thus are possessing greater advantages of their diversification than the case of latter categories of units.
Size of Employment Further considering into account the structure of employment in different categories of rural industries it depicts that in spite of higher labour absorption in relation to income derived, the rural industrial units, in fact, have relatively small number of workers per unit. In the sample units as a whole, the average number of workers employed is 1.29, consisting of 1.21 family unpaid workers and 0.08 hired wage paid workers. Inability of rural industrial activities to provide adequate income in term of sustaining minimum level of household living, the workforce from these households is seen do participate in other non-farm activities both within the rural areas itself or in nearby urban areas so as to supplement the income for their households livelihood. In fact, in a majority of the rural industrial units, only the heads of households are engaged in different stages of the operation of their units such as
Page No.132
collection and obtaining of raw materials, production process and the marketing of goods and articles. Even, over one third of the total rural industrial activities are alone handled by the retired personnel from their last occupation in Government sector and those belonging to the age groups of above 60 years. Over and above, the rural industrial units are mainly run by the head of households and to a certain extent through engaging their available family workforce while only few units are seen employing hired labour on wages for only specific kinds of work which cannot be performed alone by the heads of the households of the concerned industries. The proportion of hired worker employed in rural industrial activities accounted for only 6.03 per cent and its proportion ranged highest at 19.05 per cent in repairs and servicing activities to lowest at 0.89 per cent in Blacksmithy with no hired labour is employed by rope making units. It has been well visualised that a very low level of earnings available from the rural industrial activities is restricting the scope for employing of both family and outside family workforce in different rural enterprises. Since these views are well supported by the evidence that the size of workforce employed in different units is significantly well related according to the size of income generated by them (Table 6.9).
Production, Sale and Self Consumption of Goods
The size and structure of manufacturing various goods and articles in rural industrial enterprises is largely governed by the demand generated by local villages and the requirement of own households for different goods produced by them. Only few enterprises such as tailoring, black smithy, rope making and woolen are involved in the production of various goods for meeting the local demands as well as for selling outside their villages. However, the size of production of various goods is undertaken according to the demands of local household, therefore, the question of keeping unsold goods and articles as a stock is hardly arisen. It is, therefore, we find that the entire quantity of production of various commodities of the rural industries is either sold or it is used by its households, though a major proportion of production (99.25 per cent) is sold to the consumers and a very small part of it is reported to be used by the concerned households itself (Table 6.10).
Pattern of Sale As indicated earlier that the nature of production of various goods in rural industries is mainly to satisfy the local requirements. These view are further strengthened by the fact that a fairly high proportion of around 63 per cent of the total sale of goods is carried out directly to the local people from the site of the workplace of the industrial units. In all, the local villages, nearby villages and nearby towns are noted to be most preferred destinations for the sale of the goods and articles manufactured in rural industrial enterprises. However,

Page No.133
TAB LE 6.12 VALUE OF PRODUCTION, SALE AND SELF CONSUMPTION
Sl. No.
ACTIVITY Total Production Total Sale
Total Self Consumption
1806924 1788924 8000 1. Carpentry
(100.0) (99.56) (0.44)
1151682 1146082 5600 2. Blacksmithy
(100.0) (99.51) (0.49)
457677 452627 5050 3. Basketry
(100.0) (98.90) (1.10)
584014 577764 6250 4. Rope Making
(100.0) (98.94) (1.06)
439080 936680 2400 5. Flour Mills
(100.0) (99.74) (0.26)
558894 534454 24440 6. Woolen Textiles
(100.0) (96.24) (3.76)
899085 891335 7750 7. Tailoring
(100.0) (99.14) (0.86)
801234 795234 6000 8. Others
(100.0) (99.25) (0.75)
7198590 7133100 65490 TOTAL
(100.0) (99.25) (0.75)
the products of black smithy, tailoring rope making and flourmills are largely being sold in the local villages itself. In fact, the nature of performing repairing and servicing activities, of modern rural industrial units is also basically based on the local demands though a significant level of repairing and servicing work is also being done by them for the individuals of neighbouring villages. The flourmills are found involved in the processing of various foodgrains for only local villagers while the tailors are engaged mainly to perform work for local villagers and only to a limited extent for nearby villagers. The carpentry households are seen manufacturing various wooden based furnitures and several other wooden goods for its supply to different nearby villages and towns and even to sale outside the district. However, the indications are that the traditional household based rural industries such as basketry, woolen and rope making units have started to sale their products through different channels, both within and outside villages, nearby towns and even in the exhibitions those are organised outside Uttaranchal, during the recent past, though a major proportion of the sale of goods is performed at the village level by each of the industrial units. Thus, it is well evident that the products manufactured in traditional household industrial units are not only meeting the demands of local households but the demands of these products have been considerably increasing in neighbouring villages, nearby towns and even outside Uttaranchal. While the production basis of
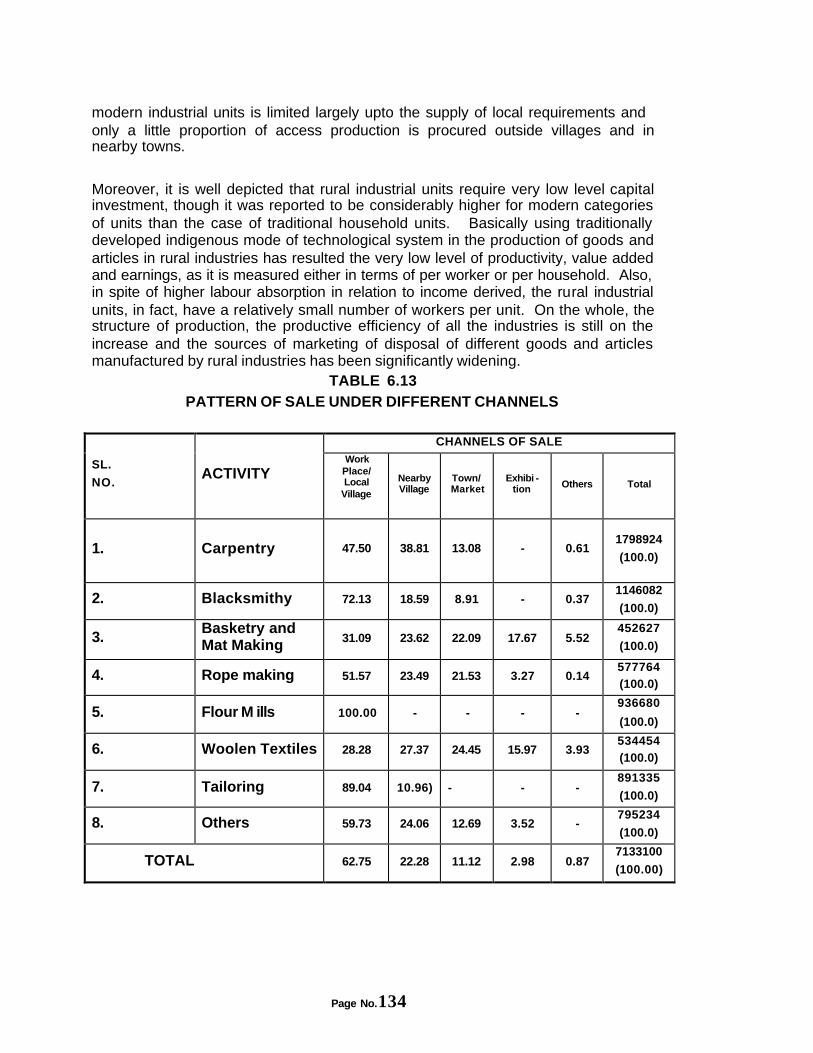
Page No.134
modern industrial units is limited largely upto the supply of local requirements and only a little proportion of access production is procured outside villages and in nearby towns.
Moreover, it is well depicted that rural industrial units require very low level capital investment, though it was reported to be considerably higher for modern categories of units than the case of traditional household units. Basically using traditionally developed indigenous mode of technological system in the production of goods and articles in rural industries has resulted the very low level of productivity, value added and earnings, as it is measured either in terms of per worker or per household. Also, in spite of higher labour absorption in relation to income derived, the rural industrial units, in fact, have a relatively small number of workers per unit. On the whole, the structure of production, the productive efficiency of all the industries is still on the increase and the sources of marketing of disposal of different goods and articles manufactured by rural industries has been significantly widening.
TABLE 6.13 PATTERN OF SALE UNDER DIFFERENT CHANNELS
CHANNELS OF SALE
SL.
NO.
ACTIVITY Work
Place/ Local
Village
Nearby Village
Town/ Market
Exhibi - tion Others Total
1. Carpentry
47.50 38.81 13.08 - 0.61 1798924
(100.0)
2. Blacksmithy 72.13 18.59 8.91 - 0.37 1146082
(100.0)
3. Basketry and Mat Making 31.09 23.62 22.09 17.67 5.52
452627
(100.0)
4. Rope making 51.57 23.49 21.53 3.27 0.14 577764 (100.0)
5. Flour M ills 100.00 - - - - 936680
(100.0)
6. Woolen Textiles 28.28 27.37 24.45 15.97 3.93 534454 (100.0)
7. Tailoring 89.04 10.96) - - - 891335
(100.0)
8. Others 59.73 24.06 12.69 3.52 - 795234
(100.0)
TOTAL 62.75 22.28 11.12 2.98 0.87 7133100
(100.00)
Page No.135
CHAPTER VII
CONSTRAINTS AND CONSTRAINTS AND PERSPECTIVES OF PERSPECTIVES OF
DEVELOPMENTDEVELOPMENT The scope for initiating large scale industrialisation and widespread diversification of economic activities is limited in most mountain and hill areas, including in Uttaranchal, because of a number of factors such as the limited and environmentally sensitive resource base, the thin spread of usable resources across difficult and inaccessible terrain, inaccessibility to markets and modern inputs and technology, deficient infrastructure and insufficient energy and high transport costs leading to non-competitiveness of products (Papola 1996), in addition to the experienced increasing dangers of environmental degradation and distress of ecological systems over the years. And thus the expansion of small scale enterprises has universally been recognised as an important alternative option in order to meet the increasing demand of employment of additional labourforce in the state. Since, the development potentials of agriculture and its assoc iated activities are largely restricted by several basic problems. Consequently, the difficult terrain combined with infrastructural and environmental problems in mountain areas made them less conducive to the establishment of large-scale enterprises (Rizwanul 1996).
No doubt, almost the hilly and mountainous part of the state is possessing certain area specific comparative advantages and opportunities in terms of the expansion of various locally available raw material resources based small scale manufacturing enterprises. Harnessing of these available advantages and niche are expected would prove as an instrumental measure for increasing employment and the avenues of income so as to bring drastic reduction in the existing level of poverty and the problem of un-employment in different geographical locations of the state. However, there are various other factors which equally influence and determine the scope of expansion of rural non-farm enterprises in different locations. As we found earlier in chapter II that in real sense the non-farm activities of different categories are consistently declining in the rural areas of different geographical locations of each of the nine districts of the state. However, the rural enterprises concentrated in non-manufacturing sector, such as trading and commercial transportation and personal services, have shown a significant increase as against a considerable
Page No.136
decrease of manufacturing activities in general and those production process is basically based on locally available raw materials over the years.
In this context we finally reach at the conclusion that the considerable expansion in the various social infrastructural facilities and the significant improvements in the accessibility of rural areas into the facilities of road transportation during the recent past have consequently provided an increasing opportunities to the rural people in the expansion of various non-farm enterprises both along the roadsides and in the villages of nearby roads. Hence, it is expected that the expansion pattern of various non-manufacturing activities will continue to a certain extent and their further expansion will be largely determined by the process of development of various other productive economic sectors, along with the general increase in the income level of rural households and the process of expansion and providing various infrastructural facilities, including the expansion of roads, in different geographical locations of the state. However, the expansion and establishment pattern of various manufacturing enterprises have been slow down, in fact many product groups of them have been closed in different geographical locations over the years. In this context, we further attempted to examine the nature and extent of problems and constraints existing in the successful functioning, growth and development of different rural industrial enterprises in the sample areas. The concerned analysis is expected would provide a conceptual base for initiating planning development of different product groups of rural industries in the state.
Constraints Imposing Limitations for Development
Beside the low level of income generation capacity and decreasing participation of young generation to adopt traditional household rural industrial activities as the sources of their employment and income, the problems associated with the availability pattern of raw materials, finance and credit, technology adoption prevailing system of marketing arrangements and the product competition in selling the goods outside rural areas are equally limiting the growth of various rural industrial enterprises is the state.
Availability of Raw Materials
Perhaps one of the most serious constraints in the productivity and development of rural industrial activities is the decreasing availability of various raw materials used in the productions of goods and articles. Traditionally, most raw materials were locally and easily available in adequate quantity at reasonable prices, even most raw materials were obtained from the local forests without paying any cost of it. However, due to increasing deforestation undertaken by the local people to meet their requirement of fuel and animal feeding and at some extent for selling forest products in nearby market so as to sustain the live lihood and by the forest mafias for its commercial uses during the recent past, the availability of required materials in nearby forests of the villages has not only compelled the rural industrial households to cover longer distances to obtain the raw materials but most of the forest products can be obtained through making at least some amounts of payments for its collection in the form of royalty to the forest department and the Van Panchayats.
Page No.137
The accessibility situation of raw materials for different rural industrial activities, in term of distances they are usually covering for obtaining required raw material is presented in table 7.1. However, the concerned analysis is based on information collected in this regard from only 453 units those were established before the period 1995 because the remaining units those were established after 1995 were not in a position to provide reliable information about the availability situation of local raw material before the period of the establishment of their unit. The analysis has well depicted the fact that a majority of the entrepreneurs (44.37 per cent) have to cover a larger distance of above five kms. to get the required raw materials and the average distance to be covered for obtaining different raw materials have been considerably increasing for the cases of the rural industries those are basically using locally available raw materials in the production of goods. However, due to increasing pattern in the expansion of roads and transportation facilities in one hand and a significant improvements in the establishment of various trading and commercial activities along the roadsides and nearby villages on the other had consequently reduced the distance for obtaining various materials of rural industrial units those were earlier obtaining it from outside villages. The most sufferer in terms of the accessibility to raw material and those are covering a longer distances for getting required raw materials are visualised among the traditional household rural industrial enterprises such as black-smithy, basketry and mating units. However, little improvements has been occurred in the distance to be covered for getting raw materials for woolen and rope making product groups of rural industrial enterprises. However, despite the fact that a fairly larger proportions of over 44 per cent entrepreneurs of different industrial units were earlier noted covering a fairly longer distances for obtaining of the required raw material but in real sense only around one third of them are actually realising that the increase in distance to the accessibility of raw material is the prime problem for them to run the concerned units successfully. But the problems such as increasing overall scarcity, increasing trends in the prices and decreasing quality of various raw materials are reported to be the equally most and additional important factors behind the proper functioning of rural industries. In fact over 46 per cent of the entrepreneurs of rural industries are found no way facing any problem in the availability of raw materials. Among them a highest proportion of units consisted of flour mills (78 per cent) followed by tailoring (67 per cent) service and repairing related (66 per cent) and woolen (53 per cent) activities. At the same time a majority of the rope making (62 per cent) and basketry and mat making (52 per cent) units are not getting adequate quantity of raw materials, and also a fairly high proportions of 67 per cent industrial units among latter groups have to cover a longer distances of above 5 kms. to find the required raw materials.
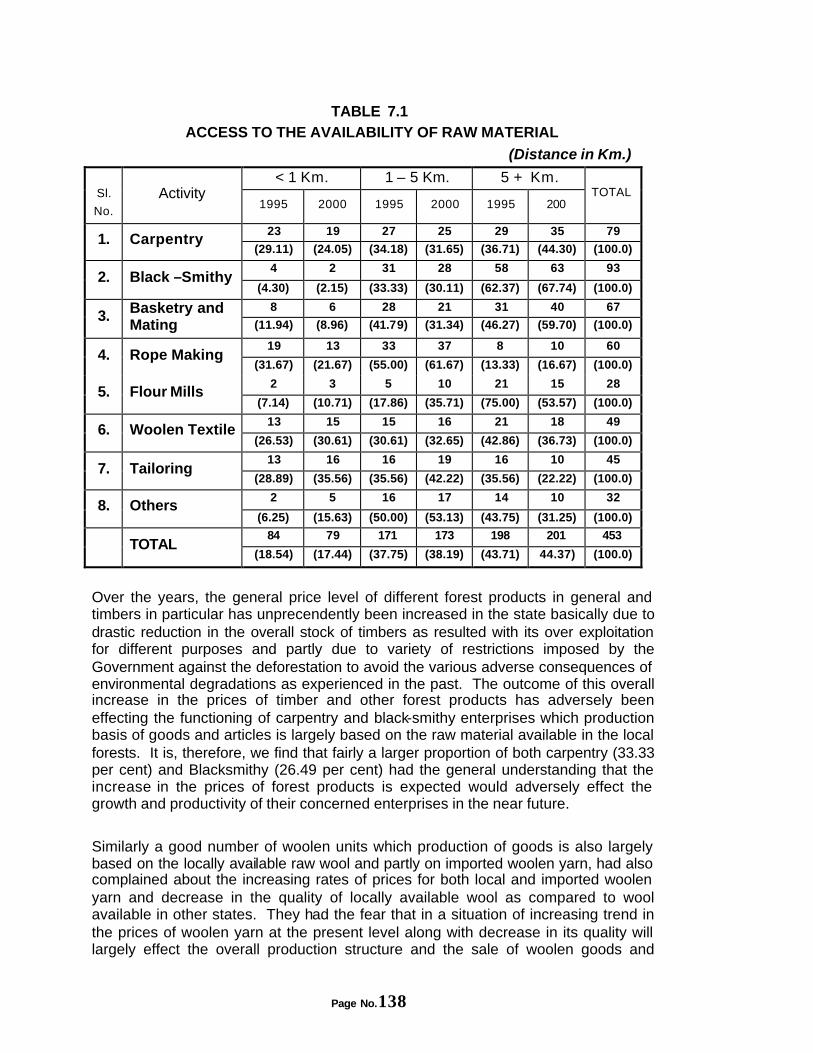
Page No.138
TABLE 7.1 ACCESS TO THE AVAILABILITY OF RAW MATERIAL
(Distance in Km.)
< 1 Km. 1 – 5 Km. 5 + Km.
Sl.
No.
Activity 1995 2000 1995 2000 1995 200
TOTAL
23 19 27 25 29 35 79 1. Carpentry
(29.11) (24.05) (34.18) (31.65) (36.71) (44.30) (100.0)
4 2 31 28 58 63 93 2. Black –Smithy
(4.30) (2.15) (33.33) (30.11) (62.37) (67.74) (100.0)
8 6 28 21 31 40 67 3. Basketry and
Mating (11.94) (8.96) (41.79) (31.34) (46.27) (59.70) (100.0)
19 13 33 37 8 10 60 4. Rope Making
(31.67) (21.67) (55.00) (61.67) (13.33) (16.67) (100.0)
2 3 5 10 21 15 28 5. Flour Mills
(7.14) (10.71) (17.86) (35.71) (75.00) (53.57) (100.0)
13 15 15 16 21 18 49 6. Woolen Textile
(26.53) (30.61) (30.61) (32.65) (42.86) (36.73) (100.0)
13 16 16 19 16 10 45 7. Tailoring
(28.89) (35.56) (35.56) (42.22) (35.56) (22.22) (100.0)
2 5 16 17 14 10 32 8. Others
(6.25) (15.63) (50.00) (53.13) (43.75) (31.25) (100.0)
84 79 171 173 198 201 453 TOTAL
(18.54) (17.44) (37.75) (38.19) (43.71) 44.37) (100.0)
Over the years, the general price level of different forest products in general and timbers in particular has unprecendently been increased in the state basically due to drastic reduction in the overall stock of timbers as resulted with its over exploitation for different purposes and partly due to variety of restrictions imposed by the Government against the deforestation to avoid the various adverse consequences of environmental degradations as experienced in the past. The outcome of this overall increase in the prices of timber and other forest products has adversely been effecting the functioning of carpentry and black-smithy enterprises which production basis of goods and articles is largely based on the raw material available in the local forests. It is, therefore, we find that fairly a larger proportion of both carpentry (33.33 per cent) and Blacksmithy (26.49 per cent) had the general understanding that the increase in the prices of forest products is expected would adversely effect the growth and productivity of their concerned enterprises in the near future.
Similarly a good number of woolen units which production of goods is also largely based on the locally available raw wool and partly on imported woolen yarn, had also complained about the increasing rates of prices for both local and imported woolen yarn and decrease in the quality of locally available wool as compared to wool available in other states. They had the fear that in a situation of increasing trend in the prices of woolen yarn at the present level along with decrease in its quality will largely effect the overall production structure and the sale of woolen goods and

Page No.139
articles adversely. And the woolen products manufactured by them would hardly be in a position to compete against the arrival of similar goods with better quality and lower price ranges in the market from outside the state.
TABLE 7.2
NATURE OF PROBLEMS EXISTING IN THE AVAILABILITY OF RAW MATERIAL
Kind of Problem
Sl. No. Product No
Problem
Scarcity/ Inade -
quacy
To Cover long
distance
High Prices
Quality No. of Units
44 13 17 28 7 84 1. Carpentry
(52.38) (15.48) (20.24) (33.33) (8.33) 100.0)
48 21 42 27 4 102 2. Black –Smithy
(47.06) (20.59) (41.18) (26.47) (3.92) (100.0)
11 35 45 8 4 67 3. Basketry and
Mating (16.42) (52.24) (67.16) (11.94) (5.97) (1`00.0)
9 38 22 8 4 61 4. Rope Making
(14.75) (62.29) (36.07) (13.12) (6.56) (100.0)
31 2 5 5 2 40 5. Flour Mill
(77.50) (5.00) (12.50) (12.50) (5.00) (100.0)
26 5 7 11 8 49 6. Woolen Textile
(53.06) (10.20) (14.29) (22.45) (16.33) (100.0)
37 - 7 10 2 55 7. Tailoring
(67.27) - (12.73) (18.18) (3.64) (100.0)
21 5 9 5 - 32 8. Others
(65.63) (15.63) (28.13) (15.63) - (100.0)
227 119 154 102 314 490 TOTAL
(46.33) (24.29) 31.43) (20.82) (6.33) (100.0)
Problems in Marketing
Lack of demand for the products of rural industrial enterprises outside local and rural areas is often considered as a serious constraint in their expansion and development. Large proportions of items produced by household-based traditional rural industrial units are utilitarian rather than luxury goods. The bulk of the demand for these products is, therefore, found in rural areas, among people with limited purchasing power and low budget for these items. In the cases of certain goods and articles manufactured by some of the industrial groups, like carpentry, woolen, basketry, mat making, enter in the nearby market and outside rural areas they find a severe competition from the similar goods manufactured through modern technology in urban areas.
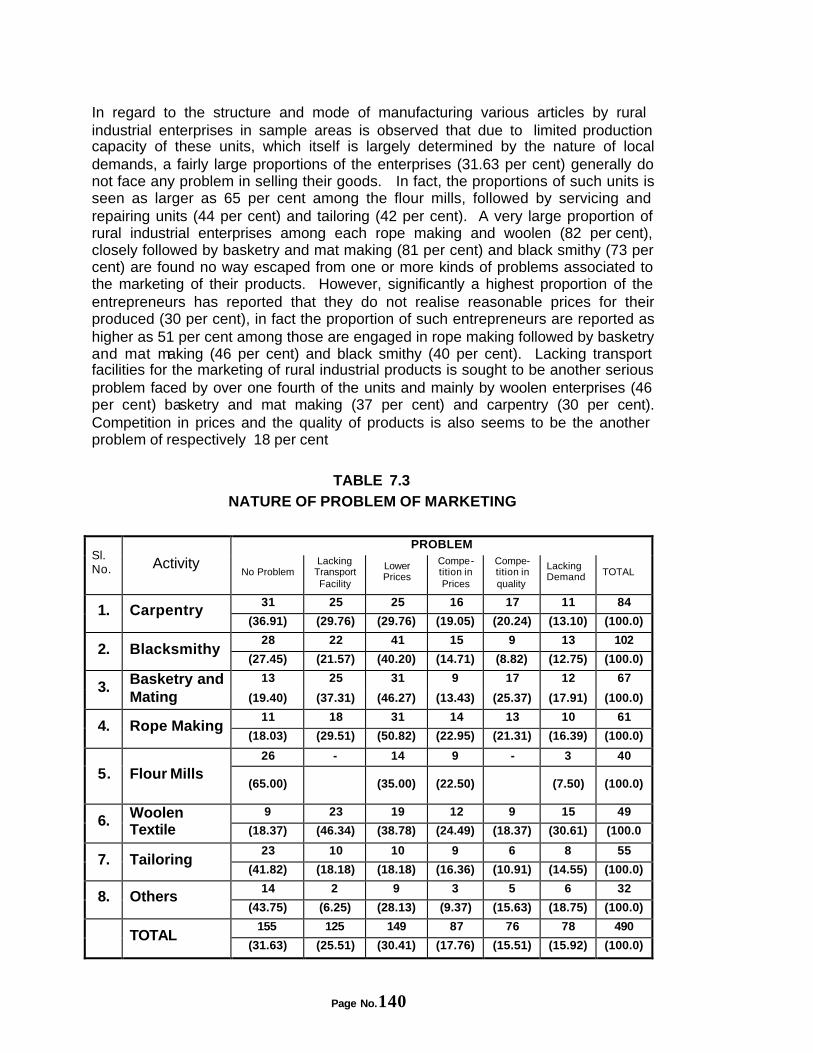
Page No.140
In regard to the structure and mode of manufacturing various articles by rural industrial enterprises in sample areas is observed that due to limited production capacity of these units, which itself is largely determined by the nature of local demands, a fairly large proportions of the enterprises (31.63 per cent) generally do not face any problem in selling their goods. In fact, the proportions of such units is seen as larger as 65 per cent among the flour mills, followed by servicing and repairing units (44 per cent) and tailoring (42 per cent). A very large proportion of rural industrial enterprises among each rope making and woolen (82 per cent), closely followed by basketry and mat making (81 per cent) and black smithy (73 per cent) are found no way escaped from one or more kinds of problems associated to the marketing of their products. However, significantly a highest proportion of the entrepreneurs has reported that they do not realise reasonable prices for their produced (30 per cent), in fact the proportion of such entrepreneurs are reported as higher as 51 per cent among those are engaged in rope making followed by basketry and mat making (46 per cent) and black smithy (40 per cent). Lacking transport facilities for the marketing of rural industrial products is sought to be another serious problem faced by over one fourth of the units and mainly by woolen enterprises (46 per cent) basketry and mat making (37 per cent) and carpentry (30 per cent). Competition in prices and the quality of products is also seems to be the another problem of respectively 18 per cent
TABLE 7.3
NATURE OF PROBLEM OF MARKETING
PROBLEM Sl. No. Activity
No Problem Lacking
Transport Facility
Lower Prices
Compe-tition in Prices
Compe-tition in quality
Lacking Demand TOTAL
31 25 25 16 17 11 84 1. Carpentry
(36.91) (29.76) (29.76) (19.05) (20.24) (13.10) (100.0)
28 22 41 15 9 13 102 2. Blacksmithy
(27.45) (21.57) (40.20) (14.71) (8.82) (12.75) (100.0)
13 25 31 9 17 12 67 3. Basketry and
Mating (19.40) (37.31) (46.27) (13.43) (25.37) (17.91) (100.0)
11 18 31 14 13 10 61 4. Rope Making
(18.03) (29.51) (50.82) (22.95) (21.31) (16.39) (100.0)
26 - 14 9 - 3 40
5. Flour Mills (65.00)
(35.00) (22.50) (7.50) (100.0)
9 23 19 12 9 15 49 6. Woolen
Textile (18.37) (46.34) (38.78) (24.49) (18.37) (30.61) (100.0
23 10 10 9 6 8 55 7. Tailoring
(41.82) (18.18) (18.18) (16.36) (10.91) (14.55) (100.0)
14 2 9 3 5 6 32 8. Others
(43.75) (6.25) (28.13) (9.37) (15.63) (18.75) (100.0)
155 125 149 87 76 78 490 TOTAL
(31.63) (25.51) (30.41) (17.76) (15.51) (15.92) (100.0)
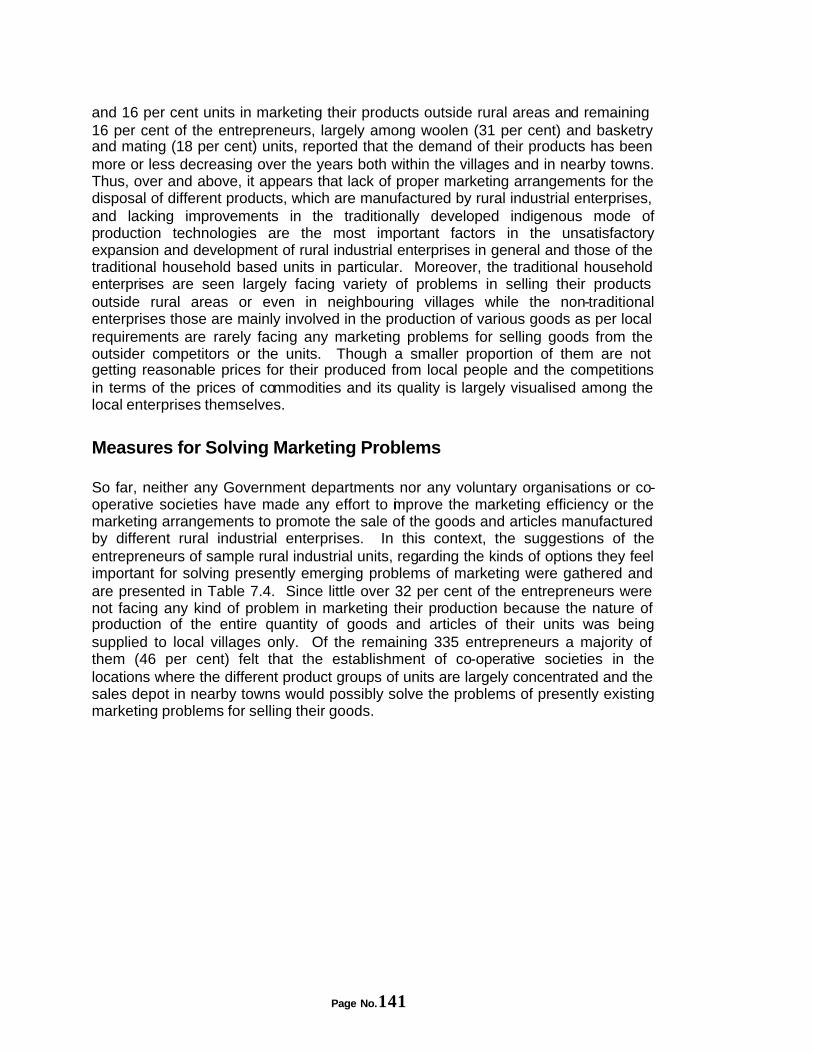
Page No.141
and 16 per cent units in marketing their products outside rural areas and remaining 16 per cent of the entrepreneurs, largely among woolen (31 per cent) and basketry and mating (18 per cent) units, reported that the demand of their products has been more or less decreasing over the years both within the villages and in nearby towns. Thus, over and above, it appears that lack of proper marketing arrangements for the disposal of different products, which are manufactured by rural industrial enterprises, and lacking improvements in the traditionally developed indigenous mode of production technologies are the most important factors in the unsatisfactory expansion and development of rural industrial enterprises in general and those of the traditional household based units in particular. Moreover, the traditional household enterprises are seen largely facing variety of problems in selling their products outside rural areas or even in neighbouring villages while the non-traditional enterprises those are mainly involved in the production of various goods as per local requirements are rarely facing any marketing problems for selling goods from the outsider competitors or the units. Though a smaller proportion of them are not getting reasonable prices for their produced from local people and the competitions in terms of the prices of commodities and its quality is largely visualised among the local enterprises themselves.
Measures for Solving Marketing Problems
So far, neither any Government departments nor any voluntary organisations or co-operative societies have made any effort to improve the marketing efficiency or the marketing arrangements to promote the sale of the goods and articles manufactured by different rural industrial enterprises. In this context, the suggestions of the entrepreneurs of sample rural industrial units, regarding the kinds of options they feel important for solving presently emerging problems of marketing were gathered and are presented in Table 7.4. Since little over 32 per cent of the entrepreneurs were not facing any kind of problem in marketing their production because the nature of production of the entire quantity of goods and articles of their units was being supplied to local villages only. Of the remaining 335 entrepreneurs a majority of them (46 per cent) felt that the establishment of co-operative societies in the locations where the different product groups of units are largely concentrated and the sales depot in nearby towns would possibly solve the problems of presently existing marketing problems for selling their goods.
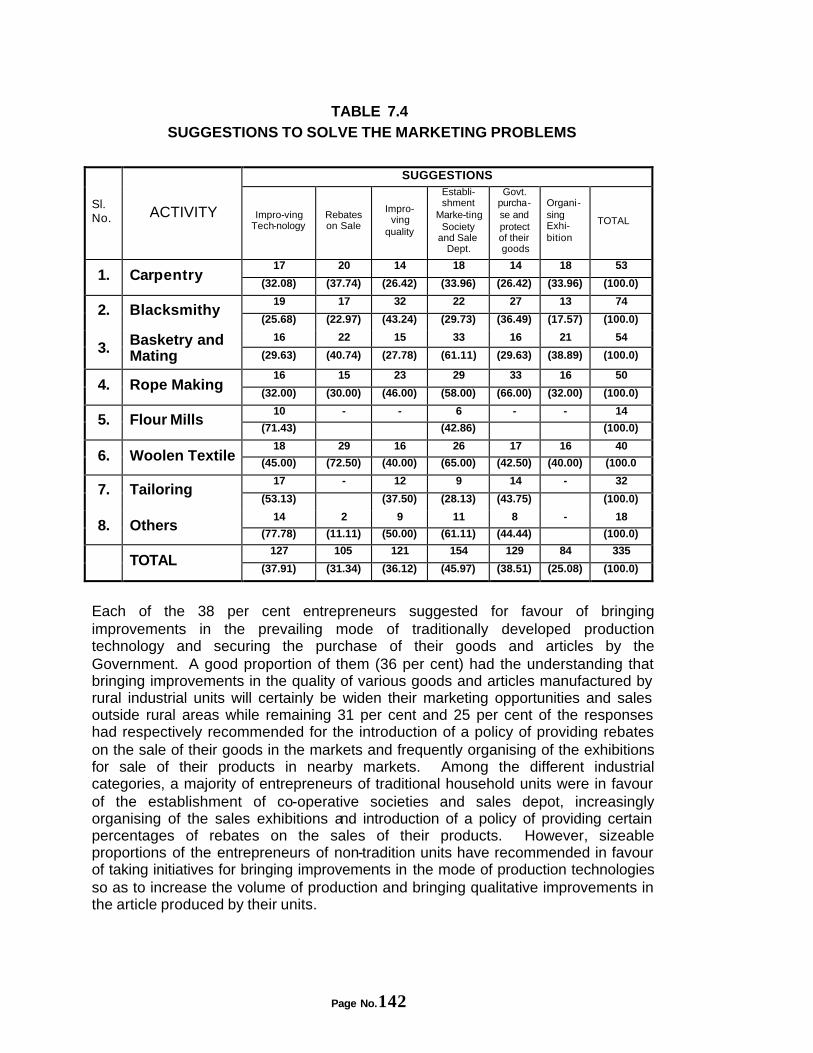
Page No.142
TABLE 7.4 SUGGESTIONS TO SOLVE THE MARKETING PROBLEMS
SUGGESTIONS
Sl. No. ACTIVITY Impro-ving
Tech-nology Rebates on Sale
Impro-ving
quality
Establi-shment
Marke-ting Society
and Sale Dept.
Govt. purcha-se and protect of their goods
Organi-sing Exhi-bition
TOTAL
17 20 14 18 14 18 53 1. Carpentry
(32.08) (37.74) (26.42) (33.96) (26.42) (33.96) (100.0)
19 17 32 22 27 13 74 2. Blacksmithy
(25.68) (22.97) (43.24) (29.73) (36.49) (17.57) (100.0)
16 22 15 33 16 21 54 3. Basketry and
Mating (29.63) (40.74) (27.78) (61.11) (29.63) (38.89) (100.0)
16 15 23 29 33 16 50 4. Rope Making
(32.00) (30.00) (46.00) (58.00) (66.00) (32.00) (100.0)
10 - - 6 - - 14 5. Flour Mills
(71.43) (42.86) (100.0)
18 29 16 26 17 16 40 6. Woolen Textile (45.00) (72.50) (40.00) (65.00) (42.50) (40.00) (100.0
17 - 12 9 14 - 32 7. Tailoring
(53.13) (37.50) (28.13) (43.75) (100.0)
14 2 9 11 8 - 18 8. Others
(77.78) (11.11) (50.00) (61.11) (44.44) (100.0)
127 105 121 154 129 84 335 TOTAL
(37.91) (31.34) (36.12) (45.97) (38.51) (25.08) (100.0)
Each of the 38 per cent entrepreneurs suggested for favour of bringing improvements in the prevailing mode of traditionally developed production technology and securing the purchase of their goods and articles by the Government. A good proportion of them (36 per cent) had the understanding that bringing improvements in the quality of various goods and articles manufactured by rural industrial units will certainly be widen their marketing opportunities and sales outside rural areas while remaining 31 per cent and 25 per cent of the responses had respectively recommended for the introduction of a policy of providing rebates on the sale of their goods in the markets and frequently organising of the exhibitions for sale of their products in nearby markets. Among the different industrial categories, a majority of entrepreneurs of traditional household units were in favour of the establishment of co-operative societies and sales depot, increasingly organising of the sales exhibitions and introduction of a policy of providing certain percentages of rebates on the sales of their products. However, sizeable proportions of the entrepreneurs of non-tradition units have recommended in favour of taking initiatives for bringing improvements in the mode of production technologies so as to increase the volume of production and bringing qualitative improvements in the article produced by their units.
Page No.143
Options for Solving the Problems of Raw Materials Availability: Establishment of Raw Material Banks (RMB) and the introduction of a policy measure to provide subsidy on the purchase of raw materials from different sources and destinations are suggested among the various most important options by over a half of the sample entrepreneurs of different rural industrial units for solving the emerging problems in acquiring of various raw material as per their requirements. Introduction of transport subsidy in transporting raw material from different destinations and the transportation of goods and articles into nearby markets for sale and providing financial assistance for the purchase of raw materials, machinery and equipments and bringing improvements in the production technologies are also recommended as the major options for mitigating the existing problems related to the timely supply of adequate quantity raw materials to them.
TABLE 7.5
SUGGESTIONS TO SOLVE THE PROBLEMS OF RAW MATERIALS
SUGGESTIONS Sl.No
ACTIVITY Establishment of
Raw Material Bank
Provision for subsidy on the
purchase of Raw Materials
Introduction of Transport
Subsidy on raw materials and final produced
Financial Assistance on
Raw Material and Know how
TOTAL
(No. of Units)
29 25 14 16 40 1. Carpentry
(72.50) (62.50) (35.00) (40.00) (100.0) 27 33 18 11 54
2. Black-Smithy (50.00) (61.11) (33.33) (20.37) (100.00
) 36 32 12 17 56
3. Basketry (64.59) (57.14) (21.43) (30.36) (100.0)
31 24 9 17 52 4. Rope Making
(59.62) (46.15) (17.31) (32.69) (100.0) - - 4 6 9
5. Flour Mills (44.44) (66.66) (100.0)
14 9 11 14 23 6. Woolen Textiles
(60.87) (39.13) (47.82) (60.87) (100.0)
- 12 - 11 18 7. Tailoring
(66.66) (61.11) (100.0) 7 4 3 8 11
8. Others (63.64) (36.36) (27.27) (72.72) (100.0)
144 139 71 100 263 TOTAL
(54.75) (52.85) (27.00) (38.02) (100.0)
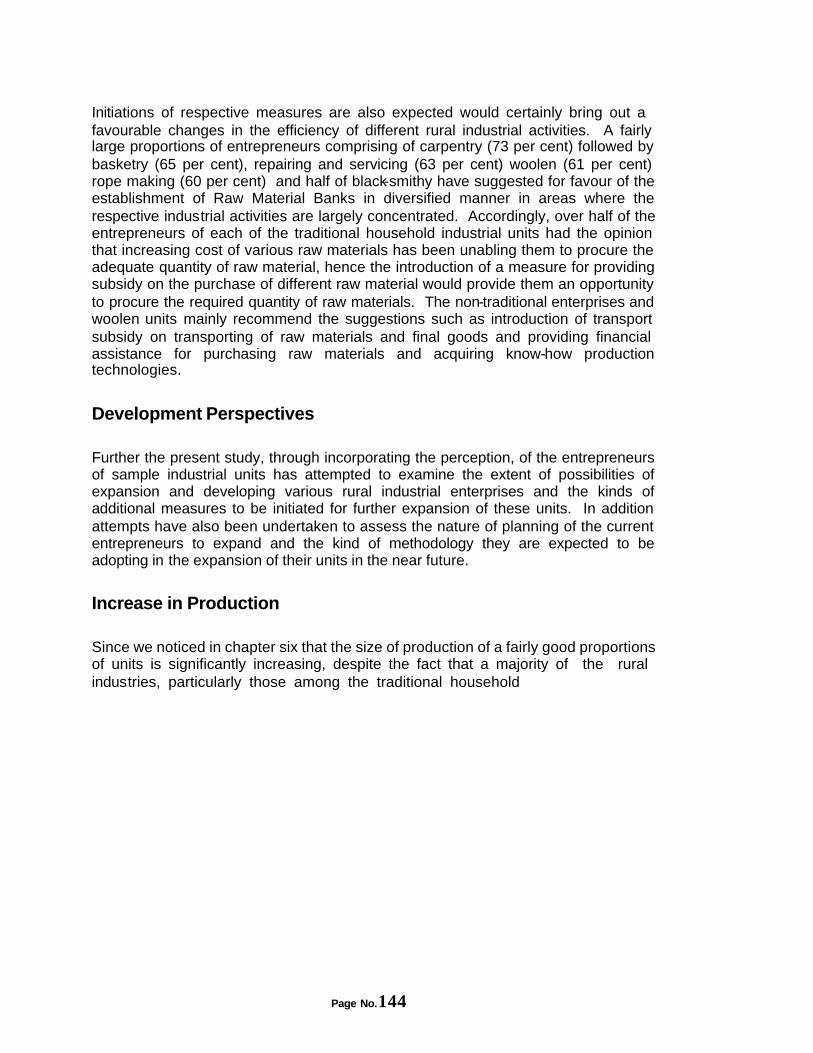
Page No.144
Initiations of respective measures are also expected would certainly bring out a favourable changes in the efficiency of different rural industrial activities. A fairly large proportions of entrepreneurs comprising of carpentry (73 per cent) followed by basketry (65 per cent), repairing and servicing (63 per cent) woolen (61 per cent) rope making (60 per cent) and half of black-smithy have suggested for favour of the establishment of Raw Material Banks in diversified manner in areas where the respective industrial activities are largely concentrated. Accordingly, over half of the entrepreneurs of each of the traditional household industrial units had the opinion that increasing cost of various raw materials has been unabling them to procure the adequate quantity of raw material, hence the introduction of a measure for providing subsidy on the purchase of different raw material would provide them an opportunity to procure the required quantity of raw materials. The non-traditional enterprises and woolen units mainly recommend the suggestions such as introduction of transport subsidy on transporting of raw materials and final goods and providing financial assistance for purchasing raw materials and acquiring know-how production technologies.
Development Perspectives Further the present study, through incorporating the perception, of the entrepreneurs of sample industrial units has attempted to examine the extent of possibilities of expansion and developing various rural industrial enterprises and the kinds of additional measures to be initiated for further expansion of these units. In addition attempts have also been undertaken to assess the nature of planning of the current entrepreneurs to expand and the kind of methodology they are expected to be adopting in the expansion of their units in the near future.
Increase in Production Since we noticed in chapter six that the size of production of a fairly good proportions of units is significantly increasing, despite the fact that a majority of the rural industries, particularly those among the traditional household
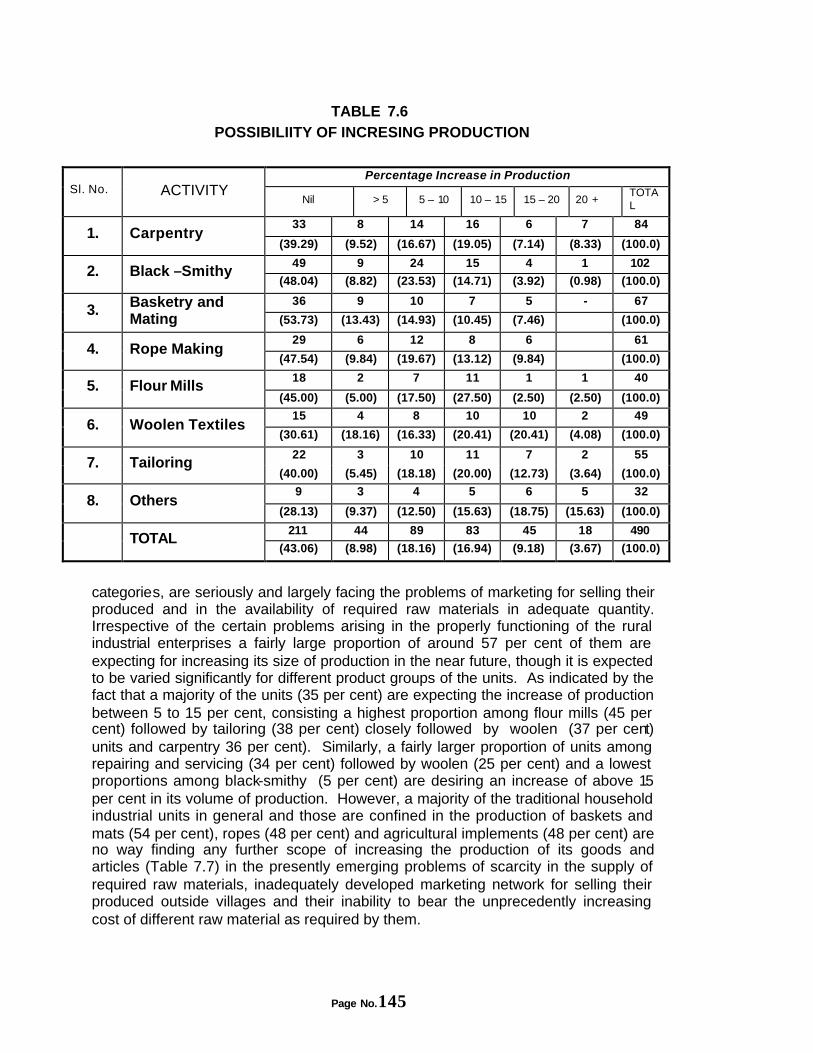
Page No.145
TABLE 7.6 POSSIBILIITY OF INCRESING PRODUCTION
Percentage Increase in Production
Sl. No. ACTIVITY Nil > 5 5 – 10 10 – 15 15 – 20 20 +
TOTAL
33 8 14 16 6 7 84 1. Carpentry
(39.29) (9.52) (16.67) (19.05) (7.14) (8.33) (100.0)
49 9 24 15 4 1 102 2. Black –Smithy
(48.04) (8.82) (23.53) (14.71) (3.92) (0.98) (100.0)
36 9 10 7 5 - 67 3. Basketry and
Mating (53.73) (13.43) (14.93) (10.45) (7.46) (100.0)
29 6 12 8 6 61 4. Rope Making
(47.54) (9.84) (19.67) (13.12) (9.84) (100.0)
18 2 7 11 1 1 40 5. Flour Mills
(45.00) (5.00) (17.50) (27.50) (2.50) (2.50) (100.0)
15 4 8 10 10 2 49 6. Woolen Textiles
(30.61) (18.16) (16.33) (20.41) (20.41) (4.08) (100.0)
22 3 10 11 7 2 55 7. Tailoring
(40.00) (5.45) (18.18) (20.00) (12.73) (3.64) (100.0)
9 3 4 5 6 5 32 8. Others
(28.13) (9.37) (12.50) (15.63) (18.75) (15.63) (100.0)
211 44 89 83 45 18 490 TOTAL
(43.06) (8.98) (18.16) (16.94) (9.18) (3.67) (100.0)
categories, are seriously and largely facing the problems of marketing for selling their produced and in the availability of required raw materials in adequate quantity. Irrespective of the certain problems arising in the properly functioning of the rural industrial enterprises a fairly large proportion of around 57 per cent of them are expecting for increasing its size of production in the near future, though it is expected to be varied significantly for different product groups of the units. As indicated by the fact that a majority of the units (35 per cent) are expecting the increase of production between 5 to 15 per cent, consisting a highest proportion among flour mills (45 per cent) followed by tailoring (38 per cent) closely followed by woolen (37 per cent) units and carpentry 36 per cent). Similarly, a fairly larger proportion of units among repairing and servicing (34 per cent) followed by woolen (25 per cent) and a lowest proportions among black-smithy (5 per cent) are desiring an increase of above 15 per cent in its volume of production. However, a majority of the traditional household industrial units in general and those are confined in the production of baskets and mats (54 per cent), ropes (48 per cent) and agricultural implements (48 per cent) are no way finding any further scope of increasing the production of its goods and articles (Table 7.7) in the presently emerging problems of scarcity in the supply of required raw materials, inadequately developed marketing network for selling their produced outside villages and their inability to bear the unprecedently increasing cost of different raw material as required by them.
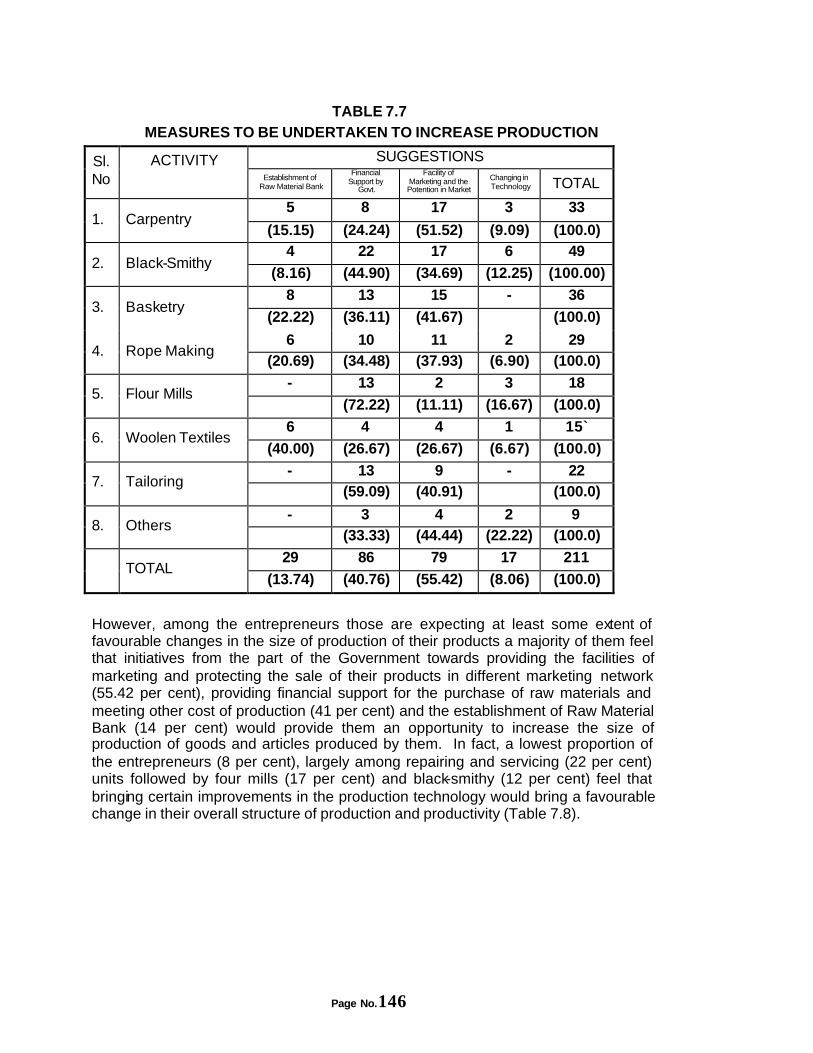
Page No.146
TABLE 7.7 MEASURES TO BE UNDERTAKEN TO INCREASE PRODUCTION
SUGGESTIONS Sl.No
ACTIVITY Establishment of
Raw Material Bank
Financial Support by
Govt.
Facility of Marketing and the Potention in Market
Changing in Technology TOTAL
5 8 17 3 33 1. Carpentry
(15.15) (24.24) (51.52) (9.09) (100.0) 4 22 17 6 49
2. Black-Smithy (8.16) (44.90) (34.69) (12.25) (100.00)
8 13 15 - 36 3. Basketry
(22.22) (36.11) (41.67) (100.0)
6 10 11 2 29 4. Rope Making
(20.69) (34.48) (37.93) (6.90) (100.0)
- 13 2 3 18 5. Flour Mills
(72.22) (11.11) (16.67) (100.0)
6 4 4 1 15 ̀6. Woolen Textiles
(40.00) (26.67) (26.67) (6.67) (100.0)
- 13 9 - 22 7. Tailoring
(59.09) (40.91) (100.0)
- 3 4 2 9 8. Others
(33.33) (44.44) (22.22) (100.0)
29 86 79 17 211 TOTAL
(13.74) (40.76) (55.42) (8.06) (100.0)
However, among the entrepreneurs those are expecting at least some extent of favourable changes in the size of production of their products a majority of them feel that initiatives from the part of the Government towards providing the facilities of marketing and protecting the sale of their products in different marketing network (55.42 per cent), providing financial support for the purchase of raw materials and meeting other cost of production (41 per cent) and the establishment of Raw Material Bank (14 per cent) would provide them an opportunity to increase the size of production of goods and articles produced by them. In fact, a lowest proportion of the entrepreneurs (8 per cent), largely among repairing and servicing (22 per cent) units followed by four mills (17 per cent) and black-smithy (12 per cent) feel that bringing certain improvements in the production technology would bring a favourable change in their overall structure of production and productivity (Table 7.8).
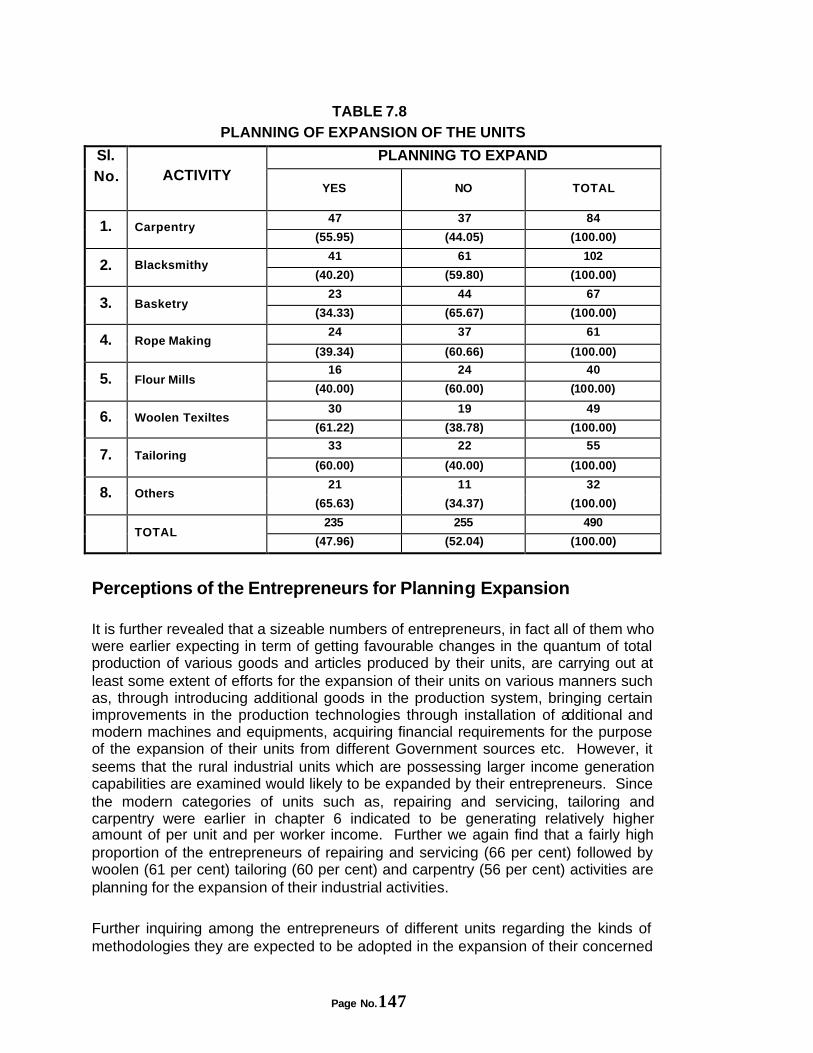
Page No.147
TABLE 7.8 PLANNING OF EXPANSION OF THE UNITS
PLANNING TO EXPAND Sl. No.
ACTIVITY YES NO TOTAL
47 37 84 1. Carpentry
(55.95) (44.05) (100.00)
41 61 102 2. Blacksmithy
(40.20) (59.80) (100.00)
23 44 67 3. Basketry
(34.33) (65.67) (100.00)
24 37 61 4. Rope Making
(39.34) (60.66) (100.00)
16 24 40 5. Flour Mills
(40.00) (60.00) (100.00)
30 19 49 6. Woolen Texiltes
(61.22) (38.78) (100.00)
33 22 55 7. Tailoring
(60.00) (40.00) (100.00)
21 11 32 8. Others
(65.63) (34.37) (100.00)
235 255 490 TOTAL
(47.96) (52.04) (100.00)
Perceptions of the Entrepreneurs for Planning Expansion
It is further revealed that a sizeable numbers of entrepreneurs, in fact all of them who were earlier expecting in term of getting favourable changes in the quantum of total production of various goods and articles produced by their units, are carrying out at least some extent of efforts for the expansion of their units on various manners such as, through introducing additional goods in the production system, bringing certain improvements in the production technologies through installation of additional and modern machines and equipments, acquiring financial requirements for the purpose of the expansion of their units from different Government sources etc. However, it seems that the rural industrial units which are possessing larger income generation capabilities are examined would likely to be expanded by their entrepreneurs. Since the modern categories of units such as, repairing and servicing, tailoring and carpentry were earlier in chapter 6 indicated to be generating relatively higher amount of per unit and per worker income. Further we again find that a fairly high proportion of the entrepreneurs of repairing and servicing (66 per cent) followed by woolen (61 per cent) tailoring (60 per cent) and carpentry (56 per cent) activities are planning for the expansion of their industrial activities. Further inquiring among the entrepreneurs of different units regarding the kinds of methodologies they are expected to be adopted in the expansion of their concerned
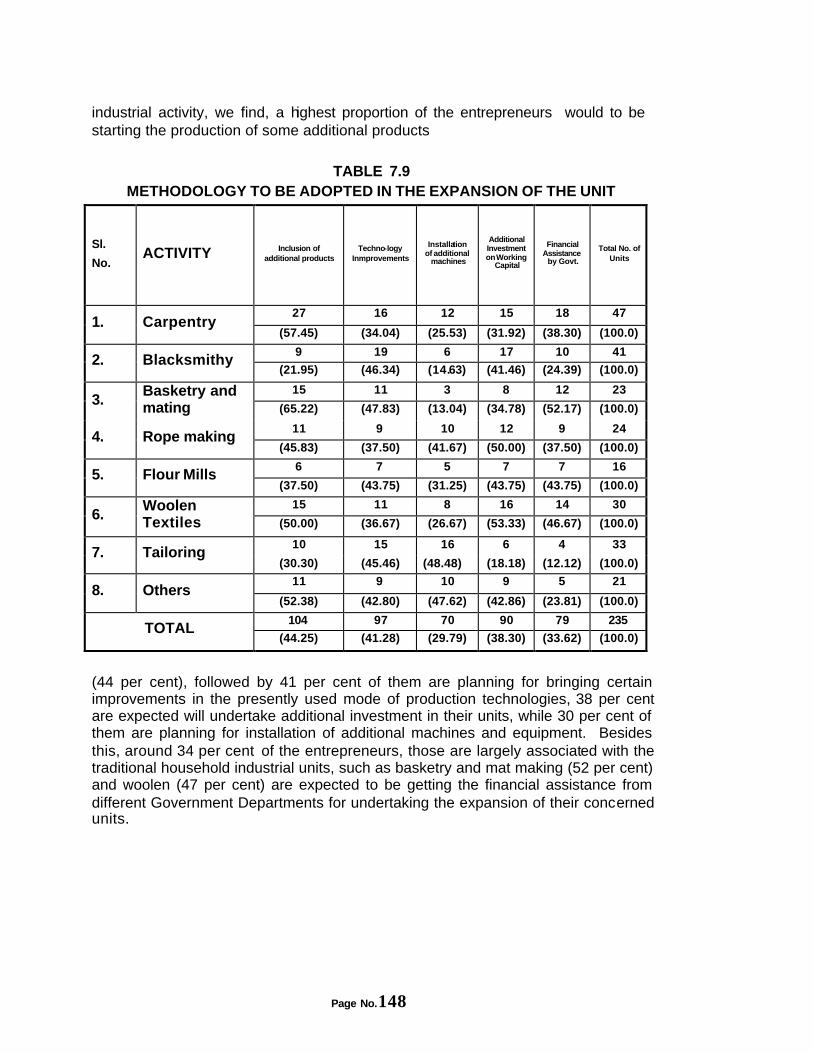
Page No.148
industrial activity, we find, a highest proportion of the entrepreneurs would to be starting the production of some additional products
TABLE 7.9 METHODOLOGY TO BE ADOPTED IN THE EXPANSION OF THE UNIT
Sl.
No. ACTIVITY Inclusion of
additional products Techno-logy
Inmprovements
Installation of additional
machines
Additional Investment on Working
Capital
Financial Assistance
by Govt.
Total No. of Units
27 16 12 15 18 47 1. Carpentry
(57.45) (34.04) (25.53) (31.92) (38.30) (100.0)
9 19 6 17 10 41 2. Blacksmithy
(21.95) (46.34) (14.63) (41.46) (24.39) (100.0)
15 11 3 8 12 23 3.
Basketry and mating (65.22) (47.83) (13.04) (34.78) (52.17) (100.0)
11 9 10 12 9 24 4. Rope making
(45.83) (37.50) (41.67) (50.00) (37.50) (100.0)
6 7 5 7 7 16 5. Flour Mills
(37.50) (43.75) (31.25) (43.75) (43.75) (100.0)
15 11 8 16 14 30 6.
Woolen Textiles (50.00) (36.67) (26.67) (53.33) (46.67) (100.0)
10 15 16 6 4 33 7. Tailoring
(30.30) (45.46) (48.48) (18.18) (12.12) (100.0)
11 9 10 9 5 21 8. Others
(52.38) (42.80) (47.62) (42.86) (23.81) (100.0)
104 97 70 90 79 235 TOTAL
(44.25) (41.28) (29.79) (38.30) (33.62) (100.0)
(44 per cent), followed by 41 per cent of them are planning for bringing certain improvements in the presently used mode of production technologies, 38 per cent are expected will undertake additional investment in their units, while 30 per cent of them are planning for installation of additional machines and equipment. Besides this, around 34 per cent of the entrepreneurs, those are largely associated with the traditional household industrial units, such as basketry and mat making (52 per cent) and woolen (47 per cent) are expected to be getting the financial assistance from different Government Departments for undertaking the expansion of their concerned units.
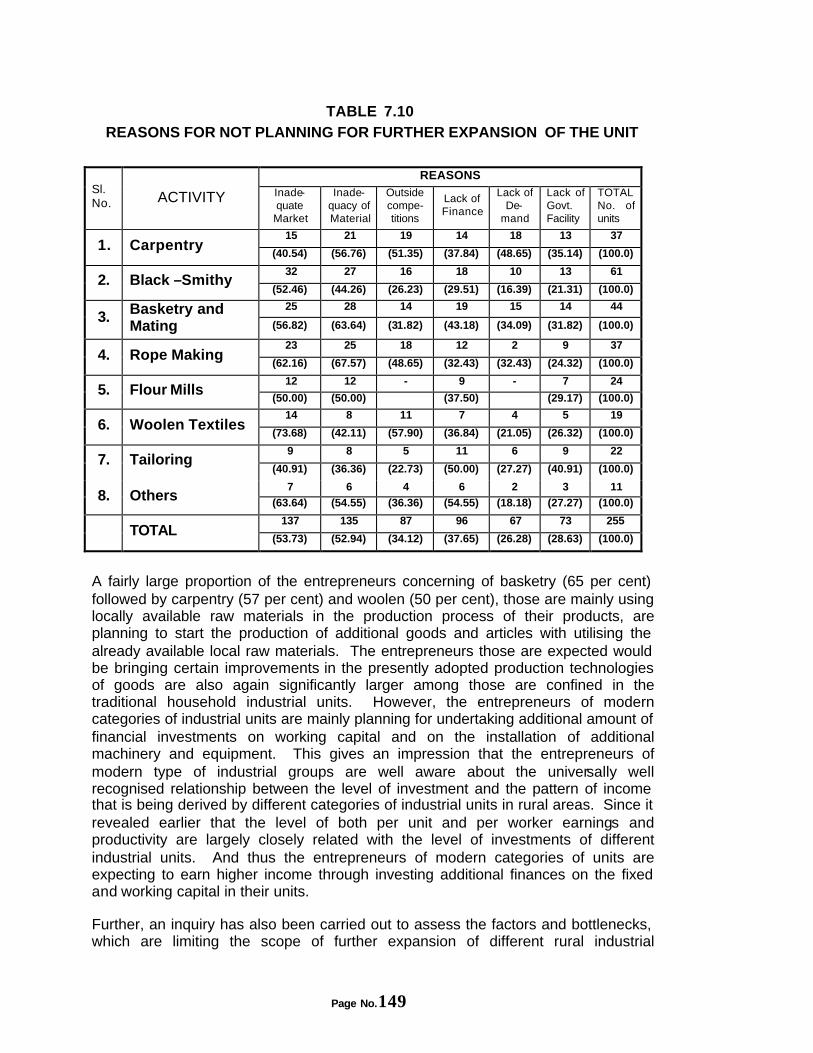
Page No.149
TABLE 7.10 REASONS FOR NOT PLANNING FOR FURTHER EXPANSION OF THE UNIT
REASONS
Sl. No. ACTIVITY Inade-
quate Market
Inade-quacy of Material
Outside compe-titions
Lack of Finance
Lack of De-
mand
Lack of Govt. Facility
TOTAL No. of units
15 21 19 14 18 13 37 1. Carpentry
(40.54) (56.76) (51.35) (37.84) (48.65) (35.14) (100.0)
32 27 16 18 10 13 61 2. Black –Smithy
(52.46) (44.26) (26.23) (29.51) (16.39) (21.31) (100.0)
25 28 14 19 15 14 44 3. Basketry and
Mating (56.82) (63.64) (31.82) (43.18) (34.09) (31.82) (100.0)
23 25 18 12 2 9 37 4. Rope Making
(62.16) (67.57) (48.65) (32.43) (32.43) (24.32) (100.0)
12 12 - 9 - 7 24 5. Flour Mills
(50.00) (50.00) (37.50) (29.17) (100.0)
14 8 11 7 4 5 19 6. Woolen Textiles
(73.68) (42.11) (57.90) (36.84) (21.05) (26.32) (100.0)
9 8 5 11 6 9 22 7. Tailoring
(40.91) (36.36) (22.73) (50.00) (27.27) (40.91) (100.0)
7 6 4 6 2 3 11 8. Others (63.64) (54.55) (36.36) (54.55) (18.18) (27.27) (100.0)
137 135 87 96 67 73 255 TOTAL
(53.73) (52.94) (34.12) (37.65) (26.28) (28.63) (100.0)
A fairly large proportion of the entrepreneurs concerning of basketry (65 per cent) followed by carpentry (57 per cent) and woolen (50 per cent), those are mainly using locally available raw materials in the production process of their products, are planning to start the production of additional goods and articles with utilising the already available local raw materials. The entrepreneurs those are expected would be bringing certain improvements in the presently adopted production technologies of goods are also again significantly larger among those are confined in the traditional household industrial units. However, the entrepreneurs of modern categories of industrial units are mainly planning for undertaking additional amount of financial investments on working capital and on the installation of additional machinery and equipment. This gives an impression that the entrepreneurs of modern type of industrial groups are well aware about the universally well recognised relationship between the level of investment and the pattern of income that is being derived by different categories of industrial units in rural areas. Since it revealed earlier that the level of both per unit and per worker earnings and productivity are largely closely related with the level of investments of different industrial units. And thus the entrepreneurs of modern categories of units are expecting to earn higher income through investing additional finances on the fixed and working capital in their units.
Further, an inquiry has also been carried out to assess the factors and bottlenecks, which are limiting the scope of further expansion of different rural industrial
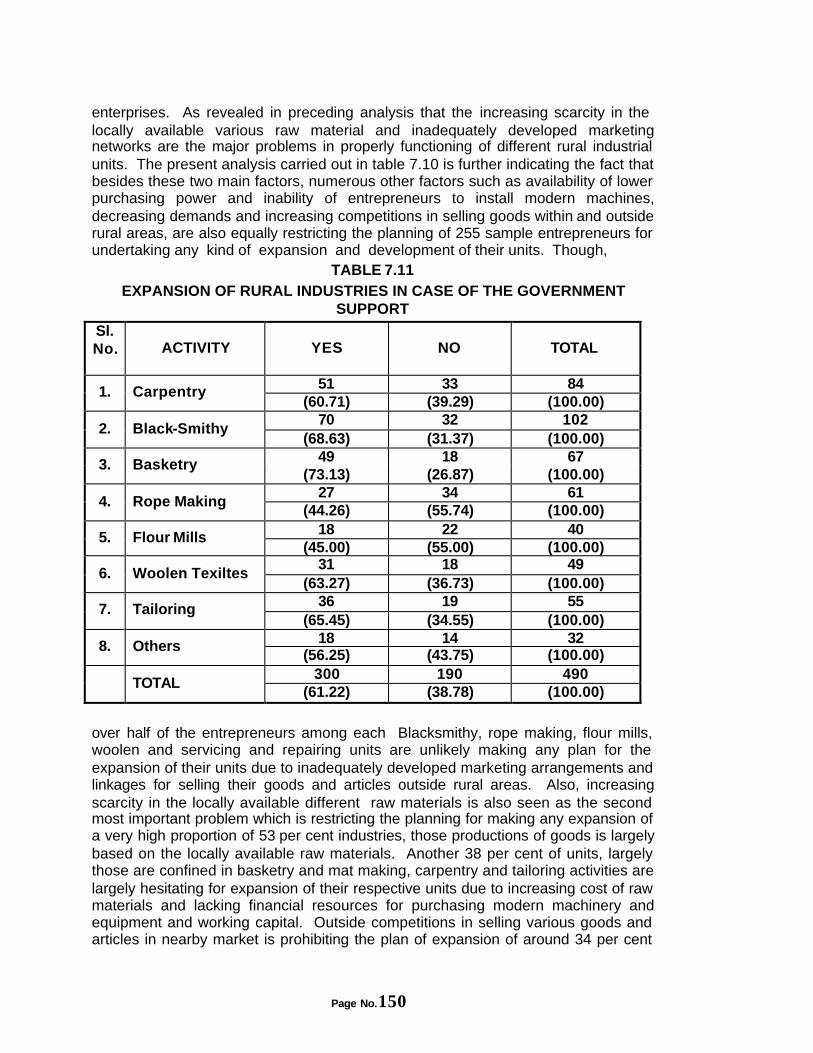
Page No.150
enterprises. As revealed in preceding analysis that the increasing scarcity in the locally available various raw material and inadequately developed marketing networks are the major problems in properly functioning of different rural industrial units. The present analysis carried out in table 7.10 is further indicating the fact that besides these two main factors, numerous other factors such as availability of lower purchasing power and inability of entrepreneurs to install modern machines, decreasing demands and increasing competitions in selling goods within and outside rural areas, are also equally restricting the planning of 255 sample entrepreneurs for undertaking any kind of expansion and development of their units. Though,
TABLE 7.11 EXPANSION OF RURAL INDUSTRIES IN CASE OF THE GOVERNMENT
SUPPORT
Sl. No.
ACTIVITY YES NO TOTAL
51 33 84 1. Carpentry (60.71) (39.29) (100.00)
70 32 102 2. Black-Smithy
(68.63) (31.37) (100.00) 49 18 67 3. Basketry
(73.13) (26.87) (100.00) 27 34 61
4. Rope Making (44.26) (55.74) (100.00)
18 22 40 5. Flour Mills (45.00) (55.00) (100.00)
31 18 49 6. Woolen Texiltes
(63.27) (36.73) (100.00) 36 19 55 7. Tailoring
(65.45) (34.55) (100.00) 18 14 32 8. Others
(56.25) (43.75) (100.00) 300 190 490
TOTAL (61.22) (38.78) (100.00)
over half of the entrepreneurs among each Blacksmithy, rope making, flour mills, woolen and servicing and repairing units are unlikely making any plan for the expansion of their units due to inadequately developed marketing arrangements and linkages for selling their goods and articles outside rural areas. Also, increasing scarcity in the locally available different raw materials is also seen as the second most important problem which is restricting the planning for making any expansion of a very high proportion of 53 per cent industries, those productions of goods is largely based on the locally available raw materials. Another 38 per cent of units, largely those are confined in basketry and mat making, carpentry and tailoring activities are largely hesitating for expansion of their respective units due to increasing cost of raw materials and lacking financial resources for purchasing modern machinery and equipment and working capital. Outside competitions in selling various goods and articles in nearby market is prohibiting the plan of expansion of around 34 per cent
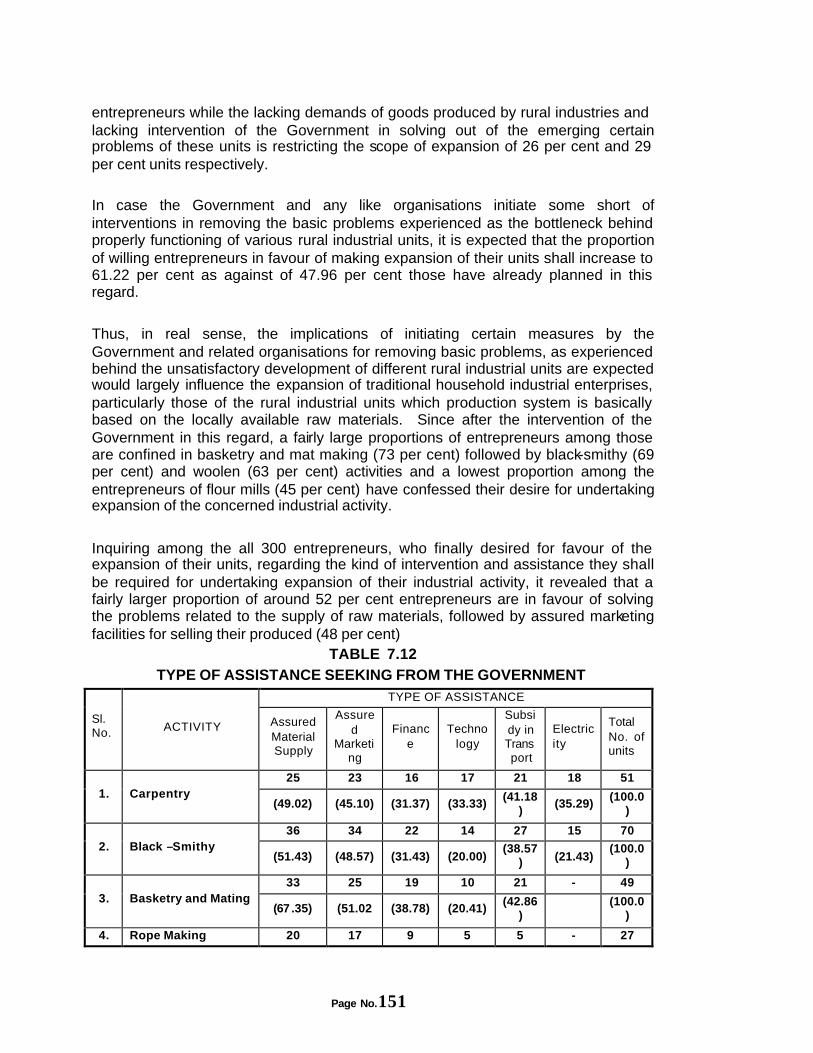
Page No.151
entrepreneurs while the lacking demands of goods produced by rural industries and lacking intervention of the Government in solving out of the emerging certain problems of these units is restricting the scope of expansion of 26 per cent and 29 per cent units respectively. In case the Government and any like organisations initiate some short of interventions in removing the basic problems experienced as the bottleneck behind properly functioning of various rural industrial units, it is expected that the proportion of willing entrepreneurs in favour of making expansion of their units shall increase to 61.22 per cent as against of 47.96 per cent those have already planned in this regard. Thus, in real sense, the implications of initiating certain measures by the Government and related organisations for removing basic problems, as experienced behind the unsatisfactory development of different rural industrial units are expected would largely influence the expansion of traditional household industrial enterprises, particularly those of the rural industrial units which production system is basically based on the locally available raw materials. Since after the intervention of the Government in this regard, a fairly large proportions of entrepreneurs among those are confined in basketry and mat making (73 per cent) followed by black-smithy (69 per cent) and woolen (63 per cent) activities and a lowest proportion among the entrepreneurs of flour mills (45 per cent) have confessed their desire for undertaking expansion of the concerned industrial activity.
Inquiring among the all 300 entrepreneurs, who finally desired for favour of the expansion of their units, regarding the kind of intervention and assistance they shall be required for undertaking expansion of their industrial activity, it revealed that a fairly larger proportion of around 52 per cent entrepreneurs are in favour of solving the problems related to the supply of raw materials, followed by assured marketing facilities for selling their produced (48 per cent)
TABLE 7.12 TYPE OF ASSISTANCE SEEKING FROM THE GOVERNMENT
TYPE OF ASSISTANCE
Sl. No. ACTIVITY Assured
Material Supply
Assured
Marketing
Finance
Technology
Subsidy in Transport
Electricity
Total No. of units
25 23 16 17 21 18 51 1. Carpentry
(49.02) (45.10) (31.37) (33.33) (41.18
) (35.29)
(100.0)
36 34 22 14 27 15 70 2. Black –Smithy
(51.43) (48.57) (31.43) (20.00) (38.57
) (21.43) (100.0
)
33 25 19 10 21 - 49 3. Basketry and Mating
(67 .35) (51.02 (38.78) (20.41) (42.86
)
(100.0)
4. Rope Making 20 17 9 5 5 - 27
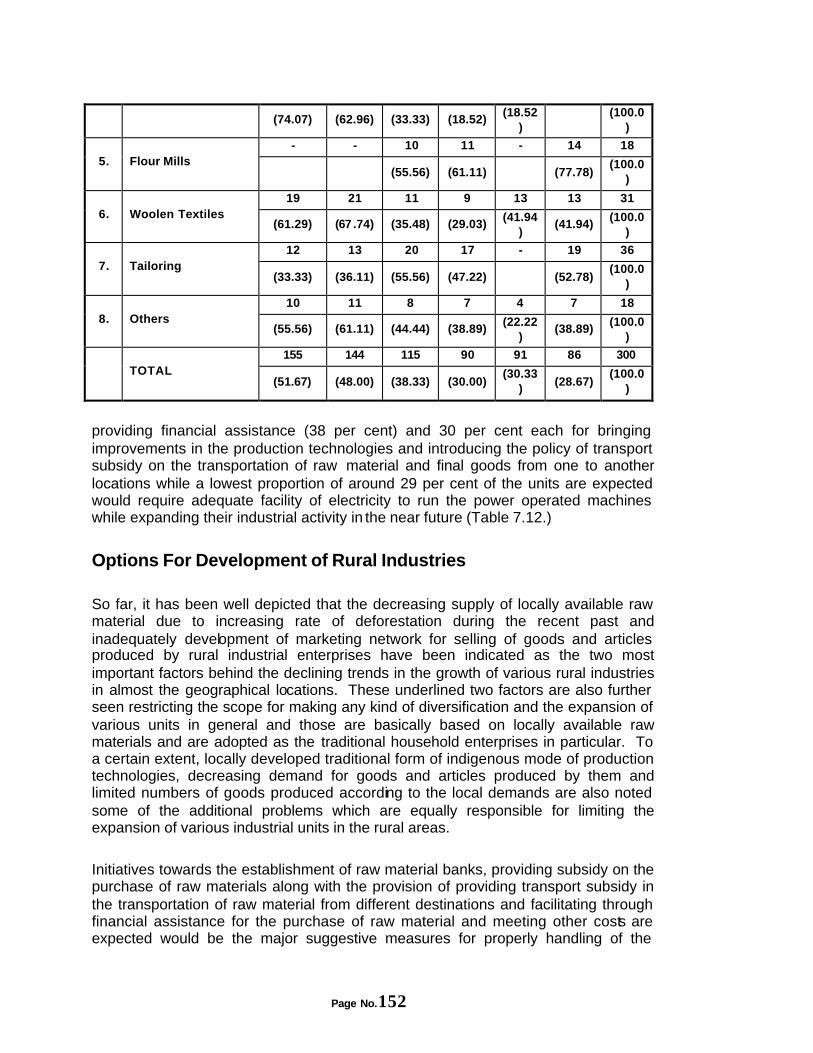
Page No.152
(74.07) (62.96) (33.33) (18.52)
(18.52)
(100.0
)
- - 10 11 - 14 18 5. Flour Mills
(55.56) (61.11) (77.78) (100.0
)
19 21 11 9 13 13 31 6. Woolen Textiles
(61.29) (67 .74) (35.48) (29.03) (41.94
) (41.94)
(100.0)
12 13 20 17 - 19 36 7. Tailoring
(33.33) (36.11) (55.56) (47.22) (52.78) (100.0
)
10 11 8 7 4 7 18 8. Others
(55.56) (61.11) (44.44) (38.89) (22.22
) (38.89)
(100.0)
155 144 115 90 91 86 300 TOTAL
(51.67) (48.00) (38.33) (30.00) (30.33
) (28.67)
(100.0)
providing financial assistance (38 per cent) and 30 per cent each for bringing improvements in the production technologies and introducing the policy of transport subsidy on the transportation of raw material and final goods from one to another locations while a lowest proportion of around 29 per cent of the units are expected would require adequate facility of electricity to run the power operated machines while expanding their industrial activity in the near future (Table 7.12.)
Options For Development of Rural Industries So far, it has been well depicted that the decreasing supply of locally available raw material due to increasing rate of deforestation during the recent past and inadequately development of marketing network for selling of goods and articles produced by rural industrial enterprises have been indicated as the two most important factors behind the declining trends in the growth of various rural industries in almost the geographical locations. These underlined two factors are also further seen restricting the scope for making any kind of diversification and the expansion of various units in general and those are basically based on locally available raw materials and are adopted as the traditional household enterprises in particular. To a certain extent, locally developed traditional form of indigenous mode of production technologies, decreasing demand for goods and articles produced by them and limited numbers of goods produced according to the local demands are also noted some of the additional problems which are equally responsible for limiting the expansion of various industrial units in the rural areas. Initiatives towards the establishment of raw material banks, providing subsidy on the purchase of raw materials along with the provision of providing transport subsidy in the transportation of raw material from different destinations and facilitating through financial assistance for the purchase of raw material and meeting other costs are expected would be the major suggestive measures for properly handling of the
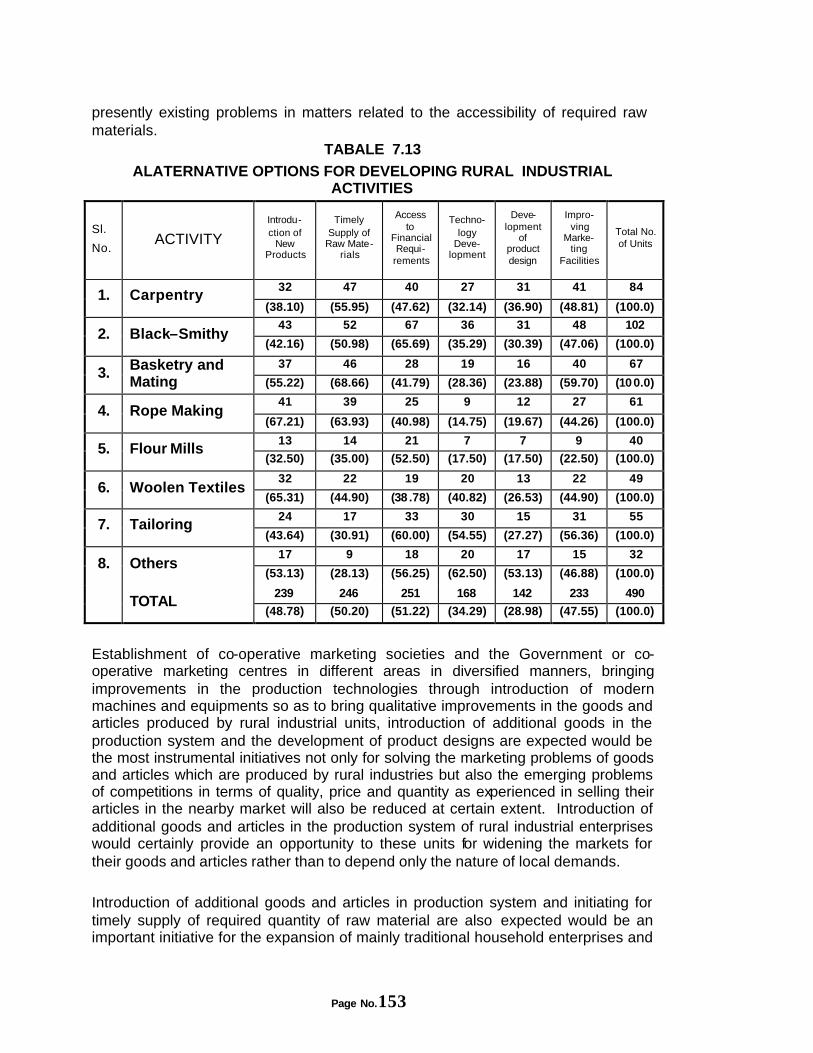
Page No.153
presently existing problems in matters related to the accessibility of required raw materials.
TABALE 7.13
ALATERNATIVE OPTIONS FOR DEVELOPING RURAL INDUSTRIAL ACTIVITIES
Sl.
No. ACTIVITY
Introdu-ction of
New Products
Timely Supply of
Raw Mate-rials
Access to
Financial Requi-
rements
Techno-logy
Deve-lopment
Deve-lopment
of product design
Impro-ving
Marke-ting
Facilities
Total No. of Units
32 47 40 27 31 41 84 1. Carpentry
(38.10) (55.95) (47.62) (32.14) (36.90) (48.81) (100.0)
43 52 67 36 31 48 102 2. Black–Smithy
(42.16) (50.98) (65.69) (35.29) (30.39) (47.06) (100.0)
37 46 28 19 16 40 67 3. Basketry and
Mating (55.22) (68.66) (41.79) (28.36) (23.88) (59.70) (100.0)
41 39 25 9 12 27 61 4. Rope Making
(67.21) (63.93) (40.98) (14.75) (19.67) (44.26) (100.0)
13 14 21 7 7 9 40 5. Flour Mills
(32.50) (35.00) (52.50) (17.50) (17.50) (22.50) (100.0)
32 22 19 20 13 22 49 6. Woolen Textiles
(65.31) (44.90) (38 .78) (40.82) (26.53) (44.90) (100.0)
24 17 33 30 15 31 55 7. Tailoring
(43.64) (30.91) (60.00) (54.55) (27.27) (56.36) (100.0)
17 9 18 20 17 15 32 8. Others
(53.13) (28.13) (56.25) (62.50) (53.13) (46.88) (100.0)
239 246 251 168 142 233 490 TOTAL
(48.78) (50.20) (51.22) (34.29) (28.98) (47.55) (100.0)
Establishment of co-operative marketing societies and the Government or co-operative marketing centres in different areas in diversified manners, bringing improvements in the production technologies through introduction of modern machines and equipments so as to bring qualitative improvements in the goods and articles produced by rural industrial units, introduction of additional goods in the production system and the development of product designs are expected would be the most instrumental initiatives not only for solving the marketing problems of goods and articles which are produced by rural industries but also the emerging problems of competitions in terms of quality, price and quantity as experienced in selling their articles in the nearby market will also be reduced at certain extent. Introduction of additional goods and articles in the production system of rural industrial enterprises would certainly provide an opportunity to these units for widening the markets for their goods and articles rather than to depend only the nature of local demands. Introduction of additional goods and articles in production system and initiating for timely supply of required quantity of raw material are also expected would be an important initiative for the expansion of mainly traditional household enterprises and

Page No.154
the units which production of goods is basically depending on the supply of locally available raw materials. Also the initiatives towards developing marketing network and proper arrangements for selling various goods outside rural areas are expected will boost the expansion and development perspectives of around 48 per cent industries.
Page No.155
CHAPTER VIII
PERCEPTIONS OF HOUSEPERCEPTIONS OF HOUSEHOLDS HOLDS AND THE POLICY AND THE POLICY
RECOMRECOMMENDATIONSMENDATIONS So far we have analyzed the mode of establishing the pattern of growth of different categories non-farm activities, structure of non-farm employment, impact of rural development on promoting non-farm sector, contribution of various non-farm activities in providing employment opportunities and the avenues of income among different size of farm holdings, in different geographical locations of the sample areas, farm and non-farm households, potentials of expansion, emerging problems in properly functioning and the kinds of measures and approaches to be initiated for expanding different potentially and environmentally viable non-farm enterprises in rural areas of Uttaranchal. Attempts have also been made to examine various pre-determined hypothesis in order to understand about the operational situation, factors and elements motivated to the expansion and growth pattern of different non-farm activities in the past and the kinds of forward and backward linkages which are presently operating in the expansion and promoting to the growth of various components of non-farm sector in general and its most important segment rural manufacturing activities in particular among different geographical locations of the state. Now on the basis of our survey, discussions held with the Government officials and the individuals of sample households and the analysis of secondary and sample data we have been able to visualised the emerging conditions of agricultural and non-agricultural sectors in different geographical areas of two districts selected by us for the purpose of present study. Based on these observations we put forward our perceptions related to the significance and possibility of development of non-farm sector and also the perceptions as presented by the individuals of sample households. (i) Agriculture and its associated activities are found constituting the economic
base and the main source of livelihood and employment for the people in the state. However, unprecedented growth of population on one hand and decreasing rate of available arable land along with degradation of supporting natural resources as required for sustaining crop productivity on the other have been seriously forcing the problems of sustaining livelihood for farming communities. In this context the significance of extending non-farm sector becomes only alternative in such agriculturally and low growth state.
Page No.156
(ii) In fact the state is lacking the scope for large scale diversification of economic
activities, especially through initiating industrialization and large scale production system because of a number of factors such as limited environmentally sensitive base, their spread of useable resources across different and inaccessible terrain, inaccessibility to markets and modern inputs and technology, deficient infrastructure and high transport costs leading to non-competitiveness of products.
(iii) Initiating small scale production at household level through harnessing certain
environmental resources based on traditionally developed indigenous technologies would not pose any adverse effect on local ecological system. In addition, the hilly areas of the state posses various area specific comparative advantages and opportunities favouring them for the expansion of locally available resources based micro enterprises. In fact, the non-farm sector, especially manufacturing activities, have been performing a very important role in the process of overall development process of rural areas, particularly in middle and high hill areas, through providing increasing levels of employment opportunities to different categories of skilled, unskilled educated and literate labourforce and contributing a sizeable amounts of incomes in the rural households. Presently also, a phenomenon increase in the absorption of rural labourforce in different activities and its overwhelmingly increasing share in the income of rural households have been well recognized in different geographical locations. Despite the fact that the rural non-farm activities, particularly less efficient and less productive traditional household manufacturing activities have been washing away from the rural areas over the years.
(iv) The rural non-farm sector is dominated by retail trade, personal and
community services and to a little extent by the manufacturing activities. The domination of manufacturing and service related activities are followed mainly in middle and high hill areas while transportation and trading activities are highly concentrated in low hill areas, indicating the fact that the development of agriculture and industrial activities, that revealed in low hill areas, are largely influencing the expansion of trading and transport related activities but its little impact and linkages are establishing in the expansion of manufacturing and service related activities. Accessibility to raw materials in adequate quantity and the availability of family skill for producing different goods have been visualised as the most important influencing factors determining the expansion pattern of different traditional rural industrial enterprises. However, the perceptions of the study team were that a very large proportion of the present entrepreneurs of different non-farm activities were forced to join their enterprises due to lack of alternative sources of employment and income opportunities in rural areas.
(v) The structure of producing various goods and articles in rural industrial
enterprises is seen largely governed by the nature of local demands, essentiality of different articles for performing various domes tic activities and
Page No.157
the purchasing power of the rural households, since most goods manufactured by them do not find any favourable market outside rural areas. In fact, over the years, the goods manufactured by rural industrials are facing a serious competition from the better quality goods entering in rural areas from urban counterpart which are manufactured at large scale by the modern industries. As the consequences, most traditional units are disappearing from the rural areas. The perceptions of the non-farm households were that bringing improvements in the production technologies, introduction of additional goods and articles in production system and the protection of the functioning of rural industries through developing and introducing suitable programmes could be the suggestive measures for sustaining the survival of rural industries. Also, initiating for diversification of rural industrial activities through introducing market oriented goods in production system and bringing improvements in the quality of products would be a most important measure to boot the growth and the income generation capacity of the rural industrial enterprises.
(vi) Beside the lack of any concrete intervention undertaken by the Government in
the past towards developing and initiating a comprehensive approach for scientifically exploitation of area specific advantages and opportunities, as are provided by the nature, so as to promote the expansion of such niche based manufacturing activities, the scarcity in the availability of local raw material and inadequately development of marketing network for selling of goods and articles produced by rural industrial have been recognized two most important factors behind the unsatisfactory growth in establishing various industrial activities in different geographical locations of the state.
(vii) The expansion of a large proportion of rural industrial enterprises was
primarily influenced by the availability of various natural resources from the nearby forests in abundance. However, due to increasing deforestation undertaken by local people to meet their basic needs of fuel and animal feeding and to some extent selling it in nearby markets so as to sustain their livelihood and by the forest mafias for its commercial uses during the recent past the decreasing adequacy in the availability of various raw materials in local forests has not only compelled the rural industrial households to cover longer distances by foot to obtain required raw materials but most forest products can be obtained through making at least some payments for its collection. This has increased the cost of production of various goods manufactured by the rural industries.
(viii) Inaccessibility to transport facilities for obtaining raw material from different
destinations and for selling goods and articles by rural industries in nearby markets have also been experienced a basic problem for unsatisfactory growth of rural industrial enterprises in middle and high altitude areas of the state.
(ix) Despite the fact that various kinds of problems existing in the properly functioning of the rural industrial activities in different geographical locations, a
Page No.158
significant proportions of the entrepreneurs are planning expansion of their units by way of introducing additional products in the production system; installation of additional modern machines, undertaking additional investment on the working capital and bringing certain changes in the production technologies through approaching various Government Departments, agencies and financial institutions.
(x) The perception of the sample non-farm households were also that the
presently emerging problems of marketing and the supply of required quantity raw materials will remain continue in the future unless the concrete interventions are undertaken from the part of the Government agencies.
(xi) Availability of low purchasing power with a sizeable proportion of
entrepreneurs is equally enabling them to think over initiating and making diversification in the production system of their enterprises. The perceptions of a fairly large number of entrepreneurs were that they shall be willing to make diversification in their units in case any kind of initiatives and interventions to be undertaken by the Government or any institutions to overcome from such financial problems.
The Policy Recommendations It has been a well recognized fact that the scope of a large scale industrialisation and widespread diversification of economy in Uttaranchal has been restricted by its limited and environmentally sensitive resource base, prevalence of highly fragile eco-system, the thin spread of useable resources across difficult and inaccessible terrain, deficient infrastructure, inaccessibility to markets and modern inputs and technology and insufficient entrepreneurship capability and risk bearing capacity among the local people and several related problems. Also, the development potentials of farming economy are basically constrained by limited availability of arable land; which by itself is decreasing due to increasing land slides, soil erosion and increasing urbanization, depletion of various natural resources as required for sustaining agricultural production, degrading of the quality of land due to increasing water scarcity for irrigation and the lacking capability of land to sustain the use of improved agricultural practices. In this manner, the expansion of potential non-farm activities especially those based on locally available resources has been visualised as an important alternative option in order to address the emerging problems of unemployment and poverty situation and to sustain the livelihood of rural households in the state. In fact, over the years, the contribution of different non-form activities has been well recognized in providing employment opportunities to the rural labourforce and in the income of rural households, despite a considerable decline in the proportions of traditional manufacturing enterprises in different locations of the state because of the little recognition that have been provided from the part of the Government and the weakness of development plans as revealed in the past to asses the importance and contribution of various non-farm activities in the process of rural development.
Page No.159
Therefore, neither have any initiatives been undertaken to identify and asses the development potentials of different non-farm activities nor any suitable intervention and planning strategies have been initiated in favour of harnessing the area specific advantages and opportunities available for developing certain non-farm ac tivities in different locations of the State. On the basis of the findings of present study we are attempting to offer a few suggestions which may be incorporated as the policy measures in the future for achieving desirable development of various non-farm activities in rural areas of the state. The development possibilities of non-farm sector are expected would be largely determined by the process of initiating expansion in the road transport facilities and to a certain extent by the pattern of agricultural diversification and industrial diversification. In fact, improving access to road transportation will positively contribute in widening opportunities for marketing of goods and articles manufactured by rural industrial enterprises into nearby markets and the procurement of required raw material from different destinations. Therefore, providing increasing initiatives towards the construction of roads would certainly prove the expansion of various non-farm activities to a greater level and also it would subsequently increase the frequencies and transactions of different produced from rural to urban areas vis-a-vis from urban to rural areas thereby to strengthened the income levels of rural households.
(II) Since the process of agricultural diversification is currently being undertaken
in the state but the diversification of agricultural activities in limited available arable land can not be expected to solve even the presently burning problems of unemployment, poverty and livelihood of the rural households. In fact such evidences are largely available even from agriculturally most developed states. Therefore, it would be more appropriate to introduce an integrated farm and non-farm sectors development planning approach together with developing a common nature of basic necessities and infrastructure facilities promoting development of both the sectors simultaneously. In short, the concerned approach calls for, firstly the identification of various potentially viable non-farm activities and the kinds of nature of development linkages that the identified non-farm activities are possessing with the diversification of different components of farm sector in different geographical locations and thus, to think intensively over the kinds of approaches and under what manner to be initiated for systematically achieving the development of both the sectors together, along with planning for expansion of different activity specific required infrastructure facilities and outside support for promoting the sustainable development of rural enterprises, would be the additional prime elements for integrated farm and rural non-farm enterprise development.
(III) The objective focus of initiating rural development programmes should by and
large be confined in favour of the expansion of self-employment opportunities rather than wage-paid-casual employment. The rural people should be encouraged towards the establishment of various non-farm activities which offer area specific comparative advantages, though awaring the rural people about the sustainability nature of different enterprises in particular areas,
Page No.160
providing subsidised financial assistance to meet the establishment costs, technological know-how to be used in the production processes and related assistance. Following are the identified groups of product lines with comparative advantages for enterprise development in mountains (Papola 1999).
(a) Diversified farm products, fruits, off-seasonal vegetables, tea, honey,
milk, meat, wool and woolen products.
(b) Nature and natural resource-based products, tourism and adventure sports, herbs and medicines, furniture and wood products, products from minor forest produce such as bamboo and rattan, natural fibre-based products, hydro power and panchakki.
(c) Handicrafts and skill based products using the traditional skills of mountain women and men often use unique, locally available materials.
(IV) The land area under actual forest cover, and even the net cultivated land has been declining with a considerable increase in barren and cultivable waste, permanent pas ture and grazing land and fallow land, (which together accounting more than arable land). Therefore, it is advisable to encourage the maximum participation of rural people to use this land for initiating large scale afforestation programmes through the plantation of various high value commercial plants, trees, groves and timbers, which are practically used and can serve as the basis of materials for rural manufacturing enterprises. Thus, undertaking afforestation programme in this suggested manner is expected to reduce the emerging scarcity of locally available raw materials to a certain extent. Besides, establishment of raw material banks, on the pattern as it is established for raw wool in Almora for certain raw materials would also be an additional measure to overcome from the inadequate and untimely supply of different raw materials to the rural enterprises.
(V) It seems necessary to bring certain initiatives in bringing improvements in the
productive efficiency of rural industrial enterprises through upgrading mode of production technologies so as to bring qualitative improvements in the products manufactured by them; introduction of additional number of goods, especially market oriented articles, in the production system widening marketing opportunities for the products through establishing co-operative marketing societies in and around of the areas where different rural industries are fairly largely concentrated in the sales centres in nearby towns, tourist centres and the large metropolitan cities outside Uttaranchal.
Page No.161
REFERENCES
1. Alagh, Y.K. Bhatt, G.S. & Bhaduri, Amit (1978) Agricultural Growth and Manpower Absorption in Indian Agriculture - Some Explanatory Investigations, ILO/ARTEP. New Delhi.
2. Bardhan, P.K. et.al (1978) - Labour Absorption in Indian Agriculture: Some Explanatory Investigations, ARTEP/ILO, Bangkok.
3. Basant, R. (1987) - Agriculture Technology and Employment in India, Economic and Political Weekly, August.
4. Basant, R. (1988) - Rural Non-agricultural Activities in India: A Review of Available Evidence, working Paper No.20, The Gujarat Institute of Area Planning, Ahmedabad.
5. Basant, R. (1993) - Diversification of Economic Activities in Rural Gujarat, Key Results of Primary Survey, Indian Journal of Labour Economics, Vol.36, No.3.
6. Basant, R., and Joshi H. (1994) - Employment Diversification in an Agriculturally Diversified Region, Some Evidence from Rural Kheda, Gujarat.
7. Visaria, P. and Basant, R. (ed.) - Non-agricultural Employment in India; Trends and Prospects, Sage Publications, New Delhi.
8. Basu, D.N. and Kashyap, S.P. (1992) - Rural Non-Agriculture and Asset Distribution, Indian Journal of Agricultural Economics, October-December.
9. Bhalla, Sheila (1987), Trends in Employment in Indian Agriculture, Land Assessment Distribution, Indian Journal of Agricultural Economics, October-December.
10. Bhalla, Sheila (1993) - Trends in Some Propositions about Dynamics of Changes in the Rural Work Force Structure, Indian Journal of Labour Economics.
11. Bhattacharya, S.N. (1980) - Rural Industrialisation in India, Vikas Publishing House Pvt. Ltd., New Delhi.
12. Chadha, G.K. (1986) - The Off-Farm Economic Structure of a Agriculturally Growing Region: A Study of Indian Punjab, in Chand, R.T. (ed.). Off-Farm Employment in the Development of Rural in Asia, Austrialian National University, Canberra.
13. Chadha, G.K. (1986) - The State and Rural Economic Transformation: The Case of Punjab (1950-85), Sage Publications, New Delhi.
14. Chadha, G.K. (1992) - Adoption of Improved Technologies in India's Cottage Industries Constraints and Impacts, in Islam Rizwanul (ed.), Transfer, Adoption and Diffusion of Technology for Small and Cottage Industries, ILO/ARTEP, New Delhi.
15. Chadha, G.K. (1993) - Non-Farm Employment for Rural Households in India, Evidence and Prognosis, Indian Journal of Labour Economics, Vol.36.
16. Chadha, G.K. (1994) - Employment, Earnings and Poverty; A Study of Rural India and Indonesia, Sage Publications, New Delhi.
17. Chadha, G.K. (1997) - Employment for Rural Households in India: Past Trends and Future Choices, Mohanty B. (ed). Employment Perspectives in Rural India, APH Publishing Co., New Delhi.
Page No.162
18. Dev. S. Mahendra (1990) - Non-agricultural Employment in India, Evidence at Disaggregated Level, Economic and Political Weekly, July.
19. Eapen, M. (1992) - Rural Non-Agricultural Employment in Kerala, Inter-District Variations, Economic and Political Weekly, March, 25.
20. Islam Rizwanul (1987) - Rural Industrialisation and Employment in Asia, Issues and Evidence, ILO/ARTEP, New Delhi.
21. Jayraj, D. (1994) - Determinants of Rural Non-agric ultural Employment, Visaria P. and Basant R. (ed.). Non-Agricultural Employment in India: Trends and Prospects, Sage Publications, New Delhi.
22. Kumar, A. (1993) - Rural Non-farm Employment: A State and Dynamic Study of Inter State Variations, Indian Journal of Labour Economics, No.36.
23. Joshi, B.K. and Mehta, G.S. (1995) - Situation of Woolen Industry in Uttarakhand, GIDS, Lucknow.
24. Joshi B.K. (2000) - Development Experience in the Himalayan Mountain Region of India, in Banskota M. and Papola, T.S. (ed.). Growth, Poverty Alleviation and Sustainable Resource Management on the Mountain Areas in South Asia, ICIMOD, Kathmandu, Nepal.
25. Kundu, Amitabh (1992) - Growth in Employment, Changing Workforce Structure and Poverty - Employment Linkages in Urban Areas: An Analysis with Special Reference to Informal Sector, ILO/ARTEP, New Delhi.
26. Lipton, M. (1982) - Why Poor People Stay Poor, A Study of Urban Bias, in World Development; Heritage, New Delhi.
27. Mathur, A and Pani, P.K. (1993) - The Character of Rural Industrialisation and Its Employment Impact in India, Indian Journal of Labour Economics, Vol.36, No.3.
28. Mehta, G.S. (1981) - Condition of Rural Artisans in U.P.'s Hills, Working Paper No.58, Giri Institute of Development Studies, Lucknow.
29. Mehta, G.S. (1992) - Role of Small Scale Enterprises in Rural Economy, in Jalal, R.S. (ed). Role of Small Sector in India's Economy, Himalaya Pub. House, New Delhi.
30. Mehta, G.S. (1996) - Uttarakhand: Prospects of Development, Indus Publishing Company, New Delhi.
31. Mehta, G.S. (1997) - Emplo yment Potentials of Handicraft Activities in Uttarakhand, Manpower Journal, Vol.XXXII, No.2, July-September.
32. Mehta, G.S. (1997) - Development Experiences and Option in a Hill Region; A Case of Uttarakhand, U.P. India, ICIMOD, Kathmandu, Nepal.
33. Mehta, G.S. (1998) - Industrial Development in Uttarakhand: A Micro Level Analysis, Workingg Paper No.141, GIDS, Lucknow.
34. Mehta, G.S. (1999) - Development of Uttarakhand: Issues and Perspectives, APH Publishing Co., New Delhi.
35. Mehta, G.S. (2000) - Development Planning and Strategy for Uttarakhand, in Sati, M.C. and Sati, S.P. (ed.), - Uttarakhand Statehood, Dimensions of Development, Indus Publishing Co., New Delhi.
Page No.163
36. Mehta, G.S. (2001) - Mountain Agriculture with Focus on Uttaranchal, Paper Presented in a International Seminar on Mountain Agriculture held at ICIMOD, Kathmandu, May 21-23, 2001
37. Mukhopadhyay, S. (1992) - Casualisation of Labour in India, Concept, Incidence and Policy Options, Indian Journal of Labour Economics, Vol.35, No.3, July-September.
38. Papola, T.S. (1979) - Production of Woollen Carpets in Garhwal and Kumaun Region; Giri Institute of Development Studies, Lucknow.
39. Papola, T.S. (1982) - Rural Industrialisation Approaches and Potentials, Himalaya Publishing House, New Delhi.
40. Papola, T.S. and Mishra, V.N. (1982) - Some Aspects of Rural Industrialisation, Economic and Political Weekly, Special Number, October.
41. Papola T.S. (1984) - Industrialisation for Rural Development, in Singh, A.K, Papola T.S. and Mathur, R.S. (ed). Economic Policy and Planning in India, Sterling Publications, New Delhi.
42. Papola, T.S. and Joshi, B.K. (1984) - Demography, Environment and Development in Uttaranchal, Giri Institute of Development Studies, Lucknow.
43. Papola, T.S. (1987) - Rural Industrialisation and Agricultural Growth: A Case Study of India, in Islam Rizwanul (ed.), Rural Industrialisation and Employment in Asia, ILO/ARTEP, New Delhi.
44. Papola, T.S. (1992) - Rural Non-farm Employment: An Assessment of Recent Trends, Indian Journal of Labour Economics, Vol.35, No.3.
45. Papola, T.S. (19986) - Integrated Planning for Environmental and Economic Development of Mountain Areas, ICIMOD, Kathmandu, Nepal.
46. Papola, T.S. (1996) - Development of Micro Enterprises in Mountain Area, ICIMOD, Kathmandu, Nepal.
47. Papola, T.S. (1999) - Scope for Economic Diversification, News Letter, ICIMOD, Kathmandu, Nepal.
48. Pathak, C.R. (1982) - Rural Industrialisation for Area Development, Indian Journal of Regional Development, Vol.14, (2).
49. Rao, R.V. (1978) - Rural Industrialisation in India, Concept Publishing Company, New Delhi.
50. Saith, Ashwini (1992) - The Rural Non-farm Economy: Processes and Policies, ILO, Geneva.
51. Sharma, H.R., Virender, K. and Sharma, P.K. (1999) - Rural Non-Farm Employment in Himachal Pradesh, 1971-1991: A District Level Study, Indian Journal of Labour Economics, Vol.42, No.2
52. Singh, A.K. (1994) - Changes in the Structure of Rural Workforce in Uttar Pradesh: A Temporal and Regional Study, in Visaria, P. and Basant, R. (ed). Non-Agricultural Employment in India, Sage Publications, New Delhi.
53. Singh, Surjit (1993) - Some Aspects of Rural Non-farm Sector Development in Developing Countries, Indian Journal of Labour Economics, No.36.
54. Vaidyanathan, A. (1986) - Labour Use in Rural India, A Study of Spatial and Temporal Variations, Economic and Political Weekly, No.52, December 27.
Page No.164
55. Visaria, P. and Minhas, B.S. (1991) - Involving Employment Policy for the 1990's what do the data tell us? Economic and Political Weekly, No.15, April 13.
56. Visaria, P. (1994) - The Sectoral Distribution of Workers in India 1961-91, in Visaria P. and Basant, R. (ed). Non-agricultural Employment in India: Trends and Prospects, Sage Publications, New Delhi.
57. Vyas, V.S. and Mathai G. (1978) - Farm and Non-farm Employment in Rural Areas: A Perspectives for Planning, Economic and Political Weekly, Annual Number, February.
58. World Bank (1978) - Rural Employment and Non-farm Employment.