nomura securities international, inc., new york · 2012-05-23 · 1-212-667-9316 wisdom of crowds /...
TRANSCRIPT

STRICTLY PRIVATE AND CONFIDENTIAL
© Nomura
This commentary has been prepared by a Nomura
equities desk strategist and is NOT a product of
the Research Department. For additional
information concerning the role of trading desk
strategists, please see the important conflicts
disclosures beginning at page 42 of this report.
Nomura Securities International, Inc., New York
April 30, 2012
Quantitative Strategy
Joseph J. Mezrich
1-212-667-9316
Wisdom of crowds / Madness of crowds
Quantitative Desk Commentary

– Active management and the hunt for alpha
– Correlation and growth of systemic risk
– Changes over the past decade – a sampling
– Wisdom of crowds or madness of crowds?
The hunt for alpha: Paradigm in motion

Joseph Mezrich, 212.667.9316,
Equity fund flow –
passive funds grow, while active funds shrink
Note: Shows cumulative fund flow into US-equity funds, active funds, passive funds and ETFs. Period of analysis is from April 2003 through March 2012.
Source: Nomura Securities International, Inc, EPFR.
2
-800
-700
-600
-500
-400
-300
-200
-100
0
100
200
300
400
Ap
r-0
3
Oct
-03
Ap
r-0
4
Oct
-04
Ap
r-0
5
Oct
-05
Ap
r-0
6
Oct
-06
Ap
r-0
7
Oct
-07
Ap
r-0
8
Oct
-08
Ap
r-0
9
Oct
-09
Ap
r-1
0
Oct
-10
Ap
r-1
1
Oct
-11
Ap
r-1
2
Cu
mu
lati
ve f
un
d f
low
(b
illio
n $
)US-equity fund flow: active vs. passive
US-equity funds
Active funds
Passive funds

Joseph Mezrich, 212.667.9316,
Wisdom of crowds or Madness of crowds?
What’s New? Why is this happening?
Cash equities
Fundamental Indexation
Min variance investing
Risk parity investing
Diversity weighting
Etc…
Many alternatives to traditional cap weighted benchmark
ETF’s/ ETN’s
SPLV (low vol)
PBP (BuyWrite)
IYR (real estate)
SH (short S&P500)
Risk on (ONN)/Risk off (OFF)
Etc …
Pick a theme or alternative beta to invest in
3

Joseph Mezrich, 212.667.9316,
The struggle for alpha
Note: Top chart shows cumulative average excess return (relative to the benchmark) in large-cap core funds based on quantitative methodologies (dark blue line) and large-cap core funds based on
fundamental methodologies (light blue line). Bottom chart shows excess return by year (relative to the benchmark) in large-cap core funds based on quantitative methodologies (dark blue bar) and large-cap
core funds based on fundamental methodologies (light blue bar).Red bar is the spread of excess returns between quant funds and fundamental funds. Currently, there are 20 funds in the quant core universe
and 44 funds in the fundamental core universe. Period of analysis is from January 2003 through 14 May 2012.
Source: Nomura Securities International, Inc, Russell, S&P, Bloomberg.
Quant vs. Fundamental Quant vs. Fundamental by year
4
-2
0
2
4
6
8
2003 2004 2005 2006 2007 2008 2009 2010 2011 2012
Cu
mu
lati
ve e
xce
ss r
etu
rn (%
)
Quant vs. Fundamental
Dec 2010
Quant+50 bp in YTD
Fundamental +50 bp in YTD
Quant core funds
Fundamental core funds Dec 2011
Quant+153 bp in 2011
Fundamental -327 bp in 2011
-6
-4
-2
0
2
4
6
2003 2004 2005 2006 2007 2008 2009 2010 2011 2012Ex
cess
re
turn
(%)
Quant vs. Fundamental by year
Quant
Fundamental
Spread (Quant - Fundamental)

Joseph Mezrich, 212.667.9316,
Stock correlation collapses from record high
& bounces
Note: Shows 21-day stock correlation within sector, where the averages of all pair-wise stock correlations are calculated within GICS 10 sectors in Russell 1000
universe using 21-day total returns, and these correlations are averaged over all GICS 10 sectors. Period of analysis is from 5 January1987 through 11 May 2012.
Source: Nomura Securities International, Inc, Russell, IDC.
5
0
0.1
0.2
0.3
0.4
0.5
0.6
0.7
0.8
0.91
98
7
19
88
19
89
19
90
19
91
19
92
19
93
19
94
19
95
19
96
19
97
19
98
19
99
20
00
20
01
20
02
20
03
20
04
20
05
20
06
20
07
20
08
20
09
20
10
20
11
20
12
21-day stock correlation within sector in Russell 1000
Black Monday
Now
Greek debtLehmanbankrupcy
Gulf War
WorldComAsian financial crisis
LTCM
Sep 12011
Apr 182012

Joseph Mezrich, 212.667.9316,
Which correlation is more relevant for performance?
6
-0.1
-0.05
0
0.05
0.1
0.15
0.2
0.25
0.00
0.10
0.20
0.30
0.40
0.50
0.60
0.70
0.80
0.90
absolute factor return correlation (LHS) factor return correlation (RHS)
Note: Average pairwise 21-day correlation of factor returns using 22 representative factor returns shown in blue. Average pairwise 21-
day correlation of factor return magnitudes shown in red. Period of analysis is from 2 January 1987 through 22 March 2012.
Source: Nomura Securities International, Inc., S&P, Russell, I/B/E/S, Compustat, IDC.

Joseph Mezrich, 212.667.9316,
Factor magnitude correlation reflects diversity
shown by PCA analysis
7
Note: Shows weight of first principal component based on 21-day PCA using 22 representative factor returns (dark blue line) together with 21-day pair-wise absolute
factor correlation based on 22 representative factor returns in Russell 1000 universe (light blue line). Period of analysis is from 30 April 1993 through 11 May 2012.
Source: Nomura Securities International, Inc., S&P, Russell, I/B/E/S, Compustat, IDC.
0
0.1
0.2
0.3
0.4
0.5
0.6
0.7
0.8
0.9
0
10
20
30
40
50
60
70
80
901
99
3
19
94
19
95
19
96
19
97
19
98
19
99
20
00
20
01
20
02
20
03
20
04
20
05
20
06
20
07
20
08
20
09
20
10
20
11
20
12
Factor m
agnitu
de
corre
lation
We
igh
t o
f 1
st p
rin
cip
al c
om
po
ne
nt
(%)
Weight of 1st principal component based on 21-day PCA
21-day factor magnitude correlation

Joseph Mezrich, 212.667.9316,
Book/Price & 1-Year Price Momentum
Correlation with Default Risk
8
-1
-0.8
-0.6
-0.4
-0.2
0
0.2
0.4
0.6
0.8M
ar-9
3
Oct
-93
May
-94
Dec
-94
Jul-9
5
Feb-
96
Sep-
96
Apr-
97
Nov
-97
Jun-
98
Jan-
99
Aug-
99
Mar
-00
Oct
-00
May
-01
Dec
-01
Jul-0
2
Feb-
03
Sep-
03
Apr-
04
Nov
-04
Jun-
05
Jan-
06
Aug-
06
Mar
-07
Oct
-07
May
-08
Dec
-08
Jul-0
9
Feb-
10
Sep-
10
Apr-
11
Nov
-11
Corr
elat
ion
wit
h D
efau
lt Ri
sk
1 Year Price Momentum Book/Price
Is this a picture of diversification?
Note: Chart shows cross sectional correlation between default risk and 1-year price momentum and B/P. As of Dec 31 2011 Universe is Russell 1000.
Source: Nomura Securities International, Inc., Compustat, I/B/E/S, IDC, Russell.

Joseph Mezrich, 212.667.9316,
-0.7
-0.6
-0.5
-0.4
-0.3
-0.2
-0.1
0
0.1
0.21
98
3
19
84
19
85
19
86
19
87
19
88
19
89
19
90
19
91
19
92
19
93
19
94
19
95
19
96
19
97
19
98
19
99
20
00
20
01
20
02
20
03
20
04
20
05
20
06
20
07
20
08
20
09
20
10
20
11
Ran
k C
orr
ela
tio
n
B/P-Momentum
9
Book/Price & 1-Year Price Momentum
Cross sectional correlation
Is this a picture of diversification?
Note: Chart shows cross sectional correlation between B/P and 1-year price momentum and B/P. Universe is Russell 1000. The latest data is as of 30 April 2012.
Source: Nomura Securities International, Inc., Compustat, I/B/E/S, IDC, Russell.

Joseph Mezrich, 212.667.9316,
Stock correlation and factor magnitude correlation –
different paths
Note: Light blue line shows 21-day stock correlation within sector, where the averages of all pair-wise stock correlations are calculated within GICS 10 sectors in
Russell 1000 universe using 21-day total returns and these correlations are averaged over all GICS 10 sectors. Dark blue line shows the average of 21-day pair-wise
absolute factor correlation based on 22 representative factor returns in Russell 1000 universe. Period of analysis is from 30 April 1993 through 11 May 2012.
Source: Nomura Securities International, Inc, Russell, S&P, Bloomberg.
10
0
0.1
0.2
0.3
0.4
0.5
0.6
0.7
0.8
0.9
2003 2004 2005 2006 2007 2008 2009 2010 2011 2012
21-d
ay c
orr
ela
tio
nFactor magnitude correlation vs. Stock correlation
21-day stock correlation within sectors
21-day factor magnitude correlation

Joseph Mezrich, 212.667.9316,
Quant performance depends on factor correlation
Note: Shows average 12-month rolling excess return of quant core funds relative to their benchmarks (dark blue line) together with the average of one-year
(252-day) pair-wise absolute factor correlation based on 22 representative factor returns in Russell 1000 universe (light blue line). Thinner lines are 12-
month moving average of each line. Currently, there are 20 funds in the quant core universe. Period of analysis is from January 2000 through 14 May 2012.
Source: Nomura Securities International, Inc, Bloomberg, Compustat, I/B/E/S, Russell, S&P and IDC.
11
0.15
0.25
0.35
0.45
0.55
0.65
-4
-3
-2
-1
0
1
2
3
4
5
6
2000 2001 2002 2003 2004 2005 2006 2007 2008 2009 2010 2011 2012
Factor m
agnitu
de
corre
lation
base
d o
n o
ne
year (%
)
On
e-y
ear
ro
llin
g al
ph
a o
f q
uan
t co
re f
un
ds
(%)
Quant fund alpha and factor magnitude correlation
One-year rolling alpha of quant core funds
One-year factor magnitude correlation

Joseph Mezrich, 212.667.9316,
Fundamental performance was once much better
Note: Shows 6-month rolling excess return of fundamental core funds (dark blue line). Last data points are as of 14 May 2012.
Source: Nomura Securities International, Inc, Bloomberg, Compustat, IDC, Russell.
12
-4
-3
-2
-1
0
1
2
3
4
5
6
2000 2001 2002 2003 2004 2005 2006 2007 2008 2009 2010 2011 2012
6-m
on
th a
lph
a o
f fu
nd
amen
tal
fun
ds
(%)
Alpha of fundamental funds
6-month alpha of fundamental core funds

Joseph Mezrich, 212.667.9316,
0.1
0.2
0.3
0.4
0.5
0.6
0.7
0.8
-4
-2
0
2
4
6
8
2000 2001 2002 2003 2004 2005 2006 2007 2008 2009 2010 2011 2012
6-m
on
th sto
ck corre
lation
with
in se
ctor
6-m
on
th a
lph
a o
f fu
nd
amen
tal
fun
ds
(%)
Alpha of fundamental funds and stock correlation
6-month alpha of Fundamental funds
6-month Stock correlation
Something changed
Fundamental performance depends on stock correlation
Note: Shows 6-month rolling excess return of fundamental core funds (dark blue line) and 126-day pair-wise stock correlation within sector in Russell
1000 (light blue line). Last data points are as of 14 May 2012.
Source: Nomura Securities International, Inc, Bloomberg, Compustat, IDC, Russell.
13

Joseph Mezrich, 212.667.9316,
Stock correlation
and the growth of systemic risk
14

Joseph Mezrich, 212.667.9316,
0
0.1
0.2
0.3
0.4
0.5
0.6
0.7
0.8
0.9
19
87
19
88
19
89
19
90
19
91
19
92
19
93
19
94
19
95
19
96
19
97
19
98
19
99
20
00
20
01
20
02
20
03
20
04
20
05
20
06
20
07
20
08
20
09
20
10
20
11
20
12
Black Monday
Asian financial crisis
Lehmanbankrupcy
Now
Chinainflationconcern
0
0.1
0.2
0.3
0.4
0.5
0.6
0.7
0.8
0.9
19
87
19
88
19
89
19
90
19
91
19
92
19
93
19
94
19
95
19
96
19
97
19
98
19
99
20
00
20
01
20
02
20
03
20
04
20
05
20
06
20
07
20
08
20
09
20
10
20
11
20
12
Japan earthquake
Lehmanbankruptcy
Black Monday
Now
Gulf War
Yamaichi bankruptcy
Quick rise of Yen rate
0
0.1
0.2
0.3
0.4
0.5
0.6
0.7
0.8
0.9
19
87
19
88
19
89
19
90
19
91
19
92
19
93
19
94
19
95
19
96
19
97
19
98
19
99
20
00
20
01
20
02
20
03
20
04
20
05
20
06
20
07
20
08
20
09
20
10
20
11
20
12
Black Monday
Now
Greek debtLehmanbankrupcy
Gulf War
WorldComAsian financial crisis
LTCM
0
0.1
0.2
0.3
0.4
0.5
0.6
0.7
0.8
0.9
19
87
19
88
19
89
19
90
19
91
19
92
19
93
19
94
19
95
19
96
19
97
19
98
19
99
20
00
20
01
20
02
20
03
20
04
20
05
20
06
20
07
20
08
20
09
20
10
20
11
20
12
Black Monday
Soviet coup Lehmanbankrupcy
Greek debt
Now
Stock correlation around the globe and the trend of
increasing stock correlation
Note: Shows 21-day stock correlation within sector, where the averages of all pair-wise stock correlations are calculated using 21-day total returns within
the 10 GICS sectors in the Russell 1000 (US), MSCI Europe (Europe) and MSCI Asia Pacific ex Japan (Asia) and within the 10 QUICK sectors in the
TOPIX 500 (Japan), and these correlations are averaged over all 10 sectors. Period of analysis is from 2 January1987 through 11 May 2012.
Source: Nomura Securities International, Inc., Russell, MSCI, IDC, S&P, Exshare
US Japan
Europe Asia
15

Joseph Mezrich, 212.667.9316,
Stock Correlation, now a product of sector correlation?
Note: Shows the average of within-sector stock correlation (top panel) and the average correlation
among 10 GICS sectors (middle panel). Bottom panel is the overlay of the top and bottom panels.
The panel on the right shows the spread between sector correlation and stock correlation. Universe
is Russell 1000.. Data from March 31, 1987 through May 15, 2012
Source: Nomura Securities International, Inc., Compustat, I/B/E/S, IDC, Russell.
28
0
0.1
0.2
0.3
0.4
0.5
0.6
0.7
0.8
0.9
Average correlation of stocks within sectors
0
0.1
0.2
0.3
0.4
0.5
0.6
0.7
0.8
0.9
1984
1985
1986
1987
1988
1989
1990
1991
1992
1993
1994
1995
1996
1997
1998
1999
2000
2001
2002
2003
2004
2005
2006
2007
2008
2009
2010
2011
2012
Average correlation of sectors Average correlation of stocks within sectors
0
0.1
0.2
0.3
0.4
0.5
0.6
0.7
0.8
0.9Average correlation of sectors
-0.3
-0.2
-0.1
0
0.1
0.2
0.3
0.4
0.5
0.6
19
84
19
85
19
86
19
87
19
88
19
89
19
90
19
91
19
92
19
93
19
94
19
95
19
96
19
97
19
98
19
99
20
00
20
01
20
02
20
03
20
04
20
05
20
06
20
07
20
08
20
09
20
10
20
11
20
12
Spread between Sector Correlation and Stock Correlation
Joseph Mezrich, 212.667.9316,
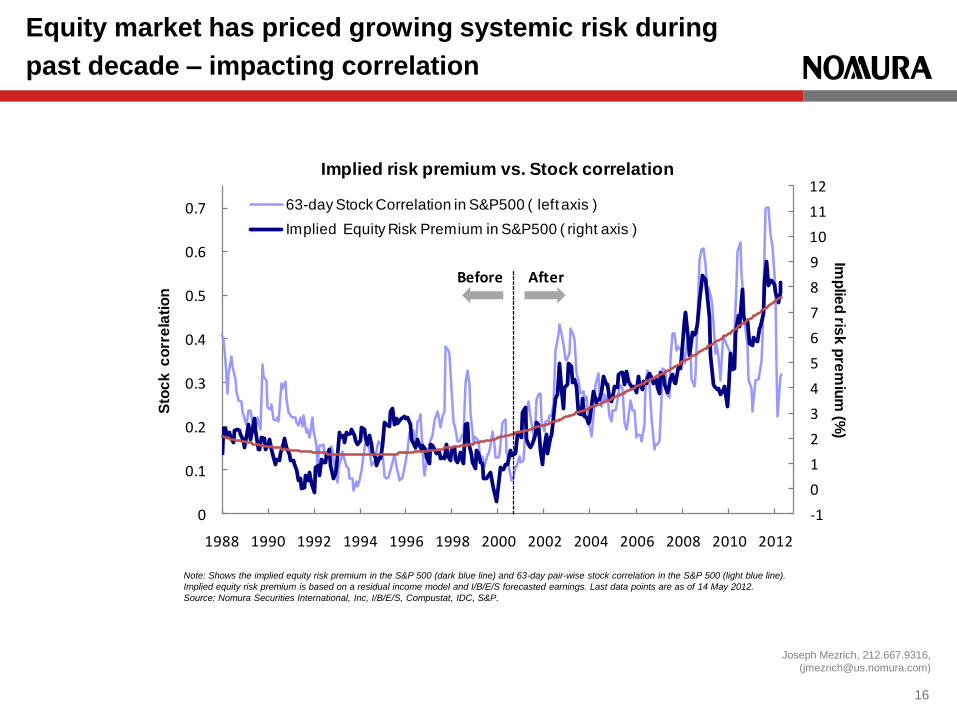
Equity market has priced growing systemic risk during
past decade – impacting correlation
Note: Shows the implied equity risk premium in the S&P 500 (dark blue line) and 63-day pair-wise stock correlation in the S&P 500 (light blue line).
Implied equity risk premium is based on a residual income model and I/B/E/S forecasted earnings. Last data points are as of 14 May 2012.
Source: Nomura Securities International, Inc, I/B/E/S, Compustat, IDC, S&P.
16
-1
0
1
2
3
4
5
6
7
8
9
10
11
12
0
0.1
0.2
0.3
0.4
0.5
0.6
0.7
1988 1990 1992 1994 1996 1998 2000 2002 2004 2006 2008 2010 2012
Imp
lied
risk
pre
miu
m (%
)
Sto
ck
co
rre
lati
on
63-day Stock Correlation in S&P500 ( left axis )
Implied Equity Risk Premium in S&P500 ( right axis )
AfterBefore
Implied risk premium vs. Stock correlation

Joseph Mezrich, 212.667.9316,
Equity market has priced growing systemic risk during
past decade – impacting correlation
Note: Top chart shows the implied equity risk premium in the S&P 500 (dark blue line) and 63-day pair-wise stock correlation in the S&P 500 (light blue
line), while bottom chart shows the implied equity risk premium (dark blue line) and VIX (implied volatility in one-month S&P 500 options, light blue line).
Implied equity risk premium is based on a residual income model and I/B/E/S forecasted earnings. Last data points are as of 14 May 2012.
Source: Nomura Securities International, Inc, I/B/E/S, Compustat, IDC, S&P. 17
-1
0
1
2
3
4
5
6
7
8
9
10
11
12
0
0.1
0.2
0.3
0.4
0.5
0.6
0.7
1988 1990 1992 1994 1996 1998 2000 2002 2004 2006 2008 2010 2012
Imp
lied
risk
pre
miu
m (%
)
Sto
ck
co
rre
lati
on
63-day Stock Correlation in S&P500 ( left axis )
Implied Equity Risk Premium in S&P500 ( right axis )
-1
0
1
2
3
4
5
6
7
8
9
10
11
12
0
10
20
30
40
50
60
1988 1990 1992 1994 1996 1998 2000 2002 2004 2006 2008 2010 2012
Imp
lied
risk
pre
miu
m (%
)
Imp
lie
d
vo
lati
lity
(%
)
Implied Volatility in one-month S&P500 option ( VIX, left axis )
Implied Equity Risk Premium in S&P500 ( right axis )
AfterBefore
Implied risk premium vs. Stock correlation
Implied risk premium vs. Implied volatility

Joseph Mezrich, 212.667.9316,
Disconnect – Stocks vs. bonds & macro
17
-1
-0.5
0
0.5
1
1.5
2
2.5
3
3.5
4
2004 2005 2006 2007 2008 2009 2010 2011 2012 2013
Imp
lied
10
-year in
flation
rate (%
)
23
26
29
32
35
38
41
44
47
50
53
56
59
62
65
-7-6-5-4-3-2-10123456789
101112131415
2004 2005 2006 2007 2008 2009 2010 2011 2012
ISM M
anu
facturin
g PM
I Ind
ex
Imp
lied
lon
g-te
rm e
arn
ings
gro
wth
rat
e (
%)
Implied long-term earnings growth rate
ISM Manufacturing PMI Composite Index
Average long-term earnings growthsince World War II ( 7.1% )
Implied 10-year inflation rate
Implied earnings growth, implied inflation and ISM Manufacturing PMI
Note: Shows the implied long-term earnings growth (LTG) of S&P500 (dark blue line) and implied 10-year inflation rate (light blue line).
Implied LTG (from FY1 to FY5) is derived by inputting expected equity risk premium in Duke University’s CFO survey, based on a residual
income model. Equity risk premium since March 2012 is estimated by linear model using VIX and previous month’s risk premium. Implied
inflation rate is calculated by subtracting the real yield of the inflation- linked maturity from the yield of the closest nominal Treasury maturity.
Last data points are as of 14 May2012.
Source: Nomura Securities International, Inc, Graham and Harvey (2012), I/B/E/S, S&P, Compustat, IDC, Bloomberg.

Joseph Mezrich, 212.667.9316,
Factor failure –
Momentum & revisions meet reg FD
18

Joseph Mezrich, 212.667.9316,
Momentum worked consistently for sixty years,
and then …
Note: Cumulative monthly factor returns to 12-month momentum (decile spreads) since 1940. The portfolios are constructed monthly using NYSE prior (2-12) return decile
breakpoints. Universe is all NYSE, AMEX, and NASDAQ stocks. Analysis based on data from January 1940 to December 2009. Transaction costs not considered.
Source: Kenneth R. French’s website (http://mba.tuck.dartmouth.edu/pages/faculty/ken.french/data_library.html, Nomura Securities International Inc.
0
200
400
600
800
1,000
1,200
1,400
1940
1943
1946
1949
1952
1955
1958
1961
1964
1967
1970
1973
1976
1979
1982
1985
1988
1991
1994
1997
2000
2003
2006
2009
Cum
ula
tive
m
onth
ly r
etu
rns (
%)
1 Year Momentum since 1940
19

Joseph Mezrich, 212.667.9316,
0
20
40
60
80
100
120
140
160
1980
1982
1983
1984
1985
1986
1987
1988
1989
1990
1991
1992
1993
1994
1995
1996
1997
1998
1999
2000
2001
2002
2003
2004
2005
2006
2007
Cu
mu
lati
ve
mo
nth
ly r
etu
rns,
%
Revision long alpha
Revision short alpha
0
50
100
150
200
250
300
1980
1982
1983
1984
1985
1986
1987
1988
1989
1990
1991
1992
1993
1994
1995
1996
1997
1998
1999
2000
2001
2002
2003
2004
2005
2006
2007
Cu
mu
lati
ve
mo
nth
ly r
etu
rns,
% Revision
Is price momentum permanently damaged?
Note: Based on analyst up down revisions (number of FY1 I/B/E/S up estimates minus number of down estimates divided by total number of estimates). Top panel shows long-side
alpha (blue line, return of the highest-ranked decile minus the return of the market, Russell 1000) and short-side alpha (red line, market return minus the lowest-ranked decile return).
Bottom panel shows the factor return of up down revisions (long-side alpha plus short alpha), excluding transaction costs. Universe is Russell 1000. Last data as of 2/28/2010.
Source: Nomura Securities International Inc., Compustat, I/B/E/S, Russell, and IDC.
Impact of estimate revisions diminished due to Reg FD
1 year price momentum factor return Estimate revisions factor return
0
50
100
150
200
250
1978
1980
1981
1982
1983
1984
1985
1986
1987
1988
1989
1990
1991
1992
1993
1994
1995
1996
1997
1998
1999
2000
2001
2002
2003
2004
2005
2006
2007
Cu
mu
lati
ve
mo
nth
ly r
etu
rns,
%
1 year PM long alpha
1 year PM short alpha
0
50
100
150
200
250
300
350
400
1978
1980
1981
1982
1983
1984
1985
1986
1987
1988
1989
1990
1991
1992
1993
1994
1995
1996
1997
1998
1999
2000
2001
2002
2003
2004
2005
2006
2007
Cu
mu
lati
ve
mo
nth
ly r
etu
rns,
%
1 Year Price Momentum
20

Joseph Mezrich, 212.667.9316,
-50
0
50
100
150
200
250
300
350
-50
0
50
100
150
200
250
300
19
80
19
82
19
84
19
86
19
88
19
90
19
92
19
94
19
96
19
98
20
00
20
02
20
04
20
06
20
08
1 y
r P
M:
Cu
mu
lati
ve
Mo
nth
ly R
etu
rns
, %
Re
vis
ion
: C
um
ula
tiv
e M
on
thly
Re
turn
s,
%
Revision
1yrPM
10/2000 when Reg FD was implemented
The world changed around 2000
Note: Shows returns to analyst up down revisions (blue line, number of FY1 I/B/E/S up estimates minus down estimates divided
by total number of estimates) and returns to one-year price momentum (red line, last twelve months’ returns minus last month’s),
excluding transaction cost. Universe is Russell 1000. Last data as of 2/28/2010. Transaction costs are not considered.
Source: Nomura Securities International Inc., Russell, IDC.
The momentum-revisions coupling conundrum
21


Joseph Mezrich, 212.667.9316,
-0.4
-0.3
-0.2
-0.1
0
0.1
0.2
0.3
0.4
0.5
0.6
0.71
98
4
19
85
19
86
19
87
19
88
19
89
19
90
19
91
19
92
19
93
19
94
19
95
19
96
19
97
19
98
19
99
20
00
20
01
20
02
20
03
20
04
20
05
20
06
20
07
20
08
20
09
20
10
20
11
Ran
k C
orr
ela
tio
n
Rank Correlation between B/P(predicted LTG) and Beta
B/P and Beta
Predicted LT growth and Beta
Regime shift in market risk of B/P and
predicted LT growth
Note: Shows a history of rank correlation between B/P and beta (dark blue line) and rank correlation between predicted long-term earnings growth and beta
(light blue line). Universe is Russell 1000. Period of analysis is from November 1983 through April 2012.
Source: Nomura Securities International Inc., Compustat, I/B/E/S, Russell, and IDC.
24

Joseph Mezrich, 212.667.9316,
-4
-3
-2
-1
0
1
2
3
4
5
6
7
19
82
19
84
19
86
19
88
19
90
19
92
19
94
19
96
19
98
20
00
20
02
20
04
20
06
20
08
20
10
Z-sc
ore
d d
isp
ers
ion
in
val
ue
fac
tor
Dispersion in value factors
Sales/Price Predicted E/P
EBITDA/EV Dividend Yield
E/P B/P
Spread in value factor dispersion – out of sync
over the past decade
Note: Shows de-trended and normalized dispersion of value factors (predicted E/P, E/P, B/P, dividend yield, Sales/Price, and EBITDA/EV) across the Russell 1000 stocks.
The dispersion of value factors is calculated by Median Absolute Deviation (MAD) / Median. Period of analysis is from January 1982 through December 2011.
Source: Nomura Securities International, Inc, Russell, Compustat, I/B/E/S, IDC.
25

Joseph Mezrich, 212.667.9316,
-0.4 -0.2 0 0.2 0.4
Predicted LT GrowthBeta
5 Year EPS Growth1 Year Price Momentum
CapEx/SalesUp to Down Revisions
1 Year Dividend GrowthPEG
Market Cap (Small - Large)Analyst Coverage
ROEEstimate Dispersion
1 Mon. Price ReversalE/P
Debt/EquityDividend Yield
Share BuybacksPredicted E/P
Earnings Quality (Accruals)EBITDA/EV
B/P
(i) 1985 - 1999
-0.4 -0.2 0 0.2 0.4
Predicted LT GrowthBeta
CapEx/Sales5 Year EPS Growth
Default RiskMarket Cap (Small - Large)
Analyst CoverageEstimate Dispersion
1 Mon. Price ReversalPEG
1 Year Dividend GrowthB/P
Up to Down Revisions1 Year Price Momentum
Dividend YieldEarnings Quality (Accruals)
Debt/EquityEBITDA/EV
Share BuybacksPredicted E/P
E/PROE
(ii) 2000 - 2005
-0.4 -0.2 0 0.2 0.4
B/PDefault RiskDebt/Equity
Estimate DispersionMarket Cap (Small - Large)Earnings Quality (Accruals)
BetaDividend Yield
EBITDA/EVPEG
1 Mon. Price ReversalPredicted E/P
Analyst CoverageCapEx/Sales
Predicted LT GrowthShare Buybacks
E/P5 Year EPS Growth
1 Year Dividend GrowthUp to Down Revisions
1 Year Price MomentumROE
(iii) 2006 - 2010
-0.4 -0.2 0 0.2 0.4
Default RiskBeta
Estimate DispersionMarket Cap (Small - Large)
B/PPEG
1 Year Dividend GrowthPredicted E/P
1 Mon. Price ReversalDebt/Equity
Predicted LT GrowthEarnings Quality (Accruals)
EBITDA/EVAnalyst Coverage
CapEx/SalesE/P
1 Year Price MomentumDividend Yield
Up to Down RevisionsShare Buybacks
ROE5 Year EPS Growth
(iv) 2011
Value
Growth
Value
Growth
Risk
Risk
Value vs. Growth were main drivers B/P migrated away from drivers
Value and Risk got mixed Risk dominated factor efficacies
First principal component loadings: paradigm shift
in “value vs. growth” over time
Note: Shows loadings of first principal component based on the performances of 22 representative factors for different periods: (i) January 1985 to December 1999,
(ii) January 2000 to December 2005, (iii) January 2006 to December 2010, and (iv) January 2011 to December 2011. For reasons of long-term data availability, the
analysis in the period (i) omits the default risk factor from our 22 representative factor (see Appendix B for factor definitions). Only period (iv), January 2011 to
December 2011, is based on daily factor performances, while other periods are based on monthly factor performances. Universe is Russell 1000.
Source: Nomura Securities International, Inc., Compustat, I/B/E/S, IDC, Russell. 26


Joseph Mezrich, 212.667.9316,
Factor Correlation with beta and default risk
Note: Shows factor score rank correlations with beta and default risk, as of December 31 2011. Yellow highlights indicate ten factors
with highest rank correlations, while blue highlights indicate ten factors with lowest rank correlations. Universe is Russell 1000.
Source: Nomura Securities International, Inc., Compustat, I/B/E/S, IDC, Russell.
Rank Correlation with Beta Rank Correlation with Default Risk
January 2012 January 2012
Beta 0.60
Default Risk 0.60
B/P 0.18 0.50
EPS Variability 0.49 0.50
EBITDA/Price 0.15 0.48
Estimate Dispersion 0.22 0.45
Sales/Price 0.18 0.40
Predicted E/P 0.21 0.39
EBITDA/EV 0.19 0.39
PEG 0.43 0.37
PEGY 0.38 0.36
Rank Correlation with Beta Rank Correlation with Default Risk
January 2012 January 2012
Gross Margin -0.12 -0.28
Dividend Payout Ratio -0.31 -0.30
5 Year EPS Growth -0.18 -0.33
ROE -0.08 -0.34
EBIT/WCPPE -0.16 -0.34
5 Year Dividend Growth -0.23 -0.35
Stable Growth -0.29 -0.41
ROIC -0.12 -0.41
ROA -0.12 -0.49
1 Year Price Momentum -0.31 -0.56
29

Joseph Mezrich, 212.667.9316,
Unintended bets - Risk off/Risk on/Risk Irrelevant
Note: Shows f actor returns against factors’ score rank correlation with default risk and beta. Universe is Russell 1000.
Source: Nomura Securities International, Inc., Compustat, I/B/E/S, IDC, Russell.
-15
-10
-5
0
5
10
-0.8 -0.6 -0.4 -0.2 0.0 0.2 0.4 0.6 0.8
Fact
or R
etur
n (%
)
Rank Correlation with Default Risk
Factor Return vs Correlation with Default Risk
-15
-10
-5
0
5
10
-0.4 -0.2 0.0 0.2 0.4 0.6 0.8
Fact
or R
etur
n (%
)
Rank Correlation with Beta
Factor Return vs Correlation with beta
Risk –on (Oct 2011)
-10
-5
0
5
10
15
20
-0.6 -0.4 -0.2 0.0 0.2 0.4 0.6 0.8
Fact
or R
etur
n (%
)
Rank Correlation with Default Risk
Factor Return vs Correlation with Default Risk
-10
-5
0
5
10
15
20
-0.4 -0.2 0.0 0.2 0.4 0.6 0.8
Fact
or R
etur
n (%
)Rank Correlation with Beta
Factor Return vs Correlation with beta
Risk – irrelevant(Oct 2005)
-6
-4
-2
0
2
4
-0.3 -0.2 -0.1 0.0 0.1 0.2 0.3 0.4
Fact
or
Ret
urn
(%)
Rank Correlation with Default Risk
Factor Return vs Correlation with Default Risk
-6
-4
-2
0
2
4
-0.4 -0.3 -0.2 -0.1 0.0 0.1 0.2 0.3 0.4 0.5
Fact
or
Ret
urn
(%)
Rank Correlation with Beta
Factor Return vs Correlation with beta
30

Joseph Mezrich, 212.667.9316,
Unintended bets - default (credit) risk has entered the room
Note: Shows R-squared of the regression of 52 factors (sector neutral) monthly return against their score rank correlation with
beta(blue line), and the default risk (red line) Period of analysis is January 1985 through Februrary 2012. Universe is Russell 1000.
Source: Nomura Securities International, Inc., Compustat, I/B/E/S, IDC, Russell.
31
0
0.1
0.2
0.3
0.4
0.5
0.6
0.7
19
85
19
86
19
87
19
88
19
89
19
90
19
91
19
92
19
93
19
94
19
95
19
96
19
97
19
98
19
99
20
00
20
01
20
02
20
03
20
04
20
05
20
06
20
07
20
08
20
09
20
10
20
11
20
12
R-s
qu
ared
market risk
default risk

Joseph Mezrich, 212.667.9316,
Price momentum, default risk and beta
Note: Shows monthly cumulative returns of factors one-year price momentum (blue line), default risk (high-low, red line) and beta (high-low,
green line). Universe is Russell 1000. Period of analysis is from March 1993 through December 2011. Transaction costs are not considered.
Source: Nomura Securities International, Inc., Compustat, I/B/E/S, IDC, Russell. 34
-100
-50
0
50
100
150
200
Ma
r-9
3
No
v-9
3
Jul-
94
Ma
r-9
5
No
v-9
5
Jul-
96
Ma
r-9
7
No
v-9
7
Jul-
98
Ma
r-9
9
No
v-9
9
Jul-
00
Ma
r-0
1
No
v-0
1
Jul-
02
Ma
r-0
3
No
v-0
3
Jul-
04
Ma
r-0
5
No
v-0
5
Jul-
06
Ma
r-0
7
No
v-0
7
Jul-
08
Ma
r-0
9
No
v-0
9
Jul-
10
Ma
r-1
1
No
v-1
1
Cu
mu
lati
ve
Mo
nth
ly F
act
or
Re
turn
s, % 1 Year Price Momentum
high default - low default
Beta
July 2007
-1
-0.8
-0.6
-0.4
-0.2
0
0.2
0.4
0.6
0.8
1
Ma
r-9
3
No
v-9
3
Jul-
94
Ma
r-9
5
No
v-9
5
Jul-
96
Ma
r-9
7
No
v-9
7
Jul-
98
Ma
r-9
9
No
v-9
9
Jul-
00
Ma
r-0
1
No
v-0
1
Jul-
02
Ma
r-0
3
No
v-0
3
Jul-
04
Ma
r-0
5
No
v-0
5
Jul-
06
Ma
r-0
7
No
v-0
7
Jul-
08
Ma
r-0
9
No
v-0
9
Jul-
10
Ma
r-1
1
No
v-1
1
Co
rre
lati
on
of m
om
en
tum
wit
h D
efa
ult
R
isk
and
Be
ta
Momentum with Default Risk Momentum with Beta
1
2
Joseph Mezrich, 212.667.9316,
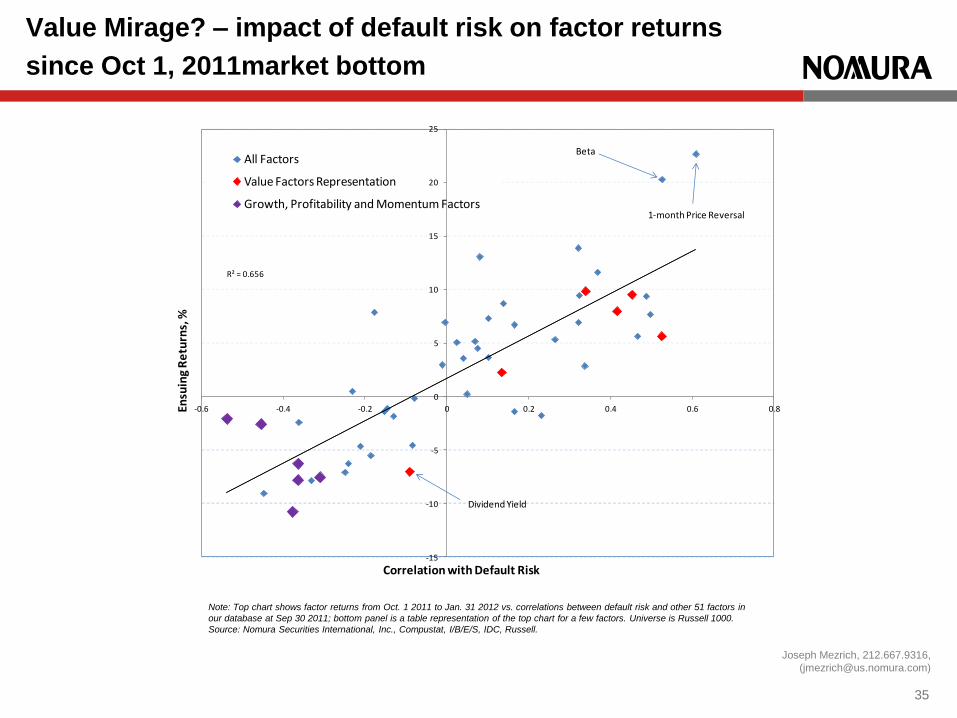
Value Mirage? – impact of default risk on factor returns
since Oct 1, 2011market bottom
Note: Top chart shows factor returns from Oct. 1 2011 to Jan. 31 2012 vs. correlations between default risk and other 51 factors in
our database at Sep 30 2011; bottom panel is a table representation of the top chart for a few factors. Universe is Russell 1000.
Source: Nomura Securities International, Inc., Compustat, I/B/E/S, IDC, Russell.
35
R² = 0.656
-15
-10
-5
0
5
10
15
20
25
-0.6 -0.4 -0.2 0 0.2 0.4 0.6 0.8Ensu
ing
Re
turn
s, %
Correlation with Default Risk
All Factors
Value Factors Representation
Growth, Profitability and Momentum Factors
Beta
1-month Price Reversal
Dividend Yield

Joseph Mezrich, 212.667.9316,
36
Impact of default risk on factor returns
between Oct 1, 2011 and March 31, 2012
R² = 0.4761
-15
-10
-5
0
5
10
15
20
25
30
-0.6 -0.4 -0.2 0 0.2 0.4 0.6 0.8
Ensu
ing
Retu
rns,
%
Correlation with Default Risk
All Factors
Value Factors Representation
Growth, Profitability and Momentum Factors
Beta
1-month Price Reversal
Dividend Yield
Value
Factors Correlation (9/30/2011) Returns (10/1/2011 - 3/31/2012)
B/P 0.53 4.55
SALES/PRICE 0.45 7.60
PREDICTED E/P 0.42 4.44
EBITDA/EV 0.34 2.04
E/P 0.13 -0.54
DIVIDEND YIELD -0.09 -10.12
Growth, Profitability
and Momentum Correlation (9/30/2011) Returns (10/1/2011 - 1/19/2012)
5 Year EPS Growth -0.38 -11.18
5 Year Dividend Growth -0.36 -10.14
ROE -0.36 -7.27
ROIC -0.45 -2.79
ROA -0.54 -3.63
1 Year Price Momentum -0.31 -5.43
Note: Top chart shows factor returns from Oct. 1 2011 to March. 31 2012 vs. correlations between default risk and other 51 factors in
our database at Sep 30 2011; bottom panel is a table representation of the top chart for a few factors. Universe is Russell 1000.
Source: Nomura Securities International, Inc., Compustat, I/B/E/S, IDC, Russell.
Joseph Mezrich, 212.667.9316,
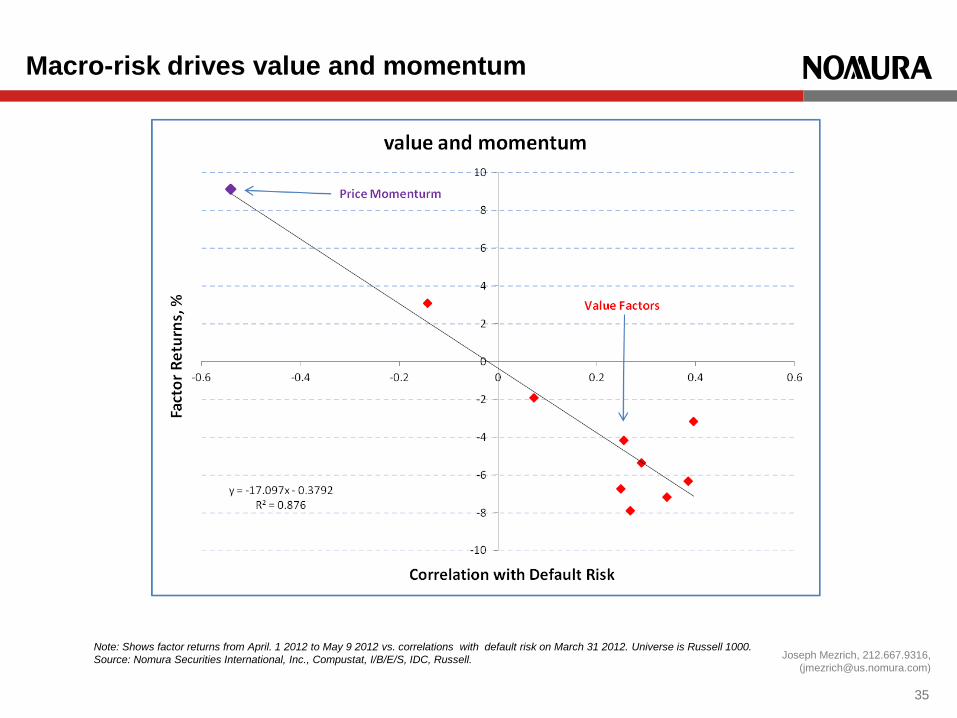
Macro-risk drives value and momentum
Note: Shows factor returns from April. 1 2012 to May 9 2012 vs. correlations with default risk on March 31 2012. Universe is Russell 1000.
Source: Nomura Securities International, Inc., Compustat, I/B/E/S, IDC, Russell.
35

Joseph Mezrich, 212.667.9316,
Where do changes of the past decade leave investors?
The hunt for alpha: Paradigm in motion
37

Joseph Mezrich, 212.667.9316,
Crossing correlation trends –
rising for stocks, flat for factors
Note: Light blue line shows 21-day stock correlation within sector, where the averages of all pair-wise stock correlations are calculated within GICS 10 sectors in
Russell 1000 universe using 21-day total returns and these correlations are averaged over all GICS 10 sectors. Dark blue line shows the average of all pair-wise
absolute factor correlation among 22 representative factor returns in Russell 1000 universe. Period of analysis is from 2 January 1991 through 11 May 2012.
Source: Nomura Securities International, Inc, Russell, S&P, Bloomberg.
38
0
0.1
0.2
0.3
0.4
0.5
0.6
0.7
0.81
99
1
19
92
19
93
19
94
19
95
19
96
19
97
19
98
19
99
20
00
20
01
20
02
20
03
20
04
20
05
20
06
20
07
20
08
20
09
20
10
20
11
20
12
21
-day
co
rre
lati
on
Factor magnitude correlation vs. Stock correlation
21-day factor magnitude correlation21-day stock correlation
?

Joseph Mezrich, 212.667.9316,
0
0.1
0.2
0.3
0.4
0.5
0.6
0.7
0.8
19
91
19
92
19
93
19
94
19
95
19
96
19
97
19
98
19
99
20
00
20
01
20
02
20
03
20
04
20
05
20
06
20
07
20
08
20
09
20
10
20
11
20
12
21
-day
co
rre
lati
on
Factor magnitude correlation vs. Stock correlation
21-day factor magnitude correlation21-day stock correlation
Crossing correlation trends –
rising for stocks, flat for factors
39
Note: Light blue line shows 252-day (one-year) stock correlation within sector, where the averages of all pair-wise stock correlations are calculated within GICS 10 sectors in
Russell 1000 universe using 252-day total returns and these correlations are averaged over all GICS 10 sectors. Dark blue line shows the average of all pair-wise absolute
factor correlation using 252-day factor returns of 22 representative factors in Russell 1000 universe. Period of analysis is from 2 January 1991 through 11 May 2012.
Source: Nomura Securities International, Inc., S&P, Russell, I/B/E/S, Compustat, IDC.
.
0
0.1
0.2
0.3
0.4
0.5
0.6
0.7
19
91
19
92
19
93
19
94
19
95
19
96
19
97
19
98
19
99
20
00
20
01
20
02
20
03
20
04
20
05
20
06
20
07
20
08
20
09
20
10
20
11
20
12
On
e-y
ear
co
rre
lati
on
Factor magnitude correlation vs. Stock correlation
One-year stock correlation
One-year factor magnitude correlation

Joseph Mezrich, 212.667.9316,
Factor premium vs. stock alpha
A diversification opportunity?
40
Note: Shows one-year rolling excess return (relative to the benchmark) in large-cap core funds based on quantitative methodologies (dark blue line) and
large-cap core funds based on fundamental methodologies (light blue line). Currently, there are 20 funds in the quant core universe and 44 funds in the
fundamental core universe. Period of analysis is from January 2003 through 11 May 2012.
Source: Nomura Securities International, Inc., Bloomberg, S&P, Russell.
-4
-3
-2
-1
0
1
2
3
4
5
6
7
2000 2001 2002 2003 2004 2005 2006 2007 2008 2009 2010 2011 2012
On
e-y
ear
ro
llin
g al
ph
a o
f co
re f
un
ds
(%)
Fundamental fund alpha vs. Quant fund alpha
One-year rolling alpha of fundamental core funds
One-year rolling alpha of quant core funds

Conclusion
– Wisdom of crowds or madness of crowds?

Joseph Mezrich, 212.667.9316,
Disclaimer
News and statistical data are aggregated from Bloomberg and other public sources including local newswires and are provided for informational purposes only.
This market commentary has been prepared by individual sales or trading personnel of Nomura Securities, International, Inc. ("Nomura" or the “Firm”). The opinions and comments contained herein
represent the views and observations of individual sales or trading personnel and are not a product of Nomura's Research Department. This market commentary (including any summaries and trading
calls) represents short-term ideas designed to take advantage of the most recent market fluctuations, which are subject to change without notice, and may differ from, or be inconsistent with the views of
Nomura research analysts or other sales and trading personnel within the Firm. The trading calls, in particular, are based on the observations by the Firm’s trading and sales personnel of various market
and trading data, including, but not limited to, trading volumes, oversold/undersold indicators and other technical information, market color, published news stories and Nomura research. More
information, however, is available upon request. Please contact your Nomura sales coverage person for more information on the items covered in this market commentary.
This material has been prepared or distributed by sales and trading personnel of Nomura Securities International, Inc. (“Nomura”) and is not a product of a Nomura research department.
This material is (1) for your information only; (2) not to be construed as an offer to sell or a solicitation of an offer to buy any security mentioned herein; and (3) based upon information that we consider
reliable, but we do not represent that it is accurate or complete, and it should not be relied upon as such. Opinions expressed are current opinions as of the date appearing on this material only and the
information, including the opinions contained herein, are subject to change without notice.
Complete copies of any research report referenced, summarized or excerpted in this message and related disclosures are available on the Nomura research website which can be accessed through the
link below. These reports may contain dated information and are sent for historical purposes only. They should not be relied upon in substitution for the exercise of independent judgment, are intended
for your use only and may not be transmitted to other parties.
Nothing herein shall form the basis of or be relied on in connection with any contract or commitment whatsoever. Neither Nomura nor any other person accepts any liability whatsoever for any loss
(howsoever arising and whether direct or consequential) from any use of the information contained herein or otherwise arising in connection herewith.
Nomura Research Website (http://www.nomuranow.com/research/globalresearchportallogin/login.aspx?ReturnUrl=research/globalresearchportal/Default.aspx)
Derivative investments require investors to assess several characteristics and risk factors that may not be present in other types of transactions. You should consider the specific return and risk profile
of a particular derivative investment before effecting, or agreeing to effect, any transaction. In reaching a determination as to the appropriateness of any proposed transaction, clients should undertake a
thorough independent review of the legal, regulatory, credit, tax, accounting and economic consequences of such action. The information presented has been obtained from or based upon sources
believed by the trader or sales person to be reliable, but none of Nomura or its employees, the trader or sales person represents or warrant its accuracy or completeness and is not responsible for losses
or damages arising out of errors, omissions or changes in market factors.
We do not provide legal, accounting or tax advice. In compliance with Internal Revenue Service Circular 230, we hereby notify you that any discussion of tax matters set forth herein was written in
connection with the promotion or marketing of the matters described herein and was not intended or written to be used, and cannot be used by any person, for the purposes of avoiding tax-related
penalties under federal, state or local tax law. Each person should seek legal, accounting and tax advice based on its particular circumstances from independent advisors.
Nomura and its affiliates may from time to time perform investment banking or other services (including acting as advisor, manager or lender) for or solicit investment banking or other business from,
companies mentioned herein. Nomura and its affiliates may make a market or deal as principal in the securities mentioned in this document or in options, futures, or other derivatives based thereon. In
addition, Nomura and its affiliates, shareholders, directors, officers and/or employees may from time to time have long or short positions in such securities or in options, futures, or other derivative
instruments based thereon.
No part of this material may be (i) copied, photocopied, or duplicated in any form, by any means, or (ii) redistributed without our prior express consent. Further information on any of the securities
mentioned herein may be obtained upon request. If this publication has been distributed by electronic transmission, such as e-mail, then such transmission cannot be guaranteed to be secure or error-
free as information could be intercepted, corrupted, lost, destroyed, arrive late or incomplete, or contain viruses. The sender therefore does not accept liability for any errors or omissions in the contents
of this publication, which may arise as a result of electronic transmission. If verification is required, please request a hard-copy version.
Nomura Securities International, Inc. is a member of FINRA (http://www.finra.org/index.htm) and SIPC(http://www.sipc.org/).
This commentary has been prepared by a desk strategist and is NOT a product of the Research Department.
42

Nomura Securities International, Inc., New York
Quantitative Desk Strategies
This commentary has been prepared by a Nomura equities desk
strategist and is NOT a product of the Research Department.
STRICTLY PRIVATE AND CONFIDENTIAL
43