no. 2 april 1998 - cgap. 2 april 1998 cgap for comments, ... cost allocation for multi-service...
TRANSCRIPT
CGAP THE CONSULTATIVE GROUP TO ASSIST THE POOREST [ A M I C R O F I N A N C E P R O G R A M ]
N o . 2 A p r i l 1 9 9 8
C G A P
For comments,contributions, or
requests for othernotes in this series,
please contact CGAP Secretariat
1818 H Street, NWWashington DC
20433
Tel: 202. 473 9594
Fax: 202. 522 3744
e-mail:[email protected]
WWW:http://www.cgap.org
Cost Al location for Mult i -Service Microfinance
Institutions 1
I . I n t r o d u c t i o n
Microfinance institutions (MFIs) increas-ingly see financial viability as a core elementof their business strategy. To implementthis strategy, MFI managers must analyzetheir financial statements for indicators ofprofitability and efficiency. But which costs,revenues, and balance sheet items should beincluded in such analysis? This question canbe complicated, especially in multi-purposeorganizations.
A number of institutions that providemicrofinance services also offer a range ofnon-financial services, such as business de-velopment services (training and technicalassistance to microentrepreneurs) and train-ing in areas like literacy, health, family plan-ning, or nutrition. Should financial servicesbe treated as a distinct cost or profit centervis a vis non-financial services in an MFI'saccounts?2 The answer will depend on theMFI's institutional vision and strategy, itscommitment to the self-sufficiency of its fi-nancial services, and the importance and au-tonomy of non-financial services within theorganization.
Many multi-service MFIs have realized theimportance of creating distinct cost centersfor their financial and non-financial programs.Separating the financial statements into costcenters facilitates analysis of past and cur-rent financial performance of microfinanceservices and provides a basis for business plan-ning and projections. Financial analysis al-lows managers to identify strengths andweaknesses in their microfinance services and
take appropriate action. In some cases, costallocation represents the first step toward hiv-ing off microfinance activities to form a sepa-rate legal entity. Further, international do-nors and other funders increasingly rely on busi-ness plans and realistic financial projections formaking funding decisions; only those institu-tions with separate financial statements canmeet this requirement.
Once an MFI decides to separate its businessinto cost centers, it can approach cost alloca-tion exercises by making adjustments to finan-cial statements from outside of the account-ing system (non-integrated approach); or 2)incorporating a cost allocation system directlyinto the accounting system (integrated ap-proach). While the integrated approach maybe more accurate, the non-integrated approachis equally valid for obtaining a better under-standing of the issues involved in cost allocation.
This Occasional Paper presents a series of ques-tions MFI managers should ask themselvesabout allocating costs and assets among costcenters. Using examples from the field and ahypothetical case called Microfem, the paperexplores alternative answers to these questionsand considers the implications of cost alloca-tion for the financial statements of multi-ser-vice MFIs using a non-integrated approach.The paper then explores the usefulness of costallocation for financial analysis and manage-ment purposes. Next, other applications ofcost allocation are briefly discussed. Finally,the paper presents a case study of BangladeshRural Advancement Committee (BRAC), oneof the largest multi-purpose organizations in-volved in microfinance in the world.
OccasionalPaper
COST ALLOCATION FOR MULTI-SERVICE MICROFINANCE INSTITUTIONS
TWO
I I . C o s t A l l o c a t i o n
Cost and asset allocation involves adjustments to theincome statement and balance sheet of MFIs. Thecost allocation process for a multi-service MFI con-sists of three basic steps, each described in detail inthis section:
• Deciding to Allocate and Defining SeparateCost Centers
• Identifying Costs to be Allocated• Establishing Decision Rules for Allocating
Costs
1. Deciding to Allocate and Defining SeparateCost Centers
Before embarking on a cost allocation exercise, MFImanagers must first decide which services offered,if any, can be considered functionally separate fromthe provision of financial services. This initial deci-sion depends on the answers to a number of keyquestions:
Q: How important is financial viability ofmicrofinance services to the MFI?
It is widely argued that, in a world of scarcesubsidized resources, financial viability of mi-crofinance services is crucial for expanding out-reach to large numbers of the world’s poor.Financial viability entails covering all the costsof delivering microfinance services with earnedincome and retention of profits to capitalizegrowth. An increasing number of MFIs havetaken on the challenge of financial viability oftheir microfinance services.3 For these MFIs,cost allocation between financial and non-finan-cial services can serve as a powerful tool forunderstanding the fundamental dynamics oftheir businesses.
Other MFIs, particularly NGOs that offer arange of services, may not regard financial vi-ability of their microfinance activities as an im-portant goal. These institutions may find costallocation cumbersome and irrelevant. How-ever, given the trends in international donorbehavior, these NGOs may encounter difficul-ties in continuing to attract subsidized funds formicrofinance indefinitely, and may be forced tore-think their strategy.
Q: To what extent does the MFI consider its non-financial services as integral to the success of themicrofinance program?
In some microfinance programs, the provisionof skills and literacy training, for instance, is con-sidered vital to core elements of the microfinancemethodology, such as group development andcohesion. In these cases, non-financial servicesmay be seen as directly contributing to goodcredit/savings behavior, particularly in programsserving extremely poor clients. This sense of“non-separability” may pertain particularly incases where credit officers are charged with pro-viding training and where on-site technical assis-tance is inseparable from credit supervision.
If non-financial services are considered an inte-gral part of the microfinance or lending meth-odology, then cost allocation between financialand non-financial services may not be warranted.However, some MFIs in this category may stillwish to separate out the costs of their non-finan-cial services to better understand their cost struc-ture and to analyze the value of these servicesrelative to their cost. Also, some multi-serviceMFIs have recognized a certain incompatibilitybetween services they once considered linked;some clients become confused when an institu-tion provides both free or subsidized serviceswhile at the same time providing credit that mustbe paid back. These MFIs may find cost alloca-tion valuable as they consider how to separatefinancial from non-financial services within theirorganization. If non-financial services arethought to be complementary (but not neces-sary) to the successful delivery of financial ser-vices, cost allocation is recommended.
Q: Are non-financial services compulsory or volun-tary for clients who want financial services?
This question is intimately related to the preced-ing question; MFIs that consider non-financialservices integral to the delivery of financial ser-vices are more likely to require clients' compul-sory participation in training programs and othernon-financial services. Some critics argue thatcompulsory services (1) increase the financial andnon-financial costs to the client and the MFI; (2)imply a certain level of interference with the
O c c a s i o n a l P a p e r N o . 2
THREE
client’s own judgment as to which services aremost useful; and (3) deprive MFI managementof valuable information about client satisfactionwith the compulsory services. Supporters, onthe other hand, believe that clients appreciatenon-financial services at least as much as the fi-nancial services, and that the benefits affordedby these services, including a sense of personaland social empowerment, exceed the costs in-volved.
If non-financial services are compulsory in amicrofinance program, cost allocation may notmake sense since the MFI implicitly or explic-itly considers these services as part of the mi-crofinance methodology and cost. However,MFIs interested in exploring the possibility ofchanging their approach and offering these ser-vices on a voluntary basis may wish to conducta cost allocation exercise to guide their plan-ning process. Cost allocation is appropriate forMFIs that offer non-financial services on a vol-untary basis.
Q: Does the MFI fund its financial services fromdifferent sources than its non-financial services?
Some MFIs recognize that the provision of non-financial services may require ongoing subsidies,particularly those services with a “social” char-acter like health and literacy training. They of-ten approach international donors or nationalfunding agencies for separate financing of theseservices. This financing may or may not be com-bined with a fee charged to clients to help coverthe costs of delivering the service. Other MFIsexpect that these social activities will be financedwith income and fees earned from the provi-sion of financial services. Such MFIs may chargea separate commission on loans or otherwise in-tegrate the cost of providing non-financial ser-vices into the effective interest rate on financialservices.
MFIs that fund their non-financial services sepa-rately, either through donations or fees or somecombination of the two, are likely to view theseservices as separate “cost centers”. These MFIsare good candidates for cost allocation. MFIs
that expect their financial services to cross-subsi-dize their non-financial services may see the valuein cost allocation so they can understand exactlywhat portion of their income from financial ser-vices goes toward covering the costs of non-finan-cial services. Similarly, MFIs that charge a dedi-cated fee on their loans to cover a specific non-financial service may wish to verify that the feeactually covers the relevant costs.
Q: What proportion of the MFI’s business is attribut-able to non-financial services?
Non-financial services may represent a marginalactivity to MFIs. Managers should apply the fun-damental accounting principle of “materiality”when making decisions about cost allocation. Ifnon-financial services make up a very small pro-portion of total costs and institutional effort, acomplicated cost allocation exercise is probably notnecessary. No fixed standard of materiality can beapplied to all cases. However, MFIs with less than10% of their costs attributable to non-financial ser-vices should consider whether they need anythingbeyond the simplest cost allocation exercise.
As the above questions indicate, the decision to em-bark on a cost allocation exercise involves intangibleelements including the MFI’s institutional vision andits understanding of the relationship between finan-cial and non-financial services. Once the decision ismade, choosing which service categories to treat asseparate cost centers is relatively straightforward. AnMFI may choose to identify only two cost centers: fi-nancial and non-financial services. Alternatively, anMFI may wish to further sub-divide each of these twocost centers further. The choice should make clearsense in terms of the MFI’s interest in conducting vi-ability and efficiency analysis for different sets of ser-vices it offers.
Thus, cost allocation is not a clear-cut issue: MFIsmay wish to conduct cost allocation exercises at differ-ent levels of complexity, depending on their particularneeds and level of institutional development. The re-mainder of this Occasional Paper presents a spectrumof options, from the very simple to the highly com-plex.
COST ALLOCATION FOR MULTI-SERVICE MICROFINANCE INSTITUTIONS
FOU
R
B o x 1 : M I C R O F E M
Microfem is an NGO serving 25,000 poor rural women. In addition to credit and savings, Microfemprovides a range of non-financial services, including business training, library services, and nutritionand literacy programs. In the past, Microfem leaders have emphasized the social character of theorganization.
While Microfem still believes its non-financial services are vitally important to its members, they haverecently decided to pursue financial viability of their financial services as a key goal. Microfem’s non-financial services are completely voluntary. To date the organization has not charged any fee for them.Microfem plans to continue funding its financial and non-financial services from separate sources, thoughit expects that its financial service earnings can partially cross-subsidize the other services in the future.While it has not yet done any cost allocation analysis, Microfem estimates that one quarter of its totalcosts stem from its non-financial services.
At a recent board meeting, Microfem’s Executive Director, Ms. Gupta, proposed that the institutionwork through a cost allocation exercise. Without such an allocation, she argued, she can neither planfor nor evaluate the financial viability of Microfem’s financial services. Based on their institutionalstrategy and their understanding of the relationship between their financial and non-financial servicesas described above, the board approved the cost allocation. However, one board member cautionedthat Microfem should not try anything too sophisticated, especially since its accounting and informa-tion systems are entirely manual. Thus, they decided to embark on a cost-allocation that distinguishesonly two cost centers: financial and non-financial services.
loan officers provide both financial and non-financialservices, this initial identification of direct costs may bedifficult. The next section, “Establishing Decision Rulesfor Allocating Indirect Costs” gives some guidelinesfor allocating these kinds of direct costs.
The second step entails identifying the costs sharedamong the various services, known as “indirect” costs,and also referred to as “general and administrative”,“back office” or “overhead” costs. An important com-ponent of these costs is salary and benefits for the Ex-ecutive Director, the Finance Department including ac-countants, and other overhead staff. Other indirectcosts include:
Rent UtilitiesOffice materials and supplies Repairs and maintenancePublications and publicity Legal, audit, and consultant feesTransportation, travel and Bank charges training for overhead staff TaxesTelephone and postage DepreciationInsurance
There are other reasons besides cost allocation for sepa-rating direct and indirect costs. For instance, MFI man-agement may wish to track the ratio of indirect to di-rect costs over time, with a view to decreasing that ra-tio as the institution grows and matures.
2. Identifying Costs to be Allocated
Once the decision to allocate costs has been made andthe MFI has defined its different cost centers, MFI man-agers need to identify those cost categories directly andindirectly attributable to each cost center. MFIs oftenhave the following categories of costs in their chart ofaccounts:
Interest Expense Utilities Loan Loss Provision Staff Training Personnel Repairs and Maintenance Rent Legal Services/Other Service Fees Office Materials/Supplies Bank Charges Publications/Publicity Taxes Transportation/Travel Depreciation Telephone and Postage Other Insurance
The first step in cost allocation is to identify those costsdirectly attributable to each of the cost centers chosen foranalysis. These costs are often referred to as “direct” or“program” costs. For instance, the MFI would first iden-tify those costs attributable only to the provision of finan-cial services. These costs might include specific person-nel expenses (for instance loan officer salaries and ben-efits), transportation and training for loan officers, loanloss provision, and interest expense on borrowings thatfund the loan portfolio. When front-line staff such as
O c c a s i o n a l P a p e r N o . 2
FIVE
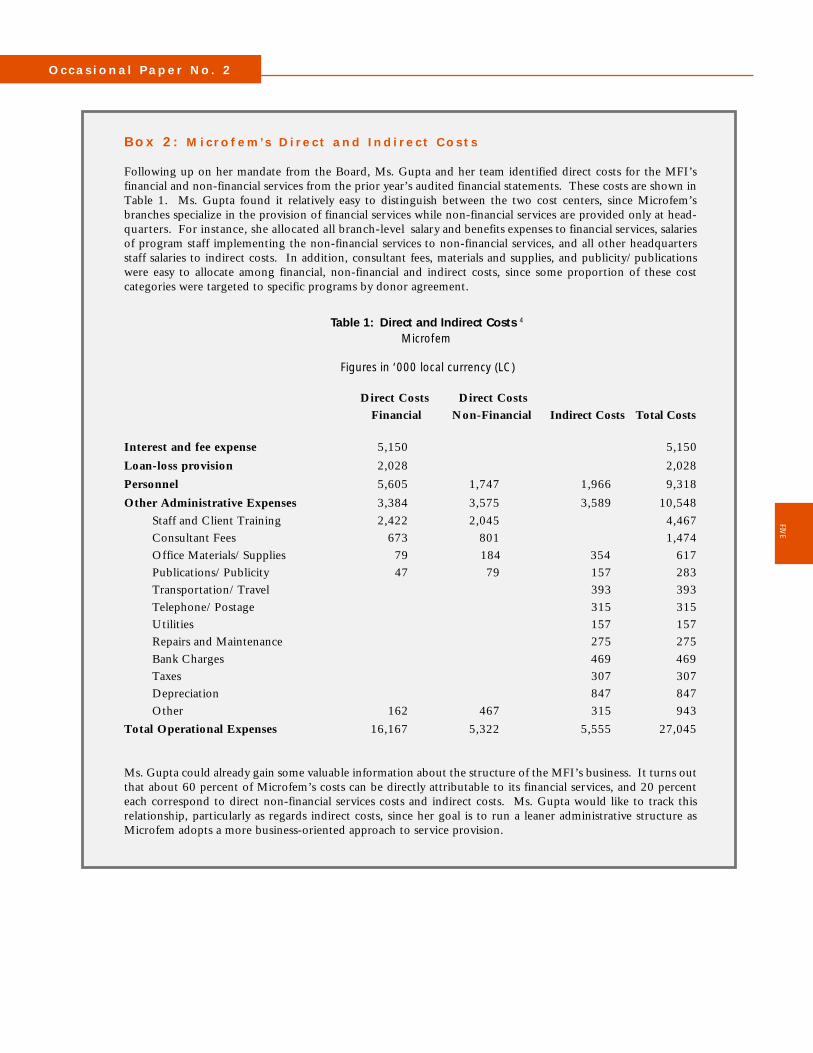
B o x 2 : M i c r o f e m ’s D i r e c t a n d I n d i r e c t C o s t s
Following up on her mandate from the Board, Ms. Gupta and her team identified direct costs for the MFI’sfinancial and non-financial services from the prior year’s audited financial statements. These costs are shown inTable 1. Ms. Gupta found it relatively easy to distinguish between the two cost centers, since Microfem’sbranches specialize in the provision of financial services while non-financial services are provided only at head-quarters. For instance, she allocated all branch-level salary and benefits expenses to financial services, salariesof program staff implementing the non-financial services to non-financial services, and all other headquartersstaff salaries to indirect costs. In addition, consultant fees, materials and supplies, and publicity/publicationswere easy to allocate among financial, non-financial and indirect costs, since some proportion of these costcategories were targeted to specific programs by donor agreement.
Table 1: Direct and Indirect Costs 4
Microfem
Figures in ‘000 local currency (LC)
Direct Costs Direct Costs Financial Non-Financial Indirect Costs Total Costs
Interest and fee expense 5,150 5,150
Loan-loss provision 2,028 2,028
Personnel 5,605 1,747 1,966 9,318
Other Administrative Expenses 3,384 3,575 3,589 10,548Staff and Client Training 2,422 2,045 4,467Consultant Fees 673 801 1,474Office Materials/Supplies 79 184 354 617Publications/Publicity 47 79 157 283Transportation/Travel 393 393Telephone/Postage 315 315Utilities 157 157Repairs and Maintenance 275 275Bank Charges 469 469Taxes 307 307Depreciation 847 847Other 162 467 315 943
Total Operational Expenses 16,167 5,322 5,555 27,045
Ms. Gupta could already gain some valuable information about the structure of the MFI’s business. It turns outthat about 60 percent of Microfem’s costs can be directly attributable to its financial services, and 20 percenteach correspond to direct non-financial services costs and indirect costs. Ms. Gupta would like to track thisrelationship, particularly as regards indirect costs, since her goal is to run a leaner administrative structure asMicrofem adopts a more business-oriented approach to service provision.
COST ALLOCATION FOR MULTI-SERVICE MICROFINANCE INSTITUTIONS
SIX
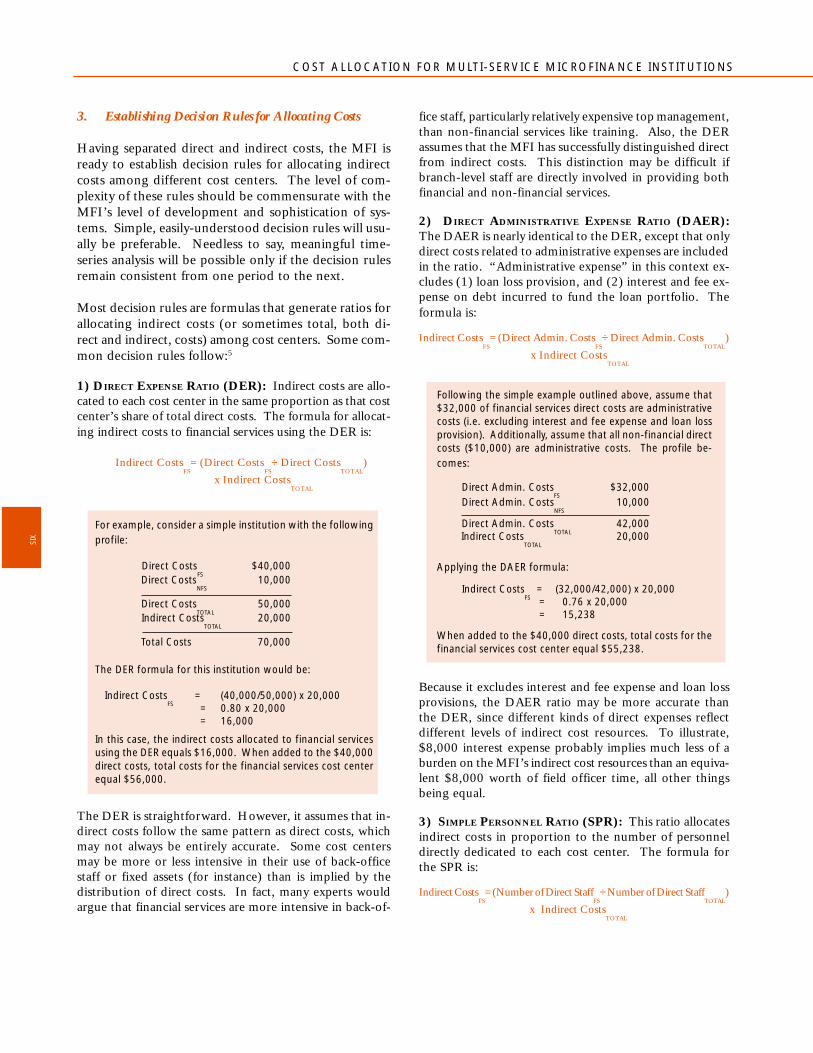
3. Establishing Decision Rules for Allocating Costs
Having separated direct and indirect costs, the MFI isready to establish decision rules for allocating indirectcosts among different cost centers. The level of com-plexity of these rules should be commensurate with theMFI’s level of development and sophistication of sys-tems. Simple, easily-understood decision rules will usu-ally be preferable. Needless to say, meaningful time-series analysis will be possible only if the decision rulesremain consistent from one period to the next.
Most decision rules are formulas that generate ratios forallocating indirect costs (or sometimes total, both di-rect and indirect, costs) among cost centers. Some com-mon decision rules follow:5
1) DIRECT EXPENSE RATIO (DER): Indirect costs are allo-cated to each cost center in the same proportion as that costcenter’s share of total direct costs. The formula for allocat-ing indirect costs to financial services using the DER is:
Indirect CostsFS
= (Direct CostsFS
÷ Direct CostsTOTAL
)
x Indirect CostsTOTAL
For example, consider a simple institution with the followingprofile:
Direct CostsFS
$40,000 Direct Costs
NFS 10,000
Direct CostsTOTAL
50,000 Indirect Costs
TOTAL 20,000
Total Costs 70,000
The DER formula for this institution would be:
Indirect CostsFS
= (40,000/50,000) x 20,000 = 0.80 x 20,000 = 16,000
In this case, the indirect costs allocated to financial servicesusing the DER equals $16,000. When added to the $40,000direct costs, total costs for the financial services cost centerequal $56,000.
The DER is straightforward. However, it assumes that in-direct costs follow the same pattern as direct costs, whichmay not always be entirely accurate. Some cost centersmay be more or less intensive in their use of back-officestaff or fixed assets (for instance) than is implied by thedistribution of direct costs. In fact, many experts wouldargue that financial services are more intensive in back-of-
fice staff, particularly relatively expensive top management,than non-financial services like training. Also, the DERassumes that the MFI has successfully distinguished directfrom indirect costs. This distinction may be difficult ifbranch-level staff are directly involved in providing bothfinancial and non-financial services.
2) DIRECT ADMINISTRATIVE EXPENSE RATIO (DAER):The DAER is nearly identical to the DER, except that onlydirect costs related to administrative expenses are includedin the ratio. “Administrative expense” in this context ex-cludes (1) loan loss provision, and (2) interest and fee ex-pense on debt incurred to fund the loan portfolio. Theformula is:
Indirect CostsFS
= (Direct Admin. CostsFS
÷ Direct Admin. CostsTOTAL
)
x Indirect CostsTOTAL
Following the simple example outlined above, assume that$32,000 of financial services direct costs are administrativecosts (i.e. excluding interest and fee expense and loan lossprovision). Additionally, assume that all non-financial directcosts ($10,000) are administrative costs. The profile be-comes:
Direct Admin. CostsFS
$32,000 Direct Admin. Costs
NFS 10,000
Direct Admin. CostsTOTAL
42,000 Indirect Costs
TOTAL 20,000
Applying the DAER formula:
Indirect CostsFS
= (32,000/42,000) x 20,000 = 0.76 x 20,000 = 15,238
When added to the $40,000 direct costs, total costs for thefinancial services cost center equal $55,238.
Because it excludes interest and fee expense and loan lossprovisions, the DAER ratio may be more accurate thanthe DER, since different kinds of direct expenses reflectdifferent levels of indirect cost resources. To illustrate,$8,000 interest expense probably implies much less of aburden on the MFI’s indirect cost resources than an equiva-lent $8,000 worth of field officer time, all other thingsbeing equal.
3) SIMPLE PERSONNEL RATIO (SPR): This ratio allocatesindirect costs in proportion to the number of personneldirectly dedicated to each cost center. The formula forthe SPR is:
Indirect CostsFS
= (Number of Direct StaffFS
÷ Number of Direct StaffTOTAL
)
x Indirect CostsTOTAL
O c c a s i o n a l P a p e r N o . 2
SEVEN
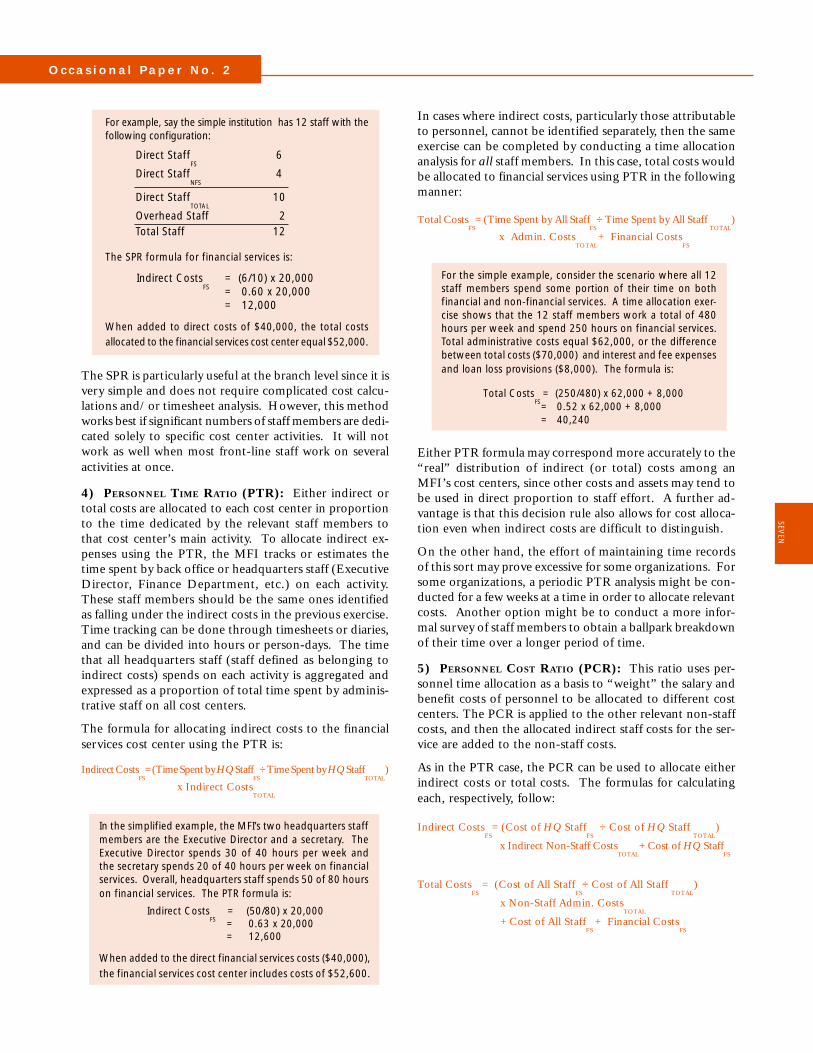
For example, say the simple institution has 12 staff with thefollowing configuration:
Direct StaffFS
6
Direct StaffNFS
4
Direct StaffTOTAL
10
Overhead Staff 2Total Staff 12
The SPR formula for financial services is:
Indirect CostsFS
= (6/10) x 20,000= 0.60 x 20,000= 12,000
When added to direct costs of $40,000, the total costsallocated to the financial services cost center equal $52,000.
The SPR is particularly useful at the branch level since it isvery simple and does not require complicated cost calcu-lations and/or timesheet analysis. However, this methodworks best if significant numbers of staff members are dedi-cated solely to specific cost center activities. It will notwork as well when most front-line staff work on severalactivities at once.
4) PERSONNEL TIME RATIO (PTR): Either indirect ortotal costs are allocated to each cost center in proportionto the time dedicated by the relevant staff members tothat cost center’s main activity. To allocate indirect ex-penses using the PTR, the MFI tracks or estimates thetime spent by back office or headquarters staff (ExecutiveDirector, Finance Department, etc.) on each activity.These staff members should be the same ones identifiedas falling under the indirect costs in the previous exercise.Time tracking can be done through timesheets or diaries,and can be divided into hours or person-days. The timethat all headquarters staff (staff defined as belonging toindirect costs) spends on each activity is aggregated andexpressed as a proportion of total time spent by adminis-trative staff on all cost centers.
The formula for allocating indirect costs to the financialservices cost center using the PTR is:
Indirect CostsFS
= (Time Spent by HQ StaffFS
÷ Time Spent by HQ StaffTOTAL
)
x Indirect CostsTOTAL
In the simplified example, the MFI’s two headquarters staffmembers are the Executive Director and a secretary. TheExecutive Director spends 30 of 40 hours per week andthe secretary spends 20 of 40 hours per week on financialservices. Overall, headquarters staff spends 50 of 80 hourson financial services. The PTR formula is:
Indirect CostsFS
= (50/80) x 20,000 = 0.63 x 20,000 = 12,600
When added to the direct financial services costs ($40,000),the financial services cost center includes costs of $52,600.
In cases where indirect costs, particularly those attributableto personnel, cannot be identified separately, then the sameexercise can be completed by conducting a time allocationanalysis for all staff members. In this case, total costs wouldbe allocated to financial services using PTR in the followingmanner:
Total CostsFS
= (Time Spent by All StaffFS
÷ Time Spent by All Staff TOTAL
)
x Admin. CostsTOTAL
+ Financial CostsFS
For the simple example, consider the scenario where all 12staff members spend some portion of their time on bothfinancial and non-financial services. A time allocation exer-cise shows that the 12 staff members work a total of 480hours per week and spend 250 hours on financial services.Total administrative costs equal $62,000, or the differencebetween total costs ($70,000) and interest and fee expensesand loan loss provisions ($8,000). The formula is:
Total CostsFS = (250/480) x 62,000 + 8,000
= 0.52 x 62,000 + 8,000 = 40,240
Either PTR formula may correspond more accurately to the“real” distribution of indirect (or total) costs among anMFI’s cost centers, since other costs and assets may tend tobe used in direct proportion to staff effort. A further ad-vantage is that this decision rule also allows for cost alloca-tion even when indirect costs are difficult to distinguish.
On the other hand, the effort of maintaining time recordsof this sort may prove excessive for some organizations. Forsome organizations, a periodic PTR analysis might be con-ducted for a few weeks at a time in order to allocate relevantcosts. Another option might be to conduct a more infor-mal survey of staff members to obtain a ballpark breakdownof their time over a longer period of time.
5) PERSONNEL COST RATIO (PCR): This ratio uses per-sonnel time allocation as a basis to “weight” the salary andbenefit costs of personnel to be allocated to different costcenters. The PCR is applied to the other relevant non-staffcosts, and then the allocated indirect staff costs for the ser-vice are added to the non-staff costs.
As in the PTR case, the PCR can be used to allocate eitherindirect costs or total costs. The formulas for calculatingeach, respectively, follow:
Indirect CostsFS
= (Cost of HQ StaffFS
÷ Cost of HQ Staff TOTAL
)
x Indirect Non-Staff CostsTOTAL
+ Cost of HQ StaffFS
Total CostsFS
= (Cost of All StaffFS
÷ Cost of All Staff TOTAL
)
x Non-Staff Admin. CostsTOTAL
+ Cost of All StaffFS
+ Financial CostsFS
COST ALLOCATION FOR MULTI-SERVICE MICROFINANCE INSTITUTIONS
EIG
HT
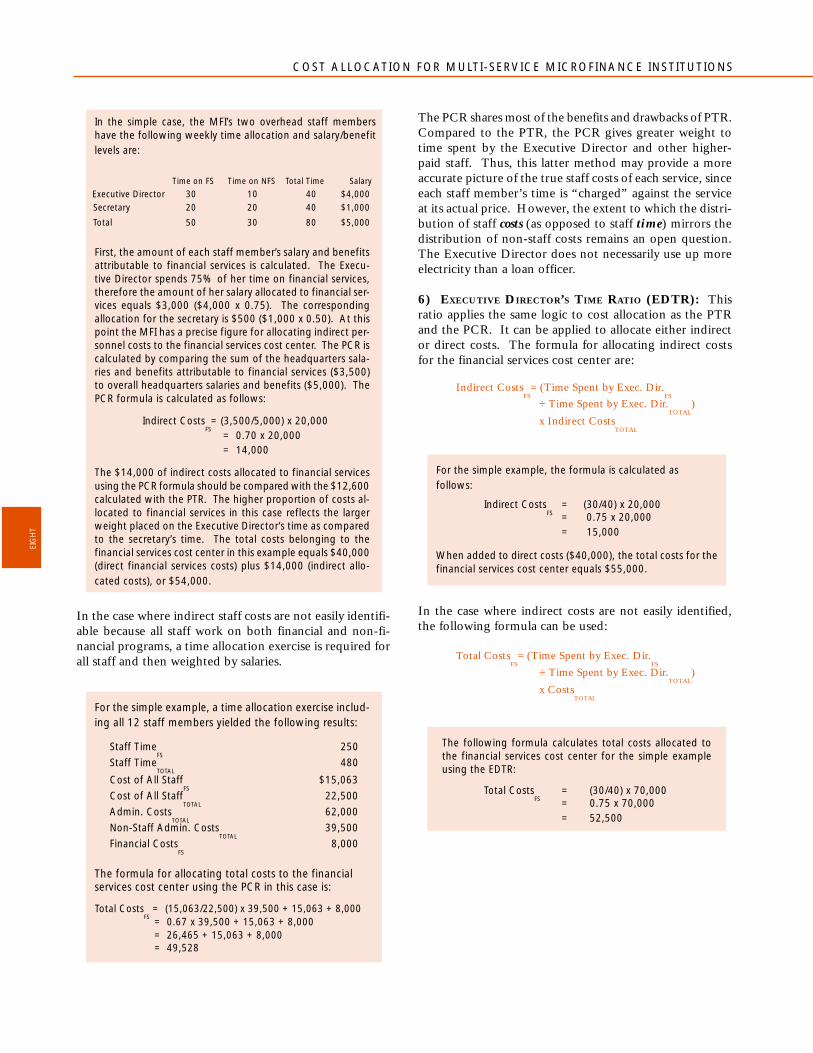
In the simple case, the MFI’s two overhead staff membershave the following weekly time allocation and salary/benefitlevels are:
Time on FS Time on NFS Total Time Salary
Executive Director 30 10 40 $4,000 Secretary 20 20 40 $1,000
Total 50 30 80 $5,000
First, the amount of each staff member’s salary and benefitsattributable to financial services is calculated. The Execu-tive Director spends 75% of her time on financial services,therefore the amount of her salary allocated to financial ser-vices equals $3,000 ($4,000 x 0.75). The correspondingallocation for the secretary is $500 ($1,000 x 0.50). At thispoint the MFI has a precise figure for allocating indirect per-sonnel costs to the financial services cost center. The PCR iscalculated by comparing the sum of the headquarters sala-ries and benefits attributable to financial services ($3,500)to overall headquarters salaries and benefits ($5,000). ThePCR formula is calculated as follows:
Indirect CostsFS= (3,500/5,000) x 20,000
= 0.70 x 20,000 = 14,000
The $14,000 of indirect costs allocated to financial servicesusing the PCR formula should be compared with the $12,600calculated with the PTR. The higher proportion of costs al-located to financial services in this case reflects the largerweight placed on the Executive Director’s time as comparedto the secretary’s time. The total costs belonging to thefinancial services cost center in this example equals $40,000(direct financial services costs) plus $14,000 (indirect allo-cated costs), or $54,000.
In the case where indirect staff costs are not easily identifi-able because all staff work on both financial and non-fi-nancial programs, a time allocation exercise is required forall staff and then weighted by salaries.
For the simple example, a time allocation exercise includ-ing all 12 staff members yielded the following results:
Staff TimeFS
250
Staff TimeTOTAL
480
Cost of All StaffFS
$15,063
Cost of All StaffTOTAL
22,500
Admin. CostsTOTAL
62,000
Non-Staff Admin. CostsTOTAL
39,500
Financial CostsFS
8,000
The formula for allocating total costs to the financialservices cost center using the PCR in this case is:
Total CostsFS = (15,063/22,500) x 39,500 + 15,063 + 8,000
= 0.67 x 39,500 + 15,063 + 8,000 = 26,465 + 15,063 + 8,000
= 49,528
The PCR shares most of the benefits and drawbacks of PTR.Compared to the PTR, the PCR gives greater weight totime spent by the Executive Director and other higher-paid staff. Thus, this latter method may provide a moreaccurate picture of the true staff costs of each service, sinceeach staff member’s time is “charged” against the serviceat its actual price. However, the extent to which the distri-bution of staff costs (as opposed to staff time) mirrors thedistribution of non-staff costs remains an open question.The Executive Director does not necessarily use up moreelectricity than a loan officer.
6) EXECUTIVE DIRECTOR’S TIME RATIO (EDTR): Thisratio applies the same logic to cost allocation as the PTRand the PCR. It can be applied to allocate either indirector direct costs. The formula for allocating indirect costsfor the financial services cost center are:
Indirect CostsFS
= (Time Spent by Exec. Dir.FS
÷ Time Spent by Exec. Dir.TOTAL
)
x Indirect CostsTOTAL
For the simple example, the formula is calculated asfollows:
Indirect CostsFS
= (30/40) x 20,000= 0.75 x 20,000= 15,000
When added to direct costs ($40,000), the total costs for thefinancial services cost center equals $55,000.
In the case where indirect costs are not easily identified,the following formula can be used:
Total CostsFS
= (Time Spent by Exec. Dir.FS
÷ Time Spent by Exec. Dir.TOTAL
)
x CostsTOTAL
The following formula calculates total costs allocated tothe financial services cost center for the simple exampleusing the EDTR:
Total CostsFS
= (30/40) x 70,000= 0.75 x 70,000= 52,500
O c c a s i o n a l P a p e r N o . 2
NIN
E
Note that the EDTR would not differ from a ratio basedon the costs of the Executive Director, since the timespent on each services would be weighted by the samesalary and benefit rate.
The EDTR is similar to the PTR and PCR, except thatit requires only one person to track or estimate his orher time allocation, which may be simpler for smalleroperations. Alternatively, the allocation could be basedon the Finance Director’s time ratio. Although a gooddeal of accuracy might be lost, particularly in the caseswhere indirect costs are difficult to measure, this deci-sion rule will provide a reasonable rough approximationfor institutions with limited resources and systems.
Staff costs constitute the most significant single cost cat-egory for most MFIs. If branch-level, program staff en-gage in both financial and non-financial services, analy-sis based on the indirect cost model may be very diffi-cult to conduct. Therefore, for these organizations, oneof the timesheet-based methods will be necessary.
None of the decision rules outlined in this section mayprovide an entirely accurate allocation of costs: a givencost center may in fact tie up a disproportionate share ofcertain costs, such as depreciation, maintenance, or mort-gage interest. The distribution of these costs across costcenters could differ substantially from the proportionsimplied by the decision rule ratios, particularly those ra-tios related to staff time. For instance, in programs wheremotorcycles are used extensively for microfinance op-erations, the proportion of their use for microfinancemay exceed the percentage of overall staff time devotedto that cost center.
One solution to this problem could be a separate alloca-tion of fixed assets and buildings using direct allocationrules (e.g. if 75% of motorcycle use is for microfinancepurposes, then 75% of their depreciation, fuel, and main-tenance should be allocated to microfinance). Some pro-grams use a square footage analysis for allocating build-ing depreciation or maintenance costs. Ultimately, thechoice of how to distribute depreciation costs amongcost centers rests on the importance of these costs in theMFI’s overall cost structure and the extent to which man-agement wishes to fine-tune the analysis.
For many multi-service MFIs, a conservative approachto cost allocation may be warranted. Because donorsand other stakeholders increasingly hold MFIs account-able for the financial results of their microfinance activi-ties (but not necessarily for non-financial services), thereis a temptation to under-allocate shared resources to fi-nancial service cost centers. At the same time, fundingproposals for non-financial services often try to maxi-mize costs to justify budget requests. However, in thename of transparency and an interest in understandingthe true financial position of the microfinance cost cen-ter, it may be recommendable to err on the side ofoverallocating costs to financial services. This is par-ticularly the case for key headquarters staff like the Ex-ecutive Director, top managers, and accountants in in-stitutions where microfinance is the main business.
The establishment of decision rules for allocating costswithin an MFI can be controversial. As seen by the simpleexamples provided in this section and the Microfem casein Box 3 below, the decision rules have different impli-cations for the cost structure of each cost center. Themanagers of each cost center may “compete” to estab-lish the decision rule which makes their program lookbetter financially. This conflict can be particularly acutein cases where managers and other staff receive incen-tives for good financial performance of their cost center.While the process of resolving disputes on the decisionrule can be painful, MFIs often find that the effort isjustified by the transparency and additional informationprovided by the cost allocation exercise.
COST ALLOCATION FOR MULTI-SERVICE MICROFINANCE INSTITUTIONS
TEN
B o x 3 : Te s t i n g A l t e r n a t i v e D e c i s i o n R u l e s f o r M i c r o f e m
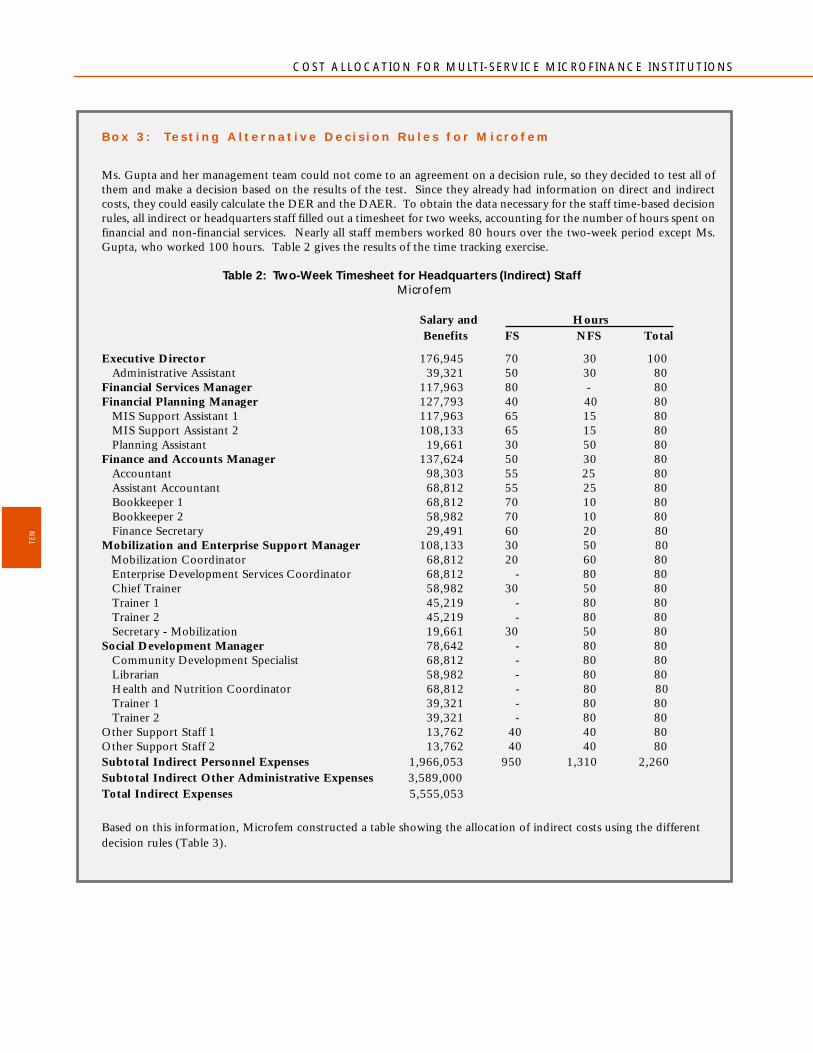
Ms. Gupta and her management team could not come to an agreement on a decision rule, so they decided to test all ofthem and make a decision based on the results of the test. Since they already had information on direct and indirectcosts, they could easily calculate the DER and the DAER. To obtain the data necessary for the staff time-based decisionrules, all indirect or headquarters staff filled out a timesheet for two weeks, accounting for the number of hours spent onfinancial and non-financial services. Nearly all staff members worked 80 hours over the two-week period except Ms.Gupta, who worked 100 hours. Table 2 gives the results of the time tracking exercise.
Table 2: Two-Week Timesheet for Headquarters (Indirect) StaffMicrofem
Salary and Hours Benefits FS NFS Total
Executive Director 176,945 70 30 100 Administrative Assistant 39,321 50 30 80Financial Services Manager 117,963 80 - 80Financial Planning Manager 127,793 40 40 80 MIS Support Assistant 1 117,963 65 15 80 MIS Support Assistant 2 108,133 65 15 80 Planning Assistant 19,661 30 50 80Finance and Accounts Manager 137,624 50 30 80 Accountant 98,303 55 25 80 Assistant Accountant 68,812 55 25 80 Bookkeeper 1 68,812 70 10 80 Bookkeeper 2 58,982 70 10 80 Finance Secretary 29,491 60 20 80Mobilization and Enterprise Support Manager 108,133 30 50 80 Mobilization Coordinator 68,812 20 60 80 Enterprise Development Services Coordinator 68,812 - 80 80 Chief Trainer 58,982 30 50 80 Trainer 1 45,219 - 80 80 Trainer 2 45,219 - 80 80 Secretary - Mobilization 19,661 30 50 80Social Development Manager 78,642 - 80 80 Community Development Specialist 68,812 - 80 80 Librarian 58,982 - 80 80 Health and Nutrition Coordinator 68,812 - 80 80 Trainer 1 39,321 - 80 80 Trainer 2 39,321 - 80 80Other Support Staff 1 13,762 40 40 80Other Support Staff 2 13,762 40 40 80Subtotal Indirect Personnel Expenses 1,966,053 950 1,310 2,260Subtotal Indirect Other Administrative Expenses 3,589,000Total Indirect Expenses 5,555,053
Based on this information, Microfem constructed a table showing the allocation of indirect costs using the differentdecision rules (Table 3).
O c c a s i o n a l P a p e r N o . 2
ELEVEN
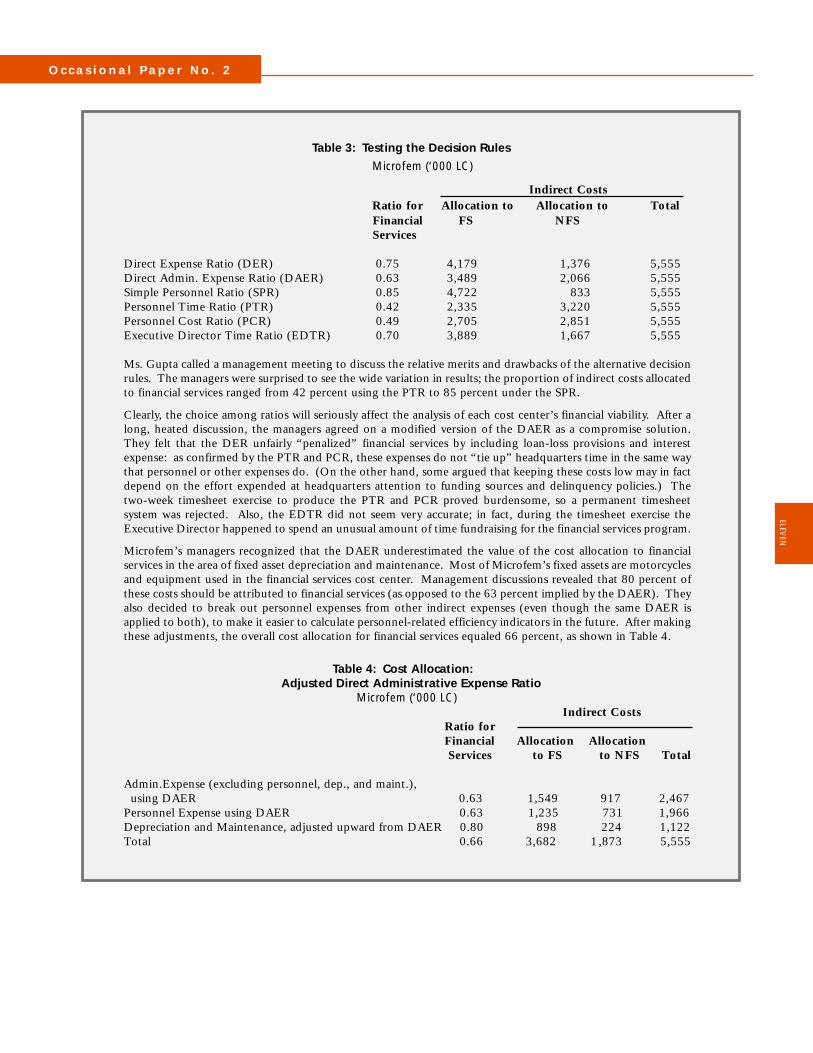
Table 3: Testing the Decision Rules
Microfem (‘000 LC)
Indirect Costs Ratio for Allocation to Allocation to Total Financial FS NFS Services
Direct Expense Ratio (DER) 0.75 4,179 1,376 5,555Direct Admin. Expense Ratio (DAER) 0.63 3,489 2,066 5,555Simple Personnel Ratio (SPR) 0.85 4,722 833 5,555Personnel Time Ratio (PTR) 0.42 2,335 3,220 5,555Personnel Cost Ratio (PCR) 0.49 2,705 2,851 5,555Executive Director Time Ratio (EDTR) 0.70 3,889 1,667 5,555
Ms. Gupta called a management meeting to discuss the relative merits and drawbacks of the alternative decisionrules. The managers were surprised to see the wide variation in results; the proportion of indirect costs allocatedto financial services ranged from 42 percent using the PTR to 85 percent under the SPR.
Clearly, the choice among ratios will seriously affect the analysis of each cost center’s financial viability. After along, heated discussion, the managers agreed on a modified version of the DAER as a compromise solution.They felt that the DER unfairly “penalized” financial services by including loan-loss provisions and interestexpense: as confirmed by the PTR and PCR, these expenses do not “tie up” headquarters time in the same waythat personnel or other expenses do. (On the other hand, some argued that keeping these costs low may in factdepend on the effort expended at headquarters attention to funding sources and delinquency policies.) Thetwo-week timesheet exercise to produce the PTR and PCR proved burdensome, so a permanent timesheetsystem was rejected. Also, the EDTR did not seem very accurate; in fact, during the timesheet exercise theExecutive Director happened to spend an unusual amount of time fundraising for the financial services program.
Microfem’s managers recognized that the DAER underestimated the value of the cost allocation to financialservices in the area of fixed asset depreciation and maintenance. Most of Microfem’s fixed assets are motorcyclesand equipment used in the financial services cost center. Management discussions revealed that 80 percent ofthese costs should be attributed to financial services (as opposed to the 63 percent implied by the DAER). Theyalso decided to break out personnel expenses from other indirect expenses (even though the same DAER isapplied to both), to make it easier to calculate personnel-related efficiency indicators in the future. After makingthese adjustments, the overall cost allocation for financial services equaled 66 percent, as shown in Table 4.
Table 4: Cost Allocation: Adjusted Direct Administrative Expense Ratio Microfem (‘000 LC)
Indirect Costs Ratio for Financial Allocation Allocation Services to FS to NFS Total
Admin.Expense (excluding personnel, dep., and maint.), using DAER 0.63 1,549 917 2,467Personnel Expense using DAER 0.63 1,235 731 1,966Depreciation and Maintenance, adjusted upward from DAER 0.80 898 224 1,122Total 0.66 3,682 1,873 5,555
COST ALLOCATION FOR MULTI-SERVICE MICROFINANCE INSTITUTIONS
CGAP THE CONSULTATIVE GROUP TO ASSIST THE POOREST [ A M I C R O - F I N A N C E P R O G R A M ]
TWEL
VE
I I I . A p p l y i n g t h e D e c i s i o n R u l e s t o
t h e F i n a n c i a l S t a t e m e n t s
Multi-service MFIs can choose between two basic ap-proaches for allocating costs to different cost centers.For the sake of simplicity, these two approaches can becalled “non-integrated” and “integrated”. The non-in-tegrated approach usually entails either 1) a one-off costallocation study; or 2) periodic (e.g. annual) cost alloca-tion management reports based on adjustments to theprofit and loss statement (and sometimes the balancesheet). Most existing MFI cost allocation systems fallinto this non-integrated category.
The integrated approach involves incorporating a costallocation system directly into the MFI’s accounting sys-tem through the chart of accounts. A few MFIs, such asBRAC in Bangladesh, employ this approach, which isprobably more accurate, particularly for the balancesheet.6 However, the integrated approach may not bepractical for institutions without fairly sophisticated com-puterized systems. MFIs wishing to eventually integratecost allocation into their systems could conduct a “non-integrated” analysis as a first step. This section discussesthe application of cost-allocation decision rules to thefinancial statements of a multi-service MFI using the non-integrated approach.
1. The Profit and Loss Statement
In the first instance, the application of the decision-rulechosen directly affects the profit and loss statement (alsoreferred to as the income statement).
Interest and fees from financial services are often themain source of earned income for an MFI. Other sourcesinclude investment income, fees for provision of non-financial services, and non-operational income such asdonor financing. Most income is easily identified as be-longing to a particular cost center. Fees for non-finan-cial services are, of course, attributed to their respectivecost center.
Both investment income and donor financing are trickierto allocate among the identified cost centers. The MFIcan allocate investment income according to the deci-sion rule established for allocating costs, unless this in-
come is specifically designated to fund a particular costcenter. In many cases, investments and their incomeare part of the liquidity strategy for the financial ser-vices cost center and thus allocation is straightforward.
Donor funding is often tied to a particular program,in which case allocation is straightforward. Since fi-nancial viability analysis is the key motivation for theallocation exercise, an MFI should clearly identify do-nor financing as non-operational income, showing itas a separate line-item on its profit and loss statement.
O c c a s i o n a l P a p e r N o . 2
B o x 4 : M i c r o f e m ’s P r o f i t a n d L o s s S t a t e m e n t
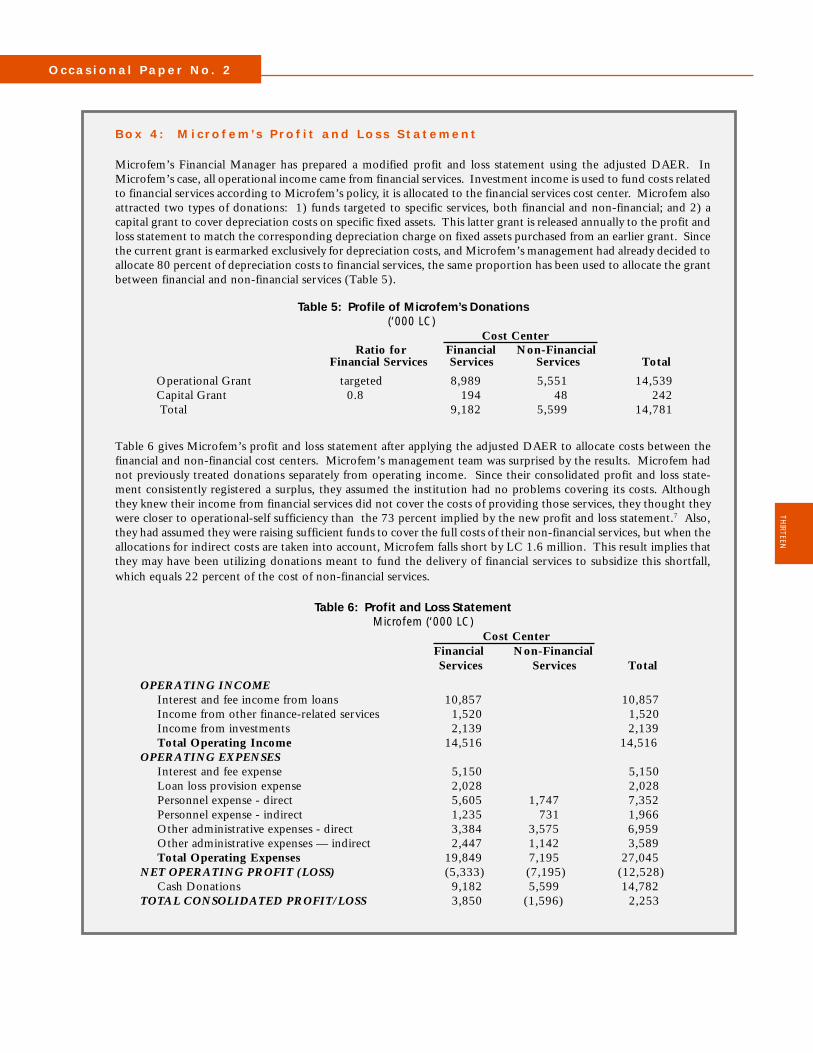
Microfem’s Financial Manager has prepared a modified profit and loss statement using the adjusted DAER. InMicrofem’s case, all operational income came from financial services. Investment income is used to fund costs relatedto financial services according to Microfem’s policy, it is allocated to the financial services cost center. Microfem alsoattracted two types of donations: 1) funds targeted to specific services, both financial and non-financial; and 2) acapital grant to cover depreciation costs on specific fixed assets. This latter grant is released annually to the profit andloss statement to match the corresponding depreciation charge on fixed assets purchased from an earlier grant. Sincethe current grant is earmarked exclusively for depreciation costs, and Microfem’s management had already decided toallocate 80 percent of depreciation costs to financial services, the same proportion has been used to allocate the grantbetween financial and non-financial services (Table 5).
Table 5: Profile of Microfem’s Donations (‘000 LC) Cost Center Ratio for Financial Non-FinancialFinancial Services Services Services Total
Operational Grant targeted 8,989 5,551 14,539 Capital Grant 0.8 194 48 242 Total 9,182 5,599 14,781
Table 6 gives Microfem’s profit and loss statement after applying the adjusted DAER to allocate costs between thefinancial and non-financial cost centers. Microfem’s management team was surprised by the results. Microfem hadnot previously treated donations separately from operating income. Since their consolidated profit and loss state-ment consistently registered a surplus, they assumed the institution had no problems covering its costs. Althoughthey knew their income from financial services did not cover the costs of providing those services, they thought theywere closer to operational-self sufficiency than the 73 percent implied by the new profit and loss statement.7 Also,they had assumed they were raising sufficient funds to cover the full costs of their non-financial services, but when theallocations for indirect costs are taken into account, Microfem falls short by LC 1.6 million. This result implies thatthey may have been utilizing donations meant to fund the delivery of financial services to subsidize this shortfall,which equals 22 percent of the cost of non-financial services.
Table 6: Profit and Loss Statement Microfem (‘000 LC)
Cost Center Financial Non-Financial
Services Services Total
OPERATING INCOMEInterest and fee income from loans 10,857 10,857Income from other finance-related services 1,520 1,520Income from investments 2,139 2,139Total Operating Income 14,516 14,516
OPERATING EXPENSESInterest and fee expense 5,150 5,150Loan loss provision expense 2,028 2,028Personnel expense - direct 5,605 1,747 7,352Personnel expense - indirect 1,235 731 1,966Other administrative expenses - direct 3,384 3,575 6,959Other administrative expenses — indirect 2,447 1,142 3,589Total Operating Expenses 19,849 7,195 27,045
NET OPERATING PROFIT (LOSS) (5,333) (7,195) (12,528)Cash Donations 9,182 5,599 14,782
TOTAL CONSOLIDATED PROFIT/LOSS 3,850 (1,596) 2,253
TWELV
E THIRTEEN
COST ALLOCATION FOR MULTI-SERVICE MICROFINANCE INSTITUTIONS
2. Incorporating Balance Sheet Accounts
The application of cost allocation to an MFI’s profit andloss statement provides a great deal of management in-formation. However, to conduct profitabilility and effi-ciency analyses for different cost centers, the MFI needsto make the changes to its balance sheet that correspondto the cost allocations in the profit and loss statement.8
This profitability and efficiency analysis, described inmore detail in the next section, involves adjusting ex-penses to account for the effect of inflation on equityand fixed assets. Expenses are also adjusted to reflectthe true commercial cost of subsidized funds (liabilities),since this analysis is aimed at understanding the poten-tial commercial viability of microfinance services. Theseadjusted expenses are then compared to operational in-come to arrive at adjusted profits.
Calculation of these adjustments and ratios requiresknowledge of the balance sheet items that correspondto the financial services cost center (equity, fixed assets,funding liabilities, total assets). However, balance sheetallocation can be complicated and the level of effort re-quired for this type of analysis may not be warranted forall MFIs. The lending portfolio will usually constitutethe most significant asset for the financial services costcenter, and a number of useful management ratios com-pare income, expense categories, and profits to averageportfolio balances over the same period. This type ofanalysis is particularly useful for tracking cost efficiencyof the institution. It may be sufficient for managementpurposes to focus on those portfolio-related indicatorsthat can be easily calculated rather than make the fulladjustment to the balance sheet.
For MFIs interested in treating some or all of their dif-ferent services as profit centers (as opposed to just costcenters), deriving a balance sheet for each cost center isnecessary for profitability analysis. In many cases, theMFI can review each account and easily allocate indi-vidual account items among cost centers. In cases whereallocation is not straightforward, The MFI must firstidentify those items on the balance sheet that are sharedamong the MFI’s financial and non-financial services.These items may include:
Cash and due from banks Paid-in equity from shareholdersInvestments Donated equity — prior years,Net fixed assets cumulativeOther assets Donated Equity — current yearBorrowed Funds Prior years’ retained earnings/lossesOther liabilities, including Current year retained earnings/lossesmortgages
The allocation exercise for the balance sheet assumesthat the MFI begins with a consolidated balance sheetand then allocates the different balances to the relevantcost centers. It is also assumed that the MFI has alreadyconducted a cost allocation exercise similar to the oneoutlined in this paper. For simplicity, this discussionwill use two cost centers, financial and non-financial.However, as in the cost allocation case, the MFI canchoose the number of cost centers that makes sense froma management perspective.
Once the shared balance sheet items are identified, theallocation exercise has three steps:
1) allocate non-cash assets among cost centers;2) allocate liabilities and equity among cost centers; and3) allocate “cash and banks” as a residual asset that balances
the balance sheet.
The decision rules for allocating a number of the bal-ance sheet items will have already been determined bythe cost allocation exercise for the profit and loss state-ment. For instance, an MFI could simply apply the de-cision rule for allocating costs to determine equity forthe two cost centers. This section will focus on simplemethods; Annex 1 contains some alternatives.
Step 1: Allocate non-cash assets among cost centers. Non-cash assets shared among cost centers include invest-ments, net fixed assets, and other assets. The allocationof these assets may already be clear based on previouspolicies or donor requirements. In cases where alloca-tion needs to be implemented, the simple alternativewould be to apply the decision rule already identifiedfor the profit and loss statement to those non-cash as-sets needing allocation. For instance, for a MFI thatused the Personnel Time Ratio (PTR) to allocate costs,the formula for each non-cash asset would be:
[Investments + Net Fixed Assets + Other Assets] FS
=
(Time Spent by StaffFS
÷ Time Spent by StaffTOTAL
)
x [Investments + Net Fixed Assets + Other Assets]TOTAL
A similar formula could be constructed for each of theother decision rules described in Section II.
FOU
RTE
EN
O c c a s i o n a l P a p e r N o . 2
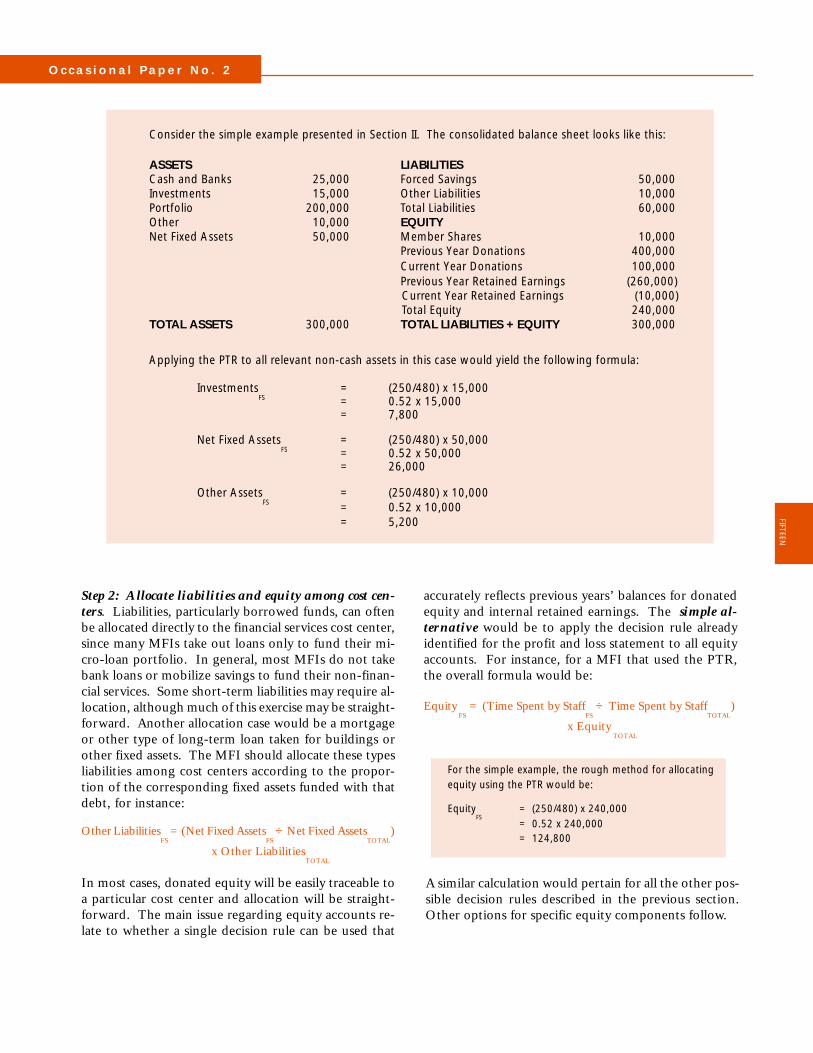
Consider the simple example presented in Section II. The consolidated balance sheet looks like this:
ASSETS LIABILITIESCash and Banks 25,000 Forced Savings 50,000Investments 15,000 Other Liabilities 10,000Portfolio 200,000 Total Liabilities 60,000Other 10,000 EQUITYNet Fixed Assets 50,000 Member Shares 10,000
Previous Year Donations 400,000 Current Year Donations 100,000 Previous Year Retained Earnings (260,000)
Current Year Retained Earnings (10,000) Total Equity 240,000
TOTAL ASSETS 300,000 TOTAL LIABILITIES + EQUITY 300,000
Applying the PTR to all relevant non-cash assets in this case would yield the following formula:
InvestmentsFS
= (250/480) x 15,000= 0.52 x 15,000= 7,800
Net Fixed AssetsFS
= (250/480) x 50,000= 0.52 x 50,000= 26,000
Other AssetsFS
= (250/480) x 10,000= 0.52 x 10,000= 5,200
Step 2: Allocate liabilities and equity among cost cen-ters. Liabilities, particularly borrowed funds, can oftenbe allocated directly to the financial services cost center,since many MFIs take out loans only to fund their mi-cro-loan portfolio. In general, most MFIs do not takebank loans or mobilize savings to fund their non-finan-cial services. Some short-term liabilities may require al-location, although much of this exercise may be straight-forward. Another allocation case would be a mortgageor other type of long-term loan taken for buildings orother fixed assets. The MFI should allocate these typesliabilities among cost centers according to the propor-tion of the corresponding fixed assets funded with thatdebt, for instance:
Other LiabilitiesFS
= (Net Fixed AssetsFS
÷ Net Fixed AssetsTOTAL
)
x Other LiabilitiesTOTAL
In most cases, donated equity will be easily traceable toa particular cost center and allocation will be straight-forward. The main issue regarding equity accounts re-late to whether a single decision rule can be used that
accurately reflects previous years’ balances for donatedequity and internal retained earnings. The simple al-ternative would be to apply the decision rule alreadyidentified for the profit and loss statement to all equityaccounts. For instance, for a MFI that used the PTR,the overall formula would be:
Equity FS
= (Time Spent by StaffFS
÷ Time Spent by StaffTOTAL
)
x Equity TOTAL
For the simple example, the rough method for allocatingequity using the PTR would be:
EquityFS
= (250/480) x 240,000= 0.52 x 240,000= 124,800
FIFTEEN
A similar calculation would pertain for all the other pos-sible decision rules described in the previous section.Other options for specific equity components follow.
COST ALLOCATION FOR MULTI-SERVICE MICROFINANCE INSTITUTIONS
Step 3: Allocate “cash and banks” as a residual asset thatbalances the balance sheet. “Cash and due from banks” equalsthe amount of cash on hand or placed in highly liquid instru-ments to cover cash expenses. The cash balance at the end ofthe period equals the cash balance at the beginning of theperiod plus the net effect of all cash transactions, i.e. additionof new sources of cash coming in over the period like increasesin cash (not accrued) profits, other equity, savings, and/ordebt, and subtraction of new uses of funds such as increases ininvestments and/or the loan portfolio. Since this cost alloca-tion exercise utilizes a non-integrated approach and adjuststhe financial statements outside the MFI’s accounting system,the cost center allocations of non-cash assets, liabilities andequity will not yet lead to balanced accounts. It is legitimateto allocate the consolidated cash and due from banks balance
to each cost center as a residual account that balances the re-spective balance sheets. However, this method of distribut-ing cash among cost centers will not be entirely accurate; onlyan integrated allocation approach that distinguishes betweencash and non-cash transactions would give exact figures forcash balances. The formula for allocating cash and due frombanks to the financial services cost center is:
Cash and Due from BanksFS
= Total LiabilitiesFS
+ Total EquityFS
- Total Non-Cash AssetsFS
Once the MFI has identified the balance sheet items affectedby the cost allocation exercise and established decision rulesfor allocating those balances, it is ready to construct separatebalance sheets for its different cost centers.
SIX
TEEN
B o x 5 : M i c r o f e m ’s B a l a n c e S h e e t
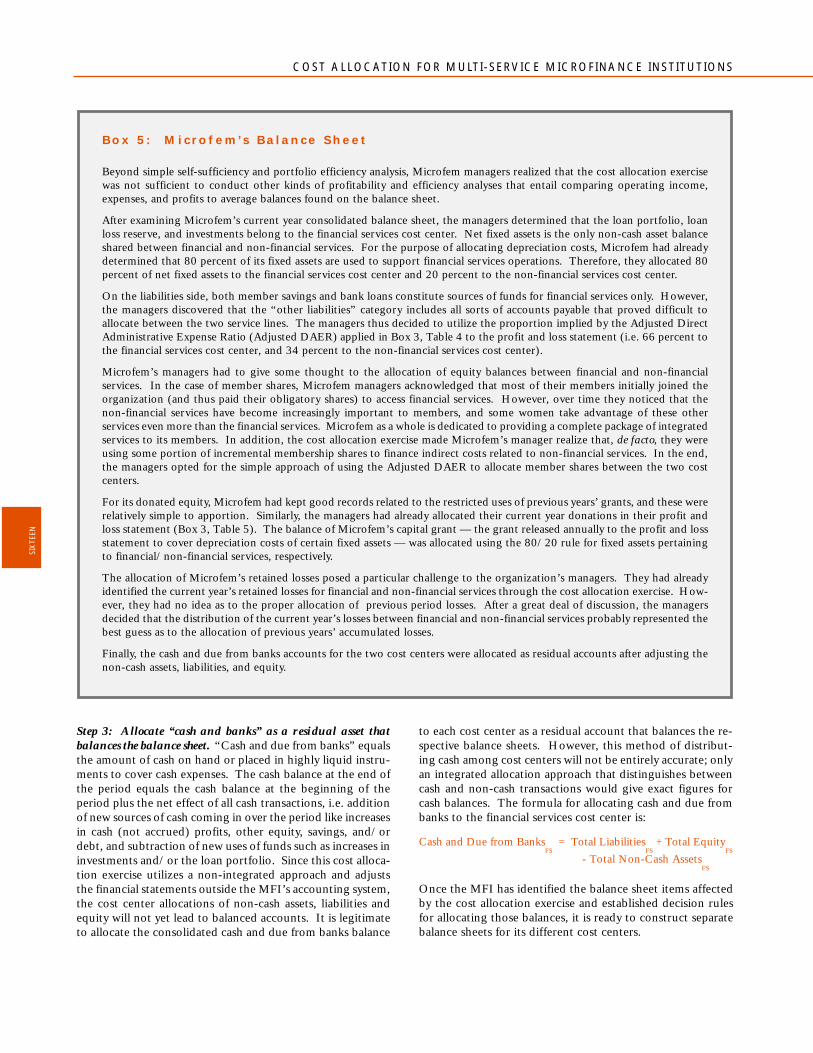
Beyond simple self-sufficiency and portfolio efficiency analysis, Microfem managers realized that the cost allocation exercisewas not sufficient to conduct other kinds of profitability and efficiency analyses that entail comparing operating income,expenses, and profits to average balances found on the balance sheet.
After examining Microfem’s current year consolidated balance sheet, the managers determined that the loan portfolio, loanloss reserve, and investments belong to the financial services cost center. Net fixed assets is the only non-cash asset balanceshared between financial and non-financial services. For the purpose of allocating depreciation costs, Microfem had alreadydetermined that 80 percent of its fixed assets are used to support financial services operations. Therefore, they allocated 80percent of net fixed assets to the financial services cost center and 20 percent to the non-financial services cost center.
On the liabilities side, both member savings and bank loans constitute sources of funds for financial services only. However,the managers discovered that the “other liabilities” category includes all sorts of accounts payable that proved difficult toallocate between the two service lines. The managers thus decided to utilize the proportion implied by the Adjusted DirectAdministrative Expense Ratio (Adjusted DAER) applied in Box 3, Table 4 to the profit and loss statement (i.e. 66 percent tothe financial services cost center, and 34 percent to the non-financial services cost center).
Microfem’s managers had to give some thought to the allocation of equity balances between financial and non-financialservices. In the case of member shares, Microfem managers acknowledged that most of their members initially joined theorganization (and thus paid their obligatory shares) to access financial services. However, over time they noticed that thenon-financial services have become increasingly important to members, and some women take advantage of these otherservices even more than the financial services. Microfem as a whole is dedicated to providing a complete package of integratedservices to its members. In addition, the cost allocation exercise made Microfem’s manager realize that, de facto, they wereusing some portion of incremental membership shares to finance indirect costs related to non-financial services. In the end,the managers opted for the simple approach of using the Adjusted DAER to allocate member shares between the two costcenters.
For its donated equity, Microfem had kept good records related to the restricted uses of previous years’ grants, and these wererelatively simple to apportion. Similarly, the managers had already allocated their current year donations in their profit andloss statement (Box 3, Table 5). The balance of Microfem’s capital grant — the grant released annually to the profit and lossstatement to cover depreciation costs of certain fixed assets — was allocated using the 80/20 rule for fixed assets pertainingto financial/non-financial services, respectively.
The allocation of Microfem’s retained losses posed a particular challenge to the organization’s managers. They had alreadyidentified the current year’s retained losses for financial and non-financial services through the cost allocation exercise. How-ever, they had no idea as to the proper allocation of previous period losses. After a great deal of discussion, the managersdecided that the distribution of the current year’s losses between financial and non-financial services probably represented thebest guess as to the allocation of previous years’ accumulated losses.
Finally, the cash and due from banks accounts for the two cost centers were allocated as residual accounts after adjusting thenon-cash assets, liabilities, and equity.
O c c a s i o n a l P a p e r N o . 2
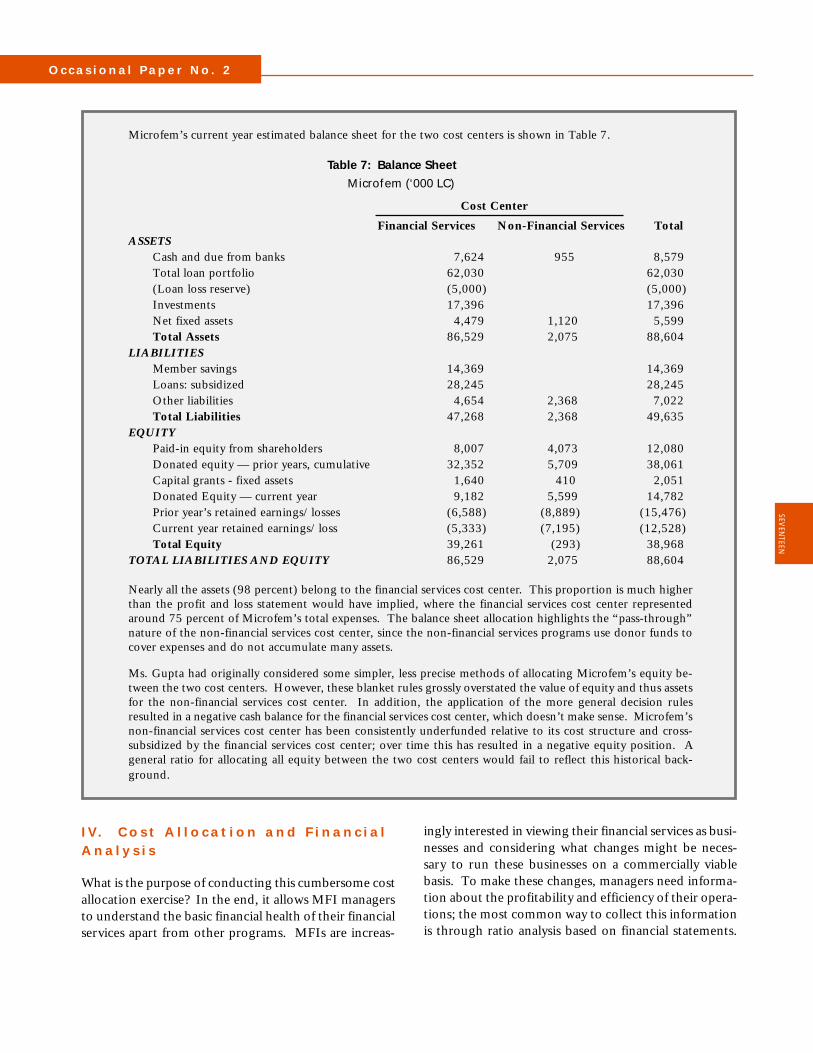
Microfem’s current year estimated balance sheet for the two cost centers is shown in Table 7.
Table 7: Balance Sheet
Microfem (‘000 LC)
Cost Center
Financial Services Non-Financial Services TotalASSETS
Cash and due from banks 7,624 955 8,579Total loan portfolio 62,030 62,030(Loan loss reserve) (5,000) (5,000)Investments 17,396 17,396Net fixed assets 4,479 1,120 5,599Total Assets 86,529 2,075 88,604
LIABILITIESMember savings 14,369 14,369Loans: subsidized 28,245 28,245Other liabilities 4,654 2,368 7,022Total Liabilities 47,268 2,368 49,635
EQUITYPaid-in equity from shareholders 8,007 4,073 12,080Donated equity — prior years, cumulative 32,352 5,709 38,061Capital grants - fixed assets 1,640 410 2,051Donated Equity — current year 9,182 5,599 14,782Prior year’s retained earnings/losses (6,588) (8,889) (15,476)Current year retained earnings/loss (5,333) (7,195) (12,528)Total Equity 39,261 (293) 38,968
TOTAL LIABILITIES AND EQUITY 86,529 2,075 88,604
Nearly all the assets (98 percent) belong to the financial services cost center. This proportion is much higherthan the profit and loss statement would have implied, where the financial services cost center representedaround 75 percent of Microfem’s total expenses. The balance sheet allocation highlights the “pass-through”nature of the non-financial services cost center, since the non-financial services programs use donor funds tocover expenses and do not accumulate many assets.
Ms. Gupta had originally considered some simpler, less precise methods of allocating Microfem’s equity be-tween the two cost centers. However, these blanket rules grossly overstated the value of equity and thus assetsfor the non-financial services cost center. In addition, the application of the more general decision rulesresulted in a negative cash balance for the financial services cost center, which doesn’t make sense. Microfem’snon-financial services cost center has been consistently underfunded relative to its cost structure and cross-subsidized by the financial services cost center; over time this has resulted in a negative equity position. Ageneral ratio for allocating all equity between the two cost centers would fail to reflect this historical back-ground.
I V. C o s t A l l o c a t i o n a n d F i n a n c i a lA n a l y s i s
What is the purpose of conducting this cumbersome costallocation exercise? In the end, it allows MFI managersto understand the basic financial health of their financialservices apart from other programs. MFIs are increas-
ingly interested in viewing their financial services as busi-nesses and considering what changes might be neces-sary to run these businesses on a commercially viablebasis. To make these changes, managers need informa-tion about the profitability and efficiency of their opera-tions; the most common way to collect this informationis through ratio analysis based on financial statements.
SEVEN
TEEN
COST ALLOCATION FOR MULTI-SERVICE MICROFINANCE INSTITUTIONS
trends. In addition, MFI managers can set internal tar-gets for their institutions, tracking actual performanceagainst targets.
Therefore, cost allocation to construct financial state-ments for the financial services cost center provides MFImanagement with the raw data required for profitabil-ity and efficiency ratio analysis.
This section outlines some examples of the type of ratioanalysis made possible by the cost allocation exercise.
Inflation and Subsidy Adjustments: An MFI maywish to analyze the extent to which it could cover allexpenses if it were operating under fully commercialconditions. Additional costs to the ones included inthe profit and loss statement that need to be consid-ered include the erosion of equity due to inflation andthe costs of subsidized debt if they had to pay commer-cial rates. At the same time, inflation has the effect ofrevaluing fixed assets, particularly buildings.9 An MFIcan use the following method for adjusting their oper-ating expenses to account for these “costs”, using thefinancial services cost center financial statements as abasis:Adjusted Operating Expenses = Operating Expenses (from the P&L) + inflation * (Average Equity - Average Fixed Assets) + commercial i * Average Funding Liabilities10
- actual Interest and Fee Expense
The commercial interest rate (“commercial i” in theformula) represents the rate that MFIs would have topay for their debt if they had to fund it on the commer-cial market. This rate could equal the 90-day certifi-cate of deposit rate for institutions that take deposits.It could also equal the rate that commercial banks offertheir medium-grade clients.
Financial Self-Sufficiency: This indicator measures the ex-tent to which an MFI covers adjusted operating expenses withoperational income. This ratio is calculated by using:
Operating Income (from the P&L)Adjusted Operating Expenses
(Adjusted) Return on Assets: MFI managers may be inter-ested in the profitability of their assets in order to guide themin managing those assets more effectively. The return onassets ratio compares net operating profit, either adjusted ornot, to average assets over the corresponding period. Theformula is:
Operating Income - (Adjusted) Operating ExpensesAverage Assets
(Adjusted) Return on Equity: The extent to which an MFI’sreturn on equity compares with alternative investment op-portunities in the local economy may be of interest to man-agers. The formula includes:
Operating Income - (Adjusted) Operating ExpensesAverage Equity
Portfolio Yield: One way of checking to make sure the port-folio is earning expected income in an efficient manner is tolook at portfolio yield. This figure should be compared withexpectations based on the MFI’s effective interest rates. Theformula is:
Interest and Fee IncomeAverage Portfolio
Administrative Cost Efficiency: MFI managers often lookat the costs of managing and maintaining their loan portfo-lios. This ratio includes administrative expenses (operationalexpenses net of interest expense and loan loss provisions), sincethose costs are most directly controlled by managers. Theformula is:
Administrative ExpensesAverage Portfolio
Personnel Cost Efficiency: Salary and benefit expenses con-stitute the single largest component of administrative expenses.MFI managers may wish to track the proportion of total ad-ministrative costs since higher proportional personal costs gen-erally reflect a more efficient use of resources. The formula is:
Personnel ExpensesAdministrative Expenses
Loan Officer Productivity: The number of active clientsper loan officer is a key productivity and efficiency indicatorfor MFI managers. Increases in productivity are importantfor cost containment. But on the other hand, an excessivelyhigh loan officer caseload could lead to a higher risk of delin-quency. This ratio is calculated as follows:
Number of Outstanding Loans (end of period)Number of Loan Officers (end of period)
Many of these ratios compare “flow” items from theprofit and loss statement to “stock” balances from thebalance sheet. It is not possible to construct a ratio withprofits earned over a period of time in the numeratorand an accumulated account balance (i.e. total assets) atthe end of a period of time in the denominator. In theratio analysis, therefore, the denominator always reflectsthe average value of the balance sheet item over a periodof time. Ideally, this average value should be calculatedfrom monthly balances. Since this paper deals with costallocation for a multi-service MFI, monthly balances maynot be feasible. At the very least, an average should becalculated between the beginning-of-period balance andthe end-of-period balance.
Profitability and efficiency ratio analysis should be con-ducted on a continual basis so that managers can track
EIG
HTE
EN
O c c a s i o n a l P a p e r N o . 2
B o x 6 : M i c r o f e m ’s F i n a n c i a l A n a l y s i s
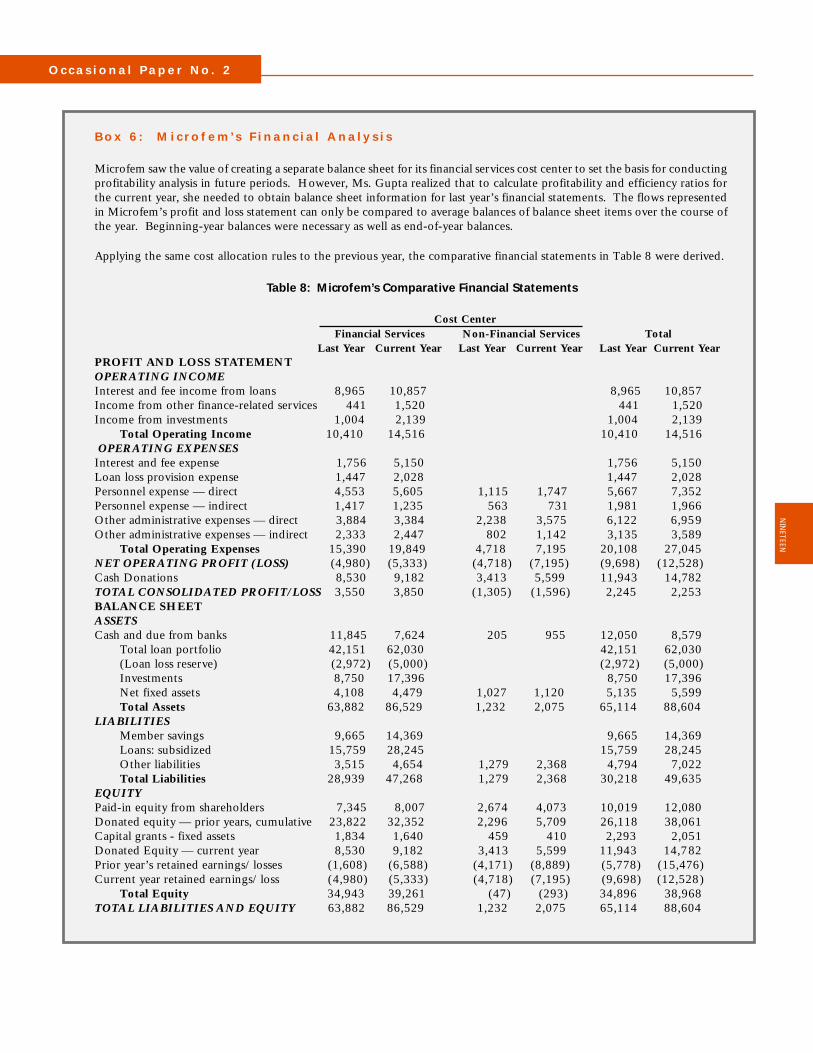
Microfem saw the value of creating a separate balance sheet for its financial services cost center to set the basis for conductingprofitability analysis in future periods. However, Ms. Gupta realized that to calculate profitability and efficiency ratios forthe current year, she needed to obtain balance sheet information for last year’s financial statements. The flows representedin Microfem’s profit and loss statement can only be compared to average balances of balance sheet items over the course ofthe year. Beginning-year balances were necessary as well as end-of-year balances.
Applying the same cost allocation rules to the previous year, the comparative financial statements in Table 8 were derived.
Table 8: Microfem’s Comparative Financial Statements
Cost Center Financial Services Non-Financial Services Total Last Year Current Year Last Year Current Year Last Year Current Year
PROFIT AND LOSS STATEMENTOPERATING INCOMEInterest and fee income from loans 8,965 10,857 8,965 10,857Income from other finance-related services 441 1,520 441 1,520Income from investments 1,004 2,139 1,004 2,139
Total Operating Income 10,410 14,516 10,410 14,516 OPERATING EXPENSESInterest and fee expense 1,756 5,150 1,756 5,150Loan loss provision expense 1,447 2,028 1,447 2,028Personnel expense — direct 4,553 5,605 1,115 1,747 5,667 7,352Personnel expense — indirect 1,417 1,235 563 731 1,981 1,966Other administrative expenses — direct 3,884 3,384 2,238 3,575 6,122 6,959Other administrative expenses — indirect 2,333 2,447 802 1,142 3,135 3,589
Total Operating Expenses 15,390 19,849 4,718 7,195 20,108 27,045NET OPERATING PROFIT (LOSS) (4,980) (5,333) (4,718) (7,195) (9,698) (12,528)Cash Donations 8,530 9,182 3,413 5,599 11,943 14,782TOTAL CONSOLIDATED PROFIT/LOSS 3,550 3,850 (1,305) (1,596) 2,245 2,253BALANCE SHEETASSETSCash and due from banks 11,845 7,624 205 955 12,050 8,579
Total loan portfolio 42,151 62,030 42,151 62,030(Loan loss reserve) (2,972) (5,000) (2,972) (5,000)Investments 8,750 17,396 8,750 17,396Net fixed assets 4,108 4,479 1,027 1,120 5,135 5,599Total Assets 63,882 86,529 1,232 2,075 65,114 88,604
LIABILITIESMember savings 9,665 14,369 9,665 14,369Loans: subsidized 15,759 28,245 15,759 28,245Other liabilities 3,515 4,654 1,279 2,368 4,794 7,022Total Liabilities 28,939 47,268 1,279 2,368 30,218 49,635
EQUITYPaid-in equity from shareholders 7,345 8,007 2,674 4,073 10,019 12,080Donated equity — prior years, cumulative 23,822 32,352 2,296 5,709 26,118 38,061Capital grants - fixed assets 1,834 1,640 459 410 2,293 2,051Donated Equity — current year 8,530 9,182 3,413 5,599 11,943 14,782Prior year’s retained earnings/losses (1,608) (6,588) (4,171) (8,889) (5,778) (15,476)Current year retained earnings/loss (4,980) (5,333) (4,718) (7,195) (9,698) (12,528)
Total Equity 34,943 39,261 (47) (293) 34,896 38,968TOTAL LIABILITIES AND EQUITY 63,882 86,529 1,232 2,075 65,114 88,604
NIN
ETEEN
COST ALLOCATION FOR MULTI-SERVICE MICROFINANCE INSTITUTIONS
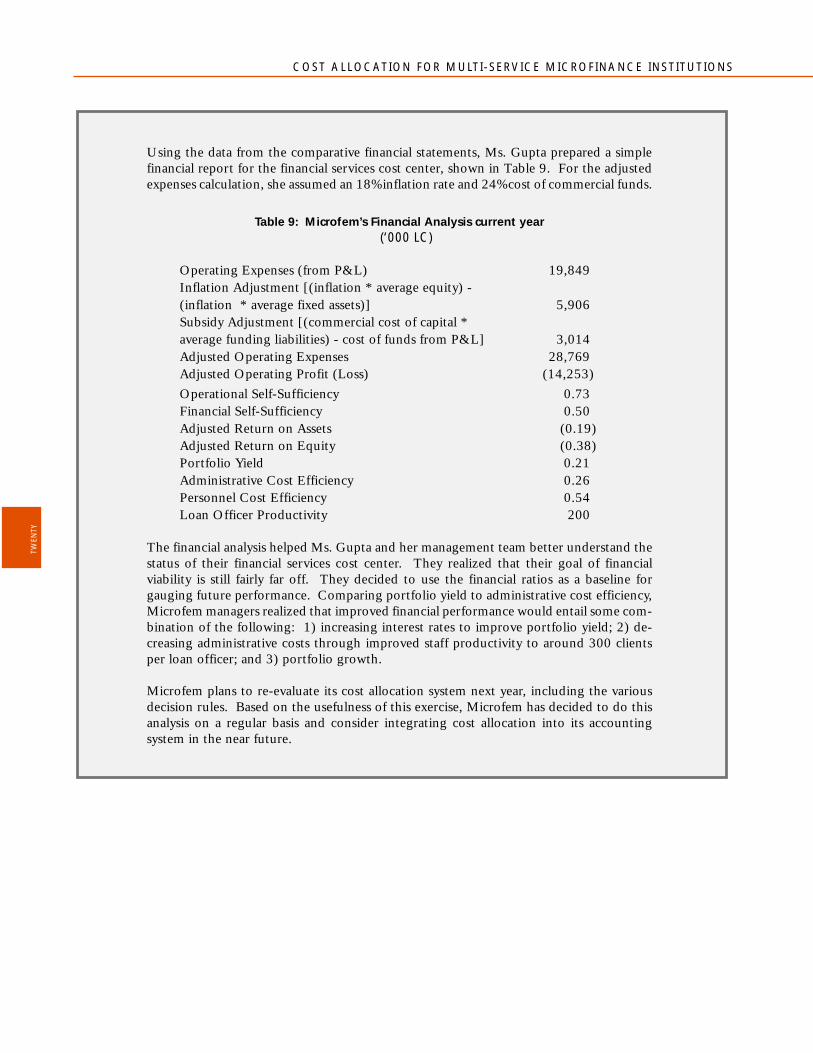
Using the data from the comparative financial statements, Ms. Gupta prepared a simplefinancial report for the financial services cost center, shown in Table 9. For the adjustedexpenses calculation, she assumed an 18% inflation rate and 24% cost of commercial funds.
Table 9: Microfem’s Financial Analysis current year (‘000 LC)
Operating Expenses (from P&L) 19,849Inflation Adjustment [(inflation * average equity) -(inflation * average fixed assets)] 5,906Subsidy Adjustment [(commercial cost of capital *average funding liabilities) - cost of funds from P&L] 3,014Adjusted Operating Expenses 28,769Adjusted Operating Profit (Loss) (14,253)Operational Self-Sufficiency 0.73Financial Self-Sufficiency 0.50Adjusted Return on Assets (0.19)Adjusted Return on Equity (0.38)Portfolio Yield 0.21Administrative Cost Efficiency 0.26Personnel Cost Efficiency 0.54Loan Officer Productivity 200
The financial analysis helped Ms. Gupta and her management team better understand thestatus of their financial services cost center. They realized that their goal of financialviability is still fairly far off. They decided to use the financial ratios as a baseline forgauging future performance. Comparing portfolio yield to administrative cost efficiency,Microfem managers realized that improved financial performance would entail some com-bination of the following: 1) increasing interest rates to improve portfolio yield; 2) de-creasing administrative costs through improved staff productivity to around 300 clientsper loan officer; and 3) portfolio growth.
Microfem plans to re-evaluate its cost allocation system next year, including the variousdecision rules. Based on the usefulness of this exercise, Microfem has decided to do thisanalysis on a regular basis and consider integrating cost allocation into its accountingsystem in the near future.
TWEN
TY
O c c a s i o n a l P a p e r N o . 2
V. O t h e r A p p l i c a t i o n s
MFIs can apply the principles behind the cost allocationmethods described in this Paper to their operations on anumber of levels. For instance, MFIs are increasinglyinterested in treating their branches as individual cost orprofit centers. MFIs concerned with branch-level vi-ability can utilize cost allocation techniques to allocatehead-office costs to each of their branches.
While some MFIs make use of the types of decision rulesdiscussed in this Paper for allocating costs to branches,many MFIs allocate head office costs to branches in pro-portion to the relative size of each branch as measuredby outstanding portfolio, number of clients, or numberof staff members. This type of decision rule may or maynot accurately reflect the level of head office effort andresources actually expended on each branch. For in-stance, newer branches with smaller portfolios may re-quire relatively more head office attention than maturebranches. Therefore, an allocation rule based on port-folio size (or number of clients, or number of staff) im-plies a cross subsidy by older branches in favor of youngerbranches. On the other hand, many back office admin-istrative and accounting functions increase in intensitywith the volume of loans and transactions, therefore jus-tifying this approach.
Another common method for covering head office ex-penses at the branch level is transfer pricing. The headoffice can “charge” branches a flat percentage rate ofbranch income (or expenses), for instance. More com-monly, branches pay a given interest rate on funds trans-ferred from the head office (these funds are normallyused to fund the loan portfolio at the branch level).Transfer pricing schemes need to be carefully designedso that all headquarters costs are covered. Determina-tion of the correct transfer price requires careful finan-cial projections and constant updating.
Credit cooperative systems often use transfer pricing,where primary societies pay interest on the net loansfrom their apex organization. The apex intermediatesbetween surplus and deficit primary societies by collect-ing excess savings from surplus societies and onlendingthese funds to deficit societies at an interest rate spread.However, the price of apex funds should be relativelyexpensive in order to encourage savings mobilization,the foundation of credit cooperative systems.
Even MFIs that do branch-level cost allocation do notnecessarily construct complete branch balance sheets, al-though assets and some liabilities are often allocated.As was seen in this paper, balance sheet allocation, par-ticularly from a non-integrated approach, presents a num-ber of key challenges and may not be worth it for everyMFI.
MFIs may also wish to track the financial performanceof individual “products” within their financial servicesline, like specific savings instruments and/or differenttypes of loans (group vs. individual, agriculture, hous-ing, working capital, etc.). Another cost allocation ap-plication relates to donor funding. Many donors re-quire separate accounting of expenses related to theirparticular project or fund. However, this form of fund-ing often complicates MFI systems with special trackingand reporting requirements at the cost of overall insti-tutional development. Donors should not necessarilyprescribe this type of fund accounting.11
As this discussion implies, cost allocation can becomeexceedingly complicated for many-faceted MFIs. Forinstance, what if an MFI offers five financial and non-financial services from 10 branches, and within financialservices has three separate products and needs to pro-duce reports for four different donors? Clearly, a costallocation system that tried to address all these dimen-sions would be too complex. MFIs should choose whichcost or profit centers make the most sense from a man-agement perspective. As more MFIs adopt cost alloca-tion systems and move from non-integrated to integratedapproaches, it is important to avoid the problem of a“proliferation in the chart of accounts” — i.e. by ser-vice, by branch, by donor, etc.12
V I . A n E x a m p l e f r o m t h e F i e l d —B R A C
BRAC (Bangladesh Rural Advancement Committee)presents an interesting case of cost and asset allocationactually implemented in the field. BRAC employs a com-plex system utilizing several of the different decision rulesdiscussed in this paper for allocating costs and balancesheet items to various cost centers. BRAC’s cost cen-ters, in turn, are analyzed at the branch, regional, andcentral levels.
TWEN
TY-ON
E
COST ALLOCATION FOR MULTI-SERVICE MICROFINANCE INSTITUTIONS
BRAC is a large MFI in Bangladesh that began opera-tions in 1972 (financial services in 1974). Its three fi-nancial service programs, contained in the Rural Devel-opment Project (RDP), Rural Credit Project (RCP) andIncome Generation for Vulnerable Development CreditProgram (IGVDD, had more than 1.5 million outstand-ing loan clients as of 31 December 1996, and operatedin 32,102 of Bangladesh’s 86,000 villages.
In addition to these financial services, BRAC offers sev-eral other types of products and services to its mem-bers/clients, including:
• Health and Population (Women Health andDevelopment Program and Family Planning Facili-tation Program)
• Human Rights and Legal Education (under the RDPproject)
• Education (two Non-Formal Primary Educationprograms, Educational Support Program)
• Other Programs (Baor Development Program,Emergency Relief and Rehabilitation Program, SmallHolder Livestock Development Project)
• Several “businesses, including Aarong Rural CraftCentre and BRAC Printers
• Sectoral programs that provide business and tech-nical inputs/advice to the sericulture, pisciculture,agriculture and poultry sectors
By 1994, BRAC had developed a cost allocation systemthat differentiates costs and 17 different financial state-ments among the many different programs and betweenthe head office and front-line operating units. Each ofthe different dimensions is considered a cost center.
1. Deciding to Allocate and Defining Separate CostCenters
As BRAC began to develop more and diverse programsand build an extensive branch system, it recognized thata cost allocation system would benefit operations in twoways:
• by helping management to clearly measure the per-formance of the operating units and the differentprograms, thus improving their accountability; and
• by assisting BRAC to attract and track separate fund-ing for each program.
BRAC chose to develop a cost allocation system that isbuilt into its overall accounting system. It was decidedthat the high initial costs of setting up the allocationsystem would simplify the process in the longer term.This decision was aided by extensive computerization atthe head office level, although the cost allocation pro-cess remains manual at the branch level.
BRAC runs the majority of its programs on the groundthrough its 372 area offices or branches. The next levelmanagement unit is the regional office, and then thehead office. The aggregate of all BRAC operations isreferred to as the “corporate level”.
BRAC’s system begins at the charts of accounts at thebranch level. Each branch maintains ledgers for all theprograms that it operates. For the sake of simplicity thispaper identifies only two cost centers at the branch level,one of the financial services programs (RCP) and thenon formal primary education program (NFPE). In re-ality, however, any given branch would allocate costsamong all programs it implements.
2. Identifying Direct and Indirect Costs at the BranchLevel
BRAC first identifies direct costs for each cost center atthe branch level. BRAC has separate field staff for RCPand NFPE programs. Field officers for each programand their direct supervisors are allocated to either theRCP or NFPE cost center. Training for both staff andclients is charged directly to the relevant cost center byone of BRAC’s regional training centers. Vehicle oper-ating expenses, fuel and maintenance are recorded in avehicle logbook and are charged to each cost center ona direct usage basis. Other direct costs that apply fullyto the RCP cost center include loan loss provisions, in-terest expense and any bank charges. The only othermajor direct cost is the depreciation of vehicles. In mostcases, an employee owns the vehicle and no deprecia-tion is taken. When BRAC owns the vehicle, it is eitherowned directly by a specific cost center and depreciatedaccordingly or considered a common use vehicle butowned by RCP and depreciation (RCP’s books) or rent(NFPE’s books) are allocated according to its usagenoted in vehicle logbook.
Indirect costs shared by different cost centers at thebranch level include office-related expenses like mainte-nance, rent, depreciation, stationary, entertainment, andgeneral expenses. In addition, there are staff membersknown as “common pool staff”, consisting of profes-sionals like accountants, cashiers and service staff.
TWEN
TY-T
WO
O c c a s i o n a l P a p e r N o . 2
3. Establishing Decision Rules for Allocating Costsat the Branch Level
Indirect costs at the branch level are allocated using sev-eral different decision rules. It is assumed that the RCPcost center “owns” the building and related assets likefurniture, fixtures, and equipment. Each cost center paysfor a proportion of the maintenance and rent (NFPE)or depreciation (RCP) of these assets based on the per-centage of total square footage occupied by the corre-sponding program.
Other indirect costs are allocated based on either theSimple Personnel Ratio (SPR) or the Personnel Cost Ra-tio (PCR). An estimate for the latter is based on a yearlywork time analysis survey conducted with branch levelstaff and revised annually as necessary.
Cost Decision Rule
StationeryGeneral ExpensesEntertainment
Common Pool Staff Service Staff Accountant Cashier
The branches also incur their share of head and regionaloffice expenses. For instance, the regional manager’soffice cost is allocated evenly among the relevant areaoffices covered in the NFPE and RCP programs on aquarterly basis. The allocation of head office costs takesplace only at the corporate level. The RCP program atthe branch level incurs a cost of funds for onlending of9 percent per annum; these funds are lent by the headoffice to branches.
4. Branch-Level Profit and Loss Statement
BRAC produces profit and loss statements at the branchlevel for all programs on a monthly basis. On the incomeside, the NFPE does not earn any income at the branchlevel. RCP earns interest income on its loans outstandingand rental income (from the other programs rentingpremises). Table 10 gives a sample chart of accounts forthe branch-level profit and loss statement.
�
�
Allocated based on # of directstaf f in the cost center'sprogram(Simple PersonnelRatio, or SPR)
Allocated based on an estimateof Personnel Cost Ratio (PCR) TW
ENTY-TH
REE
5. Incorporating the Balance Sheet at the BranchLevel
Although BRAC branches track income and expendi-tures for each of their cost centers, they create a balancesheet only for the RCP (financial services). Thus, at thebranch level, all programs are treated as cost centersexcept for the RCP which is considered a "profit cen-ter" because it is the only program that earns revenue.At the aggregate or corporate level, however, a full setof financial statements for each cost center is prepared.The branch cost allocation system feeds into these state-ments.
Since the allocation system is built into BRAC’s account-ing system, the allocation of balance sheet items for theRCP program at the branch level is relatively simple.Nearly all branch assets are allocated to the RCP costcenter. Most fixed assets are “owned” by the RCP, withthe exception of those fixed assets solely used by theNFPE, such as field officers’ motorbikes. All other fixedassets, including common use assets, are posted to theRCP balance sheet.
Current assets at the branch level, with the exception of“stock of books” (educational materials) for the NFPE,are allocated to the RCP cost center. NFPE does notkeep any bank accounts at the branch level and cash re-quests and receipts are channeled through the RCP bankaccount earmarked for NFPE. Other assets, includingthe loan portfolio, are allocated to the RCP.
Funds and liabilities are also simply allocated. All liabili-ties are allocated to the RCP, including current liabili-ties, member savings (group trust fund, compulsory sav-ings, own contribution (voluntary savings)) and the cur-rent account with the head office (usually financing theloan fund). Equity is considered the capital financing offixed assets and any accumulated surplus of income overexpenditure; since the RCP generally “owns” nearly allfixed assets and earns the largest surplus, equity itemsare mostly allocated to that program.
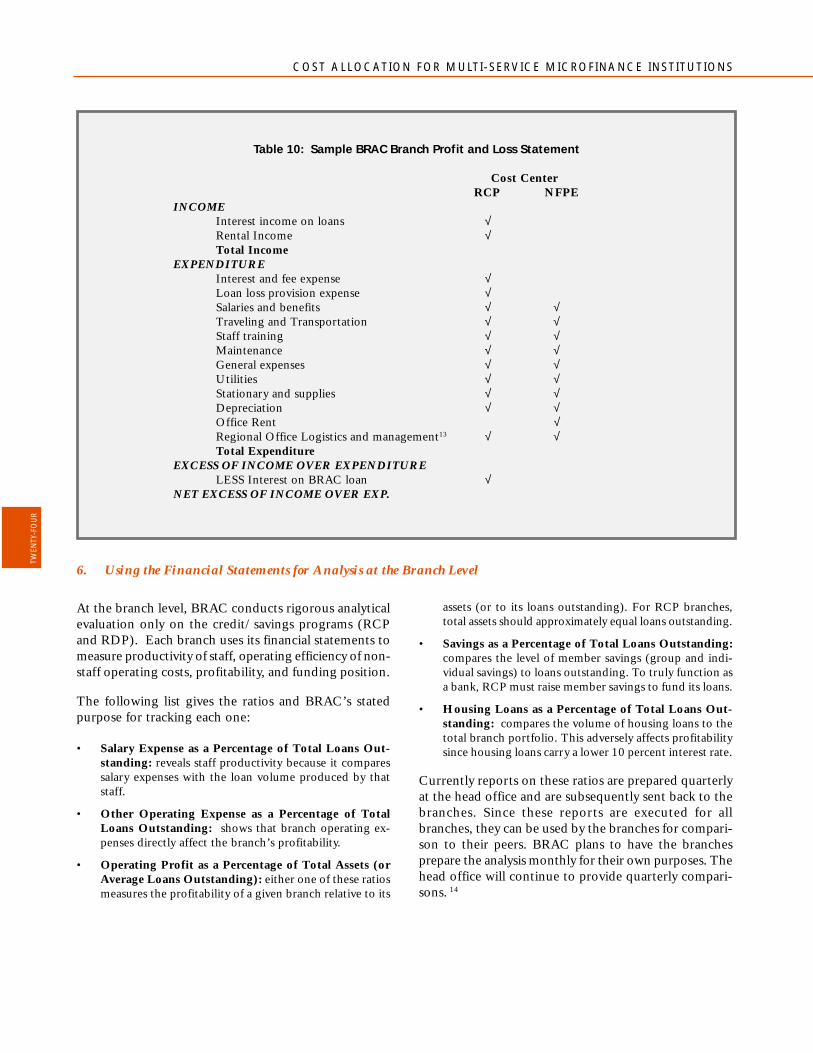
COST ALLOCATION FOR MULTI-SERVICE MICROFINANCE INSTITUTIONS
At the branch level, BRAC conducts rigorous analyticalevaluation only on the credit/savings programs (RCPand RDP). Each branch uses its financial statements tomeasure productivity of staff, operating efficiency of non-staff operating costs, profitability, and funding position.
The following list gives the ratios and BRAC’s statedpurpose for tracking each one:
• Salary Expense as a Percentage of Total Loans Out-standing: reveals staff productivity because it comparessalary expenses with the loan volume produced by thatstaff.
• Other Operating Expense as a Percentage of TotalLoans Outstanding: shows that branch operating ex-penses directly affect the branch’s profitability.
• Operating Profit as a Percentage of Total Assets (orAverage Loans Outstanding): either one of these ratiosmeasures the profitability of a given branch relative to its
Table 10: Sample BRAC Branch Profit and Loss Statement
Cost Center RCP NFPE
INCOMEInterest income on loans √Rental Income √Total Income
EXPENDITUREInterest and fee expense √Loan loss provision expense √Salaries and benefits √ √Traveling and Transportation √ √Staff training √ √Maintenance √ √General expenses √ √Utilities √ √Stationary and supplies √ √Depreciation √ √Office Rent √Regional Office Logistics and management13 √ √Total Expenditure
EXCESS OF INCOME OVER EXPENDITURELESS Interest on BRAC loan √
NET EXCESS OF INCOME OVER EXP.
TWEN
TY-F
OU
R
assets (or to its loans outstanding). For RCP branches,total assets should approximately equal loans outstanding.
• Savings as a Percentage of Total Loans Outstanding:compares the level of member savings (group and indi-vidual savings) to loans outstanding. To truly function asa bank, RCP must raise member savings to fund its loans.
• Housing Loans as a Percentage of Total Loans Out-standing: compares the volume of housing loans to thetotal branch portfolio. This adversely affects profitabilitysince housing loans carry a lower 10 percent interest rate.
Currently reports on these ratios are prepared quarterlyat the head office and are subsequently sent back to thebranches. Since these reports are executed for allbranches, they can be used by the branches for compari-son to their peers. BRAC plans to have the branchesprepare the analysis monthly for their own purposes. Thehead office will continue to provide quarterly compari-sons. 14
6. Using the Financial Statements for Analysis at the Branch Level
O c c a s i o n a l P a p e r N o . 2
7. Cost Allocation at the Corporate Level
Cost allocation at the branch level provides the basicinput into corporate cost allocation. The first step toallocating costs to each program is to identify the directand indirect costs.
Regional Office. Each Regional Office is dedicated toa specific program (cost center) and consists of a Re-gional Manager and two staff members. Typically, oneregional office covers 20 branches. That is, an NFPEregional manager would oversee 20 NFPE programs runout of 20 branches. Thus the costs related to the Re-gional Offices are very easily allocated among programs.BRAC prepares full financial statements for Regional Of-fices quarterly but a profit and loss statement on amonthly basis, allowing allocation to the variousbranches.
Head Office. Each cost center incurs direct costs relat-ing to:
• Staff: The head office has dedicated operationalstaff to each program. In addition, each programhas its own accounting, administrative, and auditstaff. Each staff member is designated to a costcenter by a special code in the accounting system.
• Vehicle operation and depreciation• Equipment• Furniture and Fixtures• Stock
The above costs are easily tracked and allocated.
BRAC’s indirect costs (called Common Costs) and thedecision rules for allocating them follow:
Cost Decision Rule
Office Maintenance Allocation based on percentageRent of total square footage occupied
by cost center program
Shared Vehicles Depreciation and operatingexpenses allocated throughusage logbook
Shared Management Allocated according to percentageof total program expenditure, basedon branch and regional officeallocations, not including loandisbursements (similar to theDirect Administrative ExpenseRatio, DAER)
�
�
�
TWEN
TY-FIVE
For the RCP program, each year these direct and allo-cated head office expenses are reconciled to the 9 per-cent charge on loan funds.
8. Global Profit and Loss Statement
BRAC produces global profit and loss statements by pro-gram every six months. Overall RCP profit and loss state-ments are completed monthly.
The NFPE program income statement, only preparedat the corporate level, shows income coming from do-nations and bank interest. Bank interest is generated onexcess accounts held at the head office. Expenses aredrawn directly from the program’s accounts as notedabove.
The RCP income statement mirrors those of thebranches, but has the additional interest earned on in-vestments held at head office. Any head office expensesare directly booked to each account. For example, anyhead office salaries and benefits related to RCP are in-corporated directly into the line item on the expensestatement. Interest expenses on the head office loan iseliminated at this level, after reconciliation.
9. Incorporating the Balance Sheet at the CorporateLevel
Generating a balance sheet for each program at thehead office level is a relatively simple process:
NFPEMany of the “social” programs are separately financed,and these funds are tracked from receipt of donations.Each program has its own balance sheet, with assets per-taining directly to the program allocated. Current assetsinclude stocks of books (held at both shared branchesand free standing branches). Other current assets, suchas advanced deposits and prepayments, accounts receiv-able, current accounts with area offices, cash and bankbalances pertain to “free standing” branches, or thosebranches which operate only NFPE programs. Fundcontrol is the head office account, where excess cashbalances are held at the head office.
COST ALLOCATION FOR MULTI-SERVICE MICROFINANCE INSTITUTIONS
These assets are funded by current liabilites which in-clude a motorcycle replacement fund, and small deferredliabilities such as accounts payable, or deferred expense.The primary funding is through a “program fund” whichis composed of the balance of donations, advance dona-tions, and any surplus or deficit for the year. This type offunding is allocated based on receipts of donations ear-marked specifically for this program.
RCPAll common use fixed assets at this level are “owned” byBRAC as a whole, as opposed to any particular program.The remainder of the asset side of the balance sheet lookslike that of a branch with the addition of fund control(head office cash and bank balances) and short-term in-vestment accounts held at the head office. These assetsare funded by short term liabilities such as client depos-its and expenses payable and a longer term liability, themotorcycle replacement fund. Finally equity, or the pro-gram fund, includes an opening balance (donor capitaland any retained earnings) and any surplus or deficit forthe year’s operations, plus some minor adjustments andinter-program transfers.
10. Using the Financial Statements for Analysis atthe Corporate Level
The corporate financial statements that are generatedfor each program operated by BRAC are reported in itsAnnual Auditors’ Report and Financial Statements. Ex-ternal analysis on RDP/RCP financial statements is per-formed by outside consultants each year. Other programsare evaluated periodically according to donor request oragreement.
Internal analysis is performed every six months for allprograms. For non-financial services, management pri-marily examines budget variances and, at times, devel-ops a unit cost for certain services. For example, thecost per child educated or vaccinated. Analysis of theconsolidated RCP financial services is also performedevery six months. This analysis includes ratios on theprofit and loss statement, the balance sheet and overallportfolio analysis. To date, the analyses do not feed intostaff performance evaluations although this is currentlyunder consideration.11. Conclusion
The BRAC case is a good illustration of the issues andbenefits discussed in this paper that relate to conduct-ing cost allocation for a large multi-service MFI. BRAC’scost allocation system is among the most sophisicated inthe MFI industry and provides a number of interestinginsights.
The level of complexity of the decision rules employedby BRAC is commensurate with the systems available atdifferent levels of operation. For instance, at the branchlevel BRAC uses simple, intuitive rules combining theSimple Personnel Ratio, the Personnel Cost Ratio, a flatcosts of funds transfer fee for head office funds, and di-rect usage of vehicles and premises. At the corporatelevel, BRAC applies more complex rules related to rec-onciliation of the cost of funds transfer and a form ofthe Direct Administrative Expense Ratio. All decisionrules are carefully designed and reviewed on a periodicbasis.
Another important feature of BRAC’s cost allocationsystem is the distinction between cost and profit centersat the branch level. For instance, full financial state-ments (profit and loss statements and balance sheets)are prepared frequently for the RCP program to facili-tate financial analysis and monitoring of branch perfor-mance for that program. The RCP program is clearlytreated as a profit center. Alternatively, other programsproduce profit and loss statements at the branch level,but full financial statements only at the regional or cor-porate level. In these instances, analysis is conducted atless frequent intervals. These other programs are con-sidered cost centers and not necessarily evaluated in termsof their profitability. This differentiation shows howBRAC’s allocation system reflects management informa-tion requirements and analysis priorities.
BRAC’s complex system is critical for enabling manage-ment to effectively monitor and analyze its financial andnon-financial programs at several different levels of op-eration — branch, regional, headquarters, and corpo-rate. BRAC’s decision to install an integrated allocationsystem that allows management to track 17 different costcenters was based on its interest in improving account-ability of operating units and different programs.
A n n e x : A l t e r n a t i v e s f o r A l l o c a t i n g
TWEN
TY-S
IX
O c c a s i o n a l P a p e r N o . 2
B a l a n c e S h e e t I t e m s
As discussed in Section III, balance sheet items are of-ten fairly straightforward to allocate, and in most cases,a simple decision rule will suffice. However, in caseswhere careful records have not been kept or many pro-grams vie for use of the same assets, liabilities, and/orequity capital, more complex allocation methods maybe required. This annex contains a few ideas for allocat-ing these items, but does not necessarily cover all pos-sible options.
Investments. The allocation of investments to differentcost centers depends directly on the use of the in-vestment income. This allocation would have alreadybeen determined for the profit and loss statements.If the MFI uses its investment income solely to fundcosts related to the provision of financial services, thenthe investment balance should be allocated to finan-cial services. If, on the other hand, the MFI investssome funds specifically to generate income to defraythe costs of its non-financial services, it should allo-cate investment balances in proportion to the use ofthis income. For financial services, the allocation for-mula is:
InvestmentsFS
= (Investment IncomeFS
÷ Investment IncomeTOTAL
)
x InvestmentsTOTAL
Net Fixed Assets. An MFI’s net fixed assets equals thegross value of fixed assets minus the accumulated de-preciation. The MFI would have already establisheda decision rule for allocating the current year’s de-preciation based on the proportional use of fixed as-sets in the provision of each service. Since both thegross value of fixed assets and accumulated deprecia-tion on those assets is assumed to follow the samepattern, net fixed assets can be allocated to financialservices with the following formula:
Net Fixed AssetsFS
= (Current DepreciationFS
÷ Current DepreciationTOTAL
)
x Net Fixed AssetsTOTAL
Donated Equity. Grants from international and/ornational donor agencies can be divided into priorperiod, cumulative donations and current perioddonations. In many cases, donors require that anMFI spends their funds on specific programs/services and allocation of these funds among costcenters is straightforward. The MFI may havealready allocated the current period’s donations asincome to different cost centers as part of the cost
allocation exercise. An MFI that has difficulty allo-cating previous periods’ donations to financial andnon-financial services has at least three options. First,the MFI can assume that the distribution of thisyear’s donations is the best estimate of previous years’donations. The formula is:
Previous Periods’ DonationsFS
= (Current Period’s DonationsFS
÷ Current Period’s DonationsTOTAL
)
x Previous Periods’ DonationsTOTAL
Previous periods’ donations could alternatively beallocated according to each cost center’s proportion oftotal operating costs, both direct and indirect
Previous Periods’ DonationsFS
= (Operating ExpensesFS
÷ Operating ExpensesTOTAL
)
x Previous Periods’ DonationsTOTAL
These are only two of several possibilities forapproaching the difficult problem of allocatingprevious periods’ donations.
Retained Earnings/Losses. As in the case of donatedequity, retained earnings or losses break down intoprevious periods’ retained earnings and currentperiod retained earnings (called “net operatingprofit” in the profit and loss statement shown inTable 6). Unlike the donations case, however, MFImanagers will not know the breakdown of previousperiods’ retained earnings between services unlessthey have conducted cost allocation exercises forthose earlier periods. The same two options applyto this case as for allocating past period donatedequity:
Previous Periods’ Retained EarningsFS
= (Current Period’s Retained
EarningsFS
÷ Current Period’s Retained EarningsTOTAL
)
x Previous Periods’ Retained EarningsTOTAL
Previous Periods’ Retained EarningsFS
= (Operating ExpensesFS
÷ Operating ExpensesTOTAL
)
x Previous Periods’ Retained EarningsTOTAL
TWEN
TY-SEVEN
1 NOTE: This Occasional Paper is targeted to managers of microfinance institutions thatprovide multiple services to their clients. The purpose is to illustrate methods for allocat-ing costs and assets among different programs in order to assess the financial sustainabilityof microfinance services.
2 A cost center refers to an activity or category of activities whose costs and revenues willbe grouped together for purposes of financial reporting and analysis. A profit centerencompasses activities or programs that earn income (or have the potential to earn in-come) sufficient to cover costs. While this paper mainly uses the term "cost centers",the same analysis and procedures apply to profit centers as well.
3 There is far less consensus or evidence for the need for viability of non-financial ser-vices, although the principle of at least partial cost-recovery is increasingly discussed ifnot embraced.
4 In Table 1 and in subsequent analyses of Microfem, “administrative” expenses refer toall expenses other than interest and fee expense and loan loss provisions. “Operational”expenses refer to all expenses incurred by the MFI.
5 These examples draw partly from Appendix 3 of Women’s World Banking (1994) Prin-ciples and Practices of Financial Management.
6 See section VI for a discussion of BRAC’s cost allocation system.
7 Operational self-sufficiency is defined as (operating income / operating expenses).
8 Section IV “Cost Allocation and Financial Analysis” provides more detail on financialratio analysis.
9 For a more complete treatment of inflation and subsidy adjustments, see chapter 2 ofRobert Peck Christen (1997) Banking Services for the Poor: Managing for Financial Suc-cess, Accion International.
10 Funding liabilities include loans from banks, governments, and donors plus voluntarysavings (and involuntary savings if an interest rate is paid on these). Accounts payable isnot a funding liability.
11 See the CGAP Focus Note 9 entitled Anatomy of a Microfinance Deal: The New Ap-proach to Investing in Microfinance Institutions for more details on the new institutionalapproach to donor funding for microfinance.
12 See Christen (1997) for ideas on how to set up a chart of accounts appropriate forfund accounting for MFIs.
13 Applied quarterly only.
14 BRAC uses end-of-period balances (e.g. loans outstanding) rather than average bal-ances since the analytical period is relatively short, only three months (soon to be monthly),and the difference between averages and end balances is not that large. Also, endbalances are easier to calculate for branch staff.
TWEN
TY-E
IGH
T
O c c a s i o n a l P a p e rN o . 2
CGAP THE CONS ULTATIVE GROUP TO ASSIST THE POOREST [ A M I C R O F I N A N C E P R O G R A M ]
This Occasional Paper was
written by Brigit Helms,
Microfinance Specialist with
the CGAP Secretariat.
The author wishes to thank
Mr. S.N. Kairy, the Chief
Management Accountant at
BRAC and Lorna Grace
for their cooperation
in producing the section
on BRAC. In addition,
the author gratefully
acknowledges the very useful
comments of Richard Rosenberg,
Bob Christen, Tony Sheldon,
Mohini Malhotra, Joyita
Mukherjee, and Greg Chen.
Reader comments are welcome,
since this paper represents
the first of many versions.
Please address all
correspondence to the author
at the CGAP Secretariat.
Production: Valerie Chisholm;
EarthWise Printing,
Gaithersburg, MD
(301) 340-0690.
TWEN
TY-E
IGH
T