nmr studies of soil, soil organic matter and nutrients: spectroscopy and imaging
TRANSCRIPT
ELSEVIER Geoderma 80 (1997) 307-325
GEODER~
NMR studies of soil, soil organic matter and nutrients: spectroscopy and imaging
E.W. Randall *, N. Mahieu, G.I. Ivanova Queen Ma~ and WesOqeld College, Mile End Road, London, E1 4NS, UK
Received 7 October 1996; accepted 4 March 1997
A b s t r a c t
A short general review of all aspects of the NMR technique, in both the spectroscopic and imaging modes, as applied to the study of soil, is presented from a mainly technical point of view. Illustrations, in the form of spectra and images, are reproduced for whole soils, solids, solid fractions, and liquid extracts from material in the authors' group. Nuclides covered are ~H, ~3C, ~SN, 27A1 and 3~ p. For solid samples the techniques employed include CP/MAS with and without TOSS, and for liquid-state studies the first high field (14.1 T) examples for soils in both one and two frequency dimensions are presented. For imaging further results from the first application of the stray field (STRAFI) technique applied to water in soil are given showing distortion-free images of both bound and free water. Finally, the first electron nuclear double resonance (ENDOR) and pulsed EPR results on soils will be illustrated. This paper is a slightly expanded version of an introductory talk of 35 minutes and so is not discursive. In particular the benefits of the techniques presented to soil science are only touched on. Other speakers present papers elsewhere in this issue which expand on particular aspects of the utility of NMR studies of soils. © 1997 Elsevier Science B.V.
Keywords: NMR; spectroscopy; imaging; soil; organic matter; nutrients
I. Introduction
The objective of this paper is to give an overview of all aspects of the NMR technique used in relation to studies of soil. It therefore overlaps with the other papers presented at the Symposium, some of which deal with particular topics in more detail. In such a short time as 35 minutes, it is impossible to be discursive,
* Corresponding author. E-mail: [email protected]
0016-7061/97/$17.00 © 1997 Elsevier Science B.V. All rights reserved. PII S001 6 - 7 0 6 1 ( 9 7 ) 0 0 0 5 7 - 8
308 E.W. Randall et al . / Geoderma 80 (1997) 307-325
and the various topics are presented at the level of news and not understanding. The many diverse aspects of soil NMR are illustrated in Figs. 1-14 which show the wide range of spectral types. All the samples except one are 'real' soils, soil fractions or extracts: we have not resorted to models. It may be apparent from these examples that the soil scientist aspiring to use NMR must learn to be just as eclectic as the NMR spectroscopist who is ambitious (or foolish) enough to study soils!
1.1. The utility of NMR in soil science is wide ranging
The soil scientist not only has a choice of methodology (spectroscopy, and imaging, or combinations of both) but there are many magnetic nuclides which may be used (Wilson, 1987; Preston, 1996; Veeman, 1997). Which nuclides are
i i /..
i I I / 20~ 15O I ~)0
ppm
I I~ i i i
i I i I I
I [ q 50 0
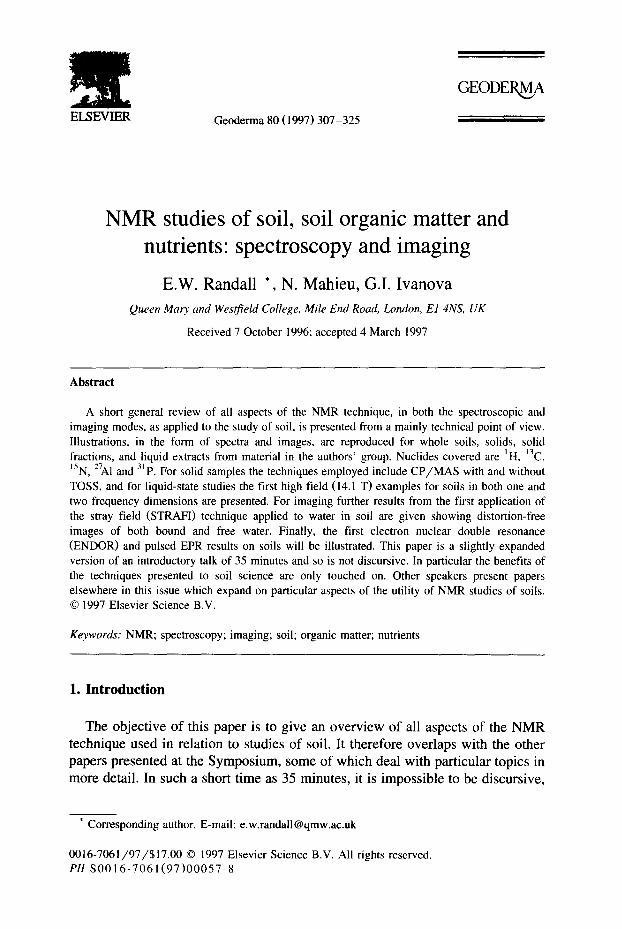
Fig. 1. 13C CPMAS TOSS solid-spectra of a humic acid obtained using (top) a Bruker AMX 600 operating at 150.9 MHz for ~3C, with a contact time of 1 ms, a relaxation delay of 1.5 s; 1024 scans were accumulated (45 min) and the spectrum was convoluted with a Lorentzian line-shape of width 50 Hz, and (bottom) a Bruker MSL 300 operating at 75.4 MHz for 13C, using a contact time of 1.5 ms, a relaxation delay of I s; 8735 scans were accumulated (2.5 h) and the spectrum was convoluted with a Lorentzian line-shape of width 75 Hz. For both spectra the magic angle spinning rates were 4 -5 kHz. The humic acid was extracted from a soil that has grown maize for at least the past 30 years at the University of Philippines at Los Bafios. Spectra can be divided approximately into the following chemical shift regions: 0-45 ppm (alkyl C), 45-65 ppm (N-alkyl C), 65-95 ppm (O-alkyl C), 95-108 ppm (acetal C), 108-145 ppm (aromatic C), 145-160 ppm (phenolic C), 160-185 ppm (carboxyl, amide and ester C). The higher field spectra have a larger signal-to-noise ratio in a given time, but the resolution is not greatly improved. This could be because of poor decoupling at the higher field, Otherwise the result indicates that the line-widths are determined by chemical shift anisotropy.
(a)
(b)
,
* /
\\
,
! *
, /
// ,
, I
, ,
, ,
1 f
I I
. ,
f I
I I
, ,
, ,
I
200
lO0
0 -I
O0
200
lO0
0 -l
O0
ppm
pp
m
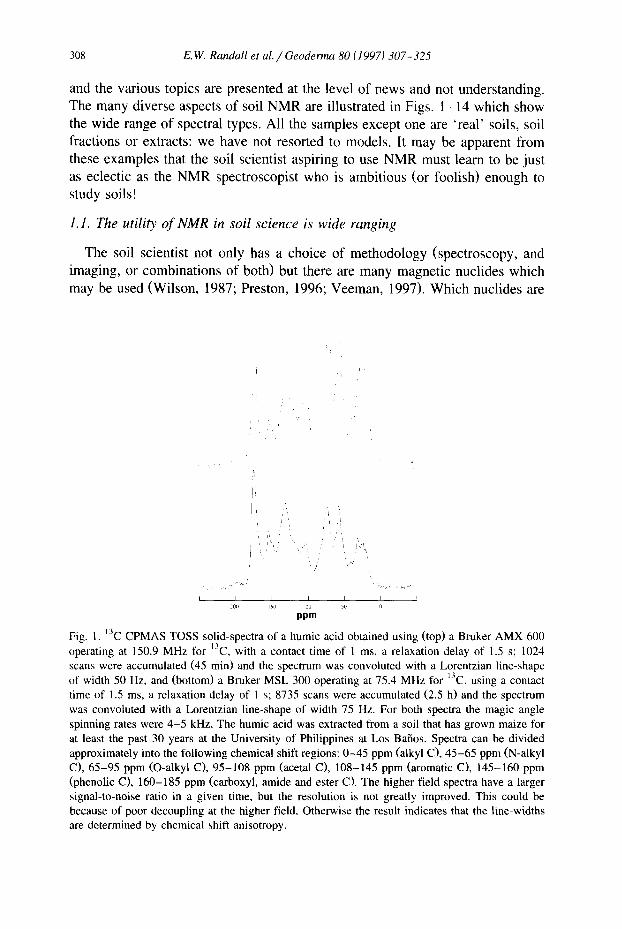
Fig.
2.
27A1
solid
-sta
te s
pect
ra o
f (a
) cl
ay-
and
(b)
silt
-siz
ed s
epar
ates
fro
m t
he u
nman
ured
plo
t in
the
B2
fiel
d of
Ler
mar
ken,
Ask
ov (
Den
mar
k).
Spec
tra
wer
e ob
tain
ed
usin
g (t
op)
a B
ruke
r A
MX
60
0 op
erat
ing
at
156.
4 M
Hz
for
27A
1, a
t m
agic
an
gle
spin
ning
ra
tes
of
12-1
4 kH
z; 4
096
scan
s w
ere
accu
mul
ated
(25
min
) an
d th
e sp
ectr
a w
ere
conv
olut
ed w
ith
a L
oren
tzia
n li
nesh
ape
of w
idth
1 o
r 10
Hz,
and
(bo
ttom
) a
Bru
ker
MSL
300
ope
rati
ng a
t 78
.2 M
Hz
for
27A
1, a
t m
agic
ang
le s
pinn
ing
rate
s of
12
kHz;
687
4 (1
h)
or 1
0247
(1.
5 h)
sca
ns w
ere
accu
mul
ated
for
(a)
and
(b)
, re
spec
tive
ly,
and
the
spec
tra
wer
e no
t co
nvol
uted
wit
h a
Lor
entz
ian
line
-sha
pe.
Pea
ks m
arke
d w
ith
* ar
e sp
inni
ng s
ide-
band
s. T
he r
eson
ance
aro
und
0 pp
m c
orre
spon
ds t
o oc
tahe
dral
alu
min
ium
, an
d th
e re
sona
nces
bet
wee
n 50
and
70
ppm
to
tetr
ahed
ral
alum
iniu
m.
The
hig
her
fiel
d sp
ectr
a ha
ve a
lar
ger
sign
al-t
o-no
ise
rati
o in
a g
iven
tim
e, a
nd t
he r
esol
utio
n is
gre
atly
im
prov
ed.
ixa
L,1
310 E. W. Randall et al. / Geoderma 80 (1997) 307-325
50 0 -50 -100 -150 -200 -250 -300 -350 -400 -450 -500 -550
pprn
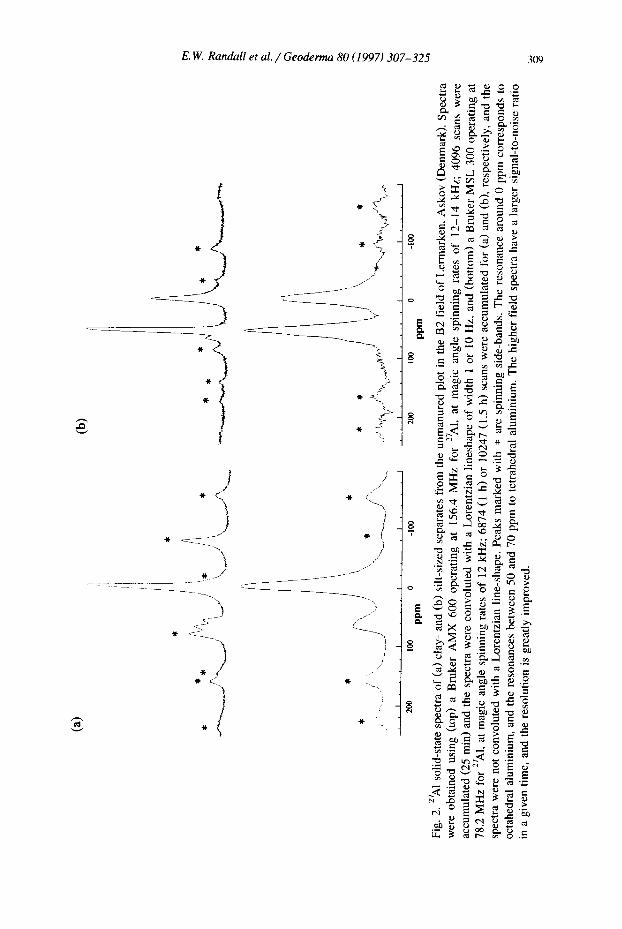
Fig. 3. ~SN CPMAS solid-state spectrum of a humic acid at natural abundance, obtained on a Bruker MSL 300 operating at 30.4 MHz for tSN. A contact time of 1 ms and a relaxation delay of 200 ms were used. 437,143 scans (26 h) were accumulated and a line broadening of width 100 Hz was applied. Peaks marked with * are spinning side-bands. The humic acid was extracted from a soil that grows three crops of irrigated rice per year at the International Rice Research Institute (IRRI) in the Philippines. Other examples are given elsewhere (KtJgel-Knabner, 1997). Like in all other published cases, the spectrum is dominated by a peak around - 260 ppm which corresponds to amides and peptides, with amino acids and amino sugars around - 3 4 0 ppm, indoles and pyrroles forming a shoulder on the left side of the amide/peptide peak, and NH 2 groups on the right side.
chosen for study will depend on the particular aspect of soil science being highlighted. For the inorganic soil matrix (SMX), the main nuclides are 14N
(and 15N), 27A1, 298i, and 3~p, whereas for the soil organic matter (SOM), including microbes and fungi, the principal nuclides are ~H (and 2H), and ~3C, in addition to the nitrogen nuclei and 3~p. Lastly, there are the soil nutrients (SN), which I shall take to include water, or soil pollutants (SP). Of course some studies may involve SMX, SOM, SN and SP!
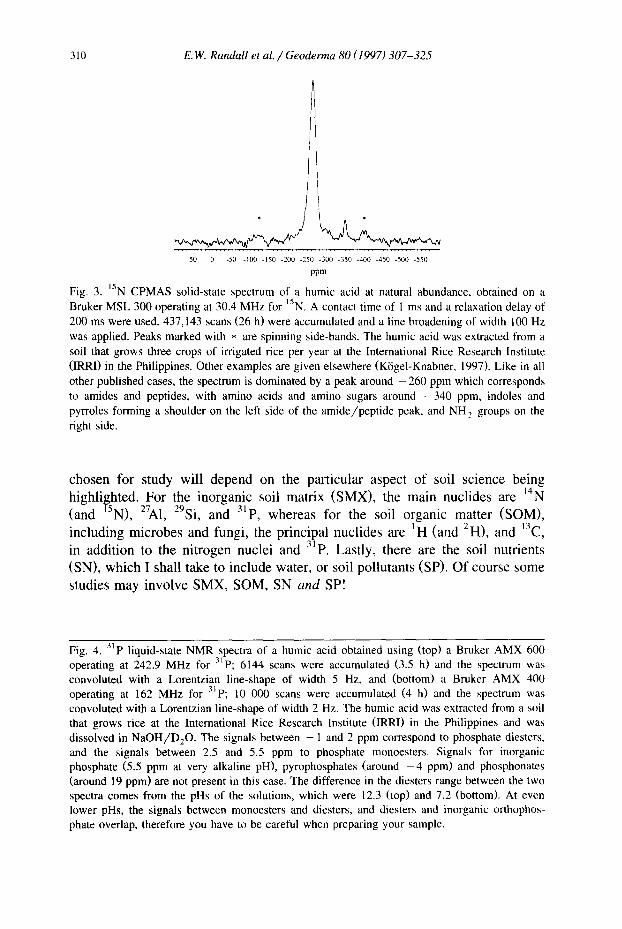
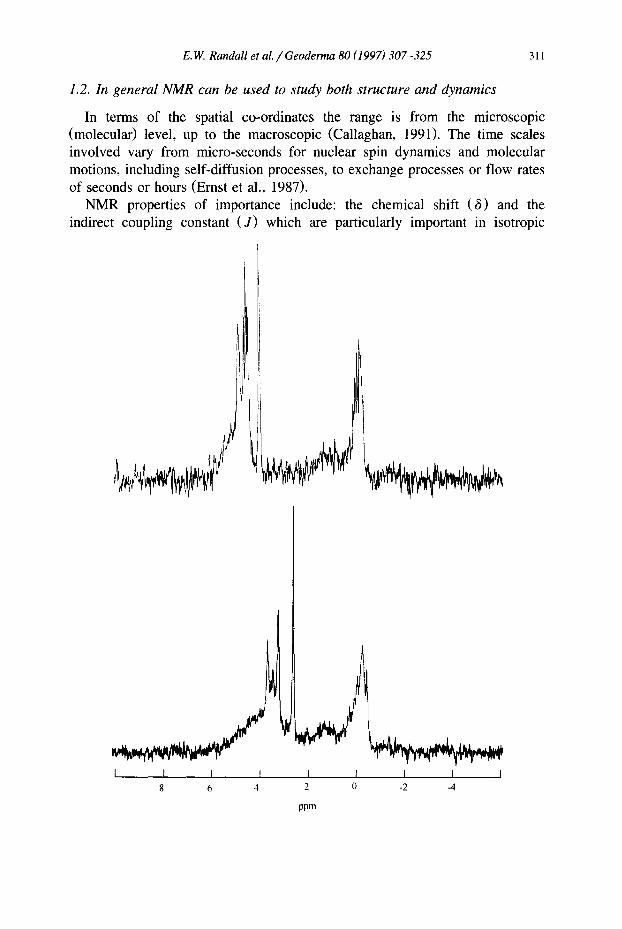
Fig. 4. 31p liquid-state NMR spectra of a humic acid obtained using (top) a Bruker AMX 600 operating at 242.9 MHz for 31p; 6144 scans were accumulated (3.5 h) and the spectrum was convoluted with a Lorentzian line-shape of width 5 Hz, and (bottom) a Bruker AMX 400 operating at 162 MHz for 31p; 10 000 scans were accumulated (4 h) and the spectrum was convoluted with a Lorentzian line-shape of width 2 Hz. The humic acid was extracted from a soil that grows rice at the International Rice Research Institute (IRRI) in the Philippines and was dissolved in N a O H / D 2 0 . The signals between - 1 and 2 ppm correspond to phosphate diesters, and the signals between 2.5 and 5.5 ppm to phosphate monoesters. Signals for inorganic phosphate (5.5 ppm at very alkaline pH), pyrophosphates (around - 4 ppm) and phosphonates (around 19 ppm) are not present in this case. The difference in the diesters range between the two spectra comes from the pHs of the solutions, which were 12.3 (top) and 7.2 (bottom). At even lower pHs, the signals between monoesters and diesters, and diesters and inorganic orthophos- phate overlap, therefore you have to be careful when preparing your sample.
E. W. Randall et al. / Geoderma 80 (1997) 307-325 311
1.2. In general NMR can be used to study both structure and dynamics
In terms of the spatial co-ordinates the range is from the microscopic (molecular) level, up to the macroscopic (Callaghan, 1991). The time scales involved vary from micro-seconds for nuclear spin dynamics and molecular motions, including self-diffusion processes, to exchange processes or flow rates of seconds or hours (Ernst et al., 1987).
NMR properties of importance include: the chemical shift (6) and the indirect coupling constant ( J ) which are particularly important in isotropic
I I I ! I I 8 6 4 2 0
ppm
I I I -2 -4
312 E.W. Randall et al. / Geoderma 80 (1997) 307-325
'ka,ino I e x t r a c t
humic ac id
fulvic ac id I~V~ P I
ppm 200' '180 ' i60 ' 140 " '120 ' 1{)0' ' 'S~)' ' '6~) . . . . 40 ' '2 '0 ' 0
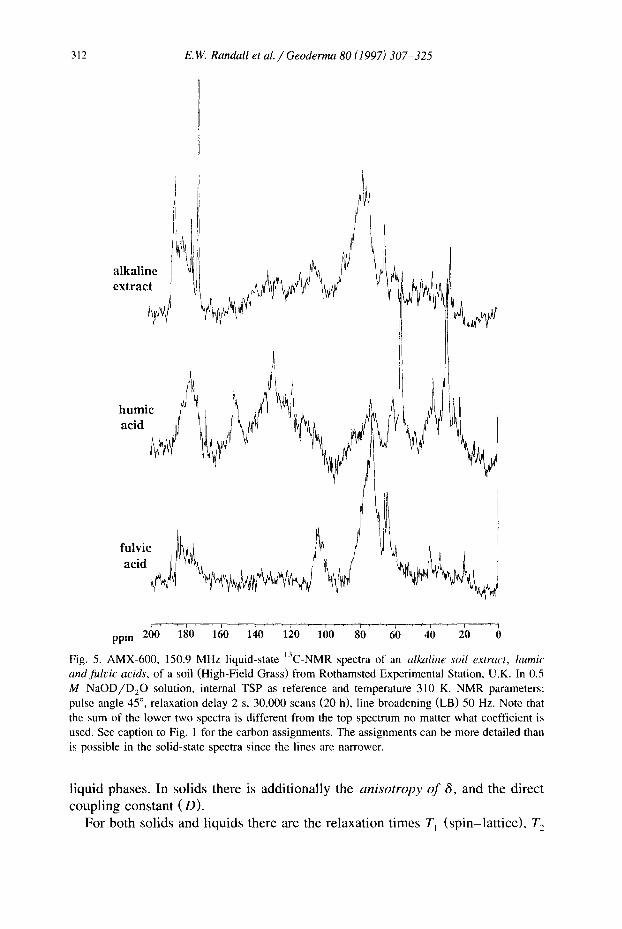
Fig. 5. AMX-600, 150.9 MHz liquid-state 13C-NMR spectra of an alkaline soil extract, humic and fuh'ic acids, of a soil (High-Field Grass) from Rothamsted Experimental Station, U.K. In 0.5 M N a O D / D 2 0 solution, internal TSP as reference and temperature 310 K. NMR parameters: pulse angle 45 °, relaxation delay 2 s, 30,000 scans (20 h), line broadening (LB) 50 Hz. Note that the sum of the lower two spectra is different from the top spectrum no matter what coefficient is used. See caption to Fig. 1 for the carbon assignments. The assignments can be more detailed than is possible in the solid-state spectra since the lines are narrower.
l i q u i d p h a s e s . In s o l i d s t he re is a d d i t i o n a l l y the anisotropy o f 6, a n d the d i r e c t
c o u p l i n g c o n s t a n t ( D ) .
F o r b o t h s o l i d s a n d l i q u i d s t h e r e a re the r e l a x a t i o n t i m e s T~ ( s p i n - l a t t i c e ) , 77,
E. W. Randall et al. / Geoderma 80 (1997) 307-325 313
13C-NM
CH3
F i
CH2 / ,t%!itt CH
ppm 260' ' '180 ' ] 60 ' ' ' 140 ' " 120' " '160' ' 8 b ' ' 6b ' '4b' ' ' 2 b ' 6
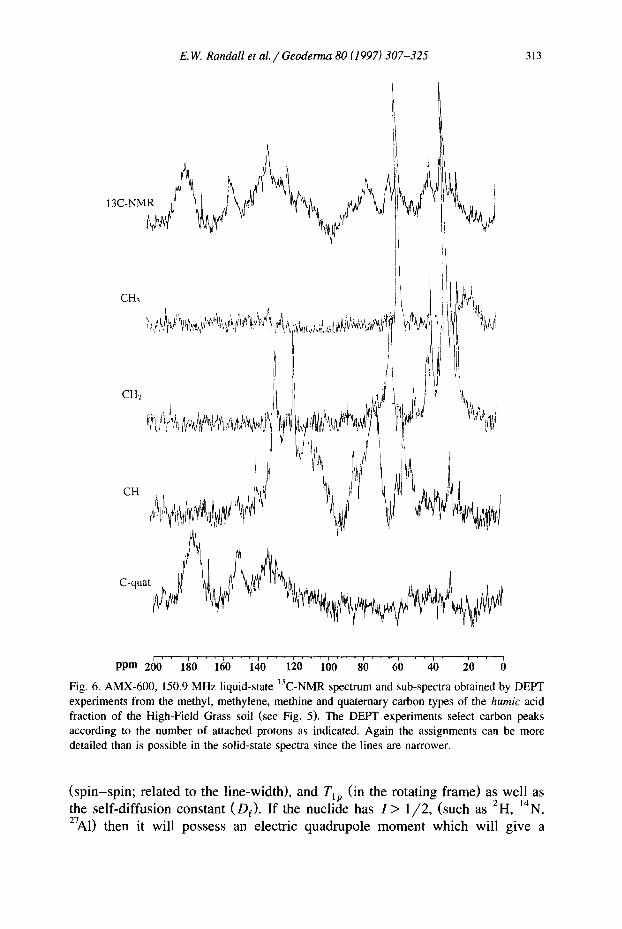
Fig. 6. AMX-600, 150.9 MHz liquid-state 13C-NMR spectrum and sub-spectra obtained by DEPT experiments from the methyl, methylene, methine and quaternary carbon types of the humic acid fraction of the High-Field Grass soil (see Fig. 5). The DEPT experiments select carbon peaks according to the number of attached protons as indicated. Again the assignments can be more detailed than is possible in the solid-state spectra since the lines are narrower.
( sp in - sp in ; related to the l ine-width), and T~p (in the rotat ing f rame) as well as the sel f -dif fusion constant (De). I f the nuclide has I > 1 / 2 , (such as 2H, IaN,
27A1) then it will possess an electric quadrupole m o m e n t which will give a
314 E.W. Randall et al. / Geoderma 80 (1997) 307-325
yl I
?
,i
! !' ;,!
13C-NMR l I'(iVll'} I, [i[! / h.[,,~;Ili,[, ' l l " ~ 4 , ' " l " ~ ] J Jl l~ ("~i~t~t'j~"~Jt'["' 2' t? I,r"
• ' ; ~ ~ l " ~ l ~ I I ~ ' ' " ' '"~ ) l ' , ! , i l l
CH2
CH
i i 'I ,['~'! ~'
['l
hll
Ji
C-quat ]l
r - - r i 1 4 i , i I ' L , , , i , , I , ~ , i i , , ,
ppm 200 180 ~ '160' 'I ':iO 120 160 8L0 ' 60 '40 2t0 6
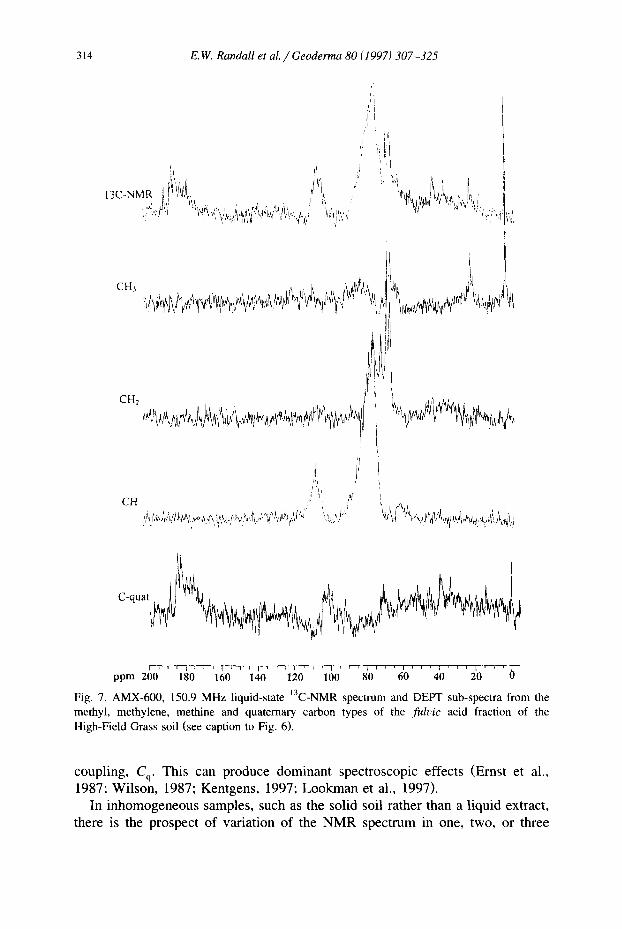
Fig. 7. AMX-600, 150.9 MHz liquid-state ]3C-NMR spectrum and DEPT sub-spectra from the methyl, methylene, methine and quaternary carbon types of the fulvic acid fraction of the High-Field Grass soil (see caption to Fig. 6).
coupling, Cq. This can produce dominant spectroscopic effects (Ernst et al., 1987; Wilson, 1987; Kentgens, 1997; Lookman et al., 1997).
In inhomogeneous samples, such as the solid soil rather than a liquid extract, there is the prospect of variation of the NMR spectrum in one, two, or three
E.W. Randall et al. / Geoderma 80 (1997) 307-325 315
l HBW I
ppm ! 0 iO0 ~0
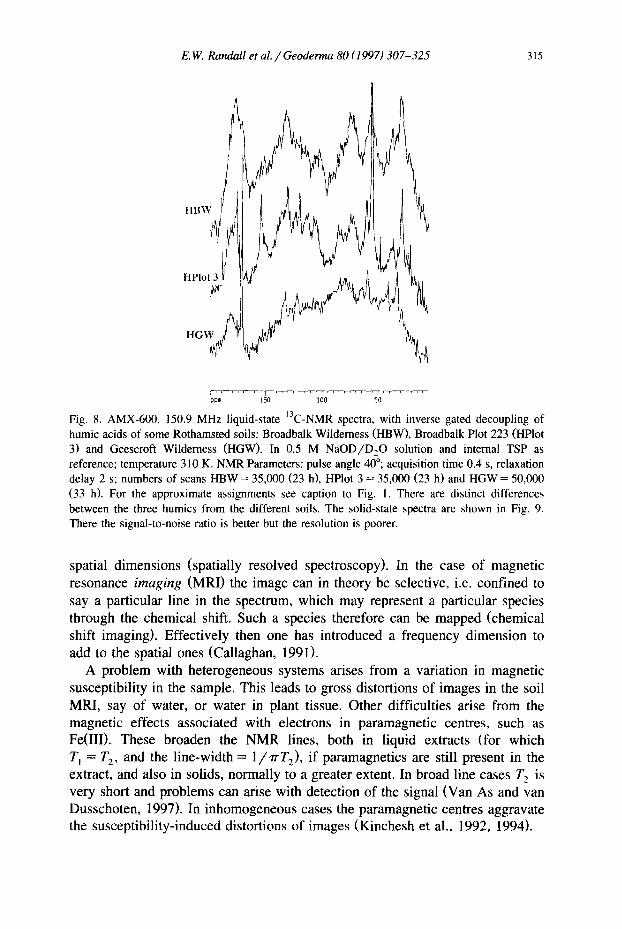
Fig. 8. AMX-600, 150.9 MHz liquid-state J3C-NMR spectra, with inverse gated decoupling of humic acids of some Rothamsted soils: Broadbalk Wilderness (HBW), Broadbalk Plot 223 (HPlot 3) and Geescroft Wilderness (HGW). In 0.5 M NaOD/D20 solution and internal TSP as reference; temperature 310 K. NMR Parameters: pulse angle 40°; acquisition time 0.4 s, relaxation delay 2 s; numbers of scans HBW = 35,000 (23 h), HPlot 3 = 35,000 (23 h) and HGW = 50,000 (33 h). For the approximate assignments see caption to Fig. 1. There are distinct differences between the three humics from the different soils. The solid-state spectra are shown in Fig. 9. There the signal-to-noise ratio is better but the resolution is poorer.
spatial dimensions (spatially resolved spectroscopy). In the case of magnetic resonance imaging (MRI) the image can in theory be selective, i.e. confined to say a particular line in the spectrum, which may represent a particular species through the chemical shift. Such a species therefore can be mapped (chemical shift imaging). Effectively then one has introduced a frequency dimension to add to the spatial ones (Callaghan, 1991).
A problem with heterogeneous systems arises from a variation in magnetic susceptibility in the sample. This leads to gross distortions of images in the soil MRI, say of water, or water in plant tissue. Other difficulties arise from the magnetic effects associated with electrons in paramagnetic centres, such as Fe(III). These broaden the NMR lines, both in liquid extracts (for which T~ = T 2, and the line-width = 1/~'T:), if paramagnetics are still present in the extract, and also in solids, normally to a greater extent. In broad line cases T 2 is very short and problems can arise with detection of the signal (Van As and van Dusschoten, 1997). In inhomogeneous cases the paramagnetic centres aggravate the susceptibility-induced distortions of images (Kinchesh et al., 1992, 1994).
316 E.W. Randall et al. / Geoderma 80 (1997) 307-325
HBW ~ :
J
/ HPIot 3 ,:
11 / Iu~ /
.,~k
\
\Jl.,
HGW "~I' ' \ ~ : '1
- , t ? ~ " ~ "l "~',:m.~,
pP~
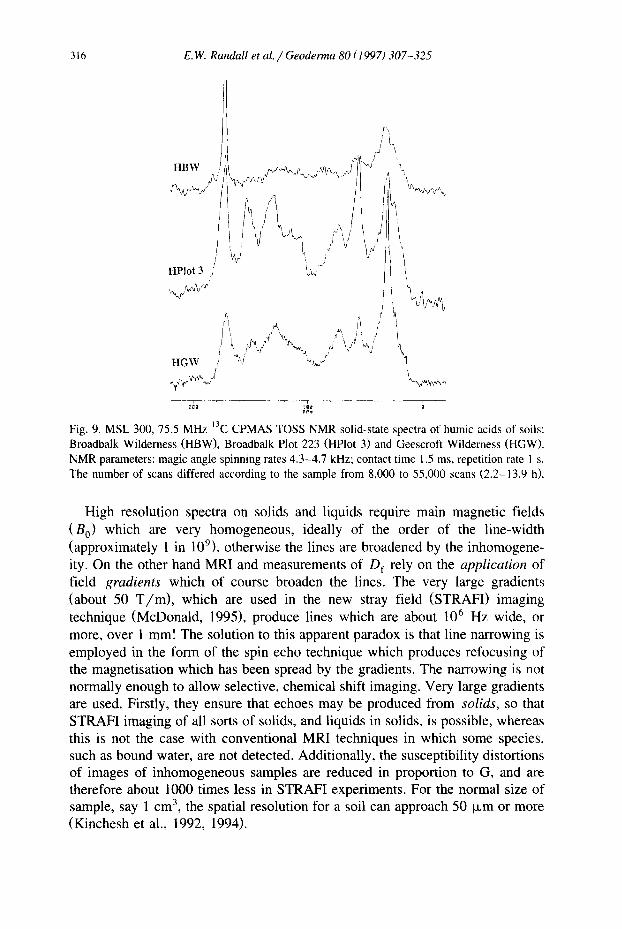
Fig. 9. MSL 300, 75.5 MHz 13C CPMAS TOSS NMR solid-state spectra of humic acids of soils: Broadbalk Wilderness (HBW), Broadbalk Plot 223 (HPlot 3) and Geescroft Wilderness (HGW). NMR parameters: magic angle spinning rates 4.3-4.7 kHz; contact time 1.5 ms, repetition rate 1 s. The number of scans differed according to the sample from 8,000 to 55,000 scans (2.2-13.9 h).
High resolution spectra on solids and liquids require main magnetic fields (B o) which are very homogeneous, ideally of the order of the line-width (approximately 1 in 109), otherwise the lines are broadened by the inhomogene- ity. On the other hand MRI and measurements of Df rely on the application of field gradients which of course broaden the lines. The very large gradients (about 50 T / m ) , which are used in the new stray field (STRAFI) imaging technique (McDonald, 1995), produce lines which are about 10 6 Hz wide, or more, over 1 ram! The solution to this apparent paradox is that line narrowing is employed in the form of the spin echo technique which produces refocusing of the magnetisation which has been spread by the gradients. The narrowing is not normally enough to allow selective, chemical shift imaging. Very large gradients are used. Firstly, they ensure that echoes may be produced from solids, so that STRAFI imaging of all sorts of solids, and liquids in solids, is possible, whereas this is not the case with conventional MRI techniques in which some species, such as bound water, are not detected. Additionally, the susceptibility distortions of images of inhomogeneous samples are reduced in proportion to G, and are therefore about 1000 times less in STRAF! experiments. For the normal size of sample, say 1 cm 3, the spatial resolution for a soil can approach 50 ~ m or more (Kinchesh et al., 1992, 1994).
E. W. Randall et al. / Geoderma 80 (1997) 307-325 317
, a o I B
,D @
O " 0
• ~1 I I t~ ",B
e p , -2
0 ~
Q ~ ~ o O "
q " • -3
o .
j ~e 2 ~ m °1~ o o O
Q'~ " D ?.
o , 0 , e . ° ~ a
pp•
ppm 4 3 2 t
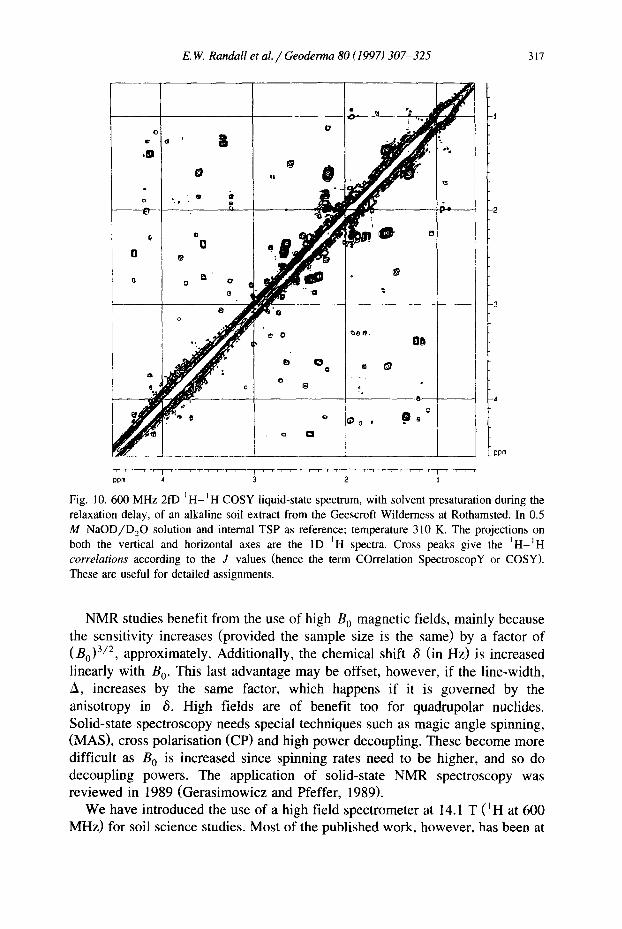
Fig. 10. 600 MHz 2fD IH-]H COSY liquid-state spectrum, with solvent presaturation during the relaxation delay, of an alkaline soil extract from the Geescroft Wilderness at Rothamsted. In 0.5 M NaOD/D20 solution and internal TSP as reference; temperature 310 K. The projections on both the vertical and horizontal axes are the ID ~H spectra. Cross peaks give the ~H-~H correlations according to the J values (hence the term COrrelation SpectroscopY or COSY). These are useful for detailed assignments.
NMR studies benefit from the use of high B 0 magnetic fields, mainly because the sensitivity increases (provided the sample size is the same) by a factor of (B0)3/2, approximately. Additionally, the chemical shift 6 (in Hz) is increased linearly with B 0. This last advantage may be offset, however, if the line-width, A, increases by the same factor, which happens if it is governed by the anisotropy in 6. High fields are of benefit too for quadrupolar nuclides. Solid-state spectroscopy needs special techniques such as magic angle spinning, (MAS), cross polarisation (CP) and high power decoupling. These become more difficult as B 0 is increased since spinning rates need to be higher, and so do decoupling powers. The application of solid-state NMR spectroscopy was reviewed in 1989 (Gerasimowicz and Pfeffer, 1989).
We have introduced the use of a high field spectrometer at 14.1 T (]H at 600 MHz) for soil science studies. Most of the published work, however, has been at
318 E.W. Randall et al. / Geoderma 80 (1997) 307-325
q
I I
'20
-40
.60
ppm
' " ' ' ' ' ' I . . . . . . ' ' ' 1 ' ' ' ' ' ' ' ' i ' l ' ' ' ' ' ' ' ' ' l ' ' ' '
ppm 4 3 2 1
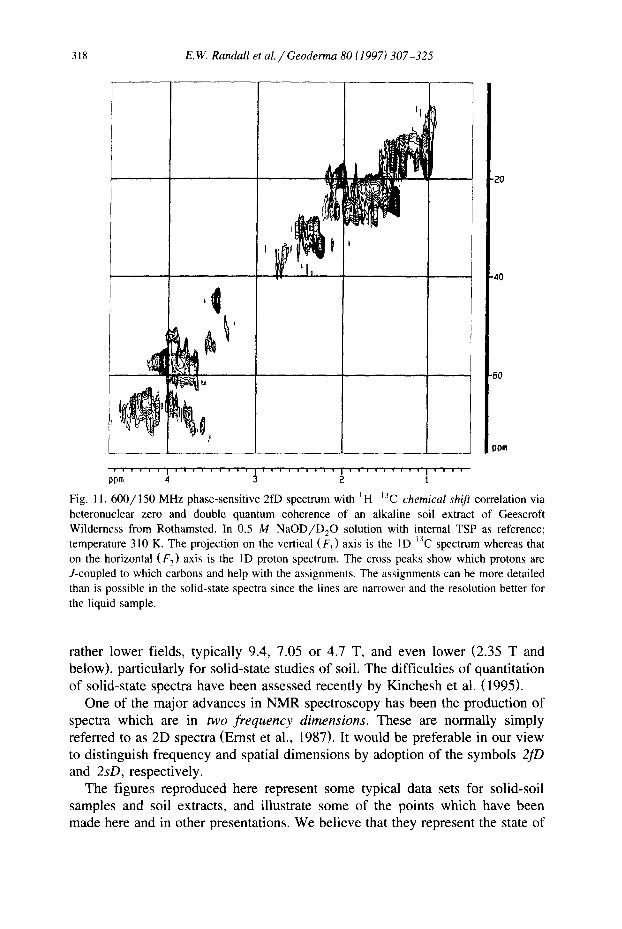
Fig. l 1,600/150 MHz phase-sensitive 2fD spectrum with I H - 1 3 C chemical shift correlation via heteronuclear zero and double quantum coherence of an alkaline soil extract of Geescroft Wilderness from Rothamsted. In 0.5 M NaOD/D20 solution with internal TSP as reference; temperature 310 K. The projection on the vertical (F~) axis is the ID t3C spectrum whereas that on the horizontal (F 2) axis is the 1D proton spectrum. The cross peaks show which protons are J-coupled to which carbons and help with the assignments. The assignments can be more detailed than is possible in the solid-state spectra since the lines are narrower and the resolution better for the liquid sample.
rather lower fields, typically 9.4, 7.05 or 4.7 T, and even lower (2.35 T and below), particularly for solid-state studies of soil. The difficulties of quantitation of solid-state spectra have been assessed recently by Kinchesh et al. (1995).
One of the major advances in NMR spectroscopy has been the production of spectra which are in two frequency dimensions. These are normally simply referred to as 2D spectra (Ernst et al., 1987). It would be preferable in our view to distinguish frequency and spatial dimensions by adoption of the symbols 2fD and 2sD, respectively.
The figures reproduced here represent some typical data sets for solid-soil samples and soil extracts, and illustrate some of the points which have been made here and in other presentations. We believe that they represent the state of
E.W. Randall et al. / Geoderma 80 (1997) 307-325 319
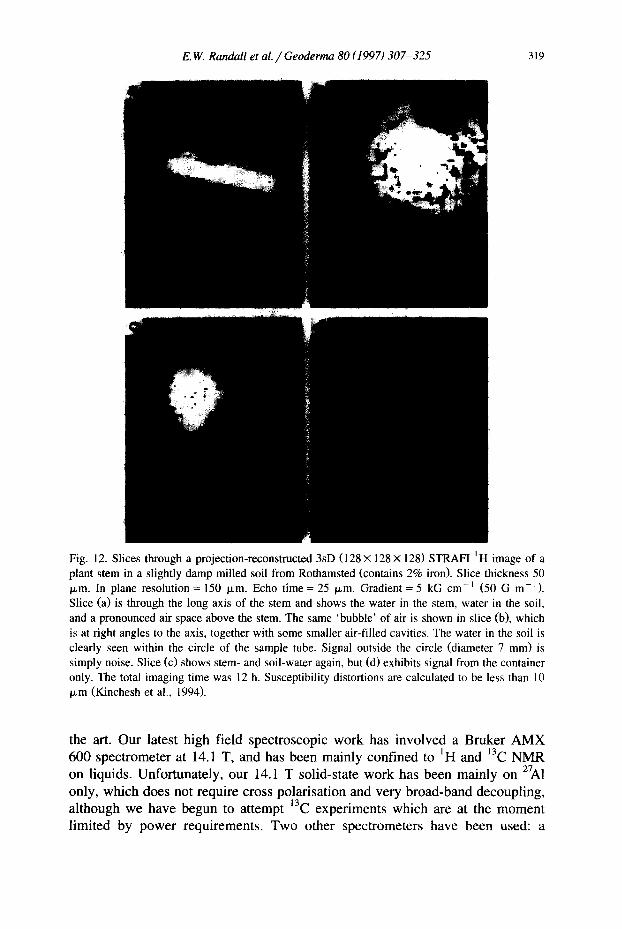
Fig. 12. Slices through a projection-reconstructed 3sD (128 X 128 X 128) STRAFI I H image of a plant stem in a slightly damp milled soil from Rothamsted (contains 2% iron). Slice thickness 50 t~m. In plane resolution = 150 I~m. Echo time= 25 p~m. Gradient = 5 kG cm -t (50 G m-J). Slice (a) is through the long axis of the stem and shows the water in the stem, water in the soil, and a pronounced air space above the stem. The same 'bubble' of air is shown in slice (b), which is at right angles to the axis, together with some smaller air-filled cavities. The water in the soil is clearly seen within the circle of the sample tube. Signal outside the circle (diameter 7 mm) is simply noise. Slice (c) shows stem- and soil-water again, but (d) exhibits signal from the container only. The total imaging time was 12 h. Susceptibility distortions are calculated to be less than l0 Ixm (Kinchesh et al., 1994).
the art. Ou r latest h igh field spec t roscopic w o r k has invo lved a Bruker A M X 600 spec t rometer at 14.1 T, and has been main ly conf ined to 1H and ~3C N M R
on liquids. Unfor tunate ly , our 14.1 T solid-state w o r k has been main ly on 27A1
only, wh ich does not require cross polar isat ion and very b road-band decoupl ing , a l though we have begun to a t tempt 13C exper iments which are at the m o m e n t
l imited by p o w e r requirements . T w o other spect rometers have been used: a
320 E. W. Randall et al. / Geoderma 80 (1997) 307-325
f <.. \
\
0 0
~ F 2 : I M H z l
0 "
' 6
% o /
0
<3
0
0 c> ,3
b ,
O
. 2 5
_ 2 0
(~_15
$
.10
~3 o . 5
0
0 " " 5 . . . . l b . . . . 1 5 . . . . 2 0 . . . . 2 g . . . . F1 :[MHz]
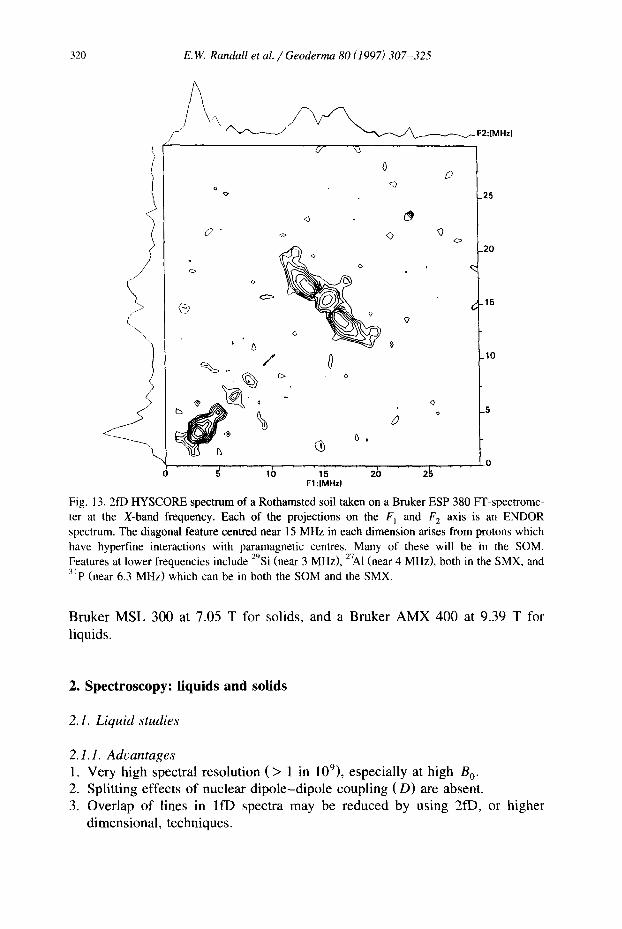
Fig. 13.2fD HYSCORE spectrum of a Rotharnsted soil taken on a Bruker ESP 380 FT-spectrome- ter at the X-band frequency. Each of the projections on the F 1 and F 2 axis is an ENDOR spectrum. The diagonal feature centred near 15 MHz in each dimension arises from protons which have hyperfine interactions with paramagnetic centres. Many of these will be in the SOM. Features at lower frequencies include 295i (near 3 MHz), 27A1 (near 4 MHz), both in the SMX, and 3tp (near 6.3 MHz) which can be in both the SOM and the SMX.
Bruker M S L 300 at 7.05 T for solids, and a Bruker A M X 400 at 9.39 T for
liquids.
2. Spectroscopy: liquids and solids
2.1. Liquid studies
2.1.1. Advantages 1. Very high spectral resolution ( > 1 in 109), especially at high B o. 2. Splitting effects of nuclear d ipo le -d ipo le coupling ( D ) are absent. 3. Overlap of lines in l fD spectra may be reduced by using 2fD, or higher
dimensional, techniques.
E. W. Randall et al. / Geoderma 80 (1997) 307-325 32 !
# ~ / ,
FI:{Ga
i
L3375
1
,.3370
.3365
3360
3355
3350
3345
~340 + 2 . 5 " 510 7. 5 1 0 " 0 * 1 ~ . 5 " 11"5~O" " 1 7 ~ " " " 2 0 ~ 0 r . ~
F2:[MHz]
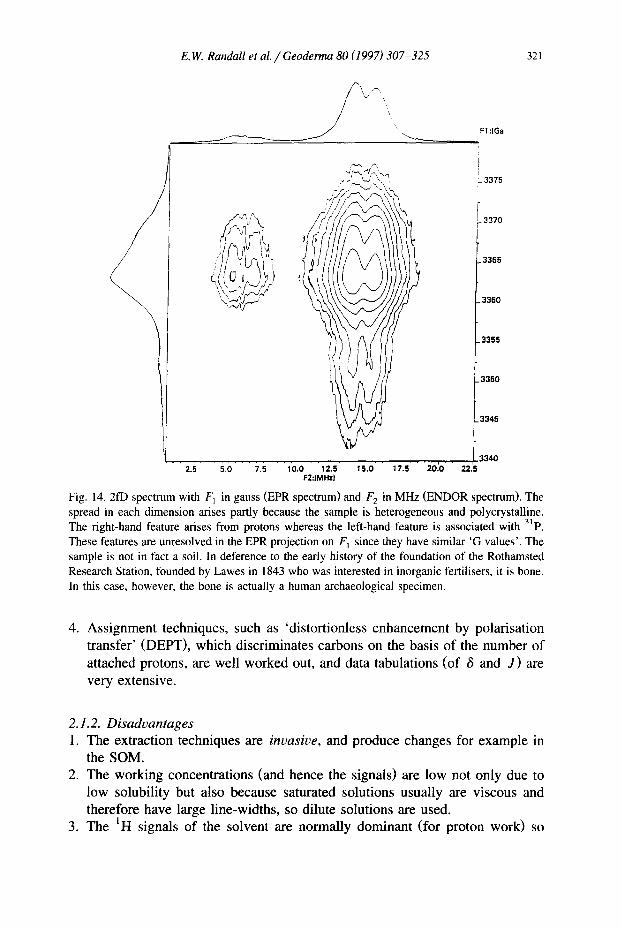
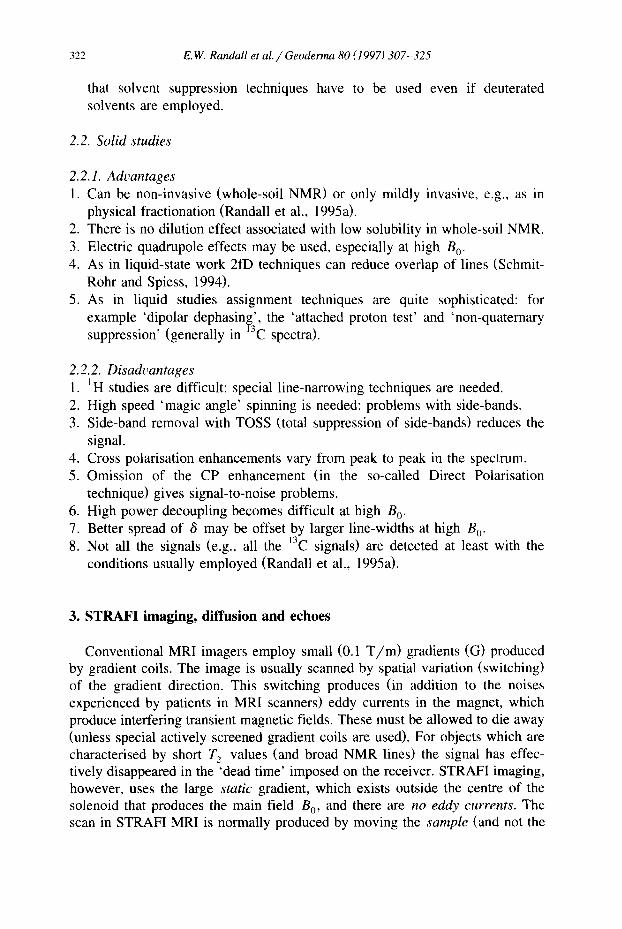
Fig. 14. 2fD spectrum with F] in gauss (EPR spectrum) and F 2 in MHz (ENDOR spectrum). The spread in each dimension arises partly because the sample is heterogeneous and polycrystalline. The right-hand feature arises from protons whereas the left-hand feature is associated with 3Jp. These features are unresolved in the EPR projection on F I since they have similar 'G values'. The sample is not in fact a soil. In deference to the early history of the foundation of the Rothamsted Research Station, founded by Lawes in 1843 who was interested in inorganic fertilisers, it is bone. In this case, however, the bone is actually a human archaeological specimen.
. Ass ignment techniques, such as 'distortionless enhancement by polarisation
transfer ' (DEPT), which discriminates carbons on the basis o f the number of
attached protons, are well worked out, and data tabulations (of 8 and J ) are very extensive.
2.1.2. Disadvantages
1. The extraction techniques are invasive, and produce changes for example in the SOM.
2. The working concentrations (and hence the signals) are low not only due to low solubility but also because saturated solutions usually are viscous and therefore have large line-widths, so dilute solutions are used.
3. The I H signals of the solvent are normal ly dominant (for proton work) so
322 E. W. Randall et al. / Geoderma 80 (1997) 307-325
that solvent suppression techniques have to be used even if deuterated solvents are employed.
2.2. Solid studies
2.2. I. Advantages 1. Can be non-invasive (whole-soil NMR) or only mildly invasive, e.g,, as in
physical fractionation (Randall et al., 1995a). 2. There is no dilution effect associated with low solubility in whole-soil NMR. 3. Electric quadrupole effects may be used, especially at high B 0. 4. As in liquid-state work 2fD techniques can reduce overlap of lines (Schmit-
Rohr and Spiess, 1994). 5. As in liquid studies assignment techniques are quite sophisticated: for
example 'dipolar dephasing', the 'attached proton test' and 'non-quaternary suppression' (generally in ~3C spectra).
2.2.2. Disadvantages 1. ~H studies are difficult: special line-narrowing techniques are needed. 2. High speed 'magic angle' spinning is needed: problems with side-bands. 3. Side-band removal with TOSS (total suppression of side-bands) reduces the
signal. 4. Cross polarisation enhancements vary from peak to peak in the spectrum. 5. Omission of the CP enhancement (in the so-called Direct Polarisation
technique) gives signal-to-noise problems. 6. High power decoupling becomes difficult at high B o, 7. Better spread of 6 may be offset by larger line-widths at high B 0. 8. Not all the signals (e.g., all the ~3C signals) are detected at least with the
conditions usually employed (Randall et al., 1995a).
3. STRAFI imaging, diffusion and echoes
Conventional MRI imagers employ small (0.1 T/m) gradients (G) produced by gradient coils. The image is usually scanned by spatial variation (switching) of the gradient direction. This switching produces (in addition to the noises experienced by patients in MRI scanners) eddy currents in the magnet, which produce interfering transient magnetic fields. These must be allowed to die away (unless special actively screened gradient coils are used). For objects which are characterised by short T 2 values (and broad NMR lines) the signal has effec- tively disappeared in the 'dead time' imposed on the receiver. STRAFI imaging, however, uses the large static gradient, which exists outside the centre of the solenoid that produces the main field B 0' and there are no eddy currents. The scan in STRAFI MRI is normally produced by moving the sample (and not the
E. W. Randall et al. / Geoderma 80 (1997) 307-325 323
gradient). An alternative is to Fourier-transform (FT) the signals just as in modern pulse NMR spectroscopy. However, because of the large bandwidths, the excited region of the sample is small and the STRAFI FT method is suitable only for thin films and therefore is not of great benefit for soil studies, except possibly for work on adsorption.
The very large gradients in the stray field mean that the spatial resolution is increased (it is proportional to G). Moreover the size of G ensures that its effect is larger than the effects of D, Cq, and paramagnetism, so that Hahn echoes may be produced, and may be used for imaging or for measurements of diffusion, Df (STRAFID).
Thus: 1. Distortions produced by the magnetic susceptibility effect are greatly reduced
(Kinchesh et al., 1992, 1994). 2. Paramagnetic centres do not interfere (at least at ambient temperatures).
Indeed water b o u n d to metals in paramagnetic states may be imaged (for the first time by MRI). Moreover 'free' and 'bound' water may be discr iminated
by relaxation weighting of the images, i.e., each may be mapped separately (Randall et al., 1995b).
3. Nuclides with electric quadrupoles (ll B, 23Na, 27A1) are accessible by MRI in the solid phase for the first time, and STRAFI echoes constitute a new method for the measurement of electric quadrupole coupling constants in solids (Bodart et al., 1996). This should prove to be useful in the study of the SMX. There are disadvantages, of course, because of the large bandwidth:
1. The signal-to-noise ratio is poor, and the observation of 3sD images, even of protons, requires very long acquisition times.
2. Because the gradients are large, not only is the chemical shift information lost but even different nuclides, which have similar resonance frequencies, may not be differentiated (except possibly by relaxation weighting).
4. ENDOR (Electron Nuclear DOuble Resonance)
ENDOR spectra show spectral absorption as a function of nuclear frequency, and therefore are true NMR spectra. Detection of the NMR transitions, though, is by double resonance and observation of changes in the electron spin reso- nance (ESR) spectra. Therefore ENDOR work is normally discussed in ESR articles.
In ENDOR spectra the nuclear transitions are confined to species which are paramagnetic, and all other NMR signals from diamagnetic species are filtered out. If it is established that paramagnetic species play a special role in any processes of interest to the soil scientist then ENDOR techniques will become
324 E.W. Randall et al. / Geoderma 80 (1997) 307-325
important for soil studies, alongside the conventional NMR and ESR methods. The ESR of soils is a topic in its own right (Senesi, 1990) for SOM and SMX.
Most ENDOR work until now has been confined to continuous wave methodology but recently pulse techniques have become available (Schweiger, 1991). Just as the introduction of pulse methods resulted in 2fD techniques which revolutionised NMR work, so also now EPR 2fD could do the same for the EPR of soils, Particularly interesting for soils is the HYSCORE technique (HSfer, 1994) in which each dimension is an ENDOR frequency. It is also possible to have the ENDOR spectrum in only one dimension and the EPR spectrum in the other. Features in the later can then be assigned by reference to the nuclear frequency.
Acknowledgements
We are very grateful to Professor D.S. Powlson for collaboration under Grant PO 1333 from the United Kingdom Biotechnology and Biological Sciences Research Council. We thank the Royal Society of Chemistry for a Fellowship for Dr. G.I. Ivanova. The NMR spectroscopic instrumentation was provided by the University of London Intercollegiate Research Scheme and is located at Queen Mary and Westfield College (Bruker AMX 600), King's College (Bruker AMX 400), and University College (Bruker MSL 300). We thank Drs. H.C. Toms, J.E. Hawkes, and A.E. Aliev, respectively, for their help on these instruments. We also thank Prof. D.S. Powlson and Dr. D.C. Olk for the soil samples. For the STRAFI work, we are grateful to Dr. K. Zick at Bruker Analytische Messtechnik in Rheinstetten, Dr. T. Nunes at ICTPOL, Lisbon, and Dr. P.J. McDonald and the Surrey consortium, which is supported by Grant No. G R / K 12397 from the United Kingdom Engineering and Physical Sciences Research Council. Lastly the pulsed EPR work was carried out with Dr. P. HSfer at Bruker Analytische Messtechnik and we are very grateful to him for his expertise, and to Bruker for their hospitality.
References
Bodart, P., Nunes, T., Randall, E.W., 1996. Stray-field experiments on quadrupolar nuclei. Proc. 28th Congress Ampere. University of Kent, Canterbury, pp. 467-468.
Callaghan, P.T., 1991. Principles of Nuclear Magnetic Resonance Microscopy. Clarendon Press, Oxford.
Ernst, R.R., Bodenhausen, G., Wokaun, A., 1987. Principles of Nuclear Magnetic Resonance in One and Two Dimensions. Clarendon Press, Oxford.
Gerasimowicz, W.V., Pfeffer, P.E., 1989. Introduction to Solid-State NMR Spectroscopy and Its Application to The Study of Soils and Related Systems. NMR in Agriculture. CRC Press, Baton Rouge, FL.
E. W. Randall et al. / Geoderma 80 (1997) 307-325 325
Hi3fer, P., 1994. Distortion-free electron-spin-echo envelope-modulation of disordered solids obtained by two- and three-dimensional HYSCORE experiments. J, Magn. Reson. A 111, 77-86.
Kentgens, A.P.M., 1997. A practical guide to solid-state NMR of half-integer quadrupolar nuclei with some applications to disordered systems. Geoderma 80 (3/4) 271-306, this issue.
Kinchesh, P., Randall, E.W., Zick, K., 1992. The elimination of magnetic susceptibility distortions in the imaging of liquids in solids: the stray field imaging technique. J. Magn. Reson. 100, 411-415.
Kinchesh, P., Randall, E.W., Zick, K., 1994. Magnetic susceptibility effects in imaging: distortion free images of plant tissue in soil. Magn. Reson. Imaging 12, 305-307.
Kinchesh, P., Powlson, D.S., Randall, E.W., 1995. 13C NMR studies of organic matter in whole soils, 1. Quantitation possibilities. Eur. J. Soil Sci. 46, 125-137.
Ki3gel-Knabner, I., 1997. ~3C and JSN NMR as a tool in soil organic matter studies. In: Hemminga, M.A., Buurman, P. (Eds.), NMR in Soil Science. Geoderma 80 (3/4), 243-270, this issue.
Lookman, R., Grobet, P., Merckx, R., Van Riemsdijk, W., 1997. Application of 31p and 27A1 MAS NMR for phosphate speciation studies in soil and aluminium hydroxides: promises and constraints. Geoderma 80 (3/4) 369-388, this issue.
McDonald, P.J., 1995. Stray field magnetic resonance imaging: a powerful technique for the quantitative, high resolution imaging of solids. Spectrosc. Eur. 7 (6), 25-30.
Preston, C.M., 1996. Applications of NMR to soil organic matter analysis: history and prospects. Soil Sci. 161, 144-166.
Randall, E.W., Mahieu, N., Powlson, D.S., Christensen, B.T., 1995a. Fertilization effects on organic matter in physically fractionated soils as studied by ~3C NMR: Results from two long-term field experiments. Eur. J. Soil Sci. 46, 557-565.
Randall, E.W., Samoilenko, A.A., Nunes, T., 1995b. NMR imaging of paramagnetic solids in the high field gradient approximation with the STRAFI method. J. Magn. Reson. A. 116, 122-124.
Schmit-Rohr, K., Spiess, H.W., 1994. Multidimensional Solid State NMR and Polymers. Aca- demic Press, London.
Schweiger, A., 1991. Pulsed electron spin resonance spectroscopy: basic principles, techniques, and examples of applications. Angew. Chem., Int. Ed. Engl. 30, 265-292.
Senesi, N., 1990. Application of electron spin resonance (esr) spectroscopy in soil chemistry. Adv. Soil Sci. 14, 77-130.
Van As, H., van Dusschoten, D., 1997. NMR imaging of transport processes in micro-porous systems. In: Hemminga, M.A., Buurman, P. (Eds.), NMR in Soil Science. Geoderma 80 (3/4), 389-403, this issue.
Veeman, W.S., 1997. NMR for the investigation of solid matter. In: Hemminga, M.A., Buurman, P. (Eds.), NMR in Soil Science. Geoderma 80 (3/4), 225-242, this issue.
Wilson, M.A., 1987. NMR Techniques and Applications in Geochemistry and Soil Chemistry. Pergamon Press, Oxford.