nmr structural characterization of beta-amyloid peptides ... · in der vorliegenden arbeit wurde...
TRANSCRIPT

Department Chemie der Technischen Universität München
NMR structural characterization of beta-amyloid peptides
and their inhibitors
Zhongjing Chen
Vollständiger Abdruck der von der Fakultät für Chemie der Technischen Universität München zur Erlangung des akademischen Grades eines
Doktors der Naturwissenschaften
genehmigten Dissertation. Vorsitzender: Univ.-Prof. Dr. St. J. Glaser Prüfer der Dissertation: 1. Univ.-Prof. Dr. H. Kessler
2. Univ.-Prof. Dr. B. Reif Humboldt Universität Berlin 3. Univ.-Prof. Dr. S. Weinkauf
Die Dissertation wurde am 21.10.2004 bei der Technischen Universität München eingereicht und durch die Fakultät für Chemie am 24.11.2004 angenommen.

dedicated to my family

Acknowledgement
First of all I would like to thank Prof. Dr. Bernd Reif for giving me the opportunity to finish
my PhD work in his group. His scientific insights, supports and his numerous discussions on
these projects and my thesis writing are especially valuable for the implement of this work.
His always-ready-to-help attitude facilitated my work very much. I thank him for his
continuous interest in my work, for his constant assistance of my scientific work.
I am very grateful to Prof. Dr. Horst Kessler for providing a wonderful work atmosphere and
supervision of my project in TUM. From October 2000 to March 2003, part of work for this
PhD thesis has been carried out in the working group of Prof. Dr. Horst Kessler at the “Institut
für Organische Chemie und Biochemie der Technischen Universität München”, under
subgroup of Prof. Dr. Bernd Reif. There I started my first peptide synthesis and purification,
and also had the possibility to use the high field NMR (specially 900 MHz) spectrometers. I
very much enjoyed the great scientific freedom, excellent working conditions, and the
inspiring, and amicable atmosphere at the institute. I would like to thank all my colleagues in
the working group of Professor Kessler, especially:
• Martin Sukopp, for introducing peptide synthesis and helping me resolve many synthetic
problems,
• Georgette Thumshirn, for helping me with HPLC problems,
• Angelika Kühlewein for introducing me the Circular Dichroism experiments,
• Mona Wolff, for ordering the chemicals,
• Dr. Rainer Haeßner for his support of NMR, hardware and software problems,
• Dr. Gerd Gemmecker for providing me ample NMR measurement time,
• Burghard Cordes and Dr. W. Spahl for recording MS-spectra,
• Evelyn Bruckmaier and Marianne Machule for secretarial assistance,
• the “NCE” members, Michael John, Melina Haupt, Markus Heller, Dr. Murray Coles, Vincent Truffault, • And all mentioned and unmentioned co-workers.
I would like also to thank Prof. Dr. Weinkauf in TUM for her kind helping to make Electron
Microscopy experiments.

From March 2003 to October 2004, the rest of work for this thesis has been carried out in the
working group of Prof. Dr. Bernd Reif at the Forschungsinstitut für Molekulare
Pharmakologie. I would like to thank the colleagues in FMP:
• Prof. Dr. H. Oschkinat for the NMR-facilities at FMP-Berlin,
• Dr. Peter Schmiedt for NMR measurement time arrangement,
• Dr. Krause for Molecular Dynamics,
• Dr. Ronald for introducing the CNSsolve program,
• Dr. Beyermann for his kindness of allowing me using the wonderful peptide chemistry lab,
• Dr. Lorenz and Martina Ringling for performing the EM experiments,
• Frau Lerch for performing ESI Mass spectra.
Many thanks to Saravanakumar Narayanan for numerous discussions about my projects, to
Veniamin Chevelkov and Maggy Hologne for helping me with solid-state NMR experiments.
I also would like to thank Dr. Johannes Winkler for his insightful comments on this
manuscript.
All this contributed to the success of this work.
I would like to thank all my friends in München, Hannover and Berlin for their support and
friendship.
Special thanks to my parents who give me endlessly love and encouragement. Many thanks to
my sisters: Shuhua, thank you for helping me solve many problems in the life, especially after
I came to Germany; to Zhongzhou, who always cheers me up throughout the time and shares
me with her happiness. Also, I would like to thank my husband, Ling Zhou, for his love,
supports and understanding throughout the years. Their love has been the best support for me
to finish my doctoral study in Germany.

Parts of this thesis have been or will be published in due course:
1. Zhongjing chen and Bernd Reif (2004), Measurements of residual dipolar couplings
in peptide inhibitors weakly aligned by transient binding to peptide amyloid fibrils.
Journal of Biomolecular NMR, 29 (4): 525-530.
2. Veniamin Chevelkov, Zhongjing Chen, Wolfgang Bermel, Bernd Reif (2004),
Resolution enhancement in MAS solid-state NMR by application of 13C homonuclear
scalar decoupling during acquisition. Journal of Magnetic Resonance. (In press)
3. Zhongjing Chen, Gerd Krause and Bernd Reif, Structural studies of peptide inhibitors
bound to β-Amyloid fibrils. (Manuscript prepared for the Submission to Journal of
Molecular Biology)

Abstract
Polymerization of the soluble β−amyloid peptide into highly ordered fibrils is
hypothesized to be a causative event in the development of Alzheimer’s Disease. Structural
information of β−amyloid fibril formation is fundamental for the development of diagnostics
and therapeutic approaches, and in addition might be valuable for elucidating fundamental
mechanisms of protein folding and assembly. Study of interactions of Aβ with inhibitors can
provide important indirect information of the amyloid fibril structure.
In this work, the structure of peptide inhibitors to Aβ fibril formation is studied with the aid of
synthetic peptides and NMR spectroscopy, as well as Electron Microscopy and Circular
Dichroism Spectroscopy. The short fragment of the β-amyloid peptide Aβ14-23 and its peptide
inhibitors iAβ5 (LPFFD) and iAβ5inv (DPFFL) are synthesized manually with and without 19F-, 13C- and 15N-labelling using standard Fmoc peptide synthesis protocols. Distance
restraints for peptide inhibitors in the bound state are obtained on the basis of trNOE
intensities and are used for structural calculations using the CNSsolve program. The
orientation of the peptide inhibitors relative to Aβ is further investigated using trRDC
techniques. In a final step, NOE-derived NMR structures of iAβ5 and iAβ5inv are docked
manually to the published structural models of fibrillar Aβ14-23 and Aβ1-40, respectively, and
the models of the complex are refined with experimental trRDC data. The model provides a
structural basis for understanding the inhibitory effect of iAβ5 or iAβ5inv during fibril
formation and gives hints to better understand the fibril disassembly process. Our findings
provide a basis for further in vitro modeling of amyloid fibril assembly, structure, and
possibly also disruption of such assemblies. We believe our structural data will contribute to
an improved understanding of the mechanisms of amyloid formation and to the development
of therapeutic agents for amyloid diseases.
Moreover, structure of amyloid fibrils formed from de novo designed amyloid peptides
is investigated by solid-state NMR. With the aid of isotopic labelling, complete 13C and 15N
assignments for STVIIE fibrils are obtained from by 2D 13C-13C and 13C-15N correlation
experiments. PDSD experiments provide information about peptide packing in the fibrils.
Primary assignments of the 1D 13C spectra for STVIIT and STVIYE fibrils are obtained. The
comparison of the chemical shifts shows that the one amino acid substitution causes the larger 13C chemical shift changes on the neighbouring residues which could explain the different
morphology observed for these fibrils.

Zusammenfassung
Nach heutigem Stand der Wissenschaft ist die Polymerisierung des löslichen
β−Αmyloid-Peptids in hoch geordnete Fibrillen ein ursächliches Ereignis bei der Entstehung
von Alzheimerischen Krankheit. Für die Entwicklung von diagnostischen und therapeutischen
Methoden ist die Kenntnis der Strukturen der β−Amyloid-Peptidfibrillen essenziell und kann
potenziell auch zu neuen Grundlagenkenntnissen auf dem Gebiet der Proteinfaltung und
Assemblierung von Protein Komplexen führen. Untersuchungen struktureller
Wechselwirkungen zwischen Aβ und Inhibitoren der Fibrillenbildung können indirekt
wichtige Erkenntnisse zu den Bildungsmechanismen von Amyloidfibrillen liefern.
In der vorliegenden Arbeit wurde die Struktur von Peptidinhibitoren der Aβ-Fibrillenbildung
mit Hilfe von synthetischen Peptiden und NMR-Spektroskopie, Elektronenmikroskopie und
CD-Spektroskopie untersucht. Ein kurzes Fragment des β−Αmyloid-Peptids Aβ14-23 und die
Peptidinhibitoren iAβ5 (LPFFD) und iAβ5inv (DPFFL) wurden sowohl mit als auch ohne 19F-, 13C- and 15N-Markierung auf Grundlage von Standard-Fmoc-Protokollen manuell
synthetisiert. Entfernungs-Restraints wurden auf der Grundlage der NOE-Intensitäten
berechnet und für strukturelle Berechnungen mit Hilfe des Programms CNSsolve verwendet.
Die räumliche Orientierung der Peptidinhibitoren relativ zur Aβ−Fibrille wurde mittels
trRDC-Methoden genauer untersucht. In einem letzten Schritt wurden die NOE-berechneten
NMR-Strukturmodelle von iAβ5 und iAβ5inv manuell an bekannte Strukturmodelle der Aβ14-
23- und Aβ1-40-Fibrillen angelagert, und die Modelle dieses Komplexes wurden mit
experimentellen trRDC-Daten verfeinert. Aus den Dockingmodellen dieses Komplexes
wurden die Bindungsstellen von iAβ5 und iAβ5inv ermittelt. Aus den vorliegenden
Ergebnissen schlussfolgern wir, dass iAβ5 und iAβ5inv Aβ-Fibrillen durch Bindung an die für
die Fibrillenbildung essenziellen Bereiche auflösen kann. Die Inhibitoren können somit zur
Disaggregation von Fibrillen führen. Unsere Ergebnisse bilden eine Grundlage für
weitergehende in vitro Modellierungen der Amyloidfibrillenbildung, der Amyloidstruktur und
möglicherweise der Auflösung dieser Fibrillen. Unsere Strukturdaten können zu einem
besseren Verständnis der Mechanismen der Amyloidfibrillenbildung und zur Entwicklung
von Therapien für Amyloiderkrankungen beitragen.
Darüber hinaus wurde mittels Solid-State-NMR die Strukturen von Amyloidfibrillen
untersucht, die von de novo-entworfenen Amyloidpeptiden gebildet werden. Mit Hilfe von
Isotopenmarkierung wurden 13C- und 15N-Zuordnungen für STVIIE-gebildete Fibrillen durch
2D 13C-13C und 13C-15N Korrelationsexperimente ermittelt. PDSD Experimente liefern

Informationen über die Packung der Amyloid-Peptide relativ zueinander. Weiterhin konnten
eine vorläufige Zuordnung der 13C chemischen Verschiebungen von STVIIT und STVIYE
erhalten werden. Ein Vergleich der chemischen Verschiebungen in Bezug auf STVIIE zeigt,
dass Substitution einer Aminsäure zu großen Änderungen führt, die die unterschiedliche
Morphologien dieser Fibrillen erklären kann.
INDEX
Contents
1.0 Introduction 1 1.1 Alzheimer’s Disease 2 1.2 Structural studies on Aβ 5
1.2.1 The structure of Aβ in solution 6 1.2.2 The structure of β-amyloid fibrils 10
1.3 Inhibition and reversion of Aβ amyloidogenesis as a therapeutic amyloid-related target for AD
14
1.4 Peptides synthesis 17 1.5 Structural studies by Electron Microscopy 22 1.6 Structural studies by Circular Dichroism 24 1.7 Structural studies by Liquid State NMR Spectroscopy 25
1.7.1 Theory of NMR spectroscopy 26 1.7.2 Structural studies on proteins by solution NMR 30
1.8 Structural Studies by Solid-state NMR Spectroscopy 33 1.8.1 Theory of solid-state NMR spectroscopy 33 1.8.2 Basic solid-state NMR techniques 36
1.9 Overview of this thesis 41 References 42 2.0 Materials and Methods 51
2.1 Instruments 51 2.2 Materials 52
2.2.1 Chemicals 52 2.2.2 Labelled Fmoc Amino Acids 52
2.3 peptide synthesis 53 2.4 Fibrillization of β-amyloid 64 2.5 Electron Microscopy 65 2.6 Circular Dichroism 65 2.7 Thioflavine T Fluorescence Assay 66 2.8 Solution NMR 66 2.9 Solid-state NMR 72 2.10 Structure calculation 73 2.11 Determination of peptide alignment tensor 74 2.12 Molecular Modeling 75
References 76 3.0 Results and Discussion 77
3.1 Peptide synthesis and purification 77 3.2 Aβ14-23 forms similar fibrils as Aβ1-40 as observed by Electron
Microscopy 78
3.3 Effect of peptide inhibitor iAβ5/iAβ5inv on Aβ fibril formation as observed by EM
79
3.4 Aβ secondary structure studies by CD Spectroscopy 82 3.5 The influence of LPFFD on the ThT binding of Aβ14-23 85 3.6 The assignment of iAβ5/iAβ5inv in the NMR spectra 86

INDEX
3.7 Binding of iAβ/iAβ5inv to Aβ peptides studied by solution NMR 92 3.8 Structural studies by trNOE experiments 93 3.9 Structural calculation of iAβ5 bound to Aβ14-23 98
3.10 Measurement of residual dipolar couplings in peptide inhibitors bound to Aβ fibrils
99
3.10.1 Alignment of amyloid fibrils 100 3.10.2 Measurement of RDCs for iAβ5inv bound to Aβ fibrils using
amyloid fibrils as orienting medium 102
3.10.3 Measurement of RDCs for KLVFFKK bound to Aβ fibrils using amyloid fibrils as orienting medium
107
3.11 Order tensor determination for iAβ5inv bound to Aβ fibrils 109 3.12 Validation of NOE-derived structures for iAβ5inv by RDCs 115 3.13 The docking model of iAβ5/ iAβ5inv bound to Aβ fibrils 116 3.14 Structural studies of Aβ14-23 by 19F NMR 120 3.15 Structural studies of de novo designed peptide-based amyloid
fibrils by solid state NMR 124
References 130 4.0 Summary 135
5.0 Appendix 137

Abbreviations
Abbreviations for amino acids follow the rules of the IUPAC-IUB Commission of
Biochemical Nomenclature in J. Biol. Chem. (1972) 247, 977-983. Additional abbreviations:
Aβ β−Amyloid
AβPP β−Αmyloid Precursor Protein
ACN Acetonitrile
AD Alzheimer’s Diesease
BSE Bovine Spongiform Encephalopathy
CD Circular Dichroism
COSY Correlation Spectroscopy
CR Congo Red
DCM Dichloromethane
DIPEA Diisopropylethylamine
DMF Dimethylformamide
EM Electron Microscopy
Fmoc 9-Fluorenylmethoxycarbonyl
Fmoc-ONSu (N-Fluorenylmethoxycarbonyloxy)-N-succinimid
HFIP Hexafluoroisopropanol
HOBt 1-Hydroxybenzotriazole
HSQC Heteronuclear Single Quantum Coherence
MeOH Methanol
mg Milligram
MS Mass Spectrometry
MW Molecular weight
MHz Megahertz
µM Micromolar
µmol Micromol
nm Nanometer
nM Nanomolar
NMP N-Methylpyrrolidinone
NMR Nuclear Magnetic Resonance
NOE Nuclear Overhauser Enhancement
NOESY Nuclear Overhauser Enhancement Spectroscopy
ppm parts per million

ROESY Rotating frame Overhauser Enhancement Spectroscopy
RP-HPLC Reversed-Phase High Performance Liquid Chromatography
RMSD root mean square deviation
sAβ Soluble β-amyloid
SPPS Solid Phase Peptide Synthesis
TFA Trifluoroacetic acid
TBTU O-(1H-Benzotriazol-1-yl)-N,N,N´,N´,-tetramethyluronium Hexafluorophosphate
TCP Tritylchlorid-Polystyrol-resin
THF Tetrahydrofuran
TIPS Triisopropylsilane
TOCSY Total Correlation Spectroscopy
UV Ultraviolet

INTRODUCTION
- 1 -
1 Introduction
Amyloidoses are protein deposition diseases, of which the more well known are Alzheimer’s
disease, Huntington’s disease, Bovine Spongiform Encephalopathy (BSE), familial amyloid
polyneuropathy (FAP) and Parkinson’s disease (1-7). Extensive studies from three diverse
disciplines, neuropathology, genetics, and biophysics show that all of these amyloid diseases
are characterized by insoluble assemblies, amyloid deposits, containing extremely insoluble
protein fibrils that share similar morphological features (80- to 150-Å fibrils) but comprise
many different proteins with no obvious sequence similarity (see Table 1-1) (8-20). However,
the pathogenesis of these neurodegenerative diseases remains unclear, and effective therapies
are currently unavailable. Theoretical and experimental data from many laboratories
worldwide support the amyloid hypothesis which suggests that the process of amyloid fibril
formation as the cause of well over a hundred distinct amyloid diseases, maladies associated
with the aberrant self-assembly of any one of twenty non-homologous human
proteins/peptides (6, 21-26). Additional interest in amyloid deposits comes from another
discipline: structural biology. Despite large differences in the size, native structure and
function, many proteins or peptides form amyloid fibrils of remarkably similar morphology
and properties (6, 17, 27-31), including some de novo-designed peptides (28, 32-35). One of
the defining features of all amyloid deposits is their ability to display positive apple green
birefringence under polarized light after binding amyloidophilic dyes such as Congo red (19,
36-39). Electron Microscopic examination of amyloid fibrils revealed fibrils are 5-10 nm in
width and of indefinite length (31, 40-42). X-ray diffraction analysis revealed a so called
cross-b diffraction pattern (43-48), showing that the fibrils ordered in the beta pleated sheet
conformation, with the direction of the polypeptide backbone perpendicular to the fibrils’
axis. The similar characteristic structures of amyloid suggest that the key elements of the fibril
formation process may be common to all proteins involved. It follows that inhibition of fibril
formation could be a viable therapeutic strategy for all amyloidosis. However, the underlying
processes that lead to the polymerization of normally soluble proteins and peptides into
aggregation in these diseases are poorly understood (17, 49), which complicates the right
therapeutic targets for treating amyloid diseases. Therefore, it is critical to understand the
mechanisms of these process at a molecular level. A proper system could offer insights into
the molecular details of amyloid fibril formation in an easy way. Amyloidogenic peptide
fragments of the Alzheimer’s amyloid peptide βA4 are an excellent model system for such
research for several reasons (50): The aggregating species, Aβ, are readily available (51); both

INTRODUCTION
- 2 -
in vitro and in vivo model systems for toxicity of the aggregates have been developed (52,
53); considerable structural data have been collected on this system (41, 46, 49, 54-65). These
features render Aβ an excellent test system for evaluating general strategies for altering
protein aggregation.
Table 1-1 List of some amyloidogenesis and their related proteins
Diseases Involved proteins Alzheimer’s Disease Amyloid β-protein Parkinson’s disease α-Synuclein Creutzfeldt–Jakob disease Prion protein Huntington’s disease Huntingtin Familial Amyloid Polyneuropathy Transthyretin Diabetes type 2 Amylin Amyotrophic lateral sclerosis (ALS) Superoxide dismutase (SOD) Haemodialysis-related amyloidosis β2-Microglobulin Reactive amyloidosis Amyloid-A Cystic fibrosis CFTR protein Sickle cell anemia Hemoglobin
1.1 Alzheimer’S Disease (AD)
ALZHEIMER’S DISEASE (AD) is a progressive, neurodegenerative disease characterized by
loss of function and death of nerve cells in several areas of the brain, leading to loss of mental
functions such as memory and learning (25, 66-75). It is the most common cause of dementia
among people age 65 and older (10). AD has two abnormal structures in the brain as its main
characteristics: amyloid plaques and neurofibrillary tangles (9, 76, 77). Plaques are dense,
largely insoluble deposits of protein and cellular material outside and around the brain's
neurons. Tangles are insoluble twisted fibrils that build up inside neurons (42). In normal
aging, nerve cells in the brain are not lost in large numbers. In contrast, AD destroys neurons
in parts of the brain that control memory, especially the hippocampus and related structures
(66, 70). As nerve cells in the hippocampus stop functioning properly, short-term memory
fails, and often, a person's ability to perform easy and familiar tasks begins to decline. AD
also attacks the cerebral cortex, particularly the areas responsible for language and reasoning.
Here, AD begins to take away language skills and change a person's ability to make
judgments. Personality changes also may occur. Emotional outbursts and disturbing
behaviour, such as wandering and agitation, begin to happen and become more and more
frequent as the disease runs its course. Eventually, many other areas of the brain are involved,
all these brain regions shrink, and the AD patient becomes bedridden, incontinent, totally
helpless, and unresponsive to the outside world. AD presents a major health problem because
of its enormous impact on individuals, families, the health care system, and society as a

INTRODUCTION
- 3 -
whole. As more and more people live longer, the number of people affected by diseases of
aging, including AD, will continue to grow, which makes the disease an urgent research
priority.
Research into the basic biology of the aging nervous system is critical to understanding what
goes wrong in the brain of a person with AD. Understanding its underlying mechanisms will
provide the basis for advances in all other areas of research, including diagnosis, treatment,
prevention, and care.
AD was long considered among the most obscure and intractable of human maladies.
However, in the past decade, knowledge about factors that may contribute to the onset of
Alzheimer’s Disease has grown considerably (11, 66-69, 75, 77-82). For example, mutations
in three genes (APP, PS-1, and PS-2) cause familial Alzheimer's disease by alteration of the
rate of generation of the amyloid peptide or the length of this peptide (83); the "plaque-
associated" proteins, like apolipoprotein E4 (84, 85), transthyretin (86), serum amyloid A (82,
87) , promote the formation of toxic fibrillar aggregates or the chronic inflammatory
responses. Based on the emerging findings, there is an increasing belief that the amyloid
fibrils formed in the brain in Alzheimer’s disease play an important causative link in the
pathology (2, 21, 67, 71, 88). The amyloid cascade hypothesis proposes Aβ as the central
trigger of the pathological changes observed in the brains of AD patients, such as synapse
loss, activation of inflammatory processes, the induction of neurofibrillary changes leading to
the formation of paired helical filaments and, ultimately, neuronal death (Fig. 1-1) (10, 21,
67). It has formed the basis for numerous research activities, which have significantly
contributed to our understanding of AD.
Fig. 1-1. The amyloid cascade hypothesis of Alzheimer’s Disease.
INTRODUCTION
- 4 -
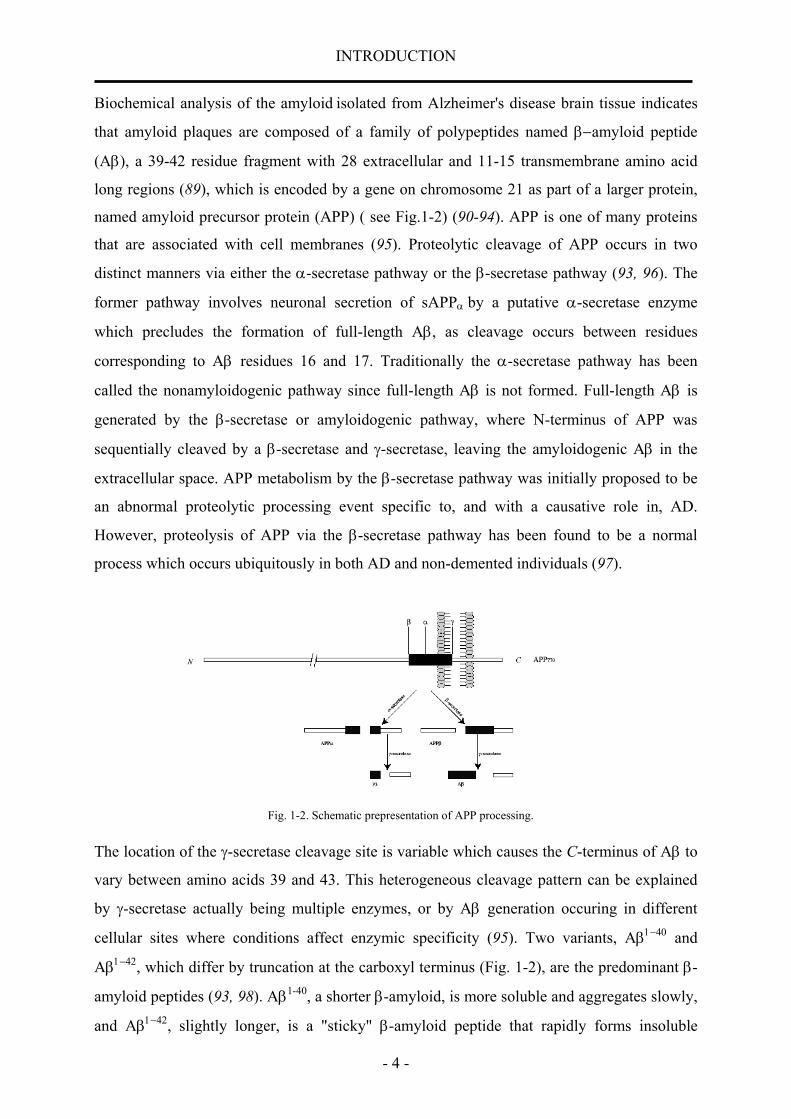
Biochemical analysis of the amyloid isolated from Alzheimer's disease brain tissue indicates
that amyloid plaques are composed of a family of polypeptides named β−amyloid peptide
(Aβ), a 39-42 residue fragment with 28 extracellular and 11-15 transmembrane amino acid
long regions (89), which is encoded by a gene on chromosome 21 as part of a larger protein,
named amyloid precursor protein (APP) ( see Fig.1-2) (90-94). APP is one of many proteins
that are associated with cell membranes (95). Proteolytic cleavage of APP occurs in two
distinct manners via either the α-secretase pathway or the β-secretase pathway (93, 96). The
former pathway involves neuronal secretion of sAPPα by a putative α-secretase enzyme
which precludes the formation of full-length Aβ, as cleavage occurs between residues
corresponding to Aβ residues 16 and 17. Traditionally the α-secretase pathway has been
called the nonamyloidogenic pathway since full-length Aβ is not formed. Full-length Aβ is
generated by the β-secretase or amyloidogenic pathway, where N-terminus of APP was
sequentially cleaved by a β-secretase and γ-secretase, leaving the amyloidogenic Aβ in the
extracellular space. APP metabolism by the β-secretase pathway was initially proposed to be
an abnormal proteolytic processing event specific to, and with a causative role in, AD.
However, proteolysis of APP via the β-secretase pathway has been found to be a normal
process which occurs ubiquitously in both AD and non-demented individuals (97).
Fig. 1-2. Schematic prepresentation of APP processing.
The location of the γ-secretase cleavage site is variable which causes the C-terminus of Aβ to
vary between amino acids 39 and 43. This heterogeneous cleavage pattern can be explained
by γ-secretase actually being multiple enzymes, or by Aβ generation occuring in different
cellular sites where conditions affect enzymic specificity (95). Two variants, Aβ1−40 and
Aβ1−42, which differ by truncation at the carboxyl terminus (Fig. 1-2), are the predominant β-
amyloid peptides (93, 98). Aβ1-40, a shorter β-amyloid, is more soluble and aggregates slowly,
and Aβ1−42, slightly longer, is a "sticky" β-amyloid peptide that rapidly forms insoluble

INTRODUCTION
- 5 -
clumps (93). It was found that more amyloidogenic Aβ1-42 is the principal specie associated
with senile plaque amyloid (99).
An ever-increasing body of genetic, physiologic, and biochemical data supports the
hypothesis that fibrillogenesis of the β-amyloid protein is an important event in Alzheimer’s
disease. However, there are still many questions remaining unclear regarding the relationship
of Aβ and AD (74). The most difficult one to answer concerns the nature of the neurotoxic
effect of the peptide itself in the brain. More recently, Aβ oligomeric intermediates, rather
than fully formed fibrils, are considered to be the predominant toxic species, based on the in
vitro and in vivo observations that small, soluble, and diffusible oligomeric Aβ species are
also capable of initiating pathogenic events (52, 100-104). However, the debate about
precisely which species of Aβ injures neurons and their processes in vivo will continue for
some time. All these uncertainties complicate identifying therapeutic targets for AD and
underline the need for a clear understanding of the molecular mechanism of Aβ
fibrillogenesis.
1.2 Structural studies on Aβ
Therapeutic strategies based on the rational design of aggregation inhibitors require
knowledge of the molecular structure of amyloid fibrils. The problem of determining and
understanding the molecular structures of amyloid fibrils has attracted considerable attention
and effort over the past decade. Although complete, high-resolution structures have not yet
been obtained, key features of structural conformations and supramolecular organization
within amyloid fibrils formed in vitro from variant synthetic Aβ peptides have been
elucidated using a variety of novel experimental methods, including electron microscopy,
circular dichroism spectroscopy, magnetic resonance spectroscopy, X-ray fibre diffraction
(43), Fourier transform infrared spectroscopy (FTIR), and other biochemical techniques (64)
(see Table 1-2).
The field of structural studies of Aβ amyloid is extremely complex and encompasses the
structure of the soluble Aβ peptide, its polymerization into intermediates and from
intermediates to amyloid fibrils, to the fibrils themselves and finally to amyloid deposition in
vivo. Structural studies of soluble Aβ have concentrated on using NMR, CD and FTIR
methods to look at the structure of different regions of Aβ in various solvents. Atomic force

INTRODUCTION
- 6 -
microscopy (AFM) has proved a valuable tool to investigate the nature of the intermediates in
the amyloid pathway. Transmission EM and fibre diffraction have been used to examine the
structure of the amyloid fibrils, as well as methods of solid-state NMR and FTIR.
Table 1-2. Structural studies on variant Aβ peptides. Structure/conformation Experimental conditions Methods Reference Aβ1-28 Random coil Water (pH1-4) CD (61) Aβ1-28 α-helix; increased temperature leads to
decrease in helix, 13-20 remain most stable helix
TFE (4-7) NMR (61, 105)
Aβ1-28 β-sheet Water (pH4-7) CD (105) Aβ1-28 Not α-helical, extended strand Water (pH5.6) NMR (106) Aβ1-28 α-helix, bend at 12 Membrane mimic, SDS and
TFE NMR (55)
Aβ1-28 C-terminal α-helix, N-terminal turn (flexible) DMSO NMR (107) Aβ1-28 Fibrillar, cross-β aqeous EM, FD (51) Aβ1-39 Random coil and β-sheet Aqueous (pH 7.3) CD (61) α-helix TFE (30%) (pH 1-4, 7-10) CD (61) β-sheet (60%) Aqueous (pH 7.4) CD (108) Aβ12-28 α-helix 16-24 SDS (pH2.6) NMR (109) Aβ10-23 β-sheet (antiparallel) Solid state FTIR (110) Aβ10-35 β-sheet (parallel), in register Dried from water (pH 7.4) ssNMR (111-113) Aβ10-35 β-sheet (parallel), in register PH 3.7 or pH 7.4 STEM, ssNMR (54) Aβ10-43 80% β-sheet Water CD (110) 28% α-helix HFIP CD (110) Aβ16-22 β-sheets (antiparallel) 1.0 mM phosphate buffer, pH
7.0 EM, ssNMR (114)
Aβ25-35 β-sheet > random coil (decreased concentration)
Aqueous (pH4, 5) CD (115)
β-sheet PH5.5, pH 7.4 Aβ29-42 β-sheet (antiparallel) Solid state FTIR (110) β-sheet Aqueous (pH 7.4) CD (110) Aβ34-42 β-sheet (antiparallel) aqueous FTIR, ssNMR (116) Aβ1-40 α-helix 15-36, kink 25-27 SDS (pH 5.1) NMR (117) α-helix 15-23, 31-35 TFE (40%) (pH 2.8) NMR (118) Cross-β water FD (46) β-sheet (parallel, in-register) Aqueous (pH 7.4) ssNMR (119) β-sheet (parallel, in-register), residuce 1-9
without structure PBS (140 mM NaCl, 3 mM KCl, 10 mM phosphate, pH 7.4)
ssNMR (120)
1-10, disordered; 12-24 and 30-40, β-strand; 25-29, a bend
Aqueous, pH 7.4 x-ray, EM, ssNMR
(60)
α-helix 10-24 and 28-42 SDS (pH 7.2) NMR (65) Aβ1-42 β-sheet water CD (61) β-sheet, in-register parallel Aqueous, pH 7.4 EM, STEM,
ssNMR (54)
α-helix 10-24 and 28-42 SDS (pH 7.2) NMR (65)
1.2.1 The structure of Aβ in solution.
The sequence of Aβ1-42 is as follows (121, 122):
NH2-DEAFRHDSGY10EVHHQKLVFF20AEDVGSNKGA30IIGLMVGGVV40IA-COOH

INTRODUCTION
- 7 -
The Aβ1-40 sequence is divided into two regions: residues 1-28 make up a relatively
hydrophilic domain with a high proportion of charged residues (46%). In the amyloid
precursor protein, this domain is extracellular. The carboxyl-terminal residues 28-40 make up
a richly hydrophobic domain that is associated with the cell membrane in the amyloid
precursor protein (46). Amino acid sequence analyses of the Aβ peptide by the Chou-Fasman
and Garnier-Osguthorpe-Robson methods indicate that the probability of finding a β-strand
conformation in Aβ is high within the C-terminal region after residue 28. The region between
amino acids 10 and 24 presents a high and similar probability to display either an α-helix or
β-strand conformation (56). There are also probably two β-turns between residues 6 and 8 and
between residues 24 and 29. Using synthetic peptides and spectroscopic techniques, the
secondary structure assignments obtained by predictive methods have been confirmed (61,
105).
Detailed secondary structural analysis by CD spectroscopy indicated that Aβ1-42 formed
approximately 90% β-sheet in aqueous buffer at pH 7.3 and the C-terminal Aβ29–42 peptide
fragment adopts approximately 100% β–sheet structure under these conditions. The addition
of 25% (v/v) TFE, which promotes intra-chain hydrogen bonding, thereby stabilizing α-
helical structures, induced α-helical structure for Aβ1-42, Aβ1-39 and Aβ1-28, but Aβ29-42
remained in a β-sheet conformation. The N-terminal domain exists as a soluble monomeric α-
helical structure at pH 1-4 and pH greater than 7. However, at pH 4-7 it rapidly precipitates
into an oligomeric β-sheet structure. Conformation studies on Aβ peptides in aqueous solution
are complicated by their tendency to aggregate. To structurally characterize the
nonaggregated state of the β-amyloid peptide, tri-dimensional structures of Aβ have been
obtained using smaller fragments in aqueous solution or full-length peptides in
nonphysiological conditions (pH, presence of strong organic solvents or detergents) to avoid
protein aggregation (55, 65). The N-terminal 28-amino-acid fragment of β-amyloid was
studied in detail by 1H-NMR in water–trifluoroethanol (TFE) solutions and was found to have
a predominantly α-helical structure (55). However, in another study undertaken by Eker et.al.,
Aβ1-28 adopts a predominantly polyproline II conformation in D2O at acidic pD (123).
Recently, NMR structures of Aβ1-40 and Aβ1-42 have been determined in aqueous
trifluoroethanol (118), in SDS micelles (65, 117) and in aqueous solutions of fluorinated
alcohols (62). All these NMR data hint to the presence of two helical regions encompassing
residues 8–25 and 28–38, connected through a flexible kink or a regular type I β-turn. Thus,

INTRODUCTION
- 8 -
Aβ generally forms α-helical conformation in organic solvents whereas in aqueous buffer or
in water it is predominantly β-sheet, although this can be affected by pH, concentration and
incubation time.
Studies of the Aβ peptide in various “membrane mimicking” solvents had suggested an α-
helical conformation for the soluble Aβ peptide, while peptide aggregation and precipitation
was observed to occur following β-sheet formation by Aβ1–39 and Aβ1–42 in a time dependent
manner indicating that formation of β-sheet structure is directly related to peptide aggregation
(61, 124-127). Therefore, it is suggested that the Aβ peptide undergoes a conformation
transition from α-helical to β-sheet structure during amyloidogenesis. Indeed, Zagorski and
Barrow (105) obtained NMR evidence for an α-helix to β-strand conformational switch in β-
amyloid (residues 1–28) with increasing temperature to 35°C or increasing pH from acidic to
neutral range, and upon forming a β-sheet structure, the peptide became insoluble. A similar
loss of solubility, associated with a conformational switch from an α-helical state, is observed
for a β-amyloid fragment comprising amino acids 12–28, in the presence of micelles of the
zwitterionic lipid dodecylphosphocholine. Moreover, a detailed 1H-NMR structure of Aβ1-28
in DMSO indicated a degree of conformational flexibility in the peptide, but confirmed that
under some conditions it assumed an extended structure consistent with a β-strand (107). β-
Sheet formation by Aβ was observed to be strongly dependent on environmental conditions,
and such factors inducing the protein structural changes were identified over the last few
years (128, 129). For example, it was found that β-Sheet formation and peptide aggregation
exhibited pH dependence and were most rapid at pH 5.5, as evidenced by changes in the CD
spectra corresponding to complete β-sheet formation. The observation that β-sheet formation
by Aβ was promoted at low pH is, particularly, of interest as the pH in AD brain has been
found to be slightly lower than in normal brain, and this acidolysis may result in enhanced Aβ
deposition. Regions of the Aβ peptide responsible for conformational switching and
fibrillogenesis have been examined using solvents at various pH to look at the effect of
ionization on side chains, amino acid substitutions and truncation of Aβ from either the N- or
C-terminus. Previous data show that the hydrophilic N-terminal of Aβ can form α-helix,
random coil and β-sheet structures, strongly depending on solution conditions, while Aβ29-42
remained in a β-sheet conformation, regardless of TFE content, pH or temperature (61). These
results suggest that the hydrophobic segment in the C-terminal domain of Aβ is largely
responsible for the propensity to form β-sheet exhibited by Aβ , while Aβ conformation is

INTRODUCTION
- 9 -
more dependent on the secondary structure adopted by the N-terminal domain. This was also
supported by the following observations: the single mutation of valine 18 (an amino acid
forming β-sheets) to alanine (an amino acid forming α-helices) induced a significant
increment of the α-helical content of Aβ1−40 and dramatically diminished fibrillogenesis; the
substitution of glutamine for glutamic acid at position 22 (the so-called “Dutch” peptide)
decreased the propensity of the Aβ N-terminal domain to adopt an α-helical structure, with a
concomitant increase in amyloid formation (126).
Given the growing evidence for a causative role of Aβ amyloid formation in Alzheimer’s
disease, it is becoming increasingly important to describe the mechanism of amyloid
formation. The aggregation and assembly of Aβ peptides is a dynamic process, which is
thought to proceed via a nucleation-dependent mechanism with a number of factors affecting
the rate and equilibrium of fibril assembly. Numerous studies have been undertaken to help
understand this mechanism, using a range of biophysical techniques including Fourier
transform infrared spectroscopy, electron microscopy, Thioflavin T fluorescence, X-ray fibre
diffraction, atomic force microscopy, surface plasmon resonance, cryoelectron microscopy
and NMR spectroscopy (129-147). Key parameters promoting the assembly of amyloid fibrils
and sedimentable aggregates include high peptide concentration (above 0.75 mg/ml), long
incubation times, low pH (pH 5-6), and mechanical agitation (59, 148). The length of the
carboxyl terminus is also critical in determining the assembly dynamics. The longer Aβ1-42
isoform aggregates more rapidly at pH 7.4. Moreover, many reports have identified either
specific residues or segments of Aβ that affect the solubility or toxicity of the peptide. For
example, the replacement of hydrophobic for hydrophilic residues in the βA4 sequence
impairs the formation of fibrils (110). Hilbich and co-workers (110, 149) reported that
substitution of two or more hydrophobic amino acid residues between positions 17 and 20 in
Aβ results in dramatically increased peptide solubility and reduced β-sheet content in Circular
Dichroism (CD) spectra. Replacement of single residues in this region of Aβ with proline
residues also decreased the aggregation propensity of the peptide (150). The work of
Tjernberg and co-workers (151) and Hughes and colleagues (152) demonstrates that short Aβ
peptide fragments with substitutions in the central hydrophobic cluster (LVFF) can alter the
assembly of full-length Aβ. Substitution of residues Lys16 in Aβ1-28 (51) or Phe19 or 20 for
Ala in 10-23 (110) results in peptides unable to form amyloid-like fibrils in vitro. All these
data suggest that the insolubility of Aβ is mainly due to its hydrophobic residues. Since this

INTRODUCTION
- 10 -
region of Aβ is important for both intra- and intermolecular interactions (45), point
substitutions in this part of the primary sequence may have important effects on the solution
conformation of the peptide and consequently on the rate of plaque growth.
It may not necessarily be true that there is a distinct and reliable correlation between in vitro
solution structure and Aβ deposition, however it is possible that particular conformational
features in soluble Aβ may contribute to a better understanding of Aβ deposition in AD.
Studies on Aβ peptides in solution have revealed a common theme in which the soluble full-
length or fragments of the peptide have been converted from a α-helical structure or random
coil structure to a β-structure upon aggregation. Inhibition of the process is therefore an
appropriate target for therapeutic intervention to delay or prevent the progression of the
disease.
1.2.2 Structure of β-amyloid fibrils.
Amyloid fibrils in AD are insoluble, ordered aggregates of normally soluble proteins. High-
resolution structural studies of Aβ fibrils have proved very difficult because of the insolubility
of the peptide at the concentrations required for NMR studies and the formation of
noncrystalline aggregates unsuitable for X-ray diffraction (56, 130). So far, experimental
studies on the structures of amyloid fibrils have been limited mainly to electron microscopy,
low-angle X-ray fibril diffraction and solid-state NMR (see Table 1-2) (27, 46, 49, 54, 114,
119, 120, 153-157).
Electron microscopy of amyloids, including those made from variant Aβ peptides, often show
ordered twisting, paired fibrils of 70-120 Å in diameter and of indeterminate length (100, 158,
159). An electron micrograph of Aβ1-40 amyloid fibrils formed in vitro is shown in Fig. 1-3.
(Fig. 1-3). Aβ1-40 fibrils have a diameter of approximately 70 Å, whereas the predicted length
of a 40-residue peptide in the β-strand conformation, with no turns, would be considerably
longer, suggesting either the existence of a turn in the fibrils under the conditions of EM
studies or a low-resolution picture demonstrating some type of “average” dimension in a
molecule with two unequal axes (47). The morphological development of the Aβ
polymerization process in detail from pseudo-spherical structures and protofibrils to mature
thioflavin-T-positive/Congo red-positive amyloid fibrils under different experimental
conditions was described using transmission electron microscopy. Moreover, the various
polymorphic fibrillar assemblies were structurally characterized (160). These results provide

INTRODUCTION
- 11 -
the framework for future investigations into how target compounds may interfere with the
polymerization process.
Fig. 1-3. Electron micrographs of Aβ1-40.
In spite of differences among amyloid proteins, the apparent generalizability of amyloid
structure lends support to the model peptide approach: generalizability implies reducibility.
Systematically selected Aβ-fragments containing the Aβ16–20 sequence, previously shown to
be essential for Aβ·Aβ binding, were incubated in a physiological buffer. Aβ14–23 was
identified to be the shortest fibril-forming sequence as observed by EM. Substitutions in this
decapeptide impaired fibril formation and deletion of the decapeptide from Aβ1-42 inhibited
fibril formation completely. Thus, it could serve as an invaluable preamble to the study of the
native proteins.
Fig. 1-4. Molecular modeling of A β14–23. Two strands of the fibrilforming decamer Aβ14–23 were aligned as an antiparallel b-sheet and subjected to energy minimization schemes. Note that His and Asp form ion pairs at both ends of the dimer. Two dimers were aligned. The resulting tetramer was energy minimized, and two ion pairs, Lys (blue) and Glu (red), were formed between the dimers. Two tetramers were aligned to form an octamer and were energy minimized. The fibril axis is in the plane of the paper and perpendicular to the peptide chains, and the Lys/Glu pairs are alternatively above and below the plane.
Molecular modelling of Aβ14–23 oligomers in an antiparallel β-sheet conformation displayed
favourable hydrophobic interactions stabilized by salt bridges between all charged residues
(Fig. 1-4). The Aβ14–23 fibril polymerisation was suggested to proceed via the formation of
dimers, then tetramers and finally oligomers, in which the charged residues form ion pairs and

INTRODUCTION
- 12 -
the hydrophobic residues forma hydrophobic core. This same pathway for fibrillogenesis of
Aβ14–23 is supported by results from other groups for Aβ1-40 and Aβ1-42 (161-163).
Fibre diffraction studies have shown that the Aβ in its fibril form is a predominantly β-pleated
sheet conformation and exhibits the characteristic X-ray diffraction pattern first described for
cross-β silk as indicated in Fig. 1-5 (43, 48, 64). Strong meridional diffraction pattern
corresponding to a characteristic spacing of 4.7 Å is usually observed for kinds of amyloid
fibrils, and is assigned to the distance between adjacent peptide chains in the β-sheets that
comprise a corss-β structure. Strong equatorial diffraction signals corresponding to 8 ~ 11 Å
range are also observed in most amyloid fibrils, and are commonly assigned to be the distance
Fig. 1-5. The characteristic cross-β spacings from X-ray fibre diffreaction from amyloid fibrils. A strong 4.8 Å reflection on the meridian correspoinds to the hydrogen bonding distance between β-strands (shown right), and a more diffuse 10-11 Å reflection on the equator shows the intersheet distance of about 10.7 Å.
between β-sheet layers in a laminated structure which depends on the size of side chain
groups. Thus, it is generally agreed that the β-strands are arranged perpendicular to the fibre
axis and hydrogen bonds between adjacent peptide chains are going parallel to fibril axis.
Fibre diffraction images from magnetically aligned fragments of the Aβ peptide have been
obtained, leading to a model of β-sheet crystallites arranged in a pentagonal or hexagonal
array (45). However, the packing arrangement of the β-sheets within the protofilament has yet
to be resolved.
Fibre diffraction and solid-state NMR have revealed much about how the β-sheets are
arranged within the amyloid fibril protofilament. Fibre diffraction data show only the
repeating structure within a molecule. Solid-state NMR is capable of measuring interactions
over relatively short ranges (~6 Å), and therefore contributes information about the local
interactions within the β-sheets.
A structural model for amyloid fibrils formed by Αβ1-40, based on a set of experimental
constraints from solid-state NMR spectroscopy was presented by Tycko and co-workers (27,

INTRODUCTION
- 13 -
60): Approximately the first 10 residues of Αβ1-40 are structurally disordered in the fibrils.
Residues 12-24 and 30-40 adopt β-strand conformations and form parallel β-sheets through
intermolecular hydrogen bonding. Residues 25-29 contain a bend of the peptide backbone that
brings the two β-sheets in contact through sidechain-sidechain interactions. A single cross-β
unit is then a double-layered β-sheet structure with a hydrophobic core and one hydrophobic
face. The only charged sidechains in the core are those of D23 and K28, which form salt
bridges (Fig. 1-6).
Fig. 1-6. Structural model for Aβ1-40 protofilaments, derived by energy minimization with constraints based on solid-state NMR data (60). The model is also consistent with overall dimensions and MPL from EM and STEM and with the characteristic spacings in X-ray fiber diffraction patterns. (a) Ribbon representation of residues 9-40, viewed down the long axis of the protofilament. Each molecule contains two β-strands (red and blue) that form separate parallel β-sheets in a double-layered cross-β motif. Two such cross-β units comprise the protofilament, which is then a four-layered structure. (b) Atomic representation of residues 1-40.
There is essentially no amino acid sequence homology between Aβ and other amyloidogenic
proteins, nor among any of the other amyloidogenic proteins. Nevertheless, quite remarkably,
all amyloid proteins form linear fibrils of similar overall structure: that of a rod shaped fibril
of β-sheet secondary structure. This pattern may well be related to many of the physical
properties of amyloids: all amyloids have in common the ability to bind Congo red and
thioflavin dyes; all are protease resistant in their fibrillar form and remain insoluble even in
the presence of strong detergents like SDS, and they all give characteristic reflections of 5 and
10 Å in X-ray diffraction of powders (48). For these reasons, it seems likely that structural
insights into Aβ fibrils will have a more general applicability to all or many amyloids. Thus,
an approach towards resolving the structure of the Aβ fibril is a clinically relevant first step in
our understanding of the more general phenomenon of amyloid deposition. It is, furthermore,
a paradigm for understanding the wider biophysical problems of protein self-assembly and
quaternary structure, as well as the pathways of protein folding.

INTRODUCTION
- 14 -
To summarize, experimental data are beginning to shed light on issues such as the nature of
the intermolecular interactions that stabilize amyloid structures, the molecular structural basis
for polymorphism in amyloid fibrils, the universality of amyloid structures, and the balance
between structural order and disorder within amyloid fibrils. Future structural data will
contribute to an improved understanding of the mechanisms of amyloid formation and the
mechanism of amyloid fibrils interacting with inhibitors, leading to the development of
therapeutic agents for amyloid diseases.
1.3 Inhibition and reversion of Aβ amyloidogenesis as a therapeutic
amyloid-related target for AD
Aβ amyloid formation and deposition is an early event in AD and perhaps a causative factor
in AD as mentioned afore. Inhibiting Aβ fibrillogenesis is thus an important strategy for AD
therapy. There are several possible targets to lower the cerebral amyloid burden in AD, like
reduction of APP gene expression, alteration of APP processing, inhibition and reversion of
Aβ misfolding and aggregation, enhancing the clearance of amyloid plaques and prevention
of amyloid neurotoxicity (76, 164, 165). However, progress in developing therapies for AD is
slow due to many unclear issues about AD. APP gene expression could be diminished by
using modern techniques of gene therapy such as antisense oligonucleotides or genetically
engineered ribozymes. But, until the biological function of APP is established, it remains
possible that lowering APP production might produce undesirable side effects. As mentioned
above, Aβ is generated from APP by two proteolytic cleavage events that involve the activity
of at least two enzymes, named β- and γ-secretase. Inhibition of these enzymes or activation
of nonamyloidogenic APP processing will probably reduce the brain concentration of sAβ
and hence slow the formation of amyloid. However, it is likely that both β- and γ-secretase
cleave many other proteins, which could be essential for proper functioning of the cell.
Therefore, inhibitors of these enzymes may have profound toxic effects. Amyloid removal
may be problematic due to their high insolubility, the attachment of a number of amyloid-
binding proteins and the presence of various degenerating cell types, including dystrophic
neurites, astrocytes, and microglial cells (130). Prevention of amyloid neurotoxicity requires
fully understanding the diverse aspects of amyloidogenesis in AD, which are unfortunately
unclear. Also, the uncertainties about the molecular mechanism of in vitro Aβ neurotoxicity
complicate the use of this target as a therapy for AD. The available evidence indicates that Aβ
misfolding and oligomerization are probably the first pathological processes in AD. This fact

INTRODUCTION
- 15 -
and the abundant knowledge accumulated about the molecular mechanism of amyloid
formation make the inhibition of Aβ amyloidogenesis an attractive therapeutic target for AD
(166). Therefore, instead of focusing on inhibiting the production of Aβ in the brain or
removing existing plaques (23, 88, 164), an alternative strategy is to identify small molecules
capable of binding Aβ (50, 167), thus disrupting the formation of aggregates and altering
aggregate structure, or by inhibiting interactions of Aβ with other receptors. Recent studies
showed that full assembly of Aβ into mature fibres similar to those found in plaques is not
necessary for toxicity. Smaller aggregates with molecular weights corresponding to dimers
(100, 101), trimers, and tetramers (52) exhibit toxicity in cell culture as well. These findings
support and highlight the necessity that Aβ assembly intermediates be included as targets in
AD drug development.
Based on the conformation/oligomerization hypothesis (26), engineering compounds with the
ability to stabilize the sAβ conformation, to destabilize the altered amyloidogenic conformer,
and to prevent the required conformational transition could be effective inhibitors of amyloid
plaque formation and very potent drug candidates for AD treatment. The intrinsic affinity of
Aβ for itself suggested that Aβ-specific interactions could be adapted to the development of
compounds that would bind to Aβ and prevent it from polymerizing (53, 168, 169). Currently,
small negatively charged molecules are being investigated regarding their ability to block
polymerization of Aβ or to disassemble preformed amyloid fibrils (76, 148, 170).
Soto and co-workers proposed that fibrillogenesis can be inhibited by short synthetic peptides
partially homologous to Aβ which contain residues acting as β-sheet breaker peptides (148,
171, 172). In their studies, a β-sheet breaker peptide iAβ5 (LPFFD) was designed from the
central hydrophobic region in the N-terminal domain of Aβ, amino acids 17-20 (LVFF) in
order to specifically bind to the Aβ region implicated in β-sheet formation. A proline residue
was added into the sequence to disrupt β-sheet formation, as incorporation of this amino acid
within a β-pleated structure is highly unfavourable (150); a charged residue was added at the
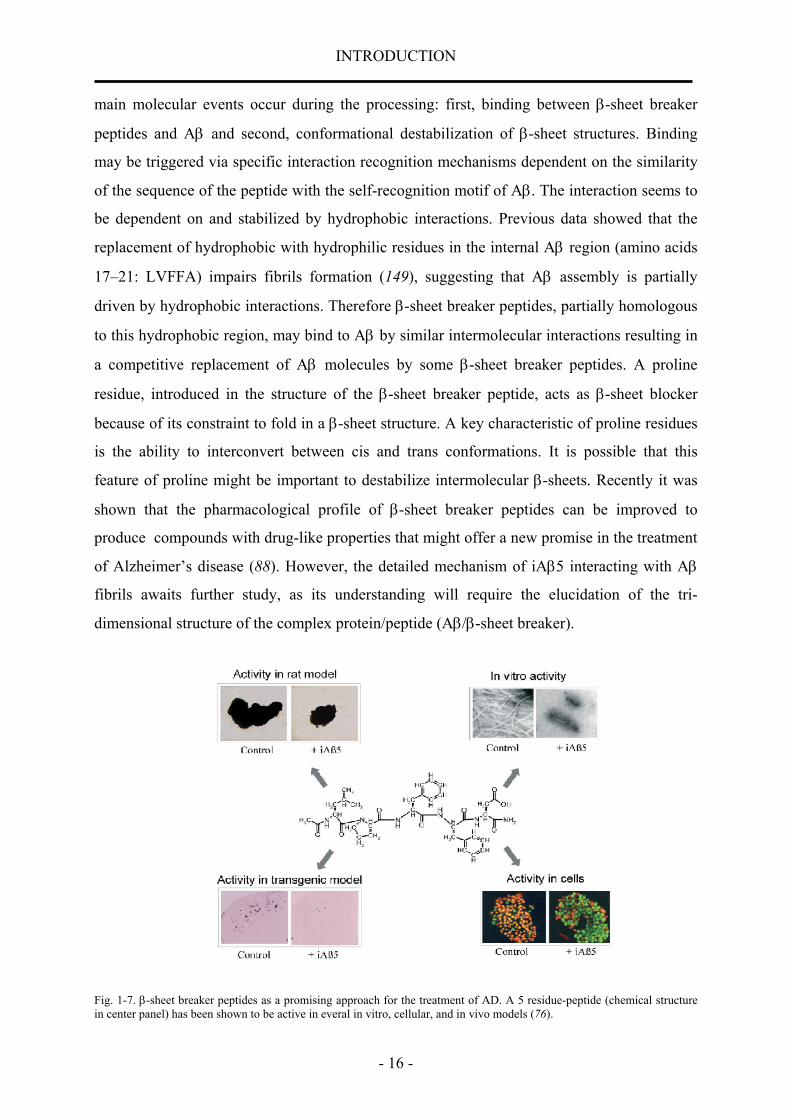
end of the peptide to increase solubility. It was demonstrated that iAβ5 inhibits amyloid β-
protein fibrillogenesis, disassembles preformed fibrils in vitro and prevents neuronal death
induced by fibrils in cell culture (Fig. 1-7). In addition, the β-sheet breaker peptide
significantly reduced amyloid β-protein deposition in vivo and completely blockers the
formation of amyloid fibrils in a rat brain model of amyloidosis. They hypothesized that two
INTRODUCTION
- 16 -
main molecular events occur during the processing: first, binding between β-sheet breaker
peptides and Aβ and second, conformational destabilization of β-sheet structures. Binding
may be triggered via specific interaction recognition mechanisms dependent on the similarity
of the sequence of the peptide with the self-recognition motif of Aβ. The interaction seems to
be dependent on and stabilized by hydrophobic interactions. Previous data showed that the
replacement of hydrophobic with hydrophilic residues in the internal Aβ region (amino acids
17–21: LVFFA) impairs fibrils formation (149), suggesting that Aβ assembly is partially
driven by hydrophobic interactions. Therefore β-sheet breaker peptides, partially homologous
to this hydrophobic region, may bind to Aβ by similar intermolecular interactions resulting in
a competitive replacement of Aβ molecules by some β-sheet breaker peptides. A proline
residue, introduced in the structure of the β-sheet breaker peptide, acts as β-sheet blocker
because of its constraint to fold in a β-sheet structure. A key characteristic of proline residues
is the ability to interconvert between cis and trans conformations. It is possible that this
feature of proline might be important to destabilize intermolecular β-sheets. Recently it was
shown that the pharmacological profile of β-sheet breaker peptides can be improved to
produce compounds with drug-like properties that might offer a new promise in the treatment
of Alzheimer’s disease (88). However, the detailed mechanism of iAβ5 interacting with Aβ
fibrils awaits further study, as its understanding will require the elucidation of the tri-
dimensional structure of the complex protein/peptide (Aβ/β-sheet breaker).
Fig. 1-7. β-sheet breaker peptides as a promising approach for the treatment of AD. A 5 residue-peptide (chemical structure in center panel) has been shown to be active in everal in vitro, cellular, and in vivo models (76).

INTRODUCTION
- 17 -
Given the hypothesis that aggregation intermediates are responsible for Aβ toxicity, one
approach to this problem is to identify compounds that bind Aβ, because these might interfere
with its aggregation and toxicity (50). These binding candidate compounds could theoretically
prevent all aggregation, or alternatively cause further association of toxic oligomers into
larger nontoxic aggregates. The latter was proofed by Murphy and co-workers. The inhibitors
were designed as containing a ‘‘recognition domain’’, a short peptide sequence homologous
to a fragment of full-length Aβ (KLVFF, 16– 20), and a ‘‘disrupting domain’’, a polypeptide
chain with the ability to interfere with Aβ aggregation (53, 173, 174). It was shown that the
inhibitors that protected PC-12 cells from Aβ toxicity actually increased the rate of Aβ
aggregation and these peptides designed to interfere with Aβ aggregation also inhibited Aβ-
associated toxicity (173). Among these peptides, KLVFFK6 was the most potent at preventing
Aβ-associated toxicity to PC-12 cells and caused the largest change in Aβ aggregation
kinetics and aggregate morphology (53). A detailed mathematical model of the specific
step(s) in the aggregation pathway affected by KLVFFK6 was suggested based on their
experimental data: (1) the inhibitor does not change the distribution of Aβ between amyloid
and nonamyloid paths; (2) it affects most strongly the rate of lateral aggregation of Aβ
filaments into fibrils; (3) it interacts with aggregated, not monomeric, Aβ, to enhance
hydrophobically driven association (175).
Structural information regarding the interaction with the target molecule is of major interest to
suggest new design strategies in the search for better inhibitors of Aβ toxicity and to
transform them into peptide mimetics. Meanwhile, such a study of interactions of Aβ with
inhibitors can contribute in valuable mechanistic understanding of the amyloid, such as the
arrangements of the constituent peptides and how these peptides pack together in the fibril. It
could be the fundamental event in the development of therapies for those diseases, and also
for elucidating fundamental mechanisms of protein folding and assembly.
1.4 Peptide synthesis
Examination of the events by which monomeric Aβ associates into oligomers and fibrils is of
central importance to elucidate the molecular mechanisms underlying AD pathogenesis.
Synthetic Aβ peptides were shown to be a powerful tool in the structural research of Aβ. The
fact that fibrils formed from synthetic peptides in vitro are identical to those in vivo as

INTRODUCTION
- 18 -
determined by EM and x-ray diffraction, and are toxic to neuron, underlines the validity of in
vitro synthetic Aβ aggregation studies (51, 89, 176, 177).
Aβ peptides have been successfully prepared by both Boc-SPPS and Fmoc-SPPS for use in a
range of structural and biological studies (178). Automated Boc- SPPS was used for the
preparation of Aβ1–42, Aβ1–39, Aβ1–28 and Aβ29–42 in the studies by Barrow et al. . Recently,
Liu et al., He and Barrow have reported the successful use of an in situ neutralization Boc-
SPPS methodology for the preparation of Aβ1–28, Aβ1–40 and analogues thereof.
Solid phase peptide synthesis (SPPS) is a quick and easy approach to synthesizing peptides
and small proteins (179). It is used extensively in the field of bioorganic chemistry. The
general scheme for solid-phase peptide synthesis is outlined in Fig. 1-8.
Fig. 1-8. General scheme for solid-phase peptide synthesis.
The C-terminal amino acid with N-α-derivatizing is attached to an insoluble support via a
linker. The N-α-blocking group is then deprotected and the amino acid-linker-support is
thoroughly washed with solvent. The next amino acid (which is N-α-derivatized) is then
INTRODUCTION
- 19 -
coupled to the amino acid-linker-support as either a preactivated species or directly in the
presence of an activator. After this reaction is complete, the N-α-dipeptide-linker-support is
washed with solvent. The deprotection/coupling cycle is repeated until the desired sequence
of amino acids is generated. The peptide-linker-support is cleaved to obtain the peptide as a
free acid or amide, depending on the chemical nature of the linker. Ideally, the cleavage
reagent also removes the amino acid side chain protecting groups, which are stable to the
deprotection reagent.
The solid support is a synthetic polymer that bears reactive groups such as -OH, -Cl. These
groups are made so that they can react easily with the carboxyl group of an N-α-protected
amino acid, thereby covalently binding it to the polymer. The amino acid may be attached
directly to the linker-support or first attached to the linker, with subsequent attachment of the
amino acid-linker to the support. There are lots of different linkers utilized in Fmoc SPPS,
such as p-alkoxybenzyl alcohol/p-hydroxymethylphenoxy (HMP) and 2-chlorotrityl-chloride
resin (TCP). The great variety of available peptide-to-resin linkers permits eventual cleavage
of synthesized polypeptides as free acids, side-chain protected peptide acid fragments,
amides, and hydrazides, as well as a number of less common carboxyl derivatives.
The loading of the first amino acid to the linker-resin often requires ester bond formation,
which is efficiently catalysed by base. Initial Fmoc SPPS loaded the first amino acid with
DCC/DMAP (N, N-dicyclohexylcarbodiimide/4-dimethylaminopyridine). It was subsequently
reported that Fmoc amino acid was loaded very efficiently in the presence of 1 equiv. of N, N-
diisopropylethylamine (DIPEA) in dichloromethane (DCM).
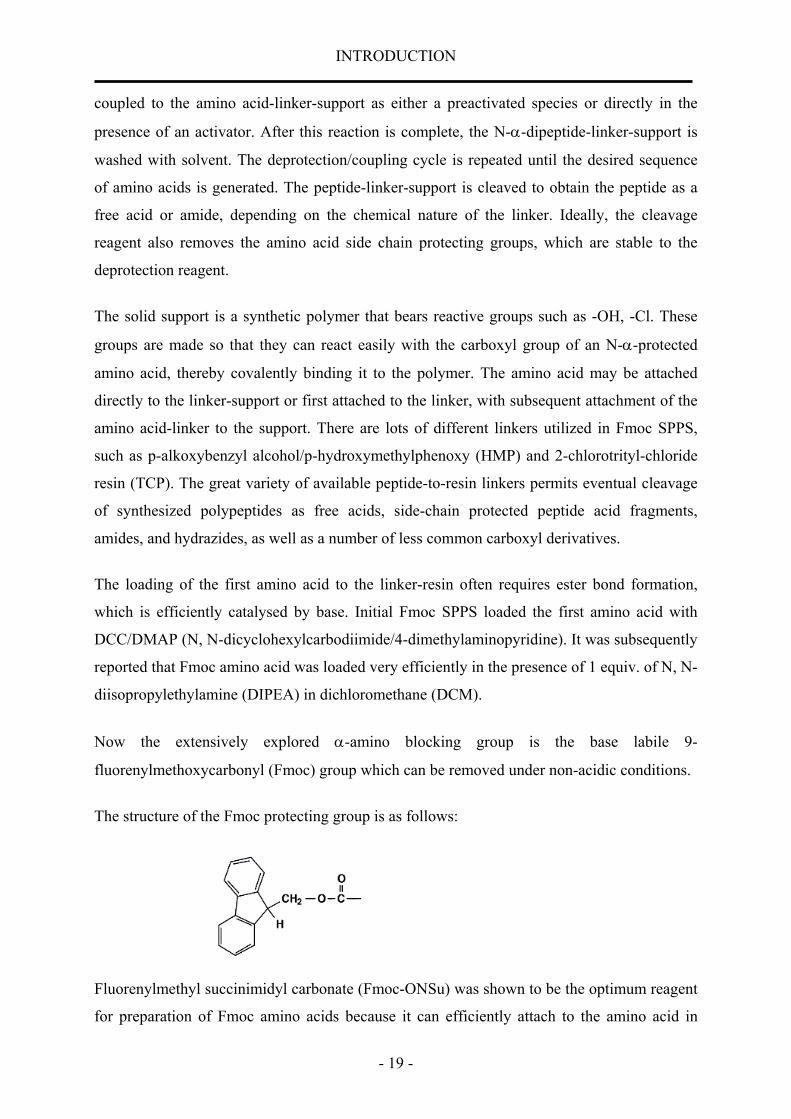
Now the extensively explored α-amino blocking group is the base labile 9-
fluorenylmethoxycarbonyl (Fmoc) group which can be removed under non-acidic conditions.
The structure of the Fmoc protecting group is as follows:
Fluorenylmethyl succinimidyl carbonate (Fmoc-ONSu) was shown to be the optimum reagent
for preparation of Fmoc amino acids because it can efficiently attach to the amino acid in

INTRODUCTION
- 20 -
aqueous dioxane, aqueous acetone, aqueous DMF, or aqueous acetonitrile in the presence of
NaHCO3 or Na2CO3 (179).
Dichloromethane (DCM), dimethylformamide (DMF) or N-methylpyrrolidone (NMP) is the
primary solvent for deprotection, coupling, and washing.
To begin each coupling, the Fmoc group on the resin bound amino acid/peptide must be
removed. The electron withdrawing fluorine ring system of the Fmoc group renders the lone
hydrogen on the α-carbon very acidic, and therefore susceptible to removal by weak bases.
The Fmoc group is most often deprotected in SPPS by 20-50% piperidine /DMF or 30%
piperidine /35% toluene /35% DMF.
Generally, an amino acid consists of a side chain group which defines the different structures
of the amino acids. Certain side chains contain functional groups that can interfere with the
formation of the amide bond. Therefore, it is important to mask the functional groups of the
amino acid side chains. tBu side chain protection group is traditionally used in Fmoc SPPS in
that it is base stable and TFA labile. Asp, Glu, Ser, Thr, Tyr, Cys, can be side chain protected
by it. Tert-butyloxycarbonyl (Boc) is another often used side chain protection group. It can be
used for His, Arg, Lys. Trityl (Trt) can be used for Gln, His, Cys, Arg. The mild base
deprotection of Fmoc SPPS permits some amino acids to be incorporated without side chain
protection, such as Met, Trp.
To ensure homogeneous peptide products, Fmoc amino acid acylation reactions must be
maximally efficient. Benzotriazolyl N-oxytrisdimethylaminophosphonium
hexafluorophosphate (BOP) and 2-(1H-benzotriazol-1-yl)-1, 1, 3, 3-tetramethyl uranium
hexafluorophosphate (HBTU) are two of the more popular activating agents now used. Other
additives such as HOBT (1-hydroxybenzotriazole) or imidazole are used in order to suppress
racemization during coupling and achieve rapid coupling.
Once the peptide is complete, it is ready to be cleaved from the resin. Since non-acidic
conditions are utilized for N-α-amino group deprotection, weak acids such as dilute TFA can
be used for cleavage and side chain deprotection. Strong acid such as hydrofluoric acid (HF)
cleavage is also compatible with Fmoc amino acid side chain protecting groups. Alternate
cleavage conditions, such as alkali, photolysis, fluoride ions, or hydrogenation, are used
primarily for peptide isolation with intact side chain protecting groups or to produce a unique
peptide carboxyl terminus.

INTRODUCTION
- 21 -
SPPS has been demonstrated to provide a facile means for the preparation of a wide range of
peptide sequences. However, despite the substantial optimization and development the
method has undergone since its introduction, a subset of sequences still prove problematic to
prepare. These so-called “difficult” sequences, of which Aβ is a prime example, are poorly
solvated while bound to the solid phase, which results in reduced Nα-amino acid acylation
and deprotection yields (10).
The synthesis of Aβ1–28, Aβ1–30, Aβ1–33, Aβ1–36, Aβ1–39, Aβ1–42, Aβ1–47 and Aβ1–52 by Fmoc-
SPPS was undertaken by Burdick et al. as part of a systematic analysis of the role of the
hydrophobic C-terminal region of Aβ (177). In this study, the assembly and purification of all
of the peptides up to Aβ1–42 was found to proceed relatively smoothly, with adequate peptide
yield and purity being obtained throughout. However, Aβ1–42 proved problematic to purify
and adequate characterizations of the Aβ1–47 and Aβ1–52 samples prepared were not achieved.
More recently, the stepwise Fmoc-SPPS of Aβ1–39 and Aβ1–40 have been performed and the
identities of the substantial amounts of side products formed during these syntheses
investigated (180, 181). Further optimization of the Fmoc-SPPS of ‘difficult’ sequences by
the use of HATU activation for regions of the target sequence known to be prone to
aggregation has also been reported to enable preparation of Aβ and other aggregating
sequences with a high yield and better than 90% initial purity (182). The synthesis of Aβ1–42
and Aβ1–43 has also been achieved by the segment condensation of fully-protected peptide
fragments previously prepared by Boc-SPPS in organic solution (183). Aβ1(3)–9, Aβ10–19,
Aβ20–25, Aβ26–29, Aβ30–33 and Aβ34–42(43) were ligated in a stepwise manner using a mixture of
chloroform and phenol to solubilize these weakly soluble fragments. The preparation of Aβ1–
43 and Aβ25–35 has also been successfully performed using Fmoc-SPPS together with Hmb
backbone amide protection (184-186). Aβ1–43 was initially prepared using Hmb protection of
Gly38, Gly33, Gly29, Gly25 and Phe20 (185). Hmb groups were incorporated using N,
ObisFmoc-Hmb amino acid Pfp esters, and their acylation was performed using N-carboxy
anhydrides in DCM. The positioning of the Hmb amino acids was largely dictated by the
previously noted ability of these protecting groups to abolish peptide aggregation for five or
six residues after their incorporation during ‘difficult’ sequence assembly (187).
The SPPS method is a practical method to synthesize isotope-labelled analogues that are
required for structural studies. 13C- and 15N-labelled Aβ peptides were well studied by solid-
state NMR, where isotopic substitution provides the source points for measuring distances in

INTRODUCTION
- 22 -
aggregated Aβ (111-114, 119). In some cases, modified functional groups could be easily
incorporated into peptide sequences for investigation of structures, such as that employed by
Gordon (188). In this study, amide bonds in Aβ16-20 were replaced with ester bonds to
investigate the effect of backbone hydrogen bonding in amyloid fibrils. The experimental data
demonstrate that this ester peptide is predominantly monomeric under solution conditions,
inhibits the aggregation of the Aβ1-40 peptide and disassembles preformed Aβ1-40 fibrils. These
results suggest that backbone hydrogen bonding is critical for the assembly of amyloid fibrils.
SPPS could also be used to obtain peptide by substituting certain residues in the sequence
with specified amino acids for structural studies (149, 189, 190). For example, an Aβ10-35-
NH2 analogue with a single point substitution (F19T) in this region was synthesized and
examined (189). Unlike Aβ10-35-NH2, the F19T analogue was plaque growth incompetent,
and NMR analysis indicated that the mutant peptide was significantly less folded than wild-
type Aβ, suggesting that the plaque competence of Aβ correlates to peptide folding.
1.5 Structural studies by Electron Microscopy
Electron Microscopy was used in the studies on structures of amyloid fibrils. Electron
Microscopy can yield information about the surface features of an object or "how it looks", its
texture; direct relation between these features and materials properties (hardness, reflectivity,
etc.); the shape and size of the particles making up the object; direct relation between these
structures and materials properties (ductility, strength, reactivity, etc.); the elements and
compounds that the object is composed of and the relative amounts of them; direct
relationship between composition and materials properties (melting point, reactivity, hardness,
etc.); how the atoms are arranged in the object; direct relation between these arrangements
and materials properties (conductivity, electrical properties, strength, etc.).
Electron Microscopes (EM) function as follows: a stream of electrons is formed and
accelerated toward the specimen using a positive electrical potential. With metal apertures and
magnetic lenses this stream is confined and focused into a thin, focused, monochromatic beam.
Then this beam is focused onto the sample using a magnetic lens. Interactions thus occur
inside the irradiated sample, affecting the electron beam. These interactions and effects are
detected and transformed into an image.

INTRODUCTION
- 23 -
Specimen interaction is what makes Electron Microscopy possible. The energetic electrons in
the microscope strike the sample and various reactions can occur as shown below. The
reactions noted on the top side of the diagram are utilized when examining thick or bulk
specimens (SEM) while the reactions on the bottom side are those examined in thin or foil
specimens (TEM).
Electron microscopy and image processing is one of the most powerful tools in the structural
investigation of large biological complexes. Insights into the structural organization of the
complexes can be gained without the necessity of crystallizing the complex. This provides the
means for observing structural changes during function of complexes unhindered by crystal
contacts.
Electron microscopy has been used to examine the morphology of fibrils formed from
different sequence peptides in different defined conditions (42, 47, 160, 177, 191). The
morphology and molecular architecture of amyloid fibrils are apparently very similar,
although they are formed from proteins with widely different native structures, sizes, and
localization. In these EM images, fibrils contained both twisted, paired fibrils with a
maximum width of about 16 nm, with a superhelical repeat distance of ~110 nm, and
monomeric fibrils of ~8 nm diameter. Also, it has been reported that fibril morphology of Aβ
is dependent on pH value as shown by EM (54).
Electron microscopy has been used to study the factors that either promote or inhibit Aβ fibril
formation and aggregation and the driving forces that are involved in the fibrillogenesis (41,
167). Identification of these factors and understanding of the driving forces behind these
interactions as well as identification of the structural motifs necessary for these interactions
will help to elucidate potential sites on Aβ that may be targeted to prevent amyloid formation
and its associated toxicity. EM has also been used to assay the influence of identified
candidate compounds on the assembly of Aβ fibrils (167). Fraser and co-workers found out
that inositol could stabilize small aggregates of Aβ1-42 that do not proceed to form fibrils as
demonstrated by Electron microscopy, thus representing a potential candidate for inhibiting
nucleation (41).
Electron microscopy has been used to study the assembly process of β-amyloid (160). The
time course of Aβ fibril formation was characterized using a variety of assays and various
experimental conditions. The detailed morphological development of the Aβ polymerization

INTRODUCTION
- 24 -
process was described from pseudo-spherical structures and protofibrils to mature thioflavin-
T-positive/Congo red-positive amyloid fibrils. Moreover, the various polymorphic fibrillar
assemblies were structurally characterized using transmission electron microscopy and their
mass was determined using scanning transmission electron microscopy. These results provide
the framework for future investigations into how target compounds may interfere with the
polymerization process.
1.6 Structural studies by Circular Dichroism
Circular Dichroism spectroscopy, which is a form of light absorption spectroscopy that
measures the difference in absorbance of right- and left-circularly polarized light (rather than
the commonly used absorbance of isotropic light) by a substance, has been extensively
applied to the structural characterization of peptides in solution (192). The phenomenon of
circular dichroism is very sensitive to the secondary structures of polypeptides and proteins:
alpha helix, parallel and antiparallel beta sheet, turn. Therefore the analysis of CD spectra can
yield valuable information about secondary structure of biological macromolecules (192) and
can be used to monitor relative structural changes of proteins due to environmental influences
on the sample (pH, denaturants, temperature etc.). Considering all CD spectra as a
combination of those secondary structures, it is possible to estimate the amount of these
secondary structures in a given protein using curve fitting algorithms. This approach
converged CD spectroscopy not only a qualitative, but a semi-quantitative method
determining the secondary structural propensity of proteins and peptides in solution.
The application of CD for conformational studies in peptides (like proteins) can be largely
grouped into 1.) monitoring conformational changes (e.g., monomer-oligomer, substrate
binding, denaturation, etc.) and 2.) estimation of secondary structural content. As already
mentioned, CD is particularly well-suited to determine structural changes in both proteins and
peptides.
The secondary structures of the synthetic, naturally occurring, β−amyloid peptides in solution
have been studied by Barrow et al using CD spectroscopy (61, 124). In their work, several
factors on the β-sheet formation have been monitored, like pH, peptide concentration, time
dependence and solvent effect. It was found that in aqueous trifluoroethanol solution, the Aβ1-
28, Aβ1-39, and Aβ1-42 peptides adopt monomeric α-helical structures at both low and high pH,
whereas at intermediate pH (4 to 7), an oligomeric β structure predominates. The hydrophobic

INTRODUCTION
- 25 -
carboxyl-terminal segment, Aβ29-42, exists exclusively as an oligomeric β-sheet in solution,
regardless of differences in solvent, pH, or temperature. A pH-dependent transition of Aβ10-35
from coil to β-structure was most obvious in the circular dichroic spectra (47). CD
spectroscopy was also used to assess whether the selected peptides could prevent Aβ from
adopting a β-sheet conformation (175, 193). It was found that the presence of 10 µM D-
KLVFFA during the L-Aβ incubation prevented this random coil to β-sheet-rich secondary
structure transition, maintaining Aβ close to its original conformation. The secondary
structure was followed as a function of time and concentration by CD (169).
Fig. 1-9. Circular dichroism spectra of poly (Lys) in the α-helical (α), β -sheet (β), and random coil (r) conformations (From “Proteins: Structures and Molecular Properties, by T.E. Creighton).
The structural studies by CD spectroscopy allow qualitative studies of the structure of
peptides in solution.
1.7 Structural studies by solution NMR spectroscopy
A detailed understanding of the function of a biological macromolecule requires knowledge
of its three-dimensional structure. Nuclear magnetic resonance (NMR) spectroscopy is
currently the most powerful technique capable of determining high-resolution structures of
biological macromolecules such as proteins and nucleic acids at atomic resolution. The basic
phenomenon of NMR was discovered in 1945: the energy levels of atomic nuclei are split up
by a magnetic field. Transitions between these energy levels can be induced by exciting the
sample with radiation whose frequency is equivalent to the energy difference between the two
levels. The nuclei of greatest interest for organic chemistry and biochemistry, H, C, N, and P,
all have isotopes with spin ½ having a magnetic moment, though for C and N the natural
abundance of these isotopes (13C, 15N) is very small. However, these isotopes can be

INTRODUCTION
- 26 -
incorporated into biomolecules through isotope labelling. Since 1960, the field of NMR has
seen an explosive growth which started with the development of pulsed Fourier-transform
NMR and multidimensional NMR spectroscopy. The first NMR-derived three-dimensional
solution structure of a small protein was determined in 1985, since then major improvements
in NMR hardware (magnetic field strength, cryoprobes) and NMR methodology, combined
with the availability of molecular biology and biochemical methods for preparation and
isotope labeling of recombinant proteins have dramatically increased the use of NMR for the
characterization of structure and dynamics of biological molecules in solution. These
improvements are ongoing and are designed to overcome the two main problems with NMR
of biomacromolecules, namely signal-to-noise and spectral overlap. Importantly,
biomolecular NMR spectroscopy can provide information about conformational dynamics and
exchange processes of biomolecules at timescales ranging from picoseconds to seconds, and
is very efficient in determining ligand binding and mapping interaction surfaces of protein-
ligand complexes.
In the following, the basic principles of NMR are described and the applications of
biomolecular NMR in structural biology are introduced.
1.7.1 Theory of NMR spectroscopy
In an external magnetic field B0, nuclei with spin ½ are aligned either in a parallel or
antiparallel orientation with respect to the magnetic field. The parallel α state is lower in
energy than the antiparallel β state. The energy of these levels is given by the classical
formula for a magnetic dipole in a homogenous magnetic field of the strength B0:
E = - µz * B0 = - m * γ * h/(2π) * B0 ,
where, h, the Planck's constant; γ, the gyromagnetic ratio; m, the magnetic quantum number,
an integer number between -I and +I.
Therefore, the population of the α state is greater than that of the β state (Boltzmann
distribution), and a macroscopic magnetization along the B0 field exists due to this population
difference. The magnetic moment of each nucleus precesses around B0. The frequency of this
precession is the larmor frequency (ω0) which is equivalent to the energy difference between
the two levels. In order to measure the precession frequencies, the system is disturbed and
brought into a non-equilibrium state which allows monitoring the transverse (x or y)

INTRODUCTION
- 27 -
magnetization. This can be done by applying an oscillatory magnetic field B1 that rotates the
magnetization away from the z-axis toward the x, y plane. Being composed of individual
nuclear spins, a transverse (in the x, y plane) macroscopic magnetization Mx,y (coherence)
starts precessing about the z axis with the Larmor frequency (in the lab coordinate system)
under the influence of the static B0 field, thus inducing a current in the receiver coil, which is
then recorded and called the free induction decay (FID). The FID obtained from a FT NMR
experiment is a superposition of the frequencies of all spins in the molecule as a function of
time, F(t). In order to obtain the corresponding spectrum F(ω) (intensity as a function of
frequency) a Fourier transformation is performed. Fourier transformation is a simple
mathematical operation which translates a function in the time domain into the frequency
domain.
Relaxation and NMR linewidths After a 90° pulse has been applied to the equilibrium z-
magnetization, a transverse magnetization is created in which the phases of the individual spin
precession frequencies are correlated. Such a non-random superposition of states is called
coherence. However, the population difference between the α and β-states (which
corresponds to the z-magnetization) has disappeared. Thus, the system is in a non-equilibrium
state and will therefore relax back into the equilibrium state. This is described by two
relaxation processes. The loss of phase-coherence in the transverse plane due to spin-spin
interactions defines the T2 or transverse relaxation time. In addition, the population difference
along z is restored by interactions with the surroundings. This spin-lattice relaxation is
described by the T1 or longitudinal relaxation time. The linewidth of an NMR signal is
described by the exponential decay of the FID, and reciprocal to the transverse relaxation time
T2. It scales with the molecular tumbling rate in solution and therefore increases with higher
molecular weight. This is the main reason for the molecular weight limitation of NMR.
Chemical Shifts The static magnetic field B0 is shielded by the electrons in the local
environment of a spin. Therefore, the individual resonance frequencies are slightly different
reflecting the different chemical surroundings. The resonance frequencies are called chemical
shifts and are measured in parts per million (ppm) in order to have chemical shift values
independent of the static magnetic field strength. For example, backbone amide protons HN in
a protein resonate around 8 ppm, while Hα spins have resonance frequencies between 3.5-5.5
ppm.

INTRODUCTION
- 28 -
J-coupling Scalar or J-couplings are mediated through chemical bonds connecting two
spins. The energy levels of each spin are slightly altered depending on the spin state of a
scalar coupled spin (α or β). This gives rise to a splitting of the resonance lines. Typical
coupling constants are: 1J (HN, N) ~ 92 Hz, 3J(HN,Hα) ~ 2-10 Hz, >3J < 1. 3J-couplings are
well-correlated with the central dihedral angle by an empirical correlation, the Karplus curve.
For example, 3J (HN,Hα) defines the backbone angle φ in proteins. Scalar couplings are used
in multidimensional (2D, 3D, 4D) correlation experiments to transfer magnetization from one
spin to another in order to identify spin systems, e.g. spins which are connected by not more
than three chemical bonds. For example, the amino acid 1H spin system of Alanine consists of
HN, Hα and Hβ.
Nuclear Overhauser Effect (NOE) The nuclear Overhauser effect is a result of cross
relaxation between dipolar coupled spins as a result of spin/spin interactions through space.
Dipolar couplings are usually in the kHz range, and depend on the distance between the two
spins and the orientation of the internuclear vector with respect to the static magnetic field B0.
Fortunately, due to the fast overall tumbling of molecules in solution, the dipolar couplings
are averaged to zero. Nevertheless, the dipolar couplings give rise to spin/spin and spin/lattice
relaxation. The NOE is a result of cross-relaxation between spins and is defined by the
transition rates W0 and W2 which involve spin flips of both spins. The NOE allows to transfer
magnetization from one spin to another through space, and scales with the distance r between
the two spins (NOE ~ 1/r6), e.g. two protons in a protein. Therefore the NOE is related to the
three-dimensional structure of a molecule. For interproton distances > 5 Å, the NOE is too
small and not observable.

INTRODUCTION
- 29 -
Residual Dipolar couplings For two directly coupled nuclei A and B, the direct dipolar
coupling interaction is quantified by (194)
2
1cos38
23
30 −−
= − θπ
γγµAB
BAAB rhD [1-1]
where µ0 is the permeability of free space, γΑ and γΒ are the magnetogyric ratios of the
coupled nuclei, and <r-3AB> is the motionally-averaged inverse cube of the internuclear
distance, θ is the time-dependent angle between a unit vector in the internuclear direction and
a unit vector parallel to B0, and the brackets signify the time average of the quantity.
Normally, the random, isotropic sampling of angles by a molecule tumbling in solution
reduces the RDC to zero. This isotropic sampling may be made anisotropic by a magnetically
induced alignment or with the aid of various types of media. This anisotropic sampling will
result in a measurable RDC that is indicative of the average orientation of an inter-nuclear
vector.
Since the introduction of two–dimensional methods, NMR spectroscopy has developed into
the most important method for the investigation of the structure, dynamics, and reactions of
molecules. The basic 2D NMR experiment consists of exciting the nuclei with two pulses or
groups of pulses then receiving the free induction decay (FID). The acquisition is carried out
many times, incrementing the delay (evolution time - t1) between the two pulse groups. Any
two-dimensional NMR experiment is composed of four separate segments: preparation
period, evolution period, mixing period, detection. A pulse sequence for a typical 2D
experiment is shown in Fig. 1-10.
Fig. 1-10. The Pulse Sequence for 2D NOESY Experiment.
The preparation period can be as simple as a delay and a pulse or a very complicated series of
pulses. The evolution period is the variable time, t1, in which the first chemical shifts are
allowed to evolve. The mixing period is the “heart” of a 2D experiment. The type of
correlation observed is a result of the type of mixing. For example, NOESY mixing allows for
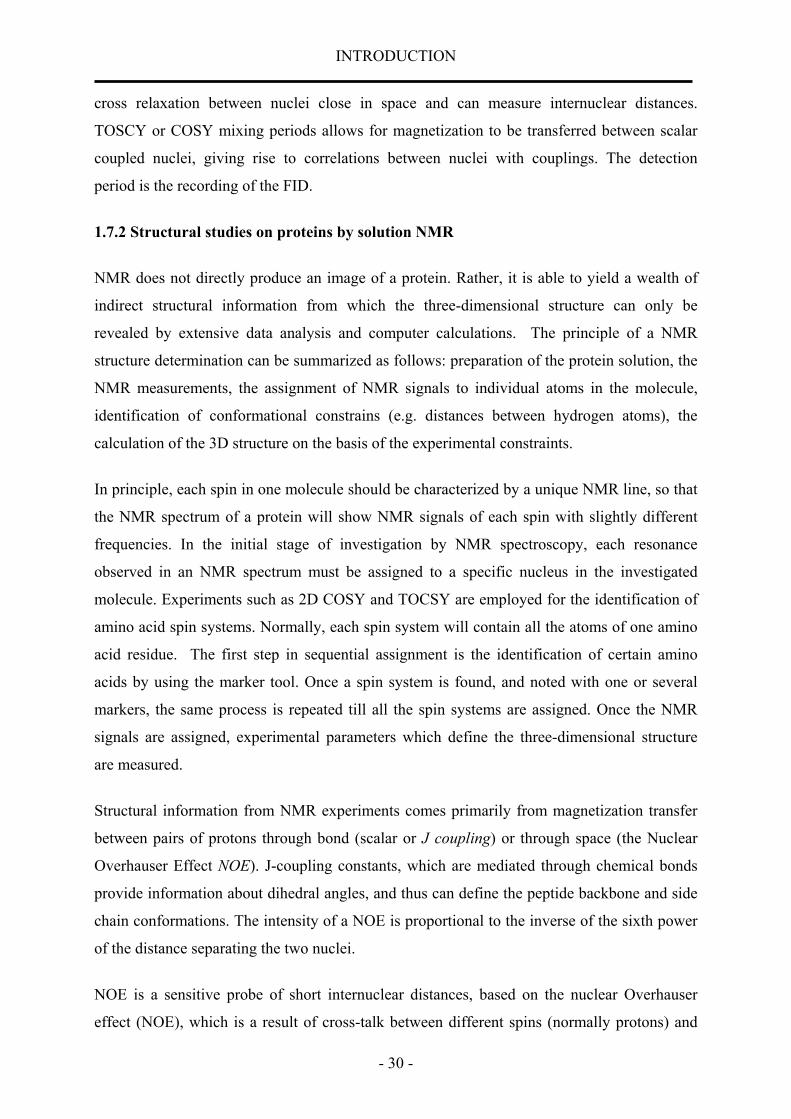
INTRODUCTION
- 30 -
cross relaxation between nuclei close in space and can measure internuclear distances.
TOSCY or COSY mixing periods allows for magnetization to be transferred between scalar
coupled nuclei, giving rise to correlations between nuclei with couplings. The detection
period is the recording of the FID.
1.7.2 Structural studies on proteins by solution NMR
NMR does not directly produce an image of a protein. Rather, it is able to yield a wealth of
indirect structural information from which the three-dimensional structure can only be
revealed by extensive data analysis and computer calculations. The principle of a NMR
structure determination can be summarized as follows: preparation of the protein solution, the
NMR measurements, the assignment of NMR signals to individual atoms in the molecule,
identification of conformational constrains (e.g. distances between hydrogen atoms), the
calculation of the 3D structure on the basis of the experimental constraints.
In principle, each spin in one molecule should be characterized by a unique NMR line, so that
the NMR spectrum of a protein will show NMR signals of each spin with slightly different
frequencies. In the initial stage of investigation by NMR spectroscopy, each resonance
observed in an NMR spectrum must be assigned to a specific nucleus in the investigated
molecule. Experiments such as 2D COSY and TOCSY are employed for the identification of
amino acid spin systems. Normally, each spin system will contain all the atoms of one amino
acid residue. The first step in sequential assignment is the identification of certain amino
acids by using the marker tool. Once a spin system is found, and noted with one or several
markers, the same process is repeated till all the spin systems are assigned. Once the NMR
signals are assigned, experimental parameters which define the three-dimensional structure
are measured.
Structural information from NMR experiments comes primarily from magnetization transfer
between pairs of protons through bond (scalar or J coupling) or through space (the Nuclear
Overhauser Effect NOE). J-coupling constants, which are mediated through chemical bonds
provide information about dihedral angles, and thus can define the peptide backbone and side
chain conformations. The intensity of a NOE is proportional to the inverse of the sixth power
of the distance separating the two nuclei.
NOE is a sensitive probe of short internuclear distances, based on the nuclear Overhauser
effect (NOE), which is a result of cross-talk between different spins (normally protons) and
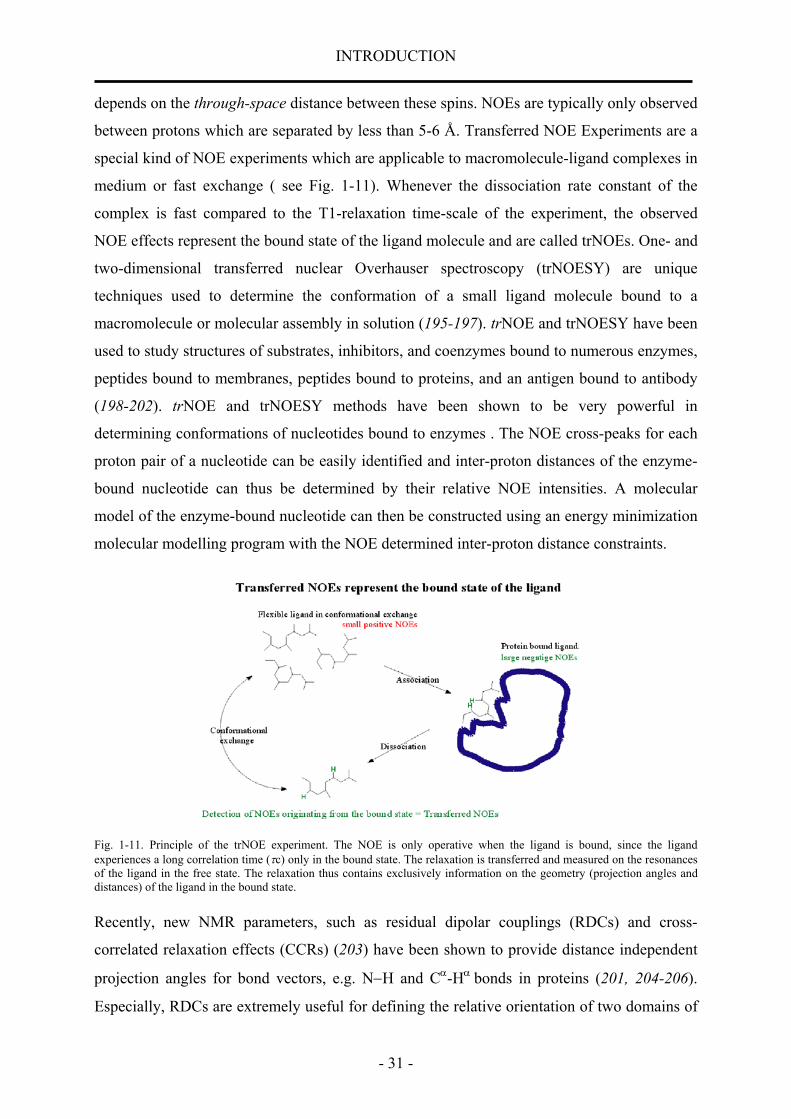
INTRODUCTION
- 31 -
depends on the through-space distance between these spins. NOEs are typically only observed
between protons which are separated by less than 5-6 Å. Transferred NOE Experiments are a
special kind of NOE experiments which are applicable to macromolecule-ligand complexes in
medium or fast exchange ( see Fig. 1-11). Whenever the dissociation rate constant of the
complex is fast compared to the T1-relaxation time-scale of the experiment, the observed
NOE effects represent the bound state of the ligand molecule and are called trNOEs. One- and
two-dimensional transferred nuclear Overhauser spectroscopy (trNOESY) are unique
techniques used to determine the conformation of a small ligand molecule bound to a
macromolecule or molecular assembly in solution (195-197). trNOE and trNOESY have been
used to study structures of substrates, inhibitors, and coenzymes bound to numerous enzymes,
peptides bound to membranes, peptides bound to proteins, and an antigen bound to antibody
(198-202). trNOE and trNOESY methods have been shown to be very powerful in
determining conformations of nucleotides bound to enzymes . The NOE cross-peaks for each
proton pair of a nucleotide can be easily identified and inter-proton distances of the enzyme-
bound nucleotide can thus be determined by their relative NOE intensities. A molecular
model of the enzyme-bound nucleotide can then be constructed using an energy minimization
molecular modelling program with the NOE determined inter-proton distance constraints.
Fig. 1-11. Principle of the trNOE experiment. The NOE is only operative when the ligand is bound, since the ligand experiences a long correlation time (τc) only in the bound state. The relaxation is transferred and measured on the resonances of the ligand in the free state. The relaxation thus contains exclusively information on the geometry (projection angles and distances) of the ligand in the bound state.
Recently, new NMR parameters, such as residual dipolar couplings (RDCs) and cross-
correlated relaxation effects (CCRs) (203) have been shown to provide distance independent
projection angles for bond vectors, e.g. N−H and Cα-Hα bonds in proteins (201, 204-206).
Especially, RDCs are extremely useful for defining the relative orientation of two domains of

INTRODUCTION
- 32 -
a protein (NOEs between separate domains are often not observed due to the 5 Å upper
distance limit for observation of an NOE). Recently, it was found, that it is possible to
measure residual dipolar couplings in solution by weakly aligning a molecule in the solution
(194, 207, 208). If only a fraction of 1 out of 1000 molecules is aligned, the dipolar couplings,
which in the solid state are in the kHz range, are scaled down to a few Hz. The weakly
alignment could be introduced by anisotropic solution, e.g. bicelle type lyotropic liquid
crystals (209), phage particles (210, 211), purple membrane fragments (212, 213) or strained
polyacrylamide gels (214-216) (for an overview see (217)). This allows to utilize the distance
and the angle dependence of dipolar couplings in order to obtain orientational restraints, while
still obtaining high-resolution NMR spectra. As shown by equation (1-1), if angles are
available from structure, RDCs will provide useful distance restraints for structure refinement
(218); if the internuclear distance is fixed, as in one-bond spins, N-H, C-H, RDCs will provide
useful angular restraints for refining or directly determine the structure of proteins (219),
nucleic acids (220) or carbohydrates (221). Residual dipolar couplings provide not only
additional structural information, but are crucial to define long range interactions, e.g. the
relative orientation of two protein domains (222, 223). For most studies unspecific
interactions between the alignment medium and the solute are used to obtain structural
information. However, similar to transferred NOE (202, 224), transferred cross correlated
relaxation (225-227), specific interactions in the limit of weak binding can be also exploited
to obtain information about transiently bound peptides and proteins (228, 229).
In studies of molecular complexes, binding strength is of central importance for the selection
of appropriate NMR experiments. Strongly bound complexes with an affinity that exceeds the
micromolar range can often be considered as a single entity and the weight limit for high-
resolution NMR applies to the overall complex. Within this weight limit the structure of the
entire complex is accessible. Isotope labelling of only one interaction partner allows reduction
of spectral complexity and application of elaborate spectral editing schemes. Deuterium
labelling might be advantageous to reduce dipolar relaxation and thus spectral linewidth.
Weakly bound complexes (affinity smaller than 10 mM) offer an opportunity to obtain at least
some structural data of molecular assemblies that exceed the weight limit of high-resolution
NMR. Of practical importance is the case where the interacting molecules have very different
size. The smaller molecule in the complex is usually termed the "ligand". Fast exchange
between free and bound ligand is crucial for a class of experiments that allow determination
of the bound ligand structure. Cross-relaxation is much more efficient in the macromolecule-
INTRODUCTION
- 33 -
bound ligand compared to the free state. Dipolar couplings are zero in case of an isotropically
tumbling free ligand but can be very large if the ligand is bound to an aligned macromolecule.
Nuclear Overhauser enhancements (NOEs) and residual dipolar couplings (RDCs) detected
with standard high-resolution NMR on the free form of a rapidly exchanging ligand are
therefore dominated by contributions originating in the bound state and can be used to
characterize of the bound ligand. This approach was recently used to determine the high-
resolution structure and orientation of a fragment of the G-protein transducin bound to the
membrane receptor rhodopsin in its natural environment, a disk membrane vesicle prepared
from rod cells of bovine retinas (230).
1.8 Structural studies by solid-state NMR spectroscopy
Over the past two decades, solid-state NMR has emerged as a powerful method for structural
studies of soft solid biomolecules, such as membrane proteins and amyloid systems. In
contrast to that in solution, fast molecular tumbling in most solids is absent and signals in the
spectrum is extremely broad (≈ 150 ppm) and generally uninterpretable due to three major
anisotropic interactions: chemical shift anisotropy (CSA), homonuclear dipolar interactions
and heteronuclear dipolar couplings of spin ½ nuclei. To overcome this problem, the magic-
angle spinning (MAS) technique has been developed to obtain high resolution spectra, where
the spectral resolution is highly improved by mechanically rotating the sample at the “magic”
angle, that is around an axis tilted of 54.7° relative to the external magnetic field. The rotation
about this axis removes the broadening and leads to a considerable sharpening of the lines in
spectrum.
MAS introduced NMR spectra provides sufficiently resolved peaks and allows us to extract
the information about the structure or dynamics of the molecule. This has important
advantages for structural investigations by solid-sate MAS NMR. First, well-established
strategies for resonance assignment known from solution NMR can be implemented in solid-
state MAS NMR, and chemical shift databases compiled from solution NMR studies can be
accessed to identify amino-acids by means of their characteristic side-chain correlation
patterns.
1.8.1 Theory of solid-state NMR spectroscopy
For a spin in the external magnetic field, the Hamiltonian could be written as

INTRODUCTION
- 34 -
H = HZ + HCS + HD + HJ +HQ. [1-2]
Hz is the Zeeman Hamiltonian, describing the interaction of the spin (I) with the external
magnetic field and has the form
Hz = − γ I B0, [1-3]
where γ is the gyromagnetic ratio of the spin I and B0 is the external magnetic field.
HCS describes the effect of B0 on the surrounding electrons and could be written as
HCS = γ σ I B0, [1-4]
where σ is the shielding tensor and has orientation dependence. Considering the anisotropy of
the chemical shift, one could divide the chemical shift Hamiltonian into an isotropic term and
an anisotropic term as
( )[ ]
+−+= φθηθσσγ 2cossin1cos3
21 22
0 CSACSAisoZCS BIH , [1-5]
where, σiso is the isotropic chemical shielding factor (σiso = 1/3 (σ11 + σ22 + σ33)), σCSA is the
anisotropy of the chemical shifts and ηCSA is the asymmetry of the chemical shift shielding
tensor. The two angles θ and φ describe the orientation of the chemical shielding tensor with
respect to the B0 field.
HD is the dipolar Hamiltonian which describes the through-space coupling between two
nuclear spins I and S. For the homonuclear dipolar coupling it has the form as
( ) ( )
−
−−= ISSI
rH ZZ
IS
KID 2
122
1cos34
2
30 θγγ
πµ h , [1-6]
and for heteronuclear dipolar coupling it has the form as
( )ZZ
IS
KID SI
rH 2
21cos3
4
2
30 −
−=θγγ
πµ h , [1-7]
where, µ0 is the permeability of free space, γI and γS are gyromagnetic ratios of the I and S
spins, respectively, rIS is the internucelar distance and IZ and SZ are the components of the
nuclear spin angular momentum operators I and S, respectively. The angle θ describes the

INTRODUCTION
- 35 -
orientation of the internuclear vector with respect to the orientation of the external magnetic
field.
HJ is the J-coupling Haniltonian which describes the coupling between two nuclei that is
mediated through the electrons and has the form as
ISJH ISJ π2= , [1-8]
where JIS is a second-rank tensor whose size depends on the orientation of the molecule
relative to the static magnetic field.
Usually HQ is the quadrupolar coupling for a spin whose spin-quantum number is larger than
½ and has the form as
( ) ( )[ ] ( )( )132cossin1cos321
122222
2
+−+−−
= IIIaIIqQeH ZkQ αθηθ . [1-9]
It is clear from these equations that HCS, HD, HJ and HQ all have the analogous angular terms
and are of orientation dependence. In liquid state, molecules usually are tumbling very fast
due to Brownian motion, and such a fast tumbling leads to a time averaging of all orientation-
dependent properties. Therefore, the spin Hamiltonian in liquids appears to be purely isotropic
and only the isotropic average of any anisotropic parts of the Hamiltonian could be observed.
However, in solids, there is much less mobility in the molecule, therefore, these anisotropic
terms remain invariant over time and result in line broadening as shown in Fig. 1-12.
Fig. 1-12. Comparison of solution 13C spectrum and solid-state 13C spectrum.

INTRODUCTION
- 36 -
1.8.2 Basic solid-state NMR techniques
Magic Angle Spinning
One approach to eliminate the interactions to give narrower lines is magic angle sample
spinning (231, 232). This is done because the value of (3cos2θ − 1) term is zero when the
vector between two nuclei makes an angle θ = 54.74° (the magic angle) with the static
magnetic field as shown in Fig. 1-13. Therefore, chemical shift anisotropy, dipolar couplings
and quadrupolar interactions can be averaged to zero. J coupling is on the order of 102 Hz, is
much smaller to be observable in solid-state NMR.
B0
54.7°
ωr
Fig. 1-13. Magic Angle Spinning of a rotor with a spinning frequency of ωr.
To date the effect of MAS on different Hamiltonians, homogeneous and inhomogeneous
Hamiltonians would be introduced here. Anisotropic interactions can be divided into
inhomogeneous interactions including the chemical shift, the first-order quadrupolar
interaction and heteronuclear dipolar coupling and homogeneous one referring to
homonuclear dipolar interactions. In the inhomogeneous case, for example, in a 13C spectrum,
where the CSA interaction overrides the homonuclear dipolar interaction, the broad line splits
up into many narrow lines which are spaced by the spinning frequency under MAS at a low
spinning frequencies . If we increase the spinning frequency, the spacing of the lines gets
larger and finally we end up with a single line at the isotropic chemical shift (seen in Fig. 1-
14). The same effect of MAS is presented on a spectrum where the heteronuclear dipolar
coupling interaction is the dominant interaction experienced by the spin. Although these
sidebands are often a nuisance (they can be minimized by spinning at a frequency greater than
the width of the CSA pattern), in some instances their presence provides additional
information about a sample (233).
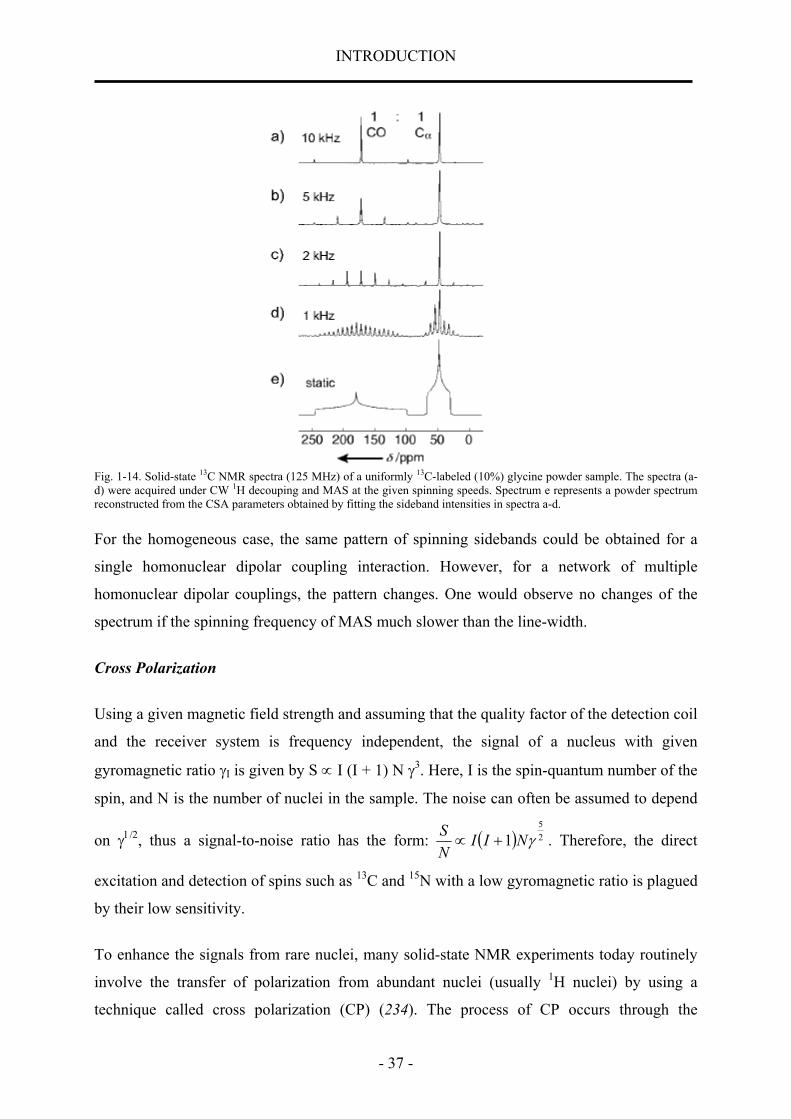
INTRODUCTION
- 37 -
Fig. 1-14. Solid-state 13C NMR spectra (125 MHz) of a uniformly 13C-labeled (10%) glycine powder sample. The spectra (a-d) were acquired under CW 1H decouping and MAS at the given spinning speeds. Spectrum e represents a powder spectrum reconstructed from the CSA parameters obtained by fitting the sideband intensities in spectra a-d.
For the homogeneous case, the same pattern of spinning sidebands could be obtained for a
single homonuclear dipolar coupling interaction. However, for a network of multiple
homonuclear dipolar couplings, the pattern changes. One would observe no changes of the
spectrum if the spinning frequency of MAS much slower than the line-width.
Cross Polarization
Using a given magnetic field strength and assuming that the quality factor of the detection coil
and the receiver system is frequency independent, the signal of a nucleus with given
gyromagnetic ratio γI is given by S ∝ I (I + 1) N γ3. Here, I is the spin-quantum number of the
spin, and N is the number of nuclei in the sample. The noise can often be assumed to depend
on γ1/2, thus a signal-to-noise ratio has the form: ( ) 25
1 γNIINS
+∝ . Therefore, the direct
excitation and detection of spins such as 13C and 15N with a low gyromagnetic ratio is plagued
by their low sensitivity.
To enhance the signals from rare nuclei, many solid-state NMR experiments today routinely
involve the transfer of polarization from abundant nuclei (usually 1H nuclei) by using a
technique called cross polarization (CP) (234). The process of CP occurs through the

INTRODUCTION
- 38 -
tendency of the magnetization to flow from highly polarized nuclei to nuclei with lower
polarizations when the two are brought into contact, similar to heat flow from a hot object to a
cold object when the two are in thermal contact. For homonuclear spins, the magnetization
can be exchanged through mutual energy conserving spin flips. For heteronuclear pairs such
as 1H and 13C, these spin flips are not energy-conserving at high magnetic fields. Therefore,
the exchange of magnetization must be driven externally by the application of RF fields.
Among the techniques for establishing a dipolar contact between two different spin systems I
and S, a particularly effective approach is that of Hartmann and Hahn. The Hartmann-Hahn
method requires the simultaneous application of two continuous RF fields, one at the
resonance frequency of the I spin and one at the resonance frequency of the S spin. The effect
of any RF field is to rotate the magnetization about the axis of the applied field. The rotation
rate depends on the frequency and amplitude of the RF field. An RF field that oscillates at the
I-spin frequency, for example, 500 MHz, would have essentially no effect on S spins with a
frequency of 125 MHz and vice versa. By applying two RF fields, one tuned to the I spins and
the other to the S spins, both the I and S spins can be rotated independently around a
particular axis at rates determined by the amplitudes of the two applied fields. When the
rotation frequencies of the I and S spins are equal, an energy conserving dipolar contact
between the two spin systems is created. The differences in energy are supplied by the RF
fields. It is through this dipolar contact that the polarization is transferred between the I and S
spins. One way to describe how this connection is established is by using a reference frame
rotating at both the I and the S spin rotation frequencies. In the doubly rotating frame, the
spacing between the spin-up and spin-down energy levels is equal for the I and S spins .
The experimental implementation of this concept to obtain high-resolution NMR spectra of
rare or dilute S spins is shown in Fig. 1-15. First, the proton magnetization is brought into the
xy plane by a π/2 pulse. RF fields are then applied to the I and S spins for a period τCP,
causing the magnetization to be exchanged between the I spins and the S spins in their
respective rotating frame. Finally, the S spins are detected while the I spins are decoupled.
This sequence forms the basis of proton-enhanced NMR spectroscopy which, through the
combination of CP and MAS, opened the way to routine high-sensitivity, high-resolution,
solid-state 13C NMR spectroscopy. The increase in the S-spin magnetization during the CP

INTRODUCTION
- 39 -
Fig. 1-15. Pulse sequence for CP of 13C (S) nuclei by protons (I) with detection of the 13C magnetization.
mixing period τCP depends on the strength of the I ± S dipolar coupling. The polarization
buildup in the unprotonated carbonyl carbon atom requires a longer CP time than for the
α carbon atom, which is quickly polarized by its bonded protons. Typical mixing times range
from 100 µs to 10 ms. The polarization buildup curve starts to decay beyond a certain mixing
time as a result of relaxation and magnetization-transport phenomena.
The maximum enhancement for a CP contact period under the Hartmann-Hahn conditions
ωΙ = ωS (γΙΒΙ = γSBS) is γΙ/γS (γI and γS are gyromagnetic ratios of spins I and S, respectively;
BI and BS are nutation rates imposed by the RF fields). Apart from gaining a factor of by using
the CP, the relaxation properties of high-abundance nuclei would also be useful. In most
NMR experiments, the acquisition or sampling rate is dictated by the relaxation time (T1) of
the detected nuclei. Under CP conditions, the sampling rate depends on the relaxation time of
the nuclei from which the magnetization is transferred. As the protons in the solid state
typically relax more rapidly than most other spin ½ nuclei, many more scans can be acquired
in a given amount of time in such an experiment than in a simple single-pulse experiment that
detects the rare 13C nucleus directly.
Heteronuclear dipolar decoupling
In principle, MAS is sufficient to average out all anisotropic second-rank tensor contributions
to the Hamiltonian. Experimentally we find that even at spinning frequencies as high as 50
kHz the 13C spectrum of a protonated sample is still quite broad if we do not apply proton
decoupling. As have been known, a proton whose spin is parallel to the external field (spin-
up) produces a shift in the resonance frequency of a 13C nucleus that is opposite to the shift
produced by a proton whose spin is antiparallel to the external field (spin-down). By
constantly applying radio-frequency (RF) pulses that rotate the proton nuclear spins between
their spin-up and spin-down states, the average orientation of the 1H magnetic moments tends

INTRODUCTION
- 40 -
to zero, and the dipolar coupling is essentially averaged away (this also applies to the J
coupling) (235, 236). This continuous wave (CW) spin decoupling is widely used to eliminate
heteronuclear couplings in solid-state NMR spectroscopy.
Recently, multipulse decouplings have been successfully employed for heteronuclear
decoupling. The two-pulse phase modulation (TPPM) was shown to produce results superior
to simple CW decouping, particularly under MAS (237). As shown in Fig. 1-16 the TPPM
sequence breaks the CW irradiation into a series of discrete time periods τ (in the order of 3 ±
20 µs) during which the phase of the irradiation alternates between φ/2 and φ/2. Typically, the
values of τ and φ must be optimized for a particular sample in order to produce the smallest
possible line widths. A typical φ value is about 50°, and τ is often adjusted to give a flip angle
of approximately 150°.
Fig. 1-16. TPPM heteronuclear dipolar decoupling sequence. RF irradiation is applied continuously, with an alternating phase shift of +φ/2 and –φ/2, for every time period τ.
Homonuclear dipolar decoupling
For low-γ nuclei such as 13C and 15N, the homonuclear dipolar coupling can often be removed
by MAS, as even for directly bonded 13C nuclei, the dipolar coupling constant d does not
exceed 5 kHz. The homonuclear dipolar interaction has perhaps the largest impact on 1H
solid-state NMR spectroscopy, as the strength of the homonuclear dipolar coupling between
two proton spins can routinely approach 100 kHz because of their large gyromagnetic ratio.
The problem of strong 1H-1H dipolar coupling is exacerbated by the high abundance of
protons in most organic systems, which results in a network of strongly coupled spins that are
very difficult to decouple from each other. As a result, solid-state 1H MAS NMR spectra
typically consist of a single broad peak, with a line width in the order of 50 kHz. In contrast to
the success for heteronuclear decoupling, CW has no effect on the homonuclear decoupling
since the magnetization of the two nuclei cannot be manipulated independently. Other

INTRODUCTION
- 41 -
multipulse sequences like WAHUHA (238), MREV-8 (239), BR-24 (240) and MSHOT (241)
have been much more successful in many applications. These techniques would be talked in
detail here since they are not so often used in this work.
The elegant techniques outlined here are powerful and often sufficient tools for many
applications in basic chemical analysis and characterization of solid samples. A combination
of high-power CW decoupling, cross-polarization, high-speed MAS and advanced multipulse
and multidimensional techniques, can rapidly yield one-dimensional solid-state spectra of
compounds containing spin 1/2 nuclei of low natural abundance such as 13C, 15N, and 29Si,
with sufficient spectral sensitivity and resolution.
1.9 Overview of this thesis
Knowledge of the Aβ fibril structure is essential for understanding the abnormal assembly and
deposition of these fibrils and could lead to the rational design of therapeutic agents for the
prevention or even disaggregation of the fibrils. Moreover, elucidation of the structure of Aβ
fibrils would be an important step towards understanding the propagating structure of other
fibrillar proteins involved in amyloidosis.
We reasoned that compounds which bind Aβ would be likely to alter its aggregation pathways
and thereby prevent its toxic effects. Compounds with these characteristics serve as useful
probes for the molecular mechanisms underlying amyloid formation and pathology and as
leads for the design of therapeutic agents. We were especially interested in investigating the
interactions between Aβ and several inhibitors which are known to prevent fibril formation.
Working with full length Aβ peptides requires special precautions and preconditioning of the
samples. In this thesis, Aβ14-23 was initially selected as a model peptide for inhibition studies.
The selection of Aβ14-23 was based on the following considerations: (1) Model peptide studies
have demonstrated that truncated peptides form fibrils morphologically similar to those of the
full-length peptide (59, 121, 129, 176); the short fragment Aβ14-23 of the Αβ1-40 peptide was
reported to be the shortest fibril-forming peptide (59); substitutions in this decapeptide
impaired fibril formation and deletion of the decapeptide from Αβ1-42 inhibited fibril
formation completely. (2) Aβ14-23 incorporates the core region, point mutations of which
significantly obstruct fibril formation; in some cases, such modifications have been used to
generate inhibitors of fibrillogenesis (59, 148, 149, 151, 172, 189, 190). (3) The use of Aβ14-23

INTRODUCTION
- 42 -
allowed the reproducible and controlled formation of fibrils from aqueous solutions, under
defined conditions of pH, ionic strength, and peptide concentration, and thus yielded the
required homogeneous fibrils.
The central hydrophobic region in the N-terminal domain of Aβ , amino acids 17-20 (LVFF),
served as a template for designing the β−sheet breaker peptide iAβ5 (LPFFD) and
KLVFFKK, which are known to prevent neurotoxicity in cell essays (53, 148, 173).
The aim of this work was to determine the bound-state structure of peptide inhibitor to Aβ
fibrils. In this work, Aβ14-23 and its inhibitors (iAβ5, iAβ5inv and KLVFFKK) with and
without spin-labelling were first synthesized via the Fmoc-SPPS protocol. The solution
structure of these peptide inhibitors in the presence of Aβ1-40 or Aβ14-23 fibrils were
investigated by multidimensional solution NMR spectroscopy. Furthermore, the model of
inhibitors bound to Aβ fibrils were determined by molecular docking. The structure
information is potentially of interest to design peptide mimetics with a higher bioavailability,
is supposed to be valuable structural information for amyloid fibril proteins/peptides.
Furthermore, the structure of fibrils formed from de novo peptides was studied by solid-state
NMR. The idea behind it is that the such a simplified system could be more easily handled
and offer additional insights into the molecular details of amyloid fibril formation which may
be common to all fibril formation process of amyloidogenic proteins or peptides.
References
1. Koo, E., Lansbury, P. J., and Kelly, J. (1999) Proc. Natl. Acad. Sci. 96, 9989-9990. 2. Hardy, J. (1997) Proc. Natl. Acad. Sci. 94, 2095-2097. 3. Ironside, J., and Head, M. (2004) Curr. Top. Microbiol. Immunol. 284, 133-159. 4. Jeffrey, M., and Gonzalez, L. (2004) Curr. Top. Microbiol. Immunol. 284, 65-97. 5. Kelly, J. W. (2000) Nat. struct. biol. 7, 824-826. 6. Kelly, J. W. (2002) Nat. Struct. biol. 9, 323-325. 7. Meredith, L. (2004) Methods Mol. Med. 92, 183-202. 8. Bellotti, V., Mangione, P., and Merlini, G. (2000) J. Struct. Biol. 130, 280-289. 9. Braak, H., and Tredici, K. D. (2004) Neurobiol. Aging 25, 713–718. 10. Clippingdale, A. B., Wade, J. D., and Barrow, C. J. (2001) J. Peptide Sci. 7, 227-249. 11. Chiti, F., Calamai, M., Taddei, N., Stefan, M., Rampon, G., and Dobson, C. (2002)
Proc. Natl. Acad. Sci. 9, 16419-16426. 12. Damas, A. M., and Saraiva, M. J. (2000) J. Struct. Biol. 130, 290-299. 13. El-Agnaf, O. M. A., and Irvine, G. B. (2000) J. Struct. Biol. 130, 300-309. 14. Goldsbury, C., Goldie, K., Pellaud, J., Seelig, J., Frey, P., Mueller, S. A., Kistler, J.,
Cooper, G. J. S., and Aebi, U. (2000) J. Struct. Biol. 130, 352-362.

INTRODUCTION
- 43 -
15. Jaroniec, C., MacPhee, C., Astrof, N., Dobson, C., and Griffin, R. (2002) Proc. Natl. Acad. Sci. 99, 16748-16753.
16. Kessler, J. C., Rochet, J.-C., and Peter T. Lansbury, J. (2003) Biochemistry 42, 672-678.
17. Kisilevsky, R. (2000) J. Struct. Biol. 130, 99-108. 18. McParland, V., Kalverda, A., Homans, S., and Radford, S. (2002) Nat. Struct. Biol. 9,
326-331. 19. Sipe, J. D., and Cohen, A. S. (2000) J. Struct. Biol. 130, 89-98. 20. Soto, C. (1999) J. Mol. Med. 77, 412-418. 21. Hardy, J., and Selkoe, D. (2002) Science 297, 353-356. 22. Lansbury, P. J. (1999) Proc. Natl. Acad. Sci. 96, 3342-3344. 23. Masliah, E., Hansen, L. A., Rockenstein, E., and Hashimoto, M. (2002) Drug Dev.
Res. 56, 282-292. 24. Morozova-Roche, L. A., Zurdo, J. s., Spencer, A., Noppe, W., Receveur, V., Archer,
D. B., Joniau, M., and Dobson, C. M. (2000) J. Struct. Biol. 130, 339–351. 25. Selkoe, D. (2002) J. Clin. Invest. 110, 1375-1381. 26. Soto, C. (2001) FEBS Letters 498, 204-207. 27. Tycko, R. (2003) Biochemistry 42, 3151-3159. 28. Paz, M. L. p. d. l., and Serrano, L. (2004) Proc. Natl. Acad. Sci. 101, 87-92. 29. Hoshino, M., Katou, H., Hagihara, Y., Hasegawa, K., Naiki, H., and Goto, Y. (2002)
Nat. Struct. Biol. 9, 332-336. 30. Miranker, A. D. (2004) Proc. Natl. Acad. Sci. 101, 4335–4336. 31. Zurdo, J. s., Guijarro, J. I. a., and Dobson, C. M. (2001) J. Am. Chem. Soc. 123, 8141-
8142. 32. Kammerer, R. A., Kostrewa, D., Zurdo, J. s., Detken, A., Garcý´a-Echeverrý´a, C.,
Green, J. D., ller, S. A. M., Meier, B. H., Winkler, F. K., Dobson, C. M., and Steinmetz, M. O. (2004) Proc. Natl. Acad. Sci. 101, 4435–4440.
33. Paz, M. L. p. d. l., Goldie, K., Zurdo, J., Lacroix, E., Dobson, C. M., Hoenger, A., and Serrano, L. (2002) Proc. Natl. Acad. Sci. 99, 16052–16057.
34. Lim, A., Makhov, A. M., Bond, J., Inouye, H., Connors, L. H., Griffith, J. D., Erickson, B. W., Kirschner, D. A., and Costello, C. E. (2000) J. Struct. Biol. 130, 363–370.
35. Fezoui, Y., Hartley, D., Walsh, D., Selkoe, D., Osterhout, J., and Teplow, D. (2000) Nat. Struct. Biol. 7, 1095-1099.
36. Kim, Y.-S., Randolph, T. W., Manning, M. C., Stevens, F. J., and Carpenter, J. F. (2003) J. Biol. Chem. 278, 10842-10850.
37. Ashburn, T., Han, H., McGuinness, B., and Lansbury, P. J. (1996) Chem. Biol. 3, 351-358.
38. Turnell, W., and Finch, J. (1992) J. Mol. Biol. 227, 1205-1223. 39. Lorenzo, A., and Yankner, B. A. (1994) Proc. Natl. Acad. Sci. 91, 12243-12247. 40. Lashuel, H. A., LaBrenz, S. R., Woo, L., Serpell, L. C., and Kelly, J. W. (2000) J. Am.
Chem. Soc. 122, 5262-5277. 41. McLaurin, J., Yang, D.-S., Yip, C. M., and Fraser, P. E. (2000) J. Struct. Biol. 130,
259-270. 42. Crowther, R. A., and Goedert, M. (2000) J. Struct. Biol. 130, 271-279. 43. Blake, C., and Serpell, L. (1996) Structure. 4, 989-998. 44. Kirschner, D., Abraham, C., and Selkoe, D. (1986) Proc. Natl. Acad. Sci. 82, 503-507. 45. Inouye, H., Fraser, P. E., and Kirschner, D. A. (1993) Biophys. J. 64, 502-519. 46. Malinchik, S. B., Inouye, H., Szumowski, K. E., and Kirschner, D. A. (1998) Biophys.
J. 74, 537–545. 47. Lynn, D. G., and Meredithb, S. C. (2000) J. Struct. Biol. 130, 153-173.

INTRODUCTION
- 44 -
48. Sunde, M., Serpell, L., Bartlam, M., Fraser, P., Pepys, M., and Blake, C. (1997) J. Mol. Biol. 273, 729-739.
49. Tycko, R. (2004) Curr. Opin. Struct. Biol. 14, 96-103. 50. Cairo, C. W., Strzelec, A., Murphy, R. M., and Kiessling, L. L. (2002) Biochemistry
41, 8620-8629. 51. Kirschner, D., Inouye, H., Duffy, L., Sinclair, A., Lind, M., and Selkoe, D. (1987)
Proc. Natl. Acad. Sci. 84, 6953-6957. 52. Lambert, M., Barlow, A., Chromy, B., Edwards, C., Freed, R., Liosatos, M., Morgan,
T., Rozovsky, I., Trommer, B., Viola, K., Wals, P., Zhang, C., Finch, C., Krafft, G., and Klein, W. (1998) Proc. Natl. Acad. Sci. 95, 6448-6453.
53. Pallitto, M. M., Ghanta, J., Heinzelman, P., Kiessling, L. L., and Murphy, R. M. (1999) Biochemistry 38, 3570-3578.
54. Antzutkin, O. N., Leapman, R. D., Balbach, J. J., and Tycko, R. (2002) Biochemistry 41, 15436-15450.
55. Talafous, J., Marcinowski, K., Klopman, G., and Zagorski, M. (1994) Biochemistry 33, 7788-7796.
56. Soto, C., Branes, M., Alvarez, J., and Inestrosa, N. (1994) J. Neurochem. 63, 1191-1198.
57. Chaney, M., Webster, S., Kuo, Y., and Roher, A. (1998) Protein Eng. 11, 761-767. 58. Li, L., Darden, T., Bartolotti, L., Kominos, D., and Pedersen, L. (1999) Biophys. J. 76,
2871-2878. 59. Tjernberg, L. O., Callaway, D. J. E., Tjernberg, A., Hahne, S., Lilliehöök, C.,
Terenius, L., Thyberg, J., and Nordstedt, C. (1999) J. Biol. Chem. 274, 12619–12625. 60. Petkova, A. T., Ishii, Y., Balbach, J. J., Antzutkin, O. N., Leapman, R. D., Delaglio,
F., and Tycko, R. (2002) Proc. Natl. Acad. Sci. 99, 16742–16747. 61. Barrow, C., and Zagorski, M. (1991) Science 253, 179-182. 62. Crescenzi, O., Tomaselli, S., Guerrini, R., Salvadori, S., D’Ursi, A. M., Temussi, P.
A., and Picone, D. (2002) Eur. J. Biochem. 269, 5642–5648. 63. Serpell, L., Blake, C., and Fraser, P. (2000) Biochemistry 39, 13269-13275. 64. Serpell, L. (2000) Biochim. Biophys. Acta. 1502, 16-30. 65. Shao, H., Jao, S.-c., Ma, K., and Zagorski, M. G. (1999) J. Mol. Biol. 285, 755-773. 66. Selkoe, D. (2001) Physiol. Rev. 81, 741-766. 67. Sommer, B. (2002) Curr. Opin. Pharmacol. 2, 87-92. 68. Glenner, G. G., and Wong, C. (1984) Biochem. Biophys. Res. Commun. 120, 885-890. 69. Selkoe, D. (1991) Neuron. 6, 487-498. 70. Selkoe, D. (1996) J. Biol. Chem. 271, 18295-18298. 71. Selkoe, D. (1997) Science 275, 630-631. 72. Selkoe, D. (2002) Science 298, 789-791. 73. Selkoe, D., Physicians, A. C. o., and Society, A. P. (2004) Ann. Intern. Med. 140, 627-
638. 74. Selkoe, D., and Schenk, D. (2003) Annu. Rev. Pharmacol. Toxicol. 43, 545-584. 75. Selkoe, D. J. (1991) Nature 354, 432-433. 76. Adessi, C., and Soto, C. (2002) Drug Dev. Res. 56, 184-193. 77. Mehta, P. D., and Pirttilä, T. (2002) Drug Dev. Res. 56, 74-84. 78. Fassbender, K., Masters, C., and Beyreuther, K. (2001) Naturwissenschaften. 88, 261-
267. 79. Fine, R. E. (1999) Alzheimer Disease and Associated Disorders 13, S82-S87. 80. Butterfield, D. A., and Bush, A. I. (2004) Neurobiol. Aging 25, 563–568. 81. Cherny, R. A., Barnham, K. J., Lynch, T., Volitakis, I., Li, Q.-X., McLean, C. A.,
Multhaup, G., Beyreuther, K., Tanzi, R. E., Masters, C. L., and Bush, A. I. (2000) J. Struct. Biol. 130, 209-216.

INTRODUCTION
- 45 -
82. Chung, T., Sipe, J., McKee, A., Fine, R., Schreiber, B., Liang, J., and Johnson, R. (2000) Amyloid 7, 105-110.
83. Hutton, M., and Hardy, J. (1997) Hum. Mol. Genet. 6, 1639-1646. 84. Golabek, A., Soto, C., Vogel, T., and Wisniewski, T. (1996) J. Biol. Chem. 271,
10602-10606. 85. Evans, K., Berger, E., Cho, C., Weisgraber, K., and Lansbury, P. J. (1995) Proc. Natl.
Acad. Sci. 92, 763-767. 86. Liu, K., Cho, H. S., Lashuel, H. A., Kelly, J. W., and Wemmer, D. E. (2000) Nat.
Struct. biol. 7, 754-757. 87. Liang, J., Sloane, J., Wells, J., Abraham, C., Fine, R., and Sipe, J. (1997) Neurosci.
Lett. 225, 73-76. 88. Adessi, C., Frossard, M.-J., Boissard, C., Fraga, S., Bieler, S., Ruckle, T., Vilbois, F.,
Robinson, S. M., Mutter, M., Banks, W. A., and Soto, C. (2003) J. Biol. Chem. 278, 13905-13911.
89. Mori, H., Takio, K., Ogawara, M., and Selkoe, D. (1992) J. Biol. Chem. 267, 17082-17086.
90. Palmert, M., Podlisny, M., Witker, D., Oltersdorf, T., Younkin, L., Selkoe, D., and Younkin, S. (1989) Proc. Natl. Acad. Sci. 86, 6338-6342.
91. Tamaoka, A., Kalaria, R., Lieberburg, I., and Selkoe, D. (1992) Proc. Natl. Acad. Sci. 89, 1345-1349.
92. Näslund, J., Schierhorn, A., Hellman, U., Lannfelt, L., Roses, A. D., Tjernberg, L. O., Silberring, J., Gandy, S. E., Winblad, B., Greengard, P., Nordstedt, C., and Terenius, L. (1994) Proc. Natl. Acad. Sci. 91, 8378-8382.
93. Citron, M., Diehl, T., Gordon, G., Biere, A., Seubert, P., and Selkoe, D. (1996) Proc. Natl. Acad. Sci. 93, 13170-13175.
94. Näslund, J., Karlström, A. R., Tjernberg, L. O., Schierhorn, A., Terenius, L., and Nordstedt, C. (1996) J. Neurochem. 67, 294-301.
95. Mattson, M. (1997) Physiol. Rev. 77, 1081-1132. 96. Esler, W. P., and Wolfe, M. S. (2001) Science 293, 1449-1454. 97. Haass, C., Schlossmacher, M., Hung, A., Vigo-Pelfrey, C., Mellon, A., Ostaszewski,
B., Lieberburg, I., Koo, E., Schenk, D., Teplow, D., and al., e. (1992) Nature 359, 322-325.
98. Kuo, Y.-M., Emmerling, M. R., Vigo-Pelfrey, C., Kasunici, T. C., Kirkpatrick, J. B., Murdoch, G. H., Ball, M. J., and Roher, A. E. (1996) J. Biol. Chem. 271, 4077-4081.
99. Roher, A. E., Lowenson, J. D., Clarke, S., Woods, A. S., Cotter, R. J., Gowing, E., and Ball, M. J. (1993) Proc. Natl. Acad. Sci. 90, 10836-10840.
100. Roher, A. E., Chaney, M. O., Kuo, Y.-M., Webster, S. D., Stinei, W. B., Haverkamp, L. J., Woods, A. S., Cotter, R. J., Tuohy, J. M., Krafft, G. A., Bonnell, B. S., and Emmerling, M. R. (1996) J. Biol. Chem. 271, 20631–20635.
101. Walsh, D., Klyubin, I., Fadeeva, J., Cullen, W., Anwyl, R., Wolfe, M., Rowan, M., and Selkoe, D. (2002) Nature 416, 535-539.
102. Caughey, B., and Lansbury, P. J. (2003) Annu. Rev. Neurosci. 26, 267-298. 103. Klein, W. L., Jr., W. B. S., and Teplow, D. B. (2004) Neurobiol. Aging 25, 569–580. 104. Walsh, D., Klyubin, I., Fadeeva, J., Rowan, M., and Selkoe, D. (2002) Biochem. Soc.
Trans. 30, 552-557. 105. Zagorski, M., and Barrow , C. (1992) Biochemistry 31, 5621-5631. 106. Lee, J., Stimson, E., Ghilardi, J., Mantyh, P., Lu, Y.-A., Felix, A., Llanos, W., Behbin,
A., Cummings, M., Criekinge, M. V., Timms, W., and Maggio, J. (1995) Biochemistry 34, 5191-5200.
107. Sorimachi, K., and Craik, D. (1994) Eur. J. Biochem. 219, 237-251. 108. Shen, C.-L., and Murphy, R. M. (1995) Biophys. J. 69, 640-651.

INTRODUCTION
- 46 -
109. Fletcher, T. G., and Keire, D. A. (1997) Protein Sci. 6, 666-675. 110. Hilbich, C., Kisters-Woike, B., Reed, J., Masters, C., and Beyreuther, K. (1991) J.
Mol. Biol. 218, 149-163. 111. Benzinger, T., Gregory, D., Burkoth, T., Miller-Auer, H., Lynn, D., Botto, R., and
Meredith, S. (1998) Proc. Natl. Acad. Sci. 95, 13407-13412. 112. Benzinger, T., Gregory, D., Burkoth, T., Miller-Auer, H., Lynn, D., Botto, R., and
Meredith, S. (2000) Biochemistry 39, 3491-3499. 113. Burkoth, T. S., Benzinger, T. L. S., Urban, V., Morgan, D. M., Gregory, D. M.,
Thiyagarajan, P., Botto, R. E., Meredith, S. C., and Lynn, D. G. (2000) J. Am. Chem. Soc. 122, 7883-7889.
114. Balbach, J. J., Ishii, Y., Antzutkin, O. N., Leapman, R. D., Rizzo, N. W., Dyda, F., Reed, J., and Tycko, R. (2000) Biochemistry 39, 13748-13759.
115. Terzi, E., Holzemann, G., and Seelig, J. (1994) Biochemistry 33, 7434-7441. 116. Lansbury, P. J., Costa, P., Griffiths, J., Simon, E., Auger, M., Halverson, K., Kocisko,
D., Hendsch, Z., Ashburn, T., Spencer, R., and al., e. (1995) Nat. Struct. Biol. 2, 990-998.
117. Coles, M., Bicknell, W., Watson, A., Fairlie, D., and Craik, D. (1998) Biochemistry 37, 11064-11077.
118. Sticht, H., Bayer, P., Willbold, D., Dames, S., Hilbich, C., Beyreuther, K., Frank, R., and Rosch, P. (1995) Eur. J. Biochem. 233, 293-298.
119. Antzutkin, O. N., Balbach, J. J., Leapman, R. D., Rizzo, N. W., Reed, J., and Tycko, R. (2000) Proc. Natl. Acad. Sci. 97, 13045-13050.
120. Balbach, J., Petkova, A., Oyler, N., Antzutkin, O., Gordon, D., Meredith, S., and Tycko, R. (2002) Biophys. J. 83, 1205-1216.
121. Fraser, P., Duffy, L., O'Malley, M., Nguyen, J., Inouye, H., and Kirschner, D. (1991) J. Neurosci. Res. 28, 474-485.
122. Kang, J., Lemaire, H., Unterbeck, A., Salbaum, J., Masters, C., Grzeschik, K., Multhaup, G., Beyreuther, K., and Muller-Hill, B. (1987) Nature 325, 733-736.
123. Eker, F., Griebenow, K., and Schweitzer-Stenne, R. (2004) Biochemistry 43, 6893-6898.
124. Barrow, C., Yasuda, A., Kenny, P., and Zagorski, M. (1992) J. Mol. Biol. 225, 1075-1093.
125. Soto, C., and Castano, E. (1996) Biochem. J. 314, 701-707. 126. Soto, C., Castano, E., Frangione, B., and Inestrosa, N. (1995) J. Biol. Chem. 270,
3063-3067. 127. Soto, C., Castano, E., Kumar, R., Beavis, R., and Frangione, B. (1995) Neurosci. Lett.
200, 105-108. 128. Zagorski, M., J, Y., Shao, H., Ma, K., Zeng, H., and Hong, A. (1999) Methods
Enzymol. 309, 189-204. 129. Fraser, P., Nguyen, J., Surewicz, W., and Kirschner, D. (1991) Biophys. J. 60, 1190-
1201. 130. Teplow, D. B. (1998) Amyloid: Int. J. Exp. Cloin. Invest. 5, 121-142. 131. Murphy, R. M., and Pallitto, M. M. (2000) J. Struct. Biol. 130, 109-122. 132. Wood, S. J., Maleeff, B., Hart, T., and Wetzel, R. (1996) J. Mol. Biol. 256, 870-877. 133. Cannon, M., Williams, A., Wetzel, R., and Myszka, D. (2004) Anal. Biochem. 328,
67-75. 134. Ban, T., Hamada, D., Hasegawa, K., Naiki, H., and Goto, Y. (2003) J. Biol. Chem.
278, 16462-16465. 135. Esler, W. P., Stimson, E. R., Jennings, J. M., Vinters, H. V., Ghilardi, J. R., Lee, J. P.,
Mantyh, P. W., and Maggio, J. E. (2000) Biochemistry 39, 6288-6295.

INTRODUCTION
- 47 -
136. Harper, J., Wong, S., Lieber, C., and Lansbury, P. J. (1999) Biochemistry 38, 8972-8980.
137. Harper, J. D. (1997) Annu. Rev. Biochem. 66, 385–407. 138. Hasegawa, K., Ono, K., Yamada, M., and Naiki, H. (2002) Biochemistry 41, 13489-
13498. 139. Huang, T., Yang, D., Fraser, P., and Chakrabartty, A. (2000) J. Biol. Chem. 275,
36436-36440. 140. Inouye, H., and Kirschner, D. (2000) J. Struct. Biol. 130, 123-129. 141. Jarvet, J., Damberg, P., Bodell, K., Eriksson, L. E. G., and Gräslund, A. (2000) J. Am.
Chem. Soc. 122, 4261-4268. 142. Lakdawala, A. S., Morgan, D. M., Liotta, D. C., Lynn, D. G., and Snyder, J. P. (2002)
J. Am. Chem. Soc. 124, 15150-15151. 143. LEVINE-III, H. (1993) Protein Sci. 2, 404-410. 144. Ma, B., and Nussinov, R. (2002) Proc. Natl. Acad. Sci. 99, 14126-14131. 145. Ma, K., Clancy, E. L., Zhang, Y., Ray, D. G., Wollenberg, K., and Zagorski, M. G.
(1999) J. Am. Chem. Soc. 121, 8698-8706. 146. Stine, W. B. J., Dahlgren, K. N., Krafft, G., and LaDu, M. J. (2003) J. Biol. Chem.
278, 11612-11622. 147. Fezoui, Y., and Teplow, D. (2002) J Biol Chem. 277, 36948-54. 148. Soto, C., Sigurdsson, E., Morelli, L., Kumar, R., Castano, E., and Frangione, B. (1998)
Nat. Med. 4, 822-826. 149. Hilbich, C., Kisters-Woike, B., Reed, J., Masters, C., and Beyreuther, K. (1992) J.
Mol. Biol. 228, 460-473. 150. Wood, S., Wetzel, R., Martin, J., and Hurle, M. (1995) Biochemistry 34, 724-730. 151. Tjernberg, L. O., Näslund, J., Lindqvist, F., Johansson, J., Karlström, A. R., Thyberg,
J., Terenius, L., and Nordstedt, C. (1996) J. Biol. Chem. 271, 8545-8548. 152. Hughes, S. R., Goyal, S., Sun, J. E., Gonzalez-DeWhitt, P., Fortes, M. A., Ried, N. G.,
and Sahasrabudhe, S. R. (1996) Proc. Natl. Acad. Sci. 93, 2065-2070. 153. Makin, O., and Serpell, L. (2002) Biochem. Soc. Trans. 30, 521-525. 154. Mikros, E., Benaki, D., Humpfer, E., Spraul, M., Loukas, S., Stassinopoulou, C., and
Pelecanou, M. (2001) Angew. Chem. Int. Ed. Engl. 40, 3603-3605. 155. Petkova, A. T., Buntkowsky, G., Dyda, F., Leapman, R. D., Yau, W. M., and Tycko,
R. (2004) J. Mol. Biol. 335, 247-260. 156. Tycko, R. (2000) Curr. Opin. Chem. Biol. 4, 500-506. 157. Tycko, R., and Ishii, Y. (2003) J. Am. Chem. Soc. 125, 6606-6607. 158. Serpell, L., and Smith, J. (2000) J. Mol. Biol. 299, 225-231. 159. Serpell, L., Sunde, M., Benson, M., Tennent, G., Pepys , M., and Fraser, P. (2000) J.
Mol. Biol. 300, 1033-1039. 160. Goldsbury, C. S., Wirtz, S., Müller, S. A., Sunderji, S., Wicki, P., Aebi, U., and Frey,
P. (2000) J. Struct. Biol. 130, 217–231. 161. Walsh, D., Hartley, D., Kusumoto, Y., Fezoui, Y., Condron , M., Lomakin, A.,
Benedek, G., Selkoe, D., and Teplow, D. (1999) J. Biol. Chem. 274, 25945-25952. 162. Walsh, D., Lomakin, A., Benedek, G., Condron, M., and Teplow, D. (1997) J. Biol.
Chem. 272, 22364-22372. 163. Harper, J., Wong, S., Lieber, C., and Lansbury, P. (1997) Chem. Biol. 4, 119-125. 164. Lahiri, D. K., Farlow, M. R., Greig, N. H., and Sambamurti, K. (2002) Drug Dev. Res.
56, 267-281. 165. Lansbury, P. T. J. (2001) Nat. Biotechnol. 19, 112-113. 166. D'Andrea, M. R., Lee, D. H. S., Wang, H.-Y., and Nagele, R. G. (2002) Drug Dev.
Res. 56, 194-200.
INTRODUCTION
- 48 -
167. Bohrmann, B., Adrian, M., Dubochet, J., Kuner, P., ller, F. M., Huber, W., Nordstedt, C., and Döbeli, H. (2000) J. Struct. Biol. 130, 232-246.
168. Matsunagaa, Y., Fujiib, A., Awasthia, A., Yokotanib, J., Takakurab, T., and Yamadaa, T. (2004) Regulatory Peptides 120, 227– 236.
169. Tjernberg, L. O., Tjernberg, A., Bark, N., Shi, Y., Ruzsicska, B. P., Bu, Z., Thyberg, J., and Callaway, D. J. E. (2002) Biochem. J. 366, 343-351.
170. Findeis, M. A., Musso, G. M., Arico-Muendel, C. C., Benjamin, H. W., Hundal, A. M., Lee, J.-J., Chin, J., Kelley, M., Wakefield, J., Hayward, N. J., and Molineaux, S. M. (1999) Biochemistry 38, 6791-6800.
171. Permanne, B., Adessi, C. l., Saborio, G. P., Fraga, S., Frossard, M.-J., Dorpe, J. V., Dewachter, I., Banks, W. A., Leuven, F. V., and Soto, C. (2002) FASEB J. 16, 860-862.
172. Soto, C., Kindy, M. S., Baumann, M., and Frangione, B. (1996) Biochemical and Biophysical Research Communications 226, 672–680.
173. Lowe, T. L., Strzelec, A., Kiessling, L. L., and Murphy, R. M. (2001) Biochemistry 40, 7882-7889.
174. Ghanta, J., Shen, C.-L., Kiessling, L. L., and Murphy, R. M. (1996) J. Biol. Chem. 271, 29525-29528.
175. Kim, J., and Murphy, R. (2004) Biophys. J. 86, 3194-3203. 176. Fraser, P., Nguyen, J., Inouye, H., Surewicz, W., Selkoe, D., Podlisny, M., and
Kirschner, D. A. (1992) Biochemistry 31, 10716-10723. 177. Burdick, D., Soreghan, B., Kwon, M., Kosmoski, J., Knauer, M., Henschen, A., Yates,
J., Cotman, C., and Glabe, C. (1992) J. Biol. Chem. 267, 546-554. 178. Fülöp, L. V., Penke, B., and NDI, M. R. Z. (2001) J. Peptide Sci. 7, 397–401. 179. Fields, G. B., and Noble, R. L. (1990) Int. J. Peptide Protein Res. 35, 161-214. 180. Hamdan, M., Masin, B., and Rovatti, L. (1996) Rapid Commun. Mass Spec. 10, 1739-
1742. 181. Vyas, S., and Duffy, L. (1997) Protein Pepteide Lett. 4, 99-106. 182. El-Agnaf, O., Goodwin, H., Sheridan, J., Frears, E., and Austen, B. (2000) Peptide
protein Lett. 7, 1-8. 183. Inui, T., Nishio, H., Bodi, J., Nishiuchi, Y., and Kimura, T. 184. Quibell, M., Turnell, W., and Johnson, T. (1995) J. Chem. Soc. Perkin 1, 2019–2024. 185. Quibell, M., Turnell, W., and Johnson, T. (1994) J. Org. Chem. 59, 1745–1750. 186. El-Agnaf, O., Harriott, P., Guthrie, D., Irvine, B., and Walker, B. (1994) Lett. Peptide
Sci. 1, 135–141. 187. Johnson, T., Quibell, M., Owen, D., and Sheppard, R. (1993) J.Chem. Soc. Chem.
Commun., 369–372. 188. Gordon, D., and Meredith, S. (2003) Biochemistry 42, 475-485. 189. Esler, W., Stimson, E., Ghilardi, J., Lu, Y., Felix, A., Vinters, H., Mantyh, P., Lee, J.,
and Maggio, J. (1996) Biochemistry 35, 13914-13921. 190. Fraser, P., McLachlan, D., Surewicz, W., Mizzen, C., Snow, A., Nguyen, J., and
Kirschner, D. (1994) J. Mol. Biol. 244, 64-73. 191. Wille, H., Prusiner, S. B., and Cohen, F. E. (2000) J. Struct. Biol. 130, 323-338. 192. Alder, A. J., Greenfield, N. J., and Fasman, G. D. (1973) Meth. Enzymology 27, 675. 193. Chalifour, R. J., McLaughlin, R. W., Lavoie, L., Morissette, C., Tremblay, N., Boulé,
M., Sarazin, P., Stéa, D., Lacombe, D., Tremblay, P., and Gervais, F. (2003) J. Biol. Chem. 278, 34874-34881.
194. Bryce, D., and Bax, A. (2004) J. Biomol. NMR 28, 273-287. 195. Koide, S., Yokoyama, S., Matsuzawa, H., Miyazawa, T., and Ohta, T. (1989) J. Biol.
Chem. 264, 8676-8679.

INTRODUCTION
- 49 -
196. Seelig, G., Prosise, W., Hawkins, J., and Senior, M. (1995) J. Biol. Chem. 270, 9241-9249.
197. Eisenmesser, E. Z., Zabell, A. P. R., and Post, C. B. (2000) J. Biomol. NMR 17, 17–32.
198. Arimoto, R., Kisselev, O., Makara, G., and Marshall, G. (2001) Biophys. J. 81, 3285-3293.
199. Zhou, C., Swaney, S., Shinabarge, r. D., and Stockman, B. (2002) Antimicrob Agents Chemother 46, 625-629.
200. Carlomagno, T., Felli, I. C., Czech, M., Fischer, R., Sprinzl, M., and Griesinger, C. (1999) J. Am. Chem. Soc. 121, 1945-1948.
201. Blommers, M. J. J., Stark, W., Jones, C. E., Head, D., Owen, C. E., and Jahnke, W. (1999) J. Am. Chem. Soc. 121, 1949-1953.
202. Casset, F., Hamelryck, T., Loris, R., Brisson, J.-R., Tellier, C., Dao-Thi, M.-H., Wyns, L., Poortmans, F., rez, S. P., and Imberty, A. (1995) J. Biol. Chem. 270, 25619–25628.
203. Carlomagno, T., Blommers, M. J. J., Meiler, J., Cuenoud, B., and Griesinger, C. (2001) J. Am. Chem. Soc. 123, 7364-7370.
204. Carlomagno, T., Maurer, M., Hennig, M., and Griesinger, C. (2000) J. Am. Chem. Soc. 122, 5105-5113.
205. Blommers, M. J. J., and Jahnke, W. (1998) Angew. Chem. Int. Ed. 37, 456-458. 206. Boisbouvier, J., and Bax, A. (2002) J. Am. Chem. Soc. 124, 11038-11045. 207. Bax, A. (2003) Protein Sci. 12, 1-16. 208. Bax, A., Kontaxis, G., and Tjandra, N. (2001) Meth. Enzymol. 339, 127-174. 209. Sanders, C. R., and Schwonek, J. P. (1992) Biochemistry 31, 8898-8905. 210. Clore, G. M., Starich, M. R., and Gronenborn, A. M. (1998) J. Am. Chem. Soc. 120,
10571-10572. 211. Hansen, M. R., Mueller, L., and Pardi, A. (1998) Nature Struct. Biol. 5, 1065-1074. 212. Sass, J., Cordier, F., Hoffmann, A., Rogowski, M., Cousin, A., Omichinski, J. G.,
Löwen, H., and Grzesiek, S. (1999) J. Am. Chem. Soc. 121, 2047-2055. 213. Koenig, B. W., Hu, J.-S., Ottiger, M., Bose, S., Hendler, R. W., and Bax, A. (1999) J.
Am. Chem. Soc. 121, 1385-1386. 214. Sass, H. J., Musco, G., Stahl, S. J., Wingfield, P. T., and Grzesiek, S. (2000) J.
Biomol. NMR 18, 303-309. 215. Ishii, Y., Markus, M. A., and Tycko, R. (2001) J. Biomol. NMR 21, 141-151. 216. Meier, S., Haussinger, D., and Grzesiek, S. (2001) J. Biomol. NMR 24, 351-356. 217. Prestegard, J. H., and Kishore, A. I. (2001) Curr. Opin. Chem. Biol. 5, 584-590. 218. Hansen, M. R., Rance, M., and Pardi, A. (1998) J. Am. Chem. Soc. 120, 11210-11211. 219. Umemoto, K., Leffler, H., Venot, A., Valafar, H., and Prestegard, J. (2003)
Biochemistry 42, 3688-3695. 220. Boisbouvier, J. r. m., Delaglio, F., and Bax, A. (2003) Proc. Natl. Acad. Sci. 100,
11333–11338. 221. Tian, F., Al-Hashimi, H., Craighead, J., and Prestegard, J. (2001) J. Am. Chem. Soc.
123, 485-492. 222. Jain, N., Noble, S., and Prestegard, J. (2003) J. Mol. Biol. 328, 451-462. 223. Fischer, M., Losonczi, J., Weaver, J., and Prestegard, J. (1999) Biochemistry 38, 9013-
9022. 224. Ni, F. (1994) Prog. NMR Spectr. 26, 517-606. 225. Felli, I. C., Richter, C., Griesinger, C., and Schwalbe, H. (1999) J. Am. Chem. Soc.
121, 1956-1957. 226. Carlomagno, T., Felli, I. C., Czech, M., Fischer, R., Sprinzl, M., and Griesinger, C.
(1999) J. Am. Chem. Soc. 121, 1943-1948.

INTRODUCTION
- 50 -
227. Blommers, M. J. J., Stark, W., Jones, C. E., Head, D., Owen, C. E., and Jahnke, W. (1999) J. Am. Chem. Soc. 121, 1949-1953.
228. Bolon, P. J., Al-Hashimi, H. M., and Prestegard, J. H. (1999) J. Mol. Biol. 293, 107-115.
229. Koenig, B. W., Mitchell, D. C., König, S., Grzesiek, S., Litman, B. J., and Bax, A. (2000) J. Biomol. NMR 16, 121–125.
230. Koenig, B. W., Kontaxis, G., Mitchell, D. C., Louis, J. M., Litman, B. J., and Bax, A. (2002) J. Mol. Biol. 322, 441-461.
231. Andrew, E. R., Bradbury, A., and Eades, R. G. (1958) Nature 182, 1659. 232. Lowe, I. J. (1959) Phys. Rev. Lett. 2, 285-287. 233. Herzfeld, J., and Berger, A. (1980) J. Chem. Phys. 73, 6021-6030. 234. Mehring, M. (1983) High Resolution NMR in Solids, Springer, New York. 235. Bloch, F. (1956) Phys. Rev. 102, 104-135. 236. Bloch, F. (1958) Phys. Rev. 111, 841-853. 237. Bennett, A. E., Rienstra, C. M., Auger, M., Lakshmi, K. V., and Griffin, R. G. (1995)
J. Chem. Phys. 103, 6951-6958. 238. Waugh, J. S., Huber, L. M., and Haeberlen, U. (1968) Phys. Rev. Lett. 20, 180-182. 239. Mansfield, P. (1971) J. Phys. C. 4, 1444-1452. 240. Burum, D. P., and Rhim, W. K. (1979) J. Chem. Phys. 71, 944-956. 241. Hohwy, M., Bower, P. V., Jakobser, H. J., and Nielsen, N. C. (1997) Chem. Phys. Lett.
273, 297-303.

MATERIALS AND METHODS
- 51 -
2 Materials and Methods
2.1 Instruments
HPLC: RP-HPLC analysis and semiscale preparations were carried out on a Waters (high
pressure pump 510, multi-wavelength detector 490 E, chromatography workstation Maxima
820), a Beckman (high pressure pump 110B, gradient mixer, controller 420, UV detector
Uvicord from Knauer), or an Amersham Pharmacia Biotech (Äkta Basic 10/100,
autosampler A-900) facility. RP-HPLC preparative separations were carried out on a
Beckman System Gold (high pressure pump module 126, UV detector 166). A C-18 column
(YMC-Pack ODS/A column) was used. As solvents, solvent A: H2O + 0.1% CF3COOH,
and B: CH3CN + 0.1% CF3COOH with UV detection at 220 and 254 nm, were used.
HPLC-ESI Mass spectrometer: HPLC-ESI mass spectra were recorded on a Finnigan
LCQ-ESI with HPLC conjunction LCQ (HPLCsystem Hewlett Packard HP 1100, Nucleosil
100 5C18).
CD: Jasco spectropolarimeter 715 with a PTC-343 temperature controller (cells with
optical paths of 1 mm).
EM: EM 902A (Carl Zeiss, Oberkochen, Germany) equipped with MegaView III camera
and analySIS® software (soft imaging system, Münster, Germany).
NMR : AVANCE DRX 600 /750/ 800/ 900 MHz solution NMR Spectrometer and 400
MHz/600 MHz solid-state NMR spectrometer (Bruker, Karlstruhe, Germany).
Centrifuge : A14 LabTop Microcentrifuge (Jouan, Unterhaching, Germany), Servall
Superspeed RC-2B and RC5B Plus with rotors GS3, GSA and SS34
Centrifuge with rotor S4180 and F2402 (Beckman, Fullerton, USA)
Lyophilizer : CHRIST ALPHA 1-4 (Osterode am Harz, Germany)
pH Meter : E512 Metrohm AG CH-9100 (Herisau, Switzerland)
Shaker : Lab Shaker and Certomat MO (B.Braun, Melsungen, Germany)

MATERIALS AND METHODS
- 52 -
Ultrasonicator : Sonifier B-12 ( Branson SONIC Power Company, USA)
UV spectrometer: LKB Ultrospec II, M 4050 UV/VIS spectrophotometer (Biochrom,
Cambridge, GB)
Fluorescence spectrophotometer: FluoroMax I (Spex, Edison, USA) thermostatted quartz
cells.
2.2 Materials
2.2.1 Chemicals
Solvents for moisture sensitive reactions were distilled and dried according to standard
procedures. All other solvents were distilled before use. NMP was purchased from BASF,
and wasn’t distilled later. Pd/C was donated by Degussa, Frankfurt/M., Germany. For solid-
phase synthesis TCP resin ( 0.9 mmol/g, tritylchloropolystyrene-resin) from PepChem
Goldammer & Clausen or TCP resin( 1.3 mmol/g) from Novabiochem; Fmoc protected
amino acids, were purchased from NovaBiochem, Alexis, Merck, Bachem, Neosystem,
Aldrich, Advanced Chemtech, Synthetech and MultisynTech. All other reagents were from
Aldrich, Fluka, perSeptive Macrocyclics and Merck unless otherwise noted.
2.2.2 Labelled Fmoc Amino Acids
Isotopically labelled FMOC-protected amino acids were obtained from Cambridge Isotopes
Laboratories.
FMOC-Phe(4-F)-OH was obtained from Sigma-Aldrich Chemie GmbH.
FMOC protected, 15N- and 10%-13C- labelled amino acids were purchased from Senn
Chemicals, Switzerland.
Synthetic Aβ1-40 was purchased from BioSource, USA.

MATERIALS AND METHODS
- 53 -
2.3 peptide synthesis
Peptides were synthesized manually by solid-phase peptide synthesis procedures
appropriate for monomers equipped with fluorenylmethoxycarbonyl protecting groups
(Fmoc).
2.3.1 General procedure for Fmoc protection of amino acids
A solution of certain amino acid in Acetone/H2O (1:1, 40 ml/g) with 1.05 equiv Fmoc-
ONSu and 1.20 equiv NaHCO3 was stirred till achieving clear solution. 1.5 N HCl was
added to this solution to pH 2. Acetone was removed under reduced pressure. The residue
was suspended in ethyl acetate and the aqueous phase was extracted with AcOEt (3 ×). The
combined organic phases were washed with HCl prepared at pH2 (2 x), H2O (2 x), then
dried (by MgSO4) and concentrated under reduced pressure. The crude product was
dissolved in chloroform, slowly heating when necessary. n-Hexan was added for
crystallisation. Crystals were filtered and dried afterwards. Samples of the product were
characterized by HPLC and NMR respectively.
2.3.2 General procedure for anchoring of the first Fmoc-protected amino acid on TCP
resin
The unloaded dry TCP resin in a syringe (exact known weight), completed with a filter, was
swollen in NMP/DMF (30 min). The resin was filtered off, and a solution (~ 0.125 M) of
Fmoc-protected amino acid (with respect of the theoretical capacity of the TCP resin: for
natural abundance Fmoc amino acids, using 1.2 equiv; for Fmoc-13C,15N-AA, using 1.0
equiv) and DIPEA (with respect to the quantity of Fmoc-protected amino acid used: for
natural abundance Fmoc amino acids, using 2.5 equiv; for Fmoc-13C,15N-AA, using 2.08
equiv ) in DCM (abs.) was added. After shaking for 1 h at rt the capping solution (10%
DIPEA in MeOH) was added. After 15 min the resin was filtered off, and the resin was
washed with DCM (3 × 3 min), NMP (3 × 3 min), and MeOH (3 × 3 min), and dried

MATERIALS AND METHODS
- 54 -
overnight under vacuum. Subsequently the exact weight of the dried resin was determined,
and the loading of the resin was calculated:
( ) ( ){ }totalHClretotal mMmmgmolC −−=
Xaasin MG/
C loading rate mresin mass of resin before loading mtotal mass of loaded resin MGXaa molar weight of the Fmoc-protected amino acid (Xaa)
The loading of the resin could also be measured by UV spectrometer. An indication of
loading of a compound on a resin can be ascertained by obtaining an Fmoc number. The
piperidine adduct produced on Fmoc removal absorbs UV at 301 nm. Given that prior art
shows (a) the cleavage is quantitative and reproduceable and (b) the reaction between the
fluorene based Michael acceptor and piperidine is quantitative, then the UV absorption of
the piperidine adduct may be used as a measure of the loading of the resin. This is achieved
through and adaption of the Beer-Lambert Law: 'CAE
gmogC •
∆=
A constant of the UV spectrometer (for the spectrometer used: A=6000) C’ concentration of test solution
After removing of the capping solvent, resin was washing the with NMP/DMF, then certain
amount of 20% piperidine/DMF solution was added to syringe to remove the FMOC
protecting group, the deprotection reaction solution was collected and measured by UV
spectrometer.
2.3.3 General procedure of coupling for solid-phase peptide synthesis
The Fmoc-protecting group of the amino acid attached to the resin was removed by treating
the resin with a 20% piperidine solution in NMP/DMF (2 ×10 min). The resin was filtered
off and washed with NMP/DMF (5 × 3 min), before a solution of the next Fmoc protected
amino acid (3 equiv Fmoc-AA-OH, but 1.7 equiv Fmoc-13C,15N-AA), TBTU/ HOBt (3
equiv for natural abundance Fmoc amino acids, 1.7 equiv for Fmoc-13C,15N-AA) and

MATERIALS AND METHODS
- 55 -
DIPEA (8.3 equiv for natural abundance Fmoc amino acids, 4.7 equiv for Fmoc-13C,15N-
AA) in NMP was added. After 1-3 h reaction was complete (monitoring by ESI-HPLC-
MS). The resin was washed with NMP/DMF (5 × 3 min), prior to the subsequent Fmoc-
deprotection and coupling steps.
When the next coupling could not be done in the same day, usually after finishing the
coupling, the resin was washed five times with NMP/DMF, stayed in NMP overnight with
Fmoc protected group.
For the preloaded resin, it was first swelled for 30 min in NMP. Then the Fmoc-protecting
group of the amino acid attached to the resin was removed by treating the resin with a 20%
piperidine solution in NMP/DMF (3 ×10 min). The resin was filtered off and washed with
NMP/DMF (5 × 3 min), and ready for the coupling of the next Fmoc-protected amino acid.
2.3.4 General procedure of cleavage for solid-phase peptide synthesis
After coupling of the last amino acid, the resin was washed with NMP/DMF (3 × 3 min),
CH2Cl2 (1 × 3 min), and dried overnight under vacuum. The peptides were cleaved from
the dry resin using a mixture of TFA:TIPS:H2O (10:1:1) (3 × 3.6 ml) within 10 minutes.
If the cleavage is done right after the coupling, then to dry the resin is not necessary. After
washing resin with NMP (3 x), DCM (3 x), a small amount (~1 ml) of TIPS+DCM (1:1)
was added to the resin, then using the normal cleavage solution. The cleavage solution
stayed 1 hour before removing TFA under reduced pressure (for peptide STVIIE, the
cleavage solution must stay more than 2 hours). The solution of products with trace of TFA
was precipitated in 20 times excess diethylether. The solid in the solvent was centrifuged
and washed by diethylether (2 x ), centrifuged, and dried under low pressure.
The dry crude peptides were purified via RP-HPLC performing on C-18 column (YMC-
Pack ODS/A) with water and ACN with 0.1 % TFA as eluents. The purity and identity for

MATERIALS AND METHODS
- 56 -
the peptides were assessed by ESI-MS and RP-HPLC-ESI-MS analyses performing on a
Finnigan LCQ-ESI Spectrometer coupled to a Hewlett Packard HP1100 HPLC-System.
2.3.5 Synthesis of Fmoc-4-19F-Phe
0.5 g 4-fluro-phenylalanine with 0.966 g Fmoc-ONSu (1.05 equiv) and 0.275 g NaHCO3
(1.20 equiv) in 20 ml Acetone/H2O (1:1) was stirred till achieving clear solution. 1.5 N HCl
was added to this solution to reach pH 2. Acetone was removed under reduced pressure.
The residue was suspended in ethyl acetate and the aqueous phase was extracted with
AcOEt (3 x). The combined organic phase was washed with HCl prepared at pH 2 (2 x),
H2O (2 x), then dried (by MgSO4) and concentrated under reduced pressure. The crude
product was dissolved in chloroform, slowly heating when necessary. n-Hexan was added
for crystallisation. Crystals were filtered and dried afterwards. The final product (1.02 g)
was characterized by HPLC-MS: 1658.9 [4M+K]+; 1238.2 [2M+Na]+; 849.3 [2M+K]+;
833.3 [2M+Na]+; 811.1 [2M+H]+; 428.3 [M+Na]+; 406.0 [M+H]+; tR=24.38 min (Anal.
HPLC, 10-90% B in 30 min); Yield: 93%.
2.3.6 Synthesis of iAβ5 (LPFFD)
In a syringe (10 ml), completed with a filter, TCP resin (0.5 g, ~0.9 mmol·g-1) was swelled
in NMP (30 min). After filtering off the resin, a solution of Fmoc-Asp(OtBu)-OH (0.222 g,
0.54 mmol, 1.2 equiv) and DIPEA (192 µl, 3.75 mmol, 8.3 equiv) in CH2Cl2 (4 ml) was
added. After 1h, 1 ml MeOH was added into the syringe, 10 minutes later, the resin was
filtered off, washed with CH2Cl2 (3×3 min), DMF (3×3 min) and MeOH (3×3 min), before
dried under reduced pressure overnight. The resin’s loading was 0.64 mmol g-1, according
to gravimetric measurements. In a syringe (10 ml) the Fmoc-Asp (OtBu)-OH loaded resin
(0.66 g, 0.64 mmol·g-1, 0.42 mmol) was swelled for 30 min in NMP. According to general
procedure Fmoc-Phe-OH (0.490 g, 1.27 mmol, 3 equiv), Fmoc- Phe-OH (0.490 g, 1.27
mmol, 3 equiv), Fmoc-Pro-OH (0.428 g, 1.27 mmol, 3 equiv) and Fmoc-Leu-OH (0.448 g,

MATERIALS AND METHODS
- 57 -
1.27 mmol, 3 equiv) were coupled subsequently. The following Fmoc-deprotection and
cleavage steps yielded the product, iAβ5, characterized by HPLC-MS: 1313.4 [2M+K]+;
1297.4 [2M+Na]+; 1275.4 [2M+H]+; 660.4 [M+Na]+; 638.4 [M+H]+; tR =12.23 min
(HPLC-MS, 10-90%B in 15 min); tR =23.24 min (Anal. HPLC, 5-50% B in 30 min).
Purification by RP-HPLC (36-50 % B in 30 min) produced 177.6 mg iAβ5, yield: 66 %.
2.3.7 Synthesis of iAβ5inv (DPFFL)
In a syringe (5 ml), completed with a filter, TCP resin (0.1 g, ~1.3 mmol·g-1) was swelled in
DMF (30 min). After filtering off the resin, a solution of Fmoc-Leu-OH (0.092 g, 0.26
mmol, 2.0 equiv) and DIPEA (89 µl, 0.52 mmol, 4.0 equiv) in CH2Cl2 (1 ml) was added.
After 1 h, 1 ml DIPEA/MeOH (1:9) was added into the syringe, 10 minutes later the resin
was filtered off, washed with CH2Cl2 (3×3 min), DMF (3×3 min). The loading ratio
checked by UV spectrometer was 1.25 mmol·g-1. According to general procedure Fmoc-
Phe-OH (0.145 g, 0.375 mmol, 3 equiv), Fmoc-Phe-OH (0.145 g, 0.375 mmol, 3 equiv),
Fmoc-Pro-OH (0.126 g, 0.375 mmol, 3 equiv) and Fmoc-Asp (OtBu)-OH (0.154 g, 0.375
mmol, 3 equiv) were coupled subsequently. Here, HBTU was used as activating agent. The
following Fmoc-deprotection and cleavage steps yielded the product, iAβ5inv, characterized
by MS: 676.14 [M+K]+; 660.17 [M+Na]+; 638.20 [M+H]+; tR=37.27 min (anal. HPLC, 5-
60%B in 80 min). Purification by RP-HPLC (tR =55.42 min, 10-60 % B in 70 min) yielded
iAβ5inv (55.7 mg, 70 %).
2.3.8 Synthesis of 19F-iAβ5
This peptide was 19F labelled in the para-position of the aromatic ring of Phe3. Synthesis
procedure was the same as that for iAβ5, except for the coupling of Fmoc- Phe (4-F)-OH. In
a syringe (10 ml) with a filter, TCP resin (0.5 g, ~0.9 mmol·g-1) was used. After loading, the
resin was dried under reduced pressure overnight and the resin’s loading was 0.54 mmol·g-1,
according to gravimetric measurements. When Fmoc- Phe (4-F)-OH was coupled, 1.7 equiv

MATERIALS AND METHODS
- 58 -
was taken for TBTU, HOBt and Fmoc-AA, 4.7 equiv for DIPEA. And the coupling time
was 2 h instead of 1 h for normal coupling. After this coupling, according to general
procedure, Fmoc-Pro-OH (0.344 g, 1.02 mmol, 3 equiv) and Fmoc-Leu-OH ( 0.360 g, 1.02
mmol, 3 equiv) were coupled subsequently. The following Fmoc-deprotection and
cleavage steps yielded the product, 19F-iAβ5, characterized by MS: 1349.4 [2M+K]+;
1333.2 [2M+Na]+; 1311.3 [2M+H]+; 694.2 [M+K]+; 678.4 [M+Na]+; 656.3 [M+H]+;
tR=23.93 min (Anal. HPLC, 5-50%B in 30 min). Purification by RP-HPLC (tR =15 min,
15-60 % B in 30 min) yielded 19F-iAβ5 (140 mg, 63 %).
2.3.9 Synthesis of U-13C, 15N-iAβ5
This peptide has been fully labelled in 15N, 13C. In a syringe (5 ml), completed with a filter,
TCP resin (0.333 g, ~0.9 mmol·g-1) was swelled in NMP (30 min). After filtering off the
resin, a solution of 15N-Fmoc-L-Aspartic acid (OBt)-13C4 (0.125 g, 0.3 mmol, 1.0 equiv)
and DIPEA (107 µl, 0.625 mmol, 2.08 equiv) in CH2Cl2 (~2 ml) was added. After 1 h, a
small amount of DIPEA was added into the reaction solution to reach pH 9. After another 1
h, 1 ml DIPEA/MeOH (1:9) was added into the syringe, 10 minutes later the resin was
filtered off, washed with CH2Cl2 (3×3 min), DMF (3×3 min) and dried under reduced
pressure overnight. The resin’s loading was 0.616 mmol·g-1, according to gravimetric
measurements. 0.3 g loaded resin was taken for the following synthesis. According to
general procedure 15N-Fmoc-L-Phenylalanine-U-13C9 (0.125 g, 0.31 mmol, 1.7 equiv), 15N-
Fmoc-L-Phenylalanine-U-13C9 (0.125 g, 0.31 mmol, 1.7 equiv), 15N-Fmoc-L-Proline-U-13C5
(0.110 g, 0.32 mmol, 1.73 equiv) and 15N-Fmoc-L-Leucine-13C6 (0.114 g, 0.316 mmol, 1.7
equiv) were coupled subsequently, and the coupling time for each amino acid was 2 h. The
following Fmoc-deprotection and cleavage steps yielded the product, U-13C, 15N-iAβ5,
characterized by MS: 1351.5 [2M+H]+; 676.5 [M+H]+; tR =15.46 min (Anal. HPLC: 15-
65% B in 30min). Purification by RP-HPLC (tR =23 min, 15-48 % B in 25 min) yielded u-13C, 15N-iAβ5 (85.8 mg, 69 %).

MATERIALS AND METHODS
- 59 -
2.3.10 Synthesis of 15N, 10%13C-iAβ5inv
This peptide has 100% enriched in 15N and 10 % randomly enriched in 13C. The synthesis
procedure was done as that for U-13C, 15N-iAβ5. In a syringe (5 ml) with a filter, TCP resin
(0.555 g, ~0.9 mmol·g-1) was swelled in NMP (30 min). After filtering off the resin, a
solution of Fmoc-Leu-OH (0.208 g, 0.59 mmol, 1.17 equiv) and DIPEA (178 µL, 1.04
mmol, 1.8 equiv) in CH2Cl2 (1 ml) was added. After 1 h, a small amount of DIPEA was
added into the reaction solution to reach pH 9. After another 1 h, 1 ml DIPEA/MeOH (1:9)
was added into the syringe, 10 minutes later the resin was filtered off, washed with CH2Cl2
(3×3 min), DMF (3×3 min) and dried under reduced pressure overnight. The resin’s loading
was 0.57 mmol·g-1, according to gravimetric measurements. According to general procedure
Fmoc-Phe-OH (0.135 g, 0.35 mmol, 1.7 equiv), Fmoc- Phe-OH (0.135 g, 0.35 mmol, 1.7
equiv), Fmoc-Pro-OH (0.116 g, 0.34 mmol, 1.7 equiv) and Fmoc-Asp (OtBu)-OH (0.122 g,
0.30 mmol, 1.5 equiv) were coupled subsequently, and the coupling time for each amino
acid was 2 h. The following Fmoc-deprotection and cleavage steps yielded the product, 15N, 10%13C-iAβ5inv, characterized by MS: 1296.3, 1295.2, 1294.3, 1292.2 [2M+H]+;
649.3, 648.3, 647.3, 646.3 [M+H]+; tR =18.46 min (Anal. HPLC, 5-75 %B in 30 min).
Purification by RP-HPLC (tR =23.7 min, 5-75 % B in 30 min) yielded 15N, 10%13C-iAβ5inv
(52.6 mg, 41 %).
2.3.11 Synthesis of Aβ14−23 (HQKLVFFAED)
In a syringe (10 ml), completed with a filter, TCP resin (0.5 g, ~0.9 mmol·g-1) was swelled
in NMP (30 min). After filtering off the resin, a solution of Fmoc-Asp (OtBu)-OH (0.222 g,
0.54 mmol, 1.20 equiv) and DIPEA (192.6 µl, 1.125 mmol, 2.5 equiv) in CH2Cl2 (4 ml)
was added. After 1 h, 1 ml DIPEA/MeOH (1:9) was added into the syringe, 10 minutes later
the resin was filtered off, washed with CH2Cl2 (3×3 min), DMF (3×3 min) and dried under
reduced pressure overnight. The resin’s loading was 0.65 mmol·g-1, according to
gravimetric measurements. According to general procedure Fmoc-Glu (OtBu)-OH (0.41 g,

MATERIALS AND METHODS
- 60 -
0.974 mmol, 3 equiv), Fmoc- Ala-OH (0.303 g, 0.974 mmol, 3 equiv), Fmoc-Phe-OH
(0.377 g, 0.974 mmol, 3 equiv), Fmoc-Phe-OH (0.377 g, 0.974 mmol, 3 equiv), Fmoc-Val-
OH (0.33 g, 0.974 mmol, 3 equiv), Fmoc-Leu-OH (0.344 g, 0.974 mmol, 3 equiv), Fmoc-
Lys (Boc)-OH (0.455 g, 0.974 mmol, 3 equiv), Fmoc-Gln (Trt)-OH (0.594 g, 0.974 mmol, 3
equiv) and Fmoc-His (Trt)-OH (0.602 g, 0.974 mmol, 3 equiv), were coupled subsequently.
The following Fmoc-deprotection and cleavage steps yielded the product, Aβ14−23,
characterized by MS: 1272.1 [M+K]+; 1256.1 [M+Na]+; 1234.1 [M+H]+; tR =10.51 min
(HPLC-MS: 10-90%B in 15 min). Purification via RP-HPLC (tR =24.5 min, 10-60 % B in
30 min) yielded Aβ14−23 as a white fluffy powder after lyophilization: (148.1 mg, 37 %).
2.3.12 Synthesis of 19F-Aβ14-23 (HQKLVF*FAED)
This peptide was 19F labelled in the para-position of the aromatic ring of Phe19. Synthesis
procedure was the same as that for Aβ14−23, except for the coupling of Fmoc- Phe (4-F)-OH.
In a syringe (10 ml) with a filter, TCP resin (0.5 g, ~0.9 mmol·g-1) was used. After loading,
the resin was dried under reduced pressure overnight. The resin’s loading was 0.58 mmol·g-
1, according to gravimetric measurements. According to general procedure Fmoc-Glu
(OtBu)-OH, Fmoc- Ala-OH and Fmoc-Phe-OH were coupled continuously. Then Fmoc-
Phe-OH (0.353 g, 0.87 mmol, 2.3 equiv) was used for the coupling. Then Fmoc-Val-OH
(0.33 g, 0.974 mmol, 3 equiv), Fmoc-Leu-OH (0.344 g, 0.974 mmol, 3 equiv), Fmoc-Lys
(Boc)-OH (0.455 g, 0.974 mmol, 3 equiv), Fmoc-Gln (Trt)-OH (0.594 g, 0.974 mmol, 3
equiv) and Fmoc-His (Trt)-OH (0.602 g, 0.974 mmol, 3 equiv), were coupled subsequently.
The following Fmoc-deprotection and cleavage steps yielded the product, Aβ14−23,
characterized by MS: 1295.4 [M-H+2Na]+; 1289.4 [M+K]+; 1273.4 [M+Na]+; 1252.4
[MC13+H]+; 1251.5 [M+H]+; tR =16.07 min (Anal. HPLC: 10-60%B in 30 min).
Purification by RP-HPLC (tR =23.7 min, 10-60 % B in 30 min) yielded 19F-Aβ14−23 (162.8
mg, 35 %).
MATERIALS AND METHODS
- 61 -
2.3.13 Synthesis of KLVFFKK
In a syringe (10 ml), completed with a filter, TCP resin (0.25 g, ~1.3 mmol·g-1) was swelled
in DMF (30 min). After filtering off the resin, a solution of Fmoc-Lys (Boc)-OH (0.25 g,
0.54 mmol, 2.0 equiv) and DIPEA (222 µl, 1.08 mmol, 4.0 equiv) in CH2Cl2 (2 ml) was
added. After 1 h, 1 ml DIPEA/MeOH (1:9) was added into the syringe, 10 minutes later the
resin was filtered off, washed with CH2Cl2 (3×3 min), DMF (3×3 min). The loading ratio
checked by UV spectrometer was 1.26 mmol·g-1. According to general procedure Fmoc-Lys
(Boc)-OH (0.35 g, 0.945 mmol, 3 equiv), Fmoc-Phe-OH (0.366 g, 0.945 mmol, 3 equiv),
Fmoc-Phe-OH (0.366 g, 0.945 mmol, 3 equiv), Fmoc-Val-OH (0.321 g, 0.945 mmol, 3
equiv), Fmoc-Leu-OH (0.334 g, 0.945 mmol, 3 equiv), Fmoc-Lys (Boc)-OH (0.35 g, 0.945
mmol, 3 equiv), were coupled subsequently. The following Fmoc-deprotection and cleavage
steps yielded the product, KLVFFKK, characterized by MS: 909.53 [M+H]+; 455.27
[M/2+H]+; 303.85 [M/3+H]+; tR =2.8 min (Anal. HPLC: 5-90%B in 40 min). Purification
via RP-HPLC (tR =8.5 min, 1-60 % B in 70 min) yielded KLVFFKK as a white fluffy
powder after lyophilization: (115.1 mg, 47 %).
2.3.14 Synthesis of STVIIE
In a syringe (5 ml), completed with a filter, TCP resin (0.30 g, ~1.14 mmol·g-1) was swelled
in DMF (30 min). After filtering off the resin, a solution of Fmoc-13C,15N-Glu(OtBu)-OH
(0.148 g, 0.34 mmol, 1.0 equiv) and DIPEA (117 µl, 0.68 mmol, 2.0 equiv) in CH2Cl2 (2
ml) was added. After 1 h, a few drops of DIPEA was added into reaction solution to reach
pH 9. Two hours after the reaction, 1 ml DIPEA/MeOH (1:9) was added into the syringe, 10
minutes later the resin was filtered off, washed with CH2Cl2 (3×3 min), DMF (3×3 min).
The loading ratio checked by UV spectrometer was 0.768 mmol·g-1. According to general
procedure Fmoc-13C,15N-Ile-OH (0.141 g, 0.392 mmol, 1.7 equiv), Fmoc-13C,15N-Ile-OH
(0.141 g, 0.392 mmol, 1.7 equiv), Fmoc-13C,15N-Val-OH (0.135 mg, 0.392 mmol, 1.7
equiv), Fmoc-13C,15N-Thr-OH (0.136 mg, 0.392 mmol, 1.7 equiv) and Fmoc-13C,15N-

MATERIALS AND METHODS
- 62 -
Ser(OtBu)-OH (0.152 g, 0.392 mmol, 1.7 equiv) were coupled subsequently. Here, Fmoc-
Threonine was used with the side chain protection. It was confirmed by the successful
synthesis of STVIIE at natural abundance using Fmoc-Thr-OH with non side chain
protection group. This The following Fmoc-deprotection and cleavage steps yielded the
product, STVIIE, characterized by MS: 611.34 [M+H]+; tR=6.68 min (anal. HPLC, 5-
95%B in 40 min). Purification by RP-HPLC (tR =7.52 min, 1-50 % B in 70 min) yielded
STVIIE (135.45 mg, 63 %).
2.3.15 Synthesis of u-13C,15N-STVIIE
In a syringe (5 ml), completed with a filter, TCP resin (0.30 g, ~1.14 mmol·g-1) was swelled
in DMF (30 min). After filtering off the resin, a solution of Fmoc-13C,15N-Glu(OtBu)-OH
(0.148 g, 0.34 mmol, 1.0 equiv) and DIPEA (117 µl, 0.68 mmol, 2.0 equiv) in CH2Cl2 (2
ml) was added. After 1 h, a few drops of DIPEA was added into reaction solution to reach
pH 9. Two hours after the reaction, 1 ml DIPEA/MeOH (1:9) was added into the syringe, 10
minutes later the resin was filtered off, washed with CH2Cl2 (3×3 min), DMF (3×3 min).
The loading ratio checked by UV spectrometer was 0.768 mmol·g-1. According to general
procedure Fmoc-13C,15N-Ile-OH (0.141 g, 0.392 mmol, 1.7 equiv), Fmoc-13C,15N-Ile-OH
(0.141 g, 0.392 mmol, 1.7 equiv), Fmoc-13C,15N-Val-OH (0.135 mg, 0.392 mmol, 1.7
equiv), Fmoc-13C,15N-Thr-OH (0.136 mg, 0.392 mmol, 1.7 equiv) and Fmoc-13C,15N-
Ser(OtBu)-OH (0.152 g, 0.392 mmol, 1.7 equiv) were coupled subsequently. Here, Fmoc-
Threonine was used with the side chain protection. It was confirmed by the successful
synthesis of STVIIE at natural abundance using Fmoc-Thr-OH with non side chain
protection group. This can be done because Threonine coupling was involved in the second
to the last step. The following Fmoc-deprotection and cleavage steps yielded the product, 13C,15N-STVIIE, characterized by MS: 696.37 [M+H]+; tR=6.68 min (anal. HPLC, 5-95%B
in 40 min). Purification by RP-HPLC (tR =7.62 min, 1-50 % B in 70 min) yielded STVIIE
(90.45 mg, 38 %).

MATERIALS AND METHODS
- 63 -
2.3.16 Synthesis of STVIIT
In a syringe (5 ml), completed with a filter, TCP resin (0.25 g, ~1.3 mmol·g-1) was swelled
in DMF (30 min). After filtering off the resin, a solution of Fmoc-Thr(OtBu)-OH (0.258 g,
0.65 mmol, 2.0 equiv) and DIPEA (222 µl, 1.3 mmol, 4.0 equiv) in CH2Cl2 (2 ml) was
added. After 1 h, 1 ml DIPEA/MeOH (1:9) was added into the syringe, 10 minutes later the
resin was filtered off, washed with CH2Cl2 (3×3 min), DMF (3×3 min). The loading ratio
checked by UV spectrometer was 1.21 mmol·g-1. According to general procedure Fmoc-Ile-
OH (0.318 g, 0.90 mmol, 3 equiv), Fmoc-Ile-OH (0.318 g, 0.90 mmol, 3 equiv), Fmoc-Val-
OH (0.305 mg, 0.9 mmol, 3 equiv), Fmoc-Thr(OtBu)-OH (0.358 mg, 0.9 mmol, 3 equiv)
and Fmoc-Ser(OtBu)-OH (0.345 g, 0.9 mmol, 3 equiv) were coupled subsequently. HBTU
was used as a activating agent. The following Fmoc-deprotection and cleavage steps yielded
the product, STVIIT, characterized by MS: 633.34 [M+H]+; tR=6.15 min (anal. HPLC, 5-
95%B in 40 min). Purification by RP-HPLC (tR =9.47 min, 1-30 % B in 70 min) yielded
STVIIT (145.45 mg, 71 %).
2.3.17 Synthesis of STVIYE
In a syringe (5 ml), completed with a filter, TCP resin (0.25 g, ~1.3 mmol·g-1) was swelled
in DMF (30 min). After filtering off the resin, a solution of Fmoc-Glu(OtBu)-OH (0.267 g,
0.65 mmol, 2.0 equiv) and DIPEA (222 µl, 1.3 mmol, 4.0 equiv) in CH2Cl2 (2 ml) was
added. After 1 h, 1 ml DIPEA/MeOH (1:9) was added into the syringe, 10 minutes later the
resin was filtered off, washed with CH2Cl2 (3×3 min), DMF (3×3 min). The loading ratio
checked by UV spectrometer was 1.26 mmol·g-1. According to general procedure Fmoc-
Tyr(OtBu)-OH (0.434 g, 0.945 mmol, 3 equiv), Fmoc-Ile-OH (0.334 g, 0.945 mmol, 3
equiv), Fmoc-Val-OH (0.321 mg, 0.945 mmol, 3 equiv), Fmoc-Thr(OtBu)-OH (0.376 mg,
0.945 mmol, 3 equiv) and Fmoc-Ser(OtBu)-OH (0.362 g, 0.945 mmol, 3 equiv) were
coupled subsequently. HBTU was used as a activating agent. The following Fmoc-
deprotection and cleavage steps yielded the product, STVIIT, characterized by MS: 711.34

MATERIALS AND METHODS
- 64 -
[M+H]+; tR=6.98 min (anal. HPLC, 5-95%B in 40 min). Purification by RP-HPLC (tR
=9.344 min, 1-20 % B in 70 min) yielded STVIIT (131.64 mg, 57 %).
2.4 Fibrillization
Aβ fibrils The buffer has been adjusted to pH 4.0, 10 mM PO43-, in order to allow for
optimal formation of fibrils (1). Fibrillar peptides were prepared following the protocol
described by Zagorski and co-workers (2). In this protocol (Fig. 2-1), lyophilized Aβ14-23
was solubilized first in TFA (Trifluoro-acetic acid). The solutions were kept at room
temperature for 1 or 2 hours, until the peptides completely dissolved. After removal of the
solvent with dry nitrogen gas, Aβ14-23 was re-solubilized in HFIP (Hexafluoro-isopropanol).
A small amount of the concentrated stock solution (0.37 mg / 50 µl) was transferred to the
aqueous buffer to yield a certain concentration. The samples were kept in the room
temperature without disturb.
Fig. 2-1. Fibril preparation protocol for Aβ peptides.
Fibrils formed from de novo peptides Fibrils were prepared using a procedure described by
Paz et al. (3). Briefly, stock peptide solutions were prepared by dissolving a weighed
amount of peptide into buffered solution (20 mM glycine/HCl) whose pH had been adjusted

MATERIALS AND METHODS
- 65 -
previously to 2.6. Samples were immediately sonicated (10 min) to dissemble preformed
nuclei and centrifuged (5 min at 16,100 x g) to deposit insoluble material. Solutions at
concentration of ~1.5 mM were prepared by diluting a known volume of stock solution into
buffer. Then, peptide solutions were incubated at room temperature. Mature fibrils were
formed after 7 days incubation and the solutions were ultracentrifuged (24 hours at 250,000
x g). The pellets were packed to rotors for solid-state NMR experiments.
2.5 Electron Microscopy
For Aβ peptides alone, lyophilized peptide powder was treated by the methods described
above, and incubated for 7 days before the EM measurements. For the mixture samples, Aβ
fibrils was grown alone 7 days before the addition of peptide inhibitors. EM measurements
were performed 7 days after the co-incubation. The incubated samples (5 µl) were placed on
grids covered by a carbon-stabilized formvar film. Excess fluid was withdrawn after 30 s,
and the grids were negatively stained with 3% uranyl acetate in water. Excess fluid was
blotted off and grids were allowed to dry in air. The stained grids were then examined and
photographed in EM 902A (Carl Zeiss, Oberkochen, Germany) equipped with MegaView
III camera (soft imaging system, Münster, Germany). Images were acquired and processed
by means of the analySIS® Digital Micrograph program (soft imaging system, Münster,
Germany).
2.6 Circular Dichroism spectroscopy
All CD measurements were made on a Jasco J-720 spectropolarimeter. Samples were
prepared following the protocol described by Zagorski and co-workers: lyophilized Aβ was
solublized first in TFA (Trifluoro-acetic acid). The solutions were kept at room temperature
for 1 or 2 hours, until the peptides completely dissolved. After removal of the solvent with
dry nitrogen gas, Aβ was re-solubilized in HFIP (Hexafluoro-isopropanol). A small amount
of the concentrated stock solution (0.37 mg / 50 µl) is transferred to the aqueous buffer to

MATERIALS AND METHODS
- 66 -
yield a certain concentration. CD studies were performed using a 1 mm quartz cell in the
wavelength range of 190- 240 nm at 30°C. Data points were collected in 0.2 nm intervals at
a rate of 500 nm/min with 0.25 sec response time and an average of 6 scans was used to
generate the data. The final CD spectrum for a given sample was determined by subtracting
the buffer-blank spectrum from that acquired for the sample. The far-UV CD spectra were
smoothed by using the noise reducing option in the software supplied by the vendor
(JASCO). The direct CD measurements (θ, in mdeg) were converted to molar ellipticity,
using [θ] = θ/(10·C·l), where C is the molar concentration (mol/l) and l the path length. The
molar ellipticity [θ] is in units deg cm2 dmol-1.
2.7 Thioflavine T Fluorescence Assay
The incubated samples were vortex mixed and 40 µl aliquots were withdrawn and mixed
with 960 µl of thioflavine T (ThT) in 50 mM phosphate buffer, pH 7.0. Analyses were
performed in a FluoroMax I (Spex, Edison, USA) fluorescence spectrophotometer and
thermostated quartz cells. During the measurements, both the excitation and emission
wavelength were set to 446 nm and 490 nm respectively with a spectral bandwidth of 5 nm.
The final concentration of the amyloid like intermediates has been set to 5 µM and that of
Thioflavin T has been set to 50 µM to make 1:10 of peptide: Thioflavin T. The emission
spectra have been obtained by scanning from 460 nm to 540 nm.
2.8 Solution NMR
All NMR spectra were recorded on Bruker Avance 600 MHz and 750 MHz NMR
spectrometers using a 5-mm triple-resonance probe with 3-axis gradients at a temperature of
30 °C. Spectra were calibrated with respect to internal TMS (0 ppm). Other spectrometer
characteristics as well as calibrated spectral widths used are reported in appendix 5.1.
Modified pulse programs and experimental parameters are summarized in appendix 5.2.
WATERGATE (4) was applied for suppression of the water resonance in 1H NMR

MATERIALS AND METHODS
- 67 -
experiments. All NMR spectra were processed and analyzed with Xwinnmr [‘XWINNMR
V3.0’, Bruker, Karlsruhe].
TOCSY experiments
TOCSY is the abbreviation for TOtal Correlation SpectroscopY. It is also called HOHAHA
(HOmonuclear HArtmann HAhn). The TOCSY experiment provides through bond
correlations between all the atoms in a single spin-system e.g. all the protons in a single
amino acid. Thus each amino acid has a characteristic pattern of signals from which the
amino acid can be identified. However, some amino acids have identical spin systems and
therefore identical signal patterns. They are: cysteine, aspartic acid, phenylalanine,
histidine, asparagine, tryptophane and tyrosine ('AMX systems') on the one hand and
glutamic acid, glutamine and methionine ('AM(PT)X systems') on the other hand. More or
less, TOCSY constitutes a very efficient transfer element for the assignment of proteins,
nucleic acids, and oligosaccharides.
The TOCSY sequence works by applying a strong RF field, called a "spin-lock", along one
axis (Fig. 2-2). Under the influence of this field magnetization is transferred from on spin to
another through the scalar coupling interactions. The efficiency of the magnetization
transfer depends on the J-coupling constant, i.e. Magnetization is transferred more
efficiently through large couplings. In this work, TOCSY with DIPSI-2 (5) mixing sequence
was used.
Fig. 2-2. Pulse sequence for the TOCSY experiments used in this work. Isotropic mixing sequence DIPSI-2 was used for
desirable magnetization transfer and WATERGATE (WG) technique was used for water suppression.

MATERIALS AND METHODS
- 68 -
The length of the DIPSI-2 mixing sequence is governed by the equation
nm 112.1152
×
=
πτ , where n is the number of times which the supercycle is repeated and
π/2 is the appropriate pulse length. An isotropic mixing sequence must possess complete
supercycles, otherwise the properties induced by a composite pulse sequence are nullified, n
= 18 was used in the TOCSY experiments in this work and the mixing time τm was
approximately 50 ms.
The rf pulse power level used during the isotropic mixing sequence was set to achieve the
pulse length of ~25 µs corresponding to 10 kHz.
TOCSY spectra were recorded at 30 °C, using a 48 ms mixing time. Data matrices with
200× 512 complex points were acquired using acquisition times of 26 ms (F1) and 68 ms
(F2). Quadrature detection in F1 was accomplished with the States-TPPI method (6). Sine-
bell window functions, phase-shifted by 838 and 728, were used for processing in the F1
and F2 dimensions, respectively. Data matrices were zero-filled to 1024×2048 points.
NOESY experiments
NOESY stands for Nuclear Overhauser Enhancement SpectroscopY. The NOESY
experiment is crucial for the determination of protein structure. It uses the dipolar
interaction of spins (the nuclear Overhauser effect, NOE) for correlation of protons. The
intensity of the NOE is proportional to 1/r6, with r being the distance between the protons:
The correlation between two protons depends on the distance between them, but normally a
signal is only observed if their distance is smaller than 5 Å. The NOESY experiment
correlates all protons which are close enough. It also correlates protons which are distant in
the amino acid sequence but close in space due to tertiary structure. This is the most
important information for the determination of protein structures.

MATERIALS AND METHODS
- 69 -
NOESY pulse sequence scheme is shown previously in Fig. 1-11. The pulse sequence starts
as usual with a 90° pulse followed by an evolution time t1. This delay is varied
systematically as usual to provide chemical shift information in the F1 domain. Then
another 90° pulse transmit some of the magnetization to the Z axis and during the following
mixing period, the non-equilibria Z components will exchange magnetization through
Nuclear Overhauser Effect (NOE). After some time (shorter than the relaxation time T1),
the transverse magnetization is restored by the third pulse and detected. If relaxation
exchange (or chemical exchange) have taken place during the mixing time, cross peaks will
be observed in the spectra.
In this work, NOESY spectra were recorded at 30 °C. The mixing time for peptide in the
bound state was varied from 10 to 500 ms. Typical two-dimensional data sets consisted of a
data matrix of 1,024 by 128 complex points, with 64 scans collected for each increment.
The sweep width in both dimensions was 8,012 Hz. The indirect dimension was zero filled
during processing.
HSQC experiments
Heteronuclear Single Quantum Coorelation (HSQC) experiments (7) correlate protons with
their directly attached heteronuclei. Proton magnetization is detected (during t2 - detection
time) while the low-gamma nuclei evolves during the evolution time - t1. Because of the
detection of the high frequency nuclei, this sequence is very sensitive. The enhancement in
sensitivity this experiment permits is much greater than the enhancement obtainable by
simple NOE (Nuclear Overhauser Effect).
The pulse sequence for HSQC experiments is shown in Fig. 2-3. The HSQC experiment
starts with proton magnetization. Therefore the recycle time is based on proton relaxation
time (1.26 * T1). The first INEPT step is used to create proton antiphase magnetization (2
τ delay) which is then transferred to the directly attached heteronuclei (carbon or nitrogen).

MATERIALS AND METHODS
- 70 -
This X nuclei magnetization is left to evolve with its chemical shift (during t1 - evolution
time). Usually, the effect of proton coupling and chemical shift is removed by the use of a
180° proton pulse applied at mid evolution time. However, it can be taken out in order to
obtain the couplings between the directly coupled spins, as employed below. The double
90° pulse applied to both nuclei (in the beginning of the last INEPT step) transfers the
magnetization back to proton as an anti-phased magnetization, which is then refocus during
the last (2 τ delay). The proton in-phase magnetization can then be detected in the presence
of the X-nuclei decoupler.
Fig. 2-3. Pulse sequence scheme for HSQC experiments. The open 180° pulse can be employed for regular HSQC
experiments or be taken out for certain desired information.
In this work, for measurement of trRDCs, 2D 1H,15N and 1H,13C correlation spectra are
recorded on iAβ5inv performed on a Bruker 750 MHz solution state NMR spectrometer,
without 1H decoupling in the indirect dimension. Two sets of experiments were carried out
for coupling measurements on iAβ5inv. In the first set, data were collected for a sample of 5
mM iAβ5inv alone in 10 mM PO43- of pH 4 at 30°C in a isotropic state and in the second set,
data were collected for a sample of same amount of iAβ5inv with 0.5 mM Aβ14-23 or 0.1 mM
Aβ1-40 in the same buffer and experimental conditions corresponding to the aligned state.
Aβ fibrils were incubated alone about two days before addition of peptide inhibitors.
Proton-coupled 1H-15N HSQC spectra were recorded on 15N-labelled iAβ5inv in absence and
presence of Aβ14-23, and the data matrix size was 256 × 4096 complex points, resulting in
acquisition times of 140 ms and 273 ms in F1 and F2, respectively. Eight transients per FID

MATERIALS AND METHODS
- 71 -
were acquired, and quadrature in the F1 dimension was achieved in the Echo-antiecho
manner. Data matrices were zero-filled to 2048 × 16384 points.
Proton-coupled 1H-13Cα HSQC spectra were recorded on natural abundance iAβ5inv in
absence and presence of Aβ1-40 at carry 13C frequency of 10.75 KHz without 1H decoupling
in F1 dimension, and the data matrix size was 256 × 1318 complex points, resulting in
acquisition times of 27 ms and 80 ms in F1 and F2, respectively. 64 transients per FID were
acquired, and quadrature in the F1 dimension was achieved in the Echo-antiecho manner.
Data matrices were zero-filled to 16384 × 32768 points.
Proton-coupled 1H-13Cβ HSQC spectra were recorded on natural abundance iAβ5inv at carry 13C frequency of 5846.6 Hz with the decoupler turned off during acquisition (pulse
sequence in Fig. 2-4), and the data matrix size was 256 × 4096 complex points, resulting in
acquisition times of 17 ms and 248 ms in F1 and F2, respectively. 128 transients per FID
were acquired, and quadrature in the F1 dimension was achieved in the Echo-antiecho
manner. Data matrices were zero-filled to 16384 × 16384 points.
Fig. 2-4. Modified HSQC employed for obtaining 1H-13C couplings for side chain groups.
Proton-coupled 1H-13C HSQC spectra on resonance of aromatic rings were recorded on
natural abundance iAβ5inv at carry 13C frequency of 24611 Hz with the decoupler turned off
during acquisition, and the data matrix size was 256 × 4096 complex points, resulting in
acquisition times of 85 ms and 248 ms in F1 and F2, respectively. 160 transients per FID

MATERIALS AND METHODS
- 72 -
were acquired, and quadrature in the F1 dimension was achieved in the Echo-antiecho
manner. Data matrices were zero-filled to 16384 × 32768 points.
Diffusion Ordered Spectroscopy (DOSY)
Pulsed-field gradient (PFG) experiments with water-suppressed longitudinal encoding
decoding (water-sLED) pulse (8) was performed to determine the molecular size of peptide
inhibitors without Αβ fibrils using internal standard methods (9). In the experiment, the
duration of the gradients was set to 2.0 ms; 30.0 ms was used as delay to allow for diffusion
between the dephasing and rephasing gradient, and 32 points have been recorded in the
indirect dimension. Sine shaped gradients and a gradient ramp with a maximum gradient
strength of 35 G/cm have been used. Gradient strengths are always given in %2 with respect
to maximum gradient strength (100% = 35 G/cm). Internal standard method has been used
in order to compensate for the viscosity effects. Tetramethylsilane (Mr = 83 Da) was used as
an internal reference to calculate the molecular mass of the possible oligomers.
2.9 Solid-state NMR
1D MAS 13C NMR spectra were obtained with a Bruker AVANCE 400/500 (DRX)
spectrometer. A 4-mm HR-MAS probe was used together with a rotor containing an inner
spacer in order to improve B0 homogeneity and spinning stability as well as to improve the
suppression of solvent signals. 1D 13C spectra were acquired at a carbon NMR frequency of
100 MHz and magic-angle spinning (MAS) frequencies of 9 kHz using a frequency
selective 1H-13C cross-polarization technique with mixing periods of 1 ms. All
measurements were performed at 7°C.

MATERIALS AND METHODS
- 73 -
Fig. 2-5. Pulse program of a standard 2D homonuclear PDSD dipolar correlation experiment, applicable in the case of 13C-13C correlation spectra. Following 1H excitation, a ramped cross-polarization between 1H and 13C creates the initial 13C
magnetization. During the following evolution period, proton decoupling is applied, using the two-pulse phase modulation
technique (TPPM). Following the carbon evolution, a 90º pulse on the low-γ nucleus brings back the magnetization along
the z-axis. During the mixing time tmix, proton decoupling is switched off and the polarization transfer between 13C spins
occur in the presence of 1H-1H and 1H-13C dipolar couplings. In the following detection period, magnetization of 13C is
detected while proton decoupling is applied using TPPM.
2D MAS 13C-13C NMR spectra were recorded on a Bruker 600 MHz spectrometer. A triple
resonance probe was equipped with a 4-mm-diameter rotor. MAS frequency was set to 11
kHz and TPPM of 90 kHz was used for heteronuclear decoupling in both dimensions.
Acquisition time t1max = 10 ms and t2
max = 30 ms were used with TPPI for phase sensitive
detection. About 10 mg peptides (de novo peptides) were used for each experiment. Total
experimental time was 12 hours. All measurements were performed at ~0°C.
1D 19F MAS NMR spectrum was recorded on a Bruker 400 MHz spectrometer. 2D 19F, 19F-
C7 experiments were carried out on a Bruker 600 MHz spectrometer in Karlsruhe,
Germany.
2.10 Structure calculation
Structure calculation are on the basis of simulated annealing protocols implemented with a
program CNSsolve. Transferred-NOESY data (750 MHz) were used for the extraction of
distance restraints for use in quantitative structure calculations. Each resolved cross peaks
were integrated using XWINNMR. The cross peak intensities were calibrated against the

MATERIALS AND METHODS
- 74 -
cross peak intensity of phenyl-ring protons, because the distance (2.56 Å) is fixed and well
known. Distances were derived from the intensities after calibration according to
61
=
ij
refrefij V
Vrr
Where, V is the intensity of cross peak, and r is the internuclear distance. NOE-derived
distance restraints were used as upper bounds. The resulting distance restraints are listed in
Appendix 5.2.5-5.2.7.
All structure calculations, minimizations and simulated annealing procedures were carried
out using CNSsolve version 1.0 (10). Molecular structures were visualized and manipulated
using Sybyl (version 6.9.2; Tripos Inc., St. Louis, MO) or MOLMOL (11). Initial embedded
structures were generated from sequence structures using the sequence annealing protocol.
Default values were used for all force constants and molecular parameters that were
involved. High-temperature Cartesian molecular dynamics of with a 0.015 ps time step at
50000 K (1000 steps) were conducted. Cooling was then achieved by 1000 steps with a
0.015 ps time step. The 200 generated structures were then minimized with 1000 steps of
van der Waals energy minimization. A final minimization of 10 cycles of 200 steps with an
NOE scale factor of 75 kcal·mol-1 and a dihedral scale factor of 400 kcal·mol-1 was run.
2.11 Determination of peptide alignment tensor
Dipolar couplings were calculated as the difference between the oriented coupling (1JCH + 1DCH or 1JNH + 1DNH) and the isotropic couplings (1JCH or 1JNH). In each case, 2D HSQC
spectra was transformed and phased with the same parameters. Single FID slices across the
resonance under investigation were analyzed independently. Order tensors were determined
using the calculated bound-state dipolar couplings and associated NOE-derived structures
by inputting into a singular value decomposition program for determination of order tensor
elements implemented in PALES (12). For the order tensor determination of iAβ5inv bound

MATERIALS AND METHODS
- 75 -
to Aβ14-23, a total of 8 RDC values were used; for that of iAβ5inv bound to Aβ1-40, a total of
10 RDCs were used. These values correspond to residues for which assignments are
available and there was no significant overlap of resonances or change in chemical shift
positions between the free and bound state. Errors in dipolar couplings were set to estimated
experimental precision.
2.12 Molecular Modeling
For selection of suitable structural templates for the oligomerized amyloid peptides, we
adopted the structural model of the anti parallel β-strand orientation for Aβ14-23 peptide
provided by Callaway (13) and the suggested structural model of the parallel β-strand
orientation for the Aβ1-40 peptide based on solid-state NMR data (14).
The amyloid bound NMR-structures of the peptide inhibitors (iAβ5 and iAβ5inv) were
docked to the structural model of Aβ14-23 and Aβ1-40 by three approaches. For automatic
docking, the docking module FlexX of the Sybyl 6.91 program package from Tripos Inc.
was used. For manual docking and docking by constrained molecular dynamic simulations,
functional data, complementary side chain properties and the RDC data (for iAβ5inv)
constraining the relative orientation of ligand with respect to amyloid fibrils were
considered as additional constrains. In details, the Cartesian coordinates of the iAβ5inv
NMR-structure bound to Aβ1-40 were calibrated along the z-axis, based on RDC data
(program PALES (12)). According the detected parallel orientation of the fibril axis along
the magnetic field, the N-H bonds (Cartesian coordinates) of β-sheet of the Aβ1-40 were also
calibrated along the z-axis using the program VMD (from University of Illinois). For the
ligand only translations along x- and y- and rotations around the z-axis were allowed for
docking at the amyloid model. All assembling procedures were performed in vacuum.
The three assembled complex models of the peptide inhibitors and the corresponding
amyloid peptide oligomers were soaked with water in a periodic boundary box. Initially the

MATERIALS AND METHODS
- 76 -
atoms were kept fixed to relax the water during minimization. Later on, the entire system
was considered. The resulting models were minimized with an AMBER 7.0 force field and
simulated with a 0.5 ns molecular dynamics run at 300 K. The geometric accuracy was
analysed by using the PROCHECK programme (15).
References
1. Fraser, P., Nguyen, J., Surewicz, W., and Kirschner, D. (1991) Biophys. J. 60, 1190-1201.
2. Zagorski, M. G., Yang, J., Shao, H., Ma, K., Zeng, H., and Hong, A. (1999) Methods Enzymol. 309, 189-204.
3. Paz, M. L. p. d. l., Goldie, K., Zurdo, J., Lacroix, E., Dobson, C. M., Hoenger, A., and Serrano, L. (2002) Proc. Natl. Acad. Sci. 99, 16052–16057.
4. Piotto, M., Saudek, V., and Sklenar, V. (1992) J.Biomol. NMR 2, 661–665. 5. Shaka, A. J., Lee, C. J., and Pines, A. (1988) J. Magn. Reson. 77, 274-293. 6. Marion, D., Ikura, M., Tschudin, R., and Bax, A. (1989) J. Magn. Reson. 85, 393–
399. 7. Bodenhausen, G., and Ruben, D. J. (1980) Chem. Phys. Lett. 69, 185-189. 8. Gibbs, S. J., and Johnson, C. S. J. (1991) J. Magn. Reson. 93, 395-402. 9. Jones, J. A., Wilkins, D. K., Smith, L. J., and Dobson, C. M. (1997) J. Biomol. NMR
10, 199-203. 10. Brunger, A. T., Adams, P. D., Clore, G. M., DeLano, W. L., Gros, P., Grosse-
Kunstleve, R. W., Jiang, J.-S., Kuszewski, J., Nilges, N., Pannu, N. S., Read, R. J., Rice, L. M., Simonson, T., and Warren, G. L. (1998) Acta. Cryst. D54, 905-921.
11. Koradi, R., Billeter, M., and Wuthrich, K. (1996) J. Mol. Graph. 14, 51–55. 12. Zweckstetter, M., and Bax, A. (2000) J. Am. Chem. Soc. 122, 3791-3792. 13. Tjernberg, L. O., Callaway, D. J. E., Tjernberg, A., Hahne, S., Lilliehöök, C.,
Terenius, L., Thyberg, J., and Nordstedt, C. (1999) J. Biol. Chem. 274, 12619–12625.
14. Petkova, A. T., Ishii, Y., Balbach, J. J., Antzutkin, O. N., Leapman, R. D., Delaglio, F., and Tycko, R. (2002) Proc. Natl. Acad. Sci. 99, 16742–16747.
15. Laskowski, R., MacArthur, M., Moss, D., and Thornton, J. (1993) J. Appl. Cryst. 26, 283-291.

RESULTS AND DISCUSSION
- 77 -
3 Results and Discussion
3.1 Peptide synthesis and purification
Aβ14-23 and its peptide inhibitors iAβ5 (LPFFD) and iAβ5inv (DPFFL) were prepared
manually by solid-phase peptide synthesis using a TCP-resin and Fmoc-chemistry protocols
(1). The determination of protein structure and dynamics by high resolution NMR requires the
incorporation of isotopic labels. Aβ14-23 with a 19F label in the para-position of the aromatic
ring of Phe19 was successfully synthesized as described in Methods. iAβ5 was synthesized
with a 19F label in the para-position of the aromatic ring of Phe3 and uniformly 13C- and 15N-
labelled, respectively. Crude peptides were purified by preparatory reverse phase HPLC
performed on a C-18 column (YMC-Pack ODS/A) with water and ACN with 0.1 % TFA as
eluents. The purity and identity of the peptides were assessed by ESI-MS and RP-HPLC-ESI-
MS analyses performed on a Finnigan LCQ-ESI Spectrometer coupled to a Hewlett Packard
HP1100 HPLC-System.
It should be noted that the coupling of Phe19 can be a little problematic due to the
hydrophobic sequence. Therefore, a longer coupling time or double coupling of this residue
are necessary. Purification of these peptides via RP-HPLC was very time-consuming. Only a
low concentration of Aβ14-23 in the injection solution could be used. A concentration of the
injection solute higher than 5 mg/ml peptide in 0.1% TFA/acetronitril solvent caused
aggregation of Aβ14-23 in the column.
3.2 Aβ14-23 forms similar fibrils as Aβ1-40 as observed by Electron
Microscopy.
Fig. 3-1 shows Electron Microscopy (EM) images of negatively stained Aβ14-23 and Aβ1-40
samples after incubation at pH 4 at concentration of 0.5 mM and 0.1 mM, respectively. The
pH of the buffer has been adjusted to 4.0, 10 mM PO43-, in order to allow for optimal
formation of fibrils (2). At this pH value Aβ14-23 formed β-sheet structure immediately after
dissolving in buffer as observed by Circular Dichroism spectroscopy (data shown below, Fig.
3-5), which is believed to be related to fibril formation (3). Both Aβ14-23 and Aβ1-40 fibrils
display straight, unbranched, ribbon-like morphologies which are 10- to 25-nm in diameter
and several micrometers in length. These fibrils appear as twisted pairs of single filaments

RESULTS AND DISCUSSION
- 78 -
with a varying periodicity from 100 nm to 600 nm, as commonly observed for amyloid fibrils
(4). This is consistent with previous evidences that Aβ14-23 forms mature fibrils
morphologically identical to Aβ1-40 fibrils (5). As suggested by Marsh et al. (6), the length of
a β-strand can be calculated as 0.695 nm ×n/2, where n is the number of residues involved in
the β-strand. Assuming Aβ14-23 forms fibrils with a fully extended β-strand conformation (n =
10), fibrils would be expected to be approximately 3.5 nm in width, which is smaller than the
5-15 nm measured in our EM data as the fibrils’ diameter. This discrepancy suggests that
fibrils are composed of more than one protofilament. This is in agreement with the previously
experimental data for Aβ fibrils observed by EM (2, 7, 8) and X-ray diffraction (9). For Aβ1-
40, the width of the fibrils would be expected to be 14 nm (n = 40), provided the molecules
were in the extended β conformation. However, the observed maximum widths are only 12.5
nm. This suggests that each Aβ1-40 molecule must adopt a hairpin structure or that some
regions of the peptide are not involved in the core structure of the fibre. Tycko and co-
workers have experimentally shown that Αβ1-40 folds into a hairpin structure in the fibrillar
state (10). Based on EM and solid-state NMR data, they concluded that the first 10 residues of
Αβ1-40 are structurally disordered in the fibril. Only residues 12-24 and 30-40 adopt β-strand
conformations and form in-register parallel β-sheets through intermolecular hydrogen bonds.
Residues 25-29 contain a bend of the peptide backbone that brings the two β-sheets in contact
through side chain and side chain interactions. Therefore the expected width based on this
model would be 4.5 nm (n =13), which is smaller than the 6.5-12.5 nm observed as the Αβ1-40
fibrils’ diameter. This again suggests that Αβ1-40 fibrils consist of several protofibrils.
At pH 4, Aβ forms fibrils with the same morphology, as Aβ peptides in solutions at different
pH values (4). This finding is not consistent with the previous results obtained by Wood et al.
(11). In their study, the aggregates of Aβ1-40 formed at pH 5.8 differed from classical amyloid
fibrils. The fibrils appeared in electron micrographs as a mixture of larger particles of
different morphologies.
Study of mature amyloid fibrils by EM shows that Aβ14-23 forms ordered amyloid fibrils,
exhibiting similar morphology to those of full-length Αβ. We have chosen to work with the
fibril model Aβ14-23 first, rather than the full-length Aβ1-40, since this peptide seemed to be -
due to its length-an easier model to study ligand-fibril interactions. In addition, this peptide
sequence is located in the central region of the full-length Αβ, which is found to be important

RESULTS AND DISCUSSION
- 79 -
for fibril formation (5) and may represent the core structure of amyloid fibrils. Also, Aβ14-23
was characterized to fold into an anti-parallel β-sheet structure, from which a model (5) was
available at the time when this project was started. Thus Αβ14-23 can serve as a model system
for fibril inhibition studies under our working conditions. Furthermore, we extend the same
study to full-length Aβ. In addition, comparing the structure of the ligand bound to Αβ14-23
and Aβ1-40 allows to draw conclusions about possibly different fibril structures.
Fig. 3-1. Aβ14-23 forms fibrils similar to those formed from full-length Aβ. Aβ peptides were incubated at 0.5mM in buffer at pH 4 as described under “Materials and Methods”. After 7 days of incubation, a 5 µl sample was placed on a EM grid and negatively stained with 3% uranyl acetate. A, 0.5 mM Aβ14-23; B, 0.1 mM Aβ1-40. Scale bars in the EM images are 1 µm.
3.3 Effect of peptide inhibitor iAβ5 and iAβ5inv on Aβ fibril formation as
observed by EM.
The effect of the identified peptide inhibitors on the assembly process of Aβ was investigated
by negative staining electron microscopy. iAβ5 was found to be able to inhibit Aβ1−42
fibrillogenesis and disassemble preformed fibrils in vitro (12). Here, we confirm this
inhibitory effect of iAβ5 on fibrils formed from synthetic Aβ1-40 under our experimental
conditions. Fig. 3-2A shows a control sample, in which Aβ1-40 was incubated alone in buffer
at pH 4, 10 mM PO43-. Only mature fibrils are observed. In contrast, a higher percentage of
Aβ1−40 intermediates, nonfibrillar and polymeric sheet assemblies with only a few detectable
mature fibrils are detectable over prolonged incubation of pre-fibrillized Aβ1-40 (7 days) with
a 100-fold excess of iAβ5 (Fig. 3-2B). The EM experiment was performed 7 days after
addition of iAβ5 to the Aβ solution. Generally, while mature fibril formation is decreased, the
RESULTS AND DISCUSSION
- 80 -
occurrence of structural intermediates is increased in the presence of peptide inhibitors.
Moreover, we show that this inhibitory effect of iAβ5 is not restricted to Aβ1-40, but is also
observable for synthetic Aβ14-23. Mature fibrils are the predominant structure in the control
sample of Aβ14-23 (Fig. 3-2D). Under similar incubation conditions, addition of a 10-fold
excess of iAβ5 to the 7-day-preformed Aβ14-23 fibril solution dramatically changes the
morphology of the aggregates as detected 7 days later by EM (Fig. 3-2E). We observed a
reduced amount of polymers and mostly short polymeric sheet assemblies that have a length
of around 500 nm, instead of elongated fibrils, indicating that fibrils are disassembled into
smaller units.
A similar inhibitory effect on Aβ fibrils was observed for another peptide, DPFFL (referred to
as iAβ5inv), as shown in Fig. 3-2C and Fig. 3-2F. For iAβ5inv the inverse hydrophobic and
hydrophilic amino acids at the N-terminus and at the C-terminus are exchanged. In Fig. 3-2C,
the sample was prepared by addition of a 100-fold excess of iAβ5inv to a 7-day incubated Aβ1-
40 solution, and detected 7 days later by EM. Only short fibrils and pseudospherical structures
(13) are visible. Similarly, iAβ5inv suppresses the assembly of Aβ14−23 peptides into mature
fibrils at a molar ratio of 10:1 (Fig. 3-2F). The absence of visible elongated amyloid fibrils is
a direct evidence for the fact that the peptide inhibitors iAβ5 and iAβ5inv can dissolve Aβ
peptide aggregates. The inhibitory effect of β-sheet breaker peptides are extensively studied
by Soto and co-workers (12, 14-18). We wanted to reproduce these findings in order to
compare the EM results with our NMR data.
In this study, we present EM data demonstrating that both iAβ5 and iAβ5inv do interact with
Aβ1-40 and Aβ14-23, which suggests that there is one common binding site for iAβ5 and iAβ5inv
interacting with Aβ1-40 or Aβ14-23. Aβ14-23 has the same hydrophobic core as Aβ1−40 (LVFF).
Since iAβ5 was designed to recognize this core structure, one could expect that iAβ5 could
easily bind to the same core due to its similar hydrophobic pattern. For iAβ5inv, the reversed
terminal amino acids do not affect the inhibitory effect of this peptide towards Aβ fibril
formation, which shows that the affinity may possibly be driven by the hydrophobic
interactions between the two Phe residues on each peptide. However, the neurotoxicity of
Aβ14-23 in the presence of these two peptide inhibitors remains to be investigated. Also,
despite the different sizes Aβ fibrils appear as very similar structures under the conditions
examined in this work, with diameters of 5-12 nm and indefinite length in EM images.
However, after addition of either of the peptide inhibitors, fibrils are shortened into small

RESULTS AND DISCUSSION
- 81 -
fragments, with a size range of 50 to 80 nm, while the diameter of these short fragments
remain at the same scale. Thus, the observed fibril length differences suggest the inhibitory
effect of iAβ5 or iAβ5inv to fibrils is taking place along the fibril’s axis, not between
protofilaments. Very likely, the inhibitors occupy the critical sites which are required for
assembly of successive β-sheets, thus disrupting the assembly of Aβ peptides along the fibril
axis within one protofilament. In order to answer this question, a structural model for the
interaction of inhibitors with Aβ fibrils is required.
Fig. 3-2. The influence of peptide inhibitors on fibril morphology of Aβ studied by EM. Aβ alone or with peptide inhibitor iAβ5 or iAβ5inv were incubated in buffer at pH 4 as described under “Materials and Methods”. Measurements were done after 7 days of incubation. A, 0.1 mM Aβ1-40 alone; B, 0.1 mM Aβ1-40 with 5 mM iAβ5; C, 0.1 mM Aβ1-40 with 5 mM iAβ5inv; D, 0.5 mM Aβ14-23 alone; E, 0.5 mM Aβ14-23 with 5 mM iAβ5; F, 0.5 mM Aβ14-23 with 5 mM iAβ5inv.

RESULTS AND DISCUSSION
- 82 -
3.4 Aβ secondary structure studies by CD spectroscopy.
The secondary structure for Aβ in the absence and presence of peptide inhibitors as a function
of concentration and pH value was followed by CD, respectively. The CD spectra for Aβ14-23
were recorded using five different peptide concentrations, measured at various time intervals
up to 72 hours. Fig. 3-3 shows the concentration dependence of the secondary structure of
Aβ14-23 at pH 4. CD spectra of lower concentration samples (like 50 µM, 100 µM, 200 µM)
show a minimum at 195 nm, which is typical of random coil secondary structure in the
solution. CD spectra of samples at concentration higher than 300 µM show that there is one
minimum at 218 nm, which is a clear indication of a β-sheet structure in solution. Fig. 3-4
shows the time dependence of secondary structures for Aβ. With longer incubation times, the
minimum at 218 nm decreases, which indicates that the β-sheet structure in solution is
decreasing and more Aβ14-23 form fibrils which can not be detected any more. However the
indicated β-sheet structure is stable for at least 4 hours in solution as indicated in Fig. 3-4.
Fig. 3-3. Concentration-dependent secondary structural changes for Aβ14-23 analyzed by circular dichroism. Circular dichroism spectra of 100 µM, 200 µM, 300 µM, 400 µM and 500 mM Aβ14-23 were recorded in 10 mM phosphate buffer at pH 4, 30°C.
The pH dependence of secondary structure of Aβ14-23 at concentration of 300 µM is shown in
Fig. 3-5. At higher pH value, like pH 10, or 8, only a random structure is present in the
solution. Once the pH value is decreased to pH 5, a spectrum typical of β-sheets with a
minimum at 217 nm dominates.

RESULTS AND DISCUSSION
- 83 -
Fig. 3-4. Time-dependent secondary structural changes for Aβ14-23 analyzed using circular dichroism. Circular dichroism spectra of 300 µM were recorded in 10 mM phosphate buffer at pH 4 at time zero up to 240 minutes as indicated, 30°C.
Fig. 3-5. pH-dependent secondary structural changes for Aβ14-23 analyzed using circular dichroism. Circular dichroism spectra of pH 3.5 (A), pH 4 (B), pH 7 (C), pH 8 (D) and pH 10 (E) Aβ14-23 were recorded in 10 mM phosphate buffer at 300 µM at 30°.
The influence of iAβ5 on the secondary structure of Aβ14-23 was also investigated by CD
studies (Fig. 3-6). The CD spectra for Aβ14-23 in the presence or absence of iAβ5 (Fig. 3-6A)
were measured 10 min after dissolution. When 0.5 mM Aβ14-23 was incubated alone, the shape
of the CD spectrum indicates almost complete β-sheet structures. The CD spectrum of 0.5
mM iAβ5 shows a minimum at 195 nm, typical for random coil secondary structure. If a
certain amount of iAβ5 stock solution is added to the Aβ solution to reach a concentration of
0.5 mM for both, the CD spectrum shows a decreased intensity at ~208 nm, but a similar
intensity at 218 nm. iAβ5 does not alter CD spectrum of Aβ14-23, indicating no disturbance of
the secondary structure of Aβ14-23 by iAβ5. Studies of Aβ14-23 with excess amount of iAβ5 by
CD spectroscopy were carried out for 0.1 mM Aβ1-40 with 1 mM iAβ5 at pH 4. In Fig. 3-6B,

RESULTS AND DISCUSSION
- 84 -
the CD spectrum of Aβ1-40 shows a typical curve of β-sheet structure under the experiment
conditions. Addition of 10 fold excess of iAβ5 changed the CD spectrum which is a type of
α-helix structure.
Fig. 3-6. The influence of iAβ5 on the secondary structure transitions in Aβ studied by CD. Figure A: a, 500 µM iAβ5 was also incubated alone and its CD spectrum is included in the figure to illustrate its contribution to the spectrum when mixed with Aβ; b, Aβ14-23 was incubated at 500 µM in 10 mM buffer at pH4; c, 500 µM Aβ14-23 with 500 µM iAβ5; d, theoretical sum of spectrum A and B. Figure B: the CD spectra for 1 mM iAβ5, 0.1 mM Aβ1-40, mixture of 0.1 mM Aβ1-40 with 1 mM iAβ5 and theoretical sum of spectrum iAβ5 and Aβ1-40.
Aβ aggregation is linked to the conversion of the peptide from a random coil to a β-sheet
secondary structure (19, 20). Initially we considered the possibility that iAβ5 could prevent
Aβ aggregation by binding to Aβ and changing the β-sheet structure of Aβ which is an initial
step of fibrillization. Analysis of CD spectra demonstrates that iAβ5 does not change the β-
sheet content of Aβ in solution in a ratio of 1:1 (Fig. 3-6A). This means that iAβ5 does not
bind to monomeric Aβ. This is consist with the findings obtained by Murphy and co-workers
(21). In their experiments, Aβ10-35 was immobilized on a surface at a low density. iAβ5 and
other compounds were used in their assay for determining the relative affinity for Aβ. Unlike
the other peptides such as KLVFFKK, iAβ5 showed an insignificant response level in the
assay. Murphy and co-workers considered that iAβ5 may only interact with higher-order
assemblies of Aβ, which they had attempted to minimize in their experimental conditions.
However, at an excess amount, iAβ5 could affect the secondary structure of Aβ peptide (Fig.
3-6B). At the same time, Aβ does not form mature fibrils in the presence of excess amount of
inhibitors as detected by EM (Fig. 3-2B, E). These results demonstrate that the inhibition of
Aβ fibril formation by iAβ5 is not due to iAβ5 associating with monomeric Aβ and thus
changing the Aβ secondary structure, rather its action is more due to a later step in the

RESULTS AND DISCUSSION
- 85 -
aggregation pathway. Moreover, this result demonstrates that the formation of amyloid is a
non-necessary end point of β-sheet formation for Aβ.
3.5 The influence of iAβ5 on the ThT binding of Aβ14-23.
Fig. 3-7 shows the effect of iAβ5 in preventing the formation of ordered fibrils as investigated
by Thioflavine T fluorescence. Thioflavine T (ThT) was reported to associate rapidly with
aggregated fibrils formed from native and synthetic Aβ peptides (22), which is going along
with changes of the excitation (ex) (absorption) and emission (em) wavelength. This change is
only related to the aggregated state of Aβ, as monomeric or dimeric peptides do not react with
Thioflavine T. Thus, this fluorometric technique should be suitable for testing the effect of the
selected peptide inhibitors on the assembly of Aβ peptides. Fluorescence spectra of ThT in the
presence of aggregated Aβ14−23 exhibits an excitation maximum at 480 nm and an emission at
518 nm. Incubation of Aβ14−23 with iAβ5 shows a reduced fluorescence signal at both ex and
em wavelengths. Assuming that iAβ5 has no effect on the ThT fluorescence, the decreasing
fluorescence signal corresponds to less aggregated material in solution, which indicates that
iAβ5 prevented formation of ordered fibril. This result confirms that the inhibitory effect of
iAβ5 on the assembly of Aβ14-23 resembles that of Aβ1-40, as shown by Soto and co-workers
(12).
Fig. 3-7. The influence of iAβ5 on the ThT binding of Aβ14-23. Samples of Aβ14-23 (0.5 mM) with or without iAβ5 (0.5 mM, 5 mM) were incubated for 1 h, and measured by Fluorescence spectroscopy.
In Fig. 3-7, a tenfold excess of iAβ5 prevents the fibril formation only slightly more
compared to the effect of an equal amount of iAβ5. Since these experiments were carried out
after a short incubation time (1 h), the comparison might not show the inhibitory effects

RESULTS AND DISCUSSION
- 86 -
quantitatively. Time dependent experiments of this effect would be required in order to
quantitatively analyse the inhibitory effects for iAβ5 at various ratios with respect to Aβ.
3.6 The assignment of iAβ5 and iAβ5inv in the NMR spectra.
The purity of the synthetic peptides was verified with electrospray mass spectrometery and
analytic HPLC to be >98%. However, the proton 1D spectra of iAβ5 and iAβ5inv show two
sets of chemical shifts (Fig. 3-8). This is because of the presence of cis and trans
conformers of proline as discussed later.
Fig. 3-8. 1D-1H spectrum of iAβ5 at 5 mM in 10 mM PO4
3- at pH 4, 30 °C.
1H chemical shifts of iAβ5 and iAβ5inv were assigned manually using regular TOCSY with a
mixing time of 50 ms and NOESY spectra with varying mixing times from 10 ms up to 500
ms. Spectra were recorded on iAβ5 or iAβ5inv with and without Aβ14-23 fibrils at 30°C. The
identification of most spin systems was achieved unambiguously from proton TOCSY
connectivities. Fig. 3-9 shows the residue patterns assigned in the aliphatic region of the
TOCSY spectrum. HN resonances were assigned by connecting HN with Hα and Hβ
resonances in a TOCSY spectrum as shown in Fig. 3-10 for 19F-iAβ5. For 19F-iAβ5, due to
the overlap of HN for Phe and Asp residues, the assignments of Phe3 and Phe4 were not
available from the sequential Hαi-HN
i+1 connectivities in a NOESY spectrum, but were
accomplished by the combined analyses of the H-H connectivities in the aromatic regions of

RESULTS AND DISCUSSION
- 87 -
the NOESY spectra and ascertained by the examination of the HN-Hβ connectivities, as shown
in Fig. 3-11. This is done because Hη of Phe3 is substituted by 19F so that the spin pattern of
Phe3 in the aromatic region contains two peaks while that of Phe4 contains three. For iAβ5inv,
the assignments of Phe3 and Phe4 were easily done by the sequential Hαi-HN
i+1 connectivities
in the HN-Hα region of the NOESY spectrum, as shown in Fig. 3-12. The β and γ protons of
Leu and Pro residues were assigned on the basis of their 13C chemical shifts from 13C-HSQC
spectra. The complete assignments for the 1H resonances of all amino acid residues are listed
in Table 3-1A. 13C shifts were assigned by correlating them with the assigned proton chemical
shifts (Fig. 3-13, Table 3-1B).
Fig. 3-9. Aliphatic region of a TOCSY spectrum of 19F-iAβ5 (H2O/D2O 9:1, 30 °C, 600 MHz, mixing time 50 ms) with assignments of intraresidue connectivities. Leu1’ and Pro2’ are the minor conformations of iAβ5.

RESULTS AND DISCUSSION
- 88 -
Fig. 3-10. HN assignment of 19F-iAβ5 in expanded regions of a TOCSY spectrum.
Fig. 3-11. Expanded regions of the NOESY spectrum for the Phe3 and Phe4 assignments of 19F-iAβ5 in the presence of Aβ14-
23 at pH 4. The spectrum was recorded on a 750 MHz Bruker spectrometer, with a mixing time of 150 ms, at 30 °C.

RESULTS AND DISCUSSION
- 89 -
Fig. 3-12. Expanded region of a NOESY spectrum for the Phe3 and Phe4 assignment of iAβ5inv in the presence of Aβ14-23 at pH 4. The spectrum was recorded on a 750 MHz Bruker spectrometer, with a mixing time of 200 ms, at 30 °C.
Fig. 3-13. Aliphatic region of the 13C-HSQC spectrum for the 13C assignment of u-13C,15N-iAβ5 at pH 4, 30 °C. Table 3-1A. 1H chemical shifts of 19F-iAβ5 in the absence of fibrils at pH 4, 303 K.
NH αH βH γH δH εH Leu1 4.22 1.70 1.64(*) 0.94 Pro2 4.353 2.133, 1.64 (*) 1.926 3.658, 3.492 Phe3 8.072 4.424 2.932 2,6H: 7.003 3,5H: 7.115 Phe4 7.900 4.546 3.034, 2.885 2,6H: 7.170 3,5H: 7.282 4H: 7.239 Asp5 8.023 4.481 2.785, 2.732
(* indicates the overlap resonances for the protons)

RESULTS AND DISCUSSION
- 90 -
Table 3-1B. 13C chemical shifts of u-13C,15N-iAβ5 in the absence of fibrils at pH 4, 303 K.
Cα Cβ Cγ Cδ Cε Cη Leu1 51.10 39.52 24.00 20.73, 22.57 Pro2 60.77 29.24 24.43 48.11 Phe3 55.14 37.39 130.23 129.7 128.07 Phe4 55.14 37.39 130.23 129.7 128.07 Asp5 50.03 36.38
(In this sample, Phe3 and Phe4 have the same 13C chemical shifts for all the resonances.)
As can be seen from Fig. 3-9 and Fig. 3-13, two sets of 1H and 13C chemical shifts for Pro and
Leu exist, which are due to the trans and cis conformers of Pro in the peptide. Schubert et al.
demonstrated that the chemical shift difference of 13Cγ and 13Cβ is a reference-independent
indicator of the Pro peptide bond conformation (23). Thus the two conformations of Pro could
be easily distinguished from the assigned 13Cγ and 13Cβ chemical shifts using the POP
program (Prediction Of Proline conformation) (23).
Table 3-2 shows the 13Cγ and 13Cβ chemical shifts for two set of Pro residues as assigned in
Fig. 3-13, together with the predicted probability of cis or trans Pro conformations by POP.
Table 3-2A. The probabilities for cis or trans conformations of Pro in iAβ5 in a 10 mM phosphate buffer at pH 4 derived from 13Cγ and 13Cβ chemical shifts using the program POP.
13Cβ (ppm) 13Cγ (ppm) ∆ (ppm) Normalized probability of Pro-trans
Normalized probability of Pro-cis
Pro2 (major) 29.243 24.432 4.811 99.91% 0.081% Pro2’ (minor) 32.231 21.686 10.545 0% 100%
Table 3-2B. The probabilities for cis or trans conformations of Pro in iAβ5 in the presence of Aβ14-23 in the 10 mM phosphate buffer at pH 4 derived from 13Cγ and 13Cβ chemical shifts using the program POP.
13Cβ (ppm) 13Cγ (ppm) ∆ (ppm) Normalized probability of Pro-trans
Normalized probability of Pro-cis
Pro2 (major) 29.51 24.71 4.80 99.92% 0.076% Pro2’ (minor) 32.17 22.03 10.14 0% 100%
By comparing the intensities of the two sets of resonances in 1D 1H spectra, we find that
about 87% iAβ5 has the Pro of trans conformer, only 13% has Pro of cis conformer. And the
population of isomers does not change in the presence of Aβ fibrils (Fig. 3-14). Taken
together, the trans and cis conformers keep the same equilibrium in the absence and presence
of Aβ fibrils. Therefore, the inhibitory effect of iAβ5 or iAβ5inv is not due to the dynamics of
trans and cis conformer of Proline.

RESULTS AND DISCUSSION
- 91 -
Fig. 3-14. The population of trans and cis conformer of peptide inhibitors in the absence and presence of Aβ fibrils.
The proton chemical shifts of iAβ5 or iAβ5inv in the presence of fibrils were compared to
those in the absence of fibrils as shown in Table 3-3. As we can see, the chemical shift
changes induced by Aβ fibrils are moderate and not localized to certain regions within the
primary structure. It is therefore very likely that these shifts are due to the residual orientation
of inhibitor and not due to modifications of its structure due to interactions with the fibrils.
One example shown in Table 3-4 shows the small 13C chemical shift differences observed for
peptide inhibitors in the absence and presence of fibrils.
Table 3-3. 1H chemical shifts differences of iAβ5 or iAβ5inv in the absence and presence of fibrils. Sample A is a 5 mM 19F-iAβ5 with and without 0.5 mM Aβ14-23 at pH 4, 303 K. Sample B is a 0.5 mM u-15N, 10% 13C- iAβ5inv and 5 mM u-15N, 10% 13C-iAβ5inv with 0.5 mM Aβ14-23 at pH 4, 303 K. Sample C is a 0.5 mM 19F-iAβ5 with and without 0.5 mM Aβ14-23 at pH 4, 283 K.
Sample A Sample B Sample C NH -- -0.176 -- αH -0.008 +0.062 -0.005 βH +0.001 +0.001 -0.003 γh -0.004 +0.001 -0.004
Leu
δH 0 +0.009, +0.003 0 αH +0.008 +0.030 -0.005 βH -0.001, -0.006 -0.016, -0.028 -0.006, -0.004 γh -0.003 +0.006, -0.023 -0.005
Pro
δH 0, +0.010 -0.025, +0.007 -0.002, -0.001 NH -0.034 -0.111 +0.005 αH 0 +0.016 -0.003 βH 0 +0.034 -0.004
Phe3
γh -0.005 +0.008 -0.001

RESULTS AND DISCUSSION
- 92 -
δH -0.005 +0.008 -0.005 εH -- +0.004 -- NH -0.044 -0.238 +0.012 αH -0.002 +0.012 -0.003 βH -0.006, +0.006 +0.034 +0.004, -0.007 γh -0.008 +0.008 +0.001 δH 0 +0.008 -0.002
Phe4
εH -0.002 +0.004 -0.005 NH +0.015 -- -0.015 αH +0.031 +0.015 -0.021
Asp
βH +0.010, +0.016 +0.078, +0.042 -0.006, -0.007
Table 3-4. 13C chemical shifts differences of iAβ5inv in the absence and presence of Aβ14-23 fibrils. Cα Cβ Cγ Cδ Cε Cη Asp1 0.06 0.03 Pro2 0.07 0.025 0.01 0.04 Phe3 0.084 0.032 -0.006 -0.004 Ph4 0.045 0.046
-0.008 -0.008 -0.003 0.001
Leu5 0.04 0.047 0.015 0, 0.01
3.7 Binding of iAβ5 or iAβ5inv to Aβ peptides studied by solution NMR.
The interaction of iAβ5 or iAβ5inv with Aβ peptides was further investigated by NMR. 1D 1H
spectra of iAβ5 and iAβ5inv in the absence and presence of Aβ fibrils were compared
respectively. One representative experiment is shown in Fig. 3-15.
Fig. 3-15. 750 MHz 1H NMR spectra of 5 mM iAβ5inv with and without 0.5 mM Aβ14-23, in 10 mM phosphate buffer at pH 4.0, 30 °C.
The 1D proton spectrum for iAβ5inv with Aβ14-23 show no signals of Aβ14-23 due to its large
molecular weight in the fibrillized state. The proton peak intensities of iAβ5 in the mixture
sample decrease by 45% compared to those in the pure iAβ5 sample. This indicates that ca.

RESULTS AND DISCUSSION
- 93 -
45% of the iAβ5 is bound to Aβ14-23 fibrils and cannot be detected. Care was taken to
reproduce the same iAβ5 concentration in both samples (see Material and Methods).
Fig. 3-16 represents a column along the aromatic ring resonance Hδ of Phe3 in the NOESY
spectra recorded on 19F-iAβ5 without (a) and with Aβ14-23 fibrils (b-d). Whereas a few
negative signals were detected for the free peptide in solution, an extensive set of positive
NOE signals of the same sign compared to the diagonal peaks was detected when the peptide
was measured after addition of Aβ14-23 fibrils. Already at a mixing time of τm = 50 msec, cross
peaks between almost all 1H resonances are observed (Fig. 3-16b). The detected trNOE
signals confirm the binding of the peptide to Aβ14-23 fibrils.
Fig. 3-16. Column along Phe3 Hδ of the NOESY spectra recorded on 19F-iAβ5 without (lane 1) and with Aβ14-23 fibrils (lanes 2-4) at different mixing times. The reference spectrum of 19F-iAβ5 without Aβ14-23 fibrils was recorded at 600 MHz, whereas all other spectra were recorded at 750 MHz field strength.
3.8 Structural studies by trNOE experiments.
As shown before, Aβ forms fibrils in solution and thus gives no signals in the solution NMR
spectrum, where their size is far beyond the NMR size limitations of ~50 kDa. However,
provided that the Kd of the ligand-fibril complex is on the oder of µM, regular solution NMR
experiments on the excess of free ligand can be used to study the conformation of the bound
ligand. The very efficient cross-relaxation processes in the slowly tumbling complex
dominate the magnetization transfer processes during the NOE mixing time. The cross-
relaxation rate occurring in the free ligand is then negligible. Therefore, NOESY spectra on a

RESULTS AND DISCUSSION
- 94 -
dynamically exchanging system containing an excess of free ligand, in rapid exchange with
bound ligand, can be used to determine the structure in the bound form. TrNOE
measurements of the type utilized here, when peptide inhibitors transiently bind to a very
large particle, require high off-rates, i.e. weak binding constants. Solid-state NMR
experiments indicate that the dissociation constant of iAβ5 (with respect to Aβ14-23) must be
high reflecting a very weak interaction. We subjected a solution NMR preparation to
ultracentrifugation. The experimental MAS solid-state NMR 1D 13C spectrum of the pellet
does not show significant changes compared to the 13C spectrum of a preparation that only
contains fibrillized Aβ14-23 (Fig. 3-17). This is in agreement with surface plasmon resonance
experiments which were carried out in the past for various inhibitors interacting with Aβ (21,
24). The dissociation constants of ligands with respect to Aβ are found to be typically on the
order of 100 µM.
Fig. 3-17. 1D MAS 13C spectrum of fibrillized Aβ14-23 incubated alone or with inhibitor iAβ5 at pH 4, room temperature. A, 10 mg lyophilized Aβ14-23 was dissolved in 7.5 ml 10 mM phosphate buffer at pH 4 as described in the methods part. The solution was centrifuged after 7 days of incubation and the pellet was filled into a 4-mm MAS rotor. B, 10 mg Aβ14-23 together with 5.5 mg u-13C, 15N- iAβ5 (at a molar ratio of 1:1) was prepared as for sample A. Spectra were recorded at 12 °C, ns = 20 K, a MAS frequency of 11 kHz.
trNOE experiments have been recorded in order to characterize the bound structure of iAβ5
with respect to fibrillar Aβ. The NOESY spectrum of the free peptide at 30 °C shows a few
cross peaks of opposite sign compared to the diagonal peaks, indicating that the peptide is in
the fast tumbling limit (Fig. 3-18A). However, in the NOESY spectrum recorded on iAβ5 in
the presence of Aβ fibrils, already at a mixing time of 50 msec, cross peaks between almost
all 1H resonances were observed with the same sign as the diagonal peaks, indicating that
iAβ5 is in the process of slow tumbling (Fig. 3-18B). Subtraction of the background NOE

RESULTS AND DISCUSSION
- 95 -
peaks corresponding to the free peptide was not used due to the small and weak cross peaks in
the spectrum of the free peptide.
Fig. 3-18. NOESY spectra for iAβ5inv (5 mM) with and without Aβ14-23 (0.5 mM) in 10 mM phosphate buffer at pH 4 and 30 °C. A, iAβ5inv, mixing time 500 ms; B, iAβ5inv with Aβ14-23, mixing time 50 ms.
At the same time, diffusion experiments were carried out to obtain information about a
possible oligomeric arrangement of iAβ5 (in the absence of Aβ fibrils) (Fig. 3-19). We used
TMS as a molecular weight reference to estimate the diffusion coefficient and, thus, the
molecular weight of u-13C,15N-iAβ5 at different peptide concentrations 0.5 mM and 5 mM,
respectively. Assuming a molecular weight of 88 Da for TMS, we can estimate the molecular
weight of u-13C, 15N-iAβ5 to be on the order of 690 Da which corresponds quite well with the
Fig. 3-19. DOSY experiments carried out for iAβ5 at different concentrations (0.5 mM and 5 mM, respectively) in the absence of Aβ14−23 fibrils. Trimethylsilane (TMS) was used as a molecular weight standard.
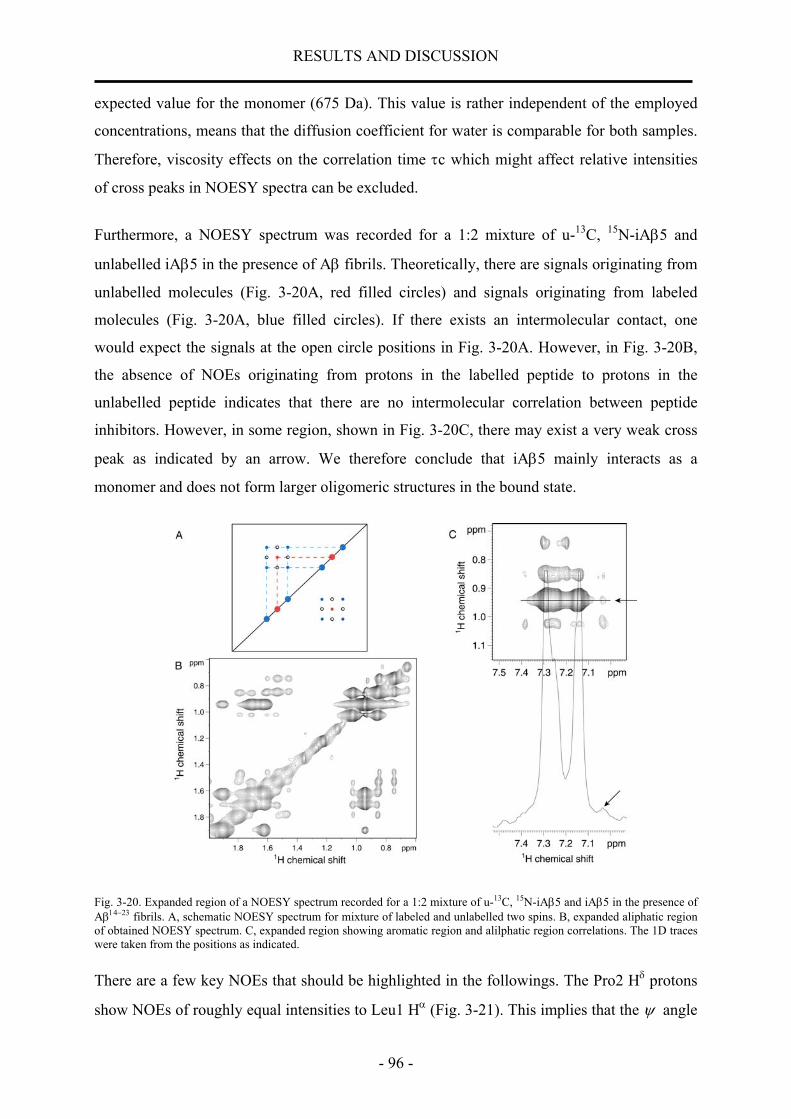
RESULTS AND DISCUSSION
- 96 -
expected value for the monomer (675 Da). This value is rather independent of the employed
concentrations, means that the diffusion coefficient for water is comparable for both samples.
Therefore, viscosity effects on the correlation time τc which might affect relative intensities
of cross peaks in NOESY spectra can be excluded.
Furthermore, a NOESY spectrum was recorded for a 1:2 mixture of u-13C, 15N-iAβ5 and
unlabelled iAβ5 in the presence of Aβ fibrils. Theoretically, there are signals originating from
unlabelled molecules (Fig. 3-20A, red filled circles) and signals originating from labeled
molecules (Fig. 3-20A, blue filled circles). If there exists an intermolecular contact, one
would expect the signals at the open circle positions in Fig. 3-20A. However, in Fig. 3-20B,
the absence of NOEs originating from protons in the labelled peptide to protons in the
unlabelled peptide indicates that there are no intermolecular correlation between peptide
inhibitors. However, in some region, shown in Fig. 3-20C, there may exist a very weak cross
peak as indicated by an arrow. We therefore conclude that iAβ5 mainly interacts as a
monomer and does not form larger oligomeric structures in the bound state.
Fig. 3-20. Expanded region of a NOESY spectrum recorded for a 1:2 mixture of u-13C, 15N-iAβ5 and iAβ5 in the presence of Aβ14−23 fibrils. A, schematic NOESY spectrum for mixture of labeled and unlabelled two spins. B, expanded aliphatic region of obtained NOESY spectrum. C, expanded region showing aromatic region and alilphatic region correlations. The 1D traces were taken from the positions as indicated.
There are a few key NOEs that should be highlighted in the followings. The Pro2 Hδ protons
show NOEs of roughly equal intensities to Leu1 Hα (Fig. 3-21). This implies that the ψ angle

RESULTS AND DISCUSSION
- 97 -
is close to 120° and that the peptide bond between Leu1 and Pro2 is trans. In an attempt to
obtain more accurate distance information from the trNOE experiment, we measured the
trNOEs as a function of the mixing time. The significant reduction in some of signal intensity
as well as the appearance of new cross peaks that are not present in the data sets with shorter
mixing times is assumed to be reflecting spin diffusion effects. The 50-ms, 150-ms and 100-
ms data sets were selected for the analysis of trNOE effects for iAβ5inv and iAβ5inv bound to
Aβ14−23 and iAβ5inv bound to Aβ1-40, respectively.
Fig. 3-21. Aliphatic region of the NOESY spectra recorded on 19F-iAβ5 in the presence of 0.5 mM Aβ14-23 fibrils (at a molar ration of 10:1) at a mixing time of 150 ms. The inset shows one row along Leu1 Hα resonance.
For a NOESY spectrum recorded with a mixing time of 50 ms, only 35 out of 110 observed
NOEs were unambigously assigned for 19F-iAβ5 bound to Aβ14-23. Ambiguities in the other
cross peaks result either from resonance overlap or from the lack of stereospecific
assignments. The same experiments were carried out for iAβ5 with Aβ1-40, iAβ5inv with Aβ14-
23 and Aβ1-40 respectively. Despite the detected positive NOEs, addition of iAβ5 to Aβ1-40
caused strong line broadening in a 1D spectrum, Thus, NOESY spectra were not satisfactory
for structural calculation for iAβ5 bound to Aβ1-40. NOEs obtained for other combinations of
inhibitor and fibril systems were used for structural calculations as shown below.
Transferred NOEs between protons on the peptide inhibitors permit to calculate the
geometries in the bound state effectively. However, because no long-range NOEs are
available between inhibitors and Aβ peptides, the exact arrangement of the peptide inhibitors
on the fibril is not possible using only trNOE data.

RESULTS AND DISCUSSION
- 98 -
3.9 Structural calculation of iAβ5 or iAβ5inv bound to Aβ.
For iAβ5 (iAβ5inv) in solution together with Aβ14−23, 35 (40) intraresidue and 75 (38)
interresidue NOE contacts were used to calculate the structure. For iAβ5inv bound to Aβ1−40,
45 intraresidue and 43 interresidue NOE restrains were employed. All structure calculations,
minimizations and simulated annealing procedures were carried out using CNSsolve version
1.0 (25). From 200 calculated structures, 20 were selected based on their energy as well as
their violations of experimental restraints. These 20 models from each set show a high degree
of similarity (Fig. 3-22, Table 3-4). No hydrogen bond restraints were used in the initial
rounds of structure calculation. However, analysis of the final calculated structure of 19F-iAβ5
identified a hydrogen bond between Leu1-CO and Asp5-HN.
Fig. 3-22. The sets of 20 lowest energy structures of the peptide inhibitors in the bound state. A, 19F-iAβ5 bound to Aβ14-23; B, iAβ5inv bound to Aβ14-23; C, iAβ5inv bound to Aβ1-40. Table 3-4. Summary of structural statistics.
19F-iAβ5 iAβ5inva iAβ5inv
b Number of distance restraints 110 78 88 Intraresidue 35 40 45 Interresidue 75 38 43 RMSDs from experimental distance restraints (Å) 0.063 0.001 0.023 RMSDs from idealized covalent geometry Bonds (Å) 0.0097 0.0007 0.0032 Angles (°) 0.821 0.606 0.665 Impropers (°) 0.227 0.077 0.195
a iAβ5 was bound to Aβ14-23; b iAβ5 was bound to Aβ1-40.
The sequences of two peptide inhibitors iAβ5 and iAβ5inv share an equal core sequence (PFF)
but posse exchanged N-terminal (L for D) and C-terminal (D for L) residues. The NMR
structures of the two peptides iAβ5 and iAβ5inv bound to Aβ14-23 fibrils show different
backbone structures in the bound state, but identical spatial side chain orientations of equal
properties (Fig. 3-23A). Besides the identical side chain orientations for P2, F3 and F4 for
both peptides, the superposition reveal that L1 and D5 of iAβ5 can be superimposed with L5

RESULTS AND DISCUSSION
- 99 -
and D1 of iAβ5inv, respectively. This indicates that the spatial binding pattern for the different
peptides might be identical and both peptides bind to the same site in Aβ14-23.
iAβ5inv binds to fibrils formed by Aβ14-23 and Aβ1-40, respectively, with different structures
showing different backbone and different side chain orientations as shown in Fig. 3-23B. This
is an indication for distinct binding geometries at the binding sites of Aβ14-23 and Aβ1-40
fibrils.
Fig. 3-23. Superposition of the NOE-derived structures for peptide inhibitors. A, superposition of the structures for iAβ5 and iAβ5inv bound to Aβ14-23, respectively. B, superposition of the structures for iAβ5inv bound to Aβ14-23 and Aβ1-40, respectively.
3.10 Measurement of residual dipolar couplings in peptide inhibitors bound
to Aβ fibrils.
TrNOE experiments have been successfully used in this work to obtain distance restraints of
the bound conformation. However, lacking of the intermolecular NOEs between iAβ5 or
iAβ5inv and fibrillized Aβ can not provide any information about the orientation of ligands
relative to the fibrils. The determination of the bound geometry of protein ligands is an
important issue for improving our understanding of how a structure relates to a certain
biological function, and also for building a basis for rational drug design. Recently, residual
dipolar couplings (RDCs) have been used successfully to restrain the absolute orientation of
dipolar vectors with respect to the magnetic field, and to provide critical structural details of
biologically important molecules (26, 27). In this work, we suggest to use transferred RDCs
(trRDCs) from 13C-1H/15N-1H pairs on peptide inhibitors to validate the structure of peptide
inhibitors that bind transiently to oriented amyloid fibrils.

RESULTS AND DISCUSSION
- 100 -
3.10.1 Alignment of amyloid fibrils.
Measurement of dipolar couplings in the peptide inhibitor, which transiently binds to the
oriented fibrils requires a significant degree of net orientation of the peptide. Usually, the
orientation is introduced through unspecific interactions between the alignment medium and
the solute by certain alignment media, like bicelle type lyotropic liquid crystals (28), phage
particles (29, 30), purple membrane fragments (31, 32) or strained polyacrylamide gels (33,
34). However, similar to transferred NOE (35), transferred cross correlated relaxation (36-38),
and also specific interactions in the limit of weak binding can be exploited to obtain
information about transiently bound peptides and proteins (31, 39, 40). It has been
demonstrated that in favourable cases it is possible to measure dipolar couplings for a ligand
which is in rapid exchange between free solution and a bound state (39). In this study, we
show that the orientation required for measurement of residual dipolar couplings for iAβ5inv
could be introduced by transient binding to Aβ fibrils which orient in the magnetic field. Such
measurements offer information about the orientation of the bound ligand relative to the
oriented fibrils, complement transferred NOE data and result in a more detailed view of the
structure of the bound ligand.
In the following paragraph, we show that the diamagnetic anisotropy of β pleated sheets as
they are found in the amyloid fibrils can be used to restrain the orientation of small peptides
binding to amyloid fibrils. The effect is based on the diamagnetic susceptibility of the peptide
bond and can be detected if peptide planes orient synchronously (41). The size of the
diamagnetic anisotropy for a peptide bond is determined by the angle φ between the peptide
plane normal and the symmetry axis of the molecular system, and is given by ∆χ = ∆K (1 - 3
cos2 φ)/2 (where ∆K corresponds to the anisotropic diamagnetic susceptibility of the peptide
bond, ca. 8.8 × 10⁻⁶). The largest diamagnetic anisotropy is found in α-helices (∆χ = ca. 4.4 ×
10-6 N, where N corresponds to the number of peptide bonds; neglecting at this point orienting
effects of aromatic rings) and is responsible for the orientation of phages and purple
membranes. In β pleated sheets, the planar groups of the peptide bonds are oriented parallel to
the sheet and the axis of smallest numerical diamagnetism is parallel to the pleats, so the
anisotropy is ∆χ = ca. 1.1 × 10⁻⁶ N for a pleated sheet (neglecting at this point orienting
effects of aromatic rings). Worcester (41) has discussed the structural origins of diamagnetic
anisotropy in proteins and concluded that for β-sheet structures, an alignment of the
hydrogen-bonding direction parallel to the direction of the applied magnetic field is expected.

RESULTS AND DISCUSSION
- 101 -
In the past, the diamagnetic anisotropy and consequent magnetic orientation of amyloid fibres
found application in structural analyses of biological material, and especially in the X-ray
diffraction analysis of amyloidogenic peptides (9, 42, 43). In these experiments, Aβ fibrils
were prepared in a 2 Tesla magnetic field, and x-ray diffraction patterns were obtained with
the incident beam directed along different directions relative to the direction of the magnetic
field, namely, two orthogonal to the magnetic field and one parallel to the magnetic field. The
observed x-ray diffraction patterns obtained with the incident beam orthogonal to the applied
magnetic field direction show strong meridional diffraction signals appearing at 0.47 nm (Fig.
3-24A, B, labelled as “200”) which represents the interchain distance between hydrogen-
bonded peptides. Consequently, the hydrogen bond direction (the fibril axis) is aligned with
the magnetic field direction. In the diffraction pattern obtained with the incident beam
parallel to the magnetic filed axis (Fig. 3-24C), the diffraction signal corresponding to a
spacing of 0.47 nm appears to be absent or much weaker confirming the arrangement of β-
sheets that Aβ peptides self-assemble and grow in the hydrogen-bonding direction along the
magnetic field.
Fig. 3-24. Wide-Angle X-ray diffraction patterns for Aβ11-25 fibrils reproduced from Sikorski et al.. The fibrils were aligned in a magnetic field. Diffraction pattern (A) and (B) was obtained when the incident X-ray beam is orthogonal to the alignment direction and along the two directions as indicated in (D). In (C), the incident X-ray beam is parallel to the alignment direction (43). The diffraction signal indicated as 200 corresponds to a spacing of 0.47 nm.
The extent of the alignment is tunable by changing the fibril concentration. However, at a
high concentration of Aβ fibrils, we obtain extensive line broadening. A compromise was
found at a concentration of 0.5 mM Aβ14-23 in 10 mM phosphate buffer at pH 4. The
alignment of macromolecules in the magnetic field is often confirmed by measuring the

RESULTS AND DISCUSSION
- 102 -
residual orientation of water deuterons in H2O/D2O mixture (32). Fig. 3-25 shows the 1D 2H
spectrum recorded on a sample containing 0.1 mM Aβ1-40 with 5 mM iAβ5inv. The spectrum
shows that there is no visible splitting of the deuterium resonance in this sample. This is due
to the very low concentration of fibrils. As suggested by Sass et al. (32), splittings larger than
2 Hz are easily observable at high concentration (like 7 mg/ml for purple membrane),
however, at the very low concentration required for NMR spectra resolution, the smaller
splitting of the deuterium resonance is not easily detected because of the large deuterium line
width. However at this low concentration orientation of fibrils can still be determined by the
measurement of residual dipolar couplings of iAβ5inv transiently bound to fibrils.
Fig. 3-25. 1D 2H spectrum of 0.1 mM Aβ1-40 with 5 mM iAβ5inv. 3.10.2 Measurement of RDCs for iAβ5inv bound to Aβ fibrils using amyloid fibrils as
orienting medium.
The experiments were carried out using a 5 mM u-15N labelled sample of the 5-residue
synthetic peptide iAβ5inv. For preparation of the NMR sample, iAβ5inv was added to
preformed Aβ14-23 fibrils (incubation time: 2 days). In the experiments described below, a
molar ratio of [iAβ5inv]:[Aβ14-23] = 10:1 or [iAβ5inv]:[Aβ1-40] = 100:1 was employed,
respectively. The large excess of the peptide inhibitor is in agreement with the reported excess
of inhibitor required to prevent neurotoxicity to cultured neuronal cells (12). Even larger
amounts of fibrils in the NMR tube induced significant line broadening. Approximately two
weeks after incubation of fibrillar Aβ14-23 and Aβ1-40 together with iAβ5inv, neither trNOEs nor
trRDCs were observed. This is due to disaggregation of Aβ14-23 or Aβ1-40 fibrils by iAβ5inv
which is also reflected by the loss of fibrillar material as observed by EM. All spectra were
recorded on a Bruker 750 MHz solution state NMR spectrometer, at 30°C.
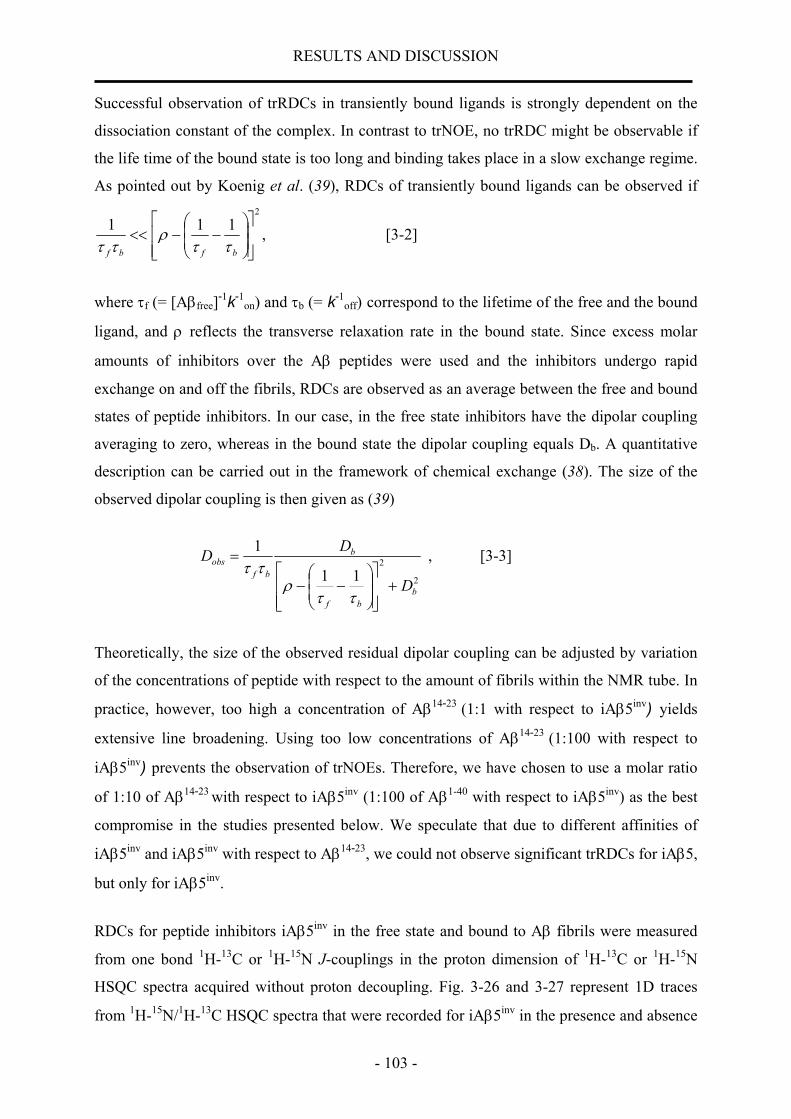
RESULTS AND DISCUSSION
- 103 -
Successful observation of trRDCs in transiently bound ligands is strongly dependent on the
dissociation constant of the complex. In contrast to trNOE, no trRDC might be observable if
the life time of the bound state is too long and binding takes place in a slow exchange regime.
As pointed out by Koenig et al. (39), RDCs of transiently bound ligands can be observed if 2
111
−−<<
bfbf ττρ
ττ, [3-2]
where τf (= [Aβfree]-1k-1on) and τb (= k-1
off) correspond to the lifetime of the free and the bound
ligand, and ρ reflects the transverse relaxation rate in the bound state. Since excess molar
amounts of inhibitors over the Aβ peptides were used and the inhibitors undergo rapid
exchange on and off the fibrils, RDCs are observed as an average between the free and bound
states of peptide inhibitors. In our case, in the free state inhibitors have the dipolar coupling
averaging to zero, whereas in the bound state the dipolar coupling equals Db. A quantitative
description can be carried out in the framework of chemical exchange (38). The size of the
observed dipolar coupling is then given as (39)
2
211
1
bbf
b
bfobs
D
DD
+
−−
=
ττρ
ττ , [3-3]
Theoretically, the size of the observed residual dipolar coupling can be adjusted by variation
of the concentrations of peptide with respect to the amount of fibrils within the NMR tube. In
practice, however, too high a concentration of Aβ14-23 (1:1 with respect to iAβ5inv) yields
extensive line broadening. Using too low concentrations of Aβ14-23 (1:100 with respect to
iAβ5inv) prevents the observation of trNOEs. Therefore, we have chosen to use a molar ratio
of 1:10 of Aβ14-23 with respect to iAβ5inv (1:100 of Aβ1-40 with respect to iAβ5inv) as the best
compromise in the studies presented below. We speculate that due to different affinities of
iAβ5inv and iAβ5inv with respect to Aβ14-23, we could not observe significant trRDCs for iAβ5,
but only for iAβ5inv.
RDCs for peptide inhibitors iAβ5inv in the free state and bound to Aβ fibrils were measured
from one bond 1H-13C or 1H-15N J-couplings in the proton dimension of 1H-13C or 1H-15N
HSQC spectra acquired without proton decoupling. Fig. 3-26 and 3-27 represent 1D traces
from 1H-15N/1H-13C HSQC spectra that were recorded for iAβ5inv in the presence and absence
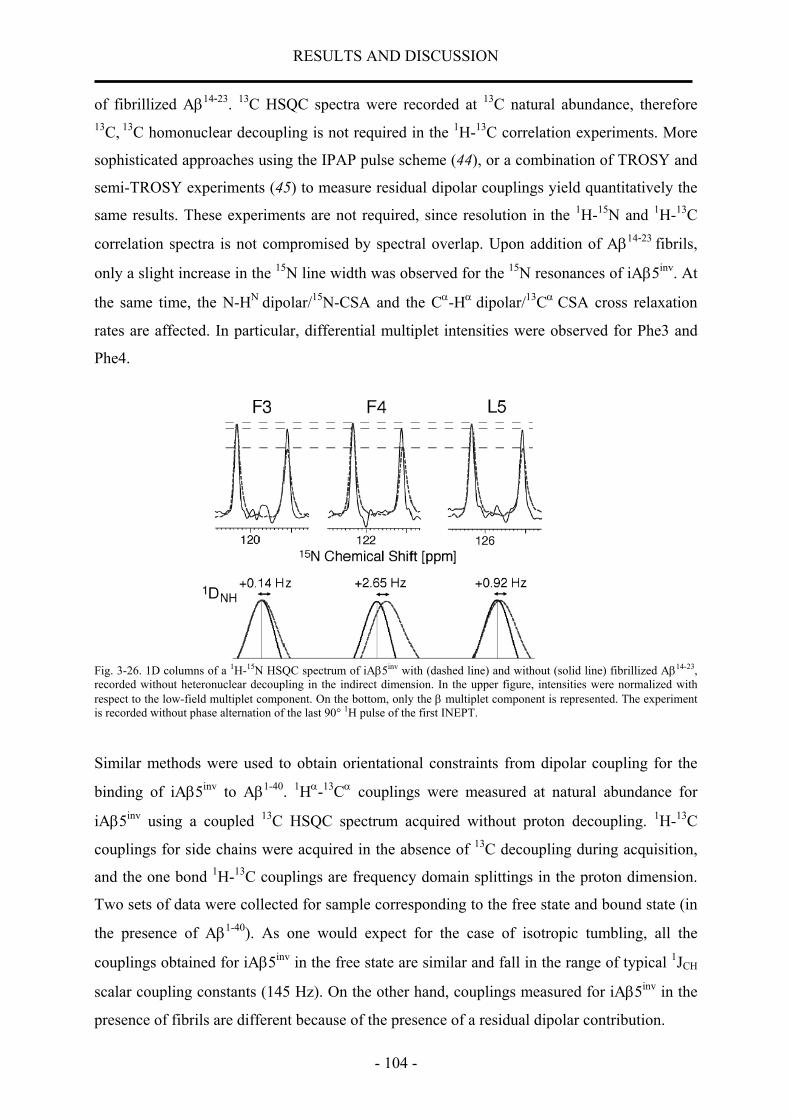
RESULTS AND DISCUSSION
- 104 -
of fibrillized Aβ14-23. 13C HSQC spectra were recorded at 13C natural abundance, therefore 13C, 13C homonuclear decoupling is not required in the 1H-13C correlation experiments. More
sophisticated approaches using the IPAP pulse scheme (44), or a combination of TROSY and
semi-TROSY experiments (45) to measure residual dipolar couplings yield quantitatively the
same results. These experiments are not required, since resolution in the 1H-15N and 1H-13C
correlation spectra is not compromised by spectral overlap. Upon addition of Aβ14-23 fibrils,
only a slight increase in the 15N line width was observed for the 15N resonances of iAβ5inv. At
the same time, the N-HN dipolar/15N-CSA and the Cα-Hα
dipolar/13Cα CSA cross relaxation
rates are affected. In particular, differential multiplet intensities were observed for Phe3 and
Phe4.
Fig. 3-26. 1D columns of a 1H-15N HSQC spectrum of iAβ5inv with (dashed line) and without (solid line) fibrillized Aβ14-23, recorded without heteronuclear decoupling in the indirect dimension. In the upper figure, intensities were normalized with respect to the low-field multiplet component. On the bottom, only the β multiplet component is represented. The experiment is recorded without phase alternation of the last 90° 1H pulse of the first INEPT.
Similar methods were used to obtain orientational constraints from dipolar coupling for the
binding of iAβ5inv to Aβ1-40. 1Hα-13Cα couplings were measured at natural abundance for
iAβ5inv using a coupled 13C HSQC spectrum acquired without proton decoupling. 1H-13C
couplings for side chains were acquired in the absence of 13C decoupling during acquisition,
and the one bond 1H-13C couplings are frequency domain splittings in the proton dimension.
Two sets of data were collected for sample corresponding to the free state and bound state (in
the presence of Aβ1-40). As one would expect for the case of isotropic tumbling, all the
couplings obtained for iAβ5inv in the free state are similar and fall in the range of typical 1JCH
scalar coupling constants (145 Hz). On the other hand, couplings measured for iAβ5inv in the
presence of fibrils are different because of the presence of a residual dipolar contribution.

RESULTS AND DISCUSSION
- 105 -
Fig. 3-27. 1D columns of a 1H-13C HSQC correlation spectrum of iAβ5inv with (dashed line) and without (solid line) fibrillized Aβ14-23, recorded without heteronuclear scalar decoupling in the indirect dimension. In the lower figure, only the β multiplet component is drawn in order to show residual dipolar coupling effects. For this purpose, signals with and without Aβ14-23 are represented with the same intensity. The experiment is recorded with phase alternation of the last 90° 1H pulse of the first INEPT in order to suppress intensity artifacts on the doublet components.
trRDCs were determined as the difference in couplings measured for the isotropic state and
the bound state. All experimental values are listed in Table 3-5. A total of 3 backbone 15N-1H
and 5 backbone 13Cα-1Hα residual dipolar couplings were measured for the 5-residue iAβ5inv
in presence of Aβ14-23. Amide protons of Asp1 could not be observed due to fast exchange
with solvent protons. For iAβ5inv in the presence of Aβ1-40, overlap of the 13C-1H correlations
of Phe3 and Phe4 prohibited measurement of their 1DCα
Hα
dipolar couplings, but an additional
seven side-chain 13C-1H couplings were obtained.
In order to estimate the error of the extracted RDC values, experiments have been carried out
twice using the same composition of the sample. The indicated values represent the average
of the two measurements. Values reported in Table 3-5 correspond to the average trRDC
value. The error for Cα-Hα trRDCs can be estimated to be ± 0.5 Hz, the error for the N-HN
trRDCs is found to be ± 0.2 Hz. In all cases, the sign of the residual dipolar coupling could be
reproduced. Furthermore, no concentration dependence – measured for iAβ5inv alone – of the
read-out coupling constant was observed, indicating that iAβ5inv does not self-orient within
the magnetic field.
Table 3-5. Residual dipolar coupling measurements for iAβ5inv bound to Aβ14-23/Aβ1-40.
iAβ5inv bound to Aβ14-23 (a) iAβ5inv bound to Aβ1-40 (b) Observed RDCs (Hz) Observed RDCs (Hz) Asp1 Cα-Hα −0.7 Pro2 Cα-Hα −1.1 −1.425 Pro2 Cγ-Hγ +1.15, +2.6 Pro2 Cδ-Hδ +2.175, +1.875

RESULTS AND DISCUSSION
- 106 -
Phe3 N-HN +0.14 Phe3 Cα-Hα +3.5 Phe3 Cη-Hη −0.83 Phe4 N-HN +2.65 Phe4 Cα-Hα +3.2 Phe4 Cδ-Hδ −1.875 Phe4 Cη-Hη −2.92 Leu5 N-HN +0.92 Leu5 Cα-Hα +0.9 Leu5 Cγ-Hγ −4.725
(a) N-H and C-H trRDCs for iAβ5inv interacting with Aβ14-23 employing a molar ratio of 10:1 for [iAβ5inv]:[Aβ14-23] (b) C-H trRDCs for iAβ5inv interacting with Aβ1-40 employing a molar ratio of 100:1 for [iAβ5inv]:[Aβ1-40]
The sign change in the interpretation of 13C-1H vs. 15N-1H residual dipolar couplings is
inferred by the negative sign of the gyromagnetic ratio of 15N (46-48). Solid-state NMR
studies suggest an antiparallel organization of Aβ16-22 (49). Contiguous β-sheet polypeptide
chains are aligned perpendicular to the long axis of the fibre. Fibrils are stabilized by
hydrogen bonding between amide nitrogens and carbonyl atoms in subsequent polypeptides.
These hydrogen bonds are directed along the fibril axis. With the exception of Asp1, positive
residual dipolar couplings for Cα-Hα are found throughout the backbone of iAβ5inv in the
presence of fibrillized Aβ14-23. This indicates that these bonds are oriented perpendicular to
the direction of the magnetic field. On the other hand, only positive trRDCs can be detected
for the case of NHN, suggesting a parallel arrangement of the N-HN bond vectors with respect
to B0. We therefore assume that the interaction between iAβ5inv and fibrillized Aβ14-23
is
driven by side chain interactions. Hydrophobic side chains might intercalate into amyloid
fibrils and weaken hydrophobic Aβ·Aβ interactions which stabilize the fibrillar structure. The
projection angle between the vectors N-HN and Cα-Hα
within the peptide bond is a function of
the backbone torsion angle, and is given as
( ) )120cos(819.0163.0,cos ϕαα +°−−=∠ HCNH N [3-5]
This equation can be derived in analogy to the derivation given in (50). In a β-sheet structure,
the (N-HN, Cα-Hα) projection angle adopts approximately a value of around 130°–160°.
Depending on the exact orientation of the interacting side chains and the planarity of the β-
strand, a change of sign for NHN and CαHα trRDC values is plausible, if we assume that the
N-HN vectors are arranged not exactly parallel with the fibril axis. The Pro induces a turn in
the structure and places the charged N-terminus appropriate for binding to Aβ14-23. This is
reflected in the negative sign of the CαHα residual dipolar coupling for Asp1 and Pro2. Our
experiments do not provide direct information whether iAβ5inv interacts with the long axis or

RESULTS AND DISCUSSION
- 107 -
the tips of an amyloid fibril. A detailed analysis of the mode of interaction requires
knowledge of side chain torsion angles.
Large variations for trRDC values were observed along the backbone of iAβ5inv. The largest
values were found for Phe3 and Phe4. Alternatively, smaller trRDC values could be due to an
increased mobility at the C-terminus of iAβ5inv, and could therefore be due to a faster loss of
orientation after being dissociated into the unligated state. The same argument is not directly
applicable to the N-terminus, since the N-terminus might be stabilized in a turn-type structure.
A quantitative interpretation of trRDC values requires the knowledge of the molecular
alignment tensor of iAβ5inv.
The asymmetry of the α/β doublet components induced by binding of iAβ5inv to Aβ14-23
is due
to 13Cα-1Hα dipole, 13Cα CSA and 15N-1HN
dipole, 15N CSA cross correlated relaxation (51).
These differences are directly related to the binding affinity of the respective sites and
chemical groups to the amyloid fibrils. Recently, this effect has been suggested to be
employed in drug design (52). We also observed differences in the size of the residual dipolar
couplings depending on the mode of sample preparation. Almost no changes were observed,
if Aβ14-23 was solubilized in a solution that already contained iAβ5inv. This is most likely due
to the fact that fibril formation is prevented under these conditions, and no preferential
orientation of Aβ14-23 is possible.
3.10.3 Measurement of RDCs for KLVFFKK peptide bound to Aβ fibrils using amyloid
fibrils as orienting medium.
In the Introduction part, we have shown that a series of the variants of KLVFF sequence are
identified to interact with Aβ and increase its aggregation rate while decreasing its toxicity.
The Kd value of KLVFFKK was determined to be around 80 µM (21). Therefore, when bound
to Aβ fibrils, this peptide is in the fast exchange between free state and bound state and can be
used for trRDC measurements.
The experiments were carried out using a 5 mM sample of KLVFFKK in the absence and
presence of 0.1 mM Aβ1-40 fibrils. 1H resonances were assigned in the TOCSY spectrum
recorded for 5 mM sample of KLVFFKK in the absence of Aβ fibrils, shown in Fig. 3-28.
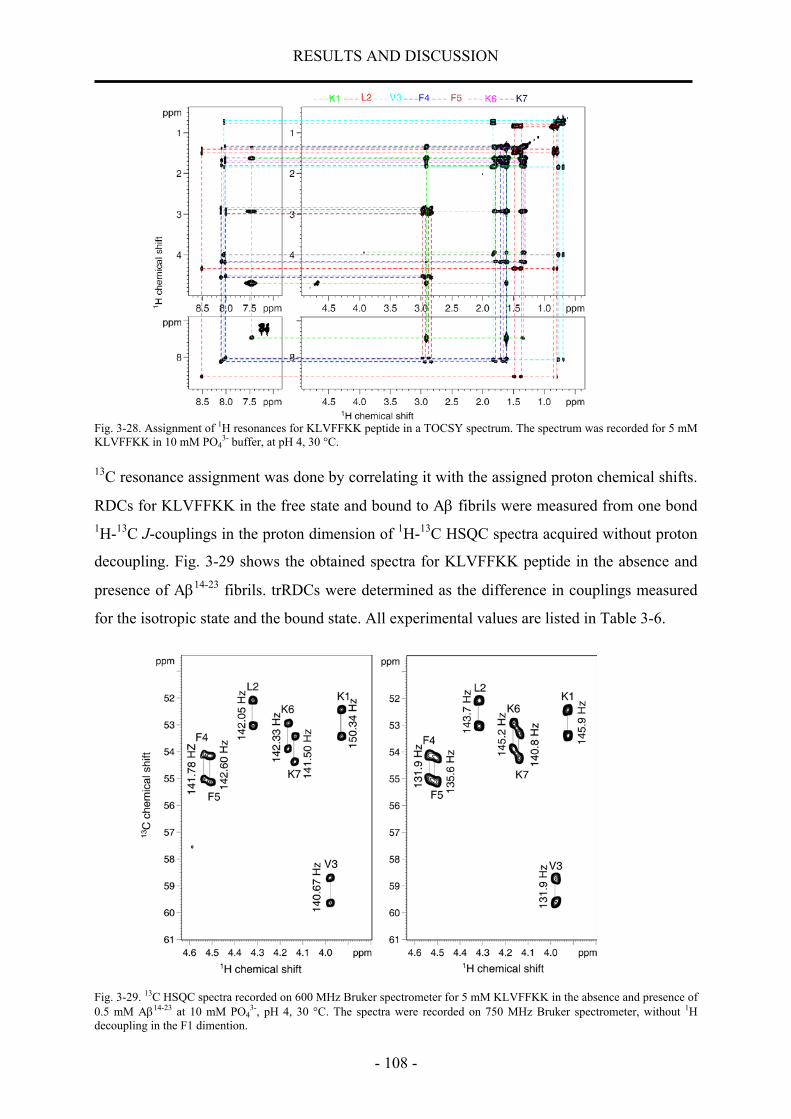
RESULTS AND DISCUSSION
- 108 -
Fig. 3-28. Assignment of 1H resonances for KLVFFKK peptide in a TOCSY spectrum. The spectrum was recorded for 5 mM KLVFFKK in 10 mM PO4
3- buffer, at pH 4, 30 °C.
13C resonance assignment was done by correlating it with the assigned proton chemical shifts.
RDCs for KLVFFKK in the free state and bound to Aβ fibrils were measured from one bond 1H-13C J-couplings in the proton dimension of 1H-13C HSQC spectra acquired without proton
decoupling. Fig. 3-29 shows the obtained spectra for KLVFFKK peptide in the absence and
presence of Aβ14-23 fibrils. trRDCs were determined as the difference in couplings measured
for the isotropic state and the bound state. All experimental values are listed in Table 3-6.
Fig. 3-29. 13C HSQC spectra recorded on 600 MHz Bruker spectrometer for 5 mM KLVFFKK in the absence and presence of 0.5 mM Aβ14-23 at 10 mM PO4
3-, pH 4, 30 °C. The spectra were recorded on 750 MHz Bruker spectrometer, without 1H decoupling in the F1 dimention.

RESULTS AND DISCUSSION
- 109 -
Table 3-6. Residual dipolar coupling measurements for KLVFFKK bound to Aβ14-23/Aβ1-40, respectively.
KLVFFKK bound to Aβ14-23 (a) KLVFFKK bound to Aβ1-40 (b) Observed RDCs (Hz) Observed RDCs (Hz) Lys1 Cα-Hα −4.4 −1.2 Leu2 Cα-Hα +1.6 −2.5 Val3 Cα-Hα −8.8 −1.8 Phe4 Cα-Hα −9.9 −7.1 Phe5 Cα-Hα −7.0 −4.8 Lys6 Cα-Hα +2.9 0 Lys7 Cα-Hα −0.7 0
(a) C-H trRDCs for KLVFFKK interacting with Aβ14-23 employing a molar ratio of 10:1 for [KLVFFKK]:[Aβ14-23] (b) C-H trRDCs for KLVFFKK interacting with Aβ1-40 employing a molar ratio of 100:1 for [KLVFFKK]:[Aβ1-40]
The larger RDCs obtained for KLVFFKK peptide in the presence of Aβ fibrils can be due to a
slightly more tight binding of this peptide to Aβ fibrils than iAβ5inv.
Moreover, no or very weak trNOEs are observable for KLVFFKK peptide bound to Aβ
fibrils. This could be due to the tight binding of KLVFFKK to Aβ fibrils. For another peptide
KLVFF which was reported to have less affinity to Aβ peptide compared to KLVFFKK,
stronger trNOEs were obtained for KLVFF in the presence of Aβ14-23 fibrils, while no or
extremely smaller trRDCs were obtained. This suggested the reasonable Kd value is required
for trNOE, trRDC measurements.
3.11 Order tensor determination for iAβ5inv bound to Aβ fibrils.
Two directly coupled nuclei A and B, the direct dipolar coupling interaction is quantified by
the dipolar coupling constant
2
1cos38
23
30 −−
= − θπ
γγµAB
BAAB rhD , [3-5]
where µ0 is the permeability of free space, γΑ and γΒ are the magnetogyric ratios of the
coupled nuclei, θ is the angle between a unit vector in the internuclear direction and a unit
vector parallel to B0, rAB is the internuclear distance and < > denotes a time average over the
motions with time scales short compared to the reciprocal of the splitting.
It is clear from Eq. [3-5] that DAB is a source of dynamic and structural information through
their dependence upon θ and upon the motional averaging of these quantities. For a given type
of a fixed distance (rAB) A–B interaction, the DAB value measured is angle dependent, which
makes it a very important tool for obtaining long-range structural information.

RESULTS AND DISCUSSION
- 110 -
To take advantage of RDCs in the study of biomolecular structures, knowledge of the
magnitude and orientation of the alignment tensor, A, with respect to the molecule is
advantageous, although optimization of the magnitude and orientation of A during the
simulated annealing process is also possible (53, 54).
In cases where information on the full structure of a molecule is not available prior to
beginning of an NMR investigation, but experimentally observed one-bond RDCs are
abundant, examination of a histogram of such normalized residual dipolar couplings is a
common method for estimating the magnitude and rhombicity of the molecular alignment
tensor. The RDCs observed for different types of one-bond interactions are then normalized to
the 1DNH interaction by removing the dependence of the dipolar couplings on bond length and
on the magnetogyric ratios of the coupled nuclei (Eq. 3-5).
The general expression for the residual dipolar coupling DAB between two directly coupled
nuclei A and B can be simplified to the form (53)
( )
+−= φθθ 2cossin
231cos3 22 RDD AB
aAB , [3-6]
where DaAB and Dr
AB in units of Hertz are the axial and rhombic components of the traceless
second rank diagonal tensor D given by ( )[ ]2/31 AB
yyABxx
ABzz DDD +− and [ ]AB
yyABxx DD −
31 ,
respectively, with ABxx
AByy
ABzz DDD ≥> ; R is the rhombicity defined by Dr
AB/DaAB and is
always positive; θ is the angle between the A–B interatomic vector and the z axis of the tensor
(it should be noted that θ has a different definition as that in Eq. [3-5]); and φ is the angle
which describes the position of the projection of the A–B interatomic vector on the x–y plane,
relative to the x axis. DaAB subsumes various constants, including the gyromagnetic ratios of
the two nuclei γΑ and γB.
For a given type of a fixed distance (rAB) A–B interaction, the extreme DAB values measured
correspond to orientations of A–B vectors closest to the z (θ = 0°) and y (θ = 90°; φ = 90°)
principal axes of the alignment tensor. If the A–B vectors are distributed uniformly and
isotropically, a histogram describing the probability of finding values of DAB between these
two extremes will have the same shape as a chemical shift anisotropy (CSA) powder pattern.
The highest probability dipolar coupling value therefore coincides with the magnitude of a

RESULTS AND DISCUSSION
- 111 -
bond vector aligned along the x axis of the alignment tensor (θ= 90°, φ= 0°). Since DxxAB +
DyyAB +Dzz
AB =0, it follows from Eq. [3-6] that
θ= 0°, DzzAB = 2Da
AB;
θ= 90° and φ= 90°, DyyAB = −Da
AB (1 + 1.5 R)
θ= 90° and φ= 0°, DxxAB = −Da
AB (1 − 1.5 R) [3-7]
Therefore, experimentally, the normalized values of Dzz and Dyy are obtained by taking the
average of the high and low extreme values of the normalized residual dipolar couplings,
respectively, such that the standard deviations in the estimated values of Dzz and Dyy are equal
to the measurement error. The value of Dxx corresponds to the most populated value in the
histogram of the observed normalized residual dipolar couplings. With two unknowns and
three observables (Dxx, Dyy, and Dzz), the values of Da and R are then calculated by nonlinear
least squares optimization of Eq. [3-7]. This method is quite useful for macromolecular
structure calculation and refinement, while the knowledge of the orientation of the alignment
tensor is not required.
For cases where the structure is known, a singular-value decomposition (SVD) approach may
be used, which fits the observed RDCs to the known structure (32, 55). Eq. [3-5] shows that
residual dipolar couplings depend on the average alignment of the molecules. The anisotropic
averaging could be represented by an order matrix (55)
,2
coscos3 ijjiij
kS
−=
θθ [3-8]
where θi denotes the instantaneous orientation of the ith molecular axis with respect to the
director (which in the studied case is the direction of the external magnetic field), and kij is the
Kronecker delta. The order matrix is symmetric (Sij = Sji) and traceless (Sxx + Syy + Szz = 0),
so it has only five independent elements. Therefore, in an arbitrarily chosen molecular frame,
the general expression for the residual dipolar coupling DAB could be rewritten as
{ }∑
=
=zyxij
ABj
ABiij
ABAB SDD,,
max coscos φφ , [3-9]

RESULTS AND DISCUSSION
- 112 -
where 33
0max 8
−−= AB
BAAB rhDπ
γγµ and ABiφ is the angle of the internuclear vector connecting
nuclei A and B relative to the ith molecular axis. Eq. [3-9] suggests that if the direction
cosines of the internuclear vectors in an arbitrary molecular frame are known, it is possible to
determine the order parameters, and hence the molecular orientational properties, from just
five independent measurements. Knowledge of direction cosines of a sufficient number of
internuclear vectors or chemical shift tensors in a particular molecular frame is only available
if the local structure of a fragment is known and assumed to be rigid. Therefore for measured
RDCs, such a system of linear equations are formed
••
=
••••••••••
−−−−
2
1
22222222222222
11111112121212
coscos2coscos2coscos2coscoscoscoscoscos2coscos2coscos2coscoscoscos
red
red
yz
xz
xy
zz
yy
zyzxyxxzxy
zyzxyxxzxy
DD
SSSSS
φφφφφφφφφφφφφφφφφφφφ , [3-10]
where the rows containing the reduced dipolar coupling, Dred, are obtained from Eq. [3-9]
after division by Dmax. The number of equations depends on the number of measured angular
parameters, but the number of unknowns is always five.
Singular value decomposition (SVD) is a powerful numerical technique for solving systems
of linear equations, such as that given in Eq. [3-10], and can be easily implemented for order
matrix calculations. If the set of equations has no exact solution, as in an overdetermined
linear system (M > 5 in this work), the SVD will still produce a solution that will not exactly
solve the linear system, but will be the best solution in the least squares sense.
One difficulty encountered in the calculations described above is that experimental
uncertainties have to be considered. One way to take this into account is to calculate Sij for
several sets of dipole couplings which are sampled from Gaussian distributions centered at the
measured values with standard deviations depending on the experimental precisions. The
calculated Sij values are then multiplied with the A matrix and are only accepted if the
predicted DAB values are within the estimated experimental error. This step is necessary since
the SVD method will produce a least squares solution for any set of input data. The width of
the resulting distribution of Sij values gives a representation of errors in the derived
parameters.

RESULTS AND DISCUSSION
- 113 -
Using NOE-derived structure coordinates for iAβ5inv and observed residual dipolar couplings
measured for iAβ5inv in the presence of fibrils is shown in Table 3-5, the five elements of the
order matrix were determined using a singular value decomposition approach (55), as shown
in Table 3-7.
Table 3-7. The calculated order parameters for iAβ5inv bound to Aβ14-23/ Aβ1-40, respectively.
iAβ5inv bound to Aβ14-23 iAβ5inv bound to Aβ1-40 Number of successful steps 475 79 Number of used RDCs 8 10 Order matrix (Saupe average)
-1.0949e-04 3.3207e-04 -2.0484e-05 -6.3617e-05 1.7826e-04
1.3645e-05 1.8146e-04 -9.8683e-05 -8.9565e-05 3.9474e-05
Principal order matrix 4.7707e-05 2.4279e-04 -2.9049e-04 -4.2724e-05 -1.4087e-04 1.8360e-04 Da ( = ½ Szz) -1.305149e-04 8.920302e-05 Dr (= 1/3(Sxx-Syy) -7.940946e-05 2.664430e-05 RMS 0.868 1.152 Correlation rate 0.972 0.961
After each set of order parameters was determined and a symmetric tensor formed from them,
the tensor was diagonalized to obtain the principal order tensor components, or order
parameters, and the transformation matrices that relate the principal order frame to the initial
molecular frame are shown in Table 3-8.
Table 3-8. The transformation matrices relating the principal order frame for bound state iAβ5inv to the initial molecular frame.
transformation matrix iAβ5inv bound to Aβ14-23 iAβ5inv bound to Aβ1-40 α β γ α β γ 1 202.25 44.67 265.07 180.08 119.94 203.72 2 22.25 44.67 265.07 0.08 119.94 203.72 3 337.75 135.33 85.07 359.92 60.06 23.72 4 157.75 135.33 85.07 179.92 60.06 23.72
The orientation of dipolar coupling tensor is described by three Euler angles, defined as follows: alpha, clockwise rotation around z between (0, 360°), leading to a new system x',y',z'; beta, clockwise rotation around y' between (1, 180°), leading to a new system x'',y'',z''; gamma between (0, 360°), clockwise rotation around z''. Four equivalent Euler orientations were reported, due to the sign ambiguity of the eigenvectors.
The set of allowable solutions coming from SVD is plotted as a distribution of points on
Sauson-Flamsteed representation, as shown in Fig. 3-30. The blue, green, and red spots depict
the direction of the axes (z, y, and x, respectively) of the principal alignment frame relative to
the starting structure coordinate frame. The top and bottom tips of the map represent + Z and
− Z in the starting structure coordinate frame while + X is in the very centre. The spread of
solutions gives an approximate picture of the precision with which the alignment frame can be
determined. Two clusters of solutions appear 180° apart for each of axes due to inversion of
axes, and four order frames which differ only in the signs of pairs of axes are allowed. The
alignment tensor is extremely asymmetric and the directions of all three principal axes of the
alignment tensor are well defined, except that inversion of any axis is allowed.

RESULTS AND DISCUSSION
- 114 -
The asymmetry is quantitatively defined by an asymmetry parameter eta (η) that can be
written in terms of order parameters Sij (η= (Syy - Sxx)/Szz). It is equal to 0.67 and 0.49 for
iAβ5inv bound to Aβ14-23 and Aβ1-40, respectively.
The direction of alignment for the bound ligand is most useful when referenced to the
alignment of fibrils. As suggested by Prestegard and co-workers, if fragments of interest
experience a common source of order, as they would if they were parts of a rigid ligand-
protein complex, the directions and levels of the orienting force should appear the same from
the point of view of each fragment when a model for the fragments is assembled with proper
fragment orientations (40, 56, 57). Therefore, the direction of highest order (Szz) depicted in
Fig. 3-30 should coincide with the direction of highest order for the fibril itself. Rotating the
molecular frame of iAβ5inv to achieve coincidence then allows determination of the relative
orientation of iAβ5inv bound to Aβ fibrils. In the absence of any large conformational
flexibility and mobility in the bound state, the order parameters determined from bound
iAβ5inv will coincide with the Aβ fibril axis. While amyloid fibrils in the magnetic field are
aligned parallel to the magnetic field as determined from x-ray diffraction studies on Aβ
fibrils (43), the fibril axis for Aβ14−23 and Aβ1−40 would be identical, namely parallel to the
magnetic field. In Table 3-7, the principle order matrices for iAβ5inv bound to Aβ14−23 and
Aβ1−40, respectively, are quite different. This indicates that iAβ5inv adopted different
orientations when bound to Aβ14−23 and Aβ1−40, respectively. This relative orientation is
subsequently used as a starting point for the docking studies.
Szz
Szz
Sxx
Syy
Syy
Sxx
Szz
Sxx
Syy
Sxx
Szz
Syy
Fig. 3-30. Orientations of the order tensor principal axis systems in the molecular frame as determined via SVD. Panels A and B show the results for iAβ5inv in presence of Aβ14-23 and Aβ1-40. The Sauson-Flamsteed projection used here maps the surface of a unit sphere into a plane by converting latitude (φ) and longitude (λ) to Cartesian coordinates (x, y) via x = λ cosφ, y = φ. The horizontal lines of latitude run from -90° to 90° in 10° increments. Vertical curved lines of longitude run from -180° to 180° in 20° increments. Each point in these plots represents the location, in the molecular frame, of the tip of the x, y, or z unit vector of the order tensor principal axis system.

RESULTS AND DISCUSSION
- 115 -
3.12 Validation of measured trRDCs for iAβ5inv by back fitting to NOE-
derived structures.
To validate the measured trRDCs for iAβ5inv in the presence of Aβ fibrils, the measured
RDCs were fitted by SVD to NOE-derived structures.
Fig. 3-31. Correlation plot of experimentally measured RDCs versus predicted RDCs from the NOE-derived structures. (A), 1DNH and 1DCaH RDCs calculated for iAβ5inv bound to Aβ14-23, using PDB coordinates DPFFL_Ab1423_SA_5 (see Appendix), are plotted against the RDCs measured in solution. (B), 1DCaH RDCs calculated for iAβ5inv bound to Aβ1-40, using PDB coordinates DPFFL_Ab40_SA_19 (see Appendix), are plotted against the RDCs measured in solution.
Fig. 3-31 shows the correlation between the experimental RDCs of iAβ5inv with the RDCs
calculated from NOE-derived structures. The predicted residual dipolar coupling values in
Fig. 3-31 were calculated using an alignment tensor derived from observed RDCs by singular
value decomposition (SVD) implemented in Pales (58). The slope close to 1 and modest
scatter (correlation coefficient of 0.972 and 0.962 for iAβ5inv bound to Aβ14-23 and Aβ1-40,
respectively) confirm that the obtained trRDCs in our studies are real, not due to experimental
errors.
In principle, correlation plots of structurally predicted RDCs versus measured RDCs would be
expected to have a slope of unity (solid lines in Fig. 3-31A, B). The slopes fitted here are,
however, less than 1.0 (dashed lines in Fig. 3-31A, B). This attenuation has been attributed to
structural uncertainty that diminishes the apparent degree of alignment. Deviations of
measured RDCs from those calculated from a structure can arise from static or dynamic
differences. Dynamic structural averaging over time scales ranging from picoseconds to
several milliseconds can affect RDCs as well (59).

RESULTS AND DISCUSSION
- 116 -
3.13 The docking model of iAβ5/ iAβ5inv bound to Aβ fibrils.
The bound state peptide conformations were docked to the Aβ fibril structures as described in
Methods. For selection of suitable structural templates for the Aβ fibrils, we used the
structural model of Aβ14-23 fibrils provided by Tjernberg et al.(5) and the structural model of
Aβ1-40 fibrils provided by Petkova et al.(10). Aβ1-40 fibrils are characterized by parallel in-
register β-strand orientation. This model is based on experimental solid state NMR data. The
structural model of Aβ14-23 fibrils has the antiparallel β-strand orientation based on the
molecular modeling, which has a 17 + k ↔ 21 − k registry (i.e. intermolecular hydrogen
bonds between residues 17 + k and 21 − k of adjacent peptide chains, for integer k).
Subsequently, Tjernberg et al. have investigated the registry of hydrogen bonding in
antiparallel β-sheets for Aβ14–23 fibrils through a combination of predictions based on the
statistical analyses by Wouters & Curmi and experimental studies of the aggregation of β-
hairpin peptides constrained to favor particular registries (60). The results of Tjernberg et al.
indicate that, in the context of designed β-hairpins, the Aβ14–23 sequence can be made to adopt
both 17 + k ↔ 20 − k and 17 + k ↔ 21 − k registries in amyloid fibrils at pH 7.4. More
recently, Petkova et al. reported a pH-dependent antiparrallel β-sheet registry in fibrils formed
by Aβ11-25 (4). In their study, 17 + k ↔ 20 − k and 17 + k ↔ 22 − k registries were
determined based on experimental solid-state NMR data for Aβ11-25 at pH 7.4 and pH 2.4,
respectively. By using the information theory formalism provided by Steward and Thornton,
Tycko and co-workers investigated the registry of antiparallel β-sheets formed by Aβ11-25.
According to their calculation, 17 + k ↔ 20 − k and 17 + k ↔ 21 − k were the two most likely
registries, corresponding to the experimental results for Aβ16–22 and Aβ11–25 fibrils at pH 7.4.
The same calculation was performed with substitution of E22 by Q22 and D23 by N23 in the
peptide sequence in order to mimic the effects of low pH. The resulting data showed that 17 +
k ↔ 21 − k and 17 + k ↔ 22 − k registries have increased likelihood, where 17 + k ↔ 22 − k
registry was observed experimentally within Aβ11–25 fibrils at pH 2.4 by Petkova et al.. Taken
together, 17 + k ↔ 21 − k registry in Aβ14-23 provided by Tjernberg et al. (5) is a good model
to describe the structure of Aβ14-23 fibrils at pH 4 in the absence of solid-state NMR
experimental data.

RESULTS AND DISCUSSION
- 117 -
Fig. 3-32A. The docking models of NMR structure of iAβ5 bound to Aβ14-23.
Fig. 3-32. The docking models of NMR structure of iAβ5inv bound to Aβ14-23, with the orientational restraint obtained from trRDC data.
Fig. 3-32 shows the docking model of iAβ5 and iAβ5inv with Aβ14-23, respectively. For iAβ5
(Fig. 3-32A), L1 interacts with F19(I), the carboxylic acid of D5 is interacting with K16(I+1),
whereas the N-terminus of iAβ5 is interacting with E22(I) of the amyloid Aβ14-23. Here, I or I
+ 1 is referring to successive β-strands in the fibril structure. For iAβ5inv (Fig. 3-32B), the C-
terminus of D1 is interacting with K16(I+1). There, D1 is occupying the same binding site as D5
in the case of iAβ5. Moreover, L5 of iAβ5inv is interacting with F19(I). A similar interaction is
found in the case of L1 of iAβ5. Furthermore, the common central residues PFF of both
peptides iAβ5 and iAβ5inv contain similar side chain-side chain contacts. Peptide/fibril
interaction sites are P2/V18(I+1), F3/F19(I+2), F4/V20(I+1). We obtain the lowest energies for

RESULTS AND DISCUSSION
- 118 -
docking, if iAβ5 and iAβ5inv are interacting at the same binding sites of Aβ14-23. We find that
iAβ5 displays more interactions to Aβ14-23 than iAβ5inv (one more attractive electrostatic
interaction). This is also reflected in the trNOESY cross-relaxation data which contain
indirect information on the dissociation of the ligand-fibril complex. Larger cross peaks were
observed for iAβ5 bound to Aβ14-23 than in the case of iAβ5inv.
From the docking model, one would assume the same interaction strengths for iAβ5 and
iAβ5inv bound to Aβ1-40. However, the presence of Aβ1-40 fibrils induces significant line
broadening on the resonances of iAβ5. This could be due to a structural variation of Aβ1-40 in
the fibrillar state. Different side chain orientations might change the number of hydrophobic
and electrostatic interactions and therefore yield a different value for KD. However, the NMR
spectrum of iAβ5 bound to Aβ1-40 showed extreme line broadening and was not effectively
excited by the radio frequency pulses used in the trNOESY experiment. The magnetization
flow from a peptide proton to Aβ fibrils will decrease the intensity of magnetization observed
during the detection time. This would explain why we could not obtain a high resolution
trNOESY spectrum of iAβ5 bound to Aβ1-40.
As mentioned in section 3.9, iAβ5inv shows completely different structures when bound to
Aβ14-23 and Aβ1-40, respectively. One can easily figure out this is due to the different fibril
structures adopted by Aβ14-23 and Aβ1-40. The different interaction patterns could be clearly
seen in the docking models. Fig. 3-33A shows the antiparallel organization of the β-strands
along the fibril axis for the short amyloid peptide Aβ14-23 and it shows that the central residues
L17VFFA form a hydrophobic core at a single molecular layer. This hydrophobic block is
flanked by alternating patterns of positive and negative charges caused by the charged C-
terminal (K16) and N-terminal (E22, D23) residues. These systematic alternations of charges
are responsible for interaction of such building blocks along and orthogonal to the fibril axis.
The parallel orientation of the β-strands along the fibril axis for the full-length amyloid
peptide Aβ1-40 (Fig. 3-33B) shows completely different interaction patterns of the building
blocks. The two β-strands of a cross β-motif are separated by a 180° bend and form two in-
register parallel β-sheets which interact through mainly hydrophobic side chain contacts. At
one surface of a single molecular layer (cross-β unit) the positively charged (K16) and the
negatively charged (D22) residues of the first β-strand (9-22) are arranged each in a row along
the fibril axis. The two charged rows are separated by a hydrophobic and an aromatic row

RESULTS AND DISCUSSION
- 119 -
(V18, F20). Hydrophobic side chains of the second β-strand (30-40) form a hydrophobic face
at the opposite side of the cross-β unit.
Fig. 3-33. Different interaction patterns of the fibril building block models for Aβ14-23 (left) and Aβ1-40 (right).
According to the observed RDC data for iAβ5inv, we were able to calculate the alignment
tensor of the identified NMR structure. As suggested by Prestegard and co-workers, the
direction of axes of the principal order frame for the ligand must coincide with that of the
protein (40, 56, 61). The orientation of the fibril axis was observed to be parallel to the
magnetic field (z-axis) (43). Therefore, iAβ5inv, when positioned so that the experimentally
determined symmetry axes are aligned as shown in Fig. 3-30 should be oriented along the
symmetry axis of the fibrils. This constraint places restrictions on the relative orientations of
iAβ5inv with respect to fibrils and allows two general orientations of iAβ5inv towards the
hydrophilic phase of the amyloid Aβ1-40 molecule at a single layer as shown in Fig. 3-34. The
orientation where the two negative charges of the ligand are oriented towards the row of
positive charged lysines (K16) is energetically preferred to the opposite ligand orientation
(allowed rotation around the Z-axis), where the N-terminal positive charge is interacting with
the row of negative charges (E22). In detail, the negative charges at D1 and the C-terminus of
the ligand iAβ5inv are interacting with K16(I+2) and K16(I+3) respectively (row of positive
charges) of the amyloid. Furthermore, the aromatic residues F4, F3 of the ligand are oriented
towards the row of aromatic residues F20(I), F20(I+1), F20(I+2) coming from three successive β-
strands (I, I+1, I+2). The hydrophobic residue L5 dives in between the row of hydrophobic
(V18 (I+2)) and the aromatic residues.

RESULTS AND DISCUSSION
- 120 -
Fig. 3-34. The model of NMR structure of iAβ5inv bound to Aβ1-40 fibrils with the orientational restraints from trRDC data.
In general, peptide inhibitors are occupying the amyloid fibrils at the identified binding sites
and are therefore disturbing key sites for the oligomerization of the amyloids.
Amyloid fibrillization is generally considered to be driven by hydrophobic and electrostatic
interactions (62, 63). Residues 17–21 are the hydrophobic segment that is identified to be
essential for fibril formation as mentioned above. The in-register parallel alignment of Aβ1–40
(10) and 17 + k ↔ 21 − k registry of Aβ14-23 (5) within the β-sheets in the fibrils maximize the
hydrophobic contacts of these segments. The only charged side chains in the core of the
structure in Aβ1–40, D23 and K28, form a salt bridge that may stabilize the structure. All other
potentially charged side chains are at positions where they could be solvated as the fibrils
grow. This salvation effect overwhelms the electrostatic repulsions between like charges that
are implicated in the in-register alignment. In our MD ligand/fibrils docking model, iAβ5inv is
located at the hydrophobic core of Aβ. Residue K16 and F20 from Aβ fibrils serve as an
anchor for iAβ5inv. We speculate that the hydrophobic and electrostatic interactions between
iAβ5 and Aβ fibrils weaken the interactions between Aβ·Aβ strands, therefore destabilize the
amyloid structures.
3.14 Structural studies of Aβ14-23 by 19F NMR
19F, as a selective marker, has properties that make its use attractive for NMR spectroscopy.
First, fluorine is a spin-1/2-nucleus and is present at 100% natural abundance, and, among
common nuclei, has a sensitivity to NMR detection that is second only after that of the proton.
Second, fluorine NMR is characterized by an extremely wide range of chemical shifts, with
the shift being highly responsive not only to changes in chemical bonding within the structure
that holds the fluorine nucleus but also to changes in the local environment which would be

RESULTS AND DISCUSSION
- 121 -
the result of protein binding. Third, the van der Waals radius of covalent fluorine is about
0.14 nm, only slightly larger than that of hydrogen, so that replacement of single hydrogen by
fluorine is not expected to have a major structure-disrupting effect. Fourth, perhaps most
important for studies of biological systems is that with in vitro systems there are no fluorine
background signals to interfere with the spectroscopy in the way that the water signal intrudes
in proton NMR experiments. Moreover, in vivo concentrations of fluorine are sufficiently low
that there are no background problems in these systems either.
In our studies, Aβ14-23 was 19F labelled in the para-position of the aromatic ring of Phe19.
Furthermore, iAβ5 was synthesized with 19F labelled in the para-position of the aromatic ring
of Phe3. The 1D solution 19F NMR spectrum of iAβ5 shows two resonances (Fig. 3-35A).
The two resonances arise from two conformations of iAβ5 due to the trans and cis
conformation of Pro residue, which is also reflected in the respective 1H spectra as shown in
Fig. 3-8. Two signals can be observed in the 1D 19F spectrum of Aβ14-23 (Fig. 3-35B). The
signal at 119.59 ppm ( indicated as an asterisk) is due to an impurity, since it does not show a
characteristic splitting of the signal into a triplet in the 1H-coupled experiment. As we can see, 19F resonances from iAβ5 and Aβ14-23 are separated and the system can be used for titration
experiments.
Fig. 3-35. 1D 19F spectrum for 19F-iAβ5 (a), 19F-Aβ14-23 without (b) and with (c) 19F-iAβ5 at 1 mM concentration and in 10 mM phosphate buffer at pH 7, 15°C. Spectrum A, B and C were recorded at 12 °C with 3116, 5475 and 3116 scans, respectively.

RESULTS AND DISCUSSION
- 122 -
Titration experiments were carried out by incubation of aqueous 19F-Aβ14-23 solutions at
concentration of approximately 1mM, at room temperature, using 10 mM phosphate sodium
buffer at pH 7. 19F-iAβ5 was dissolved in the same buffer at a concentration of 1 mM. 500 µl
of 19F-iAβ5 and fibrillized sample (10% D2O) were measured by 19F NMR techniques,
respectively. Other samples were prepared using 450 µl 19F-iAβ5 (50 µl D2O) and adding 250
µl, 450 µl, 500 µl of a 1 mM 19F-Aβ14-23 stock solution, respectively. As can be seen in Fig. 3-
36, the resonances originating from 19F-iAβ5 decrease upon addition of 19F-Aβ14-23. It is
interesting to note that the relative intensity of the two signals of 19F-iAβ5 was constant over
the whole titration at the same temperature. Once the temperature was increased to 52 °C, the
population of the cis conformer increased, while the ratio of cis/trans returned to the previous
value once the temperature was lowered to 12 °C. However, we can not conclude that the
reduced population of the trans conformer is due to a stronger binding of the trans conformer
to the fibrils at higher temperature. To do so, a reference spectrum would have to be recorded
on 19F-iAβ5 at 52°C.
Fig. 3-36. Titration of 19F-iAβ5 with 19F-Aβ14-23 as observed by 19F NMR. Peaks at –116.63 ppm and –116.54 ppm came from iAβ5, corresponding to the trans and cis conforms. Peak at –116.45 ppm came from Aβ14-23.
The 1D 19F solid-state spectrum (Fig. 3-37) of fibrillized 19F-Aβ14-23 displays a n=0 rotational
resonance effect, which is characteristic for two dipolar coupled spins with vanishing

RESULTS AND DISCUSSION
- 123 -
chemical shift difference. The asterisk indicates the isotropic chemical shift of residual TFA
in the sample which was used as an internal reference.
Fig. 3-37. 1D 19F solid-state NMR spectrum of fibrillized 19F-Aβ14-23. 46 mg 19F-Aβ14-23 was dissolved in 115 ml 10 mM PO4
3- buffer at pH 7, at room temperature. Two weeks later, sample solution was centrifuged and the pellet was packed into 4 mm rotor. The spectrum was recorded on a Bruker 400 MHz solid-state spectrometer in Karlsruhe, Germany.
1D 19F solid-state NMR spectrum shows signs of two dipolar coupled spins in the fibrils. The
spinning sideband line shapes in the 1D spectrum contain information about the relative
orientation of the Phe-rings.
2D 19F,19F DQF and Post C7 experiments were recorded for a sample of fibrilized 19F-Aβ14-23
on a Bruker 600 MHz solid-state spectrometer. 46 mg 19F-Aβ14-23 was dissolved in 115 ml 10
mM PO43- buffer at pH 7, at room temperature. Two weeks later, the peptide solution was
centrifuged and the pellet was packed into a 2.5 mm rotor. The power on the fluorine channel
during the Post-C7 mixing was adjusted to 108.7 kHz, corresponding to a MAS frequency of
15 kHz. The decoupling power was set to 41.6 kHz to avoid Hartmann-Hahn matching.
The data were fit using the relation
( ) ( ) ( )effFF TtkbdtJ 20 1
221 /1expsinsinsin −= ∫
πβββ [3-11]
for the dephasing signal. k corresponds to the scaling factor of Post-C7, and bFF to the 19F-19F
dipolar coupling: 30 4/ FFFF rb πγµ h= .
Preliminary data is shown in Fig. 3-38.

RESULTS AND DISCUSSION
- 124 -
Fig. 3-38. Fit parameters for the least squares fitting in the 19F-19F DQ filtered dephasing signal were bFF=16 kHz (2.0 Å), 1/T2eff = 200 Hz and a DQ filtering efficiency of 13%.
From the simulation, we obtain a 2.0 Å for the 19F-19F internuclear distance between two
peptides within the fibrils. In the structural models of fibrils formed by this sequence
presented by Tjernberg et al. (5), the shortest 19F-19F distance between two strands within one
sheet would be expected to be 5.5 Å. According to these models, the possible shortest 19F-19F
distance between two layers is about 2 Å.
3.15 Structural studies of de novo designed peptide-based amyloid fibrils by
solid-state NMR.
Recently, many efforts directed towards searching a higly simplified system that is able to
polymerize into β-sheets. The idea behind it is that the such a simplified system could offer
additional insights into the molecular details of amyloid fibril formation which may be
common to all fibril formation process of amyloidogenic proteins or peptides.
A series of self-associating hexapeptides with a high propensity to form homopolymeric β-
sheets were computer-designed by Paz et al. (64, 65). Sequences predicted to be highly
favorable on this basis were found experimentally to self-associate efficiently into β-sheets.
To probe the interactions driving β-sheet aggregation, the effect of specific residues on the
propensity of given sequence to form amyloid fibrils was investigated. It is found out that the
property to form polymeric β-sheets is not a sufficient requirement for fibril formation
because, under the conditions used, preformed β-sheets from these peptides with charged
residues form well defined fibrils only if the total net charge of the molecule is ± 1. A detailed

RESULTS AND DISCUSSION
- 125 -
structural model of the fibrils was proposed from their results, in conjunction with x-ray fiber
diffraction, electron microscopy, and Fourier transform infrared measurements.
Fig. 3-39. Electron micrographs of negatively stained fibrils from samples where the net charge on the molecules is + 1. (65)
Interestingly, in their studies, two hexapeptides which have a single-point mutation form
fibrils which have different morphologies under the same polymerization conditions, e.g., the
fibrils formed by STVIYE sequence is twisted while fibrils formed by STVIIT is more flatter
(Fig. 3-39). Why the β-sheets that make up the protofilaments are twisted or flat could not be
answered from the data obtained in their studies. In this work, we suggest to take the
advantages of solid state NMR technique to studies the fibrils formed from these
hexapeptides, in order to extract more detailed structural information for these systems which
would be useful for understanding of the driving forces involved in the formation of these
organized assemblies rich in β-sheet structure.
Fig. 3-40 shows 2D 13C-13C correlation spectrum of uniformly 13C-enriched STVIIE peptide,
recorded under high-speed magic angle spinning (MAS) and with recoupling of 13C–13C
dipolar interactions during a exchange period of 15 ms (see Materials and Methods). Strong
cross peaks in these spectra connect isotropic chemical shifts of directly bonded, 13C-labelled
carbon sites. Based on the chemical structure and characteristic chemical shift ranges of the
amino acid side-chains, site-specific assignments of each resonance are readily obtained.
However, for a spectrum recorded using a exchange period of 200 ms, there are some
additional cross peaks as shown in Fig. 3-41, which is discussed below.

RESULTS AND DISCUSSION
- 126 -
Fig. 3-40. 2D 13C-13C correlation NMR exchange spectrum of 10 mg STVIIE fibrils with uniform 13C and 15N-labelling, prepared at pH 2.6, observed at 14.1 T, with a mixing time of 15 ms, a MAS frequency of 11 kHz and 1H/13C cross-polarization time of 1.8 ms. Chemical shifts assignment pathways that connect strong one-bond, intraresidual cross peaks are shown.
Fig. 3-41. 2D 13C-13C correlation NMR exchange spectrum of 10 mg STVIIE fibrils with uniform 13C and 15N-labelling, prepared at pH 2.6, observed at 14.1 T, with a mixing time of 200 ms, a MAS frequency of 11 kHz and 1H/13C cross-polarization time of 1.8 ms. Marked resonances are unassigned interresidual contacts.

RESULTS AND DISCUSSION
- 127 -
Higher resolution in the Cα-C’ region was achieved in an experiment using homonuclear
decouplings. In Fig. 3-42A, there is no resolution for Caliphatic-C’ region of the spectrum
recorded without homonuclear decouplings. When applying homonuclear decoupling, the
resolution of the spectrum (Fig. 3-42B) was enhanced up to a factor of 2-2.5. The enhanced
resolution in the spectrum allows unambiguous assignment of all resonances as shown in Fig.
3-43.
Fig. 3-42. Caliphatic-C’ regions of two PDSD spectra of fibrillized u-13C,15N-STVIIE using a mixing time of 15 ms. (A) Reference spectrum, recorded without homonuclear J decoupling. (B) Spectrum recorded with homonuclear J decoupling in both dimensions according the pulse sequence represented in Materials and Methods. The row on top of the spectra represents a trace through the Ca spectral region at 59.1 ppm. All spectra were recorded at the same experimental conditions. The MAS frequency was set to 11 kHz, temperature was adjusted to 273 K and TPPM of 90 kHz was used for heteronuclear decoupling in both dimensions.
The pulse sequence used in the experiment allows us to detect the intraresidual cross peaks.
However, some interresidual cross peaks were observable as highlighted in Fig. 3-41 and Fig.
3-43. The PDSD experiment using a mixing time of 200 ms allows more such cross peaks
observed as listed in Table 3-9. These peaks may be the intermolecular contacts, which may
provide information about peptide packing in the fibrils.

RESULTS AND DISCUSSION
- 128 -
Fig. 3-43. Expanded Caliphatic-C’ region of 2D 13C-13C NMR exchange spectrum of 10 mg u-13C,15N-STVIIE fibrils recorded with selective homonuclear 13C decoupling. The sample was prepared at pH 2.6. The experiment was carried out at 14.2 T, with a mixing time of 15 ms, a MAS frequency of 11 kHz and 1H/13C cross-polarization time of 1.8 ms. Resonance assignment was shown by the Caliphatic-C’ connectivities. The highlighted cross peaks are due to interresidual contacts. Table 3-9. Interresidual contacts observed in two PDSD spectra of fibrillized u-13C,15N-STVIIE using a mixing time of 200 ms and 15 ms, respectively.
Tmix = 200 ms Tmix = 15 ms Ser1-C’ T2-Cγ I5-Cγ Thr2-C’ Ser1-Cβ, V3-Cγ, I4/I5-Cγ', I4/I5-Cγ Val3-C’ I4-Cδ, I5-Cδ, I4/I5-Cγ', I4/I5-Cγ, I4-Cβ I4-Cγ, I5-Cγ Ile4-C’ I5-Cδ, V3-Cβ I5- Cγ Glu6-C’ I4/I5-Cγ
Amide 15N chemical shifts can be assigned from 2D 15N–13C correlation spectra as shown in
Fig. 3-44. Experimentally determined 13C and 15N isotropic chemical shifts (δex) are
summarized in Table 3-10, which also lists the random coil chemical shifts (δrc) reported by
Wüthrich et al (66). Previous solid-state NMR and solution NMR studies have demonstrated
that 13C secondary shifts ∆δ = δex − δrc are reliable indicators of secondary structure in
peptides and proteins. For all residues in the peptide, the ∆δ values are negative for carbonyl
and α-carbon sites and positive for β-carbon sites. These secondary shifts indicate a β-strand
conformation for the peptide and are consistent with the CD data reported by Paz et al. (65).

RESULTS AND DISCUSSION
- 129 -
Fig. 3-44. 15N-13C spectrum of STVIIE. A, Ca-Ca region of 2D 13C-13C correlation spectrum without homonuclear decoupling. B, C’-Ca region of 2D 13C-13C correlation spectrum with homonuclear decoupling. C, N-Ca region of 15N-13C correlation spectrum. D, N-C’ region of 15N-13C correlation spectrum. Table 3-10. 15N and 13C NMR chemical shifts in STVIIE fibrils. Residue N CO αC βC γCH2 γCH3 δCHx Ser1 126.046 (115.62) 167.934 (172.6) 58.696 (56.6) 63.659 (62.3) Thr2 118.356 (113.93) 170.316 (172.7) 60.047 (60.2) 68.505 (68.3) 18.024
(20.0)
Val3 125.657 (119.14) 171.55 (174.9) 58.005 (60.7) 33.664 (30.8) 17.3 (18.5) 19.81 (19.3)
Ile4 124.541 (119.82) 171.922 (174.3) 57.23 (59.6) 39.420 (36.9) 24.979 (25.4)
15.008 (15.7)
12.536 (11.3)
Ile5 126.44 (119.82) 170.871 (174.3) 58.005 (59.6) 37.874 (36.9) 25.702 (25.4)
15.202 (15.7)
10.861 (11.3)
Glu6 126.874 (119.77) 178.107 (174.3) 52.787 (54.9) 29.530 (28.9) 29.530 (34.6)
(Values in parentheses are random coil shifts (66, 67))
Moreover, de novo designed peptides STVIIT and STVIYE have been reported to form
amyloid fibrils similar to that formed by STVIIE. Only more flatter morphology has been
observed for fibrils formed by STVIIT.
1D 13C MAS spectra were recorded on fibrils formed from STVIIT and STVIYE peptides at
natural abundance (Fig. 3-45). Spectral assignment was done with the aid of the assignment of
1D 13C spectrum of STVIIE.

RESULTS AND DISCUSSION
- 130 -
Fig. 3-45. 1D 13C NMR spectra of 10 mg fibrils at natural abundance. A, spectrum for fibrils formed from STVIIE was observed at 11.7 T, with a MAS frequency of 8.3 kHz and 1H/13C cross-polarization time of 2 ms; B, spectrum for fibrils formed from STVIIT was observed at 9.47 T, with a MAS frequency of 9 kHz and 1H/13C cross-polarization time of 1.3 ms; C, spectrum for fibrils formed from STVIYE was observed at 9.47 T, with a MAS frequency of 9 kHz and 1H/13C cross-polarization time of 1.4 ms.
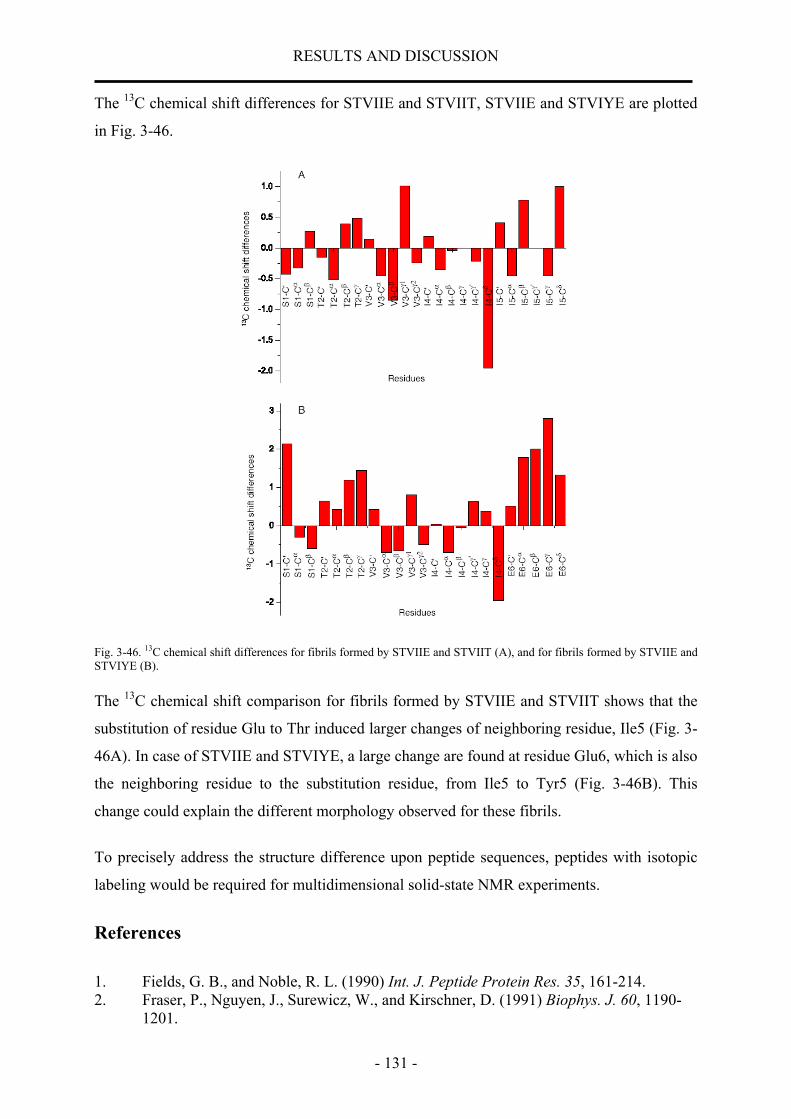
RESULTS AND DISCUSSION
- 131 -
The 13C chemical shift differences for STVIIE and STVIIT, STVIIE and STVIYE are plotted
in Fig. 3-46.
Fig. 3-46. 13C chemical shift differences for fibrils formed by STVIIE and STVIIT (A), and for fibrils formed by STVIIE and STVIYE (B).
The 13C chemical shift comparison for fibrils formed by STVIIE and STVIIT shows that the
substitution of residue Glu to Thr induced larger changes of neighboring residue, Ile5 (Fig. 3-
46A). In case of STVIIE and STVIYE, a large change are found at residue Glu6, which is also
the neighboring residue to the substitution residue, from Ile5 to Tyr5 (Fig. 3-46B). This
change could explain the different morphology observed for these fibrils.
To precisely address the structure difference upon peptide sequences, peptides with isotopic
labeling would be required for multidimensional solid-state NMR experiments.
References
1. Fields, G. B., and Noble, R. L. (1990) Int. J. Peptide Protein Res. 35, 161-214. 2. Fraser, P., Nguyen, J., Surewicz, W., and Kirschner, D. (1991) Biophys. J. 60, 1190-
1201.

RESULTS AND DISCUSSION
- 132 -
3. Soto, C., Castano, E., Kumar, R., Beavis, R., and Frangione, B. (1995) Neurosci. Lett. 200, 105-108.
4. Petkova, A. T., Buntkowsky, G., Dyda, F., Leapman, R. D., Yau, W. M., and Tycko, R. (2004) J. Mol. Biol. 335, 247-260.
5. Tjernberg, L. O., Callaway, D. J. E., Tjernberg, A., Hahne, S., Lilliehöök, C., Terenius, L., Thyberg, J., and Nordstedt, C. (1999) J. Biol. Chem. 274, 12619–12625.
6. Marsh, R. E., Corey, R. B., and Pauling, L. (1955) Biochim. Biophys. Acta. 16, 1-34. 7. Fraser, P., Duffy, L., O'Malley, M., Nguyen, J., Inouye, H., and Kirschner, D. (1991)
J. Neurosci. Res. 28, 474-485. 8. Kirschner, D., Inouye, H., Duffy, L., Sinclair, A., Lind, M., and Selkoe, D. (1987)
Proc. Natl. Acad. Sci. 84, 6953-6957. 9. Inouye, H., Fraser, P. E., and Kirschner, D. A. (1993) Biophys. J. 64, 502-519. 10. Petkova, A. T., Ishii, Y., Balbach, J. J., Antzutkin, O. N., Leapman, R. D., Delaglio,
F., and Tycko, R. (2002) Proc. Natl. Acad. Sci. 99, 16742–16747. 11. Wood, S. J., Maleeff, B., Hart, T., and Wetzel, R. (1996) J. Mol. Biol. 256, 870-877. 12. Soto, C., Sigurdsson, E., Morelli, L., Kumar, R., Castano, E., and Frangione, B. (1998)
Nat. Med. 4, 822-826. 13. Goldsbury, C. S., Wirtz, S., Müller, S. A., Sunderji, S., Wicki, P., Aebi, U., and Frey,
P. (2000) J. Struct. Biol. 130, 217–231. 14. Soto, C., Kindy, M. S., Baumann, M., and Frangione, B. (1996) Biochemical and
Biophysical Research Communications 226, 672–680. 15. Soto, C. (1999) J. Mol. Med. 77, 412-418. 16. Adessi, C., and Soto, C. (2002) Drug Dev. Res. 56, 184-193. 17. Permanne, B., Adessi, C. l., Saborio, G. P., Fraga, S., Frossard, M.-J., Dorpe, J. V.,
Dewachter, I., Banks, W. A., Leuven, F. V., and Soto, C. (2002) FASEB J. 16, 860-862.
18. Adessi, C., Frossard, M.-J., Boissard, C., Fraga, S., Bieler, S., Ruckle, T., Vilbois, F., Robinson, S. M., Mutter, M., Banks, W. A., and Soto, C. (2003) J. Biol. Chem. 278, 13905-13911.
19. Barrow, C., and Zagorski, M. (1991) Science 253, 179-182. 20. Barrow, C., Yasuda, A., Kenny, P., and Zagorski, M. (1992) J. Mol. Biol. 225, 1075-
1093. 21. Cairo, C. W., Strzelec, A., Murphy, R. M., and Kiessling, L. L. (2002) Biochemistry
41, 8620-8629. 22. LEVINE-III, H. (1993) Protein Sci. 2, 404-410. 23. Schubert, M., Labudde, D., Oschkinat, H., and Schmieder, P. (2002) J. Biomol. NMR
24, 149-154. 24. Tjernberg, L. O., Näslund, J., Lindqvist, F., Johansson, J., Karlström, A. R., Thyberg,
J., Terenius, L., and Nordstedt, C. (1996) J. Biol. Chem. 271, 8545-8548. 25. Brunger, A. T., Adams, P. D., Clore, G. M., DeLano, W. L., Gros, P., Grosse-
Kunstleve, R. W., Jiang, J.-S., Kuszewski, J., Nilges, N., Pannu, N. S., Read, R. J., Rice, L. M., Simonson, T., and Warren, G. L. (1998) Acta. Cryst. D54, 905-921.
26. Tolman, J. R., Flanagan, J. M., Kennedy, M. A., and Prestegard, J. H. (1995) Proc. Natl. Acad. Sci. 92, 9279-9283.
27. Tjandra, N., and Bax, A. (1997) Science 278, 1111-1114. 28. Sanders, C. R., and Schwonek, J. P. (1992) Biochemistry 31, 8898-8905. 29. Clore, G. M., Starich, M. R., and Gronenborn, A. M. (1998) J. Am. Chem. Soc. 120,
10571-10572. 30. Hansen, M., Mueller, L., and Pardi, A. (1998) Nat. Struct. Biol. 5, 1065–1074. 31. Koenig, B. W., Hu, J.-S., Ottiger, M., Bose, S., Hendler, R. W., and Bax, A. (1999) J.
Am. Chem. Soc. 121, 1385-1386.

RESULTS AND DISCUSSION
- 133 -
32. Sass, J., Cordier, F., Hoffmann, A., Rogowski, M., Cousin, A., Omichinski, J., Löwen, H., and Grzesiek, S. (1999) J. Am. Chem. Soc. 121, 2047–2055.
33. Sass, H., Musco, G., Stahl, S., Wingfield, P., and Grzesiek, S. (2000) J. Biomol. NMR 18, 303-309.
34. Ishii, Y., Markus, M., and Tycko, R. (2001) J. Biomol. NMR 21, 141-151. 35. Ni, F. (1994) Prog. Nucl. Magn. Reson. Spectrosc. 26, 517–606. 36. Blommers, M. J. J., Stark, W., Jones, C. E., Head, D., Owen, C. E., and Jahnke, W.
(1999) J. Am. Chem. Soc. 121, 1949-1953. 37. Carlomagno, T., Felli, I. C., Czech, M., Fischer, R., Sprinzl, M., and Griesinger, C.
(1999) J. Am. Chem. Soc. 121, 1945-1948. 38. Cavanagh, J., Fairbrother, W. J., Palmer, A. G., and Skelton, N. J. (1996) Protein
NMR Spectroscopy: Principles and Practice, Academic Press, San Diego. 39. Koenig, B. W., Kontaxis, G., Mitchell, D. C., Louis, J. M., Litman, B. J., and Bax, A.
(2002) J. Mol. Biol. 322, 441-461. 40. Bolon, P. J., Al-Hashimi, H. M., and Prestegard, J. H. (1999) J. Mol. Biol. 293, 107-
115. 41. Worcester, D. L. (1978) Proc. Natl. Acad. Sci. 75, 5475-5477. 42. Fraser, P., Nguyen, J., Inouye, H., Surewicz, W., Selkoe, D., Podlisny, M., and
Kirschner, D. A. (1992) Biochemistry 31, 10716-10723. 43. Sikorski, P., Atkins, E., and Serpell, L. (2003) Structure 11, 915-926. 44. Ottiger, M., Delaglio, F., Marquardt, J. L., Tjandra, N., and Bax, A. (1998) J. Magn.
Reson. 134, 365–369. 45. Lerche, M., Meissner, A., Poulsen, F., and Sorensen, O. (1999) J. Magn. Reson. 140,
259-263. 46. Clore, G. M., Gronenborn, A. M., and Bax, A. (1998) J. Magn. Reson. 133, 216-221. 47. Tian, F., Fowler, C., Zartler, E., Jenney, F. J., Adams, M., and Prestegard, J. (2000) J.
Biomol. NMR 18, 23-31. 48. Bax, A., Kontaxis, G., and Tjandra, N. (2001) Meth. Enzymol. 339, 127-174. 49. Balbach, J. J., Ishii, Y., Antzutkin, O. N., Leapman, R. D., Rizzo, N. W., Dyda, F.,
Reed, J., and Tycko, R. (2000) Biochemistry 39, 13748-13759. 50. Reif, B., Hohwy, M., Jaroniec, C. P., Rienstra, C. M., and Griffin, R. G. (2000) J.
Magn. Reson. 145, 132–141. 51. Reif, B., Hennig, M., and Griesinger, C. (1997) Science 276, 1230-1233. 52. Peng, J. W. (2003) J. Am. Chem. Soc. 125, 11116–11130. 53. Clore, G. M., Gronenborn, A. M., and Tjandra, N. (1998) J. Magn. Reson. 131, 159-
162. 54. Sass, H., Musco, G., Stahl, S., Wingfield, P., and Grzesiek, S. (2001) J. Biomol. NMR
21, 275-280. 55. Losonczi, J., Andrec, M., Fischer, M., and Prestegard, J. (1999) J. Magn. Reson. 138,
334-342. 56. Jain, N., Noble, S., and Prestegard, J. (2003) J. Mol. Biol. 328, 451-462. 57. Fischer, M., Losonczi, J., Weaver, J., and Prestegard, J. (1999) Biochemistry 38, 9013-
9022. 58. Zweckstetter, M., and Bax, A. (2000) J. Am. Chem. Soc. 122, 3791-3792. 59. Tolman, J., Al-Hashimi, H., Kay, L., and Prestegard, J. (2001) J. Am. Chem. Soc. 123,
1416-1424. 60. Tjernberg, L. O., Tjernberg, A., Bark, N., Shi, Y., Ruzsicska, B. P., Bu, Z., Thyberg,
J., and Callaway, D. J. E. (2002) Biochem. J. 366, 343-351. 61. Prestegard, J., Bougault, C., and Kishore, A. (2004) Chem. Rev. 104, 3519-3540. 62. Harper, J., Wong, S., Lieber, C., and Lansbury, P. J. (1999) Biochemistry 38, 8972-
8980.
RESULTS AND DISCUSSION
- 134 -
63. Hilbich, C., Kisters-Woike, B., Reed, J., Masters, C., and Beyreuther, K. (1992) J. Mol. Biol. 228, 460-473.
64. Paz, M. L. p. d. l., Lacroix, E., Ramirez-Alvarado, M., and Serrano, L. (2001) J. Mol. Biol. 312, 229-246.
65. Paz, M. L. p. d. l., Goldie, K., Zurdo, J., Lacroix, E., Dobson, C. M., Hoenger, A., and Serrano, L. (2002) Proc. Natl. Acad. Sci. 99, 16052–16057.
66. Richarz, R., and Wüthrich, K. (1978) Biopolymers 17, 2133-2141. 67. Braun, D., Wider, G., and Wuethrich, K. (1994) J. Am. Chem. Soc. 116, 8466-8469.

SUMMARY
- 135 -
4.0 Summary β-Amyloid peptide (Aβ) has an important role in the therapy of Alzheimer’s Disease.
Also it is an excellent example for probing the amyloid structural issues, such as the
supermolecular orgination, the participated sequences in the β-sheet, and so on. In this study,
the structures of peptide inhibitors to Aβ are studied with the aid of peptide synthesis and
NMR spectroscopy, as well as Transmission Electron Microscopy and Circular Dichroism
spectroscopy.
Short fragments of the β-amyloid peptide, Aβ14-23, and its peptide inhibitors iAβ5
(LPFFD) and iAβ5inv (DPFFL) were manually synthesized with and without 19F-, 13C- and 15N-labelling using standard Fmoc peptide synthesis protocols. Fibrils formed from synthetic
Aβ14-23 was characterized by Electron Microscopy. EM images clearly show that Aβ14-23
formed fibrils of the same morphology as that of Aβ1-40 under our experimental conditions,
therefore this β-amyloid peptide could serve as an in vitro model of amyloid fibril assembly,
structure, and possibly also disruption of such assemblies. The inhibitory effects of iAβ5 and
iAβ5inv to Aβ fibrils were firstly investigated by Electron Microscopy spectroscopy. Small
intermediate fibrils in the EM images of Aβ incubated with iAβ5 or iAβ5inv show that the
fibrils formed from Aβ can be disassembled by iAβ5 or iAβ5inv.
The structural information of peptide inhibitors bound to Aβ fibrils was further investigated in
solution by using advanced NMR techniques. 1H, 13C and 15N chemical shifts were assigned
by combining the information from TOCSY, NOESY and HSQC spectra. A small chemical
shift differences were inferred by addition of iAβ5 or iAβ5inv to Aβ fibrils.
TrNOESY experiments were carried out to structurally define the geometry of iAβ5 and
iAβ5inv in the bound state. Excess of peptide inhibitors was added to preformed Aβ fibrils.
Due to the fact that iAβ5 or iAβ5inv only weakly binds to the fibril (Kd ~1 nM) and the
dependence of the cross peak intensity on τc, the structure of iAβ5 or iAβ5inv can be
determined in the bound state. Extensive NOEs were observed among almost all 1H
resonances at a mixing time of 50 msec. Viscosity effects and the possibility of oligomer
formation of the peptide inhibitors were excluded by performing the diffusion experiments
and NOESY experiments on a mixed 13C-labelled and unlabelled iAβ5 sample.
Distance restrains for peptide inhibitors were obtained on the basis of NOE intensities.
Structural calculations were performed using the CNSsolve program. When bound to the
same type of amyloid fibrils (Aβ14-23), iAβ5 and iAβ5inv show identical spatial side chain

SUMMARY
- 136 -
orientations of equal properties with different backbone structures. iAβ5inv binds to fibrils
formed from Aβ14-23 and Aβ1-40, respectively, with different structures showing different
backbone and different side chain orientations.
The orientation of peptide inhibitors relative to Aβ was further investigated using transferred
RDC techniques developed in the course of this thesis. Aβ fibrils orient in the external
magnetic field with the fibrils axis parallel to B0. The oriented fibrils induce a net orientation
to the peptide inhibitor in the bound state. In a favourable case, residual dipolar couplings of
the peptide in the bound state are transferred to that in the free state. This trRDCs were
detected for iAβ5inv, not for iAβ5 due to their different affinity. The measured trRDCs data
were carefully analyzed with the aid of the program PALES, and a best-fit orientation of
iAβ5inv was obtained. NOE-derived NMR structure of iAβ5 and iAβ5inv were docked to Aβ14-
23 and Aβ1-40, respectively. The models of iAβ5inv docked to Aβ were refined using the
experimental trRDCs data. From the docking models, the binding sites of iAβ5 and iAβ5inv to
Aβ could be identified. Taken together, we propose a mechanism how iAβ5 or iAβ5inv
disassemble Aβ fibrils.
Our findings provide a basis for further in vitro modeling of amyloid fibril assembly,
structure, and possibly also disruption of such assemblies. For example, the model system
could be used to examine the effects of other amino acid substitutions in the amyloid protein,
or post-translational modifications and various chain lengths of the putative precursor protein
on amyloid fibril formation. In the later part of this work, studies on the amyloid fibril
structure was presented. 19F-NMR experiments were carried out on 19F-Aβ14-23 (with 19F
labelled in the para-position of the aromatic ring of Phe19) both in liquid state and solid state.
The de novo designed amyloid peptide (STVIIE) was characterized by solid-state
NMR. 13C and 15N chemical shifts were unambiguously obtained for STVIIE in the fibrillar
state with the aid of 13C- and 15N-labelling. Primary assignments of the 1D 13C spectra for
STVIIT and STVIYE fibrils are obtained. The comparison of the chemical shifts shows that
the one amino acid substitution causes a large 13C chemical shift change on the neighbouring
residues which could explain the different morphology observed for these fibrils.

APPENDIX
- 137 -
5 APPENDIX
5.1 NMR experimental details
5.1.1 TOCSY experimental details
Samples Sfo1 (MHz) Spectral width (Hz)
Mixing time (msec)
T1 increments Number scans T2 data points
5 mM 19F-iAβ5
750.133
10502
49.5
768
32
8192
5 mM 19F-iAβ5 with 0.5 mM Aβ14−23
750.133
7501
49.5
512
64
8192
0.5 mM iAβ5inv
750.133
10502
49.5
768
32
8192
5 mM iAβ5inv with 0.5 mM Aβ14−23
750.133
10502
49.5
512
64
8192
5.1.2 NOESY experimental details
samples SFO1 (MHz)
Spectral width (Hz)
Mixing time (msec)
T1 increments
Number scans
T2 data points
5 mM 19F-iAβ5 750.133 10502 500 512 128 8192
5 mM 19F-iAβ5 with 0.5 mM Aβ14−23 750.133 7501 10, 50, 150, 500
768 64 8192
0.5 mM iAβ5inv 750.133 7501 500 512 32 8192
5 mM iAβ5inv with Aβ14−23 750.133 7501 100, 200, 500 768 64 8192
5 mM iAβ5inv with Aβ14−23 750.013 8250 500 512 8 4096
5 mM iAβ5inv with Aβ1−40 750.013 8250 100, 500 768 16 4096
1.5 mM u-13C,15N- iAβ5 and 3.5 mM iAβ5 with Aβ14−23
750.013 9001 500 512 80 4096
5.1.3 13C-HSQC experimental details without decoupling in F1 Samples SFO1
(MHz) Spectral width
(F1) (Hz) T2 data points
T1 increments
Number scans
O2 (Hz)
0.5 mM iAβ5inv (10% 13C in rich) 750.133 28294 8192 1024 16 7544
5 mM iAβ5inv (10% 13C in rich) with Aβ14−23 750.133 28292 4096 768 16 7544
5 mM iAβ5inv 750.013 18750 1318 256 64 10749
5 mM iAβ5inv with Aβ14−23 750.013 18750 1318 256 96 10749
5 mM iAβ5inv with Aβ1−40 750.013 18750 1318 256 96 10749
5.1.4 13C-HSQC experimental details Without decoupling in F2 Samples SFO1
(MHz) Spectral width (F1)
(Hz) T2 data points T1 increments Number scans O2
(Hz) 5 mM iAβ5inv 750.013 30000 4096 256 96 5846

APPENDIX
- 138 -
5 mM iAβ5inv 750.013 6000 4096 256 96 24611
5 mM iAβ5inv with Aβ1−40 750.013 30000 4096 256 128 24611
5 mM iAβ5inv with Aβ1−40 750.013 30000 4096 256 128 5846
5.2 Data appendix 5.2.1 Assignment of 19F-iAβ5 (LPFFD) at 5mM, pH4, 303K
NH αH βH γH δH εH Leu1 4.22 1.70 1.64(*) 0.94 Pro2 4.353 2.133, 1.64 (*) 1.926 3.658, 3.492 Phe3 8.072 4.424 2.932 2,6H: 7.003 3,5H:
7.115
Phe4 7.900 4.546 3.034, 2.885 2,6H: 7.170 3,5H: 7.282
4H: 7.239
Asp5 8.023 4.481 2.785, 2.732 ( Values indicated with star mean overlapping)
5.2.2 Assignment of 19F-iAβ5 at 5 mM in the presence of 0.5 mM Aβ14-23 fibrils, at pH4,
303K
NH αH βH γH δH εH Leu1 4.212 1.701 1.636(*) 0.94 Pro2 4.361 2.132, 1.636(*) 1.923 3.658, 3.482 Phe3 8.038(*) 4.424 2.932 2,6H: 6.998 3,5H: 7.110 Phe4 7.856 4.544 3.028, 2.891 2,6H: 7.162 3,5H: 7.282 4H: 7.237 Asp5 8.038(*) 4.512 2.795, 2.748
5.2.3 Assignment of 10% labelling iAβ5inv (DPFFL) at 0.5 mM, pH4, 303 K
NH αH βH γH δH εH Asp1 4.570 2.754, 2.956 Pro2 4.437 2.228, 1.696 1.986, 1.922 3.627, 3.735 Phe3 8.185 4.555 3.038 2,6H: 7.251 (*) 3,5H: 7.375(*) 4H: 7.333(*) Phe4 7.968 4.616 3.121, 2.985 2,6H: 7.251 (*) 3,5H: 7.375(*) 4H: 7.333(*) Leu5 8.051 4.282 1.614 (*) 1.614 (*) 0.916, 0.954
5.2.4 Assignment of 10% labelling iAβ5inv (DPFFL) of 5 mM in the presence of 0.5 mM
Aβ14-23 at pH4, 303 K
NH αH βH γH δH εH
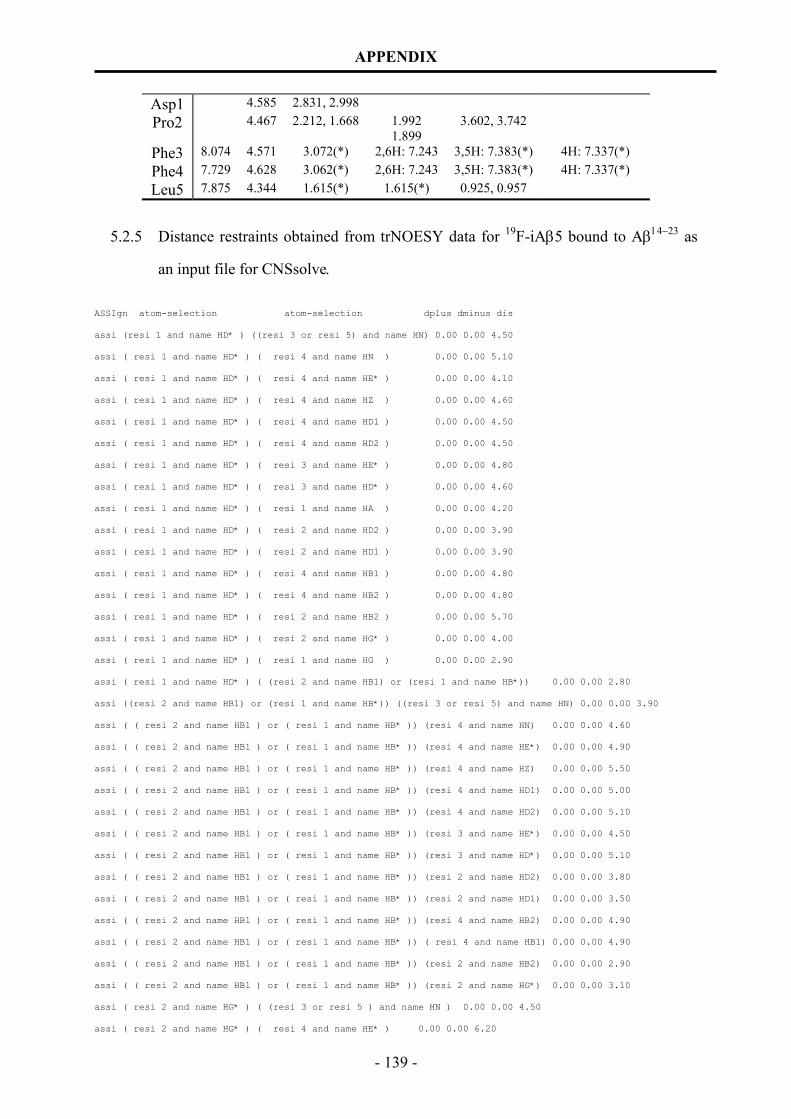
APPENDIX
- 139 -
Asp1 4.585 2.831, 2.998 Pro2 4.467 2.212, 1.668 1.992
1.899 3.602, 3.742
Phe3 8.074 4.571 3.072(*) 2,6H: 7.243 3,5H: 7.383(*) 4H: 7.337(*) Phe4 7.729 4.628 3.062(*) 2,6H: 7.243 3,5H: 7.383(*) 4H: 7.337(*) Leu5 7.875 4.344 1.615(*) 1.615(*) 0.925, 0.957
5.2.5 Distance restraints obtained from trNOESY data for 19F-iAβ5 bound to Aβ14−23 as
an input file for CNSsolve.
ASSIgn atom-selection atom-selection dplus dminus dis
assi (resi 1 and name HD* ) ((resi 3 or resi 5) and name HN) 0.00 0.00 4.50
assi ( resi 1 and name HD* ) ( resi 4 and name HN ) 0.00 0.00 5.10
assi ( resi 1 and name HD* ) ( resi 4 and name HE* ) 0.00 0.00 4.10
assi ( resi 1 and name HD* ) ( resi 4 and name HZ ) 0.00 0.00 4.60
assi ( resi 1 and name HD* ) ( resi 4 and name HD1 ) 0.00 0.00 4.50
assi ( resi 1 and name HD* ) ( resi 4 and name HD2 ) 0.00 0.00 4.50
assi ( resi 1 and name HD* ) ( resi 3 and name HE* ) 0.00 0.00 4.80
assi ( resi 1 and name HD* ) ( resi 3 and name HD* ) 0.00 0.00 4.60
assi ( resi 1 and name HD* ) ( resi 1 and name HA ) 0.00 0.00 4.20
assi ( resi 1 and name HD* ) ( resi 2 and name HD2 ) 0.00 0.00 3.90
assi ( resi 1 and name HD* ) ( resi 2 and name HD1 ) 0.00 0.00 3.90
assi ( resi 1 and name HD* ) ( resi 4 and name HB1 ) 0.00 0.00 4.80
assi ( resi 1 and name HD* ) ( resi 4 and name HB2 ) 0.00 0.00 4.80
assi ( resi 1 and name HD* ) ( resi 2 and name HB2 ) 0.00 0.00 5.70
assi ( resi 1 and name HD* ) ( resi 2 and name HG* ) 0.00 0.00 4.00
assi ( resi 1 and name HD* ) ( resi 1 and name HG ) 0.00 0.00 2.90
assi ( resi 1 and name HD* ) ( (resi 2 and name HB1) or (resi 1 and name HB*)) 0.00 0.00 2.80
assi ((resi 2 and name HB1) or (resi 1 and name HB*)) ((resi 3 or resi 5) and name HN) 0.00 0.00 3.90
assi ( ( resi 2 and name HB1 ) or ( resi 1 and name HB* )) (resi 4 and name HN) 0.00 0.00 4.60
assi ( ( resi 2 and name HB1 ) or ( resi 1 and name HB* )) (resi 4 and name HE*) 0.00 0.00 4.90
assi ( ( resi 2 and name HB1 ) or ( resi 1 and name HB* )) (resi 4 and name HZ) 0.00 0.00 5.50
assi ( ( resi 2 and name HB1 ) or ( resi 1 and name HB* )) (resi 4 and name HD1) 0.00 0.00 5.00
assi ( ( resi 2 and name HB1 ) or ( resi 1 and name HB* )) (resi 4 and name HD2) 0.00 0.00 5.10
assi ( ( resi 2 and name HB1 ) or ( resi 1 and name HB* )) (resi 3 and name HE*) 0.00 0.00 4.50
assi ( ( resi 2 and name HB1 ) or ( resi 1 and name HB* )) (resi 3 and name HD*) 0.00 0.00 5.10
assi ( ( resi 2 and name HB1 ) or ( resi 1 and name HB* )) (resi 2 and name HD2) 0.00 0.00 3.80
assi ( ( resi 2 and name HB1 ) or ( resi 1 and name HB* )) (resi 2 and name HD1) 0.00 0.00 3.50
assi ( ( resi 2 and name HB1 ) or ( resi 1 and name HB* )) (resi 4 and name HB2) 0.00 0.00 4.90
assi ( ( resi 2 and name HB1 ) or ( resi 1 and name HB* )) ( resi 4 and name HB1) 0.00 0.00 4.90
assi ( ( resi 2 and name HB1 ) or ( resi 1 and name HB* )) (resi 2 and name HB2) 0.00 0.00 2.90
assi ( ( resi 2 and name HB1 ) or ( resi 1 and name HB* )) (resi 2 and name HG*) 0.00 0.00 3.10
assi ( resi 2 and name HG* ) ( (resi 3 or resi 5 ) and name HN ) 0.00 0.00 4.50
assi ( resi 2 and name HG* ) ( resi 4 and name HE* ) 0.00 0.00 6.20

APPENDIX
- 140 -
assi ( resi 2 and name HG* ) ( resi 4 and name HZ ) 0.00 0.00 7.70
assi ( resi 2 and name HG* ) ( resi 4 and name HD* ) 0.00 0.00 6.50
assi ( resi 2 and name HG* ) ( resi 3 and name HE* ) 0.00 0.00 5.10
assi ( resi 2 and name HG* ) ( resi 3 and name HD* ) 0.00 0.00 5.90
assi ( resi 2 and name HG* ) ( resi 2 and name HD2 ) 0.00 0.00 3.40
assi ( resi 2 and name HG* ) ( resi 2 and name HD1 ) 0.00 0.00 3.30
assi ( resi 2 and name HG* ) ( resi 2 and name HB2 ) 0.00 0.00 3.10
assi ( resi 2 and name HG* ) ( resi 4 and name HN ) 0.00 0.00 6.60
assi ( resi 2 and name HB2 ) ( (resi 3 or resi 5 ) and name HN ) 0.00 0.00 4.20
assi ( resi 2 and name HB2 ) ( resi 4 and name HN ) 0.00 0.00 6.30
assi ( resi 2 and name HB2 ) ( resi 4 and name HE* ) 0.00 0.00 4.70
assi ( resi 2 and name HB2 ) ( resi 3 and name HE* ) 0.00 0.00 5.40
assi ( resi 2 and name HB2 ) ( resi 3 and name HD* ) 0.00 0.00 6.10
assi ( resi 2 and name HB2 ) ( resi 2 and name HD2 ) 0.00 0.00 4.70
assi ( resi 2 and name HB2 ) ( resi 2 and name HD1 ) 0.00 0.00 4.70
assi ( resi 5 and name HB1 ) ( (resi 3 or resi 5 ) and name HN ) 0.00 0.00 4.10
assi ( resi 5 and name HB1 ) ( resi 4 and name HN ) 0.00 0.00 6.40
assi ( resi 5 and name HB2 ) ( (resi 3 or resi 5 ) and name HN ) 0.00 0.00 4.20
assi ( resi 5 and name HB2 ) ( resi 4 and name HN ) 0.00 0.00 6.40
assi ( resi 5 and name HB2 ) ( resi 5 and name HB1 ) 0.00 0.00 2.30
assi ((resi 3 and name HB*) or (resi 4 and name HB1)) ((resi 3 or resi 5) and name HN) 0.00 0.00 3.30
assi ( ( resi 3 and name HB* ) or (resi 4 and name HB1 )) ( resi 4 and name HN ) 0.00 0.00 3.30
assi ( resi 3 and name HB* ) ( resi 3 and name HE* ) 0.00 0.00 3.40
assi ( resi 3 and name HB* ) ( resi 3 and name HD* ) 0.00 0.00 4.00
assi ( resi 4 and name HB1 ) ( resi 4 and name HE* ) 0.00 0.00 4.50
assi ( resi 4 and name HB1 ) ( resi 4 and name HD* ) 0.00 0.00 3.50
assi ( resi 4 and name HB1 ) ( resi 4 and name HB2 ) 0.00 0.00 2.70
assi ( resi 4 and name HB2 ) ((resi 3 or resi 5 ) and name HN ) 0.00 0.00 4.20
assi ( resi 4 and name HB2 ) ( resi 4 and name HE* ) 0.00 0.00 4.90
assi ( resi 4 and name HB2 ) ( resi 4 and name HD* ) 0.00 0.00 3.90
assi ( resi 4 and name HB2 ) ( resi 4 and name HN ) 0.00 0.00 4.00
assi ( resi 2 and name HD1 ) ( resi 2 and name HD2 ) 0.00 0.00 2.90
assi ( resi 2 and name HD1 ) ( resi 1 and name HG ) 0.00 0.00 4.70
assi ( resi 2 and name HD2 ) ( resi 1 and name HG ) 0.00 0.00 4.90
assi ( resi 1 and name HA ) ( resi 2 and name HD2 ) 0.00 0.00 3.40
assi ( resi 1 and name HA ) ( resi 2 and name HD1 ) 0.00 0.00 3.60
assi ( resi 1 and name HA ) ( resi 2 and name HB2 ) 0.00 0.00 5.50
assi ( resi 1 and name HA ) ( resi 2 and name HG* ) 0.00 0.00 4.20
assi ( resi 1 and name HA ) (( resi 2 and name HB1 ) or ( resi 1 and name HB* )) 0.00 0.00 3.50
assi ( resi 1 and name HA ) ( resi 1 and name HD* ) 0.00 0.00 3.30
assi ( resi 1 and name HA ) ( resi 1 and name HG ) 0.00 0.00 4.10
assi ( resi 2 and name HA ) ( resi 1 and name HD* ) 0.00 0.00 5.80
assi ( resi 2 and name HA ) ( resi 3 and name HB* ) 0.00 0.00 4.70
assi ( resi 2 and name HA ) ( resi 2 and name HB2 ) 0.00 0.00 3.30

APPENDIX
- 141 -
assi ( resi 2 and name HA ) ( resi 2 and name HD2 ) 0.00 0.00 4.90
assi ( resi 2 and name HA ) ( resi 2 and name HD1 ) 0.00 0.00 5.10
assi ( resi 2 and name HA ) ( resi 2 and name HG* ) 0.00 0.00 3.70
assi ( resi 2 and name HA ) (( resi 2 and name HB1 ) or ( resi 1 and name HB*)) 0.00 0.00 3.60
assi ( resi 2 and name HA ) ( resi 3 and name HE* ) 0.00 0.00 5.90
assi ( resi 2 and name HA ) ( (resi 3 or resi 5 ) and name HN ) 0.00 0.00 3.20
assi ( resi 2 and name HA ) ( resi 4 and name HN ) 0.00 0.00 5.10
assi ( resi 3 and name HA ) ( resi 4 and name HN ) 0.00 0.00 3.80
assi ( resi 3 and name HA ) ( (resi 3 or resi 5 ) and name HN )0.00 0.00 3.30
assi ( resi 3 and name HA ) ( resi 3 and name HE* ) 0.00 0.00 3.80
assi ( resi 3 and name HA ) ( resi 3 and name HD* ) 0.00 0.00 5.80
assi ( resi 3 and name HA ) ( resi 3 and name HB* ) 0.00 0.00 3.10
assi ( resi 4 and name HA ) ( resi 4 and name HB2 ) 0.00 0.00 3.40
assi ( resi 4 and name HA ) ( resi 4 and name HB1 ) 0.00 0.00 3.60
assi ( resi 5 and name HA ) ( resi 5 and name HB2 ) 0.00 0.00 3.70
assi ( resi 5 and name HA ) ( resi 5 and name HB1 ) 0.00 0.00 4.10
assi ( (resi 4 or resi 5 ) and name HA ) ( (resi 3 or resi 5 ) and name HN ) 0.00 0.00 3.20
assi ( (resi 4 or resi 5 ) and name HA ) ( resi 4 and name HN ) 0.00 0.00 3.60
assi ( (resi 4 or resi 5 ) and name HA ) ( resi 4 and name HE*) 0.00 0.00 4.60
assi ( (resi 4 or resi 5 ) and name HA ) ( resi 4 and name HZ ) 0.00 0.00 5.90
assi ( (resi 4 or resi 5 ) and name HA ) ( resi 4 and name HD1) 0.00 0.00 4.10
assi ( (resi 4 or resi 5 ) and name HA ) ( resi 4 and name HD2) 0.00 0.00 4.20
assi ( resi 3 and name HE* ) ( (resi 3 or resi 5 ) and name HN ) 0.00 0.00 4.40
assi ( resi 3 and name HE* ) ( resi 4 and name HN ) 0.00 0.00 5.40
assi ( resi 4 and name HE* ) ( resi 4 and name HN ) 0.00 0.00 5.10
assi ( resi 4 and name HE* ) ( (resi 3 or resi 5 ) and name HN ) 0.00 0.00 5.80
assi ( resi 4 and name HN ) ( (resi 3 or resi 5 ) and name HN ) 0.00 0.00 3.30
assi ( resi 4 and name HD* ) ( resi 4 and name HE* ) 0.00 0.00 2.50
assi ( resi 4 and name HD* ) ( resi 4 and name HZ ) 0.00 0.00 3.50
assi ( resi 4 and name HD* ) ( resi 4 and name HN ) 0.00 0.00 4.20
assi ( resi 4 and name HD* ) ( (resi 3 or resi 5 ) and name HN ) 0.00 0.00 4.90
assi ( resi 3 and name HD* ) ( resi 4 and name HD* ) 0.00 0.00 3.70
assi ( resi 3 and name HD* ) ( resi 3 and name HE* ) 0.00 0.00 2.60
5.2.6 Distance restraints obtained from trNOESY data for iAβ5inv bound to Aβ14−23 as an
input file for CNSsolve .
ASSIgn atom-selection atom-selection dplus dminus dis
assi ( resi 3 and name HN ) ( resi 5 and name HD* ) 0.00 0.00 4.74
assi ( resi 3 and name HN ) ( resi 5 and (name HB* or name HG) ) 0.00 0.00 4.69
assi ( resi 3 and name HN ) ( resi 2 and name HB1 ) 0.00 0.00 4.74
assi ( resi 3 and name HN ) ( resi 2 and name HG1 ) 0.00 0.00 5.01
assi ( resi 3 and name HN ) ( resi 2 and name HG2 ) 0.00 0.00 4.83

APPENDIX
- 142 -
assi ( resi 3 and name HN ) ( resi 2 and name HB2 ) 0.00 0.00 4.61
assi ( resi 3 and name HN ) ( resi 3 and name HB* ) 0.00 0.00 3.96
assi ( resi 3 and name HN ) ( resi 2 and name HA ) 0.00 0.00 3.74
assi ( resi 3 and name HN ) ( resi 3 and name HA ) 0.00 0.00 3.88
assi ( resi 3 and name HN ) ( resi 3 and name HD* ) 0.00 0.00 5.15
assi ( resi 3 and name HN ) ( resi 4 and name HN ) 0.00 0.00 5.16
assi ( resi 5 and name HN ) ( resi 5 and name HD* ) 0.00 0.00 3.99
assi ( resi 5 and name HN ) ( resi 5 and (name HB* or name HG) ) 0.00 0.00 3.86
assi ( resi 5 and name HN ) ( resi 4 and name HB1 ) 0.00 0.00 4.49
assi ( resi 5 and name HN ) ( resi 4 and name HB2 ) 0.00 0.00 4.73
assi ( resi 5 and name HN ) ( resi 5 and name HA ) 0.00 0.00 4.71
assi ( resi 5 and name HN ) ( resi 4 and name HA ) 0.00 0.00 4.07
assi ( resi 5 and name HN ) ( resi 4 and name HN ) 0.00 0.00 4.64
assi ( resi 4 and name HN ) ( resi 5 and name HD* ) 0.00 0.00 5.15
assi ( resi 4 and name HN ) ( resi 5 and (name HB* or name HG) ) 0.00 0.00 4.88
assi ( resi 4 and name HN ) ( resi 2 and name HB1 ) 0.00 0.00 5.93
assi ( resi 4 and name HN ) ( (resi 3 and name HB* ) or (resi 4 and name HB1) ) 0.00 0.00 4.15
assi ( resi 4 and name HN ) ( resi 4 and name HB2 ) 0.00 0.00 4.49
assi ( resi 4 and name HN ) ( resi 3 and name HA ) 0.00 0.00 3.95
assi ( resi 4 and name HN ) ( resi 4 and name HA ) 0.00 0.00 4.70
assi ( resi 4 and name HN ) ( resi 4 and name HD* ) 0.00 0.00 5.04
assi ( (resi 3 or resi 4 ) and name HE* ) ( resi 5 and name HD*) 0.00 0.00 3.10
assi ( (resi 3 or resi 4 ) and name HE* ) ( resi 5 and (name HB* or name HG) ) 0.00 0.00 3.69
assi ( (resi 3 or resi 4 ) and name HE* ) ( resi 2 and name HB2 ) 0.00 0.00 4.61
assi ((resi 3 or resi 4) and name HE*) ((resi 3 and name HB*) or (resi 4 and name HB1)) 0.00 0.00 3.55
assi ( (resi 3 or resi 4 ) and name HE* ) ( resi 4 and name HB2 ) 0.00 0.00 5.11
assi ( (resi 3 or resi 4 ) and name HZ ) ( resi 5 and name HD*) 0.00 0.00 3.67
assi ( (resi 3 or resi 4 ) and name HZ ) ( resi 5 and (name HB* or name HG) ) 0.00 0.00 4.36
assi ( (resi 3 or resi 4 ) and name HZ ) ( resi 4 and name HD* ) 0.00 0.00 4.04
assi ( (resi 3 or resi 4 ) and name HE* ) ( resi 4 and name HD* ) 0.00 0.00 2.56
assi ( (resi 3 or resi 4 ) and name HE* ) ( resi 3 and name HD* ) 0.00 0.00 2.62
assi ( resi 4 and name HD* ) ( resi 5 and name HD* ) 0.00 0.00 3.62
assi ( resi 4 and name HD* ) (resi 5 and (name HB* or name HG) ) 0.00 0.00 4.07
assi ( resi 4 and name HD* ) ( resi 2 and name HB2 ) 0.00 0.00 4.66
assi ( resi 4 and name HD* ) ( resi 4 and name HB1 ) 0.00 0.00 4.13
assi ( resi 4 and name HD* ) ( resi 4 and name HB2 ) 0.00 0.00 4.70
assi ( resi 3 and name HD* ) ( resi 5 and name HD* ) 0.00 0.00 3.72
assi ( resi 3 and name HD* ) (resi 5 and (name HB* or name HG) ) 0.00 0.00 4.03
assi ( resi 3 and name HD* ) ( resi 2 and name HB2 ) 0.00 0.00 4.25
assi ( resi 3 and name HD* ) ( resi 3 and name HB* ) 0.00 0.00 4.16
assi ( resi 3 and name HD* ) ( resi 3 and name HA ) 0.00 0.00 4.51
assi ( resi 3 and name HA ) ( resi 3 and name HB* ) 0.00 0.00 3.89
assi ( resi 1 and name HA ) ( resi 2 and name HD2 ) 0.00 0.00 4.58
assi ( resi 1 and name HA ) ( resi 2 and name HD1 ) 0.00 0.00 4.36

APPENDIX
- 143 -
assi ( resi 1 and name HA ) ( resi 1 and name HB2 ) 0.00 0.00 4.00
assi ( resi 1 and name HA ) ( resi 1 and name HB1 ) 0.00 0.00 4.23
assi ( resi 1 and name HA ) ( resi 2 and name HG2 ) 0.00 0.00 4.63
assi ( resi 1 and name HA ) ( resi 2 and name HG1 ) 0.00 0.00 4.50
assi ( resi 4 and name HA ) ( resi 4 and name HB1 ) 0.00 0.00 4.81
assi ( resi 4 and name HA ) ( resi 4 and name HB2 ) 0.00 0.00 4.24
assi ( resi 2 and name HA ) ( resi 2 and name HB1 ) 0.00 0.00 4.11
assi ( resi 2 and name HA ) ( resi 2 and name HG1 ) 0.00 0.00 4.67
assi ( resi 2 and name HA ) ( resi 2 and name HG2 ) 0.00 0.00 4.75
assi ( resi 2 and name HA ) ( resi 2 and name HB2 ) 0.00 0.00 4.14
assi ( resi 5 and name HA ) ( resi 5 and name HD1* ) 0.00 0.00 4.13
assi ( resi 5 and name HA ) ( resi 5 and name HD2* ) 0.00 0.00 5.00
assi ( resi 5 and name HA ) (resi 5 and (name HB* or name HG) ) 0.00 0.00 3.88
assi ( resi 2 and name HD1 ) ( resi 2 and name HG2 ) 0.00 0.00 4.46
assi ( resi 2 and name HD1 ) ( resi 2 and name HG1 ) 0.00 0.00 4.71
assi ( resi 2 and name HD2 ) ( resi 2 and name HG1 ) 0.00 0.00 4.36
assi ( resi 2 and name HD2 ) ( resi 2 and name HG2 ) 0.00 0.00 4.69
assi ( resi 2 and name HD1 ) ( resi 2 and name HD2 ) 0.00 0.00 4.31
assi ( resi 4 and name HB1 ) ( resi 4 and name HB2 ) 0.00 0.00 3.02
assi ( resi 1 and name HB1 ) ( resi 1 and name HB2 ) 0.00 0.00 3.11
assi ( resi 2 and name HG2 ) ( resi 2 and name HB2 ) 0.00 0.00 4.08
assi ( resi 2 and name HG1 ) ( resi 2 and name HB2 ) 0.00 0.00 4.03
assi ( resi 2 and name HB1 ) ( resi 2 and name HB2 ) 0.00 0.00 4.84
assi ( resi 2 and name HG1 ) ( resi 2 and name HG2 ) 0.00 0.00 3.35
assi ( resi 2 and name HB1 ) ( resi 2 and name HG2 ) 0.00 0.00 4.05
assi ( resi 2 and name HB1 ) ( resi 2 and name HG1 ) 0.00 0.00 3.71
assi ( resi 2 and name HG1 ) (resi 5 and (name HB* or name HG) ) 0.00 0.00 4.31
assi (resi 5 and (name HB* or name HG) ) ( resi 5 and name HD1* ) 0.00 0.00 3.69
assi (resi 5 and (name HB* or name HG) ) ( resi 5 and name HD2* ) 0.00 0.00 3.80
5.2.7 Distance restraints obtained from trNOESY data for iAβ5inv bound to Aβ1−40 as an input
file for CNSsolve .
ASSIgn atom-selection atom-selection dplus dminus dis
assi ( resi 1 and name HA ) ( resi 2 and name HD1 ) 0.00 0.00 3.70
assi ( resi 1 and name HA ) ( resi 2 and name HD2 ) 0.00 0.00 3.80
assi ( resi 1 and name HA ) ( resi 1 and name HB1 ) 0.00 0.00 3.40
assi ( resi 1 and name HB1 ) ( resi 1 and name HB2 ) 0.00 0.00 2.60
assi ( resi 2 and name HA ) ( resi 2 and name HB1 ) 0.00 0.00 3.30
assi ( resi 2 and name HA ) ( resi 2 and name HG1 ) 0.00 0.00 4.10
assi ( resi 2 and name HA ) ( resi 2 and name HG2 ) 0.00 0.00 4.40

APPENDIX
- 144 -
assi ( resi 2 and name HA ) ( resi 2 and name HB2 ) 0.00 0.00 3.60
assi ( resi 2 and name HD1 ) ( resi 2 and name HD2 ) 0.00 0.00 3.10
assi ( resi 2 and name HD2 ) ( resi 1 and name HB1 ) 0.00 0.00 3.70
assi ( resi 2 and name HD2 ) ( resi 1 and name HB2 ) 0.00 0.00 4.30
assi ( resi 2 and name HD2 ) ( resi 2 and name HG1 ) 0.00 0.00 3.70
assi ( resi 2 and name HD2 ) ( resi 2 and name HG2 ) 0.00 0.00 3.90
assi ( resi 2 and name HD2 ) ( resi 2 and name HB2 ) 0.00 0.00 4.30
assi ( resi 2 and name HD1 ) ( resi 1 and name HB1 ) 0.00 0.00 4.30
assi ( resi 2 and name HD1 ) ( resi 1 and name HB2 ) 0.00 0.00 4.40
assi ( resi 2 and name HD1 ) ( resi 2 and name HB1 ) 0.00 0.00 4.60
assi ( resi 2 and name HD1 ) ( resi 2 and name HB2 ) 0.00 0.00 4.60
assi ( resi 2 and name HD1 ) ( resi 2 and name HG1 ) 0.00 0.00 3.70
assi ( resi 2 and name HD1 ) ( resi 2 and name HG2 ) 0.00 0.00 3.60
assi ( resi 2 and name HB1 ) ( resi 2 and name HG1 ) 0.00 0.00 3.70
assi ( resi 2 and name HB1 ) ( resi 2 and name HG2 ) 0.00 0.00 3.90
assi ( resi 2 and name HB1 ) ( resi 2 and name HB2 ) 0.00 0.00 2.80
assi ( resi 2 and name HG1 ) ( resi 2 and name HG2 ) 0.00 0.00 3.20
assi ( resi 2 and name HG1 ) ( resi 2 and name HB2 ) 0.00 0.00 3.90
assi ( resi 2 and name HG2 ) ( resi 2 and name HB2 ) 0.00 0.00 3.60
assi ( resi 2 and name HG2 ) (resi 5 and (name HB* or name HG) ) 0.00 0.00 4.10
assi ( resi 3 and name HD* ) ( resi 5 and name HD2* ) 0.00 0.00 4.40
assi ( resi 3 and name HD* ) ( resi 5 and name HD1* ) 0.00 0.00 4.30
assi ( resi 3 and name HA ) ( resi 3 and name HB* ) 0.00 0.00 3.20
assi ( resi 3 and name HN ) (resi 4 and name HN ) 0.00 0.00 3.80
assi ( resi 3 and name HN ) (resi 3 and name HD* ) 0.00 0.00 4.40
assi ( resi 3 and name HN ) (resi 3 and name HE* ) 0.00 0.00 6.30
assi ( resi 3 and name HN ) (resi 2 and name HA ) 0.00 0.00 3.20
assi ( resi 3 and name HN ) (resi 3 and name HA ) 0.00 0.00 3.50
assi ( resi 3 and name HN ) (resi 3 and name HB* ) 0.00 0.00 3.30
assi ( resi 3 and name HN ) (resi 2 and name HB2 ) 0.00 0.00 4.30
assi ( resi 3 and name HN ) (resi 2 and name HB1 ) 0.00 0.00 4.50
assi ( resi 3 and name HD* ) (resi 3 and name HA ) 0.00 0.00 3.60
assi ( resi 3 and name HD* ) (resi 3 and name HB* ) 0.00 0.00 3.40
assi ( resi 3 and name HD* ) (resi 5 and (name HB* or name HG) ) 0.00 0.00 5.00
assi ( (resi 3 or resi 4 ) and name HE* ) ( resi 3 and name HA ) 0.00 0.00 4.10
assi ( (resi 3 or resi 4 ) and name HE* ) ( resi 4 and name HA ) 0.00 0.00 4.50
assi ( (resi 3 or resi 4 ) and name HE* ) (resi 5 and (name HB* or name HG) ) 0.00 0.00 4.00
assi ( (resi 3 or resi 4 ) and name HE* ) (resi 2 and name HB2 ) 0.00 0.00 4.50
assi ( (resi 3 or resi 4 ) and name HE* ) (resi 2 and name HG2 ) 0.00 0.00 5.50
assi ( (resi 3 or resi 4 ) and name HE* ) (resi 2 and name HG1 ) 0.00 0.00 6.10
assi ( (resi 3 or resi 4 ) and name HE* ) (resi 2 and name HB1 ) 0.00 0.00 4.80
assi ( (resi 3 or resi 4 ) and name HZ ) (resi 5 and (name HB* or name HG) ) 0.00 0.00 4.80
assi ( (resi 3 or resi 4 ) and name HE* ) ( resi 4 and name HB1 ) 0.00 0.00 4.90
assi ( (resi 3 or resi 4 ) and name HE* ) ( resi 3 and name HB* ) 0.00 0.00 3.80

APPENDIX
- 145 -
assi ( (resi 3 or resi 4 ) and name HE* ) ( resi 4 and name HB2 ) 0.00 0.00 4.10
assi ( (resi 3 or resi 4 ) and name HE* ) ( (resi 3 or resi 4 ) and name HZ ) 0.00 0.00 2.50
assi ( (resi 3 or resi 4 ) and name HE* ) ( resi 4 and name HD* ) 0.00 0.00 2.70
assi ( (resi 3 or resi 4 ) and name HE* ) ( resi 3 and name HD* ) 0.00 0.00 2.60
assi ( (resi 3 or resi 4 ) and name HZ ) ( resi 4 and name HD* ) 0.00 0.00 3.60
assi ( (resi 3 or resi 4 ) and name HE* ) ( resi 5 and name HD1* ) 0.00 0.00 3.50
assi ( (resi 3 or resi 4 ) and name HE* ) ( resi 5 and name HD2* ) 0.00 0.00 3.60
assi ( (resi 3 or resi 4 ) and name HZ ) ( resi 5 and name HD1* ) 0.00 0.00 4.20
assi ( (resi 3 or resi 4 ) and name HZ ) ( resi 5 and name HD2* ) 0.00 0.00 4.20
assi ( resi 4 and name HD* ) (resi 4 and name HA ) 0.00 0.00 3.80
assi ( resi 4 and name HD* ) ( resi 5 and name HD2* ) 0.00 0.00 4.00
assi ( resi 4 and name HD* ) ( resi 5 and name HD1* ) 0.00 0.00 4.10
assi ( resi 4 and name HD* ) (resi 4 and name HB1 ) 0.00 0.00 3.60
assi ( resi 4 and name HD* ) (resi 4 and name HB2 ) 0.00 0.00 3.50
assi ( resi 4 and name HN ) (resi 4 and name HD* ) 0.00 0.00 4.30
assi ( resi 4 and name HN ) (resi 3 and name HA ) 0.00 0.00 3.30
assi ( resi 4 and name HN ) (resi 4 and name HA ) 0.00 0.00 3.90
assi ( resi 4 and name HN ) (resi 4 and name HB1 ) 0.00 0.00 4.20
assi ( resi 4 and name HN ) (resi 3 and name HB* ) 0.00 0.00 3.80
assi ( resi 4 and name HN ) (resi 4 and name HB2 ) 0.00 0.00 3.80
assi ( resi 4 and name HA ) (resi 4 and name HB1 ) 0.00 0.00 3.40
assi ( resi 4 and name HD* ) (resi 5 and (name HB* or name HG) ) 0.00 0.00 4.10
assi ( resi 4 and name HB1 ) ( resi 4 and name HB2 ) 0.00 0.00 2.70
assi ( resi 5 and name HA ) (resi 5 and (name HB* or name HG) ) 0.00 0.00 3.20
assi ( resi 5 and name HA ) ( resi 5 and name HD1* ) 0.00 0.00 3.90
assi ( resi 5 and name HA ) ( resi 5 and name HD2* ) 0.00 0.00 3.30
assi (resi 5 and (name HB* or name HG) ) (resi 5 and name HD1* ) 0.00 0.00 3.00
assi (resi 5 and (name HB* or name HG) ) (resi 5 and name HD2* ) 0.00 0.00 3.20
assi ( resi 5 and name HN ) (resi 4 and name HN ) 0.00 0.00 3.90
assi ( resi 5 and name HN ) (resi 4 and name HA ) 0.00 0.00 3.40
assi ( resi 5 and name HN ) (resi 5 and name HA ) 0.00 0.00 3.80
assi ( resi 5 and name HN ) (resi 4 and name HD* ) 0.00 0.00 4.80
assi ( resi 5 and name HN ) (resi 4 and name HB2 ) 0.00 0.00 4.20
assi ( resi 5 and name HN ) (resi 4 and name HB1 ) 0.00 0.00 4.50
assi ( resi 5 and name HN ) (resi 5 and (name HB* or name HG) ) 0.00 0.00 3.30
assi ( resi 5 and name HN ) (resi 5 and name HD2* ) 0.00 0.00 4.50
assi ( resi 5 and name HN ) (resi 5 and name HD1* ) 0.00 0.00 4.40
5.3 Pulse Programs
Most of the pulse programs used in this project are well known standard programs that were
implemented from the literature. Therefore they won’t be listed here. Only the pulse programs

APPENDIX
- 146 -
that were modified and optimised during the course of this thesis are shown below. All these
pulse programs are written for digital AVANCE spectrometers of the BRUKER company
controlled by the software XWINNMR 3.0.
5.3.1 HSQC without decoupling in 1H dimension, with phase cycle of the final 90° (1H) pulse of the first INEPT # 1 "/u/exp/stan/nmr/lists/pp/jinginvieags"
;invieags
;avance-version
;2D H-1/X correlation via double inept transfer
;phase sensitive using Echo/Antiecho gradient selection
;with decoupling during acquisition
;using trim pulses in inept transfer
# 1 "/u/exp/stan/nmr/lists/pp/Avance.incl" 1
;Avance.incl
;avance-version (03/02/17)
;$Id: Avance1.incl,v 1.7.2.3 2003/02/25 14:48:47 ber Exp $
# 9 "/u/exp/stan/nmr/lists/pp/jinginvieags" 2
# 1 "/u/exp/stan/nmr/lists/pp/Grad.incl" 1
;Grad.incl - include file for Gradient Spectroscopy
;avance-version (02/05/31)
define list<gradient> EA=<EA>
;$Id: Grad1.incl,v 1.7 2002/06/12 09:04:22 ber Exp $
# 10 "/u/exp/stan/nmr/lists/pp/jinginvieags" 2
"p2=p1*2"
"p4=p3*2"
"d0=3u"
"d4=1s/(cnst2*4)"
"d11=30m"
"d13=3u"
"d20=p16+d16+d0*2"
"d21=d4-p16-d13-4u"
"l3=(td1/2)"
"ds=ns*2*cnst0"
1 ze
d11 pl12:f2
2 d1 do:f2
3 d11 do:f2
4 (p1 ph1)
d4 pl2:f2

APPENDIX
- 147 -
(p2 ph0) (p4 ph0):f2
d4 setnmr2|0 setnmr0|34|32|33
(p1 ph2) (p3 ph3):f2
d0
;;p2 ph0
d0
p16:ngrad:c34
d16
(p4 ph0):f2
d20
(p1 ph0) (p3 ph4):f2
d4
(p2 ph0) (p4 ph0):f2
d13
p16:ngrad:c34
d21 pl12:f2
4u setnmr2^0 setnmr0^34^32^33
go=2 ph31 cpd2:f2
d1 do:f2 wr #0 if #0 zd
lo to 3 times 2
d11 id0
lo to 4 times l3
exit
ph0=0
ph1=0 2
ph2=1 1 3 3
ph3=0 0 0 0 2 2 2 2
ph4=0 0 0 0 0 0 0 0
2 2 2 2 2 2 2 2
ph31=0 2 2 0 2 0 0 2
2 0 0 2 0 2 2 0
;pl1 : f1 channel - power level for pulse (default)
;pl2 : f2 channel - power level for pulse (default)
;pl12: f2 channel - power level for CPD/BB decoupling
;p1 : f1 channel - 90 degree high power pulse
;p2 : f1 channel - 180 degree high power pulse
;p3 : f2 channel - 90 degree high power pulse
;p4 : f2 channel - 180 degree high power pulse
;p16: homospoil/gradient pulse
;p28: f1 channel - trim pulse
;d0 : incremented delay (2D) [3 usec]
;d1 : relaxation delay; 1-5 * T1

APPENDIX
- 148 -
;d4 : 1/(4J)XH
;d11: delay for disk I/O [30 msec]
;d13: short delay [3 usec]
;d16: delay for homospoil/gradient recovery
;d20: =p16+d16+p2+d0*2
;d21: =d4-p16-d13-4u
;cnst0: ds = ns * 2 * cnst0
;cnst2: = J(XH)
;l3: loop for phase sensitive 2D using E/A method : l3 = td1/2
;in0: 1/(2 * SW(X)) = DW(X)
;nd0: 2
;NS: 1 * n
;DS: >= 16, but 2 * ns * m
;td1: number of experiments
;MC2: echo-antiecho
;cpd2: decoupling according to sequence defined by cpdprg2
;pcpd2: f2 channel - 90 degree pulse for decoupling sequence
;use gradient program (GRDPROG) : 2sineea
;use gradient ratio: cnst21 : cnst22 : cnst23 : cnst24
; 80 : 20 : 80 : -20 for C-13
; 80 : 8 : 80 : -8 for N-15
5.3.2 HSQC without decoupling of X during detection time, with antiphase.
# 1 "/u/exp/stan/nmr/lists/pp/jinginvieags.t3"
;invieags.t3
;avance-version
;2D H-1/X correlation via double inept transfer
;phase sensitive using Echo/Antiecho gradient selection
;with decoupling during acquisition
;using trim pulses in inept transfer
# 1 "/u/exp/stan/nmr/lists/pp/Avance.incl" 1
;Avance.incl
;avance-version (03/02/17)
;$Id: Avance1.incl,v 1.7.2.3 2003/02/25 14:48:47 ber Exp $
# 9 "/u/exp/stan/nmr/lists/pp/jinginvieags.t3" 2
# 1 "/u/exp/stan/nmr/lists/pp/Grad.incl" 1
;Grad.incl - include file for Gradient Spectroscopy
;avance-version (02/05/31)
define list<gradient> EA=<EA>
;$Id: Grad1.incl,v 1.7 2002/06/12 09:04:22 ber Exp $
# 10 "/u/exp/stan/nmr/lists/pp/jinginvieags.t3" 2
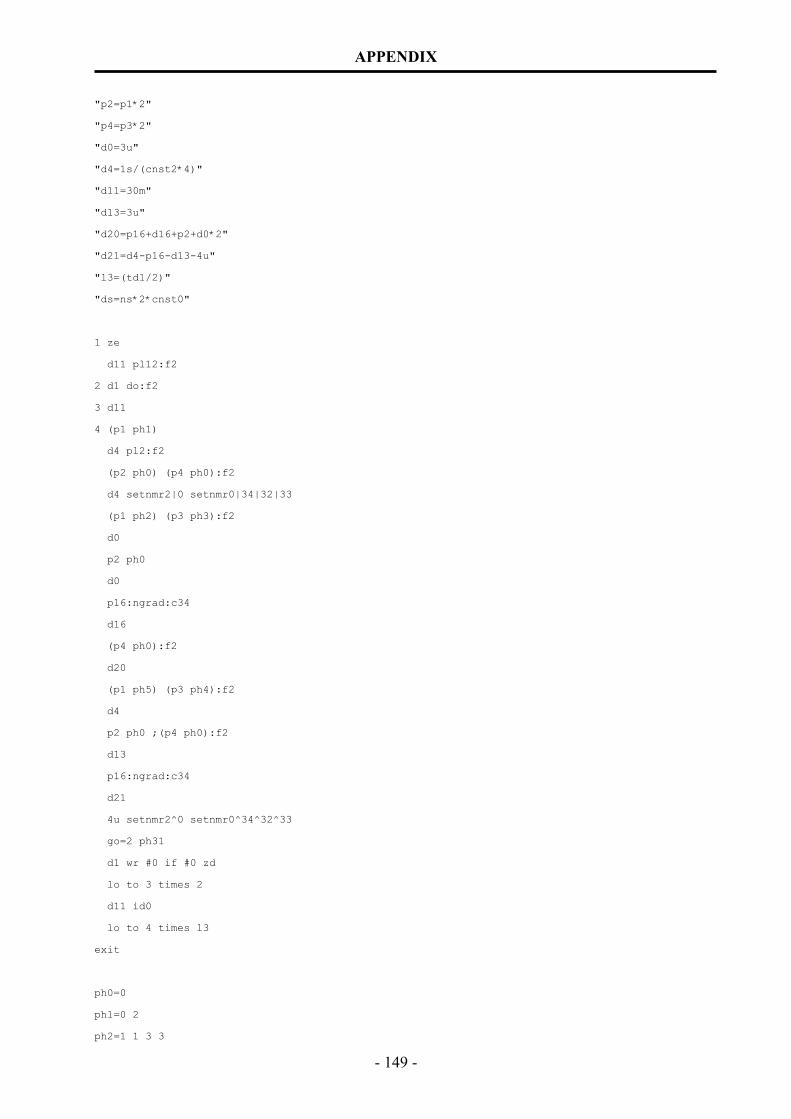
APPENDIX
- 149 -
"p2=p1*2"
"p4=p3*2"
"d0=3u"
"d4=1s/(cnst2*4)"
"d11=30m"
"d13=3u"
"d20=p16+d16+p2+d0*2"
"d21=d4-p16-d13-4u"
"l3=(td1/2)"
"ds=ns*2*cnst0"
1 ze
d11 pl12:f2
2 d1 do:f2
3 d11
4 (p1 ph1)
d4 pl2:f2
(p2 ph0) (p4 ph0):f2
d4 setnmr2|0 setnmr0|34|32|33
(p1 ph2) (p3 ph3):f2
d0
p2 ph0
d0
p16:ngrad:c34
d16
(p4 ph0):f2
d20
(p1 ph5) (p3 ph4):f2
d4
p2 ph0 ;(p4 ph0):f2
d13
p16:ngrad:c34
d21
4u setnmr2^0 setnmr0^34^32^33
go=2 ph31
d1 wr #0 if #0 zd
lo to 3 times 2
d11 id0
lo to 4 times l3
exit
ph0=0
ph1=0 2
ph2=1 1 3 3

APPENDIX
- 150 -
ph3=0 0 0 0 2 2 2 2
ph4=0 0 0 0 0 0 0 0
2 2 2 2 2 2 2 2
ph5=0 0 0 0 0 0 0 0
0 0 0 0 0 0 0 0
2 2 2 2 2 2 2 2
2 2 2 2 2 2 2 2
ph31=0 2 2 0 2 0 0 2
2 0 0 2 0 2 2 0
2 0 0 2 0 2 2 0
0 2 2 0 2 0 0 2
;pl1 : f1 channel - power level for pulse (default)
;pl2 : f2 channel - power level for pulse (default)
;pl12: f2 channel - power level for CPD/BB decoupling
;p1 : f1 channel - 90 degree high power pulse
;p2 : f1 channel - 180 degree high power pulse
;p3 : f2 channel - 90 degree high power pulse
;p4 : f2 channel - 180 degree high power pulse
;p16: homospoil/gradient pulse
;p28: f1 channel - trim pulse
;d0 : incremented delay (2D) [3 usec]
;d1 : relaxation delay; 1-5 * T1
;d4 : 1/(4J)XH
;d11: delay for disk I/O [30 msec]
;d13: short delay [3 usec]
;d16: delay for homospoil/gradient recovery
;d20: =p16+d16+p2+d0*2
;d21: =d4-p16-d13-4u
;cnst0: ds = ns * 2 * cnst0
;cnst2: = J(XH)
;l3: loop for phase sensitive 2D using E/A method : l3 = td1/2
;in0: 1/(2 * SW(X)) = DW(X)
;nd0: 2
;NS: 1 * n
;DS: >= 16, but 2 * ns * m
;td1: number of experiments
;MC2: echo-antiecho
;cpd2: decoupling according to sequence defined by cpdprg2
;pcpd2: f2 channel - 90 degree pulse for decoupling sequence
;use gradient program (GRDPROG) : 2sineea
;use gradient ratio: cnst21 : cnst22 : cnst23 : cnst24
; 80 : 20 : 80 : -20 for C-13
; 80 : 8 : 80 : -8 for N-15

APPENDIX
- 151 -
5.4 The best calculated structure for iAβ5/iAβ5inv bound to Aβ fibrils derived from trNOE data. 5.4.1 PDB file for 19F-iAβ5 bound to Aβ14-23
REMARK FILENAME="19F2_anneal_182.pdb"
REMARK The macromolecule has 5 residues
REMARK Accepted structure 126 of 200 structures
REMARK Trial structure 182 of 200 structures
REMARK Molecular dynamics scheme : torsion; torsion; cartesian; minimize
REMARK High temperature dynamics :
REMARK temp: 50000 steps: 1000 time(ps): 15
REMARK 1st cooling stage :
REMARK temp: 50000->0 steps: 1000 time(ps): 15 temp step: 250
REMARK 2nd cooling stage :
REMARK temp: 2000->0 steps: 3000 time(ps): 15 temp step: 25
REMARK a total 2000 steps of minimization
REMARK VDW scale factors 0.1; 0.1->1; 1->4; 1
REMARK 110 NOEs in 1 class(es) with scale factors of 150; 150; 150; 75
REMARK averaging function(s): sum,
REMARK 0 3-bond j-couplings in 0 class(es) with
REMARK scale factor(s) of NA
REMARK 0 1-bond j-couplings in 0 class(es) with
REMARK scale factor(s) of NA
REMARK 0 carbon chemical shifts in 0 class(es) with
REMARK scale factor(s) of NA
REMARK 0 proton chemical shifts in 0 class(es) with
REMARK scale factor(s) of NA
REMARK 0 diffusion anisotropy restraints in 0 class(es) with
REMARK scale factor(s) of NA
REMARK 0 susceptability anisotropy restraints in 0 class(es) with
REMARK scale factor(s) of NA
REMARK 0 dihedral restraints with scale factors of 100; 200; 200; 400
REMARK 0 planarity restraints with a scale factor of NA
REMARK NCS restraints not used.
REMARK ===============================================================
REMARK bond, angles, improp, vdw(<1.6), dihed
REMARK violations : 1 0 0 0 3
REMARK RMSD : 0.0097 0.821 0.277 31.575
REMARK ===============================================================
REMARK noe, cdih, coup, oneb, carb-a, carb-b,
REMARK violations : 0 0 0 0 0 -----
REMARK RMSD : 0.063 0.000 0.000 0.000 0.000 0.000

APPENDIX
- 152 -
REMARK 0.2/2 viol.: 3 0 0
REMARK ===============================================================
REMARK dani, sani
REMARK violations : 0 0
REMARK RMSD : 0.000 0.000
REMARK .2/.1 viol.: 0 0
REMARK ===============================================================
REMARK Protons violations, rmsd
REMARK all : 0 0.000
REMARK class 1: 0 0.000
REMARK class 2: 0 0.000
REMARK class 3: 0 0.000
REMARK class 4: 0 0.000
REMARK ===============================================================
REMARK overall = 61.4433
REMARK bon = 8.4898
REMARK ang = 16.6295
REMARK imp = 0.632922
REMARK vdw = 3.12231
REMARK harm = 0
REMARK noe = 32.5688
REMARK coup = 0
REMARK oneb = 0
REMARK carb = 0
REMARK prot = 0
REMARK dani = 0
REMARK sani = 0
REMARK cdih = 0
REMARK ncs = 0
REMARK ===============================================================
REMARK DATE:31-Mar-04 13:54:20 created by user: chen
REMARK VERSION:1.0
ATOM 1 CA LEU 1 1.578 -1.795 2.353 1.00 0.00
ATOM 2 HA LEU 1 2.577 -2.202 2.328 1.00 0.00
ATOM 3 CB LEU 1 0.616 -2.776 1.679 1.00 0.00
ATOM 4 HB1 LEU 1 -0.125 -2.207 1.137 1.00 0.00
ATOM 5 HB2 LEU 1 0.114 -3.341 2.452 1.00 0.00
ATOM 6 CG LEU 1 1.268 -3.762 0.706 1.00 0.00
ATOM 7 HG LEU 1 2.333 -3.784 0.887 1.00 0.00
ATOM 8 CD1 LEU 1 0.727 -5.167 0.925 1.00 0.00
ATOM 9 HD11 LEU 1 -0.322 -5.192 0.666 1.00 0.00
ATOM 10 HD12 LEU 1 0.849 -5.443 1.962 1.00 0.00
ATOM 11 HD13 LEU 1 1.268 -5.862 0.301 1.00 0.00
ATOM 12 CD2 LEU 1 1.041 -3.322 -0.732 1.00 0.00

APPENDIX
- 153 -
ATOM 13 HD21 LEU 1 1.175 -2.252 -0.808 1.00 0.00
ATOM 14 HD22 LEU 1 0.037 -3.581 -1.033 1.00 0.00
ATOM 15 HD23 LEU 1 1.749 -3.820 -1.378 1.00 0.00
ATOM 16 C LEU 1 1.563 -0.456 1.619 1.00 0.00
ATOM 17 O LEU 1 0.720 0.399 1.890 1.00 0.00
ATOM 18 N LEU 1 1.170 -1.633 3.773 1.00 0.00
ATOM 19 HT1 LEU 1 0.321 -1.034 3.793 1.00 0.00
ATOM 20 HT2 LEU 1 1.960 -1.182 4.280 1.00 0.00
ATOM 21 HT3 LEU 1 0.969 -2.579 4.155 1.00 0.00
ATOM 22 N PRO 2 2.497 -0.256 0.671 1.00 0.00
ATOM 23 CA PRO 2 2.577 0.986 -0.103 1.00 0.00
ATOM 24 HA PRO 2 2.887 1.819 0.512 1.00 0.00
ATOM 25 CB PRO 2 3.651 0.689 -1.153 1.00 0.00
ATOM 26 HB1 PRO 2 4.244 1.575 -1.325 1.00 0.00
ATOM 27 HB2 PRO 2 3.179 0.380 -2.075 1.00 0.00
ATOM 28 CG PRO 2 4.472 -0.407 -0.568 1.00 0.00
ATOM 29 HG1 PRO 2 5.260 0.009 0.041 1.00 0.00
ATOM 30 HG2 PRO 2 4.887 -1.015 -1.358 1.00 0.00
ATOM 31 CD PRO 2 3.536 -1.224 0.278 1.00 0.00
ATOM 32 HD1 PRO 2 4.051 -1.608 1.146 1.00 0.00
ATOM 33 HD2 PRO 2 3.113 -2.031 -0.300 1.00 0.00
ATOM 34 C PRO 2 1.256 1.318 -0.782 1.00 0.00
ATOM 35 O PRO 2 0.551 0.425 -1.245 1.00 0.00
ATOM 36 N PHE 3 0.924 2.605 -0.843 1.00 0.00
ATOM 37 HN PHE 3 1.530 3.272 -0.457 1.00 0.00
ATOM 38 CA PHE 3 -0.320 3.051 -1.472 1.00 0.00
ATOM 39 HA PHE 3 -0.234 4.122 -1.637 1.00 0.00
ATOM 40 CB PHE 3 -0.506 2.375 -2.821 1.00 0.00
ATOM 41 HB1 PHE 3 -1.296 2.858 -3.368 1.00 0.00
ATOM 42 HB2 PHE 3 -0.724 1.330 -2.695 1.00 0.00
ATOM 43 CG PHE 3 0.703 2.481 -3.605 1.00 0.00
ATOM 44 CD1 PHE 3 1.285 1.373 -4.149 1.00 0.00
ATOM 45 HD1 PHE 3 0.819 0.406 -4.018 1.00 0.00
ATOM 46 CD2 PHE 3 1.275 3.703 -3.758 1.00 0.00
ATOM 47 HD2 PHE 3 0.801 4.569 -3.321 1.00 0.00
ATOM 48 CE1 PHE 3 2.443 1.488 -4.850 1.00 0.00
ATOM 49 HE1 PHE 3 2.885 0.615 -5.262 1.00 0.00
ATOM 50 CE2 PHE 3 2.419 3.844 -4.450 1.00 0.00
ATOM 51 HE2 PHE 3 2.833 4.812 -4.540 1.00 0.00
ATOM 52 CZ PHE 3 3.029 2.734 -5.011 1.00 0.00
ATOM 53 HZ PHE 3 3.949 2.838 -5.566 1.00 0.00
ATOM 54 C PHE 3 -1.510 2.725 -0.592 1.00 0.00
ATOM 55 O PHE 3 -2.177 3.608 -0.052 1.00 0.00
ATOM 56 N PHE 4 -1.760 1.426 -0.467 1.00 0.00

APPENDIX
- 154 -
ATOM 57 HN PHE 4 -1.175 0.789 -0.939 1.00 0.00
ATOM 58 CA PHE 4 -2.867 0.913 0.336 1.00 0.00
ATOM 59 HA PHE 4 -3.782 1.106 -0.203 1.00 0.00
ATOM 60 CB PHE 4 -2.718 -0.597 0.528 1.00 0.00
ATOM 61 HB1 PHE 4 -3.560 -0.966 1.095 1.00 0.00
ATOM 62 HB2 PHE 4 -1.807 -0.797 1.071 1.00 0.00
ATOM 63 CG PHE 4 -2.663 -1.355 -0.767 1.00 0.00
ATOM 64 CD1 PHE 4 -3.823 -1.799 -1.375 1.00 0.00
ATOM 65 HD1 PHE 4 -4.770 -1.606 -0.913 1.00 0.00
ATOM 66 CD2 PHE 4 -1.451 -1.616 -1.382 1.00 0.00
ATOM 67 HD2 PHE 4 -0.542 -1.282 -0.926 1.00 0.00
ATOM 68 CE1 PHE 4 -3.774 -2.484 -2.564 1.00 0.00
ATOM 69 HE1 PHE 4 -4.687 -2.825 -3.030 1.00 0.00
ATOM 70 CE2 PHE 4 -1.399 -2.301 -2.570 1.00 0.00
ATOM 71 HE2 PHE 4 -0.446 -2.499 -3.040 1.00 0.00
ATOM 72 CZ PHE 4 -2.561 -2.733 -3.159 1.00 0.00
ATOM 73 HZ PHE 4 -2.521 -3.262 -4.079 1.00 0.00
ATOM 74 C PHE 4 -2.936 1.606 1.695 1.00 0.00
ATOM 75 O PHE 4 -3.984 2.119 2.088 1.00 0.00
ATOM 76 N ASP 5 -1.814 1.616 2.406 1.00 0.00
ATOM 77 HN ASP 5 -1.011 1.191 2.038 1.00 0.00
ATOM 78 CA ASP 5 -1.747 2.245 3.720 1.00 0.00
ATOM 79 HA ASP 5 -2.759 2.409 4.060 1.00 0.00
ATOM 80 CB ASP 5 -1.031 1.328 4.712 1.00 0.00
ATOM 81 HB1 ASP 5 0.035 1.412 4.566 1.00 0.00
ATOM 82 HB2 ASP 5 -1.335 0.307 4.533 1.00 0.00
ATOM 83 CG ASP 5 -1.348 1.675 6.153 1.00 0.00
ATOM 84 OD1 ASP 5 -0.808 2.684 6.653 1.00 0.00
ATOM 85 OD2 ASP 5 -2.138 0.939 6.782 1.00 0.00
ATOM 86 C ASP 5 -1.030 3.589 3.644 1.00 0.00
ATOM 87 OT1 ASP 5 -0.215 3.773 2.715 1.00 0.00
ATOM 88 OT2 ASP 5 -1.290 4.448 4.513 1.00 0.00
END
5.4.2 PDB file for iAβ5inv bound to Aβ14-23 REMARK FILENAME="DPFFL_10_anneal_69.pdb"
REMARK The macromolecule has 5 residues
REMARK Accepted structure 69 of 200 structures
REMARK Trial structure 69 of 200 structures
REMARK Molecular dynamics scheme : torsion; torsion; cartesian; minimize
REMARK High temperature dynamics :
REMARK temp: 50000 steps: 1000 time(ps): 15
REMARK 1st cooling stage :

APPENDIX
- 155 -
REMARK temp: 50000->0 steps: 1000 time(ps): 15 temp step: 250
REMARK 2nd cooling stage :
REMARK temp: 2000->0 steps: 3000 time(ps): 15 temp step: 25
REMARK a total 2000 steps of minimization
REMARK VDW scale factors 0.1; 0.1->1; 1->4; 1
REMARK 78 NOEs in 1 class(es) with scale factors of 150; 150; 150; 75
REMARK averaging function(s): sum,
REMARK 0 3-bond j-couplings in 0 class(es) with
REMARK scale factor(s) of NA
REMARK 0 1-bond j-couplings in 0 class(es) with
REMARK scale factor(s) of NA
REMARK 0 carbon chemical shifts in 0 class(es) with
REMARK scale factor(s) of NA
REMARK 0 proton chemical shifts in 0 class(es) with
REMARK scale factor(s) of NA
REMARK 0 diffusion anisotropy restraints in 0 class(es) with
REMARK scale factor(s) of NA
REMARK 0 susceptability anisotropy restraints in 0 class(es) with
REMARK scale factor(s) of NA
REMARK 0 dihedral restraints with scale factors of 100; 200; 200; 400
REMARK 0 planarity restraints with a scale factor of NA
REMARK NCS restraints not used.
REMARK ===============================================================
REMARK bond, angles, improp, vdw(<1.6), dihed
REMARK violations : 0 0 0 0 2
REMARK RMSD : 0.0007 0.606 0.077 21.260
REMARK ===============================================================
REMARK noe, cdih, coup, oneb, carb-a, carb-b,
REMARK violations : 0 0 0 0 0 -----
REMARK RMSD : 0.001 0.000 0.000 0.000 0.000 0.000
REMARK 0.2/2 viol.: 0 0 0
REMARK ===============================================================
REMARK dani, sani
REMARK violations : 0 0
REMARK RMSD : 0.000 0.000
REMARK .2/.1 viol.: 0 0
REMARK ===============================================================
REMARK Protons violations, rmsd
REMARK all : 0 0.000
REMARK class 1: 0 0.000
REMARK class 2: 0 0.000
REMARK class 3: 0 0.000
REMARK class 4: 0 0.000
REMARK ===============================================================

APPENDIX
- 156 -
REMARK overall = 9.64747
REMARK bon = 4.180711E-02
REMARK ang = 9.04866
REMARK imp = 4.884535E-02
REMARK vdw = 0.505502
REMARK harm = 0
REMARK noe = 2.649884E-03
REMARK coup = 0
REMARK oneb = 0
REMARK carb = 0
REMARK prot = 0
REMARK dani = 0
REMARK sani = 0
REMARK cdih = 0
REMARK ncs = 0
REMARK ===============================================================
REMARK DATE:10-May-04 19:12:31 created by user: chen
REMARK VERSION:1.0
ATOM 1 CA ASP 1 3.438 -3.494 1.284 1.00 0.00
ATOM 2 HA ASP 1 3.012 -3.605 2.270 1.00 0.00
ATOM 3 CB ASP 1 4.101 -2.119 1.173 1.00 0.00
ATOM 4 HB1 ASP 1 3.380 -1.357 1.433 1.00 0.00
ATOM 5 HB2 ASP 1 4.429 -1.966 0.156 1.00 0.00
ATOM 6 CG ASP 1 5.300 -1.979 2.089 1.00 0.00
ATOM 7 OD1 ASP 1 6.211 -2.831 2.010 1.00 0.00
ATOM 8 OD2 ASP 1 5.330 -1.017 2.885 1.00 0.00
ATOM 9 C ASP 1 2.330 -3.628 0.242 1.00 0.00
ATOM 10 O ASP 1 2.573 -4.075 -0.879 1.00 0.00
ATOM 11 N ASP 1 4.480 -4.538 1.098 1.00 0.00
ATOM 12 HT1 ASP 1 5.098 -4.520 1.934 1.00 0.00
ATOM 13 HT2 ASP 1 5.009 -4.306 0.233 1.00 0.00
ATOM 14 HT3 ASP 1 3.998 -5.454 1.010 1.00 0.00
ATOM 15 N PRO 2 1.093 -3.241 0.599 1.00 0.00
ATOM 16 CA PRO 2 -0.052 -3.321 -0.314 1.00 0.00
ATOM 17 HA PRO 2 -0.328 -4.347 -0.511 1.00 0.00
ATOM 18 CB PRO 2 -1.178 -2.626 0.457 1.00 0.00
ATOM 19 HB1 PRO 2 -2.114 -3.129 0.264 1.00 0.00
ATOM 20 HB2 PRO 2 -1.248 -1.594 0.145 1.00 0.00
ATOM 21 CG PRO 2 -0.788 -2.738 1.890 1.00 0.00
ATOM 22 HG1 PRO 2 -1.143 -3.674 2.295 1.00 0.00
ATOM 23 HG2 PRO 2 -1.196 -1.908 2.448 1.00 0.00
ATOM 24 CD PRO 2 0.714 -2.695 1.916 1.00 0.00
ATOM 25 HD1 PRO 2 1.096 -3.315 2.713 1.00 0.00
ATOM 26 HD2 PRO 2 1.061 -1.679 2.026 1.00 0.00

APPENDIX
- 157 -
ATOM 27 C PRO 2 0.212 -2.606 -1.635 1.00 0.00
ATOM 28 O PRO 2 0.255 -3.233 -2.693 1.00 0.00
ATOM 29 N PHE 3 0.389 -1.290 -1.565 1.00 0.00
ATOM 30 HN PHE 3 0.345 -0.848 -0.692 1.00 0.00
ATOM 31 CA PHE 3 0.651 -0.488 -2.755 1.00 0.00
ATOM 32 HA PHE 3 1.276 -1.070 -3.416 1.00 0.00
ATOM 33 CB PHE 3 -0.659 -0.155 -3.472 1.00 0.00
ATOM 34 HB1 PHE 3 -0.434 0.253 -4.447 1.00 0.00
ATOM 35 HB2 PHE 3 -1.199 0.582 -2.896 1.00 0.00
ATOM 36 CG PHE 3 -1.561 -1.341 -3.663 1.00 0.00
ATOM 37 CD1 PHE 3 -1.510 -2.086 -4.830 1.00 0.00
ATOM 38 HD1 PHE 3 -0.814 -1.806 -5.608 1.00 0.00
ATOM 39 CD2 PHE 3 -2.457 -1.711 -2.673 1.00 0.00
ATOM 40 HD2 PHE 3 -2.505 -1.137 -1.759 1.00 0.00
ATOM 41 CE1 PHE 3 -2.338 -3.178 -5.008 1.00 0.00
ATOM 42 HE1 PHE 3 -2.289 -3.750 -5.922 1.00 0.00
ATOM 43 CE2 PHE 3 -3.288 -2.803 -2.845 1.00 0.00
ATOM 44 HE2 PHE 3 -3.982 -3.081 -2.067 1.00 0.00
ATOM 45 CZ PHE 3 -3.228 -3.537 -4.014 1.00 0.00
ATOM 46 HZ PHE 3 -3.876 -4.390 -4.150 1.00 0.00
ATOM 47 C PHE 3 1.383 0.798 -2.390 1.00 0.00
ATOM 48 O PHE 3 2.537 0.997 -2.768 1.00 0.00
ATOM 49 N PHE 4 0.702 1.669 -1.652 1.00 0.00
ATOM 50 HN PHE 4 -0.215 1.452 -1.383 1.00 0.00
ATOM 51 CA PHE 4 1.285 2.938 -1.233 1.00 0.00
ATOM 52 HA PHE 4 2.252 3.029 -1.706 1.00 0.00
ATOM 53 CB PHE 4 0.402 4.103 -1.686 1.00 0.00
ATOM 54 HB1 PHE 4 0.235 4.026 -2.750 1.00 0.00
ATOM 55 HB2 PHE 4 0.908 5.033 -1.474 1.00 0.00
ATOM 56 CG PHE 4 -0.940 4.145 -1.008 1.00 0.00
ATOM 57 CD1 PHE 4 -1.205 5.085 -0.026 1.00 0.00
ATOM 58 HD1 PHE 4 -0.437 5.792 0.252 1.00 0.00
ATOM 59 CD2 PHE 4 -1.935 3.245 -1.355 1.00 0.00
ATOM 60 HD2 PHE 4 -1.739 2.507 -2.119 1.00 0.00
ATOM 61 CE1 PHE 4 -2.437 5.128 0.597 1.00 0.00
ATOM 62 HE1 PHE 4 -2.631 5.866 1.362 1.00 0.00
ATOM 63 CE2 PHE 4 -3.169 3.282 -0.735 1.00 0.00
ATOM 64 HE2 PHE 4 -3.936 2.575 -1.014 1.00 0.00
ATOM 65 CZ PHE 4 -3.421 4.225 0.242 1.00 0.00
ATOM 66 HZ PHE 4 -4.385 4.256 0.728 1.00 0.00
ATOM 67 C PHE 4 1.475 2.983 0.281 1.00 0.00
ATOM 68 O PHE 4 2.338 3.701 0.786 1.00 0.00
ATOM 69 N LEU 5 0.664 2.212 1.002 1.00 0.00
ATOM 70 HN LEU 5 -0.005 1.662 0.545 1.00 0.00

APPENDIX
- 158 -
ATOM 71 CA LEU 5 0.746 2.167 2.458 1.00 0.00
ATOM 72 HA LEU 5 0.523 3.154 2.833 1.00 0.00
ATOM 73 CB LEU 5 -0.281 1.179 3.017 1.00 0.00
ATOM 74 HB1 LEU 5 -0.252 1.234 4.095 1.00 0.00
ATOM 75 HB2 LEU 5 0.009 0.183 2.716 1.00 0.00
ATOM 76 CG LEU 5 -1.724 1.416 2.566 1.00 0.00
ATOM 77 HG LEU 5 -1.748 1.506 1.489 1.00 0.00
ATOM 78 CD1 LEU 5 -2.604 0.241 2.959 1.00 0.00
ATOM 79 HD11 LEU 5 -3.611 0.589 3.137 1.00 0.00
ATOM 80 HD12 LEU 5 -2.216 -0.215 3.858 1.00 0.00
ATOM 81 HD13 LEU 5 -2.611 -0.487 2.161 1.00 0.00
ATOM 82 CD2 LEU 5 -2.261 2.709 3.161 1.00 0.00
ATOM 83 HD21 LEU 5 -2.908 3.193 2.445 1.00 0.00
ATOM 84 HD22 LEU 5 -1.438 3.365 3.402 1.00 0.00
ATOM 85 HD23 LEU 5 -2.820 2.487 4.058 1.00 0.00
ATOM 86 C LEU 5 2.147 1.771 2.914 1.00 0.00
ATOM 87 OT1 LEU 5 2.972 2.680 3.144 1.00 0.00
ATOM 88 OT2 LEU 5 2.407 0.556 3.038 1.00 0.00
END
5.4.3 PDB file for iAβ5inv bound to Aβ1-40
REMARK FILENAME="DPFFL_40_2_anneal_15.pdb"
REMARK The macromolecule has 5 residues
REMARK Accepted structure 14 of 200 structures
REMARK Trial structure 15 of 200 structures
REMARK Molecular dynamics scheme : torsion; torsion; cartesian; minimize
REMARK High temperature dynamics :
REMARK temp: 50000 steps: 1000 time(ps): 15
REMARK 1st cooling stage :
REMARK temp: 50000->0 steps: 1000 time(ps): 15 temp step: 250
REMARK 2nd cooling stage :
REMARK temp: 2000->0 steps: 3000 time(ps): 15 temp step: 25
REMARK a total 2000 steps of minimization
REMARK VDW scale factors 0.1; 0.1->1; 1->4; 1
REMARK 88 NOEs in 1 class(es) with scale factors of 150; 150; 150; 75
REMARK averaging function(s): sum,
REMARK 0 3-bond j-couplings in 0 class(es) with
REMARK scale factor(s) of NA
REMARK 0 1-bond j-couplings in 0 class(es) with
REMARK scale factor(s) of NA
REMARK 0 carbon chemical shifts in 0 class(es) with
REMARK scale factor(s) of NA

APPENDIX
- 159 -
REMARK 0 proton chemical shifts in 0 class(es) with
REMARK scale factor(s) of NA
REMARK 0 diffusion anisotropy restraints in 0 class(es) with
REMARK scale factor(s) of NA
REMARK 0 susceptability anisotropy restraints in 0 class(es) with
REMARK scale factor(s) of NA
REMARK 0 dihedral restraints with scale factors of 100; 200; 200; 400
REMARK 0 planarity restraints with a scale factor of NA
REMARK NCS restraints not used.
REMARK ===============================================================
REMARK bond, angles, improp, vdw(<1.6), dihed
REMARK violations : 0 0 0 0 3
REMARK RMSD : 0.0032 0.665 0.195 26.430
REMARK ===============================================================
REMARK noe, cdih, coup, oneb, carb-a, carb-b,
REMARK violations : 0 0 0 0 0 -----
REMARK RMSD : 0.023 0.000 0.000 0.000 0.000 0.000
REMARK 0.2/2 viol.: 0 0 0
REMARK ===============================================================
REMARK dani, sani
REMARK violations : 0 0
REMARK RMSD : 0.000 0.000
REMARK .2/.1 viol.: 0 0
REMARK ===============================================================
REMARK Protons violations, rmsd
REMARK all : 0 0.000
REMARK class 1: 0 0.000
REMARK class 2: 0 0.000
REMARK class 3: 0 0.000
REMARK class 4: 0 0.000
REMARK ===============================================================
REMARK overall = 22.2014
REMARK bon = 0.950101
REMARK ang = 10.8984
REMARK imp = 0.312197
REMARK vdw = 6.55644
REMARK harm = 0
REMARK noe = 3.48423
REMARK coup = 0
REMARK oneb = 0
REMARK carb = 0
REMARK prot = 0
REMARK dani = 0
REMARK sani = 0

APPENDIX
- 160 -
REMARK cdih = 0
REMARK ncs = 0
REMARK ===============================================================
REMARK DATE:10-May-04 15:23:08 created by user: chen
REMARK VERSION:1.0
ATOM 1 CA ASP 1 -2.930 3.974 -4.516 1.00 0.00
ATOM 2 HA ASP 1 -3.978 3.890 -4.270 1.00 0.00
ATOM 3 CB ASP 1 -2.471 2.689 -5.208 1.00 0.00
ATOM 4 HB1 ASP 1 -1.943 2.072 -4.495 1.00 0.00
ATOM 5 HB2 ASP 1 -1.806 2.943 -6.019 1.00 0.00
ATOM 6 CG ASP 1 -3.629 1.889 -5.771 1.00 0.00
ATOM 7 OD1 ASP 1 -3.490 0.655 -5.902 1.00 0.00
ATOM 8 OD2 ASP 1 -4.675 2.497 -6.080 1.00 0.00
ATOM 9 C ASP 1 -2.133 4.198 -3.233 1.00 0.00
ATOM 10 O ASP 1 -1.313 5.113 -3.153 1.00 0.00
ATOM 11 N ASP 1 -2.756 5.108 -5.461 1.00 0.00
ATOM 12 HT1 ASP 1 -1.741 5.323 -5.516 1.00 0.00
ATOM 13 HT2 ASP 1 -3.293 5.918 -5.087 1.00 0.00
ATOM 14 HT3 ASP 1 -3.125 4.809 -6.386 1.00 0.00
ATOM 15 N PRO 2 -2.366 3.361 -2.208 1.00 0.00
ATOM 16 CA PRO 2 -1.670 3.469 -0.927 1.00 0.00
ATOM 17 HA PRO 2 -1.574 4.497 -0.612 1.00 0.00
ATOM 18 CB PRO 2 -2.603 2.722 0.025 1.00 0.00
ATOM 19 HB1 PRO 2 -3.333 3.407 0.429 1.00 0.00
ATOM 20 HB2 PRO 2 -2.031 2.283 0.828 1.00 0.00
ATOM 21 CG PRO 2 -3.249 1.678 -0.820 1.00 0.00
ATOM 22 HG1 PRO 2 -4.240 1.468 -0.445 1.00 0.00
ATOM 23 HG2 PRO 2 -2.649 0.779 -0.812 1.00 0.00
ATOM 24 CD PRO 2 -3.329 2.241 -2.218 1.00 0.00
ATOM 25 HD1 PRO 2 -4.328 2.597 -2.424 1.00 0.00
ATOM 26 HD2 PRO 2 -3.039 1.494 -2.941 1.00 0.00
ATOM 27 C PRO 2 -0.291 2.815 -0.962 1.00 0.00
ATOM 28 O PRO 2 0.269 2.590 -2.034 1.00 0.00
ATOM 29 N PHE 3 0.249 2.515 0.217 1.00 0.00
ATOM 30 HN PHE 3 -0.248 2.723 1.034 1.00 0.00
ATOM 31 CA PHE 3 1.561 1.886 0.332 1.00 0.00
ATOM 32 HA PHE 3 2.290 2.580 -0.047 1.00 0.00
ATOM 33 CB PHE 3 1.879 1.608 1.811 1.00 0.00
ATOM 34 HB1 PHE 3 2.114 2.544 2.297 1.00 0.00
ATOM 35 HB2 PHE 3 2.738 0.958 1.868 1.00 0.00
ATOM 36 CG PHE 3 0.757 0.955 2.584 1.00 0.00
ATOM 37 CD1 PHE 3 0.817 0.871 3.966 1.00 0.00
ATOM 38 HD1 PHE 3 1.668 1.284 4.485 1.00 0.00
ATOM 39 CD2 PHE 3 -0.346 0.416 1.935 1.00 0.00

APPENDIX
- 161 -
ATOM 40 HD2 PHE 3 -0.408 0.471 0.859 1.00 0.00
ATOM 41 CE1 PHE 3 -0.197 0.265 4.683 1.00 0.00
ATOM 42 HE1 PHE 3 -0.137 0.206 5.760 1.00 0.00
ATOM 43 CE2 PHE 3 -1.362 -0.186 2.646 1.00 0.00
ATOM 44 HE2 PHE 3 -2.212 -0.598 2.125 1.00 0.00
ATOM 45 CZ PHE 3 -1.288 -0.264 4.022 1.00 0.00
ATOM 46 HZ PHE 3 -2.080 -0.740 4.579 1.00 0.00
ATOM 47 C PHE 3 1.645 0.603 -0.510 1.00 0.00
ATOM 48 O PHE 3 1.649 0.661 -1.739 1.00 0.00
ATOM 49 N PHE 4 1.727 -0.548 0.149 1.00 0.00
ATOM 50 HN PHE 4 1.735 -0.539 1.121 1.00 0.00
ATOM 51 CA PHE 4 1.826 -1.828 -0.547 1.00 0.00
ATOM 52 HA PHE 4 2.210 -1.637 -1.529 1.00 0.00
ATOM 53 CB PHE 4 2.789 -2.758 0.195 1.00 0.00
ATOM 54 HB1 PHE 4 3.369 -3.317 -0.524 1.00 0.00
ATOM 55 HB2 PHE 4 2.221 -3.444 0.806 1.00 0.00
ATOM 56 CG PHE 4 3.740 -2.028 1.092 1.00 0.00
ATOM 57 CD1 PHE 4 4.487 -0.973 0.605 1.00 0.00
ATOM 58 HD1 PHE 4 4.390 -0.687 -0.428 1.00 0.00
ATOM 59 CD2 PHE 4 3.874 -2.385 2.422 1.00 0.00
ATOM 60 HD2 PHE 4 3.294 -3.204 2.815 1.00 0.00
ATOM 61 CE1 PHE 4 5.352 -0.287 1.422 1.00 0.00
ATOM 62 HE1 PHE 4 5.925 0.535 1.026 1.00 0.00
ATOM 63 CE2 PHE 4 4.741 -1.703 3.246 1.00 0.00
ATOM 64 HE2 PHE 4 4.840 -1.991 4.281 1.00 0.00
ATOM 65 CZ PHE 4 5.481 -0.653 2.745 1.00 0.00
ATOM 66 HZ PHE 4 6.156 -0.119 3.385 1.00 0.00
ATOM 67 C PHE 4 0.463 -2.494 -0.666 1.00 0.00
ATOM 68 O PHE 4 0.141 -3.112 -1.681 1.00 0.00
ATOM 69 N LEU 5 -0.322 -2.366 0.387 1.00 0.00
ATOM 70 HN LEU 5 0.008 -1.865 1.157 1.00 0.00
ATOM 71 CA LEU 5 -1.656 -2.954 0.437 1.00 0.00
ATOM 72 HA LEU 5 -1.625 -3.887 -0.103 1.00 0.00
ATOM 73 CB LEU 5 -2.059 -3.237 1.889 1.00 0.00
ATOM 74 HB1 LEU 5 -2.614 -4.162 1.911 1.00 0.00
ATOM 75 HB2 LEU 5 -2.709 -2.440 2.221 1.00 0.00
ATOM 76 CG LEU 5 -0.895 -3.354 2.880 1.00 0.00
ATOM 77 HG LEU 5 -0.401 -2.398 2.959 1.00 0.00
ATOM 78 CD1 LEU 5 -1.402 -3.729 4.260 1.00 0.00
ATOM 79 HD11 LEU 5 -2.056 -4.585 4.183 1.00 0.00
ATOM 80 HD12 LEU 5 -1.944 -2.897 4.682 1.00 0.00
ATOM 81 HD13 LEU 5 -0.563 -3.972 4.895 1.00 0.00
ATOM 82 CD2 LEU 5 0.125 -4.371 2.392 1.00 0.00
ATOM 83 HD21 LEU 5 -0.045 -4.582 1.347 1.00 0.00

APPENDIX
- 162 -
ATOM 84 HD22 LEU 5 0.027 -5.282 2.964 1.00 0.00
ATOM 85 HD23 LEU 5 1.120 -3.971 2.521 1.00 0.00
ATOM 86 C LEU 5 -2.682 -2.038 -0.225 1.00 0.00
ATOM 87 OT1 LEU 5 -3.828 -1.977 0.268 1.00 0.00
ATOM 88 OT2 LEU 5 -2.329 -1.389 -1.232 1.00 0.00
END