nitrogen mineralization characteristics of disturbed and undisturbed soil samples for four main soil...
TRANSCRIPT
This article was downloaded by: [The Aga Khan University]On: 10 October 2014, At: 12:46Publisher: Taylor & FrancisInforma Ltd Registered in England and Wales Registered Number: 1072954 Registeredoffice: Mortimer House, 37-41 Mortimer Street, London W1T 3JH, UK
Communications in Soil Science andPlant AnalysisPublication details, including instructions for authors andsubscription information:http://www.tandfonline.com/loi/lcss20
Nitrogen Mineralization Characteristicsof Disturbed and Undisturbed SoilSamples for Four Main Soil Types on theLoess PlateauShi-Qing Li a b , Kun Zhao a b & Hong-Ling Lu ca State Key Laboratory of Soil Erosion and Dryland Farming on theLoess Plateau , Northwest A&F University , Yangling , Chinab College of Resources and Environmental Sciences , Northwest A&FUniversity , Yangling , Chinac Science and Technical Information Research Institute , HunanAcademy of Agricultural Sciences , Changsha , ChinaAccepted author version posted online: 25 Mar 2013.Publishedonline: 06 Jun 2013.
To cite this article: Shi-Qing Li , Kun Zhao & Hong-Ling Lu (2013) Nitrogen MineralizationCharacteristics of Disturbed and Undisturbed Soil Samples for Four Main Soil Types on theLoess Plateau, Communications in Soil Science and Plant Analysis, 44:11, 1659-1673, DOI:10.1080/00103624.2013.783056
To link to this article: http://dx.doi.org/10.1080/00103624.2013.783056
PLEASE SCROLL DOWN FOR ARTICLE
Taylor & Francis makes every effort to ensure the accuracy of all the information (the“Content”) contained in the publications on our platform. However, Taylor & Francis,our agents, and our licensors make no representations or warranties whatsoever as tothe accuracy, completeness, or suitability for any purpose of the Content. Any opinionsand views expressed in this publication are the opinions and views of the authors,and are not the views of or endorsed by Taylor & Francis. The accuracy of the Contentshould not be relied upon and should be independently verified with primary sourcesof information. Taylor and Francis shall not be liable for any losses, actions, claims,proceedings, demands, costs, expenses, damages, and other liabilities whatsoever orhowsoever caused arising directly or indirectly in connection with, in relation to or arisingout of the use of the Content.
This article may be used for research, teaching, and private study purposes. Anysubstantial or systematic reproduction, redistribution, reselling, loan, sub-licensing,

systematic supply, or distribution in any form to anyone is expressly forbidden. Terms &Conditions of access and use can be found at http://www.tandfonline.com/page/terms-and-conditions
Dow
nloa
ded
by [
The
Aga
Kha
n U
nive
rsity
] at
12:
46 1
0 O
ctob
er 2
014
Communications in Soil Science and Plant Analysis, 44:1659–1673, 2013Copyright © Taylor & Francis Group, LLCISSN: 0010-3624 print / 1532-2416 onlineDOI: 10.1080/00103624.2013.783056
Nitrogen Mineralization Characteristicsof Disturbed and Undisturbed Soil Samples
for Four Main Soil Types on the Loess Plateau
SHI-QING LI,1,2 KUN ZHAO,1,2 AND HONG-LING LU3
1State Key Laboratory of Soil Erosion and Dryland Farming on the Loess Plateau,Northwest A&F University, Yangling, China2College of Resources and Environmental Sciences, Northwest A&F University,Yangling, China3Science and Technical Information Research Institute, Hunan Academy ofAgricultural Sciences, Changsha, China
Long-term alternate leaching aerobic incubation was conducted to study nitrogen (N)mineralization in four main soil types under disturbed (D) and undisturbed (UD) con-ditions from the Loess Plateau (China). Results showed that N mineralization of theUD and D samples decreased from southern to northern Shaanxi Province. Nitrate wasthe main component of N mineralization during the aerobic incubation for both the Dand UD samples. However, net inorganic N in the D samples was less than in UD sam-ples. The average total mineralized N levels were 30% larger for the set of D samplesthan for the UD samples, and the mineralization potential of the D samples was largerthan that of UD samples. Further studies are required to develop predictive methodsfor quantifying N availability.
Keywords Alternate leaching incubation, Loess Plateau, nitrification, nitrogenmineralization, potential, rate constant, soil type
Introduction
Knowledge of the quantity of nitrogen (N) mineralization from soil organic matter isimportant for improving the efficiency of N fertilization and reducing the risk of water andatmospheric pollution. A wide variety of chemical and biological methods have been usedto assess N mineralization in the laboratory or in situ (Binkley and Hart 1989). In addi-tion to laboratory incubations under defined conditions, experiments have been performedin the field to assess the effects of ambient environmental factors on N mineralization.However, these effects proved difficult to quantify because of the large number of variables(temperature, water, soil structure, C availability). Therefore, it is important to establish alaboratory method that accurately predicts N mineralization under field conditions.
Stanford and Smith (1972) developed an incubation method that used disturbed, dried,and rewetted soil samples at 35 ◦C, known as the alternate leaching aerobic incubation
Received 21 July 2011; accepted 14 March 2012.Address correspondence to Shi-Qing Li, State Key Laboratory of Soil Erosion and Dryland
Farming on the Loess Plateau, Northwest A&F University, Yangling 712100, China. E-mail: [email protected]
1659
Dow
nloa
ded
by [
The
Aga
Kha
n U
nive
rsity
] at
12:
46 1
0 O
ctob
er 2
014
1660 S.-Q. Li, K. Zhao, and H.-L. Lu
method. Their results suggested that N mineralization follows first-order (exponential)kinetics for a wide variety of soils according to the following equation:
Nm = N0(1 − e−kt) (1)
where k is the first-order rate constant, N0 is the initial pool of available N (i.e.,mineralization potential), and Nm is the amount of mineralized N.
They also discovered that whereas k did not vary significantly between different soils[(k = 0.054 ± 0.009 week−1), N0 varied widely (5–41% of Nm)]. Many studies have indi-cated that N0 and k reflect the potential N-supplying capacity of soil (Wang 1986; Tao, Wu,and Fang 1993). Although the alternate leaching incubation procedure and first-order rateequation have been used in many studies (e.g., Nordmeyer and Richter 1985; Ye, Zhang,and Li 2001; Li et al. 2003; Nuske and Richter 1981), criticism has arisen concerningmathematical as well as experimental aspects of parameter estimation (Skjemstad, Vallis,and Myers 1988). However, Li et al. (1992) proposed that the long-term alternate leachingaerobic incubation method had several advantages: There was no need to add water duringthe incubation period, and toxic substances and nitrate (NO3)-N formed during incubationmay be removed by leaching. Moreover, the method can be used to determine current soilN-supplying levels and potential. Several reports have revealed difference in N mineral-ization between disturbed (D) and undisturbed (UD) soil samples. Nordmeyer and Richter(1985) observed that N mineralization increased nearly linearly with time in UD soil sam-ples, whereas for D soil samples a mineralization flush was evident during the first 20 daysof incubation, which indicated that disturbance had a strong influence on subsequent Nmineralization. Cabrera and Kissel (1988) obtained results for D soil samples that con-siderably overestimated N mineralization, possibly because of the pretreatment of the soilsamples prior to incubation. Drying and rewetting of soil is known to induce a flush of Nmineralization (Cabrera 1993; Ju and Li 1997). Also, physical disruption of soil aggregatesupon sieving enhances N mineralization. Mineralization rates have been shown to decreasewith successive incubation periods in UD soil samples (Sierra 1992), which may indicatethat a mineralization–immobilization process occurs in soil micro sites.
Several studies on N mineralization have been conducted on the Loess Plateau inChina and have focused on disturbed soil samples (e.g., Fu and Li 1992; Jin et al. 2007).However, there is little information about soil N mineralization in undisturbed soil sam-ples from the Loess Plateau. The principal aims of this work are summarized as follows:(1) to compare soil N mineralization characteristics of D and UD soil samples for differ-ent soil types and (2) to compare two different methods for estimating N mineralizationand assess the suitability of these long-term laboratory methods for the prediction of net Nmineralization under field conditions.
Materials and Methods
Study Site and Soil Sampling
The work was undertaken on soils from several locations in the Loess Plateau, rangingfrom the semi-arid area in the north to the subhumid region in the south. The averageannual temperature is 3.6–14.3 ◦C and the annual mean precipitation rate is 150–750 mm.Soil samples from the tillage layer (0–20 cm) at 11 sites between the north (Shenmu) andsouth (Yangling), in the province of Shaanxi were used. The selected plots at these 11 sites
Dow
nloa
ded
by [
The
Aga
Kha
n U
nive
rsity
] at
12:
46 1
0 O
ctob
er 2
014
Nitrogen Mineralization of Disturbed Soils 1661
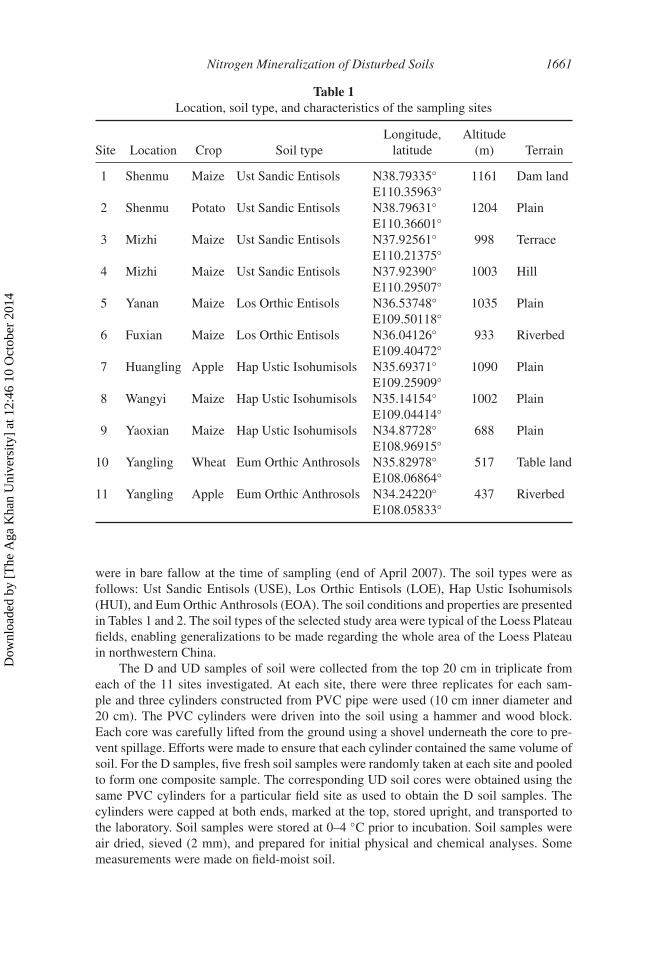
Table 1Location, soil type, and characteristics of the sampling sites
Site Location Crop Soil typeLongitude,
latitudeAltitude
(m) Terrain
1 Shenmu Maize Ust Sandic Entisols N38.79335◦E110.35963◦
1161 Dam land
2 Shenmu Potato Ust Sandic Entisols N38.79631◦E110.36601◦
1204 Plain
3 Mizhi Maize Ust Sandic Entisols N37.92561◦E110.21375◦
998 Terrace
4 Mizhi Maize Ust Sandic Entisols N37.92390◦E110.29507◦
1003 Hill
5 Yanan Maize Los Orthic Entisols N36.53748◦E109.50118◦
1035 Plain
6 Fuxian Maize Los Orthic Entisols N36.04126◦E109.40472◦
933 Riverbed
7 Huangling Apple Hap Ustic Isohumisols N35.69371◦E109.25909◦
1090 Plain
8 Wangyi Maize Hap Ustic Isohumisols N35.14154◦E109.04414◦
1002 Plain
9 Yaoxian Maize Hap Ustic Isohumisols N34.87728◦E108.96915◦
688 Plain
10 Yangling Wheat Eum Orthic Anthrosols N35.82978◦E108.06864◦
517 Table land
11 Yangling Apple Eum Orthic Anthrosols N34.24220◦E108.05833◦
437 Riverbed
were in bare fallow at the time of sampling (end of April 2007). The soil types were asfollows: Ust Sandic Entisols (USE), Los Orthic Entisols (LOE), Hap Ustic Isohumisols(HUI), and Eum Orthic Anthrosols (EOA). The soil conditions and properties are presentedin Tables 1 and 2. The soil types of the selected study area were typical of the Loess Plateaufields, enabling generalizations to be made regarding the whole area of the Loess Plateauin northwestern China.
The D and UD samples of soil were collected from the top 20 cm in triplicate fromeach of the 11 sites investigated. At each site, there were three replicates for each sam-ple and three cylinders constructed from PVC pipe were used (10 cm inner diameter and20 cm). The PVC cylinders were driven into the soil using a hammer and wood block.Each core was carefully lifted from the ground using a shovel underneath the core to pre-vent spillage. Efforts were made to ensure that each cylinder contained the same volume ofsoil. For the D samples, five fresh soil samples were randomly taken at each site and pooledto form one composite sample. The corresponding UD soil cores were obtained using thesame PVC cylinders for a particular field site as used to obtain the D soil samples. Thecylinders were capped at both ends, marked at the top, stored upright, and transported tothe laboratory. Soil samples were stored at 0–4 ◦C prior to incubation. Soil samples wereair dried, sieved (2 mm), and prepared for initial physical and chemical analyses. Somemeasurements were made on field-moist soil.
Dow
nloa
ded
by [
The
Aga
Kha
n U
nive
rsity
] at
12:
46 1
0 O
ctob
er 2
014
1662 S.-Q. Li, K. Zhao, and H.-L. Lu
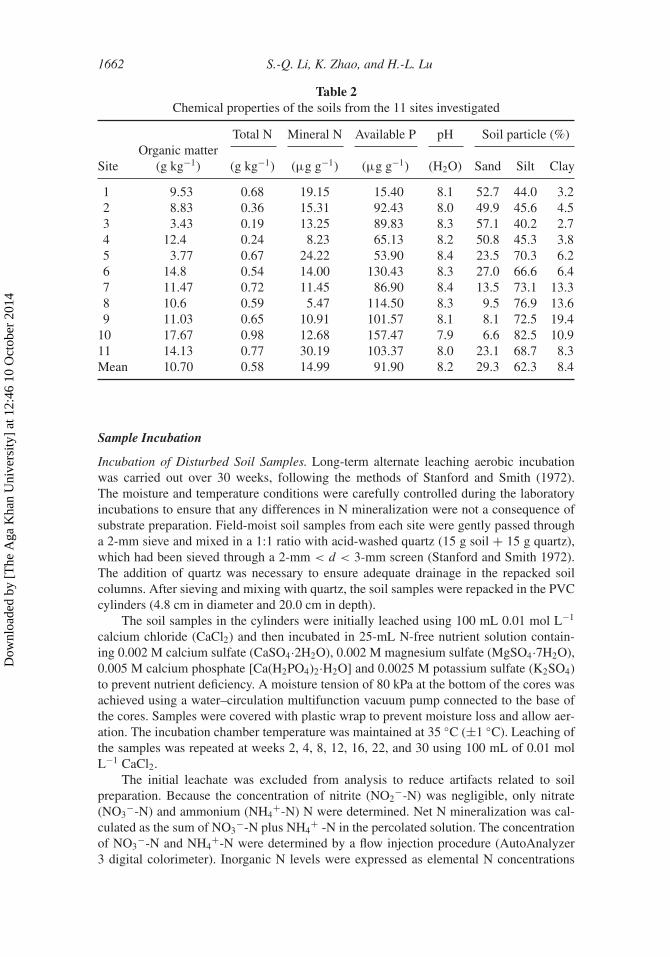
Table 2Chemical properties of the soils from the 11 sites investigated
Total N Mineral N Available P pH Soil particle (%)
SiteOrganic matter
(g kg−1) (g kg−1) (µg g−1) (µg g−1) (H2O) Sand Silt Clay
1 9.53 0.68 19.15 15.40 8.1 52.7 44.0 3.22 8.83 0.36 15.31 92.43 8.0 49.9 45.6 4.53 3.43 0.19 13.25 89.83 8.3 57.1 40.2 2.74 12.4 0.24 8.23 65.13 8.2 50.8 45.3 3.85 3.77 0.67 24.22 53.90 8.4 23.5 70.3 6.26 14.8 0.54 14.00 130.43 8.3 27.0 66.6 6.47 11.47 0.72 11.45 86.90 8.4 13.5 73.1 13.38 10.6 0.59 5.47 114.50 8.3 9.5 76.9 13.69 11.03 0.65 10.91 101.57 8.1 8.1 72.5 19.4
10 17.67 0.98 12.68 157.47 7.9 6.6 82.5 10.911 14.13 0.77 30.19 103.37 8.0 23.1 68.7 8.3Mean 10.70 0.58 14.99 91.90 8.2 29.3 62.3 8.4
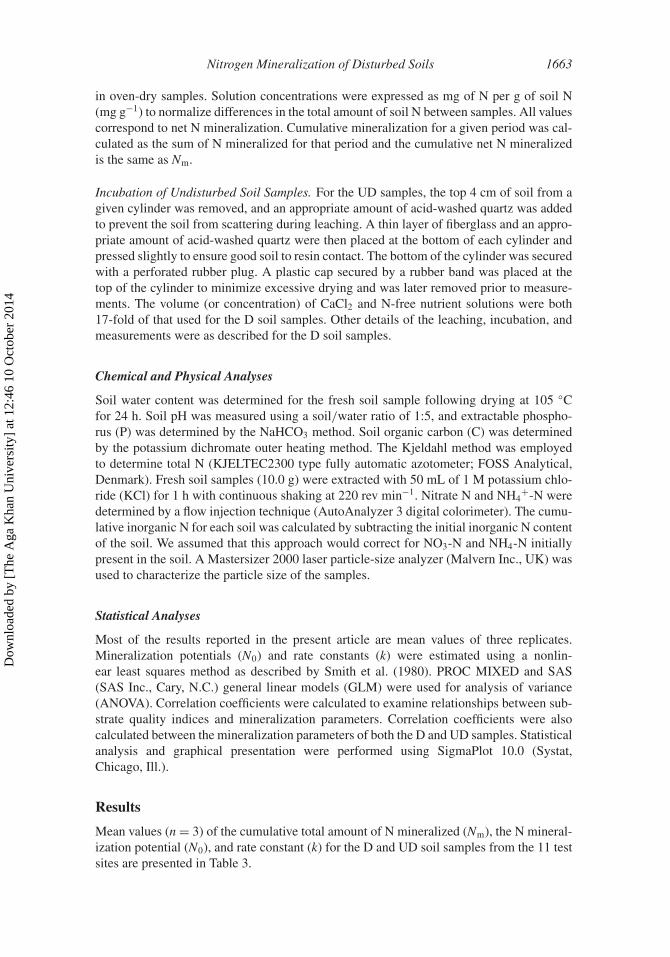
Sample Incubation
Incubation of Disturbed Soil Samples. Long-term alternate leaching aerobic incubationwas carried out over 30 weeks, following the methods of Stanford and Smith (1972).The moisture and temperature conditions were carefully controlled during the laboratoryincubations to ensure that any differences in N mineralization were not a consequence ofsubstrate preparation. Field-moist soil samples from each site were gently passed througha 2-mm sieve and mixed in a 1:1 ratio with acid-washed quartz (15 g soil + 15 g quartz),which had been sieved through a 2-mm < d < 3-mm screen (Stanford and Smith 1972).The addition of quartz was necessary to ensure adequate drainage in the repacked soilcolumns. After sieving and mixing with quartz, the soil samples were repacked in the PVCcylinders (4.8 cm in diameter and 20.0 cm in depth).
The soil samples in the cylinders were initially leached using 100 mL 0.01 mol L−1
calcium chloride (CaCl2) and then incubated in 25-mL N-free nutrient solution contain-ing 0.002 M calcium sulfate (CaSO4·2H2O), 0.002 M magnesium sulfate (MgSO4·7H2O),0.005 M calcium phosphate [Ca(H2PO4)2·H2O] and 0.0025 M potassium sulfate (K2SO4)to prevent nutrient deficiency. A moisture tension of 80 kPa at the bottom of the cores wasachieved using a water–circulation multifunction vacuum pump connected to the base ofthe cores. Samples were covered with plastic wrap to prevent moisture loss and allow aer-ation. The incubation chamber temperature was maintained at 35 ◦C (±1 ◦C). Leaching ofthe samples was repeated at weeks 2, 4, 8, 12, 16, 22, and 30 using 100 mL of 0.01 molL−1 CaCl2.
The initial leachate was excluded from analysis to reduce artifacts related to soilpreparation. Because the concentration of nitrite (NO2
−-N) was negligible, only nitrate(NO3
−-N) and ammonium (NH4+-N) N were determined. Net N mineralization was cal-
culated as the sum of NO3−-N plus NH4
+ -N in the percolated solution. The concentrationof NO3
−-N and NH4+-N were determined by a flow injection procedure (AutoAnalyzer
3 digital colorimeter). Inorganic N levels were expressed as elemental N concentrations
Dow
nloa
ded
by [
The
Aga
Kha
n U
nive
rsity
] at
12:
46 1
0 O
ctob
er 2
014
Nitrogen Mineralization of Disturbed Soils 1663
in oven-dry samples. Solution concentrations were expressed as mg of N per g of soil N(mg g−1) to normalize differences in the total amount of soil N between samples. All valuescorrespond to net N mineralization. Cumulative mineralization for a given period was cal-culated as the sum of N mineralized for that period and the cumulative net N mineralizedis the same as Nm.
Incubation of Undisturbed Soil Samples. For the UD samples, the top 4 cm of soil from agiven cylinder was removed, and an appropriate amount of acid-washed quartz was addedto prevent the soil from scattering during leaching. A thin layer of fiberglass and an appro-priate amount of acid-washed quartz were then placed at the bottom of each cylinder andpressed slightly to ensure good soil to resin contact. The bottom of the cylinder was securedwith a perforated rubber plug. A plastic cap secured by a rubber band was placed at thetop of the cylinder to minimize excessive drying and was later removed prior to measure-ments. The volume (or concentration) of CaCl2 and N-free nutrient solutions were both17-fold of that used for the D soil samples. Other details of the leaching, incubation, andmeasurements were as described for the D soil samples.
Chemical and Physical Analyses
Soil water content was determined for the fresh soil sample following drying at 105 ◦Cfor 24 h. Soil pH was measured using a soil/water ratio of 1:5, and extractable phospho-rus (P) was determined by the NaHCO3 method. Soil organic carbon (C) was determinedby the potassium dichromate outer heating method. The Kjeldahl method was employedto determine total N (KJELTEC2300 type fully automatic azotometer; FOSS Analytical,Denmark). Fresh soil samples (10.0 g) were extracted with 50 mL of 1 M potassium chlo-ride (KCl) for 1 h with continuous shaking at 220 rev min−1. Nitrate N and NH4
+-N weredetermined by a flow injection technique (AutoAnalyzer 3 digital colorimeter). The cumu-lative inorganic N for each soil was calculated by subtracting the initial inorganic N contentof the soil. We assumed that this approach would correct for NO3-N and NH4-N initiallypresent in the soil. A Mastersizer 2000 laser particle-size analyzer (Malvern Inc., UK) wasused to characterize the particle size of the samples.
Statistical Analyses
Most of the results reported in the present article are mean values of three replicates.Mineralization potentials (N0) and rate constants (k) were estimated using a nonlin-ear least squares method as described by Smith et al. (1980). PROC MIXED and SAS(SAS Inc., Cary, N.C.) general linear models (GLM) were used for analysis of variance(ANOVA). Correlation coefficients were calculated to examine relationships between sub-strate quality indices and mineralization parameters. Correlation coefficients were alsocalculated between the mineralization parameters of both the D and UD samples. Statisticalanalysis and graphical presentation were performed using SigmaPlot 10.0 (Systat,Chicago, Ill.).
Results
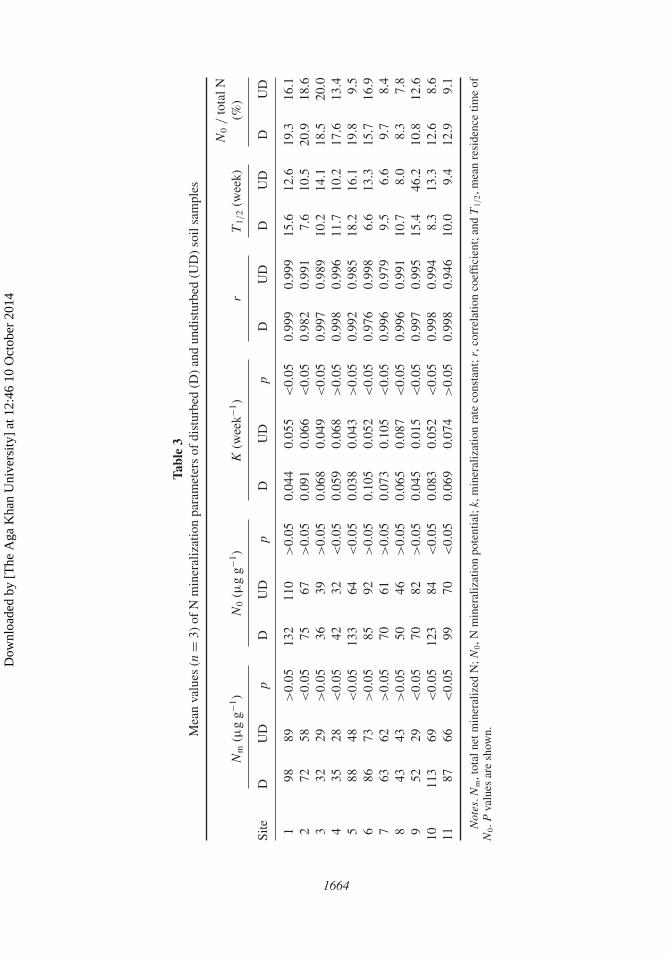
Mean values (n = 3) of the cumulative total amount of N mineralized (Nm), the N mineral-ization potential (N0), and rate constant (k) for the D and UD soil samples from the 11 testsites are presented in Table 3.
Dow
nloa
ded
by [
The
Aga
Kha
n U
nive
rsity
] at
12:
46 1
0 O
ctob
er 2
014
Tabl
e3
Mea
nva
lues
(n=
3)of
Nm
iner
aliz
atio
npa
ram
eter
sof
dist
urbe
d(D
)an
dun
dist
urbe
d(U
D)
soil
sam
ples
Nm
(µg
g−1)
N0
(µg
g−1)
K(w
eek−1
)r
T1/
2(w
eek)
N0/
tota
lN(%
)
Site
DU
Dp
DU
Dp
DU
Dp
DU
DD
UD
DU
D
198
89>
0.05
132
110
>0.
050.
044
0.05
5<
0.05
0.99
90.
999
15.6
12.6
19.3
16.1
272
58<
0.05
7567
>0.
050.
091
0.06
6<
0.05
0.98
20.
991
7.6
10.5
20.9
18.6
332
29>
0.05
3639
>0.
050.
068
0.04
9<
0.05
0.99
70.
989
10.2
14.1
18.5
20.0
435
28<
0.05
4232
<0.
050.
059
0.06
8>
0.05
0.99
80.
996
11.7
10.2
17.6
13.4
588
48<
0.05
133
64<
0.05
0.03
80.
043
>0.
050.
992
0.98
518
.216
.119
.89.
56
8673
>0.
0585
92>
0.05
0.10
50.
052
<0.
050.
976
0.99
86.
613
.315
.716
.97
6362
>0.
0570
61>
0.05
0.07
30.
105
<0.
050.
996
0.97
99.
56.
69.
78.
48
4343
>0.
0550
46>
0.05
0.06
50.
087
<0.
050.
996
0.99
110
.78.
08.
37.
89
5229
<0.
0570
82>
0.05
0.04
50.
015
<0.
050.
997
0.99
515
.446
.210
.812
.610
113
69<
0.05
123
84<
0.05
0.08
30.
052
<0.
050.
998
0.99
48.
313
.312
.68.
611
8766
<0.
0599
70<
0.05
0.06
90.
074
>0.
050.
998
0.94
610
.09.
412
.99.
1
Not
es.N
m,t
otal
netm
iner
aliz
edN
;N0,N
min
eral
izat
ion
pote
ntia
l;k,
min
eral
izat
ion
rate
cons
tant
;r,c
orre
latio
nco
effic
ient
;and
T1/
2,m
ean
resi
denc
etim
eof
N0.P
valu
esar
esh
own.
1664
Dow
nloa
ded
by [
The
Aga
Kha
n U
nive
rsity
] at
12:
46 1
0 O
ctob
er 2
014
Nitrogen Mineralization of Disturbed Soils 1665
Incubation of Disturbed Soil
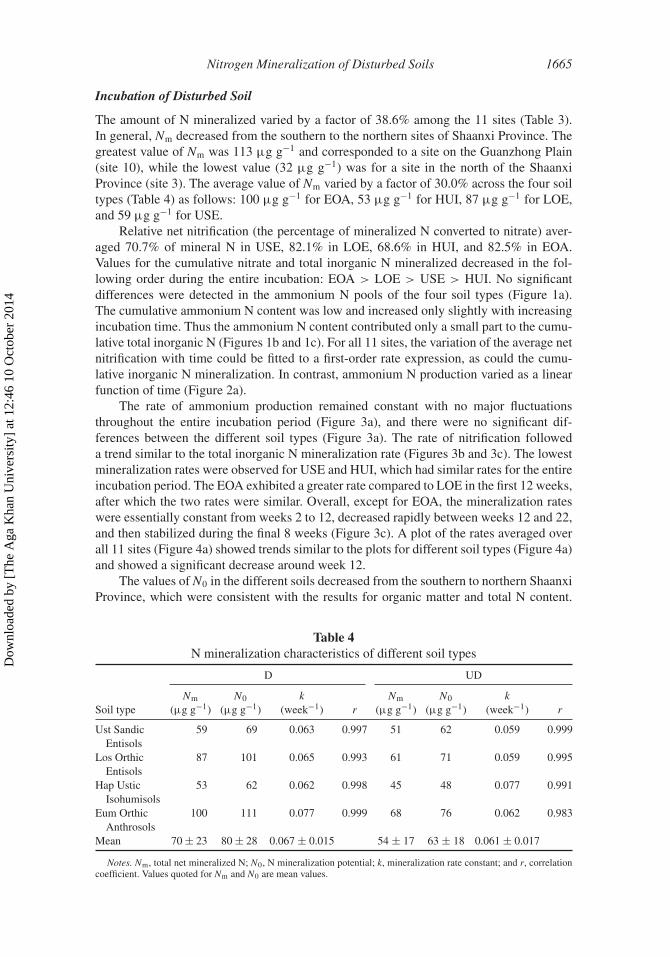
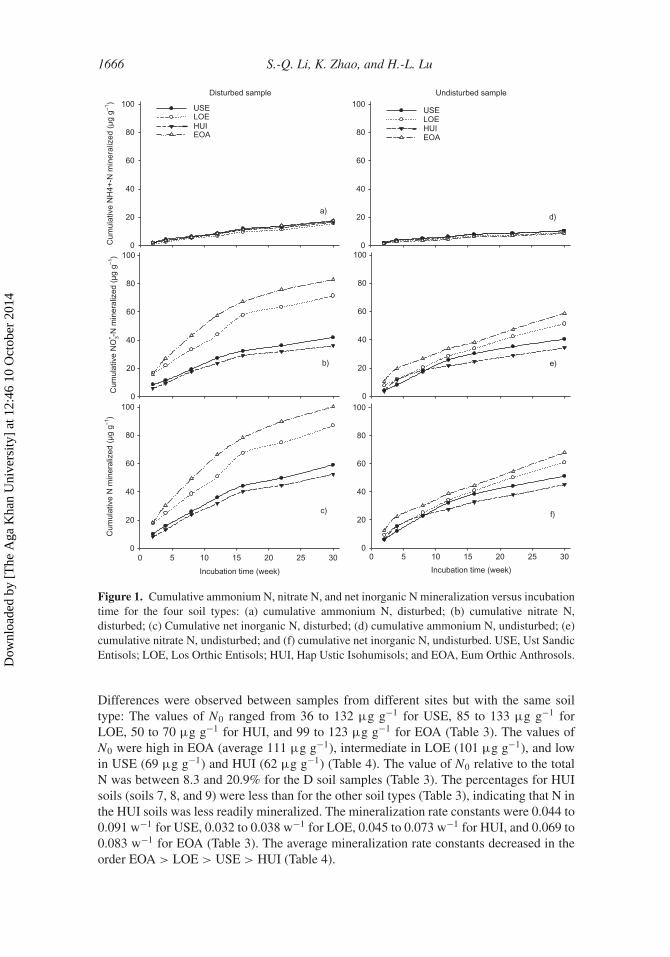
The amount of N mineralized varied by a factor of 38.6% among the 11 sites (Table 3).In general, Nm decreased from the southern to the northern sites of Shaanxi Province. Thegreatest value of Nm was 113 µg g−1 and corresponded to a site on the Guanzhong Plain(site 10), while the lowest value (32 µg g−1) was for a site in the north of the ShaanxiProvince (site 3). The average value of Nm varied by a factor of 30.0% across the four soiltypes (Table 4) as follows: 100 µg g−1 for EOA, 53 µg g−1 for HUI, 87 µg g−1 for LOE,and 59 µg g−1 for USE.
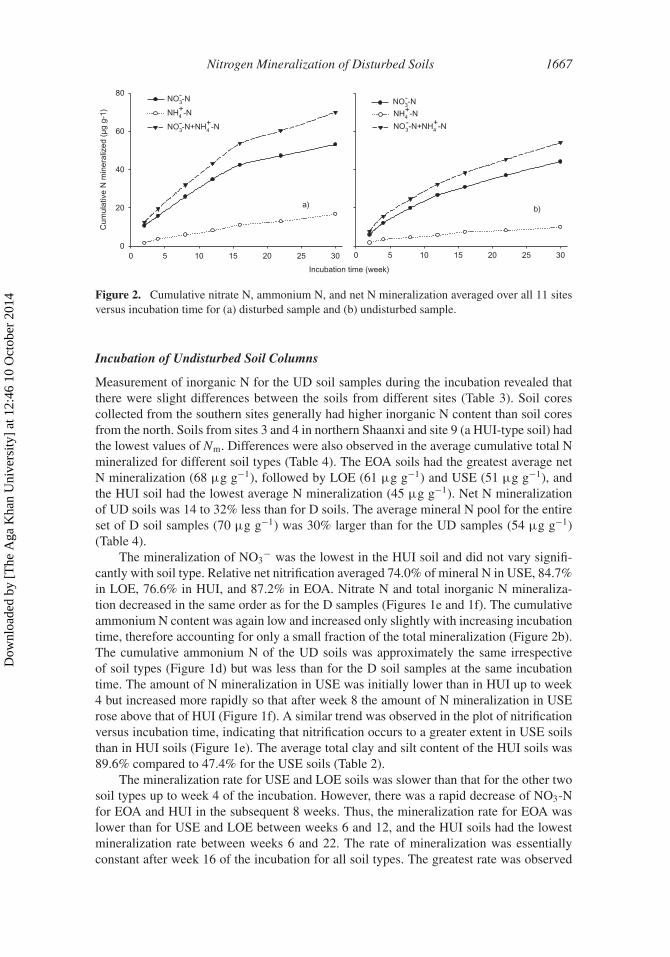
Relative net nitrification (the percentage of mineralized N converted to nitrate) aver-aged 70.7% of mineral N in USE, 82.1% in LOE, 68.6% in HUI, and 82.5% in EOA.Values for the cumulative nitrate and total inorganic N mineralized decreased in the fol-lowing order during the entire incubation: EOA > LOE > USE > HUI. No significantdifferences were detected in the ammonium N pools of the four soil types (Figure 1a).The cumulative ammonium N content was low and increased only slightly with increasingincubation time. Thus the ammonium N content contributed only a small part to the cumu-lative total inorganic N (Figures 1b and 1c). For all 11 sites, the variation of the average netnitrification with time could be fitted to a first-order rate expression, as could the cumu-lative inorganic N mineralization. In contrast, ammonium N production varied as a linearfunction of time (Figure 2a).
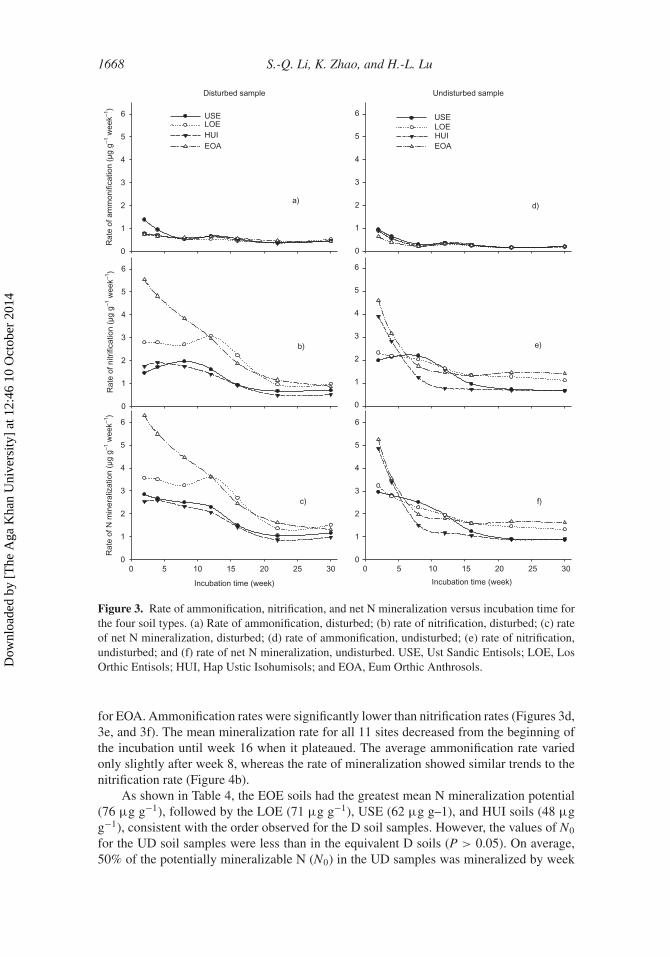
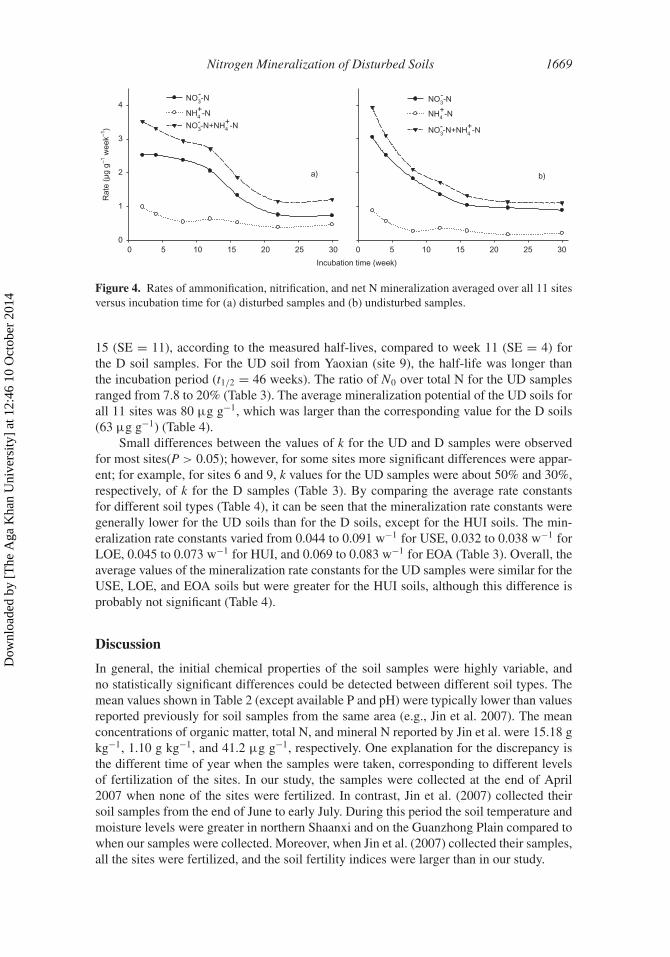
The rate of ammonium production remained constant with no major fluctuationsthroughout the entire incubation period (Figure 3a), and there were no significant dif-ferences between the different soil types (Figure 3a). The rate of nitrification followeda trend similar to the total inorganic N mineralization rate (Figures 3b and 3c). The lowestmineralization rates were observed for USE and HUI, which had similar rates for the entireincubation period. The EOA exhibited a greater rate compared to LOE in the first 12 weeks,after which the two rates were similar. Overall, except for EOA, the mineralization rateswere essentially constant from weeks 2 to 12, decreased rapidly between weeks 12 and 22,and then stabilized during the final 8 weeks (Figure 3c). A plot of the rates averaged overall 11 sites (Figure 4a) showed trends similar to the plots for different soil types (Figure 4a)and showed a significant decrease around week 12.
The values of N0 in the different soils decreased from the southern to northern ShaanxiProvince, which were consistent with the results for organic matter and total N content.
Table 4N mineralization characteristics of different soil types
D UD
Soil typeNm
(µg g−1)N0
(µg g−1)k
(week−1) rNm
(µg g−1)N0
(µg g−1)k
(week−1) r
Ust SandicEntisols
59 69 0.063 0.997 51 62 0.059 0.999
Los OrthicEntisols
87 101 0.065 0.993 61 71 0.059 0.995
Hap UsticIsohumisols
53 62 0.062 0.998 45 48 0.077 0.991
Eum OrthicAnthrosols
100 111 0.077 0.999 68 76 0.062 0.983
Mean 70 ± 23 80 ± 28 0.067 ± 0.015 54 ± 17 63 ± 18 0.061 ± 0.017
Notes. Nm, total net mineralized N; N0, N mineralization potential; k, mineralization rate constant; and r, correlationcoefficient. Values quoted for Nm and N0 are mean values.
Dow
nloa
ded
by [
The
Aga
Kha
n U
nive
rsity
] at
12:
46 1
0 O
ctob
er 2
014
1666 S.-Q. Li, K. Zhao, and H.-L. Lu
Incubation time (week)
c)
0 5 10 15 20 25 300
20
40
60
80
100
Incubation time (week)
f)
0 5 10 15 20 25 300
20
40
60
80
100
b)
Cum
ulat
ive
NO
3- -N m
iner
aliz
ed (
µg g
–1)
0
20
40
60
80
100
e)
0
20
40
60
80
100
Disturbed sample
a)
Cum
ulat
ive
N m
iner
aliz
ed (
µg g
–1)
0
20
40
60
80
100 USELOEHUIEOA
Undisturbed sample
d)
Cum
ulat
ive
NH
4+-N
min
eral
ized
(µg
g–1
)
0
20
40
60
80
100USELOEHUIEOA
Figure 1. Cumulative ammonium N, nitrate N, and net inorganic N mineralization versus incubationtime for the four soil types: (a) cumulative ammonium N, disturbed; (b) cumulative nitrate N,disturbed; (c) Cumulative net inorganic N, disturbed; (d) cumulative ammonium N, undisturbed; (e)cumulative nitrate N, undisturbed; and (f) cumulative net inorganic N, undisturbed. USE, Ust SandicEntisols; LOE, Los Orthic Entisols; HUI, Hap Ustic Isohumisols; and EOA, Eum Orthic Anthrosols.
Differences were observed between samples from different sites but with the same soiltype: The values of N0 ranged from 36 to 132 µg g−1 for USE, 85 to 133 µg g−1 forLOE, 50 to 70 µg g−1 for HUI, and 99 to 123 µg g−1 for EOA (Table 3). The values ofN0 were high in EOA (average 111 µg g−1), intermediate in LOE (101 µg g−1), and lowin USE (69 µg g−1) and HUI (62 µg g−1) (Table 4). The value of N0 relative to the totalN was between 8.3 and 20.9% for the D soil samples (Table 3). The percentages for HUIsoils (soils 7, 8, and 9) were less than for the other soil types (Table 3), indicating that N inthe HUI soils was less readily mineralized. The mineralization rate constants were 0.044 to0.091 w−1 for USE, 0.032 to 0.038 w−1 for LOE, 0.045 to 0.073 w−1 for HUI, and 0.069 to0.083 w−1 for EOA (Table 3). The average mineralization rate constants decreased in theorder EOA > LOE > USE > HUI (Table 4).
Dow
nloa
ded
by [
The
Aga
Kha
n U
nive
rsity
] at
12:
46 1
0 O
ctob
er 2
014
Nitrogen Mineralization of Disturbed Soils 1667
a)
0 5 10 15 20 25 30
Cum
ulat
ive
N m
iner
aliz
ed (
µg g
-1)
0
20
40
60
80NO3
--N
NH4+-N
NO3--N+NH4
+-N
b)
Incubation time (week)
0 5 10 15 20 25 30
NO3--N
NH4+-N
NO3--N+NH4
+-N
Figure 2. Cumulative nitrate N, ammonium N, and net N mineralization averaged over all 11 sitesversus incubation time for (a) disturbed sample and (b) undisturbed sample.
Incubation of Undisturbed Soil Columns
Measurement of inorganic N for the UD soil samples during the incubation revealed thatthere were slight differences between the soils from different sites (Table 3). Soil corescollected from the southern sites generally had higher inorganic N content than soil coresfrom the north. Soils from sites 3 and 4 in northern Shaanxi and site 9 (a HUI-type soil) hadthe lowest values of Nm. Differences were also observed in the average cumulative total Nmineralized for different soil types (Table 4). The EOA soils had the greatest average netN mineralization (68 µg g−1), followed by LOE (61 µg g−1) and USE (51 µg g−1), andthe HUI soil had the lowest average N mineralization (45 µg g−1). Net N mineralizationof UD soils was 14 to 32% less than for D soils. The average mineral N pool for the entireset of D soil samples (70 µg g−1) was 30% larger than for the UD samples (54 µg g−1)(Table 4).
The mineralization of NO3− was the lowest in the HUI soil and did not vary signifi-
cantly with soil type. Relative net nitrification averaged 74.0% of mineral N in USE, 84.7%in LOE, 76.6% in HUI, and 87.2% in EOA. Nitrate N and total inorganic N mineraliza-tion decreased in the same order as for the D samples (Figures 1e and 1f). The cumulativeammonium N content was again low and increased only slightly with increasing incubationtime, therefore accounting for only a small fraction of the total mineralization (Figure 2b).The cumulative ammonium N of the UD soils was approximately the same irrespectiveof soil types (Figure 1d) but was less than for the D soil samples at the same incubationtime. The amount of N mineralization in USE was initially lower than in HUI up to week4 but increased more rapidly so that after week 8 the amount of N mineralization in USErose above that of HUI (Figure 1f). A similar trend was observed in the plot of nitrificationversus incubation time, indicating that nitrification occurs to a greater extent in USE soilsthan in HUI soils (Figure 1e). The average total clay and silt content of the HUI soils was89.6% compared to 47.4% for the USE soils (Table 2).
The mineralization rate for USE and LOE soils was slower than that for the other twosoil types up to week 4 of the incubation. However, there was a rapid decrease of NO3-Nfor EOA and HUI in the subsequent 8 weeks. Thus, the mineralization rate for EOA waslower than for USE and LOE between weeks 6 and 12, and the HUI soils had the lowestmineralization rate between weeks 6 and 22. The rate of mineralization was essentiallyconstant after week 16 of the incubation for all soil types. The greatest rate was observed
Dow
nloa
ded
by [
The
Aga
Kha
n U
nive
rsity
] at
12:
46 1
0 O
ctob
er 2
014
1668 S.-Q. Li, K. Zhao, and H.-L. Lu
c)
Incubation time (week)
0 5 10 15 20 25 30
Rat
e of
N m
iner
aliz
atio
n (µ
g g–1
wee
k–1)
0
1
2
3
4
5
6
f)
Incubation time (week)
0 5 10 15 20 25 300
1
2
3
4
5
6
b)
Rat
e of
nitr
ifica
tion
(µg
g–1 w
eek–1
)
0
1
2
3
4
5
6
e)
0
1
2
3
4
5
6
Disturbed sample
a)
Rat
e of
am
mon
ifica
tion
(µg
g–1 w
eek–1
)
0
1
2
3
4
5
6 USELOEHUIEOA
Undisturbed sample
d)
0
1
2
3
4
5
6 USELOEHUIEOA
Figure 3. Rate of ammonification, nitrification, and net N mineralization versus incubation time forthe four soil types. (a) Rate of ammonification, disturbed; (b) rate of nitrification, disturbed; (c) rateof net N mineralization, disturbed; (d) rate of ammonification, undisturbed; (e) rate of nitrification,undisturbed; and (f) rate of net N mineralization, undisturbed. USE, Ust Sandic Entisols; LOE, LosOrthic Entisols; HUI, Hap Ustic Isohumisols; and EOA, Eum Orthic Anthrosols.
for EOA. Ammonification rates were significantly lower than nitrification rates (Figures 3d,3e, and 3f). The mean mineralization rate for all 11 sites decreased from the beginning ofthe incubation until week 16 when it plateaued. The average ammonification rate variedonly slightly after week 8, whereas the rate of mineralization showed similar trends to thenitrification rate (Figure 4b).
As shown in Table 4, the EOE soils had the greatest mean N mineralization potential(76 µg g−1), followed by the LOE (71 µg g−1), USE (62 µg g–1), and HUI soils (48 µgg−1), consistent with the order observed for the D soil samples. However, the values of N0
for the UD soil samples were less than in the equivalent D soils (P > 0.05). On average,50% of the potentially mineralizable N (N0) in the UD samples was mineralized by week
Dow
nloa
ded
by [
The
Aga
Kha
n U
nive
rsity
] at
12:
46 1
0 O
ctob
er 2
014
Nitrogen Mineralization of Disturbed Soils 1669
a)
Incubation time (week)
0 5 10 15 20 25 30
Rat
e (µ
g g–1
wee
k–1)
0
1
2
3
4NO3
--N
NH4+-N
NO3--N+NH4
+-N
NO3--N
NH4+-N
NO3--N+NH4
+-N
b)
0 5 10 15 20 25 30
Figure 4. Rates of ammonification, nitrification, and net N mineralization averaged over all 11 sitesversus incubation time for (a) disturbed samples and (b) undisturbed samples.
15 (SE = 11), according to the measured half-lives, compared to week 11 (SE = 4) forthe D soil samples. For the UD soil from Yaoxian (site 9), the half-life was longer thanthe incubation period (t1/2 = 46 weeks). The ratio of N0 over total N for the UD samplesranged from 7.8 to 20% (Table 3). The average mineralization potential of the UD soils forall 11 sites was 80 µg g−1, which was larger than the corresponding value for the D soils(63 µg g−1) (Table 4).
Small differences between the values of k for the UD and D samples were observedfor most sites(P > 0.05); however, for some sites more significant differences were appar-ent; for example, for sites 6 and 9, k values for the UD samples were about 50% and 30%,respectively, of k for the D samples (Table 3). By comparing the average rate constantsfor different soil types (Table 4), it can be seen that the mineralization rate constants weregenerally lower for the UD soils than for the D soils, except for the HUI soils. The min-eralization rate constants varied from 0.044 to 0.091 w−1 for USE, 0.032 to 0.038 w−1 forLOE, 0.045 to 0.073 w−1 for HUI, and 0.069 to 0.083 w−1 for EOA (Table 3). Overall, theaverage values of the mineralization rate constants for the UD samples were similar for theUSE, LOE, and EOA soils but were greater for the HUI soils, although this difference isprobably not significant (Table 4).
Discussion
In general, the initial chemical properties of the soil samples were highly variable, andno statistically significant differences could be detected between different soil types. Themean values shown in Table 2 (except available P and pH) were typically lower than valuesreported previously for soil samples from the same area (e.g., Jin et al. 2007). The meanconcentrations of organic matter, total N, and mineral N reported by Jin et al. were 15.18 gkg−1, 1.10 g kg−1, and 41.2 µg g−1, respectively. One explanation for the discrepancy isthe different time of year when the samples were taken, corresponding to different levelsof fertilization of the sites. In our study, the samples were collected at the end of April2007 when none of the sites were fertilized. In contrast, Jin et al. (2007) collected theirsoil samples from the end of June to early July. During this period the soil temperature andmoisture levels were greater in northern Shaanxi and on the Guanzhong Plain compared towhen our samples were collected. Moreover, when Jin et al. (2007) collected their samples,all the sites were fertilized, and the soil fertility indices were larger than in our study.
Dow
nloa
ded
by [
The
Aga
Kha
n U
nive
rsity
] at
12:
46 1
0 O
ctob
er 2
014
1670 S.-Q. Li, K. Zhao, and H.-L. Lu
For both the D and UD soil samples, Nm was found to decrease in the order EOA >
LOE > USE > HUI. The low quantities of mineralized N (Nm) measured in several ofthe USE soils (sites 3 and 4) may be the reason for the smaller variation in the rate ofmineralization versus incubation time observed for these soils compared to the other types.Differences in mineralization may be the result of differences in the activity of a small butlabile fraction of soil organic N. The typically low amount of organic matter in USE soils(Table 2) limits the potentially mineralizable substrate because the N reserve originatingfrom humus is small and easily decomposable. Moreover, because of limited carbon andenergy supplies in USE soils, soil microbial biomass probably declines considerably duringthe incubation experiments. N mineralization rates under in situ conditions are reported tobe significantly less than measured in our study. Because the HUI soils have the greatestclay and second greatest silt contents, they may have more immobilized N than the otherthree soil types, resulting in lower net N mineralization. The effect of soil texture on Nmineralization has also been reported by other researchers (Sorensen, Jensen, and Nielsen1994; Honeycutt, Griffin, and He 2005).
As for Nm, the average value of N0 was greatest for the EOA soils and LOE soils,moderately high for the USE soils, and lowest for the HUI soils for the D and/or theUD samples (Table 2), in agreement with the results of Jin et al. (2008). Soil–particlecomposition has a large effect on soil texture and soil structure and thus may affect N0
by influencing microbial activity. In line with this, fast mineralization rates of organic Cand N have been reported for coarse-textured soils (Zhao et al. 2006). Therefore, it is notsurprising that the fine-textured soils analyzed in our study were associated with relativelylow values of N0 and slow rates, considering their greater capacity to “fix” soil organicmatter, forming large pools of C and N with relatively slow turnover. Further, the rate andextent of mineralization of N showed a strong positive correlation with silt content of thesoils and a negative correlation with the clay and sand content. The mineralization rateconstants for the D soil samples varied slightly from 0.038 to 0.105 w−1 and averaged0.067 ± 0.021 w−1, which is nearly twice the value reported by Jin et al. (2007) anda little greater than the values reported by Stanford and Smith (1972) and Bai and Zhao(1981) (0.054 w−1and 0.045 w−1, respectively). Although the factors controlling biologicaltransformations of N in soil are numerous and complex, N mineralization largely dependson the quantity and quality (composition) of organic matter, C/N ratio, soil moisture, andtemperature (Li and Li 1996). The 11 soils analyzed differed mainly in organic-mattercontent, total N content, and C/N ratio, but these differences were small. Consequently,the variation in Nm with soil type was not significant (P > 0.05) for either the D or UDsamples, indicating that the effect of soil type on N mineralization was small in our study.These results are in contrast to other studies, which found significant differences in Nmineralization for different soil types (Sistani et al. 2008). In addition, some researchershave suggested that the wetting and drying cycles used in the incubation procedure arenot long enough to accurately assess mineralization (Griffin, Khan, and Lockowitz 2002;Honeycutt, Griffin, and He 2005).
The amount of N mineralized in the D soil samples was larger than in the UD soilsamples, which agrees with the findings of other researchers (Cabrera and Kissel 1988;Sierra 1992; Stenger, Priesack, and Beese 1995; Ringuelet and Bachmeier 2002) and indi-cates that any disturbance introduced by soil preparation (drying and rewetting) stronglyinfluences subsequent N mineralization. The main factor governing soil organic-mattermineralization is microbial activity in soil, which is enhanced when the soil sample isdisturbed. However, in our study, this process contributed less to the overall mineraliza-tion than reported previously. For the 11 sites investigated in our study, Nm for the D
Dow
nloa
ded
by [
The
Aga
Kha
n U
nive
rsity
] at
12:
46 1
0 O
ctob
er 2
014
Nitrogen Mineralization of Disturbed Soils 1671
samples were 0 and 82% greater than Nm for the equivalent UD samples (Tables 3 and 4),in agreement with the results of Ringuelet and Bachmeier (2002). However, other stud-ies have shown that disturbance of soils increases N mineralization by as much as 80 to343% (Cabrera and Kissel 1988; Sierra 1992; Stenger, Priesack, and Beese 1995). Thesmaller difference in N mineralization between the D and UD samples in our results maybe because the soils we used contained a high proportion of sand and silt. Moreover, distur-bance is likely to have less effect on our results because the soil samples were taken fromthe top 0 to 20 cm, whereas the readily mineralizable N pool is associated with deepercoarser fractions, such as those containing plant debris and roots (Balabane and Balesdent1995).
Nitrate N was the main component of mineralization during the aerobic incubation inour study. In contrast, only a small amount of ammonium was produced. We found that thecumulative total mineralized N correlated with the amount nitration for both the D and UDsoil samples. Nitrate production is known to be an important factor influencing potentialN loss (Vitousek et al. 1982). In calcareous soil, ammonium is rapidly converted to nitrate(Hu, Li, and Hao 2000), explaining why in all the soils we analyzed the amount of ammo-nium was low and stable. Aerobic incubation increases the activity of nitrifying bacteria,and therefore any ammonium N initially present in the soil or generated by mineralizationof organic N would be rapidly converted to nitrate by nitrification (Li, Bu, and Li 1993; Li,Li, and Li 2000).
Compared to the UD samples, the D soil samples had greater total inorganic N min-eralization, nitrate N, and cumulative ammonium N, by 16%, 3%, and 65% respectivelyfor USE; 43%, 39%, and 68% respectively for LOE; 17%, 5%, and 57%, respectively forHUI; and 49%, 41%, and 103% respectively for EOA. The effects of the D treatment onsoil mineralization were larger for samples from the Guanzhong Plain (HUI and EOA) thanfor samples from northern Shaanxi (USE and LOE). The D treatment mainly resulted inan increased mineralization rate of the soil organic matter due to improved soil aeration.The soils collected from northern Shaanxi contained a greater proportion of sand than thesoils from the Guanzhong Plain and hence were well aerated even without disturbance,which could explain the smaller difference in k between the D and UD samples for sites1–5 compared to sites 7–11. The soils from sites 6 and 9 were partially compacted and thuswere omitted when comparing differences in k.
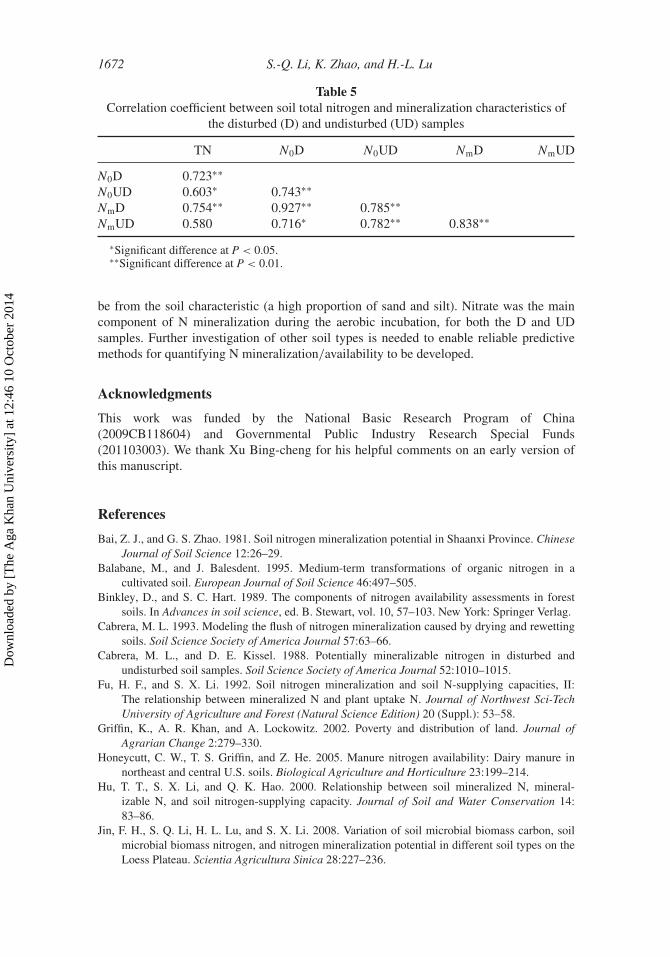
The value of the mineralization potential N0 is believed to reflect the N-supply capac-ity of soils (Lu et al. 1996). The mineralization potential of the D soil samples (DN0)correlated strongly with the total N (r = 0.723, P < 0.05, n = 11) as well as N mineral-ization (DNm) (r = 0.754, P < 0.05, n = 11) (Table 5). The potential mineralization ofUD soil samples (UDN0) and total N were also significantly related (r = 0.603, P < 0.05,n = 11), and the mineralization of UD (UDNm) and total N were not significantly related(r = 0.580, P > 0.05, n = 11) (Table 5). Moreover, the potential mineralization (DN0 andUDN0) and cumulative mineralized N (DNm and UDNm) were highly correlated, but noother pairwise correlations between the potential mineralization, cumulative mineralizedN, and mineralization rates were significant (P < 0.05) (Table 5). These results suggestthat N0 could be used to predict the value of mineralized N in soil.
Conclusions
In this study, we found that N mineralization of the UD and D samples decreased fromsouthern to northern Shaanxi Province, and the mineralization potential of the D sampleswas larger than that of UD samples, though the difference was not significant, which may
Dow
nloa
ded
by [
The
Aga
Kha
n U
nive
rsity
] at
12:
46 1
0 O
ctob
er 2
014
1672 S.-Q. Li, K. Zhao, and H.-L. Lu
Table 5Correlation coefficient between soil total nitrogen and mineralization characteristics of
the disturbed (D) and undisturbed (UD) samples
TN N0D N0UD NmD NmUD
N0D 0.723∗∗N0UD 0.603∗ 0.743∗∗NmD 0.754∗∗ 0.927∗∗ 0.785∗∗NmUD 0.580 0.716∗ 0.782∗∗ 0.838∗∗
∗Significant difference at P < 0.05.∗∗Significant difference at P < 0.01.
be from the soil characteristic (a high proportion of sand and silt). Nitrate was the maincomponent of N mineralization during the aerobic incubation, for both the D and UDsamples. Further investigation of other soil types is needed to enable reliable predictivemethods for quantifying N mineralization/availability to be developed.
Acknowledgments
This work was funded by the National Basic Research Program of China(2009CB118604) and Governmental Public Industry Research Special Funds(201103003). We thank Xu Bing-cheng for his helpful comments on an early version ofthis manuscript.
References
Bai, Z. J., and G. S. Zhao. 1981. Soil nitrogen mineralization potential in Shaanxi Province. ChineseJournal of Soil Science 12:26–29.
Balabane, M., and J. Balesdent. 1995. Medium-term transformations of organic nitrogen in acultivated soil. European Journal of Soil Science 46:497–505.
Binkley, D., and S. C. Hart. 1989. The components of nitrogen availability assessments in forestsoils. In Advances in soil science, ed. B. Stewart, vol. 10, 57–103. New York: Springer Verlag.
Cabrera, M. L. 1993. Modeling the flush of nitrogen mineralization caused by drying and rewettingsoils. Soil Science Society of America Journal 57:63–66.
Cabrera, M. L., and D. E. Kissel. 1988. Potentially mineralizable nitrogen in disturbed andundisturbed soil samples. Soil Science Society of America Journal 52:1010–1015.
Fu, H. F., and S. X. Li. 1992. Soil nitrogen mineralization and soil N-supplying capacities, II:The relationship between mineralized N and plant uptake N. Journal of Northwest Sci-TechUniversity of Agriculture and Forest (Natural Science Edition) 20 (Suppl.): 53–58.
Griffin, K., A. R. Khan, and A. Lockowitz. 2002. Poverty and distribution of land. Journal ofAgrarian Change 2:279–330.
Honeycutt, C. W., T. S. Griffin, and Z. He. 2005. Manure nitrogen availability: Dairy manure innortheast and central U.S. soils. Biological Agriculture and Horticulture 23:199–214.
Hu, T. T., S. X. Li, and Q. K. Hao. 2000. Relationship between soil mineralized N, mineral-izable N, and soil nitrogen-supplying capacity. Journal of Soil and Water Conservation 14:83–86.
Jin, F. H., S. Q. Li, H. L. Lu, and S. X. Li. 2008. Variation of soil microbial biomass carbon, soilmicrobial biomass nitrogen, and nitrogen mineralization potential in different soil types on theLoess Plateau. Scientia Agricultura Sinica 28:227–236.
Dow
nloa
ded
by [
The
Aga
Kha
n U
nive
rsity
] at
12:
46 1
0 O
ctob
er 2
014
Nitrogen Mineralization of Disturbed Soils 1673
Jin, F. H., S.Q. Li, H. L. Lu, and S. X. Li. 2007. Estimation of biological methods on assessing soilnitrogen-supplying capacity in calcareous soil. Scientia Agricultura Sinica 40:1422–1431.
Ju, X. T., and S. X. Li. 1997. The influence of incubation conditions on soil nitrogen mineralization.Acta Agriculturae Boreali-occidentalis Sinica 6:64–67.
Li, J. M., Z. H. Wang, and S. X. Li. 2003. Significance of soil organic matter, total N, and mineraliz-able nitrogen in reflecting soil N-supplying capacity. Acta Pedologica Sinica 40:232–237.
Li, S. Q., T. Y. Bu, and S. X. Li. 1993. Ammonium nitrification and fixation by clay minerals incalcareous soil. Agricultural Research in the Arid Areas 11 (Suppl.): 99–107.
Li, S. Q., and S. X. Li. 1996. Changes of soil mineralizable N during crops growth periods. Journalof Soil Erosion and Soil and Water Conservation 2:73–77.
Li, S. Q., S. X. Li, and F. M. Li. 2000. Mineralization and nitrification of soil nitrogen in calcareoussoil profile. Journal of Lanzhou University (Natural Sciences) 36:98–104.
Li, S. X., H. F. Fu, J. Z. Xiao, and H. L. Yuan. 1992. The effectiveness of several methods deter-mining soil available or potentially available N in reflecting dryland soil N supply capacities.Agricultural Research in the Arid Areas 10:72–81.
Lu, S. L., X. R. Yang, Y. D. Zhang, and D. M. Wu. 1996. Nitrogen mineralization potential and theforecast of the content of nitrogen supplied in the soils of Shanxi Province. Scientia AgriculturaSinica 29:21–26.
Nordmeyer, H., and J. Richter. 1985. Incubation experiments on nitrogen mineralization in Loessand sandy soils. Plant and Soil 83:433–445.
Nuske, A., and J. Richter. 1981. N-mineralization in Loess-Parabrownearthes: Incubation experi-ments. Plant and Soil 59:237–247.
Ringuelet, A., and O. A. Bachmeier. 2002. Kinetics of soil nitrogen mineralization from undisturbedand disturbed soil. Communications in Soil Science and Plant Analysis 33:3703–3721.
Sierra, J. 1992. Relationship between mineral N contents and N mineralization rate in disturbed andundisturbed soil samples incubated under field and laboratory conditions. Australian Journal ofSoil Research 30:477–492.
Sistani, K. R., A. Adeli, S. L. McGowen, H. Tewolde, and G. E. Brink. 2008. Laboratory and fieldevaluation of broiler litter nitrogen mineralization. Bioresource Technology 99:2603–2611.
Skjemstad, J. O., I. Vallis, and R. J. K. Myers. 1988. Decomposition of soil organic nitrogen. InAdvances in nitrogen cycling in agricultural ecosystems, ed. J. Wilson, 134–144. Wallingford,UK: CAB International.
Smith, J. L., R. R. Schnabel, B. L. McNeal, and G. S. Campbell. 1980. Potential errors in thefirst-order model for estimating soil nitrogen mineralization potentials. Soil Science Society ofAmerica Journal 44:996–1000.
Sorensen, P., E. S. Jensen, and N. E. Nielsen. 1994. The fate of 15N-labeled organic nitrogen in sheepmanure applied to soils of different texture under field conditions. Plant and Soil 162:39–47.
Stanford, G., and S. J. Smith. 1972. Nitrogen mineralization potentials of soils. Soil Science Societyof America Journal 36:465–472.
Stenger, R., E. Priesack, and F. Beese. 1995. Rates of net nitrogen mineralization in disturbed andundisturbed soils. Plant and Soil 171:323–332.
Tao, Q. N., L. H. Wu, and P. Fang. 1993. Study on mineralization rate of nitrogen in paddy soils.Acta Pedologica Sinica 8:237–244.
Vitousek, P. M., J. R. Gosz, C. C. Grier, J. M. Melillo, and W. A. Reiners. 1982. A comparative anal-ysis of potential nitrification and nitrate mobility in forest ecosystems. Ecological Monographs52:155–177.
Wang, Y. Q. 1986. Nitrogen mineralization potential of loess soil, cinnamon soil, and fluvo-aquicsoil in China. Acta Pedologica Sinica 2:19.
Ye, Y. L., F. S. Zhang, and S. X. Li. 2001. Study on soil nitrogen supplying indexes. Chinese Journalof Soil Science 32:273–277.
Zhao, X. L., H. T. Cheng, G. H. Lv, and Q. Jia. 2006. Advances in soil microbial biomass. Journalof Meteorology and Environment 22:68–72.
Dow
nloa
ded
by [
The
Aga
Kha
n U
nive
rsity
] at
12:
46 1
0 O
ctob
er 2
014