nitrogen isotope fractionation during nitrate, ammonium … well explained only in the case of the...
TRANSCRIPT
Vol. 169: 29-41,1998 MARINE ECOLOGY PROGRESS SERIES Mar Ecol Prog Ser
Published August 6
Nitrogen isotope fractionation during nitrate, ammonium and urea uptake by marine diatoms and
coccolithophores under various conditions of N availability
Nathalie A. Waser',', Kedong in', Zhiming YU', Kuninao Tada3, Paul J. ~arrison', David H. Turpin4, Stephen E. Calvertl
' ~ e p a r t m e n t of Earth and Ocean Sciences, University of British Columbia, Vancouver, British Columbia V6T 124, Canada *Institute of Oceanology, Chinese Academy of Sciences, Qingdao, Shandong 266071, China 3Departn~ent of Bioresource Science, Faculty of Agriculture, Miki, Kagawa 761-07, Japan
'~epar t rnen t o f Biology, Queen's University, Kingston, Ontario K7L 3N6. Canada
ABSTRACT: Stable isotopes of N provide a new approach to the study of algal production in the ocean, yet know!edge of the isctopc fractionation (c) in various oceanic regime5 is i d ~ k i ~ ~ y . tiere we report large and rapid changes in isotope composit~on (6'") of 2 coastal diatoms and 2 clones (open and coastal) of a coccolithophore grown in the simultaneous presence of nitrate, ammonium and urea under varylng conditions of N availability (i.e. N-sufficiency and N-starvation followed by N-resupply) and hence different physiological states. Du.ring N-sufficiency, the SI5N of particulate organic N (PON) was well reproduced, uslng a model derived from Rayleigh distillation theory, with constant E similar to that for growth on each individual N source. However, following N-resupply, the variations in S15NpoU could be well explained only in the case of the open ocean Emiliania huxleyi, with E similar to N-sufficient conditions. It was concluded that the mechanism of isotope fractionation changed rapidly with N avail- ability for the 3 coastal clones. However, in the case of E. huxleyi isolated from the Subarctic Pacific Ocean, no evidence of a change in mechanism was found, suggesting that perhaps open ocean species can quickly recover from N-depleted conditions.
KEY WORDS: Isotope fractionation . 15N/14N . Nitrogen uptake. Diatoms Coccolithophores - Nitrate . Ammonium. Urea
INTRODUCTION
The incorporation of nitrogen is a key factor limiting phytoplankton production in the ocean. Furthermore, the form of N incorporated determines the partitioning between new and regenerated production. The use of natural stable isotopes of N has provided new ways with which to examine the relationships between N sources and primary production. In principle, during growth on a particular N source, phytoplankton dis- criminate between I4N and 15N and preferentially
incorporate "N. Knowledge of the fact that isotope fractionation (E) varies with source should provide an important tool for distinguishing between new and regenerated production (Wada & Hattori 1978, Mon- toya & McCarthy 1995, Pennock et al. 1996, Waser et al. 1998). Yet, further use of N isotope ratios is hin- dered by the lack of knowledge of E in various oceanic regimes which can differ in terms of N availability (i.e. N-sufficient and N-depleted) and thus physiological state, N source (nitrate, ammonium and urea) and spe- cies composition.
In eutrophic oceanic regions, evidence for isotope fractionation of 4 to 5%0 has been obtained where pro- ductivity is nitrate-based (Wada 1980, Horrigan et al.
O Inter-Research 1998 Resale of full article not permitted

30 Mar Ecol Prog Ser 169: 29-41, 1998
1990, Altabet et al. 1991, Sigman et al. 1996, Voss et al. particular, we hypothesized that in the N-resupply 1996, Wu et al. 1997). These field estimates are sup- phase following N-starvation E might be significantly ported by estimates of 2 to 1 2 Y ~ determined in cultures reduced relative to the N-sufficient phase. (Montoya & McCarthy 1995, Pennock et al. 1996, Nee- doba 1997, Waser et al. 1998). In coastal environments, phytoplankton growth on ammonium is accompanied MATERIALS AND METHODS by an isotope fractionation of 6.5 to g'?!! (Cifuentes et al. 1989, Montoya et al. 1991). This is lower than the Cultures. Two coastal diatoms, Thalassiosira pseu- recent estimates of 20 to 26Oh for growth of diatoms on donana (NPCC 58) and Chaetoceros debilis (NPCC levels of NH,' of more than 20 PM (Pennock et al. 644), and 2 clones of the coccolithophore Erniliania 1996, Waser et al. 1998) but similar to the 5 to 10%0 huxleyz (NPCC 646 and NPCC 732) were obtained obtained during growth on 20 pM NH,' (Pennock et al. from the Northeast Pacific Culture Collection (NPCC), 1996). The discrepancy between culture and field esti- Department of Earth and Ocean Sciences, University mates may therefore be due to a concentration effect of British Columbia. E. huxleyi (NPCC 732) is an open (Hoch et al. 1992, Pennock et al. 1996). Unlike growth ocean clone isolated from Stn Papa located in the on nitrate and ammonium, isotope fractionation during Northeast Subarctic Pacific gyre and has coccoliths, growth on urea is very small and around 0.7OA (Waser while the other clone of E. huxleyi (NPCC 646) is non- et al. 1998). calcifving (i.e. naked) and is a coastal clone. All culture
Less is known about fractionation in oligotrophic experiments were performed in triplicate. However, in regimes. Typically, the 6'" of particulate organic N the case of C. debilis one culture did not grow. The cul- (6I5NpoN) is lower and exhibits much smaller variations tures were grown on artificial seawater (ESAW) follow- relative to eutrophic regions (Altabet 1988, Villareal et ing a modified recipe of Harrison et al. (1980). They al. 1993). There are no estimates of c in those environ- were grown on 3 N sources present simultaneously, i.e. ments because of the extremely low ambient nutrient NO3-, NH4+ and CO(NH2)2, in batch cultures, at 18 rt concentrations. However, it has been hypothesized 0.5"C, in continuous light (120 pm01 photons m-2 S-') as that because dissolved N is in such low concentration, described in detail elsewhere (Waser et al. 1998). The E may be as low as OoA, signifying that all N taken up batch culture inoculum had been acclimated to the by the cell is assimilated (Fogel & Cifuentes 1993). This same medium for 8 to 10 generations. After inocula- change may come about due to a decrease in the efflux tion, the cultures were grown first in N-sufficient con- of N out of the cell (Mariotti et al. 1982, Handley & ditions. They were then N-starved for 40 to 60 h, and Raven 1992, Evans et al. 1996) and in extremely then all three N sources were resupplied to the N-depleted environments one may hypothesize that N medium. The total concentration of NO3-, NH4+ and efflux may be close to zero. CO(NH& was 100 to 130 pM in the N-sufficient phase
In a previous study (Waser et al. 1998), we deter- and ranged from 50 to 130 pM in the N-resupply mined c associated with the uptake of the 3 most phase. In one culture of the coastal clone of E. huxleyl, important N sources for phytoplankton, NO3-, NH,+ urea concentration was 73 pM in the N-sufficient and urea (McCarthy & Goldman 1979, Harrison 1992). phase and thus double the concentration of NO3- and In this paper, we are investigating the variations in NH,'. However, 2 duplicate cultures of the coastal 6I5NpoN during phytoplankton growth on these N clone of E. huxleyi were grown with 30 to 35 pM of sources when they are all present simultaneously. To urea and showed similar results. The N:P and Si:N this end, ecologically important species of cocco- ratios in the medium were 4:l and 2:1, respectively, to lithophores and dia.toms were grown in pure cultures ensure that N was limiting biomass at the stationary in the laboratory. Growth conditions were designed to phase. Bicarbonate (NaHC03) was initially 2 mM and simulate eutrophic and oligotrophic and/or temporar- 0.9 g was added daily to the 6 1 cultures to prevent ily N-depleted surface oceans. To this end, the algae C-limitation. Each addition was accompanied by a were grown under N-sufficient and N-depleted condi- small decrease in pH. The pH increased from 8.0-8.2 tions (i.e. N-starvation followed by the resupply of all 3 to 8.5-8.9 during log phase growth in N-sufficient N sources). The N-sufficient phase was designed to conditions and remained fairly constant following simulate bloom conditions and coastal environments N-resupply. Both the inoculum and the experimental where the concentration of dissolved N is large relative culture of the calcifying coccolithophore were grown to its biological uptake. In contrast, the N-resupply on ESAW, although this clone is grown in the culture phase sim.ulated oligotrophic oceans where new and coll.ection on surface seawater collected at Stn Papa to regenerated N are supplied to the N-depleted surface allow the coccollths to be maintained. Calcifying cells ocean during episodic events. Variations in N avail- constituted about 50% of the experimental triplicate ability were expected to produce changes in c and, in cultures.
Urdser et al . : N isotope fractionatlon dunng N uptake 3 1
Biomass, PON and nutrient analysis. Samples for nutrients, particulate matter, fluorescence and cell den- sity were collected at time intervals ranging up to 120 h. PON samples were collected by vacuum filtration at 0.5 atm on pre-combusted (450°C) glass-fiber filters (CF/F) and determ~nations were made on a Fisons automated CHN analyzer on-line with a mass spec- trometer. The precision of each PON analysis was 1 to 2 % . The filtrate was used for nitrate, ammonium and urea analyses which were determined manually and with a Technicon Autoanalyzer. Manual nitrate analy- ses were made using a spongy cadmium method (Jones 1984) slightly modified for small volumes (D. Bronk, University of Georgia a t Athens, pers. comm.). Ammo- nium was analyzed according to Slawyk & MacIsaac (1972) and urea according to the diacetyl monoxime method described by Price & Harrison (1987).
Nitrogen isotope analysis. Isotopic abundance was determined with a VG PRISM dual inlet, triple collec- tor mass spectrometer operated in continuous flow mode. Results are reported in the delta notation (%o):
where R is the I5N/l4N ratio and the standard is atmos- pheric air (O%o). Routinely, a standard of acetanilide is run frequently (every 5 to 10 samples). The precision is 0 . 1 7 ~ & .
Multiple N source uptake model. A model was developed for simulating the 615NpoN which results from growth on multiple N sources. The model does not address the mechanism of isotope fractionation, but tests whether S15NpoN can be described as the weighted sum of the changes in 6l5NpON which would result from the incorporation of each individual N source, assuming that they follow the accumulation
product equation (Mariotti et al. 1981). Thus each N incorporation is treated as a unidirectional reaction (NO3' + PON, NH4+ + PON, urea + PON) and the total N incorporation is described as the sum of these reactions. E has been previously determined for Tha- lassiosira pseudonana when each of these sources was the sole source of N (Waser et al. 1998). The model uses thls information and evaluates whether it can be used in a more complex situation where all 3 N sources are present simultaneously. It further assumes that there is a n isotope mass balance (i.e. no loss and no other N form involved except NO, , NH,', urea and PON). The SliNpON (615Nx) for growth on a source X is given by the accumulated product equation as in our previous study:
where X is NO3-, NH,' or urea, 61%N,, is the 615N of the initial source, E, is the isotope fractionation during the incorporation of X and F, = -[£,/(l - E,)] In E,, where F, is the fraction of unconsumed N source. The variables are given in Table 1. F1'NpoT is then as follows:
where PON, is the ?ON Lildl is produced from growth on a source X. PON, is calculated from the changes in N source concentration (i.e. [NO3-], [NH,"] and [urea]) The time-dependent expressions for [NO3-], [NH,'] and [urea] are determined by the fits of the dissolved N data. In the N-resupply phase a large amount of PON was present prior to N-addition and the appropriate correction for initial concentration of PON (PON,) was made. In the N-sufficient phase, a small correction was also made to account for the PON that was carried over from the inoculum. PON, was calculated as the differ-
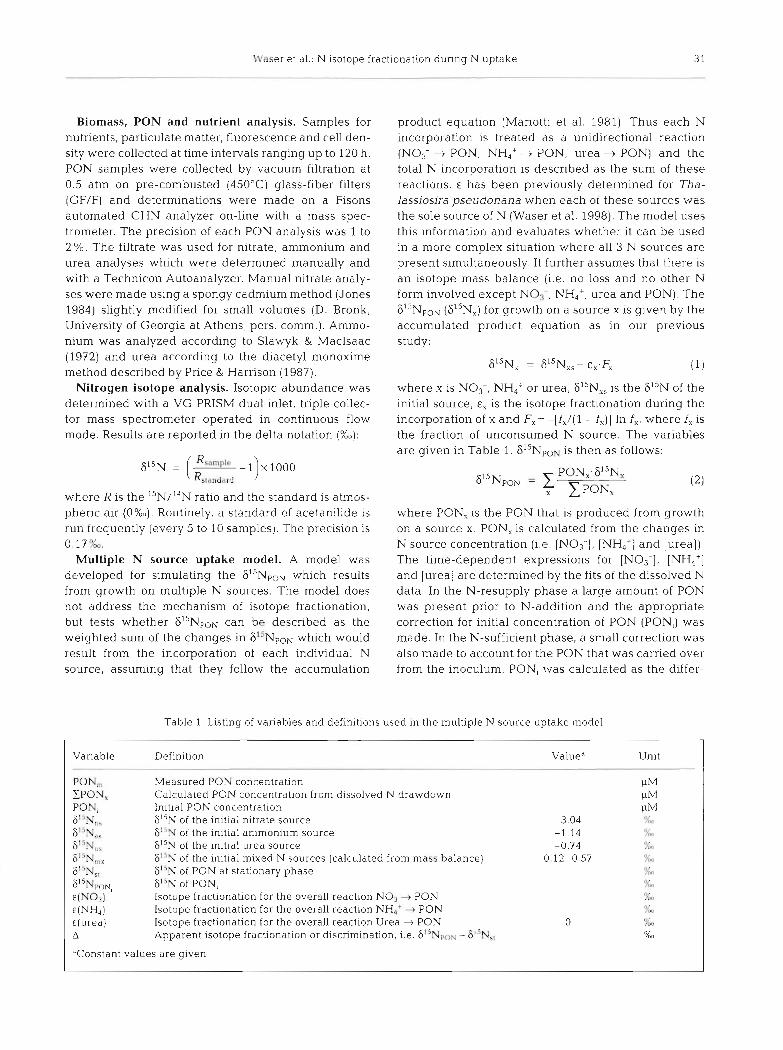
Table 1 Listing of variables and definitions used in the multiple N source uptake model
I Variable Definition Val'ued Unlt I POK,, ZPON, POX, 6: 'N,,, 6' 'N,, 6' 'N,, 6' 'NrtIy 6' 'N,, 6ISNpo~, E(NO 11 E(NH,) &(urea) A
Measured PON concentration Calculated PON concentration from dissolved N drawdown Initial PON concentration 615N of the initial nitrate source 3.04 6 " ~ of the initial ammonium source -1.14 F1'N of the initial urea source -0.74 6'" of the initial mixed N sources (calculated from mass balance) 0.12-0.57 F"N of PON at stationary phase F1" of PON, Isotope fractionation for the overall reactlon NO3 + PON Isotope frdctionation for the overall reaction NH,' 4 PON Isotope fractionation for the overall reaction Urea -+ PON 0 Apparent isotope fractionation or discrimination, i.e. 615Npos - F15Nq,
I 'Constant values are given l
32 Mar Ecol Prog Ser 169: 29-41, 1998
ence between XPON, and the measured PON (PON,). The 6"NpoN is then as follows:
RESULTS
Coastal clone of Emiliania huxleyi
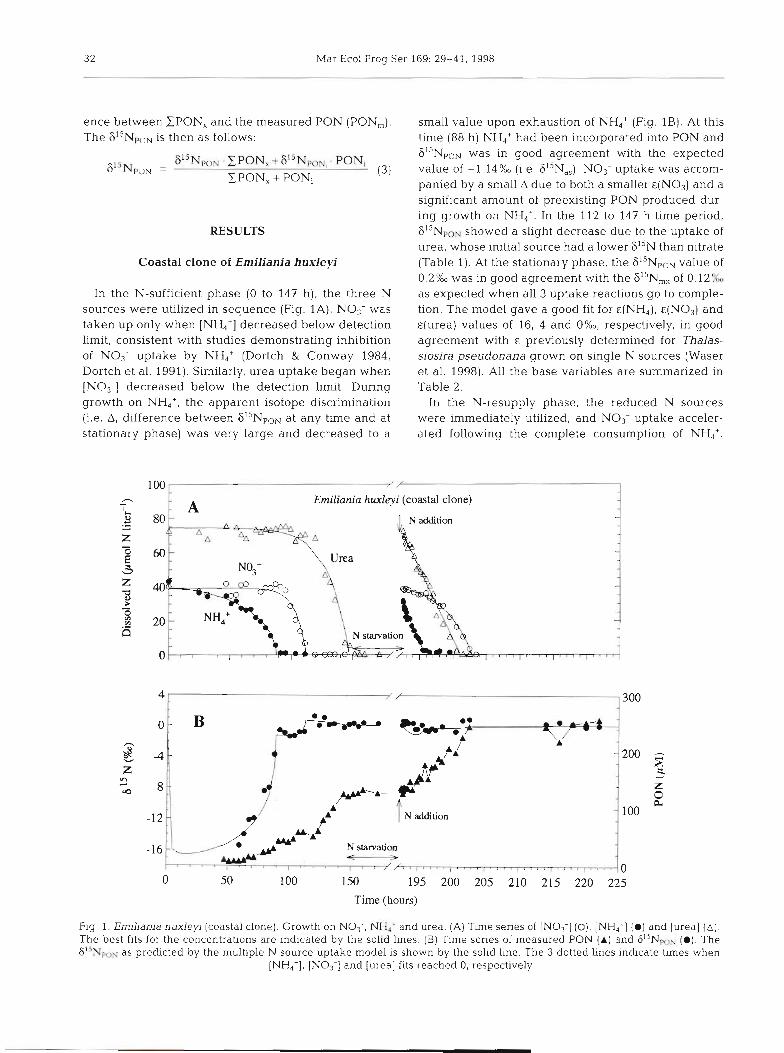
In the N-sufficient phase (0 to 147 h), the three N sources were utilized in sequence (Fig. 1A). NO3- was taken up only when [NH4+] decreased below detection limit, consistent with studies demonstrating inhibition of NO,- uptake by NH4+ (Dortch & Conway 1984, Dortch et al. 1991). Similarly, urea uptake began when !NO3-! decreased below the detection limit. During growth on NH,', the apparent isotope discrimination (i.e. A, difference between 6I5NpoN at any time and at stationary phase) was very large and decreased to a
small value upon exhaustion of NH4+ (Fig. 1B). At this time (88 h) NH,+ had been incorporated into PON and 6iiNpON was in good agreement with the expected value of -1.14%0 (i.e. 6I5N,,). No3- uptake was accom- panied by a small A due to both a smaller €(NO3) and a significant amount of preexisting PON produced dur- ing growth on NH,'. In the 112 to 147 h time period, S1'NpoN showed a slight decrease due to the uptake of urea, whose initial source had a lower F1'N than nitrate (Table 1). At the stationary phase, the 615NpoN value of 0.2Y6 was in good agreement with the 6I5N, of 0.12% as expected when all 3 uptake reactions go to comple- tion. The model gave a good fit for &(NH,), &(NO3) and ~ ( u r e a ) values of 16, 4 and O%O, respectively, in good agreement with E previously determined for Thalas- siosira pseudonana grown on single N sources (Waser et al. 1998). All the base variables are summarized in Table 2.
In the N-resupply phase, the reduced N sources were immediately utilized, and NO3- uptake acceler- ated following the complete consumption of NH4+.
100 Emiliania huxleyi (coastal clone)
80
60
40
20
0
A - 200 5 3
z - 100
B
, , , , , , , , , , , , , , . ,: 0
0 50 100 150 195 200 205 210 215 220 225
Time (hours)
Fig 1. Emiliania hux ley~ (coastal clone). Growth on NOi-, NH4+ and urea. (A) Time senes of [NO;] (O), [NH,'] ( @ l and [urea] (A] . The best fits for the concentrations are indicated by the solid lines. (B) Time series of measured PON (A) and 8ISNpON (@). Th.e G1'NpoN as predicted by the multiple N source uptake model is shown by the solid line. The 3 dotted lines indicate tlmes when
[NH4+], [NO3-] and [urea] fits reached 0, respectively
\Mast,r et al.: N isotope fractionat~on during N uptake 33
p - p - -
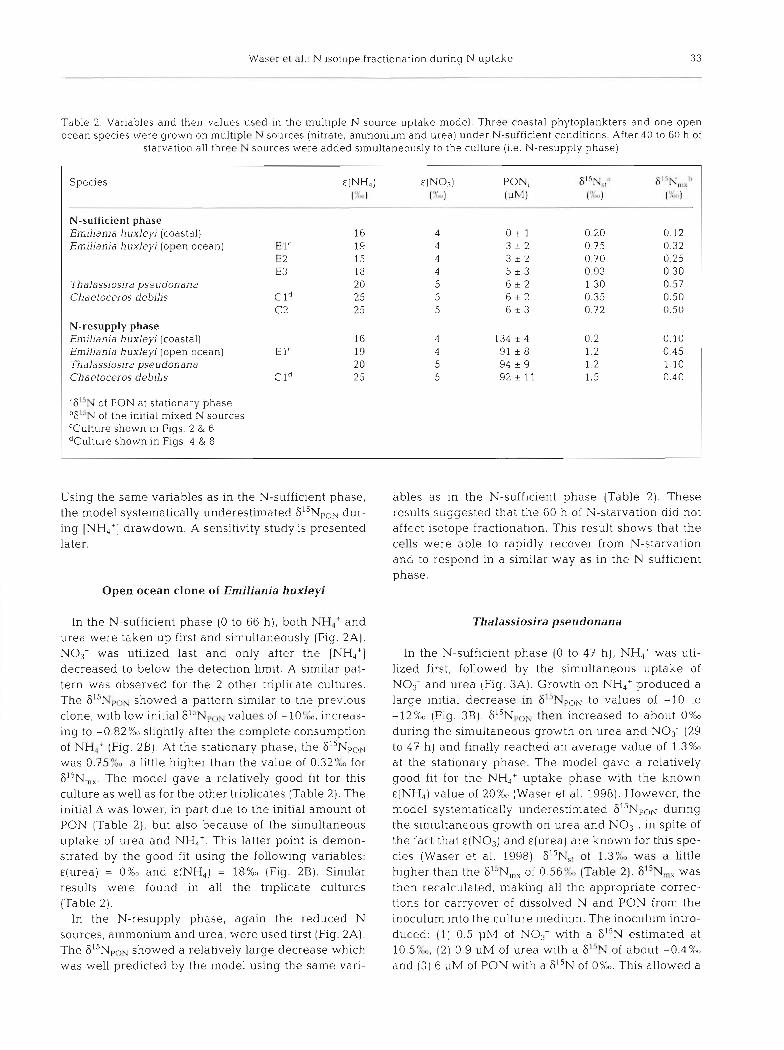
Table 2. Variables and their values used in the ~nultiple N source uptake model. Threc coastal phytoplankters and one open ocean species were grown on multiple N sources (nitrate, ammonium and urea) under N-sufficient conditions. After 40 to 60 h of
starvation all three N sources were added simultaneously to the culture (i.e. N-resupply phase)
Species WH4) ~ ( N 0 . d PON, 6'5N,," 6! iNm,x't (":">) ('-c'",) ( ~ h l ) (",",) ("m)
p -
N-sufficient phase Emiliania huxleyj (coastal) 16 4 O t l 0 20 0.12 Emilianja huxleyi (open ocean) E l' 19 4 3 - 2 0 75 0.32
C2 l S 4 3 t 2 0 70 0.25 E3 18 4 5 t 3 0 93 0.30
Thalassiodra pseudonana 2 0 5 6 t 2 1 30 0.57 Chaetoceros debilis Cl" 25 5 6 * 2 0.35 0.50
C2 25 5 6 + 3 0.72 0.50
N-resupply phase Emiliania huxleyi (coastal) 16 4 134 + 4 0.2 0.10 Emiliania huxleyi (open ocean) E l " 19 4 91 + 8 1.2 0.45 Thalassiosira pseudonana 20 5 94 + 9 1.2 1.10 Chaetoceros debilis C l d 2 5 5 9 2 + 11 1 .5 0.40
d6'5N of PON at stationary phase 1'61CN of the i n ~ t ~ a l mixed N sources CCulture shoivn in Figs 2 & 6 dCulture shown In Figs 4 & 8
Using the same variables as in the N-sufficient phase, the model systematically underestimated S15Npon dur- ing [NH,'] drawdown. A sensitivity study is presented later.
Open ocean clone of Emiliania huxleyi
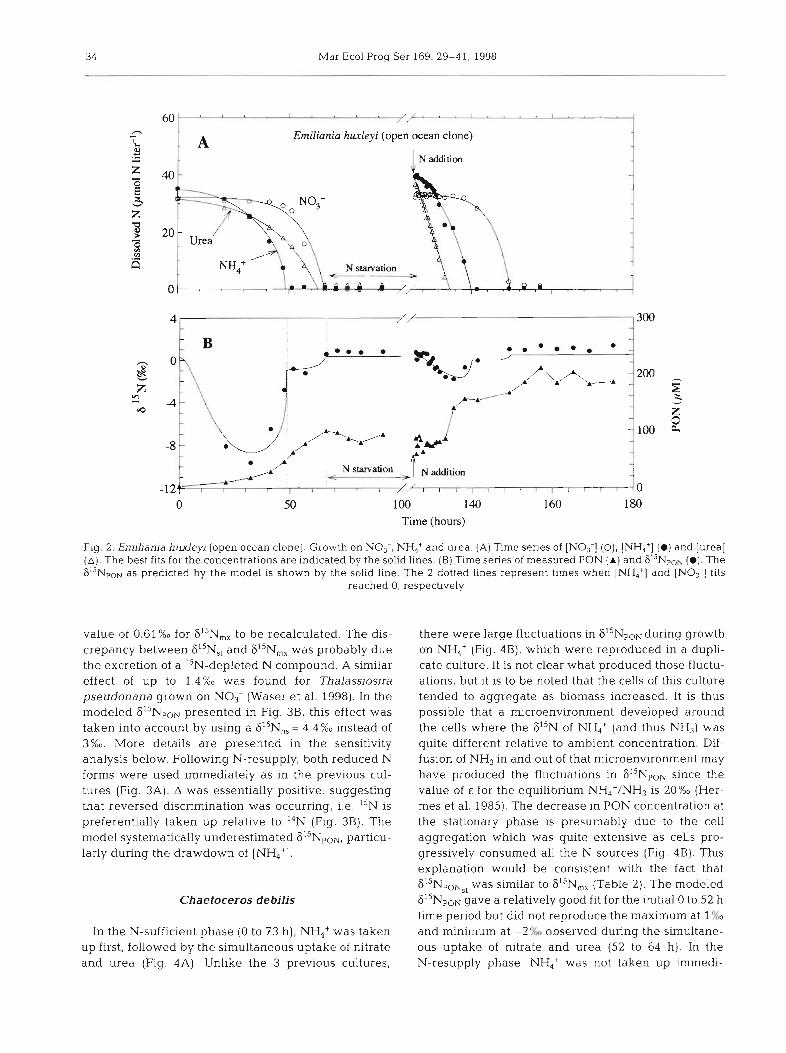
In the N-sufficient phase (0 to 66 h), both NH,,' and urea were taken up flrst and simultaneously (Fig. 2A). No3- was utilized last and only after the [NH,'] decreased to below the detection limit. A similar pat- tern was observed for the 2 other triplicate cultures. The 61sNpou showed a pattern similar to the previous clone, with low initial 61"F,r,z! valucs of - 10'!(x,, increas- ing to -0.82%" slightly after the complete consumption of NH,' (Fig. 2B). At the stationary phase, the 6I5NpoN was 0.?5?;0, a little higher than the value of 0.32?cK3 for 615N,,. The model gave a rela.tively good fit for this culture as well as for the other triplicates (Table 2). The initial A was lower, in part due to the initial amount of PON (Table 2), but also because of the simultaneous uptake of urea and NH,'. This latter point is demon- strated by the good fit using the following variables: &(urea) = 0%" and E(NH,) = 18%" (Fig. 2B). Similar results were found in all the triplicate cultures (Table 2).
In the N-resupply phase, again the reduced N sources, ammonium and urea, were used first (Fig. 2A). The 615N,c,u showed a relatively large decrease which was well predicted by the model using the same vari-
ables as in the N-sufficient phase (Table 2). These results suggested that the GO h of N-starvation aid not affect isotope fractionation. This result shows that the cells were able to rapidly recover from N-starvation and to respond in a similar way as in the N-sufficient phase.
Thalassiosira pseudonana
In the N-sufficient phase (0 to 47 h), NH4+ was uti- lized first, followed by the simultaneous uptake of NO3- and urea (Fig. 3A). Growth on NH4+ produced a large initial decrease in 6'"NpoN to values of -10 to -12% (Fig. 3B). then increased to about 0x0 during the simultaneous growth on urea and NO,- (29 to 47 h) and finally reached an average value of 1.3%0 at the stationary phase. The model gave a relatively good fit for the NH,' uptake phase with the known E(NH,) value of 20% (Waser et al. 1998). However, the model systematically underestimated 6"NpoN during the simultaneous growth on urea and NO3-, in spite of the fact that &(NO,) and &(urea) are known for this spe- cies (Waser e t al. 1998) 6I5Ns, of 1.3?$, was a little higher than the F"'N,, of 0.56% (Table 2). 6lSN,, was then recalculated, making all the appropriate correc- tions for carryover of dissolved N and PON from the inoculum into the culture medium. The inoculum intro- duced: (1) 0.5 pM of NO:,- with a 6I5N estimated a t 10.5":,o, (2 ) 0.9 pM of urea with a 6'"N of about -0.4%0 and. (3) 6 pM of PON wlth a SI5N of O%o. This allowed a
34 Mar Ecol Prog Ser 169: 29-41, 1998
k A
+ A
N starvation '1' - ,I N addition
/ l I l , I , ' , r I I : ~
100 140 160 180 Time (hours)
Fig. 2. Emiliania hu l ey i (open ocean clone]. Growth on NO,-, NH4+ and urea (A) Time series of [NO;] (O), [NH,'] (0) and [urea] (A) . The best fits for the concentrations are indicated by the solid lines. (B) Time senes of measured PON ( A ) and 615Npo~ (0) . The 6 ' ' ~ ~ ~ ~ as predicted by the model is shown by the solid line. The 2 dotted lines represent times when [NH4+J and [NO3-] fits
reached 0, respectively
value of 0.61 %0 for 615N,, to be recalculated. The dis- crepancy between 615N,, and 615N,, was probably due the excretion of a I5N-depleted N compound. A similar effect of up to 1.4%0 was found for Thalassiosira pseudonana grown on NO3- (Waser et al. 1998). In the modeled 615NpoN presented in Fig. 3B, this effect was taken into account by using a F15N,, = 4.4%0 instead of 3%0. More details are presented in the sensitivity analysis below. Following N-resupply, both reduced N forms were used immediately as in the previous cul- tures (Fig. 3A). A was essentially positive, suggesting that reversed discrimination was occurring, i.e. 15N is preferentially taken up relative to 14N (Fig. 3B). The model systematically underestimated 615NpoN, particu- larly during the drawdown of [NH4+].
Chaetoceros debilis
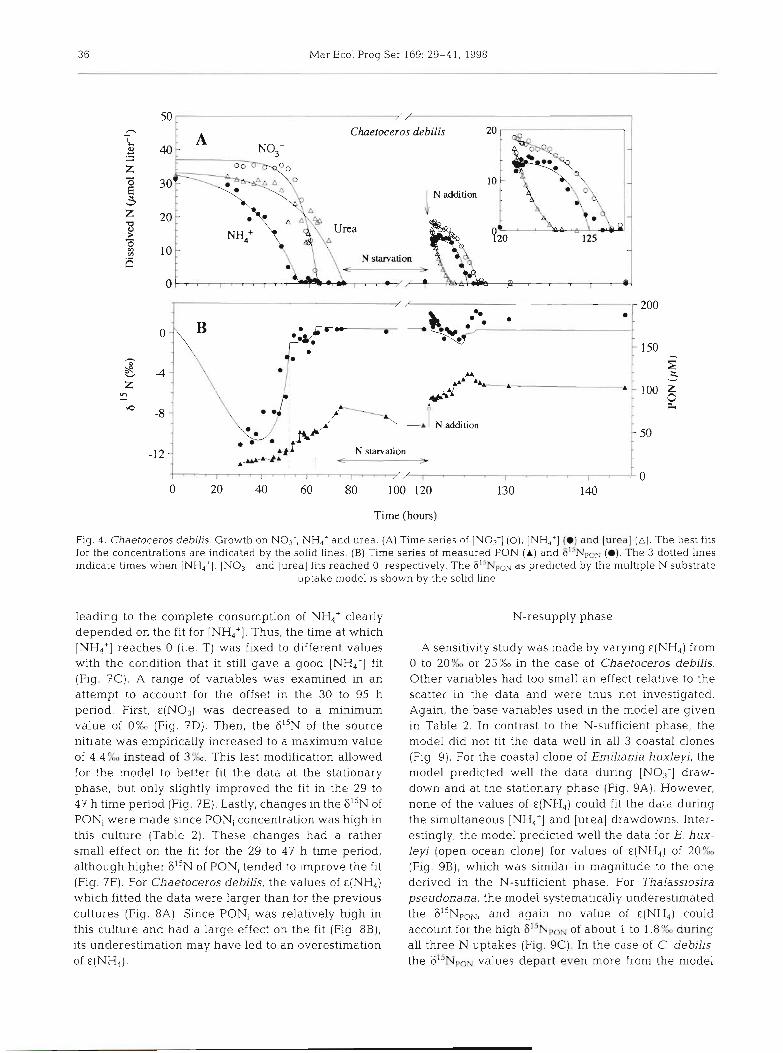
In the N-sufficient phase (0 to 73 h), NH4+ was taken up first, followed by the simultaneous uptake of nitrate and urea (Fig. 4A). Unlike the 3 previous cultures,
there were large fluctuations in i?il'NpoN during growth on NH4+ (Fig. 4B), which were reproduced in a duph- cate culture. It is not clear what produced those fluctu- ations, but it is to be noted that the cells of this culture tended to aggregate as biomass increased. I t is thus possible that a microenvironment developed around the cells where the F15N of NH4' (and thus NH3) was quite different relative to ambient concentration. Dif- fusion of NH3 in and out of that microenvironment may have produced the fluctuations in 615NpoN since the value of E for the equilibrium NH,'/NH3 is 20%0 (Her- mes et al. 1985). The decrease in PON concentration at the stationary phase is presumably due to the cell aggregation which was quite extensive as cells pro- gressively consumed all the N sources (Fig. 4B). This explanation would be consistent with the fact that 615NpoN,t was similar to 615N,, (Table 2) . The modeled 6 1 5 ~ p o N gave a relatively good fit for the initial 0 to 52 h time period but did not reproduce the maximum at 1% and minimum at -2% observed during the simultane- ous uptake of nitrate and urea (52 to 64 h). In the N-resupply phase. NH4+ was not taken up immedi-

Wdser et al.: N isotope fractionation during N uptake 35
Thalassiosira pseudonana 20
0 20 40 60 -0
8095 100 105 110 115 120 Time (hours)
/ / / /
a .
A
N Starvation < >
Fig. 3. Thalassiosira pseudonana. Growth on No3-, NH,' and urea. (A) Time series of [NO3-] (0). [NH,'] (m) and [urea] (A). The best fits for the concentrations are indicated by the solid lines. (B) Time series of measured PON ( A ) and 615NpoN (m) . The 6I5NpoN as predicted by the model is shown by the solid line. The 2 dotted hnes represent times when [NH,+] and [NO,-] fits reached 0,
respectively
200
- 150
3 3
- l o o ,- 2
- M
ately, unlike in all previous cultures (Fig. 4A). The model systematically underestimated the 6l5NPoN, but most of all could not predict the 2 large maxima (Fig. 4B). A duplicate culture was analyzed and con- firmed these features. The results for the duplicate cul- tures are summarized in Table 2.
Sensitivity analysis
N-sufficient conditions and coccolithophore cultures
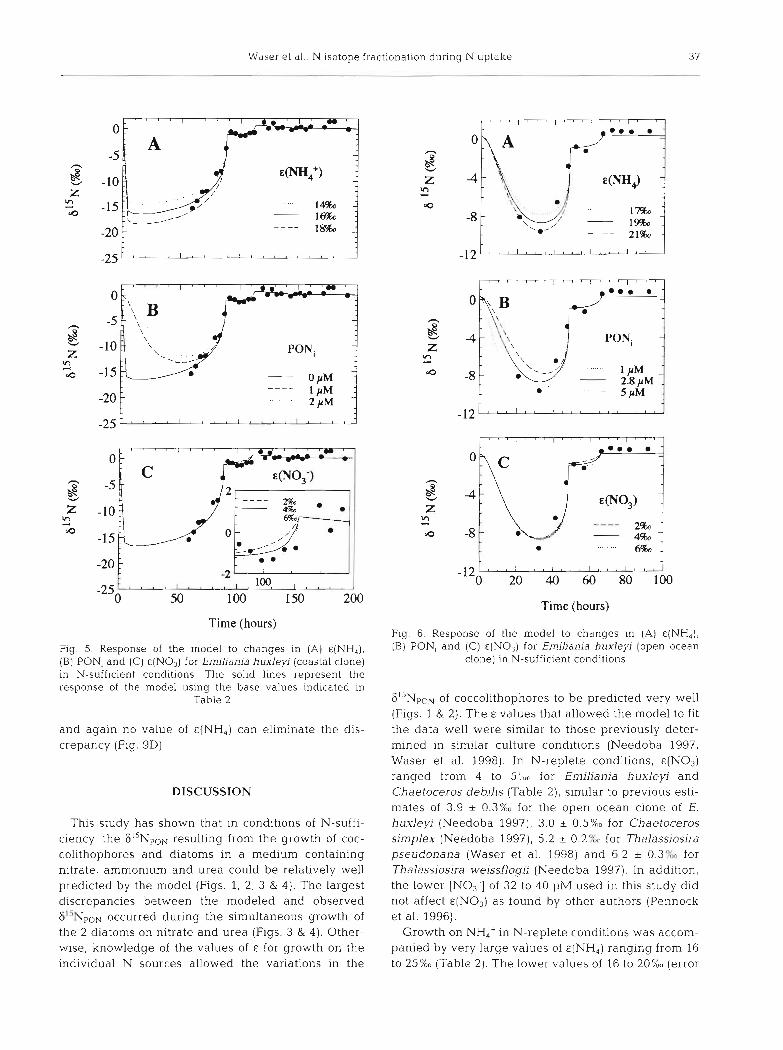
Changes in various variables were made to study their effect on the 6I5NpoN in N-replete conditions. In this study, the value of &(urea) was taken as a constant of O % o . For the coastal clone of Emiliania huxleyi, changes in the values of &(NH,), E(NO,) and PON, are shown in Fig. 5. Variations in the values of &(NH4) and PONi produced large changes in the 6I5NpoN at low PON concentrations (Fig. 5A, B). Thus PONi is a critical variable in determining &(NHq) and, in this case, an underestimation of PON, by 1 g M leads to an overesti-
mation of E(NH,) of about 2%0. The value of &(NO,) that fits the data best is in the range of 4 to 6 % (Fig. 5C), similar to previously determined E for E. huxleyi and Thalassiosira pseudonana (Needoba 1997, Waser et al. 1998). For the open ocean clone of E. huxleyi, changes in &(NH,), &(NO3), and PON, were studied (Fig. 6). PON, was again a critical variable, with a 2 pM error on PON, equivalent to a 1 to 1.5%0 change in €(NH4) (Fig. 6A, B). There were few data collected during the nitrate uptake phase, but &(NO3) was clearly larger than 2%0 and closer to 4-6%0 (Fig. 6C) as in 2 of the triplicate cultures (Table 2).
N-sufficient conditions and diatom cultures
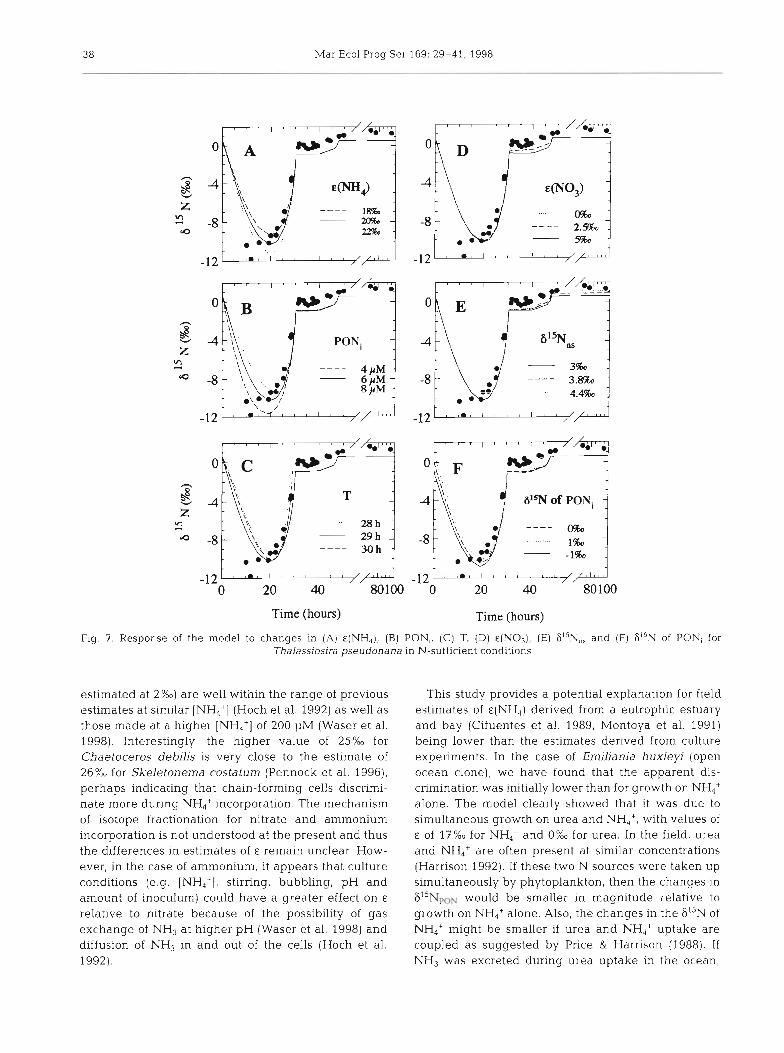
For Thalassiosira pseudonana, the model predicted the data well for growth on NH,' for e(NH,) values of 18 to 20% (Fig. ?A). PON, had again a large effect on the response of the model during the initial growth on NH4+ (Fig. 7B). Changes in the fit for [NH,'] were made. This is because the rapid change in 615NpoN
36 Mar Ecol Prog Ser 169: 29-41. 1998
Chaetoceros debilis
200 '
- 150 - 5
R
- 50
' N starvation - Time (hours)
Fig. 4. Chaetoceros debilis. Growth on NO3-, NH,+ and urea. (A) Time series of IN0,-] (0), [NH,'] (a) and [urea] (A) . The best fits for the concentrations are indicated by the solid lines. (B) Time series of measured PON (A) and 615NpoN (a). The 3 dotted lines indicate times when [NH,']. [NO3-] and [urea] fits reached 0, respectively. The G1'NpoN as predicted by the multiple N substrate
uptake model is shown by the solid line
leading to the complete consumption of NH,' clearly depended on the fit for [NH,']. Thus, the time at which [NH.,'] reaches 0 (i.e. T) was fixed to different values with the condition that it still gave a good [NH,+] fit (Fig. 7C). A range of variables was examined in an attempt to account for the offset in the 30 to 95 h period. First, €(NO3) was decreased to a minimum value of O%o (Fig. ?D). Then, the 6I5N of the source nitrate was empirically increased to a maximum value of 4.4OXm instead of 3%. This last modification allowed for the model to better fit the data at the stationary phase, but only slightly improved the fit in the 29 to 47 h time period (Fig. 7E). Lastly, changes In the 615N of PONi were made since PONi concentration was high in this culture (Table 2). These changes had a rather small effect on the fit for the 29 to 47 h time period, although higher 615N of PON, tended to improve the fit (Fig. ?F). For Chaetoceros debilis, the values of €(NH4) which fitted the data were larger than for the previous cultures (Fig. 8A). Since PONi was relatively high in this culture and had a large effect on the fit (Fig 8 B ) , its underestimation may have led to an overestimation of E (NH,) .
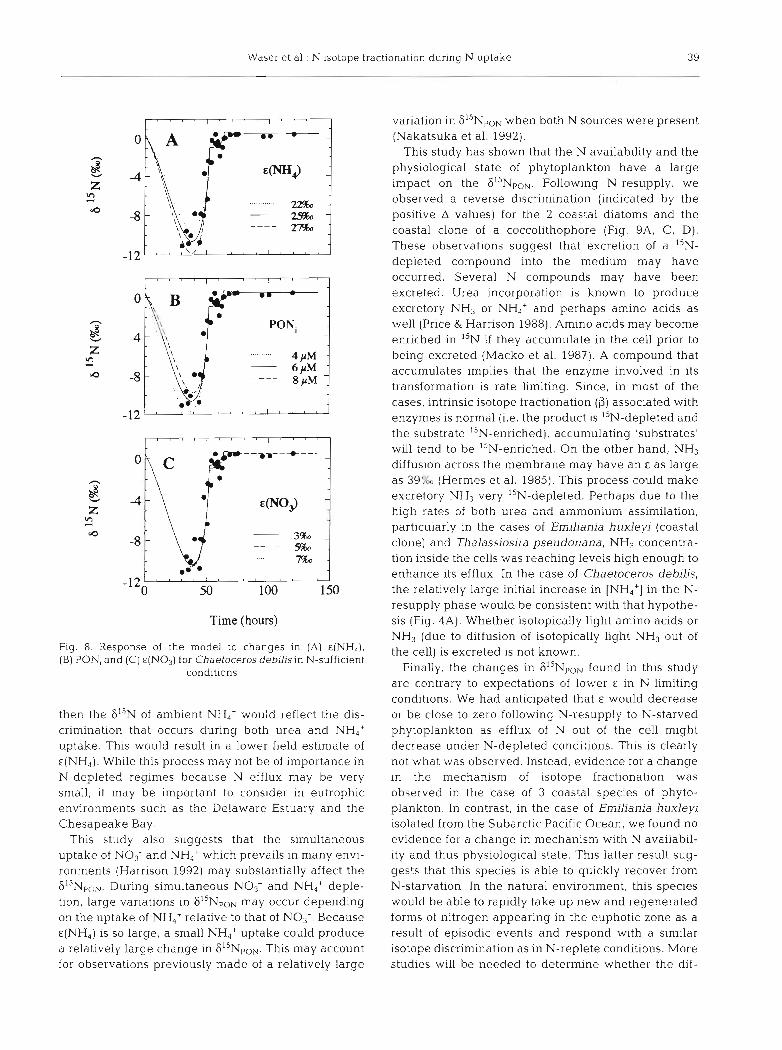
N-resupply phase
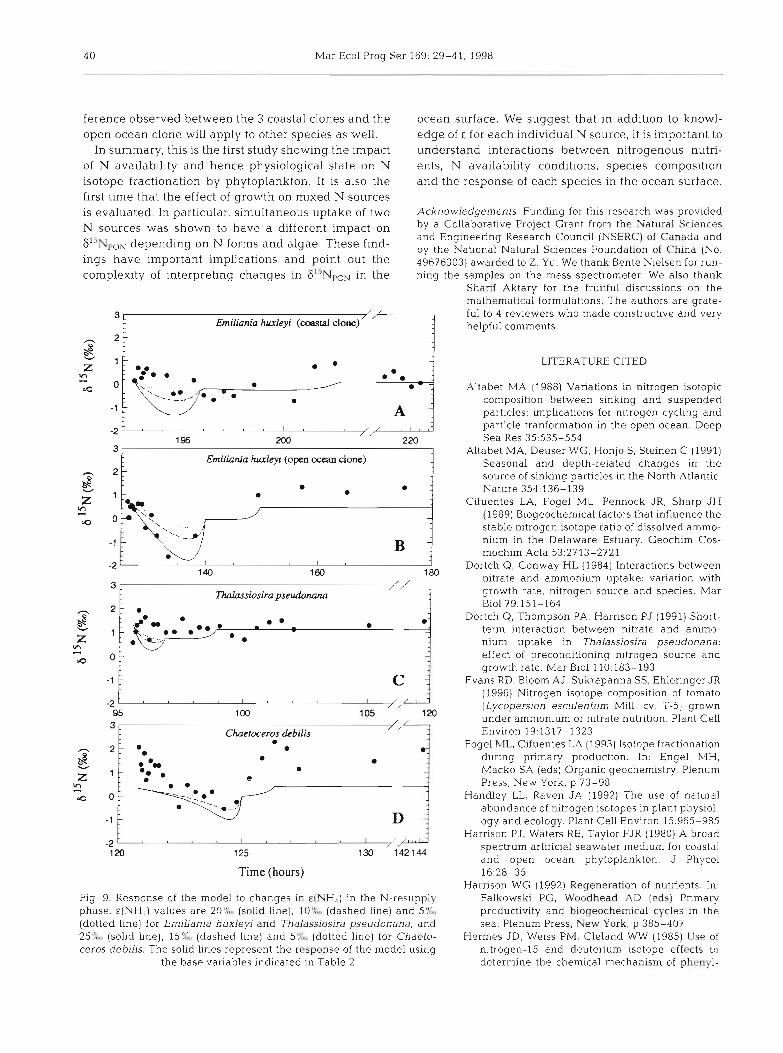
A sensitivity study was made by varying &(NH4) from 0 to 20°A or 25%0 in the case of Chaetoceros debilis. Other variables had too small an effect relative to the scatter in the data and were thus not investigated. Again, the base variables used in the model are given in Table 2 . In contrast to the N-sufficient phase, the model did not fit the data well in all 3 coastal clones (Fig 9) . For the coastal clone of Emilian~a huxleyi, the model predicted well the data durlng [NO;] draw- down and at the stationary phase (Fig. 9A). However, none of the values of &(NH,) could fit the data during the simultaneous [NH4+] and [urea] drawdowns. Inter- estingly, the model predicted well the data for E. hux- leyi (open ocean clone) for values of E(NH,) of 20% (Fig. 9B), which was similar in magnitude to the one derived in the N-sufficient phase. For Thalassiosira pseudonana, the model systematically underestimated the 615NpoN, and again no value of €(NH4) could account for the high 8''NpoN of about 1 to 1.8Yw during all three N uptakes (Fig. 9C). In the case of C. debilis, the 615NpoN values depart even more from the model
Waser et a.].: N Isotope fracl :ionation during N uptake 37
Time (hours)
Fig. 5. Response of the model to changes in (A) &(NH,), (B) PON, and (C) &(NO,) for Emiliania huxleyi (coastal clone) in N-sufficient conditions. The solid lines represent the response of the model using the base values indicated in
Table 2
and again no value of &(NH,) can eliminate the dis- crepancy (Fig. 9D).
DISCUSSION
This study has shown that in conditions of N-suffi- ciency, the 6I5NpoN resulting from the growth of coc- colithophores and diatoms in a medium containing nitrate, ammonium and urea could be relatively well predicted by the model (Figs. 1, 2, 3 & 4). The largest discrepancies between the modeled and observed SiiNpoN occurred during the simultaneous growth of the 2 diatoms on nitrate and urea (Figs. 3 & 4). Other- wise, knowledge of the values of E for growth on the individual N sources allowed the variations in the
Time (hours)
Fig. 6. Response of the model to changes in (A) c(NH,), (B) PON, and (C) € (No3) for Emilian~a hux1ej.l (open ocean
clone) in N-sufficient conditions
GliNpON of coccolithophores to be predicted very well (Figs. 1 & 2). The E values that allowed the model to fit the data well were similar to those previously deter- mined in similar culture conditions (Needoba 1997, Waser et al. 1998). In N-replete conditions, &(NO3) ranged froin 4 to 5"un for En~iliania huxley~ and Chaetoceros debllis (Table 2 ) , similar to previous esti- mates of 3.9 + 0.3% for the open ocean clone of E. huxleyi (Needoba 1997), 3.0 + 0.5% for Chaetoceros simplex (Needoba 1997), 5.2 + 0.2% for Thalassiosira pseudonana (Waser et a1 1998) and 6.2 + 0.3'L for Thalassiosira weissflogii (Needoba 1997). In addition, the lower [NO3-] of 32 to 40 pM used in this study did not affect E ( N O ~ ) as found by other authors (Pennock et al. 1996).
Growth on NH,' in N-replete conditions was accom- panied by very large values of &(NH,) ranging from 16 to 25%0 (Table 2) . The lower values of 16 to 20%" (error
3 8 Mar Ecol Prog Ser 169: 29-41, 1998
PON,
---- 4 PM
. . . . . . . . . - 8 r M ,
Time (hours) Time (hours)
Fig. 7. Response of the model to changes in (A) E(NH,), (B) PON,. ( C ) T. (D) e(N03), (E) 61SNns and (F1 6"N of PONi for Thalassiosira pseudonana in N-sufficient conditions
estimated at 2%0) are well within the range of previous estimates at similar [NH,+] (Hoch et al. 1992) as well as those made at a higher [NH,'] of 200 FM (Waser et al. 1998). Interestingly, the higher value of 25%0 for Chaetoceros debilis is very close to the estimate of 26%0 for Skeletonema costaturn (Pennock et al. 1996), perhaps indicating that chain-forming cells discrimi- nate more during NH4+ incorporation. The mechanism of isotope fractionation for nitrate and ammonium incorporation is not understood a t the present and thus the differences in estimates of E remain unclear. How- ever, in the case of ammonium, it appears that culture conditions (e.g. [NH,'], stirring, bubbling, pH and amount of inoculum) could have a greater effect on E
relative to nitrate because of the possibility of gas exchange of NHS at higher pH (Waser et al. 1998) and diffusion of NH3 in and out of the cells (Hoch et al. 1992).
This study provides a potential explanation for field estimates of E(NH,) derived from a eutrophic estuary and bay (Cifuentes et al. 1989, Montoya et al. 1991) being lower than the estimates derived from culture experiments. In the case of Emiliania huxleyi (open ocean clone), we have found that the apparent dis- crimination was initially lower than for growth on NH,' alone. The model clearly showed that it was due to simultaneous growth on urea and NH4+, with values of E of 17%0 for NH,' and O%O for urea. In the field, urea and NH,' are often present at similar concentrations (Harrison 1992). If these two N sources were taken up simultaneously by phytoplankton, then the changes jn 6I5Npos would be smaller in magnitude relative to growth on NH,' alone. Also, the changes in the S1'N of NH4+ might be smaller if urea and NH4+ uptake are coupled as suggested by Price & Harrison (1988). If NH3 was excreted during urea uptake in the ocean,
Waser et al.: N isotope fractionation during N uptake 39
oh. B m. - i
l " " I " " I " ' 1
Time (hours)
Flg 8 Response of the model to changes In (A) &(NH,), (B) PON, and (C) €(NO,) for Chaetoceros debd~sin N-sufficient
conditions
then the 6'" of ambient NH,+ would reflect the dis- crimination that occurs during both urea and NH4+ uptake. This would result in a lower field estimate of E(NH,). While this process may not be of importance in N-depleted regimes because N efflux may be very small, it may be important to consider in eutrophic environments such as the Delaware Estuary and the Chesapeake Bay.
This study also suggests that the simultaneous uptake of NO3- and NH4+ which prevails in many envi- ronments (Harrison 1992) may substantially affect the 6I5NpoN. During simultaneous NO3- and NH,' deple- tion, large variations in 6"NpoN may occur depending on the uptake of NH,' relative to that of NO3-. Because E(NH,) is so large, a small NH4+ uptake could produce a relatively large change in 615NpoN. This may account for observations previously made of a relatively large
variation in 6I5NpoN when both N sources were present (Nakatsuka et al. 1992).
This study has shown that the N availability and the physiological state of phytoplankton have a large impact on the Following N-resupply, we observed a reverse discrimination (indicated by the positive A values) for the 2 coastal diatoms and the coastal clone of a coccolithophore (Fig. 9A, C, D). These observations suggest that excretion of a I5N- depleted compound into the medium may have occurred. Several N compounds may have been excreted. Urea incorporation is known to produce excretory NH3 or NH,' and perhaps amino acids as well (Price & Harrison 1988). Amino acids may become enriched in I5N if they accumulate in the cell prior to being excreted (Macko et al. 1987). A compound that accumulates implies that the enzyme involved in its transformation is rate limiting. Since, in most of the cases, intrinsic isotope fractionation (P) associated with enzymes is normal (i.e. the product is I5N-depleted and the substrate "N-enriched), accumulating 'substrates' will tend to be I5N-enriched. On the other hand, NH, diffusion across the membrane may have an E a s large as 39% (Hermes et al. 1985). This process could make excretory NH, very I5N-depleted. Perhaps due to the high rates of both urea and ammonium assimilation, particularly in the cases of Emiliania huxleyi (coastal clone) and Thalassioslra pseudonana, NH3 concentra- tion inside the cells was reaching levels high enough to enhance its efflux. In the case of Chaetoceros debilis, the relatively large initial increase in [NH4+] in the N- resupply phase would be consistent with that hypothe- sis (Fig. 4A). Whether isotopically light amino acids or NH3 (due to diffusion of isotopically light NH3 out of the cell) is excreted is not known.
Finally, the changes in 615NpoN found in this study are contrary to expectations of lower e in N-limiting conditions. We had anticipated that E would decrease or be close to zero following N-resupply to N-starved phytoplankton as efflux of N out of the cell might decrease under N-depleted conditions. This is clearly not what was observed. Instead, evidence for a change in the mechanism of isotope fractionation was observed in the case of 3 coastal species of phyto- plankton. In contrast, in the case of Emiliania huxleyi isolated from the Subarctic Pacific Ocean, we found no evidence for a change in mechanism with availabil- ity and thus physiological state. This latter result sug- gests that this species is able to quickly recover from N-starvation. In the natural environment, this species would be able to rapidly take up new and regenerated forms of nitrogen appearing in the euphotic zone as a result of episodic events and respond with a similar isotope discrimination as in N-replete conditions. More studies will be needed to determine whether the dif-
4 0 Mar Ecol Prog Ser 169: 29-41. 1998
ference observed between the 3 coastal clones and the ocean surface. We suggest that in addition to knowl- open ocean clone will apply to other species as well. edge of E for each individual N source, it is important to
Jn summary, this is the first study showing the impact understand interactions between nitrogenous nutri- of N availability and hence physiological state on N ents, N availability conditions, species composition isotope fractionation by phytoplankton. I t is also the and the response of each species in the ocean surface. first time that the effect of growth on mixed N sources is evaluated. In particular, simultaneous uptake of two Acknowledgements. Funding for this research was provided
N sources was shown to have a different impact on by a Collaborative Project Grant from the Natural Sciences and Engineering Research Council (NSERC) of Canada and
G1"NpOlu depending On forms and These find- by the Natlonal Natural Sciences Foundation of China (No. ings have important implications and point out the 49676303) awarded to Z. Yu. We thank Bente Nielsen for run- complexity of interpreting changes in F"NpoN in the ning the samples on the mass spectrometer. We also thank
Sharif Aktary for the fruitful discussions on the mathematical formulations. The authors are grate- ful to 4 reviewers who made constructive and very helpful comments.
LITERATURE CITED
Altabet MA (1988) Variations in nitrogen isotopic • composition between sinking and suspended
particles: implications for nitrogen cycling and
-2 r particle tranformation in the open ocean. Deep 1 95 200 220 Sea Res 35:535-554
3 L Altabet MA, Deuser WG, Honjo S, Steinen C (1991) Emiliania h l e y i (open ocean cione) Seasonal and depth-related changes in the
source of sinking particles in the North Atlantic. Nature 354:136-139
Cifuentes LA, Fogel ML, Pennock JR, Sharp J H (1989) Biogeochemical factors that influence the stable nitrogen isotope ratio of dissolved ammo- nium in the Delaware Estuary. Geochim Cos- mochim Acta 53:2713-2721
-2 Dortch Q, Conway HL (1.984) Interactions between 140 180
3 n~trate and ammonium uptake: variation with
Thalassiosira pseudo- growth rate, nitrogen source and species. Mar
2: . Biol 79:151.-164 a Dortch Q, Thompson PA, Harrison PJ (1991) Short- a term interaction between nitrate and ammo-
2 nium uptake in Thalassiosira pseudonana: 2 'a 0; effect of preconditioning nltrogen source and
growth rate. Mar Biol 110:183-193 -1 : Evans RD, Bloom AJ, Sukrapanna SS, Ehleringer JR
(1996) Nitrogen isotope composition of tomato -2 (Lycopersion esculenturn Mill. CV. T-5) grown
95 100 1 05
. . . under ammonium or nitrate nutrition. Plant Cell
Chaeroceros debilis Environ 19:1317-1323 Fogel ML. Cifuentes LA (1993) Isotope fractionation
during primary production. In: Engel blH, • Macko SA (eds) Organic geochemistry. Plenum
Press, New York, p 73-98 Handley LL, Raven JA (1992) The use of natural
abundance of nitrogen isotopes in plant physiol- ogy and ecology. Plant Cell Environ 15:965-985 DJ Harrison PJ. Waters RE, Taylor FJR (1980) A broad
-2 I , ,
120 125 130 142144 spectrum artificial seawater medium for coastal and open ocean phytoplankton. J Phycol
Time (hours) 16:28-35 Harrison WG (1992) Regeneration of nutrients In
Fig. 9. Kcsponse of the model to changes in c(NH,) in the N-resupply Falkowski PG, Woodhead AD (eds) Pnmary phase. E(NH.,I values are 20?L (solid line), 10'YM5 (dashed line) and 5',Y., productivity and biogeochemical cycles in the (dotted line) for Emiliania huxleyi and Thalassiosira pseudonana, and sea. Plenum Press, New York, p 385-407 2576, (solid line), 15:L (dashed line) and 5 % (dotted line) for Chaeto- Hermes JD, Weiss PM, Cleland WW (1985) Use of ceros debilis. The solid lines represent the response of the model using nitrogen.-15 and deuterium isotope effects to
the base variables ind~cated in Table 2 determine the chemi.ca1 mechanism of phenyl-

Waser et al.. N isotope fractionation during N uptake 4 1
alanine ammonia-lyase. Biochemistry 24~2959-2967 Hoch MP, Fogel ML, l r c h m a n DL (1992) Isotope fractiona-
tion associated with ammonium uptake by a marine bac- terium. Limnol Oceanogr 37:1447-1459
Horrigan SG, Montoya JP, Nevins JL, McCarthy J J (1990) Natural isotopic composition of dissolved inorganic nitro- gen in the Chesapeake Bay. Estuar Coastal Shclf SCI 30. 393-410
Jones MIX (1984) Nitrate reduction by shaking with cadmium. alternative to cadmium columns. Water Res 18:643-646
Macko SA, Fogel ML, Hare PE, Hoering TC (1987) Isotoplc fractionation of nitrogen and carbon in the synthesis of amino acids by microorganisms. Chern Geol 65:79-92
Mariotti A, Germon JC, Hubert P, Kaiser P, Letolle R, Tardieux A, Tardieux P (1981) Experimental determina- tion of n~trogen kinet~c isotope fractionation. some prlnci- ples; illustration for the denitrification and nitri.ficatlon processes. Plant Soil 62413-430
Mariotti A. Mariotti F, Champigny M. Amarger N. Moyse A (1982) Nitl-ogen isotope fractionation associated with nitrate reductase activ~ty and uptake of NO, by Pearl MII- let. Plant Physiol 69:880-884
McCarthy J J , Goldman J C (1979) Nitrogenous nutrition of marine phytoplankton in nutrient-depleted waters. Sci- ence 203:670-672
Montoya JP, Horrigan SG, McCarthy J J (1991) Rapid, storm- induced changes in the natural abundance of '% in a planktonic ecosystem. Chesapeake Bay, USA. Geochim Cosmochim Acta 55-3627-3638
Montoya JP, McCarthy J J (1995) Isotopic fractionation dunng nitrate uptake by phytoplankton grown in continuous cul- tare. J Plankton Res i7:439-464
Nakatsuka T, Handa N. Wada E, Wong CS (1992) The dynamic changes of stable isotopic ratios of carbon and nitrogen in suspended and sedimented particulate organic matter during a phytoplankton bloom. J Mar Res 50:267-296
Needoba J (1997) Nitrogen isotope fractionation by four groups of phytoplankton grown on nitrate. BSc disserta- tion, University of B~itish Columbia, Vancouver
Editorial responsibil~ty: Ot to Kinne (Editor), Oldendori/Luhe, Germany
Pennock JR, Velinsky DJ, Ludlam JM. Sharp J H (1996) Iso- topic fractlonation of ammonium and nitrate during uptake by Skeletonenm costatun?. implications for 6 '"N dynamics under bloom conditions. Limnol Oceanogr 41 451-459
Price KM, Harrison PJ (1987) Comparison of methods for the analysis of dissolved urea in seawater Mar Biol 94: 307-317
Price Nb1, Harrison PJ (1988) Uptake of urea C and N by the coastal marine dlatom Thalassiosira pseudonana. Limnol Oceanogr 33.528-537
Sigman DM, McCorckle DC, Francois K , Donaghue J , Altabet blh. Michener R. Fry B (1996) A new method for the nitro- yen isotopic analysis of oceanic nitrate and first results from the Southern Ocean 1996 Ocean Science Meeting, San Diego EOS (Trans Am Geophys Un) 76:143
Slawyk G, Maclsaac J J (1972) Comparison of two automated ammonium methods in a region of coastal upwelling. Deep Sea Res 19:521-524
Villareal TA, Altabet MA, Culver-Rymsza K (1993) Nitrogen transport by vertically migrating diatom mats in the North Pacific Ocean. Nature 363:709-712
Voss M, Altabet M A , Bodungen Bv (1996) 6 1 5 ~ in sediment- ing particles a s indicator of euphotic-zone processes. Deep Sea Res 43-33-47
Wada E (1980) Nitrogen isotope fract~onation and its signifl- cance in biogeochemical processes occurring in marine environments. In: Goldberg ED, Horibe Y, Saruhashi K (eds) Isotope marine chemistry. Uchlda-Rokakuho, Tokyo, p 375-398
Wada E, Hattori A (1978) Nitrogen isotope effects in the assimilation of inorganic nitrogenous compounds by marine diatoms. Geomicrobiol J 1:85-101
Waser NAD, Turpin DH, Harrison PJ, Nielsen B, Calvert SE (1998) Nitrogen isotope fractionat~on during the uptake and assimilation of nitrate, nitrite, ammonium and urea by a marine diatom. Limnol Oceanogr 43:215-224
Wu J, Calvert SE, Wong CS (1997) 15N/14N isotope ratios in the subarctic northeast Pacific ecosystem: nitrate utiliza- tion and trophic structure. Deep Sea Res 44.287-314
Submitted: December 15, 1997; Accepted: May 26, 1998 Proofs received from author(s): July 20, 1998