ninth annual retirement savings 10 9 11 fw 24.05.13 fw 28 ... widows pensions report 2013.pdf ·...
TRANSCRIPT
Scottish Widows UK Pensions Report June 2013
Retirement savings across the nation.
Ninth Annual Pensions Report.
CREATIVE SERVICES DOCUMENT CHECKLIST
• Mandatory checks must be completed on all proofs.
• Additional checks must also be completed on the first proof and subsequently when relevant or necessary.
Proof number 1 2 3 4 5 6 7 Comments
Mandatory checks
Logo Size/PositionHalf way through so no checks done
Ali 25/04/13
Footer/Form number/version date is correct • • • • •
Spell check • • • • • • •
Ensure specification is up to date
Compare alterations to comment summary • • • •
Layout/text
Remove bad line breaks • • • • • • •
Check all hyphenation/n-dashes
Remove double spaces/full stops (except deliberate) • • •
Telephone numbers/postcodes are not split
No full stop after URLs
Folio/page numbers are in correct order/position
Images/graphics
Usage is up to date • • • • •
Image type – TIFF (300dpi) or EPS (postscript level 3)
Widow looking into page
Tables/boxes/charts/graphs are on brand
Graphs/charts match figures
Document
Most recent logos and widows are used.
Colour split (CMYK or spot) • • • • • • • •
Key Facts logo – use template for position
Forms can be completed • • •
Envelopes/letters – check position •
Initials ALI FW FW FW FW FW FW FW ALI
Date 25/04/13 26.04.13 03.05.13 06.05.13 13.05.13 16.05.13 17.05.13 20.05.13 28/05/13
Document Info Notes
Form 46273 Half way through so no checks done Ali 25/04/13Job ID 035610
Size A4
Pages 32pp
Colour CMYK
Version MAY 2013
Operator Info
1 ALI 25/04/13
2 FW 26.04.13
3 FW(2) 03.05.13
4 FW 06.05.13
5 FW 10.05.13
6 FW 13.05.13
7 FW 16.05.13
8 FW 20.05.13
9 FW 21.05.13
10 FW 23.05.13
11 FW 24.05.13
12 FW 28.05.13
13 ALI 28/05/13
14
15
2
Contents.Foreword. 2
Executive summary. 4-6
Introduction. 7
UK pensions landscape. 8-9
Part 1. 2013 Pensions Index and Average Savings Ratio 10-15
Part 2. Differences between savers 16-17
Part 3. Preparing for a comfortable retirement 18-20
Part 4. Managing the transition into retirement 21-24
Part 5. Key findings and recommendations 25-28
A negative savings trend, but with positive signs 25 of improvement
A mismatch between expectation and reality 27
Retirement planning is not just about pensions 27
Where you work makes a big difference 28
Appendix 1: The Pensions Index and the Average Savings Ratio 29-30
Foreword.
We want people to have a decent and secure income in their retirement and to achieve this we must all encourage and enable a culture of individual saving. I have already introduced automatic enrolment which over the next five years will support up to 11 million people to begin saving, or save more for their retirement. The largest employers have already started automatically enrolling all eligible staff into a workplace pension. As of April this year, employers with more than 6,000 staff will have reached their staging date.
It is early days and we still have a long way to go – it will be 2018 before we see automatic enrolment fully rolled out. However, there are some positive signs. We know that pension saving has increased among the large employers and early indications are the number of people opting out of pension saving is lower than expected.
Some employers who contractually enrol workers have also seen some interesting results. With these employers the people they are automatically enrolling had already chosen to leave their scheme and stop saving. But we are very pleased that when they were automatically enrolled more than half of these people are now staying in and saving. This shows why re-enrolment every three years is so important.
We are also introducing the new single tier pension which will give many more people access to a full state pension and support automatic enrolment through providing certainty about what individuals can expect to receive from the State and when. Together it will make it easier and simpler for people to save and provide today’s working population with a firm foundation for retirement.
Now that automatic enrolment is up and running, we need to think about how we ensure we capture the good things the market is delivering and get that best practice embedded for all those who will be starting to save for a pension. For too long the number of people saving in workplace schemes has declined. We are determined to turn this trend around and restore trust in our pensions system.
We want everyone to get the most that they can out of their pension savings. We must focus on creating a future pensions landscape that gives people high quality schemes to save in and a balance of risk they feel comfortable with. Employers, industry, consumer groups as well as the regulators need to work together to make this happen and give millions the opportunity to save for a better retirement.
Steve Webb MP Minister of State for Pensions
3
Contents.Foreword. 2
Executive summary. 4-6
Introduction. 7
UK pensions landscape. 8-9
Part 1. 2013 Pensions Index and Average Savings Ratio 10-15
Part 2. Differences between savers 16-17
Part 3. Preparing for a comfortable retirement 18-20
Part 4. Managing the transition into retirement 21-24
Part 5. Key findings and recommendations 25-28
A negative savings trend, but with positive signs 25 of improvement
A mismatch between expectation and reality 27
Retirement planning is not just about pensions 27
Where you work makes a big difference 28
Appendix 1: The Pensions Index and the Average Savings Ratio 29-30
Foreword.
We want people to have a decent and secure income in their retirement and to achieve this we must all encourage and enable a culture of individual saving. I have already introduced automatic enrolment which over the next five years will support up to 11 million people to begin saving, or save more for their retirement. The largest employers have already started automatically enrolling all eligible staff into a workplace pension. As of April this year, employers with more than 6,000 staff will have reached their staging date.
Now that automatic enrolment is up and running, we need to think about how we ensure we capture the good things the market is delivering and get that best practice embedded for all those who will be starting to save for a pension. For too long the number of people saving in workplace schemes has declined. We are determined to turn this trend around and restore trust in our pensions system.
We want everyone to get the most that they can out of their pension savings. We must focus on creating a future pensions landscape that gives people high quality schemes to save in and a balance of risk they feel comfortable with. Employers, industry, consumer groups as well as the regulators need to work together to make this happen and give millions the opportunity to save for a better retirement.
Steve Webb MP Minister of State for Pensions
2013 Pensions Index and Average Savings Ratio
Appendix 1: The Pensions Index and the Average Savings Ratio
Preparing for a comfortable retirement
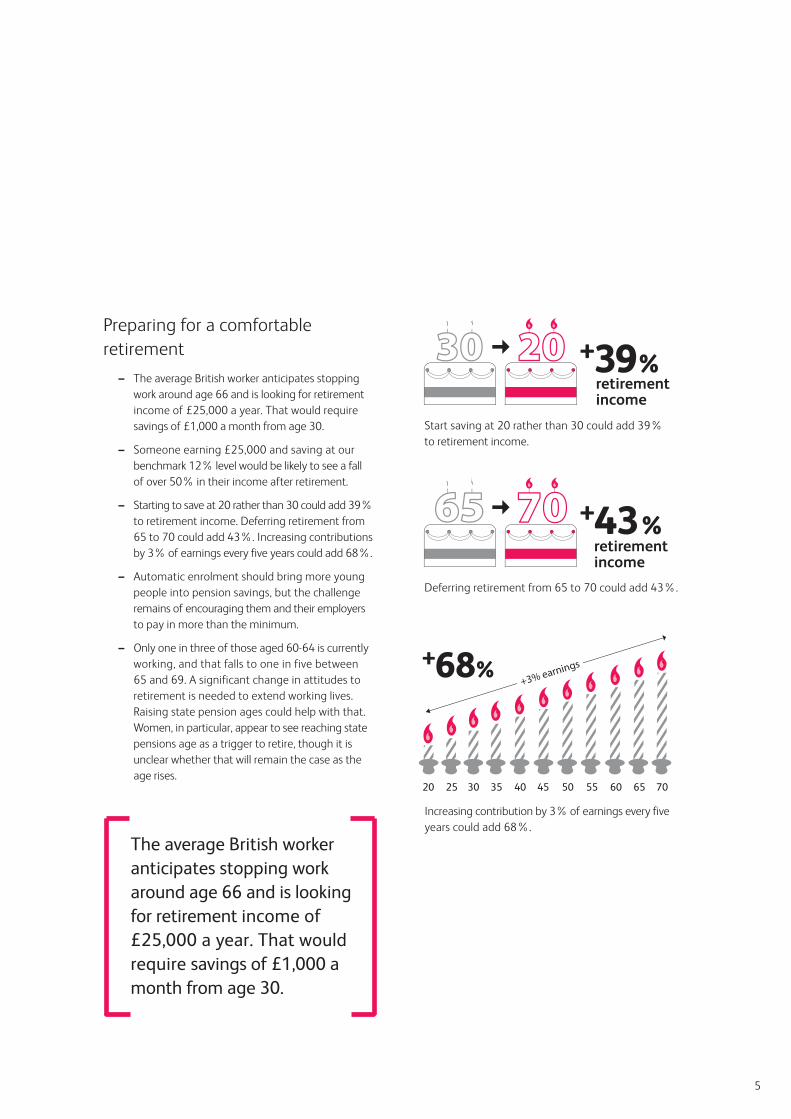
– The average British worker anticipates stopping work around age 66 and is looking for retirement income of £25,000 a year. That would require savings of £1,000 a month from age 30.
– Someone earning £25,000 and saving at our benchmark 12% level would be likely to see a fall of over 50% in their income after retirement.
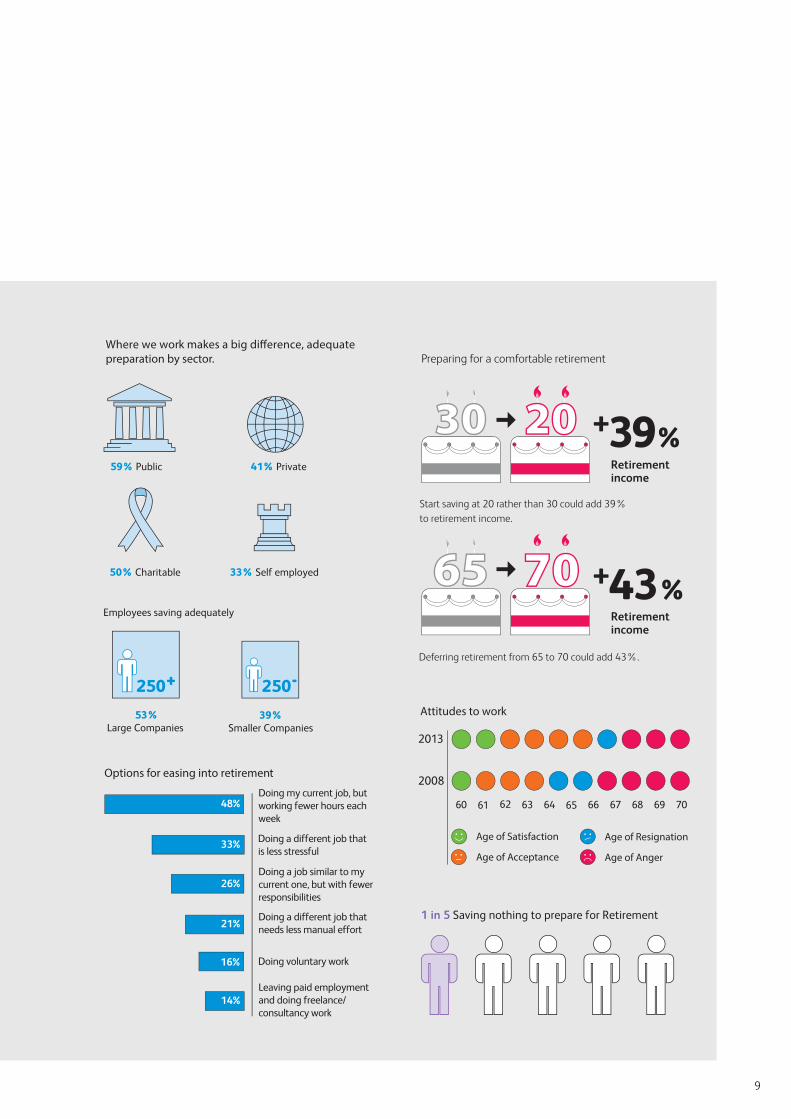
– Starting to save at 20 rather than 30 could add 39% to retirement income. Deferring retirement from 65 to 70 could add 43%. Increasing contributions by 3% of earnings every five years could add 68%.
– Automatic enrolment should bring more young people into pension savings, but the challenge remains of encouraging them and their employers to pay in more than the minimum.
– Only one in three of those aged 60-64 is currently working, and that falls to one in five between 65 and 69. A significant change in attitudes to retirement is needed to extend working lives. Raising state pension ages could help with that. Women, in particular, appear to see reaching state pensions age as a trigger to retire, though it is unclear whether that will remain the case as the age rises.
Executive summary.
The ninth annual Scottish Widows Pensions Report reveals a slight decline in the level of preparation for retirement compared with last year, meaning adequate provision is at an all-time low. However, there are signs that more people are now making the effort to save for retirement, but not at high enough levels.
The lower dependence on defined benefit provision, which we noted last year, has continued, and is not being compensated for by an adequate level of defined contribution savings. There has also been a significant widening of the gap between men and women at younger ages.
The Scottish Widows Pensions Index
The Pensions Index measures the current adequacy of provision by those who could and should be preparing financially for their retirement.
– Only 45% are making enough provision for their retirement, down from 46% in 2012.
– The fall in the Pensions Index is a result of fewer people who are not relying mainly on a defined contribution pension saving at the benchmark 12% level.
– 20% are saving nothing in 2013, compared with 22% in 2012.
– The gender gap between men and women is 9%, up from 7% last year. 49% of men are currently saving adequately, compared to 40% of women.
– The age gap is similar to last year. 53% of over-50s are preparing adequately, compared with 42% of those between 30 and 50. More women over 50 are saving adequately this year than last year, but fewer men. This finding is reversed for those under 50, with only 36% of women aged 30-50 saving adequately.
– Currently 55% of those earning over £30,000 are saving adequately, but only 40% of those earning between £10,000 and £30,000. This is similar to 2012, but there is evidence of lower savings among those earning over £50,000 a year.
The Scottish Widows Average Savings Ratio
The Average Savings Ratio focuses on those who are not relying on a defined benefit pension for their main income in retirement, and measures their savings for retirement as a percentage of total income.
– The Average Savings Ratio for 2013 is 9.1%, up from 8.9% in 2012.
– The increase is a result of more people saving between 6% and 12% of income, and also of fewer non-savers than last year.
4
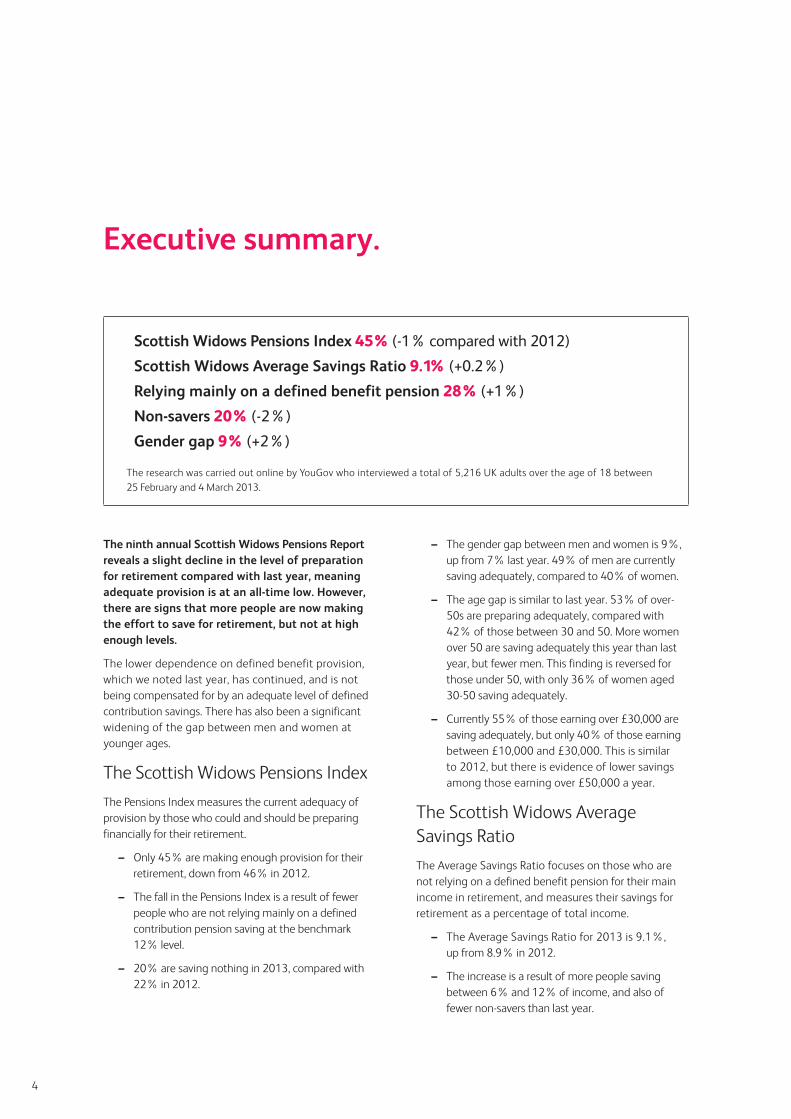
Scottish Widows Pensions Index 45% (-1% compared with 2012)
Scottish Widows Average Savings Ratio 9.1% (+0.2%)
Relying mainly on a defined benefit pension 28% (+1%)
Non-savers 20% (-2%)
Gender gap 9% (+2%)
The research was carried out online by YouGov who interviewed a total of 5,216 UK adults over the age of 18 between 25 February and 4 March 2013.
The average British worker anticipates stopping work around age 66 and is looking for retirement income of £25,000 a year. That would require savings of £1,000 a month from age 30.
The research was carried out online by YouGov who interviewed a total of 5,216 UK adults over the age of 18 between 25 February and 4 March 2013.
5
Preparing for a comfortable retirement
– The average British worker anticipates stopping work around age 66 and is looking for retirement income of £25,000 a year. That would require savings of £1,000 a month from age 30.
– Someone earning £25,000 and saving at our benchmark 12% level would be likely to see a fall of over 50% in their income after retirement.
– Starting to save at 20 rather than 30 could add 39% to retirement income. Deferring retirement from 65 to 70 could add 43%. Increasing contributions by 3% of earnings every five years could add 68%.
– Automatic enrolment should bring more young people into pension savings, but the challenge remains of encouraging them and their employers to pay in more than the minimum.
– Only one in three of those aged 60-64 is currently working, and that falls to one in five between 65 and 69. A significant change in attitudes to retirement is needed to extend working lives. Raising state pension ages could help with that. Women, in particular, appear to see reaching state pensions age as a trigger to retire, though it is unclear whether that will remain the case as the age rises.
Executive summary.
– The gender gap between men and women is 9%, up from 7% last year. 49% of men are currently saving adequately, compared to 40% of women.
– The age gap is similar to last year. 53% of over-50s are preparing adequately, compared with 42% of those between 30 and 50. More women over 50 are saving adequately this year than last year, but fewer men. This finding is reversed for those under 50, with only 36% of women aged 30-50 saving adequately.
– Currently 55% of those earning over £30,000 are saving adequately, but only 40% of those earning between £10,000 and £30,000. This is similar to 2012, but there is evidence of lower savings among those earning over £50,000 a year.
The Scottish Widows Average Savings Ratio
The Average Savings Ratio focuses on those who are not relying on a defined benefit pension for their main income in retirement, and measures their savings for retirement as a percentage of total income.
– The Average Savings Ratio for 2013 is 9.1%, up from 8.9% in 2012.
– The increase is a result of more people saving between 6% and 12% of income, and also of fewer non-savers than last year.
Scottish Widows Pensions Index 45% (-1% compared with 2012)
Scottish Widows Average Savings Ratio 9.1% (+0.2%)
Relying mainly on a defined benefit pension 28% (+1%)
Non-savers 20% (-2%)
Gender gap 9% (+2%)
The research was carried out online by YouGov who interviewed a total of 5,216 UK adults over the age of 18 between 25 February and 4 March 2013.
The average British worker anticipates stopping work around age 66 and is looking for retirement income of £25,000 a year. That would require savings of £1,000 a month from age 30.
Increasing contribution by 3% of earnings every five years could add 68%.
retirement income
retirement income
57% +39%
+43%
Start saving at 20 rather than 30 could add 39% to retirement income.
Deferring retirement from 65 to 70 could add 43%.
20 25 30 35 40 45 50 55 60 65 70
+68%
+68%+3% earnings
6
Introduction.
In many ways 2013 feels like a year for drawing breath and taking stock on UK pensions. After state pension
reforms in 2010, changes to pensions tax allowances and pension income rules in 2011 and the start of automatic
enrolment in 2012, there are no legislative changes on a similar scale this year.
Of course, there is still a great deal of activity. We have
our fourth Pensions Bill in six years, and preparations will
be made for fundamental changes to state pensions as
well as further reductions to pension tax allowances,
simplification of automatic enrolment and the introduction
of ‘pot follows member’ when individuals move employer
having built up modest pension funds. This year we also
have industry-led initiatives to improve transparency and
help individuals to make good choices at retirement,
and there is a major review of workplace pensions by the
Office of Fair Trading.
Nevertheless, this feels like a good point to step back
and assess the impact of all the changes, and our report
is designed to help with that. Now in its ninth year, the
Scottish Widows UK Pensions Report provides a snapshot
of retirement preparation based on a survey with over
5,000 respondents, as well as examining consumer
attitudes to some of the current changes to pensions.
Our headline results are similar to last year, but below
the surface there are some important trends.
More people are saving for their retirement than in
recent years, but fewer are saving enough to provide
a satisfactory income level. The gender gap between
men and women remains worryingly high, and is only
partly accounted for by different earnings levels. And
expectations of when individuals will retire are creeping
up, but not fast enough to keep pace with state pension
age changes.
Managing the transition into retirement
– Over the last five years, the average age when people expect to be able to retire has increased from 64 to 66. However, the age they are willing to work to has only edged up slightly, and is below the state pensions age for most.
– The idea of easing into retirement is attractive to many, with working reduced hours in their present role seen as the most likely option. Other attractive options include shedding responsibilities and moving to a different job with less stress or less manual effort. However, this is largely seen as a vehicle for partial early retirement rather than as a way to work for longer.
– Many are placing significant reliance on non-pension savings for retirement income, and these may be particularly helpful in plugging a gap between retiring or moving to lower-paid work and receiving state pensions.
– Under half of consumers believed they knew what an annuity is, but most of these identified it correctly. However, the issues around when to annuitise and ensuring that the right annuity is bought (including enhanced annuities where appropriate) are complex, and professional advice is important, especially for those with significant pension funds.
Recommendations
– Consumers should be helped to understand what state pension they may receive, and when. The state pension forecast system should be updated to take account of the single state pensions as soon as possible after legislation is passed.
– 8% of qualifying earnings is insufficient to provide adequate retirement income for most, and consideration should be given both to gradually increasing the minimum and to encouraging ‘smart’ schemes and other methods of increasing contribution levels over time.
– Consumers still tend to choose cash investments for non-pension savings, and improved understanding of risk / return trade-offs is needed if they are to make informed choices appropriate for their pensions. Greater awareness of equity ISAs could help with this.
– Consumers should be encouraged to take professional financial advice, but where that is not viable they should be encouraged to access the Money Advice Service site or an alternative offered by their employer’s scheme.
– Messages about the need to start saving early and the benefits of working beyond traditional retirement ages need to be communicated clearly.
– Consumers should be encouraged to think beyond pensions in retirement planning, but with a clear message that it will almost always pay to join an employer’s pension scheme.
– The Government should consider giving incentives to small employers to go beyond the minimum requirements for pension provision. One possibility would be to give double Corporation Tax relief on, say, the first £5,000 of employer contributions (across all the workforce) above the minimum.
– To encourage the self-employed to make better provision for their retirement, pension contributions made by them could be exempted from National Insurance, in the same way as employer contributions.
The state pension forecast system should be updated to take account of the single state pensions as soon as possible after legislation is passed.
7
Introduction.
In many ways 2013 feels like a year for drawing breath and taking stock on UK pensions. After state pension
reforms in 2010, changes to pensions tax allowances and pension income rules in 2011 and the start of automatic
enrolment in 2012, there are no legislative changes on a similar scale this year.
Of course, there is still a great deal of activity. We have
our fourth Pensions Bill in six years, and preparations will
be made for fundamental changes to state pensions as
well as further reductions to pension tax allowances,
simplification of automatic enrolment and the introduction
of ‘pot follows member’ when individuals move employer
having built up modest pension funds. This year we also
have industry-led initiatives to improve transparency and
help individuals to make good choices at retirement,
and there is a major review of workplace pensions by the
Office of Fair Trading.
Nevertheless, this feels like a good point to step back
and assess the impact of all the changes, and our report
is designed to help with that. Now in its ninth year, the
Scottish Widows UK Pensions Report provides a snapshot
of retirement preparation based on a survey with over
5,000 respondents, as well as examining consumer
attitudes to some of the current changes to pensions.
Our headline results are similar to last year, but below
the surface there are some important trends.
More people are saving for their retirement than in
recent years, but fewer are saving enough to provide
a satisfactory income level. The gender gap between
men and women remains worryingly high, and is only
partly accounted for by different earnings levels. And
expectations of when individuals will retire are creeping
up, but not fast enough to keep pace with state pension
age changes.
Alongside our detailed analysis of trends in the number
of people preparing adequately for retirement (the Scottish
Widows Pensions Index) and the amounts being put aside
(the Scottish Widows Average Savings Ratio) we look this
year at the levers individuals can pull to help themselves
achieve a comfortable retirement, and at how the transition
into retirement can be better managed. Both of these are
important areas to be addressed as automatic enrolment
is rolled out and embedded.
It would be unrealistic to expect major improvements
in pension savings at a time when growth in average
weekly earnings is at its lowest level since records began
and has been continuously below the rate of price
inflation for three and a half years.(i) However, this is
a good point at which to influence expectations and
attitudes towards saving, so that when people do begin
to feel better off they recognise the importance of
increasing the amounts they put aside to prepare for
their retirement. The present Coalition Government and
the previous Labour Government have tackled the issues
facing an aging population with great vision and vigour.
The foundations have now been laid and the building
blocks are available. We need to ensure that individuals,
with help from their employers, advisers, pension providers
and Government, are able to construct secure retirements
for themselves.
– Consumers still tend to choose cash investments for non-pension savings, and improved understanding of risk / return trade-offs is needed if they are to make informed choices appropriate for their pensions. Greater awareness of equity ISAs could help with this.
– Consumers should be encouraged to take professional financial advice, but where that is not viable they should be encouraged to access the Money Advice Service site or an alternative offered by their employer’s scheme.
– Messages about the need to start saving early and the benefits of working beyond traditional retirement ages need to be communicated clearly.
– Consumers should be encouraged to think beyond pensions in retirement planning, but with a clear message that it will almost always pay to join an employer’s pension scheme.
– The Government should consider giving incentives to small employers to go beyond the minimum requirements for pension provision. One possibility would be to give double Corporation Tax relief on, say, the first £5,000 of employer contributions (across all the workforce) above the minimum.
– To encourage the self-employed to make better provision for their retirement, pension contributions made by them could be exempted from National Insurance, in the same way as employer contributions.
The state pension forecast system should be updated to take account of the single state pensions as soon as possible after legislation is passed.
8
UK pensions landscape.
55%
46%49% 51%
54%48%
51%46% 45%
2005 2006 2007 2008 2009 2010 2011 2012 2013
The Index is based on those earning over £10,000a year and aged between 30 and 64 for males, or 30and 59 for females.
2013 Pensions Index and Average Savings Ratio.
Trend in Scottish Widows Pensions Index
Where we work makes a big di�erence, adequatepreparation by sector.
1 in 5 Saving nothing to prepare for Retirement
54%59% 61%
50%
59%54% 53%
58%
41%44% 46%
53%47% 47%
42% 42%
2006 2007 2008 2009 2010 2011 2012 2013
Age 51+Age 30-50
Pensions Index by age
Female
49%54% 55%
59%
52% 53%49% 49%
2006 2007 2008 2009 2010 2011 2012 2013
Male
41% 41%46%
43%
50%
42% 40%
47%
Pensions Index by gender
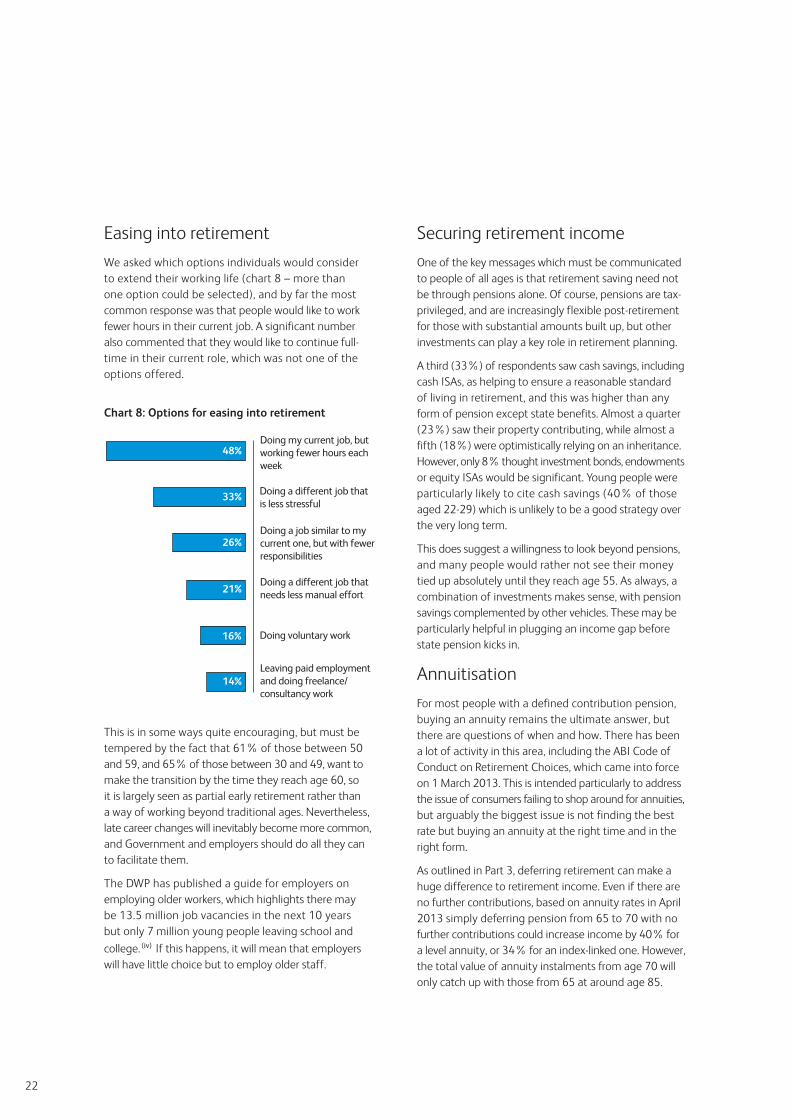
Options for easing into retirement
Doing voluntary work16%
Leaving paid employmentand doing freelance/consultancy work
14%
Doing a different job thatneeds less manual effort21%
Doing a different job thatis less stressful
33%
Doing a job similar to mycurrent one, but with fewerresponsibilities
26%
Doing my current job, butworking fewer hours eachweek
48%
Employees saving adequately
53%Large Companies
250+
39%Smaller Companies
250-
59% Public 41% Private
50% Charitable 33% Self employed
59% Public 41% Private
50% Charitable 33% Self employed
Preparing for a comfortable retirement
Deferring retirement from 65 to 70 could add 43%.
Savings groups 2013
We divide those who make up our Pensions Indexgroup into four categories:
45.3%(12%+ of income)Saving Adequately
14.3%(0-6% of income)
Seriously Undersaving
20.1%(6-12% of income)
Somewhat Undersaving
20.3%Not Saving
7.9%
5.8%
7.9%8.7%
9.3% 9.2% 9.3% 8.9% 9.1%
2005 2006 2007 2008 2009 2010 2011 2012 2013
Trend in Average Savings Ratio
35%
2006
32%
2007
33%
2008
35%
2009
30%
2010
33%
2011
27%
2012
28%
2013
Percentage relying mainly on DB provision
Attitudes to work
2013
2008
60 61 62 63 64 65 66 67 68 69 70
Age of Satisfaction
Age of Acceptance
Age of Resignation
Age of Anger
+39%Retirementincome
+43%Retirementincome
Start saving at 20 rather than 30 could add 39%to retirement income.
9
UK pensions landscape.
55%
46%49% 51%
54%48%
51%46% 45%
2005 2006 2007 2008 2009 2010 2011 2012 2013
The Index is based on those earning over £10,000a year and aged between 30 and 64 for males, or 30and 59 for females.
2013 Pensions Index and Average Savings Ratio.
Trend in Scottish Widows Pensions Index
Where we work makes a big di�erence, adequatepreparation by sector.
1 in 5 Saving nothing to prepare for Retirement
54%59% 61%
50%
59%54% 53%
58%
41%44% 46%
53%47% 47%
42% 42%
2006 2007 2008 2009 2010 2011 2012 2013
Age 51+Age 30-50
Pensions Index by age
Female
49%54% 55%
59%
52% 53%49% 49%
2006 2007 2008 2009 2010 2011 2012 2013
Male
41% 41%46%
43%
50%
42% 40%
47%
Pensions Index by gender
Options for easing into retirement
Doing voluntary work16%
Leaving paid employmentand doing freelance/consultancy work
14%
Doing a different job thatneeds less manual effort21%
Doing a different job thatis less stressful
33%
Doing a job similar to mycurrent one, but with fewerresponsibilities
26%
Doing my current job, butworking fewer hours eachweek
48%
Employees saving adequately
53%Large Companies
250+
39%Smaller Companies
250-
59% Public 41% Private
50% Charitable 33% Self employed
59% Public 41% Private
50% Charitable 33% Self employed
Preparing for a comfortable retirement
Deferring retirement from 65 to 70 could add 43%.
Savings groups 2013
We divide those who make up our Pensions Indexgroup into four categories:
45.3%(12%+ of income)Saving Adequately
14.3%(0-6% of income)
Seriously Undersaving
20.1%(6-12% of income)
Somewhat Undersaving
20.3%Not Saving
7.9%
5.8%
7.9%8.7%
9.3% 9.2% 9.3% 8.9% 9.1%
2005 2006 2007 2008 2009 2010 2011 2012 2013
Trend in Average Savings Ratio
35%
2006
32%
2007
33%
2008
35%
2009
30%
2010
33%
2011
27%
2012
28%
2013
Percentage relying mainly on DB provision
Attitudes to work
2013
2008
60 61 62 63 64 65 66 67 68 69 70
Age of Satisfaction
Age of Acceptance
Age of Resignation
Age of Anger
+39%Retirementincome
+43%Retirementincome
Start saving at 20 rather than 30 could add 39%to retirement income.

10
Part 1. 2013 Pensions Index and Average Savings Ratio.
The percentage of people who are currently making adequate retirement provision has fallen again this year to an all time low. Fewer than half of those who could and should be preparing financially for their old age are currently saving enough.
The Scottish Widows Pensions Index
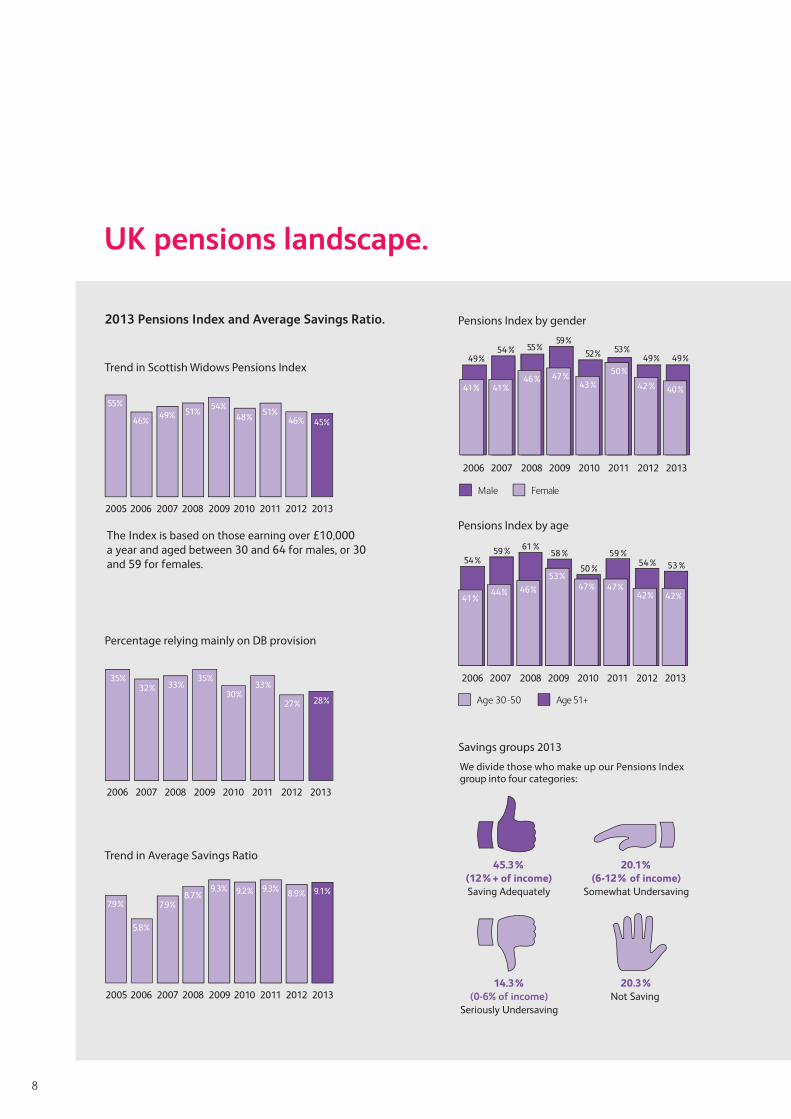
The Scottish Widows Pensions Index, which measures the proportion of consumers who are currently saving adequately for their retirement, continues to fall, down from 51% two years ago to 46% last year to 45% this year. This is the lowest result in the history of our pensions report (see chart 1).
The Index is based on those earning over £10,000 a year and aged between 30 and 64 for males, or 30 and 59 for females. Provision is considered adequate if the individual is saving at least 12% of current income for retirement or expecting a defined benefit (DB) pension to provide their main retirement income. Those saving lower amounts may still build up a worthwhile income, but are likely to experience a significant drop in living standard after retirement. We classify those saving 6-12% of income as Somewhat Undersaving and those saving under 6% as Seriously Undersaving. See Appendix 1 for more detail on the Pensions Index.
There has been a further fall in the percentage saving adequately for retirement.
Chart 1: Trend in Scottish Widows Pensions Index Number who are currently savings adequately for retirement
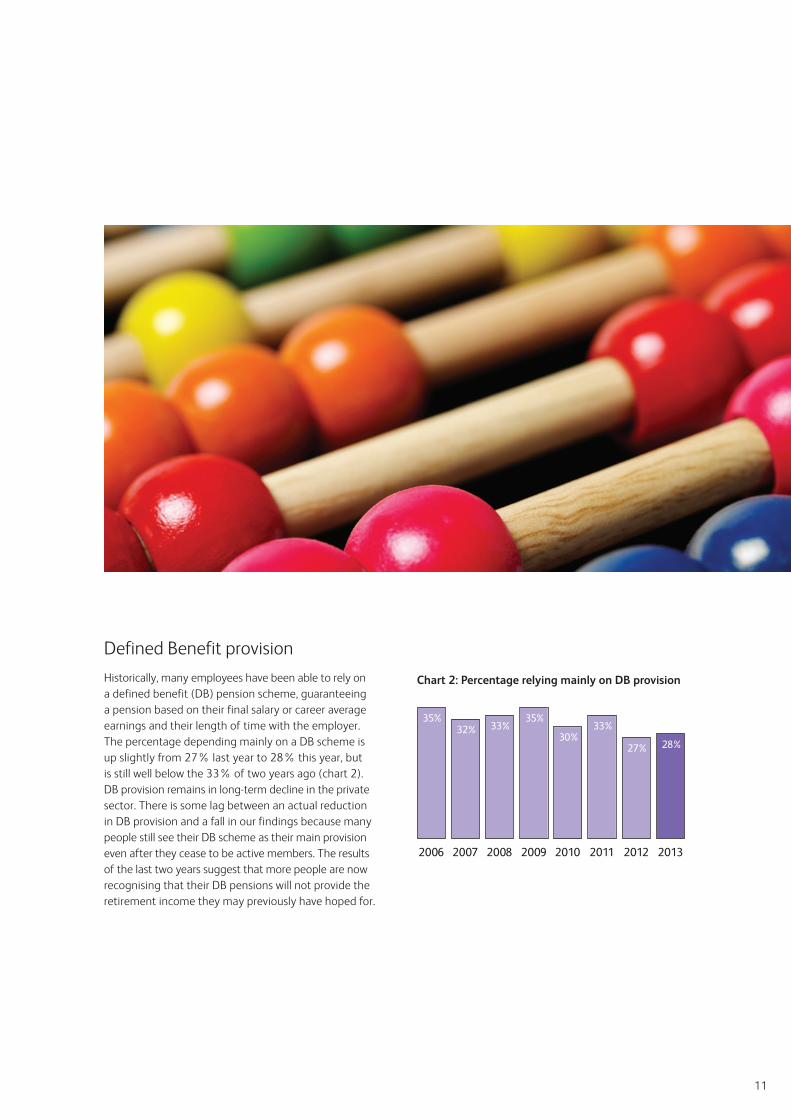
Defined Benefit provision
Historically, many employees have been able to rely on a defined benefit (DB) pension scheme, guaranteeing a pension based on their final salary or career average earnings and their length of time with the employer. The percentage depending mainly on a DB scheme is up slightly from 27% last year to 28% this year, but is still well below the 33% of two years ago (chart 2). DB provision remains in long-term decline in the private sector. There is some lag between an actual reduction in DB provision and a fall in our findings because many people still see their DB scheme as their main provision even after they cease to be active members. The results of the last two years suggest that more people are now recognising that their DB pensions will not provide the retirement income they may previously have hoped for.
Monthly cost of running home.
Percentage of age range with ‘no money available’.
18-24
62%
£856
25-34
62%
£1,099
35-44
68%
£1,187
45-54
73%
£1,132
+55
60%
£85355%
46%49% 51%
54%48%
51%46% 45%
2005 2006 2007 2008 2009 2010 2011 2012 2013
SavingRetirementPensions (shortfall)
The Index is based on those earning over £10,000 a year and aged between 30 and 64 for males, or 30 and 59 for females.
11
Part 1. 2013 Pensions Index and Average Savings Ratio.
Chart 1: Trend in Scottish Widows Pensions Index Number who are currently savings adequately for retirement
Defined Benefit provision
Historically, many employees have been able to rely on a defined benefit (DB) pension scheme, guaranteeing a pension based on their final salary or career average earnings and their length of time with the employer. The percentage depending mainly on a DB scheme is up slightly from 27% last year to 28% this year, but is still well below the 33% of two years ago (chart 2). DB provision remains in long-term decline in the private sector. There is some lag between an actual reduction in DB provision and a fall in our findings because many people still see their DB scheme as their main provision even after they cease to be active members. The results of the last two years suggest that more people are now recognising that their DB pensions will not provide the retirement income they may previously have hoped for.
Chart 2: Percentage relying mainly on DB provision
Monthly cost of running home.
Percentage of age range with ‘no money available’.
18-24
62%
£856
25-34
62%
£1,099
35-44
68%
£1,187
45-54
73%
£1,132
+55
60%
£85355%
46%49% 51%
54%48%
51%46% 45%
2005 2006 2007 2008 2009 2010 2011 2012 2013
Monthly cost of running home.
Percentage of age range with ‘no money available’.
18-24
62%
£856
25-34
62%
£1,099
35-44
68%
£1,187
45-54
73%
£1,132
+55
60%
£85335%
2006
32%
2007
33%
2008
35%
2009
30%
2010
33%
2011
27%
2012
28%
2013
The Index is based on those earning over £10,000 a year and aged between 30 and 64 for males, or 30 and 59 for females.
12
Chart 5: Pensions Index by ageDefined Contribution - The Scottish Widows Average Savings Ratio
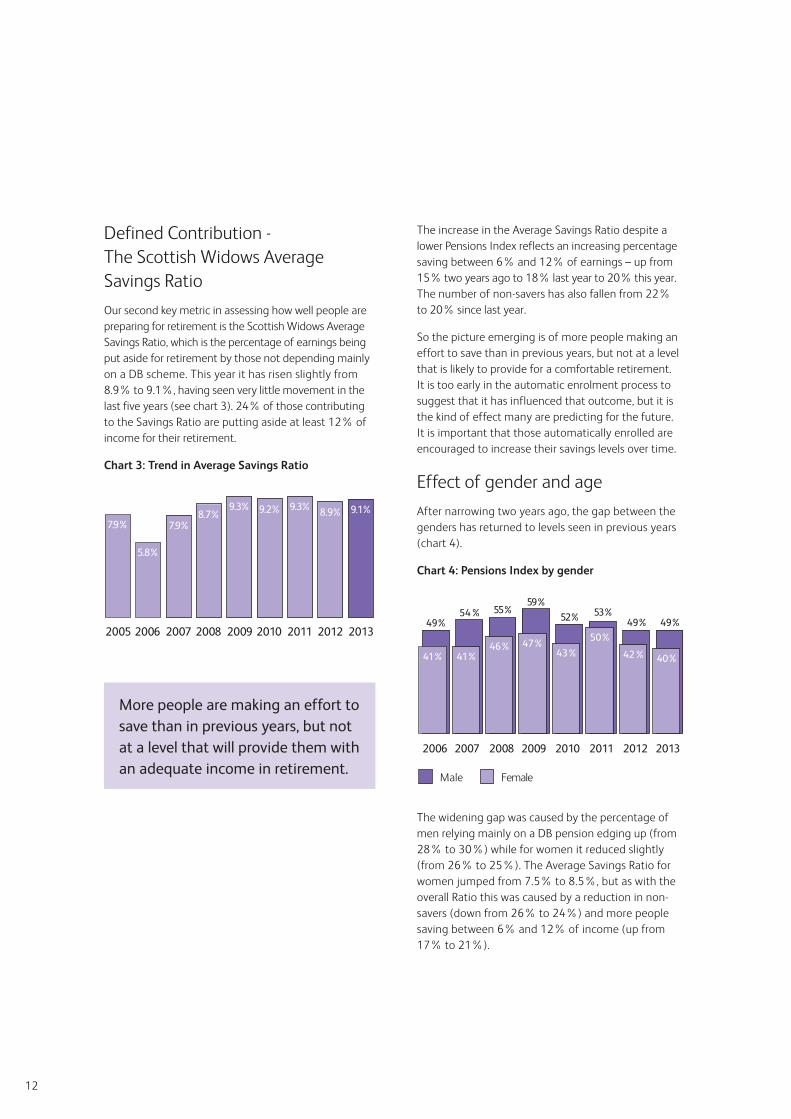
Our second key metric in assessing how well people are preparing for retirement is the Scottish Widows Average Savings Ratio, which is the percentage of earnings being put aside for retirement by those not depending mainly on a DB scheme. This year it has risen slightly from 8.9% to 9.1%, having seen very little movement in the last five years (see chart 3). 24% of those contributing to the Savings Ratio are putting aside at least 12% of income for their retirement.
Chart 3: Trend in Average Savings Ratio
More people are making an effort to save than in previous years, but not at a level that will provide them with an adequate income in retirement.
The increase in the Average Savings Ratio despite a lower Pensions Index reflects an increasing percentage saving between 6% and 12% of earnings – up from 15% two years ago to 18% last year to 20% this year. The number of non-savers has also fallen from 22% to 20% since last year.
So the picture emerging is of more people making an effort to save than in previous years, but not at a level that is likely to provide for a comfortable retirement. It is too early in the automatic enrolment process to suggest that it has influenced that outcome, but it is the kind of effect many are predicting for the future. It is important that those automatically enrolled are encouraged to increase their savings levels over time.
Effect of gender and age
After narrowing two years ago, the gap between the genders has returned to levels seen in previous years (chart 4).
Chart 4: Pensions Index by gender
The widening gap was caused by the percentage of men relying mainly on a DB pension edging up (from 28% to 30%) while for women it reduced slightly (from 26% to 25%). The Average Savings Ratio for women jumped from 7.5% to 8.5%, but as with the overall Ratio this was caused by a reduction in non-savers (down from 26% to 24%) and more people saving between 6% and 12% of income (up from 17% to 21%).
Monthly cost of running home.
Percentage of age range with ‘no money available’.
18-24
62%
£856
25-34
62%
£1,099
35-44
68%
£1,187
45-54
73%
£1,132
+55
60%
£8537.9%
5.8%
7.9%8.7%
9.3% 9.2% 9.3% 8.9% 9.1%
2005 2006 2007 2008 2009 2010 2011 2012 2013
Female
49%54% 55%
59%
52% 53%49% 49%
2006 2007 2008 2009 2010 2011 2012 2013
Male
41% 41%46%
43%
50%
42% 40%
47%
54%59% 61%
50%
59%54% 53%
58%
Age 51+
41%44% 46%
53%47% 47%
42% 42%
2006 2007 2008 2009 2010 2011 2012 2013
Age 30-50
13
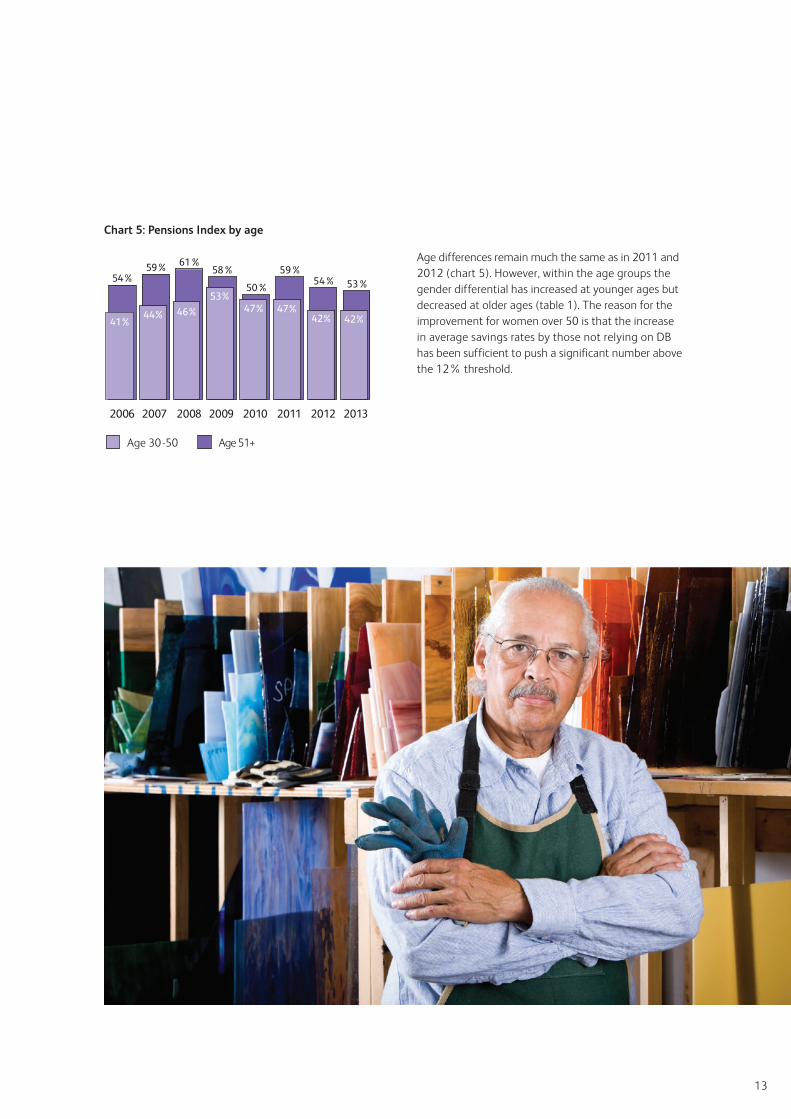
Chart 5: Pensions Index by age
Age differences remain much the same as in 2011 and 2012 (chart 5). However, within the age groups the gender differential has increased at younger ages but decreased at older ages (table 1). The reason for the improvement for women over 50 is that the increase in average savings rates by those not relying on DB has been sufficient to push a significant number above the 12% threshold.
The increase in the Average Savings Ratio despite a lower Pensions Index reflects an increasing percentage saving between 6% and 12% of earnings – up from 15% two years ago to 18% last year to 20% this year. The number of non-savers has also fallen from 22% to 20% since last year.
So the picture emerging is of more people making an effort to save than in previous years, but not at a level that is likely to provide for a comfortable retirement. It is too early in the automatic enrolment process to suggest that it has influenced that outcome, but it is the kind of effect many are predicting for the future. It is important that those automatically enrolled are encouraged to increase their savings levels over time.
Effect of gender and age
After narrowing two years ago, the gap between the genders has returned to levels seen in previous years (chart 4).
Chart 4: Pensions Index by gender
The widening gap was caused by the percentage of men relying mainly on a DB pension edging up (from 28% to 30%) while for women it reduced slightly (from 26% to 25%). The Average Savings Ratio for women jumped from 7.5% to 8.5%, but as with the overall Ratio this was caused by a reduction in non-savers (down from 26% to 24%) and more people saving between 6% and 12% of income (up from 17% to 21%).
Female
49%54% 55%
59%
52% 53%49% 49%
2006 2007 2008 2009 2010 2011 2012 2013
Male
41% 41%46%
43%
50%
42% 40%
47%
54%59% 61%
50%
59%54% 53%
58%
Age 51+
41%44% 46%
53%47% 47%
42% 42%
2006 2007 2008 2009 2010 2011 2012 2013
Age 30-50
14
Table 1: Pensions Index by age and gender
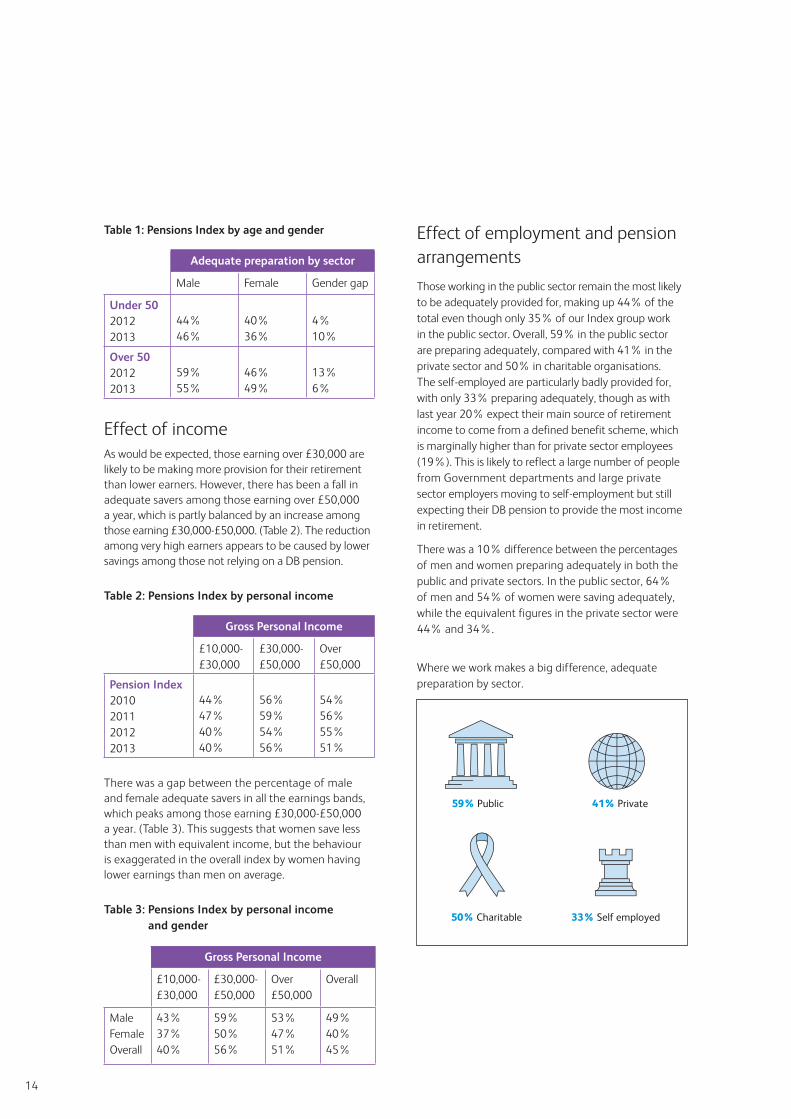
Effect of incomeAs would be expected, those earning over £30,000 are likely to be making more provision for their retirement than lower earners. However, there has been a fall in adequate savers among those earning over £50,000 a year, which is partly balanced by an increase among those earning £30,000-£50,000. (Table 2). The reduction among very high earners appears to be caused by lower savings among those not relying on a DB pension.
Table 2: Pensions Index by personal income
There was a gap between the percentage of male and female adequate savers in all the earnings bands, which peaks among those earning £30,000-£50,000 a year. (Table 3). This suggests that women save less than men with equivalent income, but the behaviour is exaggerated in the overall index by women having lower earnings than men on average.
Table 3: Pensions Index by personal income and gender
Effect of employment and pension arrangements
Those working in the public sector remain the most likely to be adequately provided for, making up 44% of the total even though only 35% of our Index group work in the public sector. Overall, 59% in the public sector are preparing adequately, compared with 41% in the private sector and 50% in charitable organisations. The self-employed are particularly badly provided for, with only 33% preparing adequately, though as with last year 20% expect their main source of retirement income to come from a defined benefit scheme, which is marginally higher than for private sector employees (19%). This is likely to reflect a large number of people from Government departments and large private sector employers moving to self-employment but still expecting their DB pension to provide the most income in retirement.
There was a 10% difference between the percentages of men and women preparing adequately in both the public and private sectors. In the public sector, 64% of men and 54% of women were saving adequately, while the equivalent figures in the private sector were 44% and 34%.
Where we work makes a big difference, adequate preparation by sector.
Adequate preparation by sector
Male Female Gender gap
Under 5020122013
44%46%
40%36%
4%10%
Over 5020122013
59%55%
46%49%
13%6%
Gross Personal Income
£10,000-£30,000
£30,000-£50,000
Over £50,000
Pension Index2010201120122013
44%47%40%40%
56%59%54%56%
54%56%55%51%
Gross Personal Income
£10,000-£30,000
£30,000-£50,000
Over £50,000
Overall
MaleFemaleOverall
43%37%40%
59%50%56%
53%47%51%
49%40%45%
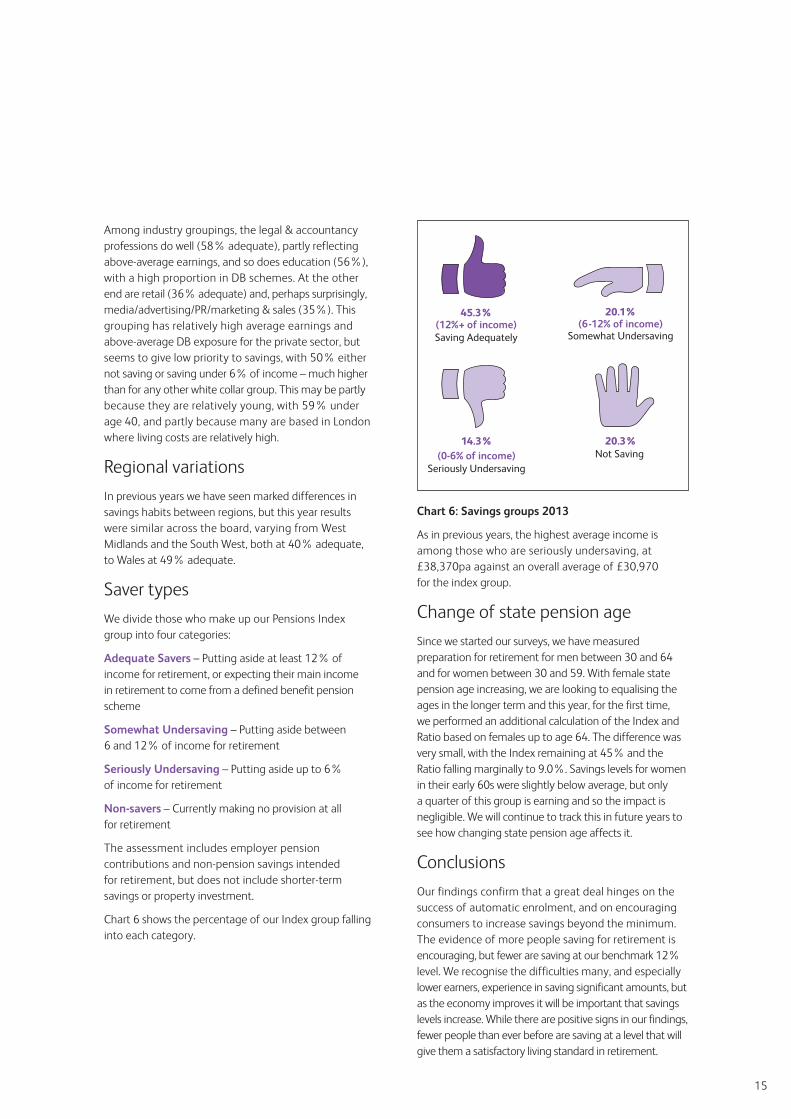
Among industry groupings, the legal & accountancy professions do well (58% adequate), partly reflecting above-average earnings, and so does education (56%), with a high proportion in DB schemes. At the other end are retail (36% adequate) and, perhaps surprisingly, media/advertising/PR/marketing & sales (35%). This grouping has relatively high average earnings and above-average DB exposure for the private sector, but seems to give low priority to savings, with 50% either not saving or saving under 6% of income – much higher than for any other white collar group. This may be partly because they are relatively young, with 59% under age 40, and partly because many are based in London where living costs are relatively high.
Regional variations
In previous years we have seen marked differences in savings habits between regions, but this year results were similar across the board, varying from West Midlands and the South West, both at 40% adequate, to Wales at 49% adequate.
Saver types
We divide those who make up our Pensions Index group into four categories:
Adequate Savers – Putting aside at least 12% of income for retirement, or expecting their main income in retirement to come from a defined benefit pension scheme
Somewhat Undersaving – Putting aside between 6 and 12% of income for retirement
Seriously Undersaving – Putting aside up to 6% of income for retirement
Non-savers – Currently making no provision at all for retirement
The assessment includes employer pension contributions and non-pension savings intended for retirement, but does not include shorter-term savings or property investment.
Chart 6 shows the percentage of our Index group falling into each category.
59% Public 41% Private
50% Charitable 33% Self employed
15
Effect of employment and pension arrangements
Those working in the public sector remain the most likely to be adequately provided for, making up 44% of the total even though only 35% of our Index group work in the public sector. Overall, 59% in the public sector are preparing adequately, compared with 41% in the private sector and 50% in charitable organisations. The self-employed are particularly badly provided for, with only 33% preparing adequately, though as with last year 20% expect their main source of retirement income to come from a defined benefit scheme, which is marginally higher than for private sector employees (19%). This is likely to reflect a large number of people from Government departments and large private sector employers moving to self-employment but still expecting their DB pension to provide the most income in retirement.
There was a 10% difference between the percentages of men and women preparing adequately in both the public and private sectors. In the public sector, 64% of men and 54% of women were saving adequately, while the equivalent figures in the private sector were 44% and 34%.
Where we work makes a big difference, adequate preparation by sector.
Among industry groupings, the legal & accountancy professions do well (58% adequate), partly reflecting above-average earnings, and so does education (56%), with a high proportion in DB schemes. At the other end are retail (36% adequate) and, perhaps surprisingly, media/advertising/PR/marketing & sales (35%). This grouping has relatively high average earnings and above-average DB exposure for the private sector, but seems to give low priority to savings, with 50% either not saving or saving under 6% of income – much higher than for any other white collar group. This may be partly because they are relatively young, with 59% under age 40, and partly because many are based in London where living costs are relatively high.
Regional variations
In previous years we have seen marked differences in savings habits between regions, but this year results were similar across the board, varying from West Midlands and the South West, both at 40% adequate, to Wales at 49% adequate.
Saver types
We divide those who make up our Pensions Index group into four categories:
Adequate Savers – Putting aside at least 12% of income for retirement, or expecting their main income in retirement to come from a defined benefit pension scheme
Somewhat Undersaving – Putting aside between 6 and 12% of income for retirement
Seriously Undersaving – Putting aside up to 6% of income for retirement
Non-savers – Currently making no provision at all for retirement
The assessment includes employer pension contributions and non-pension savings intended for retirement, but does not include shorter-term savings or property investment.
Chart 6 shows the percentage of our Index group falling into each category.
Chart 6: Savings groups 2013
As in previous years, the highest average income is among those who are seriously undersaving, at £38,370pa against an overall average of £30,970 for the index group.
Change of state pension age
Since we started our surveys, we have measured preparation for retirement for men between 30 and 64 and for women between 30 and 59. With female state pension age increasing, we are looking to equalising the ages in the longer term and this year, for the first time, we performed an additional calculation of the Index and Ratio based on females up to age 64. The difference was very small, with the Index remaining at 45% and the Ratio falling marginally to 9.0%. Savings levels for women in their early 60s were slightly below average, but only a quarter of this group is earning and so the impact is negligible. We will continue to track this in future years to see how changing state pension age affects it.
Conclusions
Our findings confirm that a great deal hinges on the success of automatic enrolment, and on encouraging consumers to increase savings beyond the minimum. The evidence of more people saving for retirement is encouraging, but fewer are saving at our benchmark 12% level. We recognise the difficulties many, and especially lower earners, experience in saving significant amounts, but as the economy improves it will be important that savings levels increase. While there are positive signs in our findings, fewer people than ever before are saving at a level that will give them a satisfactory living standard in retirement.
45.3%(12%+ of income)Saving Adequately
14.3%(0-6% of income)
Seriously Undersaving
20.3%Not Saving
20.1%(6-12% of income)
Somewhat Undersaving
59% Public 41% Private
50% Charitable 33% Self employed
16
Anita Steph Tony Stat base
In a relationship or unattached?
Sanjeev and I have been together for 5 years.
Unattached since my divorce 3 years ago.
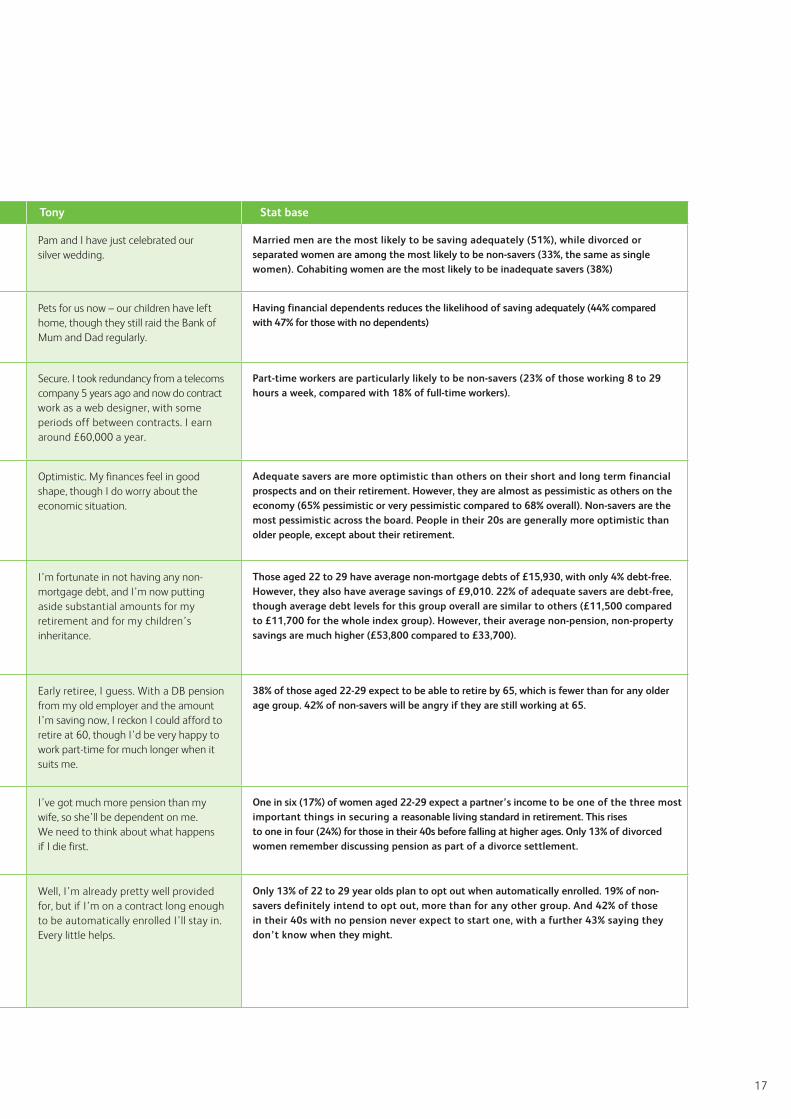
Pam and I have just celebrated our silver wedding.
Married men are the most likely to be saving adequately (51%), while divorced or separated women are among the most likely to be non-savers (33%, the same as single women). Cohabiting women are the most likely to be inadequate savers (38%)
Children or pets? Neither at present. We plan to start a family in the next few years.
My two teenage children stay with me. Pets for us now – our children have left home, though they still raid the Bank of Mum and Dad regularly.
Having financial dependents reduces the likelihood of saving adequately (44% compared with 47% for those with no dependents)
Financially secure or struggling?
Reasonably secure. I’m employed as a junior accountant with a local firm, on £33,000 a year.
Very much struggling. I work part-time as a personal assistant, and earn £16,000 a year.
Secure. I took redundancy from a telecoms company 5 years ago and now do contract work as a web designer, with some periods off between contracts. I earn around £60,000 a year.
Part-time workers are particularly likely to be non-savers (23% of those working 8 to 29 hours a week, compared with 18% of full-time workers).
Optimistic or pessimistic?
Generally pretty optimistic, though I’m not sure about my retirement.
Very pessimistic. I can’t see anything but financial hardship for the rest of my life.
Optimistic. My finances feel in good shape, though I do worry about the economic situation.
Adequate savers are more optimistic than others on their short and long term financial prospects and on their retirement. However, they are almost as pessimistic as others on the economy (65% pessimistic or very pessimistic compared to 68% overall). Non-savers are the most pessimistic across the board. People in their 20s are generally more optimistic than older people, except about their retirement.
Saver or borrower?
Both! Like almost everyone in my generation I have big debts between my student loan and other borrowing – but I’m also saving so we can get onto the housing ladder.
Borrower. My ex pays maintenance for our children, and I receive some benefits, but there still never seems to be enough to go round.
I’m fortunate in not having any non-mortgage debt, and I’m now putting aside substantial amounts for my retirement and for my children’s inheritance.
Those aged 22 to 29 have average non-mortgage debts of £15,930, with only 4% debt-free. However, they also have average savings of £9,010. 22% of adequate savers are debt-free, though average debt levels for this group overall are similar to others (£11,500 compared to £11,700 for the whole index group). However, their average non-pension, non-property savings are much higher (£53,800 compared to £33,700).
Early retiree or late worker?
Well, I expect people my age to have to work into their late 60s or beyond, but that’s not that old these days, is it?
Definitely late worker. I won’t be able to retire until I get my state pension, and that’s likely to be at 67 or 68. I can’t bear the thought of having to work past 65.
Early retiree, I guess. With a DB pension from my old employer and the amount I’m saving now, I reckon I could afford to retire at 60, though I’d be very happy to work part-time for much longer when it suits me.
38% of those aged 22-29 expect to be able to retire by 65, which is fewer than for any older age group. 42% of non-savers will be angry if they are still working at 65.
Keeper or kept in retirement?
I quite fancy the idea of being a kept woman! Hopefully my partner’s pension will help me achieve a comfortable retirement.
You must be joking! I got no pension from my ex when I divorced – we didn’t even discuss it – so I’m entirely on my own.
I’ve got much more pension than my wife, so she’ll be dependent on me. We need to think about what happens if I die first.
One in six (17%) of women aged 22-29 expect a partner’s income to be one of the three most important things in securing a reasonable living standard in retirement. This rises to one in four (24%) for those in their 40s before falling at higher ages. Only 13% of divorced women remember discussing pension as part of a divorce settlement.
Automatically enrolled or opted out?
I’ve not got round to starting a pension yet, though I’m putting money into an ISA that may eventually help fund my retirement. I’ll definitely stay in pension when the time comes. With my employer contributing I’d be mad not to.
I’ve a horrible feeling it’s too late for me. I’ll probably opt out because I just can’t afford it.
Well, I’m already pretty well provided for, but if I’m on a contract long enough to be automatically enrolled I’ll stay in. Every little helps.
Only 13% of 22 to 29 year olds plan to opt out when automatically enrolled. 19% of non-savers definitely intend to opt out, more than for any other group. And 42% of those in their 40s with no pension never expect to start one, with a further 43% saying they don’t know when they might.
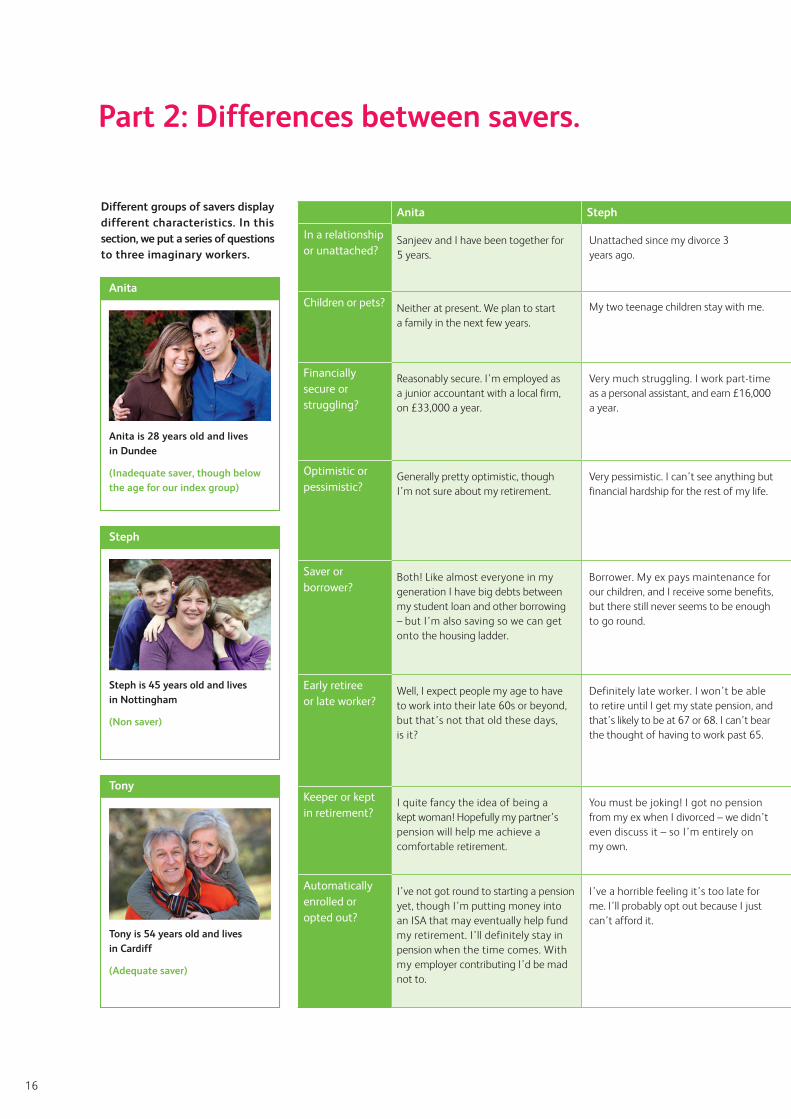
Different groups of savers display different characteristics. In this section, we put a series of questions to three imaginary workers.
Part 2: Differences between savers.
Anita is 28 years old and lives in Dundee
(Inadequate saver, though below the age for our index group)
Anita
Steph is 45 years old and lives in Nottingham
(Non saver)
Steph
Tony is 54 years old and lives in Cardiff
(Adequate saver)
Tony
17
Anita Steph Tony Stat base
In a relationship or unattached?
Sanjeev and I have been together for 5 years.
Unattached since my divorce 3 years ago.
Pam and I have just celebrated our silver wedding.
Married men are the most likely to be saving adequately (51%), while divorced or separated women are among the most likely to be non-savers (33%, the same as single women). Cohabiting women are the most likely to be inadequate savers (38%)
Children or pets? Neither at present. We plan to start a family in the next few years.
My two teenage children stay with me. Pets for us now – our children have left home, though they still raid the Bank of Mum and Dad regularly.
Having financial dependents reduces the likelihood of saving adequately (44% compared with 47% for those with no dependents)
Financially secure or struggling?
Reasonably secure. I’m employed as a junior accountant with a local firm, on £33,000 a year.
Very much struggling. I work part-time as a personal assistant, and earn £16,000 a year.
Secure. I took redundancy from a telecoms company 5 years ago and now do contract work as a web designer, with some periods off between contracts. I earn around £60,000 a year.
Part-time workers are particularly likely to be non-savers (23% of those working 8 to 29 hours a week, compared with 18% of full-time workers).
Optimistic or pessimistic?
Generally pretty optimistic, though I’m not sure about my retirement.
Very pessimistic. I can’t see anything but financial hardship for the rest of my life.
Optimistic. My finances feel in good shape, though I do worry about the economic situation.
Adequate savers are more optimistic than others on their short and long term financial prospects and on their retirement. However, they are almost as pessimistic as others on the economy (65% pessimistic or very pessimistic compared to 68% overall). Non-savers are the most pessimistic across the board. People in their 20s are generally more optimistic than older people, except about their retirement.
Saver or borrower?
Both! Like almost everyone in my generation I have big debts between my student loan and other borrowing – but I’m also saving so we can get onto the housing ladder.
Borrower. My ex pays maintenance for our children, and I receive some benefits, but there still never seems to be enough to go round.
I’m fortunate in not having any non-mortgage debt, and I’m now putting aside substantial amounts for my retirement and for my children’s inheritance.
Those aged 22 to 29 have average non-mortgage debts of £15,930, with only 4% debt-free. However, they also have average savings of £9,010. 22% of adequate savers are debt-free, though average debt levels for this group overall are similar to others (£11,500 compared to £11,700 for the whole index group). However, their average non-pension, non-property savings are much higher (£53,800 compared to £33,700).
Early retiree or late worker?
Well, I expect people my age to have to work into their late 60s or beyond, but that’s not that old these days, is it?
Definitely late worker. I won’t be able to retire until I get my state pension, and that’s likely to be at 67 or 68. I can’t bear the thought of having to work past 65.
Early retiree, I guess. With a DB pension from my old employer and the amount I’m saving now, I reckon I could afford to retire at 60, though I’d be very happy to work part-time for much longer when it suits me.
38% of those aged 22-29 expect to be able to retire by 65, which is fewer than for any older age group. 42% of non-savers will be angry if they are still working at 65.
Keeper or kept in retirement?
I quite fancy the idea of being a kept woman! Hopefully my partner’s pension will help me achieve a comfortable retirement.
You must be joking! I got no pension from my ex when I divorced – we didn’t even discuss it – so I’m entirely on my own.
I’ve got much more pension than my wife, so she’ll be dependent on me. We need to think about what happens if I die first.
One in six (17%) of women aged 22-29 expect a partner’s income to be one of the three most important things in securing a reasonable living standard in retirement. This rises to one in four (24%) for those in their 40s before falling at higher ages. Only 13% of divorced women remember discussing pension as part of a divorce settlement.
Automatically enrolled or opted out?
I’ve not got round to starting a pension yet, though I’m putting money into an ISA that may eventually help fund my retirement. I’ll definitely stay in pension when the time comes. With my employer contributing I’d be mad not to.
I’ve a horrible feeling it’s too late for me. I’ll probably opt out because I just can’t afford it.
Well, I’m already pretty well provided for, but if I’m on a contract long enough to be automatically enrolled I’ll stay in. Every little helps.
Only 13% of 22 to 29 year olds plan to opt out when automatically enrolled. 19% of non-savers definitely intend to opt out, more than for any other group. And 42% of those in their 40s with no pension never expect to start one, with a further 43% saying they don’t know when they might.
Wales has the highest percentage of
adequate savers (49%) while the East
Midlands has the highest percentage
of non-savers (27%) and Scotland has
the highest percentage of inadequate
savers (38%) in the mainland UK.
Part 2: Differences between savers.
18
Part 3: Preparing for a comfortable retirement.
The average British worker anticipates stopping work around age 66 and is looking for retirement income of £25,000 a year, having saved from age 30.
For all of that income to come from private and state pensions would require a contribution of £1,000 a month, or 48% of income for someone earning £25,000 a year while working. For most, that is an unrealistic prospect. So what can be done?
For any individual, there are three key levers they can pull which affect their pension income: when they start saving, how much they save and when they retire.
In our analysis of outcomes below, the base case is an individual earning £25,000 a year and saving 12% of income from age 30 (£250 a month gross initially), retiring at age 65 with an illustrated private pension
of £4,200 a year (£350 a month). (ii) State pension of around £7,500 a year would be on top of this.
Starting pension early
Starting saving at 25 rather than 30 could add almost a fifth to the final pension. Starting saving at 20 could add almost two-fifths.
While we have restricted our Pensions Index group to those who have reached age 30, which ties in with the average age when consumers think pension saving needs to start, putting money aside for retirement earlier than this can be very beneficial.
Even at the relatively low growth rate assumed, starting to save 5 years early could add £19 to every £100 retirement income, while starting to save 10 years early could add £39. This is a very worthwhile increase, but are those in their 20s more interested in paying off student loans and getting onto the housing ladder than in starting a pension?
Almost half of those aged 22 to 29 who are not already in a pension scheme expect to stay automatically enrolled, with only one in six intending to opt out.
Our research found that younger people are positive about automatic enrolment, meaning they may be well on their way with retirement saving by the time they reach age 30. 37% of those aged 22 to 29 in companies which have not yet been through automatic enrolment expect to choose to stay in their employer’s scheme. This is a higher percentage than for any older age group, and even when the result is adjusted to allow for those already in a pension scheme – which is much lower in this group than for older people – the 48% intending to remain in the scheme matches the average for other groups, while the 17% intending to opt out is slightly below average. This means, though, that over a third have still to decide, which is higher than for older age groups.
These findings suggest that those in their 20s may be less averse to pension saving than is often assumed, and that automatic enrolment may be an effective method of getting them onto the savings ladder. Only 39% are aware of currently having a private pension – compared with 66% of those in their 30s – but that should increase to well over half in the next few years.
At this age contributions are likely to be relatively low, both because of low earnings capacity and because saving extra for retirement is unlikely to be a high priority, but the most difficult part of saving is often getting started. If most younger people stay in their pension, this will give them a head-start and provide a very solid base from which to increase savings as they get closer to retirement.
Increasing savings levels
Increasing the contribution rate by 3% of earnings every 5 years could increase retirement income by two-thirds.
The second key lever is the amount individual put aside for retirement each month. It is generally agreed that the minimum 8% of qualifying earnings (those between £5,668 and £41,450) under automatic enrolment is a good kick-start to pension savings, but not enough to provide an adequate income.
Retirement income of £25,000 a year would require savings of £1,000 a month from age 30.
retirement income
retirement income
57% +39%
+43%
Start saving at 20 rather than 30 could add 39% to retirement income.
Deferring retirement from 65 to 70 could add 43%.
19
Part 3: Preparing for a comfortable retirement.
Even at the relatively low growth rate assumed, starting to save 5 years early could add £19 to every £100 retirement income, while starting to save 10 years early could add £39. This is a very worthwhile increase, but are those in their 20s more interested in paying off student loans and getting onto the housing ladder than in starting a pension?
Almost half of those aged 22 to 29 who are not already in a pension scheme expect to stay automatically enrolled, with only one in six intending to opt out.
Our research found that younger people are positive about automatic enrolment, meaning they may be well on their way with retirement saving by the time they reach age 30. 37% of those aged 22 to 29 in companies which have not yet been through automatic enrolment expect to choose to stay in their employer’s scheme. This is a higher percentage than for any older age group, and even when the result is adjusted to allow for those already in a pension scheme – which is much lower in this group than for older people – the 48% intending to remain in the scheme matches the average for other groups, while the 17% intending to opt out is slightly below average. This means, though, that over a third have still to decide, which is higher than for older age groups.
These findings suggest that those in their 20s may be less averse to pension saving than is often assumed, and that automatic enrolment may be an effective method of getting them onto the savings ladder. Only 39% are aware of currently having a private pension – compared with 66% of those in their 30s – but that should increase to well over half in the next few years.
At this age contributions are likely to be relatively low, both because of low earnings capacity and because saving extra for retirement is unlikely to be a high priority, but the most difficult part of saving is often getting started. If most younger people stay in their pension, this will give them a head-start and provide a very solid base from which to increase savings as they get closer to retirement.
Increasing savings levels
Increasing the contribution rate by 3% of earnings every 5 years could increase retirement income by two-thirds.
The second key lever is the amount individual put aside for retirement each month. It is generally agreed that the minimum 8% of qualifying earnings (those between £5,668 and £41,450) under automatic enrolment is a good kick-start to pension savings, but not enough to provide an adequate income.
The benchmark for our reports has been 12% of total earnings, which for someone on £25,000 a year is close to double the automatic enrolment minimum (because all earnings are included, not just qualifying earnings), and we have seen that as providing only a satisfactory living standard, not a high level of comfort. Using the new FCA mid-rate assumptions, it would give a replacement rate under 50% for someone on average earnings when combined with the single state pension, so it could be questioned whether it is even satisfactory. And the average actually being saved is only 9% of earnings.
There is no getting away from affordability issues for paying a reasonable amount into a pension. For someone on £25,000 a year funding a pension on their own, a contribution rate of 12% would mean they were paying in £200 a month out of take-home pay of about £1,650. An employer contribution at the automatic enrolment minimum would reduce the individual’s cost to around £150 a month. While not out of the question for many, it is a significant financial outlay. And it may still not be enough. Those without a generous employer contribution face an uphill struggle.
One option is to start with modest contributions and build up over time. The principle behind ‘save more tomorrow’
developed by Thaler & Benartzi,(iii) where a portion of each salary increase over a period of years automatically goes towards increasing the percentage going into pensions, is sound and can make a significant difference.
We modelled a slightly different scenario, where the contribution rate starts at 12% at age 30, and increases by 3% at 5-year intervals, reaching 30% by age 60. While the ultimate level is very high, it reflects the increasing priority likely to be given to saving as retirement approaches. This pattern of payments could increase the private pension for the individual by over two-thirds (68%).
Most people have scope to save more if they give it sufficient priority. Among our Index group, the average extra amount that respondents felt they could put aside each month was £77, which could make a significant dent in their retirement shortfall. If part of each pay increase was redirected to pension, consumers would not immediately miss what they never had.
retirement income
retirement income
57% +39%
+43%
Start saving at 20 rather than 30 could add 39% to retirement income.
Deferring retirement from 65 to 70 could add 43%.
20
Deferring retirement
Deferring retirement from 65 to 70 could lead to a 43% increase in pension.
While starting saving as soon as possible is highly desirable, and increasing contributions as retirement approaches is almost essential, the biggest single difference can come from deferring retirement. For example, starting to save at age 30 and deferring retirement from 65 to 70 could increase the final pension by 43%.
The key issue is whether consumers will work beyond traditional retirement ages. We found that the average age when they aspire to stop work is 62, but around half would not be angry if they had to work past 65. This is relatively encouraging, particularly if attitudes soften as older working becomes more common.
However, there is a long way to go, as Table 4 demonstrates.
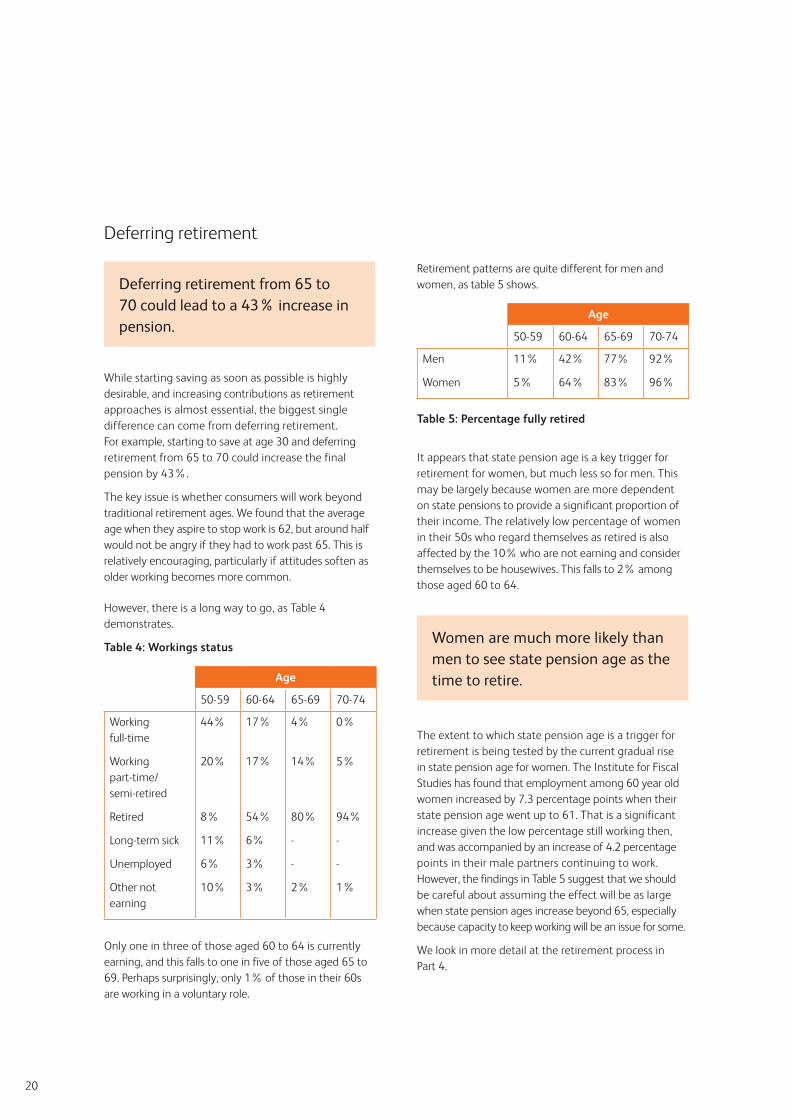
Table 4: Workings status
Only one in three of those aged 60 to 64 is currently earning, and this falls to one in five of those aged 65 to 69. Perhaps surprisingly, only 1% of those in their 60s are working in a voluntary role.
Retirement patterns are quite different for men and women, as table 5 shows.
Table 5: Percentage fully retired
It appears that state pension age is a key trigger for retirement for women, but much less so for men. This may be largely because women are more dependent on state pensions to provide a significant proportion of their income. The relatively low percentage of women in their 50s who regard themselves as retired is also affected by the 10% who are not earning and consider themselves to be housewives. This falls to 2% among those aged 60 to 64.
Women are much more likely than men to see state pension age as the time to retire.
The extent to which state pension age is a trigger for retirement is being tested by the current gradual rise in state pension age for women. The Institute for Fiscal Studies has found that employment among 60 year old women increased by 7.3 percentage points when their state pension age went up to 61. That is a significant increase given the low percentage still working then, and was accompanied by an increase of 4.2 percentage points in their male partners continuing to work. However, the findings in Table 5 suggest that we should be careful about assuming the effect will be as large when state pension ages increase beyond 65, especially because capacity to keep working will be an issue for some.
We look in more detail at the retirement process in Part 4.
Age
50-59 60-64 65-69 70-74
Working full-time
Working part-time/ semi-retired
Retired
Long-term sick
Unemployed
Other not earning
44%
20%
8%
11%
6%
10%
17%
17%
54%
6%
3%
3%
4%
14%
80%
-
-
2%
0%
5%
94%
-
-
1%
Age
50-59 60-64 65-69 70-74
Men
Women
11%
5%
42%
64%
77%
83%
92%
96%
Part 4: Managing the transition into retirement.
As working to older ages becomes increasingly common, consumers will have to consider whether they are able and willing to continue their current jobs or whether a change would suit them better. They will also have to think carefully about their income requirements and sources as they make the transition from work towards retirement.
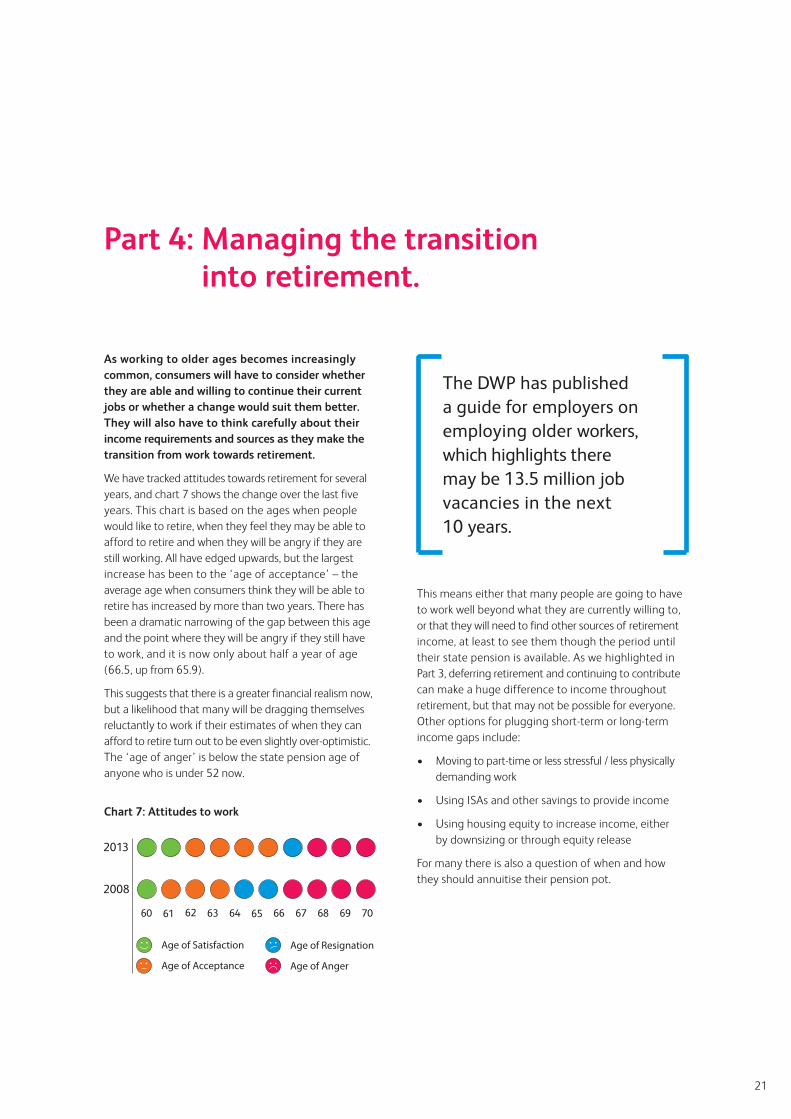
We have tracked attitudes towards retirement for several years, and chart 7 shows the change over the last five years. This chart is based on the ages when people would like to retire, when they feel they may be able to afford to retire and when they will be angry if they are still working. All have edged upwards, but the largest increase has been to the ‘age of acceptance’ – the average age when consumers think they will be able to retire has increased by more than two years. There has been a dramatic narrowing of the gap between this age and the point where they will be angry if they still have to work, and it is now only about half a year of age (66.5, up from 65.9).
This suggests that there is a greater financial realism now, but a likelihood that many will be dragging themselves reluctantly to work if their estimates of when they can afford to retire turn out to be even slightly over-optimistic. The ‘age of anger’ is below the state pension age of anyone who is under 52 now.
Chart 7: Attitudes to work
2013
2008
60 61 62 63 64 65 66 67 68 69 70
Age of Satisfaction
Age of Acceptance
Age of Resignation
Age of Anger
21
Retirement patterns are quite different for men and women, as table 5 shows.
Table 5: Percentage fully retired
It appears that state pension age is a key trigger for retirement for women, but much less so for men. This may be largely because women are more dependent on state pensions to provide a significant proportion of their income. The relatively low percentage of women in their 50s who regard themselves as retired is also affected by the 10% who are not earning and consider themselves to be housewives. This falls to 2% among those aged 60 to 64.
Women are much more likely than men to see state pension age as the time to retire.
The extent to which state pension age is a trigger for retirement is being tested by the current gradual rise in state pension age for women. The Institute for Fiscal Studies has found that employment among 60 year old women increased by 7.3 percentage points when their state pension age went up to 61. That is a significant increase given the low percentage still working then, and was accompanied by an increase of 4.2 percentage points in their male partners continuing to work. However, the findings in Table 5 suggest that we should be careful about assuming the effect will be as large when state pension ages increase beyond 65, especially because capacity to keep working will be an issue for some.
We look in more detail at the retirement process in Part 4.
Age
50-59 60-64 65-69 70-74
Men
Women
11%
5%
42%
64%
77%
83%
92%
96%
Part 4: Managing the transition into retirement.
As working to older ages becomes increasingly common, consumers will have to consider whether they are able and willing to continue their current jobs or whether a change would suit them better. They will also have to think carefully about their income requirements and sources as they make the transition from work towards retirement.
We have tracked attitudes towards retirement for several years, and chart 7 shows the change over the last five years. This chart is based on the ages when people would like to retire, when they feel they may be able to afford to retire and when they will be angry if they are still working. All have edged upwards, but the largest increase has been to the ‘age of acceptance’ – the average age when consumers think they will be able to retire has increased by more than two years. There has been a dramatic narrowing of the gap between this age and the point where they will be angry if they still have to work, and it is now only about half a year of age (66.5, up from 65.9).
This suggests that there is a greater financial realism now, but a likelihood that many will be dragging themselves reluctantly to work if their estimates of when they can afford to retire turn out to be even slightly over-optimistic. The ‘age of anger’ is below the state pension age of anyone who is under 52 now.
Chart 7: Attitudes to work
This means either that many people are going to have to work well beyond what they are currently willing to, or that they will need to find other sources of retirement income, at least to see them though the period until their state pension is available. As we highlighted in Part 3, deferring retirement and continuing to contribute can make a huge difference to income throughout retirement, but that may not be possible for everyone. Other options for plugging short-term or long-term income gaps include:
• Moving to part-time or less stressful / less physically demanding work
• Using ISAs and other savings to provide income
• Using housing equity to increase income, either by downsizing or through equity release
For many there is also a question of when and how they should annuitise their pension pot.
2013
2008
60 61 62 63 64 65 66 67 68 69 70
Age of Satisfaction
Age of Acceptance
Age of Resignation
Age of Anger
The DWP has published a guide for employers on employing older workers, which highlights there may be 13.5 million job vacancies in the next 10 years.
22
Easing into retirement
We asked which options individuals would consider to extend their working life (chart 8 – more than one option could be selected), and by far the most common response was that people would like to work fewer hours in their current job. A significant number also commented that they would like to continue full-time in their current role, which was not one of the options offered.
Chart 8: Options for easing into retirement
This is in some ways quite encouraging, but must be tempered by the fact that 61% of those between 50 and 59, and 65% of those between 30 and 49, want to make the transition by the time they reach age 60, so it is largely seen as partial early retirement rather than a way of working beyond traditional ages. Nevertheless, late career changes will inevitably become more common, and Government and employers should do all they can to facilitate them.
The DWP has published a guide for employers on employing older workers, which highlights there may be 13.5 million job vacancies in the next 10 years but only 7 million young people leaving school and
college. (iv) If this happens, it will mean that employers will have little choice but to employ older staff.
Securing retirement income
One of the key messages which must be communicated to people of all ages is that retirement saving need not be through pensions alone. Of course, pensions are tax-privileged, and are increasingly flexible post-retirement for those with substantial amounts built up, but other investments can play a key role in retirement planning.
A third (33%) of respondents saw cash savings, including cash ISAs, as helping to ensure a reasonable standard of living in retirement, and this was higher than any form of pension except state benefits. Almost a quarter (23%) saw their property contributing, while almost a fifth (18%) were optimistically relying on an inheritance. However, only 8% thought investment bonds, endowments or equity ISAs would be significant. Young people were particularly likely to cite cash savings (40% of those aged 22-29) which is unlikely to be a good strategy over the very long term.
This does suggest a willingness to look beyond pensions, and many people would rather not see their money tied up absolutely until they reach age 55. As always, a combination of investments makes sense, with pension savings complemented by other vehicles. These may be particularly helpful in plugging an income gap before state pension kicks in.
Annuitisation
For most people with a defined contribution pension, buying an annuity remains the ultimate answer, but there are questions of when and how. There has been a lot of activity in this area, including the ABI Code of Conduct on Retirement Choices, which came into force on 1 March 2013. This is intended particularly to address the issue of consumers failing to shop around for annuities, but arguably the biggest issue is not finding the best rate but buying an annuity at the right time and in the right form.
As outlined in Part 3, deferring retirement can make a huge difference to retirement income. Even if there are no further contributions, based on annuity rates in April 2013 simply deferring pension from 65 to 70 with no further contributions could increase income by 40% for a level annuity, or 34% for an index-linked one. However, the total value of annuity instalments from age 70 will only catch up with those from 65 at around age 85.
There are many factors which may influence a decision on whether or not to delay starting pension income – not least whether other sources of income are available. Some of the considerations are listed in table 6.
Table 6: Considerations in deferring annuity purchase
Expect to see an improvement in the economy in 2013.
UK adult population failing to save.
11%
31%
57% Individuals believe that they are saving less now than two years ago.
57%
11%Expect to see an improvement in the economy in 2013.
31% UK adult population failing to save.
57%Individuals believe that they are saving less now than two years ago.
Doing voluntary work16%
Leaving paid employmentand doing freelance/consultancy work
14%
Doing a different job thatneeds less manual effort21%
Doing a different job thatis less stressful
33%
Doing a job similar to mycurrent one, but with fewerresponsibilities
26%
Doing my current job, butworking fewer hours eachweek
48%
Short-term income needs
These may require annuitisation sooner rather than later, but could potentially be filled by other means such as:
– Earned income, perhaps part-time– Other savings – e.g. ISAs– Other pensions, such as defined benefit schemes– Income drawdown, perhaps with a lower income level than could be bought through an annuity
Long-term income needs
Deferring taking income should increase the amount eventually available, which in turn should increase income throughout retirement. However:
– Total income received will not catch up for many years (see main text)– Final income is subject to performance of investments and future annuity rates– An alternative might be to take income and reinvest it
Death benefits/ Inheritance
Leaving a pension plan in a pre-retirement state should mean that on death before age 75 the whole value is available without any tax charge. If it is in drawdown, the fund is available but is subject to a 55% tax charge. Alternatively a dependant may continue to a draw pension. Once in an annuity death benefits are usually much lower, although some guarantee a return of the balance of the original capital, subject to a 55% tax charge.
Flexibility It is not normally possible to change a lifetime annuity once it is set up. Pre-retirement pension or drawdown allow changes in circumstances to be incorporated. For example, the consumer may qualify for an enhanced annuity if health deteriorates, or if a spouse/partner dies there will be no need for a joint life annuity.
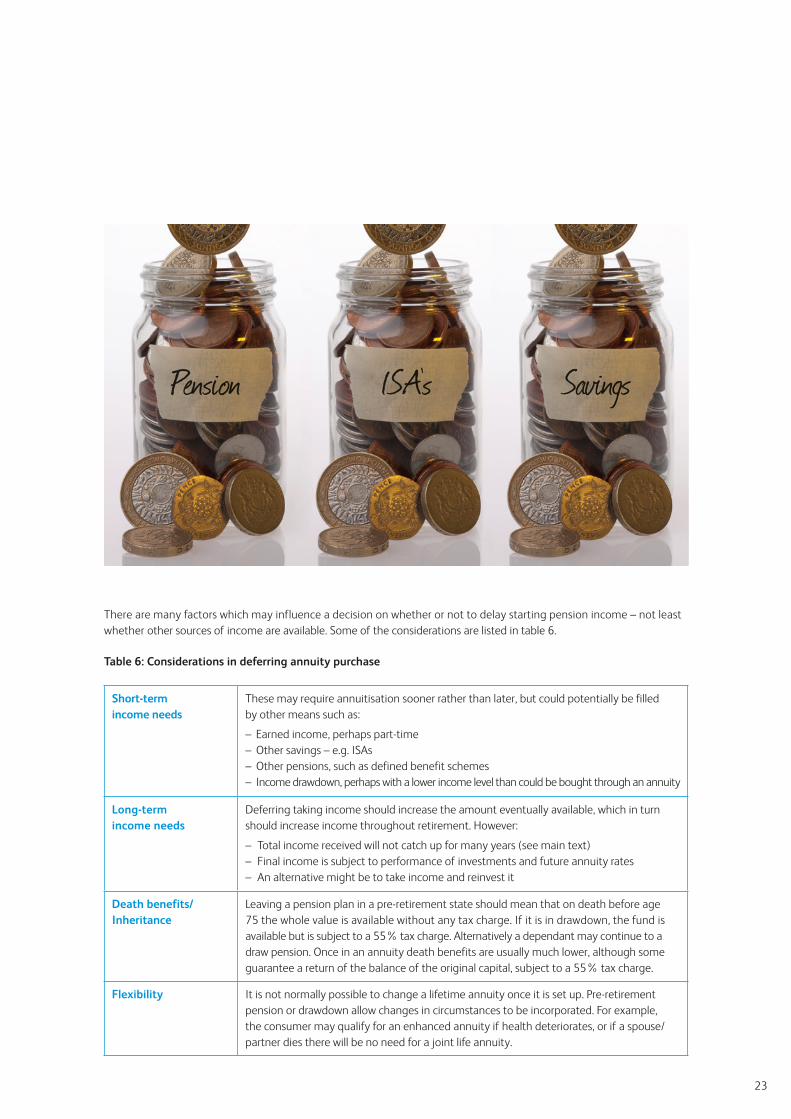
23
Securing retirement income
One of the key messages which must be communicated to people of all ages is that retirement saving need not be through pensions alone. Of course, pensions are tax-privileged, and are increasingly flexible post-retirement for those with substantial amounts built up, but other investments can play a key role in retirement planning.
A third (33%) of respondents saw cash savings, including cash ISAs, as helping to ensure a reasonable standard of living in retirement, and this was higher than any form of pension except state benefits. Almost a quarter (23%) saw their property contributing, while almost a fifth (18%) were optimistically relying on an inheritance. However, only 8% thought investment bonds, endowments or equity ISAs would be significant. Young people were particularly likely to cite cash savings (40% of those aged 22-29) which is unlikely to be a good strategy over the very long term.
This does suggest a willingness to look beyond pensions, and many people would rather not see their money tied up absolutely until they reach age 55. As always, a combination of investments makes sense, with pension savings complemented by other vehicles. These may be particularly helpful in plugging an income gap before state pension kicks in.
Annuitisation
For most people with a defined contribution pension, buying an annuity remains the ultimate answer, but there are questions of when and how. There has been a lot of activity in this area, including the ABI Code of Conduct on Retirement Choices, which came into force on 1 March 2013. This is intended particularly to address the issue of consumers failing to shop around for annuities, but arguably the biggest issue is not finding the best rate but buying an annuity at the right time and in the right form.
As outlined in Part 3, deferring retirement can make a huge difference to retirement income. Even if there are no further contributions, based on annuity rates in April 2013 simply deferring pension from 65 to 70 with no further contributions could increase income by 40% for a level annuity, or 34% for an index-linked one. However, the total value of annuity instalments from age 70 will only catch up with those from 65 at around age 85.
There are many factors which may influence a decision on whether or not to delay starting pension income – not least whether other sources of income are available. Some of the considerations are listed in table 6.
Table 6: Considerations in deferring annuity purchase
Improving our population’s awareness and knowledge of financial products is the key to increasing saving.
Short-term income needs
These may require annuitisation sooner rather than later, but could potentially be filled by other means such as:
– Earned income, perhaps part-time– Other savings – e.g. ISAs– Other pensions, such as defined benefit schemes– Income drawdown, perhaps with a lower income level than could be bought through an annuity
Long-term income needs
Deferring taking income should increase the amount eventually available, which in turn should increase income throughout retirement. However:
– Total income received will not catch up for many years (see main text)– Final income is subject to performance of investments and future annuity rates– An alternative might be to take income and reinvest it
Death benefits/ Inheritance
Leaving a pension plan in a pre-retirement state should mean that on death before age 75 the whole value is available without any tax charge. If it is in drawdown, the fund is available but is subject to a 55% tax charge. Alternatively a dependant may continue to a draw pension. Once in an annuity death benefits are usually much lower, although some guarantee a return of the balance of the original capital, subject to a 55% tax charge.
Flexibility It is not normally possible to change a lifetime annuity once it is set up. Pre-retirement pension or drawdown allow changes in circumstances to be incorporated. For example, the consumer may qualify for an enhanced annuity if health deteriorates, or if a spouse/partner dies there will be no need for a joint life annuity.
24
For many consumers, there may well be benefit in deferring annuity purchase, or possibly securing some income through an annuity fairly early on and leaving the remainder invested. Such decisions need to be made with the help of a professional adviser.
Understanding of annuities
In our research, just under half (47%) of consumers claimed to know what an annuity is, and when tested against a small number of alternatives (a type of pension to help you save for retirement, an alternative savings product that is used instead of a pension and a savings product that can be used at any time in your life) 79% of these correctly identified it as a product that pays an income to you in retirement. Unsurprisingly, awareness levels increased with age, peaking at age 60 to 64 when 69% felt they understood what an annuity is and 86% of them correctly identified it. Awareness levels were slightly higher among men than among women. 68% of those with a personal pension claimed to understand it, with 83% of those choosing the right option. Overall this appears a fairly positive outcome.
Ease of purchase and convenience were key factors for many people, with 21% of those who have already bought an annuity saying that was the reason for staying
with the same company that provided their pension. The ABI code removes some of that ease by banning firms from sending an annuity application out with pre-retirement packs, and it is important that the momentum to make open market option purchases easier is maintained. The Options initiative supported by major insurers, including Scottish Widows, has substantially reduced the time consumers have to wait for money to move between providers at retirement.
Among those who have yet to buy an annuity, there is a distinct preference for shopping around for themselves (37%) rather than paying a professional adviser to help generate additional income (14%), though that leaves almost half who don’t know or haven’t considered it. That emphasises the importance of online facilities in helping people make the right decisions if they do not see an adviser, but also that advisers need to make it clear that their services go well beyond simply securing the best rate.
It is also very important that consumers make an informed choice about the type of annuity they buy – for example, whether it should increase each year to protect against inflation and whether it should continue to a spouse / partner on death. This points to the need for advice, or at least a straightforward guidance mechanism such as the one on the The Pensions Advisory Service (TPAS) website.
Part 5: Key findings and recommendations.
In last year’s report we presented our vision for improving financial provision in the UK. This year’s findings have confirmed the importance of our proposals.
Scottish Widows’ Vision
• To make more people better off by saving
• To ensure individuals in the UK are prepared for the future
To achieve this, we need to undertake the following:
• Improve consumer confidence
• Remove barriers to savings and protection
• Encourage the right behaviours
• Place savings and protection at the heart of Government policy
Key finding 1: A negative savings trend, but with positive signs of improvement
– The percentage of people who are currently making adequate retirement provision has fallen once again, with the Scottish Widows Pensions Index at its lowest level (45%) since our pension reports began eight years ago. Fewer than half of those who should be preparing financially for their old age are saving enough.
– However there appears to be positive signs that attitudes towards saving are changing for the better. More people are making an effort to save than last year, with only one in five doing nothing to prepare for retirement. If automatic enrolment succeeds in kick-starting pension provision for at least some of these, the situation could improve significantly.
25
with the same company that provided their pension. The ABI code removes some of that ease by banning firms from sending an annuity application out with pre-retirement packs, and it is important that the momentum to make open market option purchases easier is maintained. The Options initiative supported by major insurers, including Scottish Widows, has substantially reduced the time consumers have to wait for money to move between providers at retirement.
Among those who have yet to buy an annuity, there is a distinct preference for shopping around for themselves (37%) rather than paying a professional adviser to help generate additional income (14%), though that leaves almost half who don’t know or haven’t considered it. That emphasises the importance of online facilities in helping people make the right decisions if they do not see an adviser, but also that advisers need to make it clear that their services go well beyond simply securing the best rate.
It is also very important that consumers make an informed choice about the type of annuity they buy – for example, whether it should increase each year to protect against inflation and whether it should continue to a spouse / partner on death. This points to the need for advice, or at least a straightforward guidance mechanism such as the one on the The Pensions Advisory Service (TPAS) website.
Part 5: Key findings and recommendations.
In last year’s report we presented our vision for improving financial provision in the UK. This year’s findings have confirmed the importance of our proposals.
Scottish Widows’ Vision
• To make more people better off by saving
• To ensure individuals in the UK are prepared for the future
To achieve this, we need to undertake the following:
• Improve consumer confidence
• Remove barriers to savings and protection
• Encourage the right behaviours
• Place savings and protection at the heart of Government policy
Key finding 1: A negative savings trend, but with positive signs of improvement
– The percentage of people who are currently making adequate retirement provision has fallen once again, with the Scottish Widows Pensions Index at its lowest level (45%) since our pension reports began eight years ago. Fewer than half of those who should be preparing financially for their old age are saving enough.
– However there appears to be positive signs that attitudes towards saving are changing for the better. More people are making an effort to save than last year, with only one in five doing nothing to prepare for retirement. If automatic enrolment succeeds in kick-starting pension provision for at least some of these, the situation could improve significantly.
– The Scottish Widows Average Savings Ratio has risen slightly, from 8.9% to 9.1%, having seen very little movement in the last 5 years. However the fact that the savings ratio has been stable during the years of the financial crisis is a positive development which should not been overlooked – at the start of the crisis many would have predicted that savings rates would decline sharply as a result of poor economic circumstances, rising living costs and below-inflation earnings increases. Essentially, understanding the need to save for the long-term has remained at the front of people’s minds.
– The percentage of our Index group saving between 6% and 12% of earnings is at its highest level ever (20%). In many cases, a relatively modest savings increase could push them up to saving adequately for retirement.
– The percentage relying mainly on a DB pension for their retirement income has been noticeably lower in the last two years than previously. That has been a major factor in the lower Pensions Index, but in some ways is encouraging. Many who leave an employer with a DB pension still see that as their main provision, and if they are realising that it will not provide an adequate income by itself they are more likely to start saving at adequate levels.
The percentage of people who are currently making adequate retirement provision has fallen once again, with the Scottish Widows Pensions Index at its lowest level (45%).
26
Based on these findings, we propose the following steps in line with our vision:
– Consumers must be confident that it pays to save. The proposed changes to state pensions mean both that individuals should know with reasonable certainty what pension they will receive and that means-testing should not be an issue for most. It is important that these messages are clearly communicated. To assist with this, the state pension forecast system should be updated to reflect the new single state pension as soon as possible after the legislation is finalised.
– Serious consideration should be given to how individuals can be encouraged to save more that the statutory 8% of qualifying earnings (after the phasing period for automatic enrolment). This may involve increasing the minimum over time, but also the encouragement of ‘smart’ schemes and other methods of automatically increasing contribution levels as individuals get closer to retirement.
– A further major risk is that individuals lose confidence because they suffer investment losses. Both cautious investment approaches and the various strands of work around ‘defined ambition’ can help with this, but they also reduce growth potential. Improving consumer understanding of risk / reward trade-offs would lead to more informed decisions.
Key finding 2: A mismatch between expectation and reality
– The average British worker anticipates stopping work at around age 66 and is looking for retirement income of £25,000 a year in today’s money, having saved from age 30. However, achieving that level of income is likely to require contributions of around £1,000 per month, which is beyond most people’s capability, and is almost 8 times the automatic enrolment minimum for someone earning £25,000 a year.
– Our adequacy benchmark is 12% of full earnings – or £1 per month for every £100 per year of income. That is only a quarter of the level required for a £25,000 a year income, and could provide an income, including state pension when it comes into payment, of around £12,000 a year.
– Saving at the automatic enrolment minimum is likely to result in income of under £10,000 a year.
– In practice, a number of things need to happen alongside maximising contribution levels to make reality match expectations. One is to reduce income aspirations – accepting that in most cases there will be some fall in living standards, though often partly offset by reduced costs on mortgage, travel etc. A second is to work to an older age – saving from 30 to 70 rather than 65 could add 43% to private pension income. And a third is to start earlier – saving from age 20 rather than 30 to 65 could add almost two-fifths to the final pension. The cumulative effect of more than one of these options could make a big difference in matching retirement expectations.
Based on these findings, we propose the following steps in line with our vision:
– Consumers should be encouraged, where possible, to take individual advice on their financial planning.
– Where this is impractical, the Money Advice Service can help fill the gap, both through its phone / face-to-face services and through its website. The MAS/ABI pension calculator is particularly valuable in this context. Consumers should be encourage to access the site, perhaps as part of automatic enrolment communications where the scheme does not offer similar facilities.
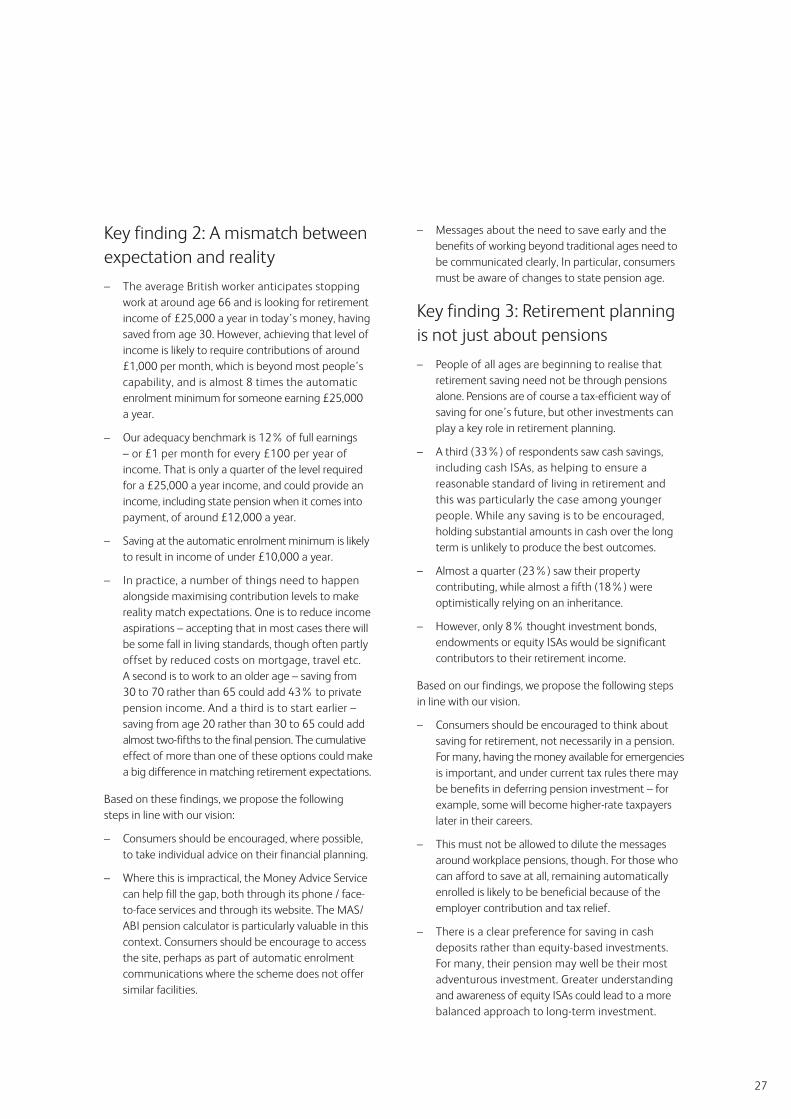
27
– Serious consideration should be given to how individuals can be encouraged to save more that the statutory 8% of qualifying earnings (after the phasing period for automatic enrolment). This may involve increasing the minimum over time, but also the encouragement of ‘smart’ schemes and other methods of automatically increasing contribution levels as individuals get closer to retirement.
– A further major risk is that individuals lose confidence because they suffer investment losses. Both cautious investment approaches and the various strands of work around ‘defined ambition’ can help with this, but they also reduce growth potential. Improving consumer understanding of risk / reward trade-offs would lead to more informed decisions.
Key finding 2: A mismatch between expectation and reality
– The average British worker anticipates stopping work at around age 66 and is looking for retirement income of £25,000 a year in today’s money, having saved from age 30. However, achieving that level of income is likely to require contributions of around £1,000 per month, which is beyond most people’s capability, and is almost 8 times the automatic enrolment minimum for someone earning £25,000 a year.
– Our adequacy benchmark is 12% of full earnings – or £1 per month for every £100 per year of income. That is only a quarter of the level required for a £25,000 a year income, and could provide an income, including state pension when it comes into payment, of around £12,000 a year.
– Saving at the automatic enrolment minimum is likely to result in income of under £10,000 a year.
– In practice, a number of things need to happen alongside maximising contribution levels to make reality match expectations. One is to reduce income aspirations – accepting that in most cases there will be some fall in living standards, though often partly offset by reduced costs on mortgage, travel etc. A second is to work to an older age – saving from 30 to 70 rather than 65 could add 43% to private pension income. And a third is to start earlier – saving from age 20 rather than 30 to 65 could add almost two-fifths to the final pension. The cumulative effect of more than one of these options could make a big difference in matching retirement expectations.
Based on these findings, we propose the following steps in line with our vision:
– Consumers should be encouraged, where possible, to take individual advice on their financial planning.
– Where this is impractical, the Money Advice Service can help fill the gap, both through its phone / face-to-face services and through its website. The MAS/ABI pension calculator is particularly valuable in this context. Consumers should be encourage to access the site, perhaps as part of automatic enrolment communications where the scheme does not offer similar facilities.
– Messages about the need to save early and the benefits of working beyond traditional ages need to be communicated clearly, In particular, consumers must be aware of changes to state pension age.
Key finding 3: Retirement planning is not just about pensions
– People of all ages are beginning to realise that retirement saving need not be through pensions alone. Pensions are of course a tax-efficient way of saving for one’s future, but other investments can play a key role in retirement planning.
– A third (33%) of respondents saw cash savings, including cash ISAs, as helping to ensure a reasonable standard of living in retirement and this was particularly the case among younger people. While any saving is to be encouraged, holding substantial amounts in cash over the long term is unlikely to produce the best outcomes.
– Almost a quarter (23%) saw their property contributing, while almost a fifth (18%) were optimistically relying on an inheritance.
– However, only 8% thought investment bonds, endowments or equity ISAs would be significant contributors to their retirement income.
Based on our findings, we propose the following steps in line with our vision.
– Consumers should be encouraged to think about saving for retirement, not necessarily in a pension. For many, having the money available for emergencies is important, and under current tax rules there may be benefits in deferring pension investment – for example, some will become higher-rate taxpayers later in their careers.
– This must not be allowed to dilute the messages around workplace pensions, though. For those who can afford to save at all, remaining automatically enrolled is likely to be beneficial because of the employer contribution and tax relief.
– There is a clear preference for saving in cash deposits rather than equity-based investments. For many, their pension may well be their most adventurous investment. Greater understanding and awareness of equity ISAs could lead to a more balanced approach to long-term investment.
28
Key finding 4: Where you work makes a big difference– 59% in the public sector are preparing adequately for
retirement, compared with 41% in the private sector and 50% in charitable organisations. This reflects the much greater availability of defined benefit pensions, which is likely to change significantly though public sector schemes are becoming less generous.
– DB schemes in the private sector are also cutting back, for example by moving to average salary or capping increases to pensionable pay. Such changes may reduce the disparity between DB and DC, particularly if ‘defined ambition’ schemes are developed as a hybrid.
– Those working for large companies are relatively well provided for. 53% of those with companies employing 250 staff or more are saving adequately, compared to 39% employed by smaller companies.
– Savings levels among the self-employed are particularly low. 33% are deemed to be saving adequately, but among these 20% are relying on deferred benefits in a DB scheme for their main retirement income, with only 13% achieving adequacy by saving at least 12% of income.
– There are significant variations across industries. In general, the least well provided for are those where wage levels are relatively low and workforces are quite transient, such as retail.
Based on our findings, we propose the following steps in line with our vision.
– Automatic enrolment should lead to greater consistency of provision among different company sizes and industries, though disparities are likely to remain. The Government could consider giving incentives to go beyond the automatic enrolment minimum, particularly for smaller companies. The proposed Employment Allowance which takes the first £2,000 of the National Insurance bill off every company could form a blueprint. For example, the first £5,000 of employer contribution above the automatic enrolment minimum could count double for Corporation Tax relief as long as it was not for the directors or connected parties.
– The self-employed will benefit particularly from the move to a single state pension, but more is needed to encourage them to save for retirement. One possibility might be to consider exempting pension contributions by the self-employed from National Insurance, in the same way as employer pension contributions.
Appendix 1: The Pensions Index and the Average Savings Ratio.
Calculation of the Pensions Index
The Scottish Widows Pensions Index is a snapshot of how well employed and self-employed people in the UK are currently preparing financially for retirement. It is based on those who are of an age – between 30 and 64 (men) / 59 (women) – and an income level – £10,000 or more a year – where they could reasonably be expected to be saving for their old age. The target retirement income is one that will leave most people feeling they are in an acceptable financial position, but which is likely to involve a sacrifice in living standard compared with when they were working.
The level of retirement income which consumers are likely to feel is acceptable will depend largely on their income while working. However, the proportion required is likely to be higher for lower earners than for those who are relatively well-off, and that is reflected in our assumptions.
We have assumed that saving 12% of earnings from age 30 to age 64 will provide an adequate income when combined with state pensions. The 12% includes employer pension contributions, tax relief and any non-pension savings for retirement, and could produce
a pension of around 17% of earnings at age 65 (v).
When added to state pension of £7,500 a year, those earning £10,000 a year and saving 12% a year may have an income replacement rate of around 92% in retirement, those earning £30,000 may have a replacement rate of around 42%, and those earning £50,000 may have a replacement rate of around 36%. These replacement rates are significantly lower than assumed in previous years because the MAS/ABI calculator now assumes investment growth of 5% a year in line with FCA maximum assumptions, down from 7% in previous years. We have retained the 12% benchmark for consistency, but if the new assumptions are reflected in reality most would want to save more to achieve a satisfactory living standard in retirement.
29
Based on our findings, we propose the following steps in line with our vision.
– Automatic enrolment should lead to greater consistency of provision among different company sizes and industries, though disparities are likely to remain. The Government could consider giving incentives to go beyond the automatic enrolment minimum, particularly for smaller companies. The proposed Employment Allowance which takes the first £2,000 of the National Insurance bill off every company could form a blueprint. For example, the first £5,000 of employer contribution above the automatic enrolment minimum could count double for Corporation Tax relief as long as it was not for the directors or connected parties.
– The self-employed will benefit particularly from the move to a single state pension, but more is needed to encourage them to save for retirement. One possibility might be to consider exempting pension contributions by the self-employed from National Insurance, in the same way as employer pension contributions.
Appendix 1: The Pensions Index and the Average Savings Ratio.
Calculation of the Pensions Index
The Scottish Widows Pensions Index is a snapshot of how well employed and self-employed people in the UK are currently preparing financially for retirement. It is based on those who are of an age – between 30 and 64 (men) / 59 (women) – and an income level – £10,000 or more a year – where they could reasonably be expected to be saving for their old age. The target retirement income is one that will leave most people feeling they are in an acceptable financial position, but which is likely to involve a sacrifice in living standard compared with when they were working.
The level of retirement income which consumers are likely to feel is acceptable will depend largely on their income while working. However, the proportion required is likely to be higher for lower earners than for those who are relatively well-off, and that is reflected in our assumptions.
We have assumed that saving 12% of earnings from age 30 to age 64 will provide an adequate income when combined with state pensions. The 12% includes employer pension contributions, tax relief and any non-pension savings for retirement, and could produce
a pension of around 17% of earnings at age 65 (v).
When added to state pension of £7,500 a year, those earning £10,000 a year and saving 12% a year may have an income replacement rate of around 92% in retirement, those earning £30,000 may have a replacement rate of around 42%, and those earning £50,000 may have a replacement rate of around 36%. These replacement rates are significantly lower than assumed in previous years because the MAS/ABI calculator now assumes investment growth of 5% a year in line with FCA maximum assumptions, down from 7% in previous years. We have retained the 12% benchmark for consistency, but if the new assumptions are reflected in reality most would want to save more to achieve a satisfactory living standard in retirement.
We have not yet taken into account the increasing state pension ages, either in setting the target contribution rate or in defining the index group, except through an alternative index tracking women up to age 64. We will consider how this can best be allowed for in future years.
Those with defined-benefit pensions need to be considered separately, because there is no direct relationship between contribution levels for individuals and the pension provided. In calculating the Index we have assumed that all those who expect to receive most retirement income from a defined-benefit pension are adequately provided for. We are aware that changes to defined benefit schemes will, in some cases, mean that benefits are reduced overall, but believe that those who receive their main retirement income from a defined benefit scheme will be relatively well catered for.
The Scottish Widows Pensions Index therefore tracks the percentage of those aged between 30 and 64 (30 and 59 for women) and earning £10,000 or more a year who are either relying mainly on a defined-benefit pension or saving at least 12% of earnings for their retirement (including any pension contribution by their employer).
The Scottish Widows Average Savings Ratio is the average percentage of earnings being saved for retirement by those in the Index group, but excluding those relying mainly on a defined-benefit pension.
Savings that are includedWhile pension arrangements remain the most common and most tax-efficient method of saving for retirement, many people use alternative savings vehicles such as ISAs, perhaps with a view towards moving funds into pension closer to retirement.
In calculating the Pensions Index and the Average Savings Ratio, we have taken account of all savings specifically intended to contribute towards retirement income. These comprise company and employee contributions to employer-sponsored pensions, individual contributions to personal and stakeholder pensions and non-pension savings. We have not included non-financial assets such as residential property.
30
Groups that are trackedWhile we are able to track preparation for retirement against many different criteria, there are three key differentiators that we monitor every year:
Gender: Women have always lagged behind men in pension provision, and we measure whether the gap is growing or shrinking.
Age: We divide the index between those aged 30 to 50, who are generally some distance from retirement, and those aged 51 to 64, who are approaching retirement.
Earnings: We monitor three bands to see the effect of earnings level on retirement preparation – £10,000-£29,999, £30,000-£49,999 and £50,000 and over.
(i) Labour Market Statistics, April 2013, ONS.
(ii) Illustrated pensions are taken from the Money Advice Service / ABI Pension Calculator, where the assumed investment growth rate is 5% a year and assumed inflation 2.5% a year. These tie in with the new FCA ‘middle’ growth rates, though many would consider these quite cautious. A higher assumed growth rate would increase the effect of starting saving earlier or working longer.
(iii) Save More Tomorrow: Using Behavioral Economics to Increase Employee Saving by Richard H Thaler and Shlomo Bernatzi, Journal of Political Economy, The University of Chicago, 2004.
(iv) Employing older workers: An employer’s guide to today’s multi-generational workforce, DWP, April 2013.
(v) Based on the ABI/Money Advice Service Pension Calculator, allowing for a single-life inflation-linked pension with no lump sum at retirement.

PB

Scottish Widows plc. Registered in Scotland No. 199549. Registered Office in the United Kingdom at 69 Morrison Street, Edinburgh EH3 8YF. Telephone: 0845 608 0371. Authorised by the Prudential Regulation Authority and regulated by the Financial Conduct Authority and the Prudential Regulation Authority. Financial Services Register number 191517 (www.fca.org.uk/firms/systems-reporting/register).46273 05/13