nielsen’s 2017 outbound chinese tourism and … · 2018-03-06nielsen’s 2017 outbound chinese...
TRANSCRIPT
2017OUTBOUND CHINESE TOURISMAND CONSUMPTION TRENDS
CONTENTS
INTRODUCTION 05
KEY FINDINGS 06
PART I: Outbound Chinese Tourism Trends 09
PART II: Outbound Chinese Tourism Consumption Trends 14
PART III: Outbound Chinese Tourism Mobile Payment—Current and Future Trends 23
3

Along with rising levels of income, travel has become a key indicator of quality of life for the country's rising affluent population with more and more Chinese traveling overseas for their vacations. According to statistics from the China National Tourism Administration, Chinese tourists traveled overseas on 131 million occasions in 2017, an increase of 7.0% from the previous year. Data from the International Association of Tour Managers shows that overseas travel[1] spending by Chinese tourists reached USD 261.1 billion in 2016, an increase of 4.5% year-on-year, and ranking first worldwide. What do Chinese tourists buy when they travel overseas? What role do mobile payments play in these overseas transactions? What are the drivers and barriers for Chinese tourists to use mobile payments while traveling overseas? In which travel scenarios have mobile payments been widely adopted? If overseas merchants adopt Chinese mobile payment brands, will it boost Chinese tourists' spending? This report attempts to answer these questions.The Outbound Chinese Tourism and Consumption Trends: 2017 Survey, jointly issued by Nielsen and Alipay, provides an in-depth analysis of current consumption and payment behaviors of outbound Chinese tourists travelling overseas and assesses future trends. Specifically, this analysis focuses on the usage of mobile payment platforms by Chinese tourists. Alipay, an icon of cashless lifestyle in China, is the focus of a case study discussing the influence of mobile payment platforms on Chinese tourists' spending patterns overseas.The respondents to this survey include both Chinese and non-Chinese tourists who have traveled overseas in the past year and are also planning to travel abroad within the next year. The respondents are aged 20 to 50, and are segmented hereinafter into the generational conventions used in the Chinese context: the "post-70s" generation (people born between 1970 and 1979), the "post-80s" (between '80 and '89), and the "post-90s" (those born between '90 and '99). 2,009 of the Chinese respondents interviewed online by Nielsen come from China's first-, second- and third-tier cities[2]. The 613 non-Chinese tourists traveling overseas[3] surveyed include 201 people from the United States, 111 from the United Kingdom, 100 from France, 100 from South Korea, and 101 from Japan. In-depth, face-to-face interviews were also conducted with 12 respondents who had returned to their hometowns of Shanghai and Chengdu after their overseas travels.
INTRODUCTION
Note 1: The "overseas travel" in this survey report refers to travel taken by the residents of a country to other countries or regions outside of their home region. The "overseas travel of Chinese tourists" in this survey report refers to the travel of residents of Chinese mainland to other countries or regions, including to Hong Kong, Macao, and Taiwan.Note 2: Respondents hailed from first-tier cities such as Beijing, Shanghai, Guangzhou, and Shenzhen, second-tier cities such as Tianjin, Nanjing, Hangzhou, Chengdu, Chongqing, and Qingdao, and third-tier cities such as Jilin, Zaozhuang, Taiyuan, Zhuhai, and Shaoxing.Note 3: The "non-Chinese tourists traveling overseas" in this survey report are residents of the country to which they are attributed, and do not include Chinese residents domiciled abroad who are not residents of that country.
5
KEY FINDINGS
WHEN CONSIDERING OVERSEAS TRAVEL DESTINATIONS AND TOURIST ATTRACTIONS, "COST" IS FAR LESS IMPORTANT THAN THE "EXPERIENCE".
The survey shows that for Chinese tourists who are generally well-off, tourist attractions and the travel experience are more important factors than the costs that might be incurred. 56% of the respondents expressed that the beauty and uniqueness of a given destination is their primary consideration, while 47% stated that safety of the destination would affect their travel choice. 45% said that they would consider the ease of visa procedures, and 35% felt that it is important that the locals at the destination make them feel welcomed. The question of affordability is only the fifth highest priority, with 34% of respondents expressing concern for the costs.
Note 1: All spending amounts specified in this survey report are in USD. The amount spent by non-Chinese tourists is calculated using the average exchange rate for their respective countries or regions in 2017 (to CNY, Euro, Pound, Yen, and Won), i.e., CNY 1=USD 0.1480, EUR 1=USD 1.12986, GBP 1=USD 1.2886, JPY 1=USD 0.0089 and KRW 1=USD 0.0009.
1
2
365% OF CHINESE TOURISTS USED MOBILE PAYMENT PLATFORMS DURING OVERSEAS TRAVEL.
According to the survey, the proportion of Chinese tourists who use mobile payment platforms is far greater than that of non-Chinese tourists. During their most recent overseas trip, 65% of Chinese tourists paid for their expenses via mobile payment, while a mere 11% of their non-Chinese counterparts used mobile payment.At present, the proportion of Chinese tourists using mobile payment (28%) is quickly approaching that of cash payments (30%). Compared with the previous two years, the proportion of cash payment has declined while the use of mobile payments has increased. Total transaction volume via mobile payments has also been on the rise: 77% of Chinese tourists spent more via mobile payments on their most recent overseas trip than on previous trips over the past two years.
CHINESE AND NON-CHINESE TOURISTS EXHIBIT OBVIOUS DIFFERENCES IN THE TYPE OF SPENDING ON OVERSEAS TRIPS, WITH CHINESE TOURISTS EXHIBITING STRONGER PURCHASING POWER.
The top three categories of expenses by outbound Chinese tourists are shopping (25%), hotel accommodations (19%), and dining (16%). Other categories of expenses include visits to tourist attractions, local transportation, recreation, and communications and others. Non-Chinese tourists spend the highest proportion of their travel funds on hotel accommodations (29%), dining (18%), and shopping (15%) during overseas trips. Non-Chinese tourists are more frugal in general, but will spend a greater proportion of their travel budget towards accommodations.Chinese tourists spent an average of USD 762 per person towards shopping on their most recent overseas trip, while non-Chinese tourists averaged USD 486[1].
6 Outbound Chinese Tourism and Consumption Trends
4
5
CHINESE TOURISTS PRIMARILY USE MOBILE PAYMENTS FOR SHOPPING, DINING AND VISITS TO TOURIST ATTRACTIONS WHEN TRAVELING OVERSEAS.
Shopping is where Chinese tourists use mobile payments the most. 63% of the Chinese respondents said they have used mobile payments for shopping, and 76% hoped that they could use mobile payment for shopping during their overseas travels in the future. 62% of the Chinese respondents have used mobile payment platforms to pay for dining, and 58% to pay for visits to tourist attractions. These are the three consumption categories in which Chinese tourists most often pay by mobile payments.
INCREASED ADOPTION OF MOBILE PAYMENT PLATFORMS BY OVERSEAS MERCHANTS ENCOURAGES SPENDING BY OUTBOUND CHINESE TOURISTS.
The survey shows that 93% of Chinese tourists would consider using mobile payments when traveling overseas if more overseas merchants would accept mobile payments in the future, while 91% would show greater willingness to spend and shop if overseas merchants accept Chinese mobile payment brands.
7

PART I: OUTBOUND CHINESE TOURISM TRENDS
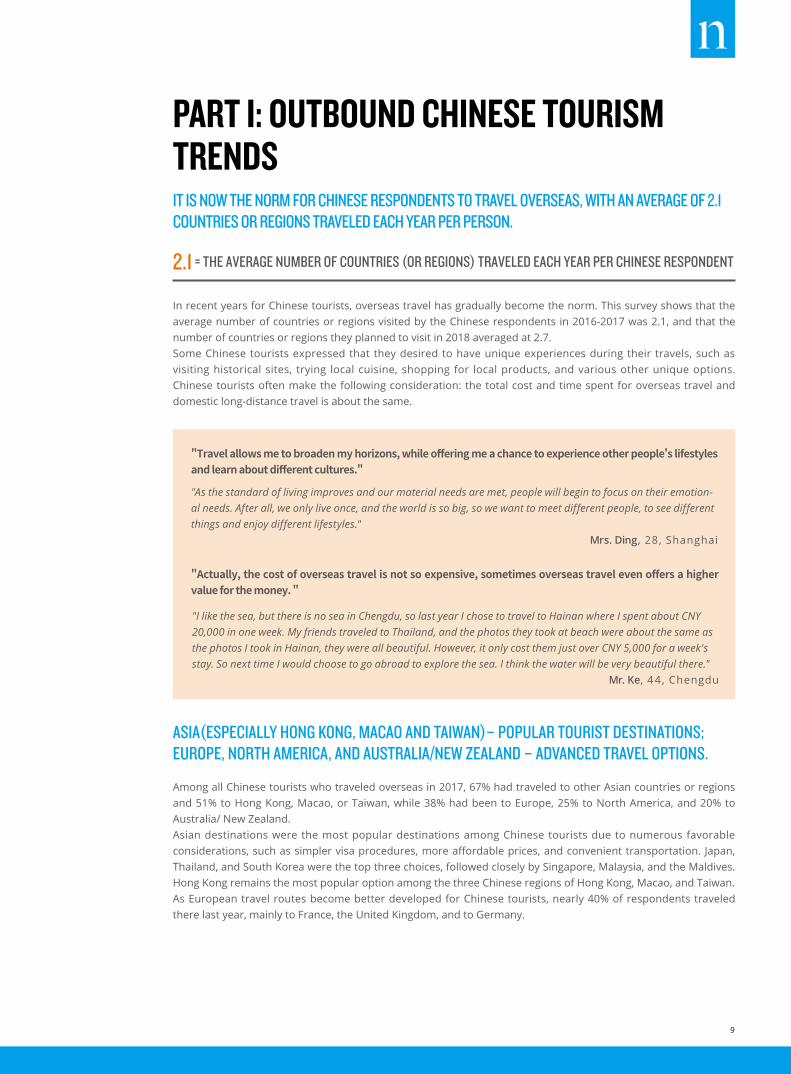
In recent years for Chinese tourists, overseas travel has gradually become the norm. This survey shows that the average number of countries or regions visited by the Chinese respondents in 2016-2017 was 2.1, and that the number of countries or regions they planned to visit in 2018 averaged at 2.7.Some Chinese tourists expressed that they desired to have unique experiences during their travels, such as visiting historical sites, trying local cuisine, shopping for local products, and various other unique options. Chinese tourists often make the following consideration: the total cost and time spent for overseas travel and domestic long-distance travel is about the same.
IT IS NOW THE NORM FOR CHINESE RESPONDENTS TO TRAVEL OVERSEAS, WITH AN AVERAGE OF 2.1 COUNTRIES OR REGIONS TRAVELED EACH YEAR PER PERSON.
Among all Chinese tourists who traveled overseas in 2017, 67% had traveled to other Asian countries or regions and 51% to Hong Kong, Macao, or Taiwan, while 38% had been to Europe, 25% to North America, and 20% to Australia/ New Zealand.Asian destinations were the most popular destinations among Chinese tourists due to numerous favorable considerations, such as simpler visa procedures, more affordable prices, and convenient transportation. Japan, Thailand, and South Korea were the top three choices, followed closely by Singapore, Malaysia, and the Maldives. Hong Kong remains the most popular option among the three Chinese regions of Hong Kong, Macao, and Taiwan.As European travel routes become better developed for Chinese tourists, nearly 40% of respondents traveled there last year, mainly to France, the United Kingdom, and to Germany.
ASIA(ESPECIALLY HONG KONG, MACAO AND TAIWAN)– POPULAR TOURIST DESTINATIONS; EUROPE, NORTH AMERICA, AND AUSTRALIA/NEW ZEALAND – ADVANCED TRAVEL OPTIONS.
2.1 = THE AVERAGE NUMBER OF COUNTRIES (OR REGIONS) TRAVELED EACH YEAR PER CHINESE RESPONDENT
"I like the sea, but there is no sea in Chengdu, so last year I chose to travel to Hainan where I spent about CNY 20,000 in one week. My friends traveled to Thailand, and the photos they took at beach were about the same as the photos I took in Hainan, they were all beautiful. However, it only cost them just over CNY 5,000 for a week's stay. So next time I would choose to go abroad to explore the sea. I think the water will be very beautiful there."
Mr. Ke, 44, Chengdu
"Actually, the cost of overseas travel is not so expensive, sometimes overseas travel even offers a higher value for the money. "
"As the standard of living improves and our material needs are met, people will begin to focus on their emotion-al needs. After all, we only live once, and the world is so big, so we want to meet different people, to see different things and enjoy different lifestyles."
Mrs. Ding, 28, Shanghai
"Travel allows me to broaden my horizons, while offering me a chance to experience other people's lifestyles and learn about different cultures."
9
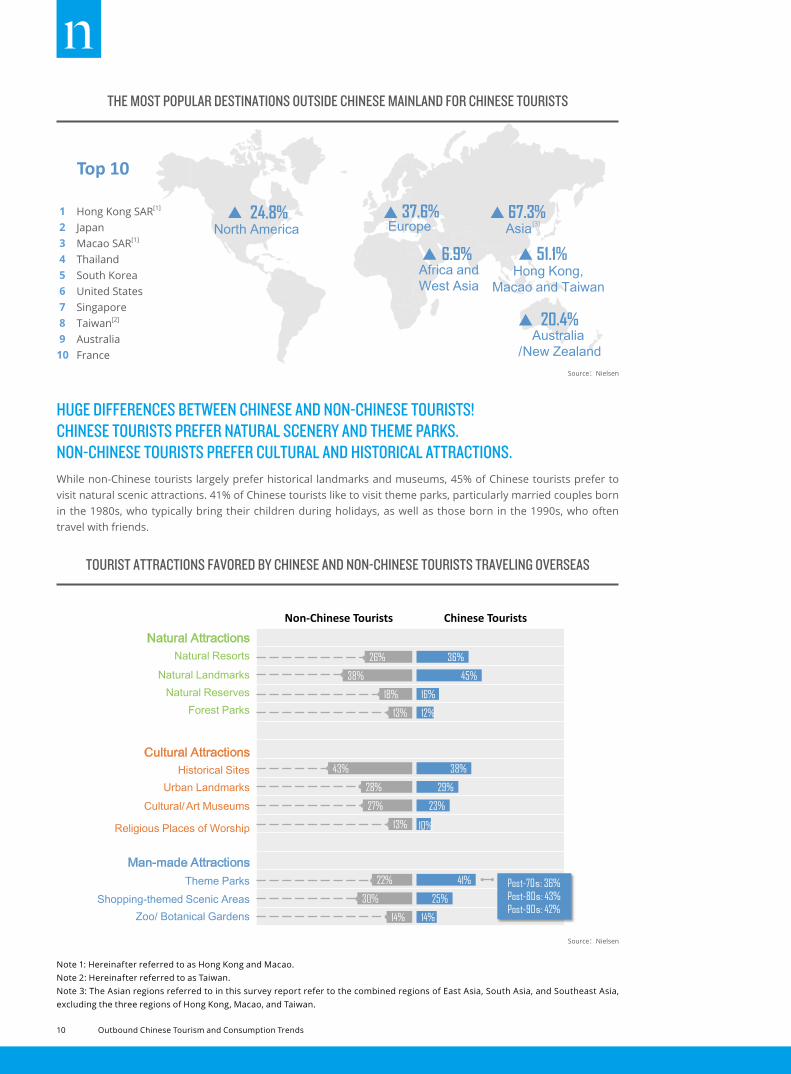
While non-Chinese tourists largely prefer historical landmarks and museums, 45% of Chinese tourists prefer to visit natural scenic attractions. 41% of Chinese tourists like to visit theme parks, particularly married couples born in the 1980s, who typically bring their children during holidays, as well as those born in the 1990s, who often travel with friends.
HUGE DIFFERENCES BETWEEN CHINESE AND NON-CHINESE TOURISTS! CHINESE TOURISTS PREFER NATURAL SCENERY AND THEME PARKS.NON-CHINESE TOURISTS PREFER CULTURAL AND HISTORICAL ATTRACTIONS.
56%47% 45 35%
5
90 8070 61% 70
26%
38%
18%
13%
43%
28%
27%
13%
22%
30%
14%
36%
45%
16%
12%
38%
29%
23%
10%
41%
25%
14%
Natural Attractions Natural Resorts
Natural Landmarks Natural Reserves
Forest Parks
Cultural Attractions Historical Sites
Urban Landmarks Cultural/Art Museums
Religious Places of Worship
Man-made Attractions Theme Parks
Shopping-themed Scenic Areas Zoo/ Botanical Gardens
Chinese Tourists Non-Chinese Tourists
Post-70s: 36% Post-80s: 43% Post-90s: 42%
Sources Nielsen
Tourist attractions favored by Chinese and non-Chinese tourists traveling overseas
Popular tourist spots favored by Chinese tourists (par list)
1 Hong Kong Disneyland
2 Victoria Harbor
3 Ocean Park Hong Kong
4 Tsim Sha Tsui
Hong Kong Japan Thailand
Australia
1 Tokyo Disneyland
2 Mount Fuji
3 Tokyo Tower
4 Hokkaido
1 Sydney Opera House
2 Sydney Harbour Bridge
3 Gold Coast
4 Great Barrier Reef
1 Phuket Island
2 Pattaya
3 Chiang Mai
4 Grand Palace
1 Louvre Museum
2 Notre-Dame de Paris
3 Eiffel Tower
4 Arc de Triomphe
1 Disneyland
2 Times Square
3 The Statue of
Liberty
4 The White House
France
The United States
Taiwan
South Korea
1 Riyuetan Pool
2 Tai Bei Gu Gong
3 Ali Mountain
4 Taipei 101
1 Chejudo
2 Seoul Tower
3 Dongdaemun
4 Gyeongbokgung Palace
1 Underwater World Singapore
2 Universal Studios Singapore
3 Merlion Park
4 Singapore Botanic Gardens
Singapore
Source:Nielsen
TOURIST ATTRACTIONS FAVORED BY CHINESE AND NON-CHINESE TOURISTS TRAVELING OVERSEAS
2-3个:每年人均境外游国家
近年来,对于中国旅游者而言,境外游日渐成为旅游首选并更为“常态化”。调查显示,在2016-2017年,中国受访者的年均旅游国家数量为2.1个,人均计划2018年去2.7个国家旅游,超越海外平均水平(2.0个)。
部分游客算过这么一回帐:花了同样的时间,同样的钱,所游览的人文景点,品尝的异域美食,享受到的购物体验,甚至旅途中的新奇见闻,境外游比国内游更丰富、更有品质。
亚洲及港澳台——广受青睐的旅游目的地;欧州、北美及新澳——旅游“进阶”不二之选
2017年内,67%的中国出境游受访者有过亚洲范围内的旅游经历,51%的受访者去过港
澳台地区旅游,而以欧洲、北美和澳新为旅游目的地的受访者占比分别为38%、25%、20%。
东南亚地区以其简易的签证手续、亲民的价格以及便利的交通等优势,以67%的比例
“当选”为受访者心中最受欢迎的出境游目的地;日本、泰国及韩国的受欢迎程度分列一到三位,紧随其后的分别是新加坡、马来西亚和马尔代夫。另外,香港依旧是港澳台区域最热门的旅游目的地。
伴随欧洲线路的逐渐成熟,接近4成的受访
者在欧洲大陆留下了他们的足迹,主要游览国家包括法国、英国及德国。
中国出境游“常态化”,人均每年2-3个国家
1 Hong Kong SAR 2 Japan
3 Macao SAR 4 Thailand
5 South Korea 6 The United States
7 Singapore 8 The Region of Taiwan
9 Australia 10 France
The most popular destinations outside mainland China for Chinese tourists:
Top 10
1 Hong Kong SAR 2 Japan
3 Macao SAR 4 Thailand
5 South Korea 6 The United States
7 Singapore 8 The Region of Taiwan
9 Australia 10 France
Hong Kong, Macao and Taiwan
51.1%
Asia 67.3%
Africa and West Asia
6.9%
Europe 37.6%
North America 24.8%
Australia / New Zealand
20.4%
Sources:Nielsen
THE MOST POPULAR DESTINATIONS OUTSIDE CHINESE MAINLAND FOR CHINESE TOURISTS
Source:Nielsen
Note 1: Hereinafter referred to as Hong Kong and Macao.Note 2: Hereinafter referred to as Taiwan. Note 3: The Asian regions referred to in this survey report refer to the combined regions of East Asia, South Asia, and Southeast Asia, excluding the three regions of Hong Kong, Macao, and Taiwan.
2-3个:每年人均境外游国家
近年来,对于中国旅游者而言,境外游日渐成为旅游首选并更为“常态化”。调查显示,在2016-2017年,中国受访者的年均旅游国家数量为2.1个,人均计划2018年去2.7个国家旅游,超越海外平均水平(2.0个)。
部分游客算过这么一回帐:花了同样的时间,同样的钱,所游览的人文景点,品尝的异域美食,享受到的购物体验,甚至旅途中的新奇见闻,境外游比国内游更丰富、更有品质。
亚洲及港澳台——广受青睐的旅游目的地;欧州、北美及新澳——旅游“进阶”不二之选
2017年内,67%的中国出境游受访者有过亚洲范围内的旅游经历,51%的受访者去过港
澳台地区旅游,而以欧洲、北美和澳新为旅游目的地的受访者占比分别为38%、25%、20%。
东南亚地区以其简易的签证手续、亲民的价格以及便利的交通等优势,以67%的比例
“当选”为受访者心中最受欢迎的出境游目的地;日本、泰国及韩国的受欢迎程度分列一到三位,紧随其后的分别是新加坡、马来西亚和马尔代夫。另外,香港依旧是港澳台区域最热门的旅游目的地。
伴随欧洲线路的逐渐成熟,接近4成的受访
者在欧洲大陆留下了他们的足迹,主要游览国家包括法国、英国及德国。
中国出境游“常态化”,人均每年2-3个国家
1 Hong Kong SAR 2 Japan
3 Macao SAR 4 Thailand
5 South Korea 6 The United States
7 Singapore 8 The Region of Taiwan
9 Australia 10 France
The most popular destinations outside mainland China for Chinese tourists:
Top 10
1 Hong Kong SAR 2 Japan
3 Macao SAR 4 Thailand
5 South Korea 6 The United States
7 Singapore 8 The Region of Taiwan
9 Australia 10 France
Hong Kong, Macao and Taiwan
51.1%
Asia 67.3%
Africa and West Asia
6.9%
Europe 37.6%
North America 24.8%
Australia / New Zealand
20.4%
Sources:Nielsen
1 Hong Kong SAR[1]
2 Japan 3 Macao SAR[1]
4 Thailand 5 South Korea 6 United States 7 Singapore 8 Taiwan[2]
9 Australia10 France
[3]
10 Outbound Chinese Tourism and Consumption Trends
56%47% 45 35%
5
90 8070 61% 70
26%
38%
18%
13%
43%
28%
27%
13%
22%
30%
14%
36%
45%
16%
12%
38%
29%
23%
10%
41%
25%
14%
Natural Attractions Natural Resorts
Natural Landmarks Natural Reserves
Forest Parks
Cultural Attractions Historical Sites
Urban Landmarks Cultural/Art Museums
Religious Places of Worship
Man-made Attractions Theme Parks
Shopping-themed Scenic Areas Zoo/ Botanical Gardens
Chinese Tourists Non-Chinese Tourists
Post-70s: 36% Post-80s: 43% Post-90s: 42%
Sources Nielsen
Tourist attractions favored by Chinese and non-Chinese tourists traveling overseas
Popular tourist spots favored by Chinese tourists (par list)
1 Hong Kong Disneyland
2 Victoria Harbor
3 Ocean Park Hong Kong
4 Tsim Sha Tsui
Hong Kong Japan Thailand
Australia
1 Tokyo Disneyland
2 Mount Fuji
3 Tokyo Tower
4 Hokkaido
1 Sydney Opera House
2 Sydney Harbour Bridge
3 Gold Coast
4 Great Barrier Reef
1 Phuket Island
2 Pattaya
3 Chiang Mai
4 Grand Palace
1 Louvre Museum
2 Notre-Dame de Paris
3 Eiffel Tower
4 Arc de Triomphe
1 Disneyland
2 Times Square
3 The Statue of
Liberty
4 The White House
France
The United States
Taiwan
South Korea
1 Riyuetan Pool
2 Tai Bei Gu Gong
3 Ali Mountain
4 Taipei 101
1 Chejudo
2 Seoul Tower
3 Dongdaemun
4 Gyeongbokgung Palace
1 Underwater World Singapore
2 Universal Studios Singapore
3 Merlion Park
4 Singapore Botanic Gardens
Singapore
Source:Nielsen
Source:Nielsen
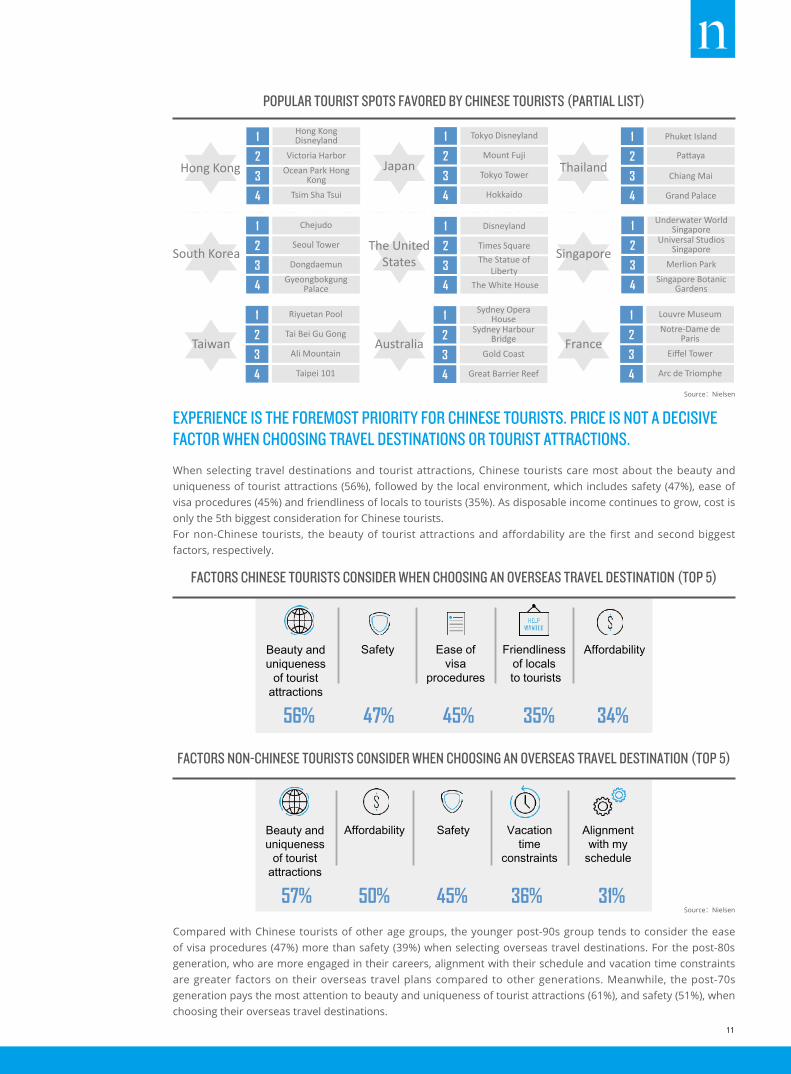
POPULAR TOURIST SPOTS FAVORED BY CHINESE TOURISTS (PARTIAL LIST)
FACTORS CHINESE TOURISTS CONSIDER WHEN CHOOSING AN OVERSEAS TRAVEL DESTINATION (TOP 5)
FACTORS NON-CHINESE TOURISTS CONSIDER WHEN CHOOSING AN OVERSEAS TRAVEL DESTINATION (TOP 5)
EXPERIENCE IS THE FOREMOST PRIORITY FOR CHINESE TOURISTS. PRICE IS NOT A DECISIVE FACTOR WHEN CHOOSING TRAVEL DESTINATIONS OR TOURIST ATTRACTIONS.
When selecting travel destinations and tourist attractions, Chinese tourists care most about the beauty and uniqueness of tourist attractions (56%), followed by the local environment, which includes safety (47%), ease of visa procedures (45%) and friendliness of locals to tourists (35%). As disposable income continues to grow, cost is only the 5th biggest consideration for Chinese tourists.For non-Chinese tourists, the beauty of tourist attractions and affordability are the first and second biggest factors, respectively.
Compared with Chinese tourists of other age groups, the younger post-90s group tends to consider the ease of visa procedures (47%) more than safety (39%) when selecting overseas travel destinations. For the post-80s generation, who are more engaged in their careers, alignment with their schedule and vacation time constraints are greater factors on their overseas travel plans compared to other generations. Meanwhile, the post-70s generation pays the most attention to beauty and uniqueness of tourist attractions (61%), and safety (51%), when choosing their overseas travel destinations.
Ease of visa
procedures
Friendliness of locals to tourists
56% 47% 45% 35% 34%
57% 50% 45% 36% 31%
Factors Chinese tourists consider when choosing an overseas travel des na on (Top 5)
旅游 为 ,费用不是 出游国家 的高 素
同 中国人来近 的90后在 境游国家
不 的;而当 在 的
80后中,旅游 、
出境游的 其 人群;70后的出境游 更为 ,61%的70后 优美 为
Factors Post-90s
Post-80s
Post-70s
Factors di erent genera ons of Chinese tourists consider when choosing an overseas travel des na on(%)
Friendliness of locals to tourists 25 21 25
Affordability 39 49 51
it with my schedule 53 55 61
Vacation time constraints 33 37 33
47 45 44
Popularity of the country or region 20 20 18
Alignment with my objectives for travel 33 35 31
Distance to destination 19 13 16
The willingness of travel companion(s) 15 14 14
34 34
Safety 29 33 28
Ease of visa procedures 19 20 17
25 24 25
35
Rank
53 55 61
39 49 51
47 45 44
33 37 33
35 34 34
33 35 31
29 33 28
25 24 25
25 21 25
20 20 18
19 20 17
19 13 16
15 14 14
1
2
3
4
5
6
7
8
9
10
11
12
13
Sources Nielsen
Beauty and uniqueness
of tourist attractions
Safety Affordability
Sources Nielsen
Safety Vacation time
constraints
Beauty and uniqueness
of tourist attractions
Affordability Alignment with my
schedule
Factors non-Chinese tourists consider when choosing an overseas travel des na on (top 5)
Beauty and uniqueness of tourist attractions
Recommendations from friends and relatives
Introduction or recommendations fromtravel agency/platforms
56%47% 45 35%
5
90 8070 61% 70
26%
38%
18%
13%
43%
28%
27%
13%
22%
30%
14%
36%
45%
16%
12%
38%
29%
23%
10%
41%
25%
14%
Natural Attractions Natural Resorts
Natural Landmarks Natural Reserves
Forest Parks
Cultural Attractions Historical Sites
Urban Landmarks Cultural/Art Museums
Religious Places of Worship
Man-made Attractions Theme Parks
Shopping-themed Scenic Areas Zoo/ Botanical Gardens
Chinese Tourists Non-Chinese Tourists
Post-70s: 36% Post-80s: 43% Post-90s: 42%
Sources Nielsen
Tourist attractions favored by Chinese and non-Chinese tourists traveling overseas
Popular tourist spots favored by Chinese tourists (par list)
1 Hong Kong Disneyland
2 Victoria Harbor
3 Ocean Park Hong Kong
4 Tsim Sha Tsui
Hong Kong Japan Thailand
Australia
1 Tokyo Disneyland
2 Mount Fuji
3 Tokyo Tower
4 Hokkaido
1 Sydney Opera House
2 Sydney Harbour Bridge
3 Gold Coast
4 Great Barrier Reef
1 Phuket Island
2 Pattaya
3 Chiang Mai
4 Grand Palace
1 Louvre Museum
2 Notre-Dame de Paris
3 Eiffel Tower
4 Arc de Triomphe
1 Disneyland
2 Times Square
3 The Statue of
Liberty
4 The White House
France
The United States
Taiwan
South Korea
1 Riyuetan Pool
2 Tai Bei Gu Gong
3 Ali Mountain
4 Taipei 101
1 Chejudo
2 Seoul Tower
3 Dongdaemun
4 Gyeongbokgung Palace
1 Underwater World Singapore
2 Universal Studios Singapore
3 Merlion Park
4 Singapore Botanic Gardens
Singapore
11
"FREE YOURSELF": "WHAT AND HOW TO ENJOY" DURING OVERSEAS TRAVEL.
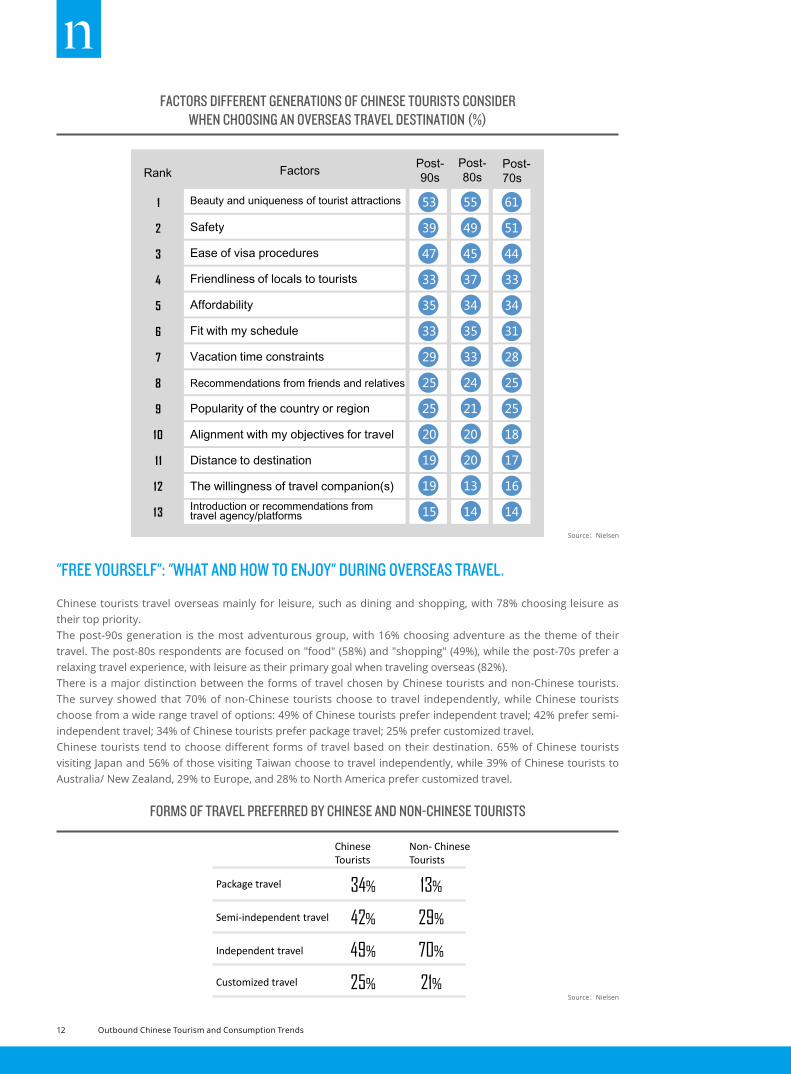
Chinese tourists travel overseas mainly for leisure, such as dining and shopping, with 78% choosing leisure as their top priority.The post-90s generation is the most adventurous group, with 16% choosing adventure as the theme of their travel. The post-80s respondents are focused on "food" (58%) and "shopping" (49%), while the post-70s prefer a relaxing travel experience, with leisure as their primary goal when traveling overseas (82%).There is a major distinction between the forms of travel chosen by Chinese tourists and non-Chinese tourists.The survey showed that 70% of non-Chinese tourists choose to travel independently, while Chinese tourists choose from a wide range travel of options: 49% of Chinese tourists prefer independent travel; 42% prefer semi-independent travel; 34% of Chinese tourists prefer package travel; 25% prefer customized travel.Chinese tourists tend to choose different forms of travel based on their destination. 65% of Chinese tourists visiting Japan and 56% of those visiting Taiwan choose to travel independently, while 39% of Chinese tourists to Australia/ New Zealand, 29% to Europe, and 28% to North America prefer customized travel.
Source:Nielsen
Source:Nielsen78% 55% 47% 30% 12%
Leisure Enjoying Food Shopping RomanticGetaway
Adventure
Post-90s
Post-80s
Post-70s
74%
79%
82%
52%
58%
56%
46%
49%
45%
32%
33%
23%
16%
10%
11%
出境游“怎么玩”:旅游形式中国人境外旅游形式与国外有较大差异。调查显示,接近7成的外国
游客在境外游览时会选择自助游的旅游形式;而中国游客的出境形式则更为多样,用户会根据目的地的不同,灵活选择出游形式。去日本和去台湾的游客中,分别有65%和56%更习惯于自助游;去欧洲、北美和澳新旅游选择私人定制游的比例更高,分别为29%、28%和39%。
智能通讯出行,成为出境游新趋势伴随智能手机的普及,以及越来越多的通讯社交、地图导航、当
地吃喝和消费付款等需要通过手机上网实现的旅游刚需,当前97%的中国公民在境外旅游前都会做好境外手机及网络的准备。开通手机国际漫游和购买优惠通讯套餐是最常见的准备方式,分别有62%和50%通过此类方式;另外并有38%的游客采用租赁境外wifi、34%的游客购买当地手机及手机卡、以及18%的人租赁国外手机及手机卡。
当在国外使用手机上网时,81%的中国游客使用过wifi联网,主要依靠公共免费wifi(56%)和租赁的境外wifi(49%)设备;而更乐于尝试新事物的80后和90后,使用租借的境外wifi上网的比例更高,分别为55%和52%。另外,69%的中国游客在境外会直接使用手机流量上网。
Objectives for Chinese tourists traveling overseas
62% 50%Purchase
discountedcommunication
packages
38%Rent local
portable Wi-Fidevices
Purchase international
roamingservices for
mobile phones
56% 49%Use rented
local portable Wi-Fi devices
39%Use mobiledata whennecessary
Use free publicWi-Fi (if any)
on their mobilephones
Sources:Nielsen
Communication plans used by Chinesetourists while overseas (top 3)
Sources:Nielsen
Package travel
Semi-independent travel
Independent travel
Customized travel
34% 13%
42% 29%
49% 70%
25% 21%
Chinese Tourists
Non- Chinese Tourists
Sources:Nielsen
Forms of travel preferred by Chineseand non-Chinese tourists
Objectives for Chinese tourists of different generations traveling overseas
How Chinese tourists connect their phonesto the internet while overseas (top 3)
FORMS OF TRAVEL PREFERRED BY CHINESE AND NON-CHINESE TOURISTS
FACTORS DIFFERENT GENERATIONS OF CHINESE TOURISTS CONSIDERWHEN CHOOSING AN OVERSEAS TRAVEL DESTINATION (%)
Ease ofvisa
procedures
Friendlinessof localsto tourists
56% 47% 45% 35% 34%
57% 50% 45% 36% 31%
Factors Chinese tourists consider whenchoosing an overseas travel des na on (Top 5)
旅游 为 ,费用不是 出游国家 的高 素
同 中国人来近 的90后在 境游国家
不 的;而当 在 的
80后中,旅游 、
出境游的 其 人群;70后的出境游 更为 ,61%的70后 优美 为
Factors Post-90s
Post-80s
Post-70s
Factors di erent genera ons of Chinese tourists consider whenchoosing an overseas travel des na on(%)
Friendliness of locals to tourists 25 21 25
Affordability 39 49 51
it with my schedule 53 55 61
Vacation time constraints 33 37 33
47 45 44
Popularity of the country or region 20 20 18
Alignment with my objectives for travel 33 35 31
Distance to destination 19 13 16
The willingness of travel companion(s) 15 14 14
34 34
Safety 29 33 28
Ease of visa procedures 19 20 17
25 24 25
35
Rank
53 55 61
39 49 51
47 45 44
33 37 33
35 34 34
33 35 31
29 33 28
25 24 25
25 21 25
20 20 18
19 20 17
19 13 16
15 14 14
1
2
3
4
5
6
7
8
9
10
11
12
13
Sources Nielsen
Beauty and uniqueness
of touristattractions
Safety Affordability
Sources Nielsen
Safety Vacation time
constraints
Beauty and uniqueness
of touristattractions
Affordability Alignmentwith my
schedule
Factors non-Chinese tourists consider whenchoosing an overseas travel des na on (top 5)
Beauty and uniqueness of tourist attractions
Recommendations from friends and relatives
Introduction or recommendations fromtravel agency/platforms
12 Outbound Chinese Tourism and Consumption Trends
78% 55% 47% 30% 12%
Leisure Enjoying Food Shopping Romantic Getaway
Adventure
Post-90s
Post-80s
Post-70s
74%
79%
82%
52%
58%
56%
46%
49%
45%
32%
33%
23%
16%
10%
11%
出境游“怎么玩”:旅游形式中国人境外旅游形式与国外有较大差异。调查显示,接近7成的外国
游客在境外游览时会选择自助游的旅游形式;而中国游客的出境形式则更为多样,用户会根据目的地的不同,灵活选择出游形式。去日本和去台湾的游客中,分别有65%和56%更习惯于自助游;去欧洲、北美和澳新旅游选择私人定制游的比例更高,分别为29%、28%和39%。
智能通讯出行,成为出境游新趋势伴随智能手机的普及,以及越来越多的通讯社交、地图导航、当
地吃喝和消费付款等需要通过手机上网实现的旅游刚需,当前97%的中国公民在境外旅游前都会做好境外手机及网络的准备。开通手机国际漫游和购买优惠通讯套餐是最常见的准备方式,分别有62%和50%通过此类方式;另外并有38%的游客采用租赁境外wifi、34%的游客购买当地手机及手机卡、以及18%的人租赁国外手机及手机卡。
当在国外使用手机上网时,81%的中国游客使用过wifi联网,主要依靠公共免费wifi(56%)和租赁的境外wifi(49%)设备;而更乐于尝试新事物的80后和90后,使用租借的境外wifi上网的比例更高,分别为55%和52%。另外,69%的中国游客在境外会直接使用手机流量上网。
Objectives for Chinese tourists traveling overseas
62% 50%Purchase
discountedcommunication
packages
38%Rent local
portable Wi-Fidevices
Purchase international
roamingservices for
mobile phones
56% 49%Use rented
local portable Wi-Fi devices
39%Use mobiledata whennecessary
Use free publicWi-Fi (if any)
on their mobilephones
Sources:Nielsen
Communication plans used by Chinesetourists while overseas (top 3)
Sources:Nielsen
Package travel
Semi-independent travel
Independent travel
Customized travel
34% 13%
42% 29%
49% 70%
25% 21%
ChineseTourists
Non- ChineseTourists
Sources:Nielsen
Forms of travel preferred by Chineseand non-Chinese tourists
Objectives for Chinese tourists of different generations traveling overseas
How Chinese tourists connect their phonesto the internet while overseas (top 3)
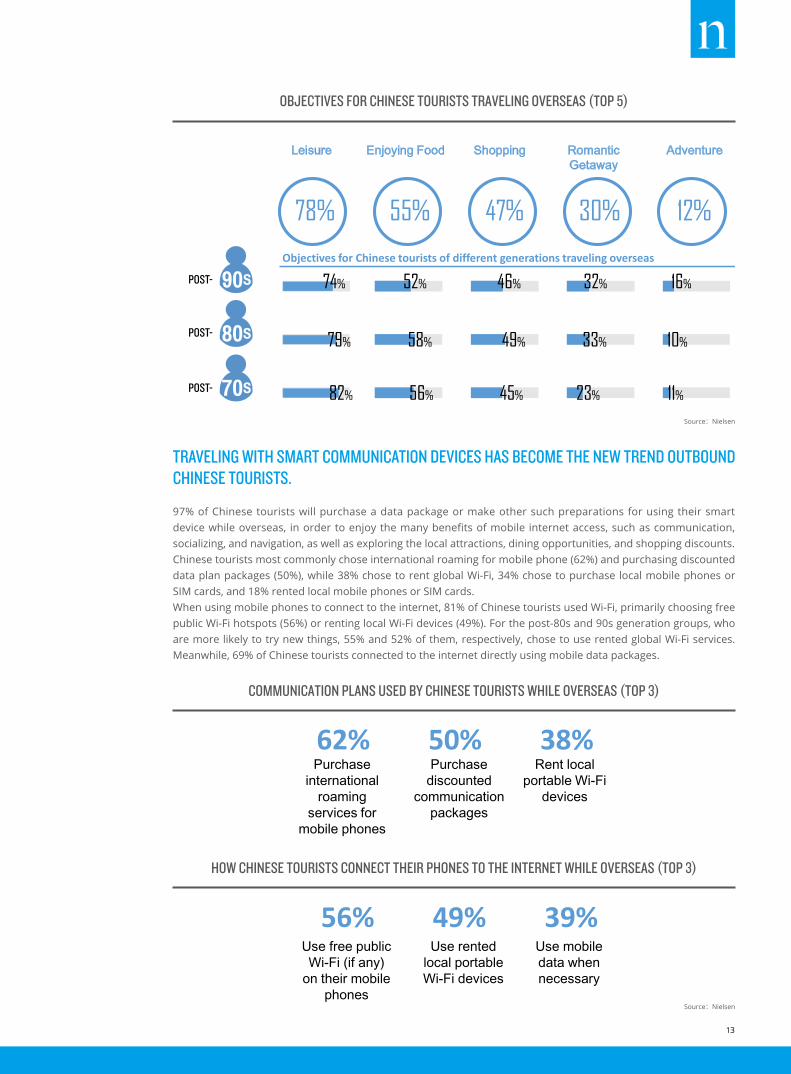
OBJECTIVES FOR CHINESE TOURISTS TRAVELING OVERSEAS (TOP 5)
COMMUNICATION PLANS USED BY CHINESE TOURISTS WHILE OVERSEAS (TOP 3)
HOW CHINESE TOURISTS CONNECT THEIR PHONES TO THE INTERNET WHILE OVERSEAS (TOP 3)
Source:Nielsen
Source:Nielsen
90S
80S
70S
POST-
POST-
POST-
78% 55% 47% 30% 12%
Leisure Enjoying Food Shopping RomanticGetaway
Adventure
Post-90s
Post-80s
Post-70s
74%
79%
82%
52%
58%
56%
46%
49%
45%
32%
33%
23%
16%
10%
11%
出境游“怎么玩”:旅游形式中国人境外旅游形式与国外有较大差异。调查显示,接近7成的外国
游客在境外游览时会选择自助游的旅游形式;而中国游客的出境形式则更为多样,用户会根据目的地的不同,灵活选择出游形式。去日本和去台湾的游客中,分别有65%和56%更习惯于自助游;去欧洲、北美和澳新旅游选择私人定制游的比例更高,分别为29%、28%和39%。
智能通讯出行,成为出境游新趋势伴随智能手机的普及,以及越来越多的通讯社交、地图导航、当
地吃喝和消费付款等需要通过手机上网实现的旅游刚需,当前97%的中国公民在境外旅游前都会做好境外手机及网络的准备。开通手机国际漫游和购买优惠通讯套餐是最常见的准备方式,分别有62%和50%通过此类方式;另外并有38%的游客采用租赁境外wifi、34%的游客购买当地手机及手机卡、以及18%的人租赁国外手机及手机卡。
当在国外使用手机上网时,81%的中国游客使用过wifi联网,主要依靠公共免费wifi(56%)和租赁的境外wifi(49%)设备;而更乐于尝试新事物的80后和90后,使用租借的境外wifi上网的比例更高,分别为55%和52%。另外,69%的中国游客在境外会直接使用手机流量上网。
Objectives for Chinese tourists traveling overseas
62% 50% Purchase
discounted communication
packages
38% Rent local
portable Wi-Fi devices
Purchase international
roaming services for
mobile phones
56% 49%Use rented
local portable Wi-Fi devices
39%Use mobiledata whennecessary
Use free publicWi-Fi (if any)
on their mobilephones
Sources:Nielsen
Communication plans used by Chinesetourists while overseas (top 3)
Sources:Nielsen
Package travel
Semi-independent travel
Independent travel
Customized travel
34% 13%
42% 29%
49% 70%
25% 21%
ChineseTourists
Non- ChineseTourists
Sources:Nielsen
Forms of travel preferred by Chineseand non-Chinese tourists
Objectives for Chinese tourists of different generations traveling overseas
How Chinese tourists connect their phonesto the internet while overseas (top 3)
78% 55% 47% 30% 12%
Leisure Enjoying Food Shopping RomanticGetaway
Adventure
Post-90s
Post-80s
Post-70s
74%
79%
82%
52%
58%
56%
46%
49%
45%
32%
33%
23%
16%
10%
11%
出境游“怎么玩”:旅游形式中国人境外旅游形式与国外有较大差异。调查显示,接近7成的外国
游客在境外游览时会选择自助游的旅游形式;而中国游客的出境形式则更为多样,用户会根据目的地的不同,灵活选择出游形式。去日本和去台湾的游客中,分别有65%和56%更习惯于自助游;去欧洲、北美和澳新旅游选择私人定制游的比例更高,分别为29%、28%和39%。
智能通讯出行,成为出境游新趋势伴随智能手机的普及,以及越来越多的通讯社交、地图导航、当
地吃喝和消费付款等需要通过手机上网实现的旅游刚需,当前97%的中国公民在境外旅游前都会做好境外手机及网络的准备。开通手机国际漫游和购买优惠通讯套餐是最常见的准备方式,分别有62%和50%通过此类方式;另外并有38%的游客采用租赁境外wifi、34%的游客购买当地手机及手机卡、以及18%的人租赁国外手机及手机卡。
当在国外使用手机上网时,81%的中国游客使用过wifi联网,主要依靠公共免费wifi(56%)和租赁的境外wifi(49%)设备;而更乐于尝试新事物的80后和90后,使用租借的境外wifi上网的比例更高,分别为55%和52%。另外,69%的中国游客在境外会直接使用手机流量上网。
Objectives for Chinese tourists traveling overseas
62% 50%Purchase
discountedcommunication
packages
38%Rent local
portable Wi-Fidevices
Purchase international
roamingservices for
mobile phones
56% 49% Use rented
local portable Wi-Fi devices
39% Use mobile data when necessary
Use free public Wi-Fi (if any)
on their mobile phones
Sources:Nielsen
Communication plans used by Chinesetourists while overseas (top 3)
Sources:Nielsen
Package travel
Semi-independent travel
Independent travel
Customized travel
34% 13%
42% 29%
49% 70%
25% 21%
ChineseTourists
Non- ChineseTourists
Sources:Nielsen
Forms of travel preferred by Chineseand non-Chinese tourists
Objectives for Chinese tourists of different generations traveling overseas
How Chinese tourists connect their phonesto the internet while overseas (top 3)
TRAVELING WITH SMART COMMUNICATION DEVICES HAS BECOME THE NEW TREND OUTBOUND CHINESE TOURISTS.
97% of Chinese tourists will purchase a data package or make other such preparations for using their smart device while overseas, in order to enjoy the many benefits of mobile internet access, such as communication, socializing, and navigation, as well as exploring the local attractions, dining opportunities, and shopping discounts. Chinese tourists most commonly chose international roaming for mobile phone (62%) and purchasing discounted data plan packages (50%), while 38% chose to rent global Wi-Fi, 34% chose to purchase local mobile phones orSIM cards, and 18% rented local mobile phones or SIM cards.When using mobile phones to connect to the internet, 81% of Chinese tourists used Wi-Fi, primarily choosing free public Wi-Fi hotspots (56%) or renting local Wi-Fi devices (49%). For the post-80s and 90s generation groups, who are more likely to try new things, 55% and 52% of them, respectively, chose to use rented global Wi-Fi services. Meanwhile, 69% of Chinese tourists connected to the internet directly using mobile data packages.
13
Travel Spending in 2017
从年均消费金额来看,中国游客的境外旅游花费稳中有升。2017年中国境外游人均花费3.76万,未来一年的人均预算达到3.86万,同比增长3%。
在旅游目的地花费方面,除去团费和来回大交通费用,中国游客最近1次境外旅游的人均当地花费为2.07万元。
在中国游客的热门境外游目的地中,长线游国家当地花费更高:赴美国旅游的游客人均花费达到3.01万,赴澳洲旅游的游客以2.39万的当地开销紧随其后;而中短途的亚洲线方面,泰国保持了价格亲民的优势,受访游客在当地的人均支出为1.37万,相较而言,日本和韩国素来为消费者的购物天堂,受访游客在当地的人均支出为2万元。
从游客的不同特征来看,90后和未婚的中国游客当地消费金额最低,均不满2万元;已婚育以及80后、70后人群花费金额较高,人均约2.1万元;而随着游客收入的增高,花费支出增长显著:月收入8,000元以下旅行者人均目的地花费1.53万,较高收入的旅行者(月收入15,000元以上)人均花费是普通收入旅行者(月收入4,000-8,000元)的1.7倍。
Average annual spending of Chinese touristson overseas travels each year per person
Travel Budget in2018
$5,565
$5,715
$3,064
$4,462
$3,754
$3,541
$3,007
$2,971
$2,952
$2,487
$2,335
$2,027
$2,026
+3%
Average on-location spending of Chinese tourists on overseas travel per person (Excluding tour group fee and costs of
transportation to and from the destination)
Post-90s
$2,877
Post-80s
$3,160
Post-70s
$3,117
Unmarried
$2,763
Married with no children
$3,119
Married with children
$3,165
United States
Europe
Australia
South Korea
Singapore
Japan
Hong Kong
Macao
Taiwan
Thailand
On-location spendingon overseas travel
per person $3,064
On-location spending of different demographicgroups during overseas travel per person
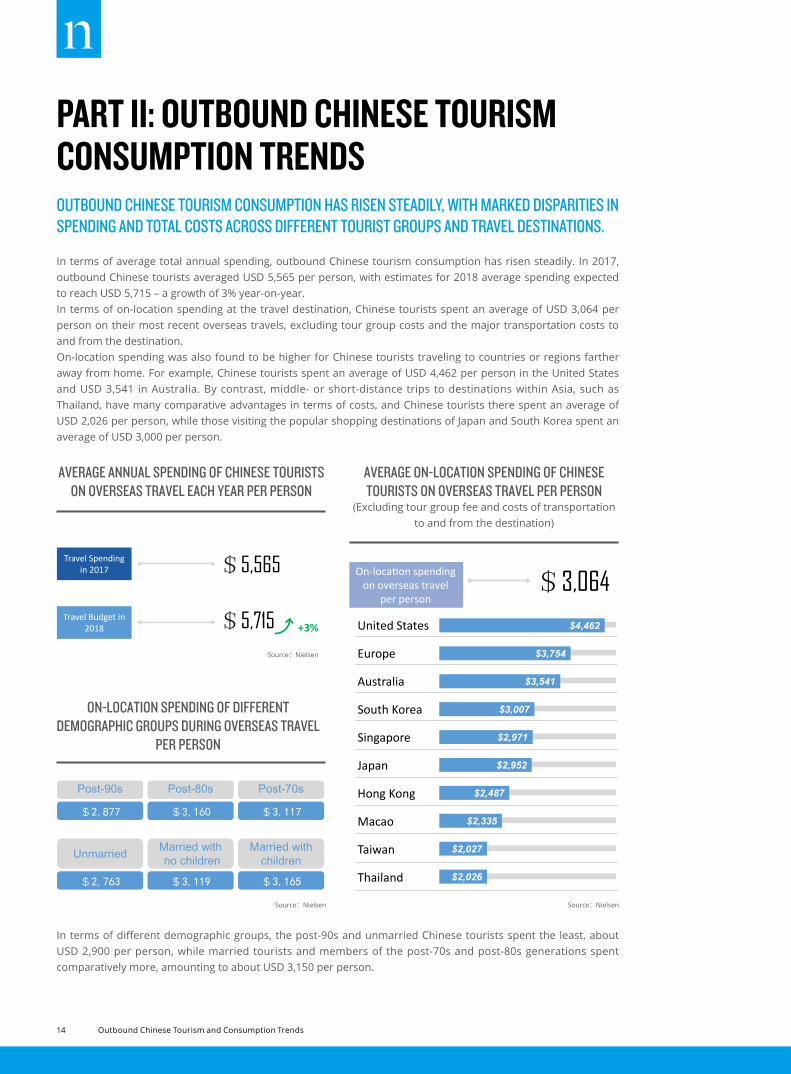
AVERAGE ANNUAL SPENDING OF CHINESE TOURISTSON OVERSEAS TRAVEL EACH YEAR PER PERSON
AVERAGE ON-LOCATION SPENDING OF CHINESE TOURISTS ON OVERSEAS TRAVEL PER PERSON
(Excluding tour group fee and costs of transportation to and from the destination)
ON-LOCATION SPENDING OF DIFFERENT DEMOGRAPHIC GROUPS DURING OVERSEAS TRAVEL
PER PERSON
Source:Nielsen
Source:NielsenSource:Nielsen
OUTBOUND CHINESE TOURISM CONSUMPTION HAS RISEN STEADILY, WITH MARKED DISPARITIES IN SPENDING AND TOTAL COSTS ACROSS DIFFERENT TOURIST GROUPS AND TRAVEL DESTINATIONS.
PART II: OUTBOUND CHINESE TOURISM CONSUMPTION TRENDS
In terms of average total annual spending, outbound Chinese tourism consumption has risen steadily. In 2017, outbound Chinese tourists averaged USD 5,565 per person, with estimates for 2018 average spending expected to reach USD 5,715 – a growth of 3% year-on-year.In terms of on-location spending at the travel destination, Chinese tourists spent an average of USD 3,064 per person on their most recent overseas travels, excluding tour group costs and the major transportation costs to and from the destination.On-location spending was also found to be higher for Chinese tourists traveling to countries or regions farther away from home. For example, Chinese tourists spent an average of USD 4,462 per person in the United States and USD 3,541 in Australia. By contrast, middle- or short-distance trips to destinations within Asia, such as Thailand, have many comparative advantages in terms of costs, and Chinese tourists there spent an average of USD 2,026 per person, while those visiting the popular shopping destinations of Japan and South Korea spent an average of USD 3,000 per person.
In terms of different demographic groups, the post-90s and unmarried Chinese tourists spent the least, about USD 2,900 per person, while married tourists and members of the post-70s and post-80s generations spent comparatively more, amounting to about USD 3,150 per person.
Travel Spendingin 2017
从年均消费金额来看,中国游客的境外旅游花费稳中有升。2017年中国境外游人均花费3.76万,未来一年的人均预算达到3.86万,同比增长3%。
在旅游目的地花费方面,除去团费和来回大交通费用,中国游客最近1次境外旅游的人均当地花费为2.07万元。
在中国游客的热门境外游目的地中,长线游国家当地花费更高:赴美国旅游的游客人均花费达到3.01万,赴澳洲旅游的游客以2.39万的当地开销紧随其后;而中短途的亚洲线方面,泰国保持了价格亲民的优势,受访游客在当地的人均支出为1.37万,相较而言,日本和韩国素来为消费者的购物天堂,受访游客在当地的人均支出为2万元。
从游客的不同特征来看,90后和未婚的中国游客当地消费金额最低,均不满2万元;已婚育以及80后、70后人群花费金额较高,人均约2.1万元;而随着游客收入的增高,花费支出增长显著:月收入8,000元以下旅行者人均目的地花费1.53万,较高收入的旅行者(月收入15,000元以上)人均花费是普通收入旅行者(月收入4,000-8,000元)的1.7倍。
Average annual spending of Chinese touristson overseas travels each year per person
Travel Budget in2018
$5,565
$5,715
$3,064
$4,462
$3,754
$3,541
$3,007
$2,971
$2,952
$2,487
$2,335
$2,027
$2,026
+3%
Average on-location spending of Chinese tourists on overseas travel per person (Excluding tour group fee and costs of
transportation to and from the destination)
Post-90s
$2,877
Post-80s
$3,160
Post-70s
$3,117
Unmarried
$2,763
Married with no children
$3,119
Married with children
$3,165
United States
Europe
Australia
South Korea
Singapore
Japan
Hong Kong
Macao
Taiwan
Thailand
On-location spendingon overseas travel
per person $3,064
On-location spending of different demographicgroups during overseas travel per person
Travel Spendingin 2017
从年均消费金额来看,中国游客的境外旅游花费稳中有升。2017年中国境外游人均花费3.76万,未来一年的人均预算达到3.86万,同比增长3%。
在旅游目的地花费方面,除去团费和来回大交通费用,中国游客最近1次境外旅游的人均当地花费为2.07万元。
在中国游客的热门境外游目的地中,长线游国家当地花费更高:赴美国旅游的游客人均花费达到3.01万,赴澳洲旅游的游客以2.39万的当地开销紧随其后;而中短途的亚洲线方面,泰国保持了价格亲民的优势,受访游客在当地的人均支出为1.37万,相较而言,日本和韩国素来为消费者的购物天堂,受访游客在当地的人均支出为2万元。
从游客的不同特征来看,90后和未婚的中国游客当地消费金额最低,均不满2万元;已婚育以及80后、70后人群花费金额较高,人均约2.1万元;而随着游客收入的增高,花费支出增长显著:月收入8,000元以下旅行者人均目的地花费1.53万,较高收入的旅行者(月收入15,000元以上)人均花费是普通收入旅行者(月收入4,000-8,000元)的1.7倍。
Average annual spending of Chinese touristson overseas travels each year per person
Travel Budget in 2018
$5,565
$5,715
$3,064
$4,462
$3,754
$3,541
$3,007
$2,971
$2,952
$2,487
$2,335
$2,027
$2,026
+3%
Average on-location spending of Chinese tourists on overseas travel per person (Excluding tour group fee and costs of
transportation to and from the destination)
Post-90s
$2,877
Post-80s
$3,160
Post-70s
$3,117
Unmarried
$2,763
Married with no children
$3,119
Married with children
$3,165
United States
Europe
Australia
South Korea
Singapore
Japan
Hong Kong
Macao
Taiwan
Thailand
On-location spendingon overseas travel
per person $3,064
On-location spending of different demographicgroups during overseas travel per person
Travel Spendingin 2017
从年均消费金额来看,中国游客的境外旅游花费稳中有升。2017年中国境外游人均花费3.76万,未来一年的人均预算达到3.86万,同比增长3%。
在旅游目的地花费方面,除去团费和来回大交通费用,中国游客最近1次境外旅游的人均当地花费为2.07万元。
在中国游客的热门境外游目的地中,长线游国家当地花费更高:赴美国旅游的游客人均花费达到3.01万,赴澳洲旅游的游客以2.39万的当地开销紧随其后;而中短途的亚洲线方面,泰国保持了价格亲民的优势,受访游客在当地的人均支出为1.37万,相较而言,日本和韩国素来为消费者的购物天堂,受访游客在当地的人均支出为2万元。
从游客的不同特征来看,90后和未婚的中国游客当地消费金额最低,均不满2万元;已婚育以及80后、70后人群花费金额较高,人均约2.1万元;而随着游客收入的增高,花费支出增长显著:月收入8,000元以下旅行者人均目的地花费1.53万,较高收入的旅行者(月收入15,000元以上)人均花费是普通收入旅行者(月收入4,000-8,000元)的1.7倍。
Average annual spending of Chinese touristson overseas travels each year per person
Travel Budget in2018
$5,565
$5,715
$3,064
$4,462
$3,754
$3,541
$3,007
$2,971
$2,952
$2,487
$2,335
$2,027
$2,026
+3%
Average on-location spending of Chinese tourists on overseas travel per person (Excluding tour group fee and costs of
transportation to and from the destination)
Post-90s
$2,877
Post-80s
$3,160
Post-70s
$3,117
Unmarried
$2,763
Married with no children
$3,119
Married with children
$3,165
United States
Europe
Australia
South Korea
Singapore
Japan
Hong Kong
Macao
Taiwan
Thailand
On-location spendingon overseas travel
per person $3,064
On-location spending of different demographicgroups during overseas travel per person
14 Outbound Chinese Tourism and Consumption Trends
Source:Nielsen
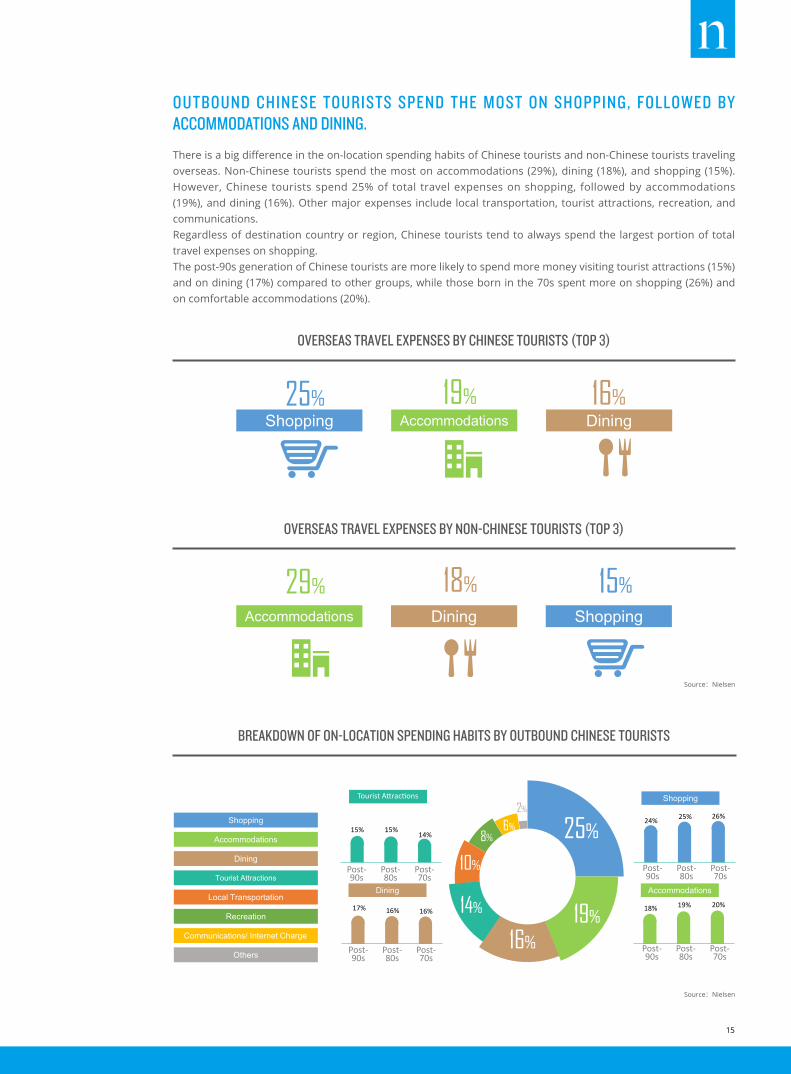
There is a big difference in the on-location spending habits of Chinese tourists and non-Chinese tourists traveling overseas. Non-Chinese tourists spend the most on accommodations (29%), dining (18%), and shopping (15%). However, Chinese tourists spend 25% of total travel expenses on shopping, followed by accommodations (19%), and dining (16%). Other major expenses include local transportation, tourist attractions, recreation, and communications.Regardless of destination country or region, Chinese tourists tend to always spend the largest portion of total travel expenses on shopping.The post-90s generation of Chinese tourists are more likely to spend more money visiting tourist attractions (15%) and on dining (17%) compared to other groups, while those born in the 70s spent more on shopping (26%) and on comfortable accommodations (20%).
OUTBOUND CHINESE TOURISTS SPEND THE MOST ON SHOPPING, FOLLOWED BY ACCOMMODATIONS AND DINING.
购物为中国游客境外游当地消费 支出 ,其后是 和
。外国游客的当地消费支出, (29%)、 (19%)、购物(15%)。而中国游客的境外游当地支出, , 25% (19%) (16%);
、当地交通、 、 。, 。
中国90 ,(15%) (17%) 70后游客,购物花费更高 (26%),(20%)。
Shopping
Accommodations
Dining
Tourist Attractions
Local Transportation
Recreation
Communications/ Internet Charge
Others
Top 3 overseas travel expenses by Chinese tourists
Shopping Accommodations Dining
Dining Shopping
25% 19% 16%
29% 18% 15%
Sources Nielsen
25%
19%
16%
14%
10%
8%6%
2%
Breakdown of on-location spending habits by Chinese tourists overseas
Accommodations
Top 3 overseas travel expenses by non-Chinese tourists
Post-90s
Post-80s
Post-70s
Sources Nielsen
15% 15%14%
Tourist Attractions
17% 16% 16%
Dining
24% 25% 26%
18% 19% 20%
Shopping
Accommodations
Post-90s
Post-80s
Post-70s
Post-90s
Post-80s
Post-70s
Post-90s
Post-80s
Post-70s
购物为中国游客境外游当地消费 支出 ,其后是 和
。外国游客的当地消费支出, (29%)、 (19%)、购物(15%)。而中国游客的境外游当地支出, , 25% (19%) (16%);
、当地交通、 、 。, 。
中国90 ,(15%) (17%) 70后游客,购物花费更高 (26%),(20%)。
Shopping
Accommodations
Dining
Tourist Attractions
Local Transportation
Recreation
Communications/ Internet Charge
Others
Top 3 overseas travel expenses by Chinese tourists
Shopping Accommodations Dining
Dining Shopping
25% 19% 16%
29% 18% 15%
Sources Nielsen
25%
19%
16%
14%
10%
8% 6%
2%
Breakdown of on-location spending habits by Chinese tourists overseas
Accommodations
Top 3 overseas travel expenses by non-Chinese tourists
Post-90s
Post-80s
Post-70s
Sources Nielsen
15% 15% 14%
Tourist Attractions
17% 16% 16%
Dining
24% 25% 26%
18% 19% 20%
Shopping
Accommodations
Post-90s
Post-80s
Post-70s
Post-90s
Post-80s
Post-70s
Post-90s
Post-80s
Post-70s
OVERSEAS TRAVEL EXPENSES BY NON-CHINESE TOURISTS (TOP 3)
BREAKDOWN OF ON-LOCATION SPENDING HABITS BY OUTBOUND CHINESE TOURISTS
OVERSEAS TRAVEL EXPENSES BY CHINESE TOURISTS (TOP 3)
Source:Nielsen
15
BREAKDOWN OF POPULAR SHOPPING LOCATIONS IN DIFFERENT COUNTRIES OR REGIONS FOR CHINESE TOURISTS
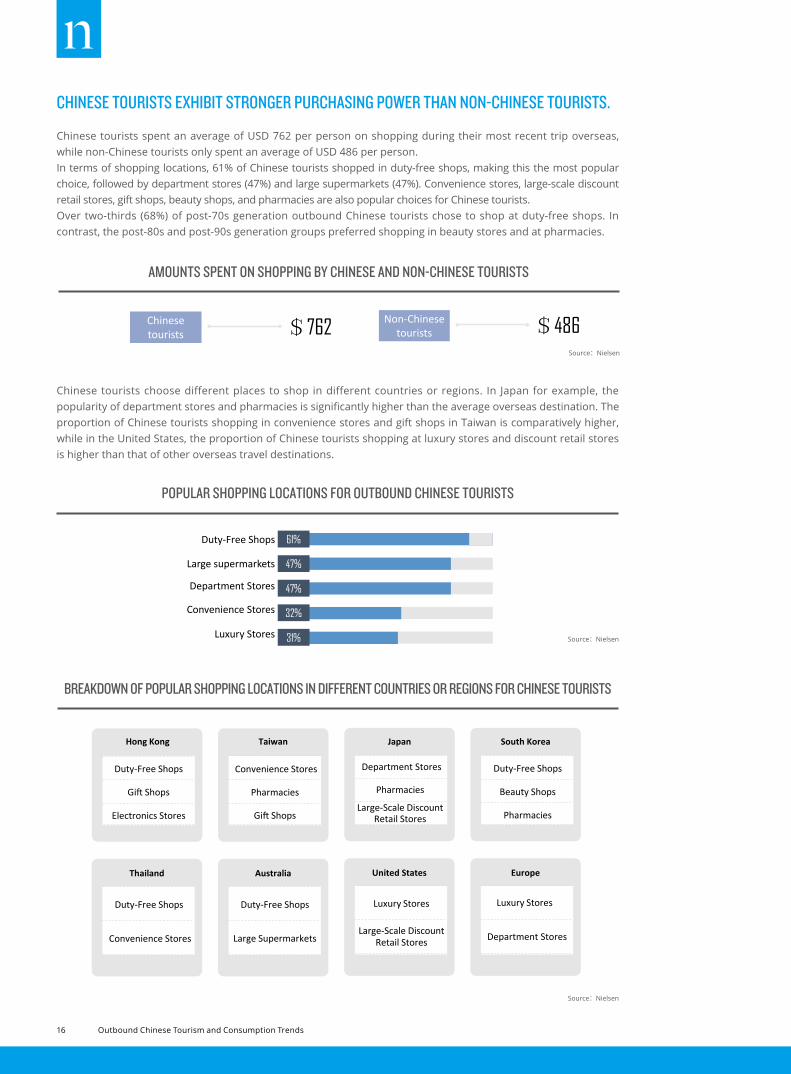
Chinese tourists spent an average of USD 762 per person on shopping during their most recent trip overseas, while non-Chinese tourists only spent an average of USD 486 per person.In terms of shopping locations, 61% of Chinese tourists shopped in duty-free shops, making this the most popular choice, followed by department stores (47%) and large supermarkets (47%). Convenience stores, large-scale discount retail stores, gift shops, beauty shops, and pharmacies are also popular choices for Chinese tourists.Over two-thirds (68%) of post-70s generation outbound Chinese tourists chose to shop at duty-free shops. In contrast, the post-80s and post-90s generation groups preferred shopping in beauty stores and at pharmacies.
CHINESE TOURISTS EXHIBIT STRONGER PURCHASING POWER THAN NON-CHINESE TOURISTS.
Duty-Free Shops
Large supermarkets
Department Stores
Convenience Stores
Luxury Stores
Large-Scale DiscountRetail Stores
Beauty Shops
Gi Shops
Pharmecies
Small- and medium-sized supermarkets
61%
47%
47%
32%
31%
31%
28%
28%
26%
21%
Popular shopping loca ons for Chinese tourists traveling overseas
Amounts spent on shopping by Chinese and non-Chinese tourists traveling overseas
Skin Care& Beauty Products Local special es Souvenirs Clothing,
Shoes & Hats Food
Pharmacy& Health Care
ProductsElectronicProducts Arts & Cra s
Watches& Jewelry
TOP1 TOP2 TOP3 TOP4 TOP5
TOP6 TOP7 TOP8 TOP9 TOP10
Chinese tourists $762 Non-Chinese
tourists $486
Hong Kong
Duty-Free Shops
Gi Shops
Electronics Stores
Taiwan
Convenience Stores
Pharmacies
Gi Shops
Japan
Pharmacies
Large-Scale DiscountRetail Stores
South Korea
Duty-Free Shops
Beauty Shops
Pharmacies
Thailand
Duty-Free Shops
Convenience Stores
Australia United States
Luxury Stores
Large-Scale DiscountRetail Stores
Europe
Department Stores
Department Stores
Luxury Stores
Breakdown of popular shopping loca ons in different countries or regions for Chinese tourists
Duty-Free Shops
Large Supermarkets
Top 10 most popular goods purchased by Chinese tourists while overseas
Bag & Suitcase
Duty-Free Shops
Large supermarkets
Department Stores
Convenience Stores
Luxury Stores
Large-Scale DiscountRetail Stores
Beauty Shops
Gi Shops
Pharmecies
Small- and medium-sized supermarkets
61%
47%
47%
32%
31%
31%
28%
28%
26%
21%
Popular shopping loca ons for Chinese tourists traveling overseas
Amounts spent on shopping by Chinese and non-Chinese tourists traveling overseas
Skin Care& Beauty Products Local special es Souvenirs Clothing,
Shoes & Hats Food
Pharmacy& Health Care
ProductsElectronicProducts Arts & Cra s
Watches& Jewelry
TOP1 TOP2 TOP3 TOP4 TOP5
TOP6 TOP7 TOP8 TOP9 TOP10
Chinese tourists $762 Non-Chinese
tourists $486
Hong Kong
Duty-Free Shops
Gi Shops
Electronics Stores
Taiwan
Convenience Stores
Pharmacies
Gi Shops
Japan
Pharmacies
Large-Scale Discount Retail Stores
South Korea
Duty-Free Shops
Beauty Shops
Pharmacies
Thailand
Duty-Free Shops
Convenience Stores
Australia United States
Luxury Stores
Large-Scale Discount Retail Stores
Europe
Department Stores
Department Stores
Luxury Stores
Breakdown of popular shopping loca ons in different countries or regions for Chinese tourists
Duty-Free Shops
Large Supermarkets
Top 10 most popular goods purchased by Chinese tourists while overseas
Bag & Suitcase
Duty-Free Shops
Large supermarkets
Department Stores
Convenience Stores
Luxury Stores
Large-Scale DiscountRetail Stores
Beauty Shops
Gi Shops
Pharmecies
Small- and medium-sized supermarkets
61%
47%
47%
32%
31%
31%
28%
28%
26%
21%
Popular shopping loca ons for Chinese tourists traveling overseas
Amounts spent on shopping by Chinese and non-Chinese tourists traveling overseas
Skin Care& Beauty Products Local special es Souvenirs Clothing,
Shoes & Hats Food
Pharmacy& Health Care
ProductsElectronicProducts Arts & Cra s
Watches& Jewelry
TOP1 TOP2 TOP3 TOP4 TOP5
TOP6 TOP7 TOP8 TOP9 TOP10
Chinese tourists $762 Non-Chinese
tourists $486
Hong Kong
Duty-Free Shops
Gi Shops
Electronics Stores
Taiwan
Convenience Stores
Pharmacies
Gi Shops
Japan
Pharmacies
Large-Scale DiscountRetail Stores
South Korea
Duty-Free Shops
Beauty Shops
Pharmacies
Thailand
Duty-Free Shops
Convenience Stores
Australia United States
Luxury Stores
Large-Scale DiscountRetail Stores
Europe
Department Stores
Department Stores
Luxury Stores
Breakdown of popular shopping loca ons in different countries or regions for Chinese tourists
Duty-Free Shops
Large Supermarkets
Top 10 most popular goods purchased by Chinese tourists while overseas
Bag & Suitcase
Source:Nielsen
Source:Nielsen
Source:Nielsen
POPULAR SHOPPING LOCATIONS FOR OUTBOUND CHINESE TOURISTS
AMOUNTS SPENT ON SHOPPING BY CHINESE AND NON-CHINESE TOURISTS
Chinese tourists choose different places to shop in different countries or regions. In Japan for example, the popularity of department stores and pharmacies is significantly higher than the average overseas destination. The proportion of Chinese tourists shopping in convenience stores and gift shops in Taiwan is comparatively higher, while in the United States, the proportion of Chinese tourists shopping at luxury stores and discount retail stores is higher than that of other overseas travel destinations.
16 Outbound Chinese Tourism and Consumption Trends
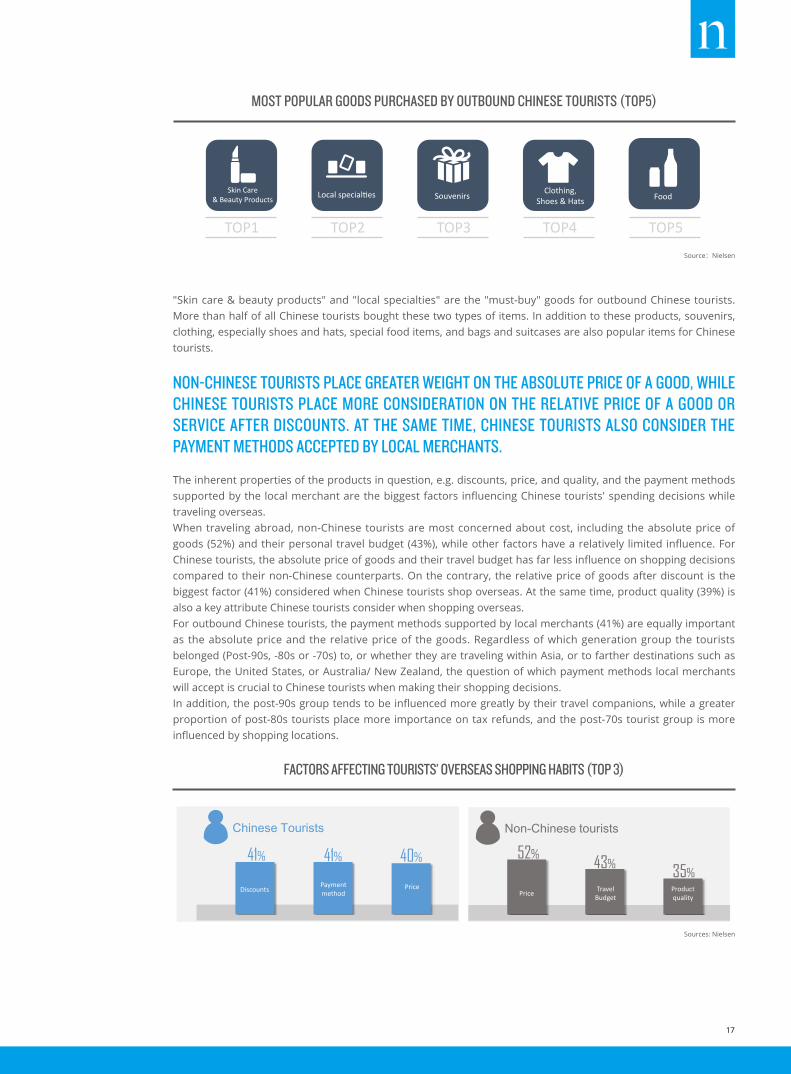
MOST POPULAR GOODS PURCHASED BY OUTBOUND CHINESE TOURISTS (TOP5)
"Skin care & beauty products" and "local specialties" are the "must-buy" goods for outbound Chinese tourists. More than half of all Chinese tourists bought these two types of items. In addition to these products, souvenirs, clothing, especially shoes and hats, special food items, and bags and suitcases are also popular items for Chinese tourists.
Duty-Free Shops
Large supermarkets
Department Stores
Convenience Stores
Luxury Stores
Large-Scale Discount Retail Stores
Beauty Shops
Gi Shops
Pharmecies
Small- and medium -sized supermarkets
61%
47%
47%
32%
31%
31%
28%
28%
26%
21%
Popular shopping loca ons for Chinese tourists traveling overseas
Amounts spent on shopping by Chinese and non-Chinese tourists traveling overseas
Skin Care & Beauty Products Local special es Souvenirs Clothing,
Shoes & Hats Food
Pharmacy & Health Care
Products Electronic Products Arts & Cra s
Watches & Jewelry
TOP1 TOP2 TOP3 TOP4 TOP5
TOP6 TOP7 TOP8 TOP9 TOP10
Chinese tourists $762 Non-Chinese
tourists $486
Hong Kong
Duty-Free Shops
Gi Shops
Electronics Stores
Taiwan
Convenience Stores
Pharmacies
Gi Shops
Japan
Pharmacies
Large-Scale Discount Retail Stores
South Korea
Duty-Free Shops
Beauty Shops
Pharmacies
Thailand
Duty-Free Shops
Convenience Stores
Australia United States
Luxury Stores
Large-Scale Discount Retail Stores
Europe
Department Stores
Department Stores
Luxury Stores
Breakdown of popular shopping loca ons in different countries or regions for Chinese tourists
Duty-Free Shops
Large Supermarkets
Top 10 most popular goods purchased by Chinese tourists while overseas
Bag & Suitcase
Source:Nielsen
NON-CHINESE TOURISTS PLACE GREATER WEIGHT ON THE ABSOLUTE PRICE OF A GOOD, WHILE CHINESE TOURISTS PLACE MORE CONSIDERATION ON THE RELATIVE PRICE OF A GOOD OR SERVICE AFTER DISCOUNTS. AT THE SAME TIME, CHINESE TOURISTS ALSO CONSIDER THE PAYMENT METHODS ACCEPTED BY LOCAL MERCHANTS.
The inherent properties of the products in question, e.g. discounts, price, and quality, and the payment methods supported by the local merchant are the biggest factors influencing Chinese tourists' spending decisions while traveling overseas.When traveling abroad, non-Chinese tourists are most concerned about cost, including the absolute price of goods (52%) and their personal travel budget (43%), while other factors have a relatively limited influence. For Chinese tourists, the absolute price of goods and their travel budget has far less influence on shopping decisions compared to their non-Chinese counterparts. On the contrary, the relative price of goods after discount is the biggest factor (41%) considered when Chinese tourists shop overseas. At the same time, product quality (39%) is also a key attribute Chinese tourists consider when shopping overseas.For outbound Chinese tourists, the payment methods supported by local merchants (41%) are equally important as the absolute price and the relative price of the goods. Regardless of which generation group the tourists belonged (Post-90s, -80s or -70s) to, or whether they are traveling within Asia, or to farther destinations such as Europe, the United States, or Australia/ New Zealand, the question of which payment methods local merchants will accept is crucial to Chinese tourists when making their shopping decisions. In addition, the post-90s group tends to be influenced more greatly by their travel companions, while a greater proportion of post-80s tourists place more importance on tax refunds, and the post-70s tourist group is more influenced by shopping locations.
FACTORS AFFECTING TOURISTS’ OVERSEAS SHOPPING HABITS (TOP 3)
( )
52% 43%
41%
39%
41%90 80 70
9080 70
52% 43% 35% Travel
Budget
41% 41% 40%
Discounts Payment method
Price
的 外国游客境外游购物 的 中国游客, 后的 中国游客的
更 ; 游国 地 支 的消费支 , 是中国游客境外 游购物 的
Non-Chinese tourists
Chinese Tourists
Sources: Nielsen
Top three factors affecting tourists’ overseas shopping
Discount/ Special Offers
Supported Payment Methods
Price
Product Quality
Shopping Location
Travel Budget
Merchant’s Hospitality
Tax Refunds
Exchange Rates
Suggestion/ Behavior of Traveling Companions
Factors affecting Chinese tourists’ overseas shopping decisions
41%
41%
40%
39%
33%
29%
27%
25%
20%
19%
Sources: Nielsen
Post-90s:22%
Post-70s:35%
Post-80s:27%
Price Product quality
Sources: Nielsen
17
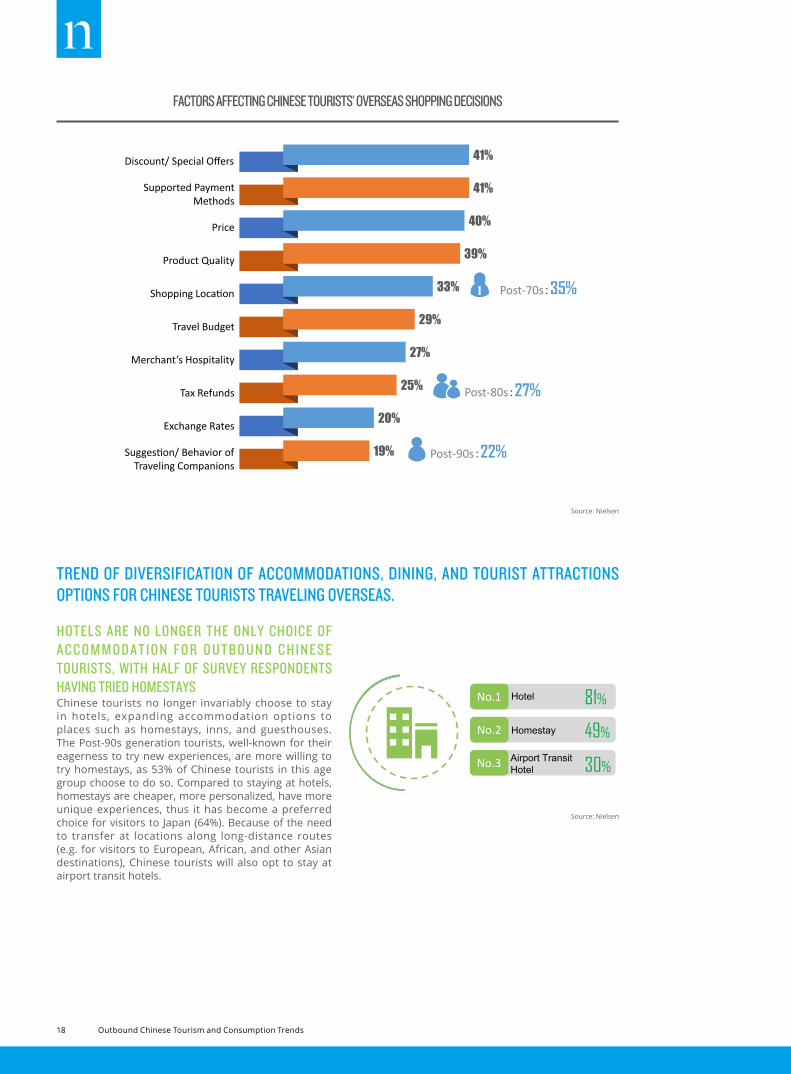
TREND OF DIVERSIFICATION OF ACCOMMODATIONS, DINING, AND TOURIST ATTRACTIONS OPTIONS FOR CHINESE TOURISTS TRAVELING OVERSEAS.
HOTELS ARE NO LONGER THE ONLY CHOICE OF A C C O M M O D A T I O N F O R O U T B O U N D C H I N E S E TOURISTS, WITH HALF OF SURVEY RESPONDENTS HAVING TRIED HOMESTAYSChinese tourists no longer invariably choose to stay in hotels, expanding accommodation options to places such as homestays, inns, and guesthouses. The Post-90s generation tourists, well-known for their eagerness to try new experiences, are more willing to try homestays, as 53% of Chinese tourists in this age group choose to do so. Compared to staying at hotels, homestays are cheaper, more personalized, have more unique experiences, thus it has become a preferred choice for visitors to Japan (64%). Because of the need to transfer at locations along long-distance routes (e.g. for visitors to European, African, and other Asian destinations), Chinese tourists will also opt to stay at airport transit hotels.
中国游客境外旅行的 、 、 消费 元 势
No.1 Hotel
No.2 Homestay
No.3 Airport Transit Hotel
81%
49%
30%
No.1 Public Transportation
No.2 Taxi
No.3 Car Rental
71%
71%
34%
No.1 Restaurant
No.2 Roadside Snacks
No.3 Fast Food Restaurant
80%
60%
55%
No.4 Café
No.5 Dessert Shop
49%
48% No.1 Dining
No.2 Shopping
No.3 Admission Tickets
75%
68%
66%
No.4 Recreation
No.5 Short-distance Transportation
58%
51%
不 是中国游客境外旅行 的 一 ,游客 民
, 、 、 。90 ,
53%。 , 、
、 ,(64%)。 ,长线
( 、 )。
交通是中国游客最 的境外旅游出行方 。
,高,达80%的地, (81%)
, (44%)。 ,高收入(月收入15,000元以上)的中
(月收入4,000-8,000元)的1.7倍。
的 地特 受中国境外旅游者
。在泰国,(84%) ,
(55%)。
,普通收入(月收入15,000 ), 、 、 、 、
“ ” 15,000以上的。
境外游的 额外消费比门
99%费, ( 76%)、购物(69%) ,
(64%),
59%和51%。
境外旅游的 育消费同 升
,86%的中
、、 、SPA 、
。
No.1 Exhibitions/Performances
No.2 Bars
No.3
47%
46%
34%
No.4 Concerts/Musicals
No.5 Sporting Events
30%
22%
SPAs/Massages
Source: Nielsen
( )
52% 43%
41%
39%
41%90 80 70
9080 70
52% 43% 35% Travel
Budget
41% 41% 40%
Discounts Payment method
Price
的 外国游客境外游购物 的 中国游客, 后的 中国游客的
更 ; 游国 地 支 的消费支 , 是中国游客境外 游购物 的
Non-Chinese tourists
Chinese Tourists
Sources: Nielsen
Top three factors affecting tourists’ overseas shopping
Discount/ Special Offers
Supported Payment Methods
Price
Product Quality
Shopping Location
Travel Budget
Merchant’s Hospitality
Tax Refunds
Exchange Rates
Suggestion/ Behavior of Traveling Companions
Factors affecting Chinese tourists’ overseas shopping decisions
41%
41%
40%
39%
33%
29%
27%
25%
20%
19%
Sources: Nielsen
Post-90s:22%
Post-70s:35%
Post-80s:27%
Price Product quality
FACTORS AFFECTING CHINESE TOURISTS’ OVERSEAS SHOPPING DECISIONS
Source: Nielsen
18 Outbound Chinese Tourism and Consumption Trends
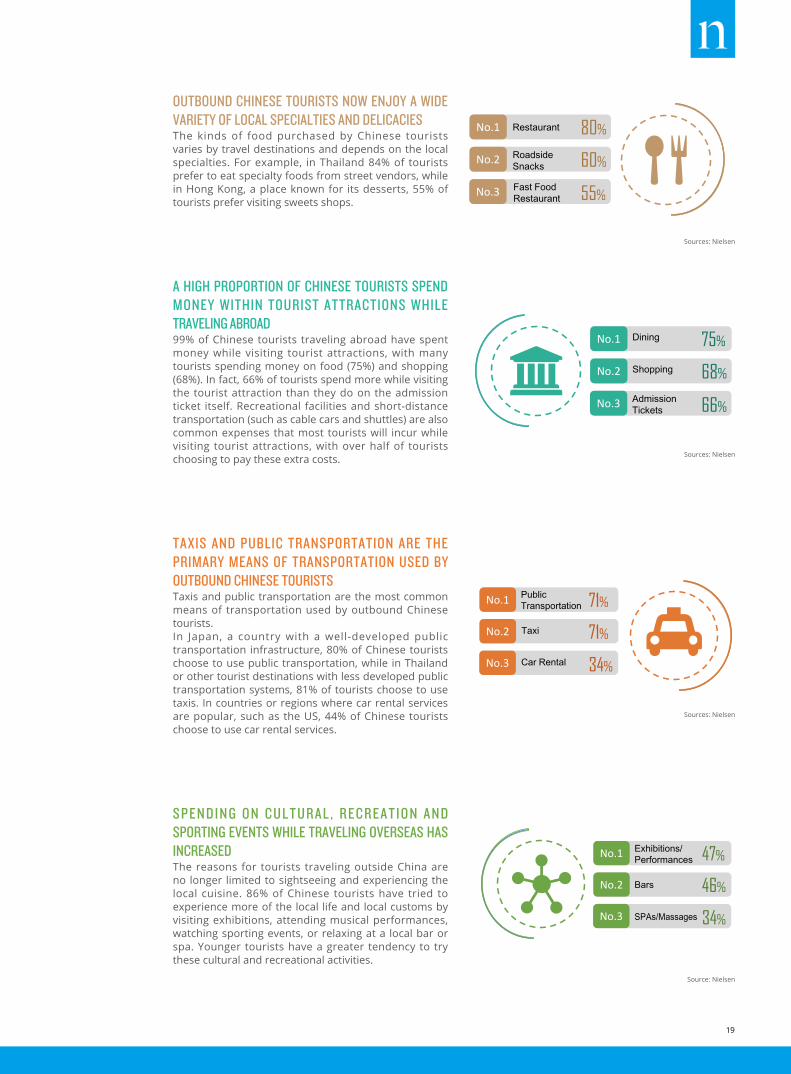
OUTBOUND CHINESE TOURISTS NOW ENJOY A WIDE VARIETY OF LOCAL SPECIALTIES AND DELICACIESThe kinds of food purchased by Chinese tourists varies by travel destinations and depends on the local specialties. For example, in Thailand 84% of tourists prefer to eat specialty foods from street vendors, while in Hong Kong, a place known for its desserts, 55% of tourists prefer visiting sweets shops.
A HIGH PROPORTION OF CHINESE TOURISTS SPEND MONEY WITHIN TOURIST ATTRACTIONS WHILE TRAVELING ABROAD99% of Chinese tourists traveling abroad have spent money while visiting tourist attractions, with many tourists spending money on food (75%) and shopping (68%). In fact, 66% of tourists spend more while visiting the tourist attraction than they do on the admission ticket itself. Recreational facilities and short-distance transportation (such as cable cars and shuttles) are also common expenses that most tourists will incur while visiting tourist attractions, with over half of tourists choosing to pay these extra costs.
TAXIS AND PUBLIC TRANSPORTATION ARE THE PRIMARY MEANS OF TRANSPORTATION USED BY OUTBOUND CHINESE TOURISTSTaxis and public transportation are the most common means of transportation used by outbound Chinese tourists.In Japan, a country with a well-developed public transportation infrastructure, 80% of Chinese tourists choose to use public transportation, while in Thailand or other tourist destinations with less developed public transportation systems, 81% of tourists choose to use taxis. In countries or regions where car rental services are popular, such as the US, 44% of Chinese tourists choose to use car rental services.
S P E N D I N G O N C U L T U R A L , R E C R E A T I O N A N D SPORTING EVENTS WHILE TRAVELING OVERSEAS HAS INCREASEDThe reasons for tourists traveling outside China are no longer limited to sightseeing and experiencing the local cuisine. 86% of Chinese tourists have tried to experience more of the local life and local customs by visiting exhibitions, attending musical performances, watching sporting events, or relaxing at a local bar or spa. Younger tourists have a greater tendency to try these cultural and recreational activities.
中国游客境外旅行的 、 、 消费 元 势
No.1 Hotel
No.2 Homestay
No.3 Airport Transit Hotel
81%
49%
30%
No.1 Public Transportation
No.2 Taxi
No.3 Car Rental
71%
71%
34%
No.1 Restaurant
No.2 Roadside Snacks
No.3 Fast Food Restaurant
80%
60%
55%
No.4 Café
No.5 Dessert Shop
49%
48% No.1 Dining
No.2 Shopping
No.3 Admission Tickets
75%
68%
66%
No.4 Recreation
No.5 Short-distance Transportation
58%
51%
不 是中国游客境外旅行 的 一 ,游客 民
, 、 、 。90 ,
53%。 , 、
、 ,(64%)。 ,长线
( 、 )。
交通是中国游客最 的境外旅游出行方 。
,高,达80%的地, (81%)
, (44%)。 ,高收入(月收入15,000元以上)的中
(月收入4,000-8,000元)的1.7倍。
的 地特 受中国境外旅游者
。在泰国,(84%) ,
(55%)。
,普通收入(月收入15,000 ), 、 、 、 、
“ ” 15,000以上的。
境外游的 额外消费比门
99%费, ( 76%)、购物(69%) ,
(64%),
59%和51%。
境外旅游的 育消费同 升
,86%的中
、、 、SPA 、
。
No.1 Exhibitions/Performances
No.2 Bars
No.3
47%
46%
34%
No.4 Concerts/Musicals
No.5 Sporting Events
30%
22%
SPAs/Massages
Source: Nielsen
Sources: Nielsen
Sources: Nielsen
Sources: Nielsen
中国游客境外旅行的 、 、 消费 元 势
No.1 Hotel
No.2 Homestay
No.3 Airport Transit Hotel
81%
49%
30%
No.1 Public Transportation
No.2 Taxi
No.3 Car Rental
71%
71%
34%
No.1 Restaurant
No.2 Roadside Snacks
No.3 Fast Food Restaurant
80%
60%
55%
No.4 Café
No.5 Dessert Shop
49%
48% No.1 Dining
No.2 Shopping
No.3 Admission Tickets
75%
68%
66%
No.4 Recreation
No.5 Short-distance Transportation
58%
51%
不 是中国游客境外旅行 的 一 ,游客 民
, 、 、 。90 ,
53%。 , 、
、 ,(64%)。 ,长线
( 、 )。
交通是中国游客最 的境外旅游出行方 。
,高,达80%的地, (81%)
, (44%)。 ,高收入(月收入15,000元以上)的中
(月收入4,000-8,000元)的1.7倍。
的 地特 受中国境外旅游者
。在泰国,(84%) ,
(55%)。
,普通收入(月收入15,000 ), 、 、 、 、
“ ” 15,000以上的。
境外游的 额外消费比门
99%费, ( 76%)、购物(69%) ,
(64%),
59%和51%。
境外旅游的 育消费同 升
,86%的中
、、 、SPA 、
。
No.1 Exhibitions/Performances
No.2 Bars
No.3
47%
46%
34%
No.4 Concerts/Musicals
No.5 Sporting Events
30%
22%
SPAs/Massages
19
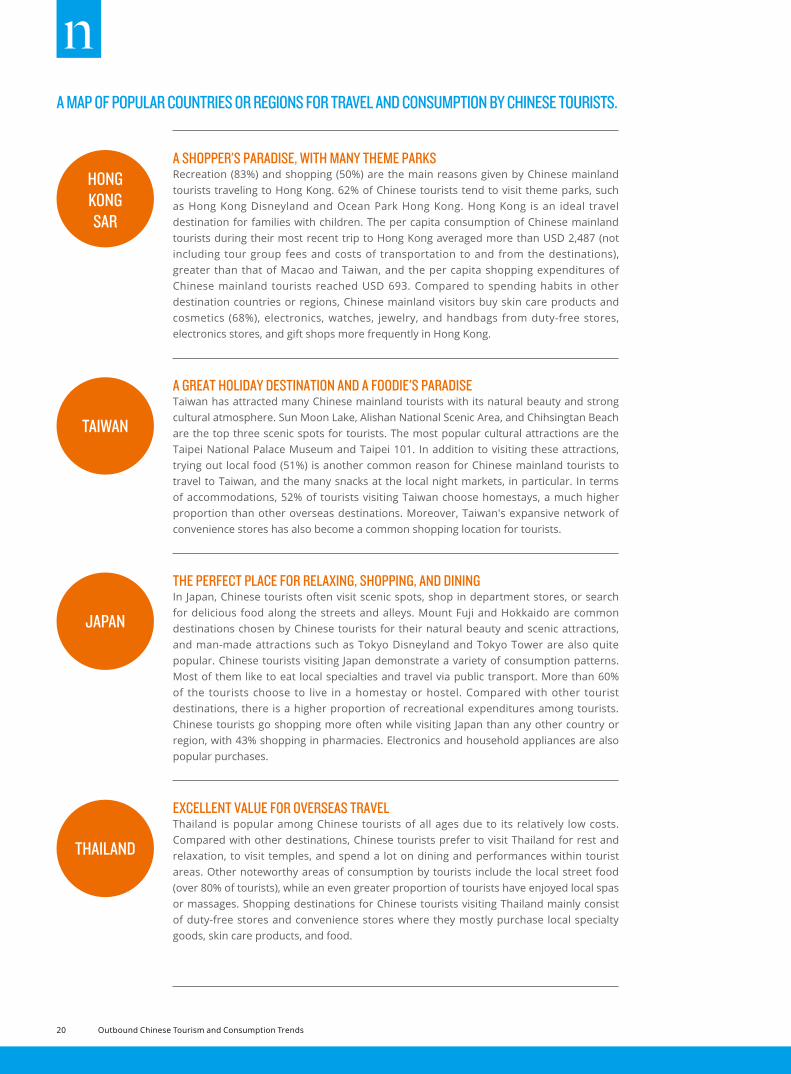
JAPAN
HONGKONGSAR
A MAP OF POPULAR COUNTRIES OR REGIONS FOR TRAVEL AND CONSUMPTION BY CHINESE TOURISTS.
A SHOPPER’S PARADISE, WITH MANY THEME PARKSRecreation (83%) and shopping (50%) are the main reasons given by Chinese mainland tourists traveling to Hong Kong. 62% of Chinese tourists tend to visit theme parks, such as Hong Kong Disneyland and Ocean Park Hong Kong. Hong Kong is an ideal travel destination for families with children. The per capita consumption of Chinese mainland tourists during their most recent trip to Hong Kong averaged more than USD 2,487 (not including tour group fees and costs of transportation to and from the destinations), greater than that of Macao and Taiwan, and the per capita shopping expenditures of Chinese mainland tourists reached USD 693. Compared to spending habits in other destination countries or regions, Chinese mainland visitors buy skin care products and cosmetics (68%), electronics, watches, jewelry, and handbags from duty-free stores, electronics stores, and gift shops more frequently in Hong Kong.
A GREAT HOLIDAY DESTINATION AND A FOODIE'S PARADISETaiwan has attracted many Chinese mainland tourists with its natural beauty and strong cultural atmosphere. Sun Moon Lake, Alishan National Scenic Area, and Chihsingtan Beach are the top three scenic spots for tourists. The most popular cultural attractions are the Taipei National Palace Museum and Taipei 101. In addition to visiting these attractions, trying out local food (51%) is another common reason for Chinese mainland tourists to travel to Taiwan, and the many snacks at the local night markets, in particular. In terms of accommodations, 52% of tourists visiting Taiwan choose homestays, a much higher proportion than other overseas destinations. Moreover, Taiwan's expansive network of convenience stores has also become a common shopping location for tourists.
THE PERFECT PLACE FOR RELAXING, SHOPPING, AND DININGIn Japan, Chinese tourists often visit scenic spots, shop in department stores, or search for delicious food along the streets and alleys. Mount Fuji and Hokkaido are common destinations chosen by Chinese tourists for their natural beauty and scenic attractions, and man-made attractions such as Tokyo Disneyland and Tokyo Tower are also quite popular. Chinese tourists visiting Japan demonstrate a variety of consumption patterns. Most of them like to eat local specialties and travel via public transport. More than 60% of the tourists choose to live in a homestay or hostel. Compared with other tourist destinations, there is a higher proportion of recreational expenditures among tourists. Chinese tourists go shopping more often while visiting Japan than any other country or region, with 43% shopping in pharmacies. Electronics and household appliances are also popular purchases.
EXCELLENT VALUE FOR OVERSEAS TRAVELThailand is popular among Chinese tourists of all ages due to its relatively low costs. Compared with other destinations, Chinese tourists prefer to visit Thailand for rest and relaxation, to visit temples, and spend a lot on dining and performances within tourist areas. Other noteworthy areas of consumption by tourists include the local street food (over 80% of tourists), while an even greater proportion of tourists have enjoyed local spas or massages. Shopping destinations for Chinese tourists visiting Thailand mainly consist of duty-free stores and convenience stores where they mostly purchase local specialty goods, skin care products, and food.
THAILAND
TAIWAN
20 Outbound Chinese Tourism and Consumption Trends
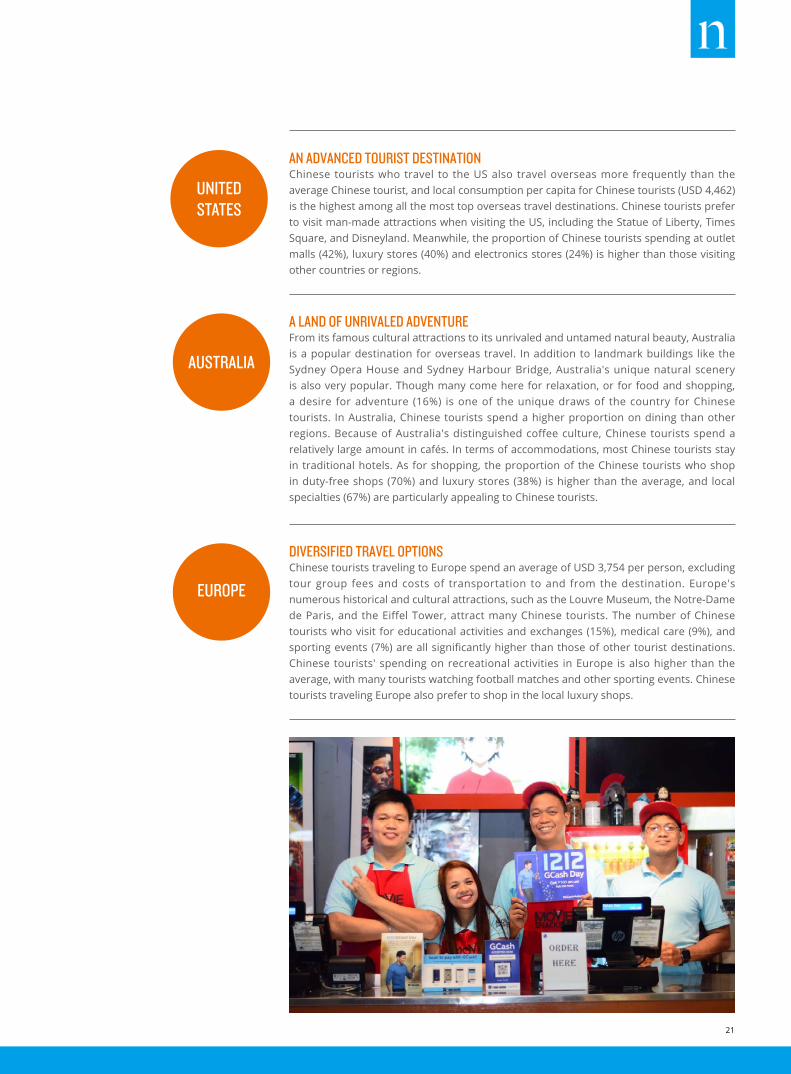
AN ADVANCED TOURIST DESTINATIONChinese tourists who travel to the US also travel overseas more frequently than the average Chinese tourist, and local consumption per capita for Chinese tourists (USD 4,462) is the highest among all the most top overseas travel destinations. Chinese tourists prefer to visit man-made attractions when visiting the US, including the Statue of Liberty, Times Square, and Disneyland. Meanwhile, the proportion of Chinese tourists spending at outlet malls (42%), luxury stores (40%) and electronics stores (24%) is higher than those visiting other countries or regions.
A LAND OF UNRIVALED ADVENTUREFrom its famous cultural attractions to its unrivaled and untamed natural beauty, Australia is a popular destination for overseas travel. In addition to landmark buildings like the Sydney Opera House and Sydney Harbour Bridge, Australia's unique natural scenery is also very popular. Though many come here for relaxation, or for food and shopping, a desire for adventure (16%) is one of the unique draws of the country for Chinese tourists. In Australia, Chinese tourists spend a higher proportion on dining than other regions. Because of Australia's distinguished coffee culture, Chinese tourists spend a relatively large amount in cafés. In terms of accommodations, most Chinese tourists stay in traditional hotels. As for shopping, the proportion of the Chinese tourists who shop in duty-free shops (70%) and luxury stores (38%) is higher than the average, and local specialties (67%) are particularly appealing to Chinese tourists.
DIVERSIFIED TRAVEL OPTIONSChinese tourists traveling to Europe spend an average of USD 3,754 per person, excluding tour group fees and costs of transportation to and from the destination. Europe's numerous historical and cultural attractions, such as the Louvre Museum, the Notre-Dame de Paris, and the Eiffel Tower, attract many Chinese tourists. The number of Chinese tourists who visit for educational activities and exchanges (15%), medical care (9%), and sporting events (7%) are all significantly higher than those of other tourist destinations. Chinese tourists' spending on recreational activities in Europe is also higher than the average, with many tourists watching football matches and other sporting events. Chinese tourists traveling Europe also prefer to shop in the local luxury shops.
EUROPE
AUSTRALIA
UNITEDSTATES
21
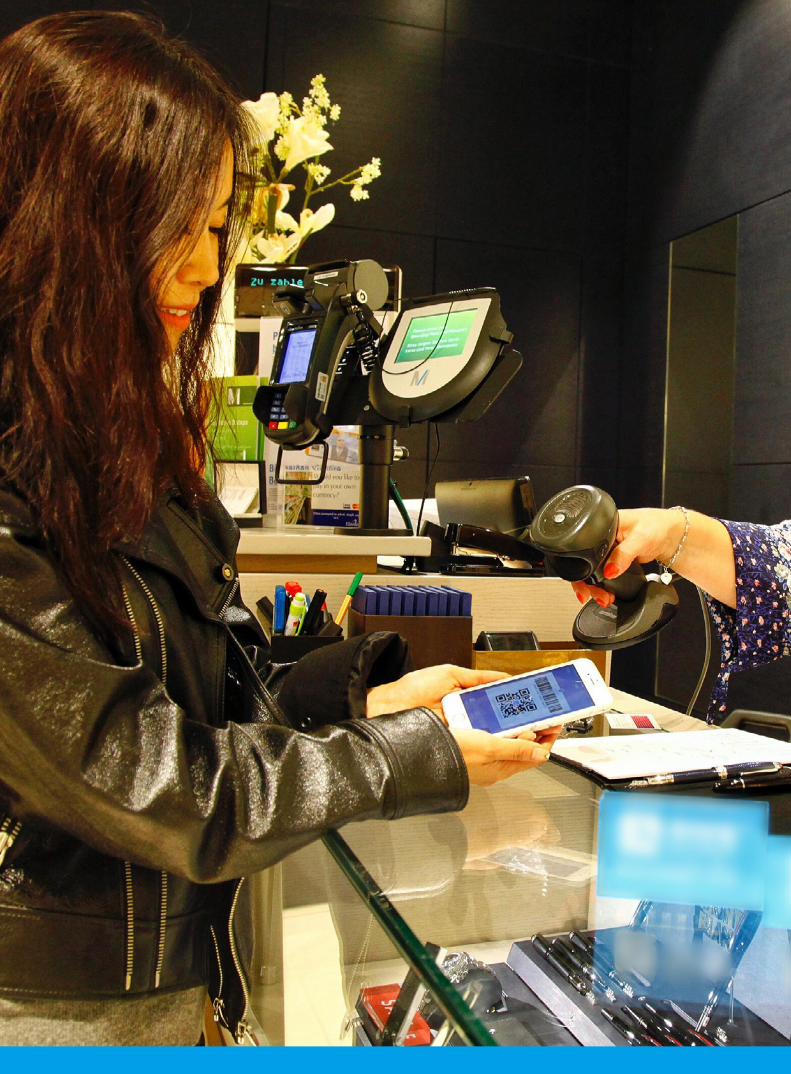
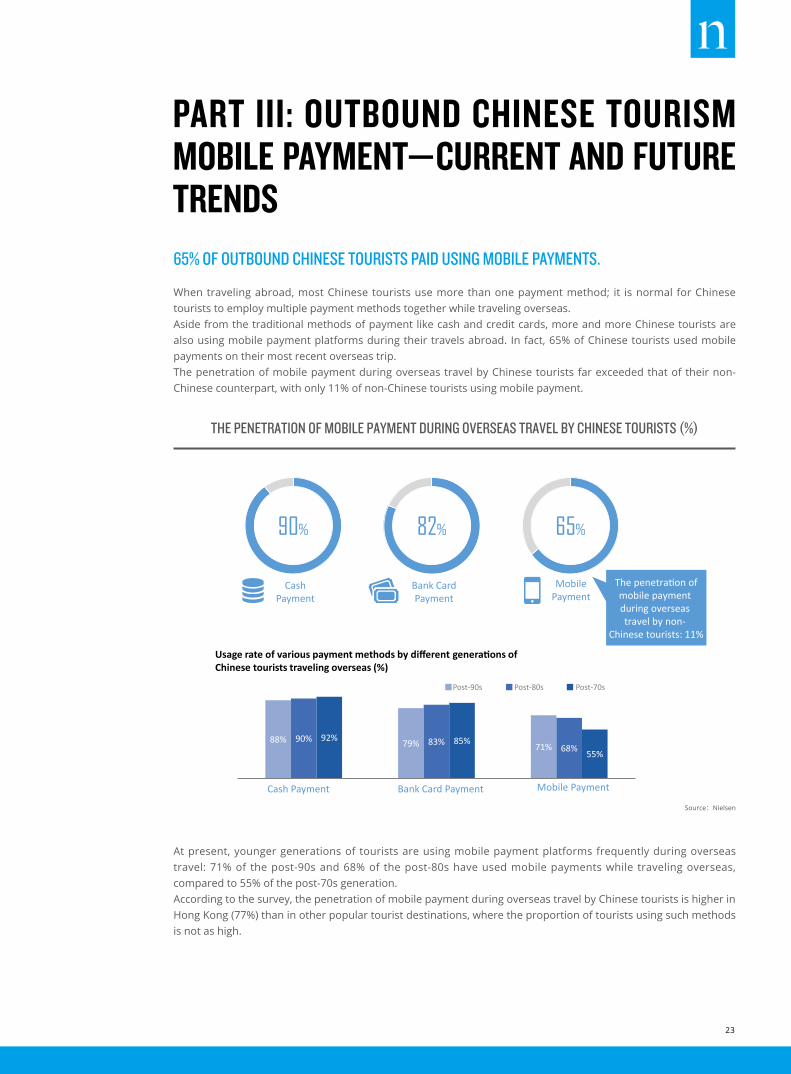
When traveling abroad, most Chinese tourists use more than one payment method; it is normal for Chinese tourists to employ multiple payment methods together while traveling overseas. Aside from the traditional methods of payment like cash and credit cards, more and more Chinese tourists are also using mobile payment platforms during their travels abroad. In fact, 65% of Chinese tourists used mobile payments on their most recent overseas trip.The penetration of mobile payment during overseas travel by Chinese tourists far exceeded that of their non-Chinese counterpart, with only 11% of non-Chinese tourists using mobile payment.
At present, younger generations of tourists are using mobile payment platforms frequently during overseas travel: 71% of the post-90s and 68% of the post-80s have used mobile payments while traveling overseas, compared to 55% of the post-70s generation.According to the survey, the penetration of mobile payment during overseas travel by Chinese tourists is higher in Hong Kong (77%) than in other popular tourist destinations, where the proportion of tourists using such methods is not as high.
PART III: OUTBOUND CHINESE TOURISM MOBILE PAYMENT—CURRENT AND FUTURE TRENDS65% OF OUTBOUND CHINESE TOURISTS PAID USING MOBILE PAYMENTS.
, 。1 , 1% ( ) , 1%
( ) 。, , 。 1
的境外旅游中 65%, 10% 。
——71%的90 68%的80 , 7055% 70 。
, , : 70% ( 2 )( 1 )的49% 。
, (77%), (50%),。
:方 、
, 。, ,
。 ,,
, “”。
90% 82% 65%
Usage rate of various payment methods by Chinese tourists traveling overseas (%)
Cash Payment
Bank Card Payment
Mobile Payment
88% 79% 71% 90% 83%
68% 92% 85%
55%
Post-90s Post-80s Post-70s
Cash Payment Bank Card Payment Mobile Payment
The penetration of mobile payment during overseas travel by non-
Chinese tourists: 11%
Usage rate of various payment methods by different generations of Chinese tourists traveling overseas (%)
Sources: Nielsen
THE PENETRATION OF MOBILE PAYMENT DURING OVERSEAS TRAVEL BY CHINESE TOURISTS (%)
Source:Nielsen
23
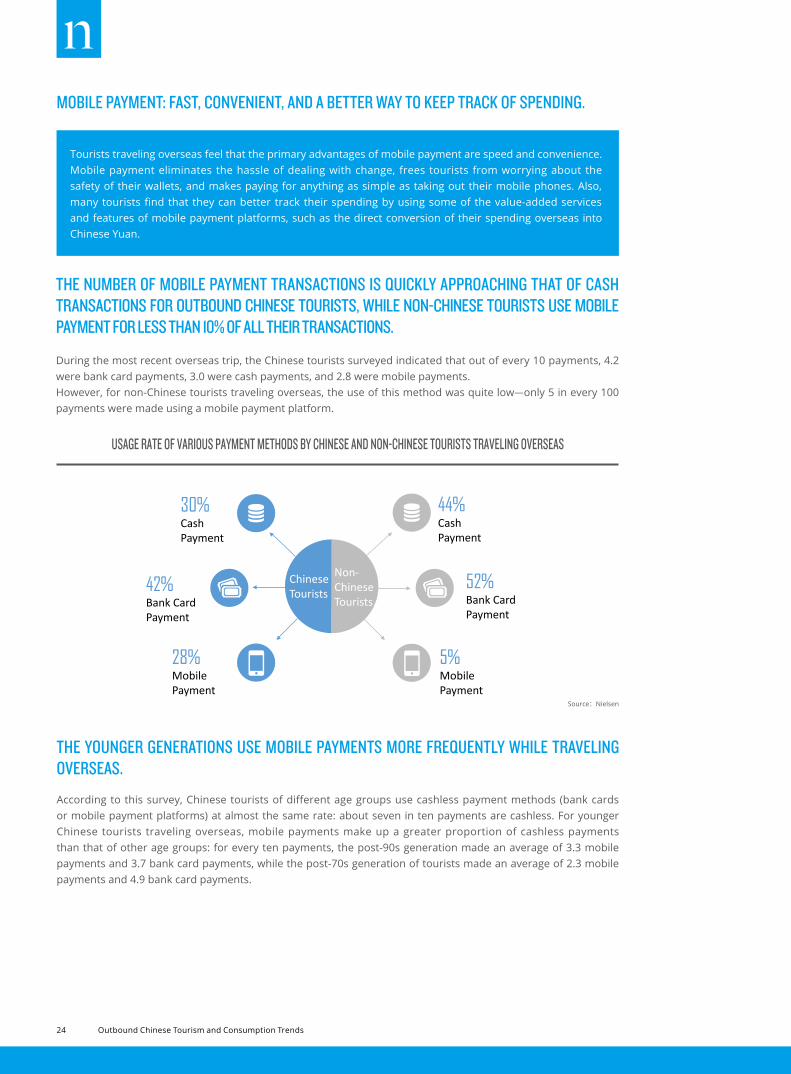
THE NUMBER OF MOBILE PAYMENT TRANSACTIONS IS QUICKLY APPROACHING THAT OF CASH TRANSACTIONS FOR OUTBOUND CHINESE TOURISTS, WHILE NON-CHINESE TOURISTS USE MOBILE PAYMENT FOR LESS THAN 10% OF ALL THEIR TRANSACTIONS.
THE YOUNGER GENERATIONS USE MOBILE PAYMENTS MORE FREQUENTLY WHILE TRAVELING OVERSEAS.
During the most recent overseas trip, the Chinese tourists surveyed indicated that out of every 10 payments, 4.2 were bank card payments, 3.0 were cash payments, and 2.8 were mobile payments.However, for non-Chinese tourists traveling overseas, the use of this method was quite low—only 5 in every 100 payments were made using a mobile payment platform.
USAGE RATE OF VARIOUS PAYMENT METHODS BY CHINESE AND NON-CHINESE TOURISTS TRAVELING OVERSEAS
According to this survey, Chinese tourists of different age groups use cashless payment methods (bank cards or mobile payment platforms) at almost the same rate: about seven in ten payments are cashless. For younger Chinese tourists traveling overseas, mobile payments make up a greater proportion of cashless payments than that of other age groups: for every ten payments, the post-90s generation made an average of 3.3 mobile payments and 3.7 bank card payments, while the post-70s generation of tourists made an average of 2.3 mobile payments and 4.9 bank card payments.
Source:Nielsen
中国游客境外旅游时,移动支付方式的使用次数接近现金支付的使用次数
中国游客的境外移动支付次数比例接近现金支付次数比例;而外国游客使用移动支付次数比例不足1成在中国游客最近1次的境外旅行中,就单人消费使用各类支付方式的次数而言,每100次消费支付过程,有42次为银
行卡支付、30次为现金支付、28次为移动支付。对外国境外旅游者来说,移动支付的使用次数显得微不足道,100次消费支付中仅4次是通过移动支付的方式实现。
年轻一代境外游更高频使用移动支付增益其无现金消费
调查显示,不同年龄段的中国游客,使用无现金支付消费(即用银行卡或移动支付)的次数基本相同:每10次消费支付过程中约7次为无现金支付。然而对更年轻的中国境外旅行者来说,移动支付对其无现金消费的增益性更为突显:每10次消费支付,90后平均使用3.3次移动支付,3.7次银行卡支付;70后平均使用2.3次移动支付,4.9次银行卡支付。
中国游客在不同热门境外旅游国家或地区中,对各类支付方式的使用次数比例围绕均值略有浮动。在泰国,受当地丰富的旅游娱乐项目及结算习惯影响,中国游客使用现金消费的次数比例更高;在更接近国内支付环境的香港和新加坡,中国游客用移动支付的次数比例相对更高;而发达国家或地区,如美国、澳大利亚、日本、韩国和台湾,信用卡结算习惯和环境更为成熟,中国游客使用银行卡支付的次数比例相对更高。
Average times of usage of each payment method for Chinese touristsof various age demographics in their last trip
Cash Payment
Bank Card Payment
Mobile Payment
30%
30%
28%
37%
41%
49%
33%
28%
23%
Post-90s
Post-80s
Post-70s
Usage rate of various payment methods by Chinese and non-Chinese tourists traveling overseas (%)
Chinese Tourists
30% Cash Payment
42% Bank Card Payment
28% Mobile Payment
44% Cash Payment
52% Bank Card Payment
5% Mobile Payment
Sources: Nielsen
Sources: Nielsen
Non-Chinese Tourists
Tourists traveling overseas feel that the primary advantages of mobile payment are speed and convenience. Mobile payment eliminates the hassle of dealing with change, frees tourists from worrying about the safety of their wallets, and makes paying for anything as simple as taking out their mobile phones. Also, many tourists find that they can better track their spending by using some of the value-added services and features of mobile payment platforms, such as the direct conversion of their spending overseas into Chinese Yuan.
MOBILE PAYMENT: FAST, CONVENIENT, AND A BETTER WAY TO KEEP TRACK OF SPENDING.
24 Outbound Chinese Tourism and Consumption Trends
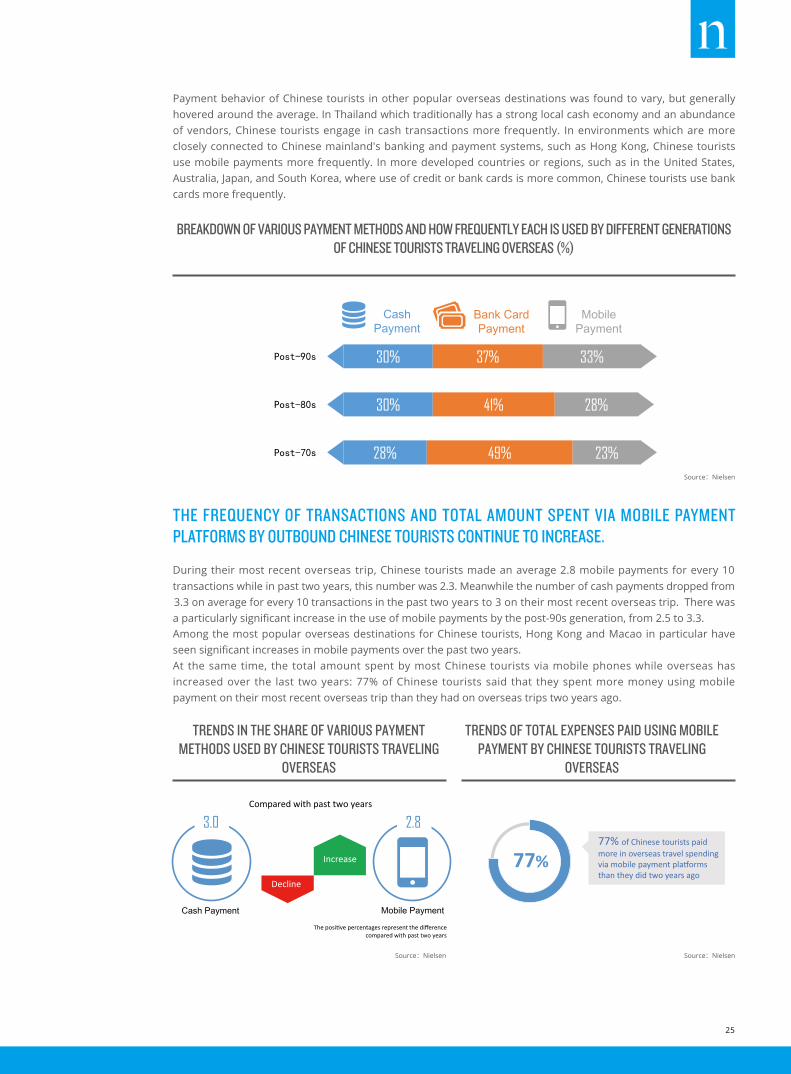
THE FREQUENCY OF TRANSACTIONS AND TOTAL AMOUNT SPENT VIA MOBILE PAYMENT PLATFORMS BY OUTBOUND CHINESE TOURISTS CONTINUE TO INCREASE.
TRENDS IN THE SHARE OF VARIOUS PAYMENT METHODS USED BY CHINESE TOURISTS TRAVELING
OVERSEAS
TRENDS OF TOTAL EXPENSES PAID USING MOBILE PAYMENT BY CHINESE TOURISTS TRAVELING
OVERSEAS
BREAKDOWN OF VARIOUS PAYMENT METHODS AND HOW FREQUENTLY EACH IS USED BY DIFFERENT GENERATIONS OF CHINESE TOURISTS TRAVELING OVERSEAS (%)
During their most recent overseas trip, Chinese tourists made very 10 an average 2.8 mobile payments for etransactions while in past two years, this number was 2.3. Meanwhile the number of cash payments dropped from 3.3 on average for every 10 transactions in the past two years to 3 on their most recent overseas trip. There was a particularly significant increase in the use of mobile payments by the post-90s generation, from 2.5 to 3.3.Among the most popular overseas destinations for Chinese tourists, Hong Kong and Macao in particular have seen significant increases in mobile payments over the past two years.At the same time, the total amount spent by most Chinese tourists via mobile phones while overseas has increased over the last two years: 77% of Chinese tourists said that they spent more money using mobile payment on their most recent overseas trip than they had on overseas trips two years ago.
Source:Nielsen Source:Nielsen
Source:Nielsen
中国游客境外旅游时,移动支付方式的使用次数接近现金支付的使用次数
中国游客的境外移动支付次数比例接近现金支付次数比例;而外国游客使用移动支付次数比例不足1成在中国游客最近1次的境外旅行中,就单人消费使用各类支付方式的次数而言,每100次消费支付过程,有42次为银
行卡支付、30次为现金支付、28次为移动支付。对外国境外旅游者来说,移动支付的使用次数显得微不足道,100次消费支付中仅4次是通过移动支付的方式实现。
年轻一代境外游更高频使用移动支付增益其无现金消费
调查显示,不同年龄段的中国游客,使用无现金支付消费(即用银行卡或移动支付)的次数基本相同:每10次消费支付过程中约7次为无现金支付。然而对更年轻的中国境外旅行者来说,移动支付对其无现金消费的增益性更为突显:每10次消费支付,90后平均使用3.3次移动支付,3.7次银行卡支付;70后平均使用2.3次移动支付,4.9次银行卡支付。
中国游客在不同热门境外旅游国家或地区中,对各类支付方式的使用次数比例围绕均值略有浮动。在泰国,受当地丰富的旅游娱乐项目及结算习惯影响,中国游客使用现金消费的次数比例更高;在更接近国内支付环境的香港和新加坡,中国游客用移动支付的次数比例相对更高;而发达国家或地区,如美国、澳大利亚、日本、韩国和台湾,信用卡结算习惯和环境更为成熟,中国游客使用银行卡支付的次数比例相对更高。
Average times of usage of each payment method for Chinese touristsof various age demographics in their last trip
Cash Payment
Bank Card Payment
Mobile Payment
30%
30%
28%
37%
41%
49%
33%
28%
23%
Post-90s
Post-80s
Post-70s
Usage rate of various payment methods by Chinese and non-Chinese tourists traveling overseas (%)
Chinese Tourists
30%Cash Payment
42%Bank Card Payment
28%Mobile Payment
44%Cash Payment
52%Bank Card Payment
5%Mobile Payment
Sources: Nielsen
Sources: Nielsen
Non-Chinese Tourists
中国游客境外使用移动支付消费的次数比例与金额持续提升
在最近1次的境外旅游中,中国游客每10次消费支付中,有2.8次为移动支付;在此之前的过去2年内,该次数值为2.3次。其中,90后与高收入人群境外旅游的移动支付使用次数比例提升幅度更为明显:90后人群从2.5次增加到3.3次,月收入
15k以上人群从2.5次提升至3.4次。而在中国游客热门境外旅游国家或地区中,香港和澳门近2年内游客使用移动支付的次数比例增幅较为突出。
Trends in the share of various payment methodsused by Chinese tourists traveling overseas (%)
Trends of total expenses paid using mobile payment pla orms by Chinese tourists traveling overseas
77% of Chinese tourists paidmore in overseas travel spendingvia mobile payment pla ormsthan they did two years ago
77%
Cash Payment Mobile Payment
+ 5%
The posi ve percentages represent the difference compared with past two years
3.0 2.8
Decline
Increase
Compared with past two years
中国游客境外使用移动支付消费的次数比例与金额持续提升
在最近1次的境外旅游中,中国游客每10次消费支付中,有2.8次为移动支付;在此之前的过去2年内,该次数值为2.3次。其中,90后与高收入人群境外旅游的移动支付使用次数比例提升幅度更为明显:90后人群从2.5次增加到3.3次,月收入
15k以上人群从2.5次提升至3.4次。而在中国游客热门境外旅游国家或地区中,香港和澳门近2年内游客使用移动支付的次数比例增幅较为突出。
Trends in the share of various payment methodsused by Chinese tourists traveling overseas (%)
Trends of total expenses paid using mobile payment pla orms by Chinese tourists traveling overseas
77% of Chinese tourists paidmore in overseas travel spending via mobile payment pla orms than they did two years ago
77%
Cash Payment Mobile Payment
+ 5%
The posi ve percentages represent the differencecompared with past two years
30% 28%
Decline
Increase
Compared with past two years
Payment behavior of Chinese tourists in other popular overseas destinations was found to vary, but generally hovered around the average. In Thailand which traditionally has a strong local cash economy and an abundanceof vendors, Chinese tourists engage in cash transactions more frequently. In environments which are more closely connected to Chinese mainland's banking and payment systems, such as Hong Kong, Chinese tourists use mobile payments more frequently. In more developed countries or regions, such as in the United States, Australia, Japan, and South Korea, where use of credit or bank cards is more common, Chinese tourists use bank cards more frequently.
25
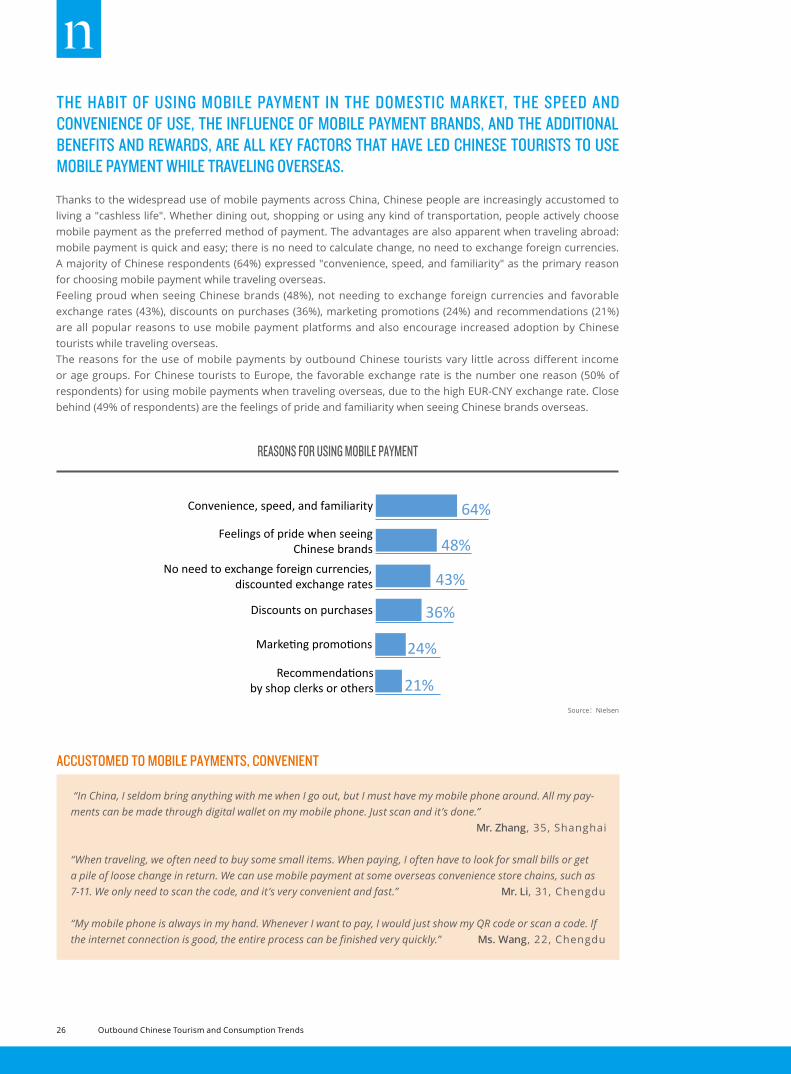
Thanks to the widespread use of mobile payments across China, Chinese people are increasingly accustomed to living a "cashless life". Whether dining out, shopping or using any kind of transportation, people actively choose mobile payment as the preferred method of payment. The advantages are also apparent when traveling abroad: mobile payment is quick and easy; there is no need to calculate change, no need to exchange foreign currencies. A majority of Chinese respondents (64%) expressed "convenience, speed, and familiarity" as the primary reason for choosing mobile payment while traveling overseas.Feeling proud when seeing Chinese brands (48%), not needing to exchange foreign currencies and favorable exchange rates (43%), discounts on purchases (36%), marketing promotions (24%) and recommendations (21%) are all popular reasons to use mobile payment platforms and also encourage increased adoption by Chinese tourists while traveling overseas.The reasons for the use of mobile payments by outbound Chinese tourists vary little across different income or age groups. For Chinese tourists to Europe, the favorable exchange rate is the number one reason (50% of respondents) for using mobile payments when traveling overseas, due to the high EUR-CNY exchange rate. Close behind (49% of respondents) are the feelings of pride and familiarity when seeing Chinese brands overseas.
THE HABIT OF USING MOBILE PAYMENT IN THE DOMESTIC MARKET, THE SPEED AND CONVENIENCE OF USE, THE INFLUENCE OF MOBILE PAYMENT BRANDS, AND THE ADDITIONAL BENEFITS AND REWARDS, ARE ALL KEY FACTORS THAT HAVE LED CHINESE TOURISTS TO USE MOBILE PAYMENT WHILE TRAVELING OVERSEAS.
“In China, I seldom bring anything with me when I go out, but I must have my mobile phone around. All my pay-ments can be made through digital wallet on my mobile phone. Just scan and it’s done.”
Mr. Zhang, 35, Shanghai
“When traveling, we often need to buy some small items. When paying, I often have to look for small bills or get a pile of loose change in return. We can use mobile payment at some overseas convenience store chains, such as 7-11. We only need to scan the code, and it’s very convenient and fast.” Mr. Li, 31, Chengdu
“My mobile phone is always in my hand. Whenever I want to pay, I would just show my QR code or scan a code. If the internet connection is good, the entire process can be finished very quickly.” Ms. Wang, 22, Chengdu
Source:Nielsen
REASONS FOR USING MOBILE PAYMENT
No need to exchange foreign currencies,discounted exchange rates
F
Convenience, speed, and familiarity
eelings of pride when seeingChinese brands
Discounts on purchases
Marke ng promo ons
Recommenda onsby shop clerks or others
38% of Chinese tourists who did not use mobile payment
attribute it to non-acceptance by local merchants
84% of Chinese tourists feelthat there are more overseas merchants supporting mobilepayments than two years ago
I’m used to paying with credit cardsor local currency
I didn’t know I can use mobilepayments while traveling overseas
The merchants I visit do notsupport mobile payments
No discount for mobile payments
Reasons for using mobile payments
Reasons for Chinese tourists not using mobilepayments while overseas
64%
48%
43%
36%
24%
21%
55%
38%
20%
16%
No need to exchange foreign currencies,discounted exchange rates
F
Convenience, speed, and familiarity
eelings of pride when seeing Chinese brands
Discounts on purchases
Marke ng promo ons
Recommenda onsby shop clerks or others
38% of Chinese tourists who did not use mobile payment
attribute it to non-acceptance by local merchants
84% of Chinese tourists feelthat there are more overseas merchants supporting mobilepayments than two years ago
I’m used to paying with credit cardsor local currency
I didn’t know I can use mobilepayments while traveling overseas
The merchants I visit do notsupport mobile payments
No discount for mobile payments
Reasons for using mobile payments
Reasons for Chinese tourists not using mobilepayments while overseas
64%
48%
43%
36%
24%
21%
55%
38%
20%
16%
No need to exchange foreign currencies,discounted exchange rates
F
Convenience, speed, and familiarity
eelings of pride when seeingChinese brands
Discounts on purchases
Marke ng promo ons
Recommenda onsby shop clerks or others
38% of Chinese tourists who did not use mobile payment
attribute it to non-acceptance by local merchants
84% of Chinese tourists feelthat there are more overseas merchants supporting mobilepayments than two years ago
I’m used to paying with credit cardsor local currency
I didn’t know I can use mobilepayments while traveling overseas
The merchants I visit do notsupport mobile payments
No discount for mobile payments
Reasons for using mobile payments
Reasons for Chinese tourists not using mobilepayments while overseas
64%
48%
43%
36%
24%
21%
55%
38%
20%
16%
No need to exchange foreign currencies,discounted exchange rates
F
Convenience, speed, and familiarity
eelings of pride when seeingChinese brands
Discounts on purchases
Marke ng promo ons
Recommenda ons by shop clerks or others
38% of Chinese tourists who did not use mobile payment
attribute it to non-acceptance by local merchants
84% of Chinese tourists feelthat there are more overseas merchants supporting mobilepayments than two years ago
I’m used to paying with credit cardsor local currency
I didn’t know I can use mobilepayments while traveling overseas
The merchants I visit do notsupport mobile payments
No discount for mobile payments
Reasons for using mobile payments
Reasons for Chinese tourists not using mobilepayments while overseas
64%
48%
43%
36%
24%
21%
55%
38%
20%
16%
ACCUSTOMED TO MOBILE PAYMENTS, CONVENIENT
26 Outbound Chinese Tourism and Consumption Trends
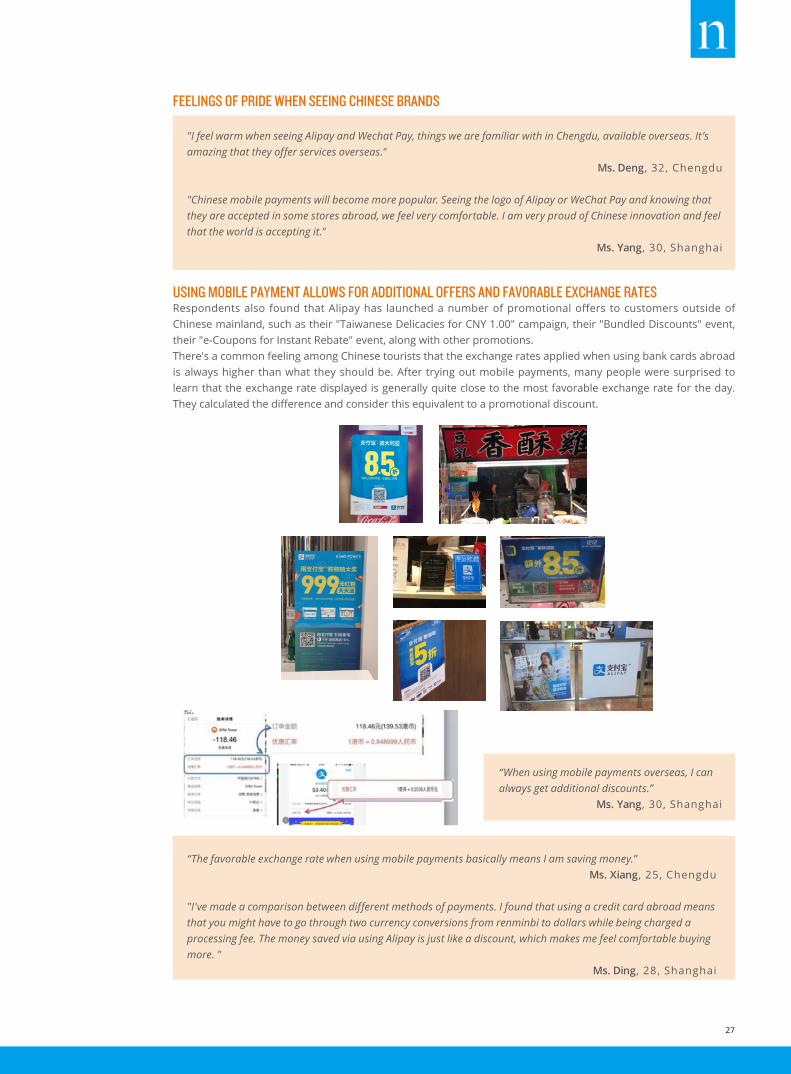
"I feel warm when seeing Alipay and Wechat Pay, things we are familiar with in Chengdu, available overseas. It’s amazing that they offer services overseas."
Ms. Deng, 32, Chengdu
"Chinese mobile payments will become more popular. Seeing the logo of Alipay or WeChat Pay and knowing that they are accepted in some stores abroad, we feel very comfortable. I am very proud of Chinese innovation and feel that the world is accepting it."
Ms. Yang, 30, Shanghai
“When using mobile payments overseas, I can always get additional discounts.”
Ms. Yang, 30, Shanghai
USING MOBILE PAYMENT ALLOWS FOR ADDITIONAL OFFERS AND FAVORABLE EXCHANGE RATESRespondents also found that Alipay has launched a number of promotional offers to customers outside of Chinese mainland, such as their "Taiwanese Delicacies for CNY 1.00" campaign, their "Bundled Discounts" event, their "e-Coupons for Instant Rebate" event, along with other promotions.There's a common feeling among Chinese tourists that the exchange rates applied when using bank cards abroad is always higher than what they should be. After trying out mobile payments, many people were surprised to learn that the exchange rate displayed is generally quite close to the most favorable exchange rate for the day. They calculated the difference and consider this equivalent to a promotional discount.
“The favorable exchange rate when using mobile payments basically means I am saving money.”Ms. Xiang, 25, Chengdu
"I've made a comparison between different methods of payments. I found that using a credit card abroad means that you might have to go through two currency conversions from renminbi to dollars while being charged a processing fee. The money saved via using Alipay is just like a discount, which makes me feel comfortable buying more. "
Ms. Ding, 28, Shanghai
FEELINGS OF PRIDE WHEN SEEING CHINESE BRANDS
27
Over the past few years, Chinese companies have been expanding mobile payment services worldwide. 84% of Chinese tourists felt that merchants overseas had increased their support for mobile payments compared with two years ago, while the remaining 16% believed that there was no significant difference. However, there were still nearly 40% of Chinese tourists who felt that only a small portion of local merchants they encountered during their last overseas trip supported mobile payment methods.At the same time, 38% of respondents who did not use mobile payments while traveling overseas expressed that this was due to the lack of acceptance for mobile payment by merchants in their destination countries or regions. Furthermore, some Chinese tourists believed that local merchants' operation of mobile payment solutions needs to be improved.
ONE OF THE MAJOR OBSTACLES FOR CHINESE TOURISTS TO USE MOBILE PAYMENT OVERSEAS IS LACK OF ACCEPTANCE FROM LOCAL MERCHANTS.
USING MOBILE PAYMENT IS MORE CONVENIENT FOR TAX REFUNDS
“I used Alipay for a tax refund. When I arrived at the airport, I found that I can use Alipay to obtain tax refunds directly after scanning the QR code. After passing through security checks, you could see two refund options: cash or Alipay. I chose Alipay for the convenience. Also, I didn’t want a cash refund since I’ve no idea whether I would have a chance to use the South Korean Won again. So basically, Alipay can convert Korean Won to Chinese Yuan immediately, so I think it is convenient to use Alipay for such a tax refund.”
Ms. Wang, 22, Chengdu
“It was more convenient to get a tax refund with Alipay at the Galerie Lafayette, which offered customers two ways to obtain a tax refund: by cash or through credit card. For Chinese customers accustomed to using Alipay, a Chinese staff of Lafayette is there to help them use Alipay. After filling out a form, you just need to put the customs form into the box without waiting in a long line. It is possible to miss the plane because of waiting for the refund, so sometimes I choose to give up the money. Doing the tax refund this way is much faster.”
Ms. Ding, 28, Shanghai
“This time when I went to Hong Kong and bought perfume for my friend, I paid with my credit card. There was supposed to be an SMS notification soon afterwards. But it was delayed and I was worried that I might have been charged twice. Later, when I bought skin care products in the pharmacy, I used my mobile phone to pay. The phone never left my hand, and I authenticated the payment with my fingerprint, which is a unique form of identification for me.”
Mr. Zhang, 35, Shanghai
Shopping is an important part of overseas travel, particularly for Chinese tourists. Chinese tourists often like to visit duty-free shops, department stores, luxury boutiques, and tend to purchase mostly clothing, shoes, handbags, and other accessories and consumer goods. The amount spent on these goods is often relatively high. Tourists are always very cautious when paying and are reluctant to make payments in large quantities of cash. Some tourists say it might happen that they cannot receive transaction notifications via SMS if they do not have international roaming for their mobile phones when they pay with bank card. Then they will be particularly worried about having their account hacked or incurring duplicate transactions from a vendor. Sometimes rejection of card payment might leave them in embarrassment. Customers who choose to pay via mobile payment can complete the transaction by inputting a password or fingerprint after they scan to pay. They hold their phones and have control over the transaction during the whole process, thus feeling more secure.
BETTER SECURITY WHEN USING MOBILE PAYMENT
28 Outbound Chinese Tourism and Consumption Trends
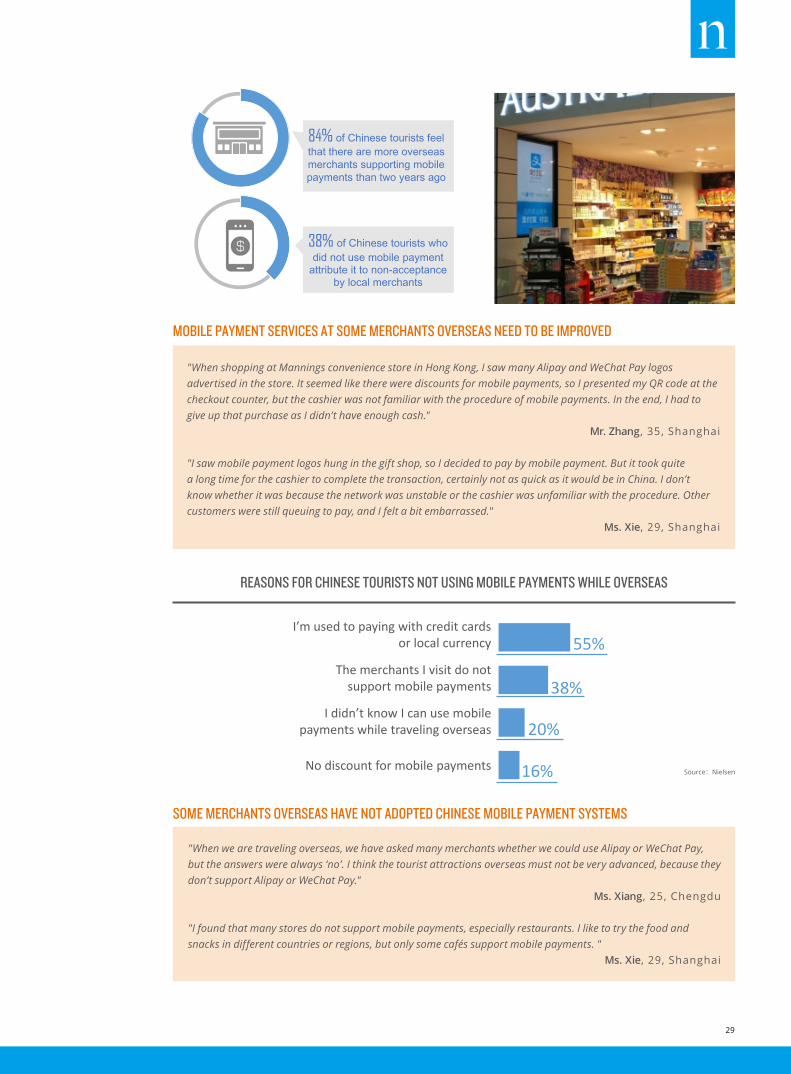
"When we are traveling overseas, we have asked many merchants whether we could use Alipay or WeChat Pay, but the answers were always ‘no’. I think the tourist attractions overseas must not be very advanced, because they don’t support Alipay or WeChat Pay."
Ms. Xiang, 25, Chengdu
"I found that many stores do not support mobile payments, especially restaurants. I like to try the food and snacks in different countries or regions, but only some cafés support mobile payments. "
Ms. Xie, 29, Shanghai
Source:Nielsen
REASONS FOR CHINESE TOURISTS NOT USING MOBILE PAYMENTS WHILE OVERSEAS
SOME MERCHANTS OVERSEAS HAVE NOT ADOPTED CHINESE MOBILE PAYMENT SYSTEMS
"When shopping at Mannings convenience store in Hong Kong, I saw many Alipay and WeChat Pay logos advertised in the store. It seemed like there were discounts for mobile payments, so I presented my QR code at the checkout counter, but the cashier was not familiar with the procedure of mobile payments. In the end, I had to give up that purchase as I didn’t have enough cash."
Mr. Zhang, 35, Shanghai
"I saw mobile payment logos hung in the gift shop, so I decided to pay by mobile payment. But it took quite a long time for the cashier to complete the transaction, certainly not as quick as it would be in China. I don’t know whether it was because the network was unstable or the cashier was unfamiliar with the procedure. Other customers were still queuing to pay, and I felt a bit embarrassed."
Ms. Xie, 29, Shanghai
MOBILE PAYMENT SERVICES AT SOME MERCHANTS OVERSEAS NEED TO BE IMPROVED
No need to exchange foreign currencies,discounted exchange rates
F
Convenience, speed, and familiarity
eelings of pride when seeingChinese brands
Discounts on purchases
Marke ng promo ons
Recommenda onsby shop clerks or others
38% of Chinese tourists whodid not use mobile payment
attribute it to non-acceptance by local merchants
84% of Chinese tourists feelthat there are more overseas merchants supporting mobile payments than two years ago
I’m used to paying with credit cardsor local currency
I didn’t know I can use mobilepayments while traveling overseas
The merchants I visit do notsupport mobile payments
No discount for mobile payments
Reasons for using mobile payments
Reasons for Chinese tourists not using mobilepayments while overseas
64%
48%
43%
36%
24%
21%
55%
38%
20%
16%
No need to exchange foreign currencies,discounted exchange rates
F
Convenience, speed, and familiarity
eelings of pride when seeingChinese brands
Discounts on purchases
Marke ng promo ons
Recommenda onsby shop clerks or others
38% of Chinese tourists who did not use mobile payment
attribute it to non-acceptance by local merchants
84% of Chinese tourists feelthat there are more overseas merchants supporting mobilepayments than two years ago
I’m used to paying with credit cards or local currency
I didn’t know I can use mobile payments while traveling overseas
The merchants I visit do not support mobile payments
No discount for mobile payments
Reasons for using mobile payments
Reasons for Chinese tourists not using mobilepayments while overseas
64%
48%
43%
36%
24%
21%
55%
38%
20%
16%
29
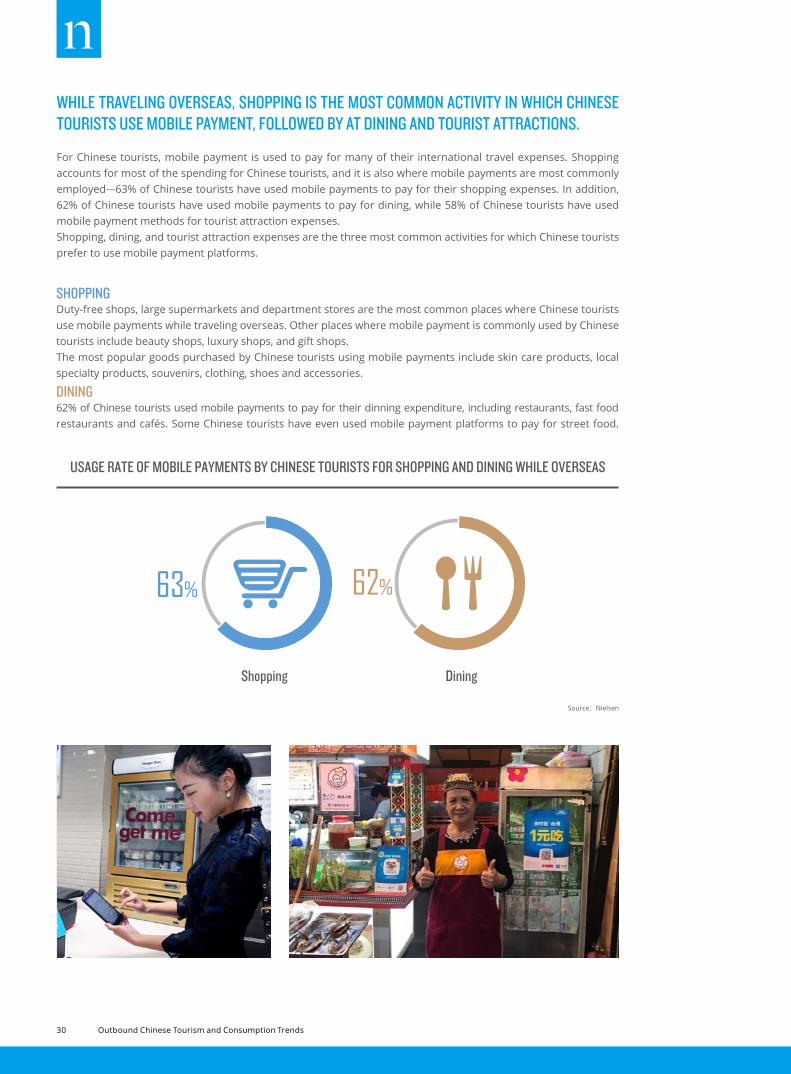
Source:Nielsen
SHOPPINGDuty-free shops, large supermarkets and department stores are the most common places where Chinese tourists use mobile payments while traveling overseas. Other places where mobile payment is commonly used by Chinese tourists include beauty shops, luxury shops, and gift shops.The most popular goods purchased by Chinese tourists using mobile payments include skin care products, local specialty products, souvenirs, clothing, shoes and accessories.
DINING62% of Chinese tourists used mobile payments to pay for their dinning expenditure, including restaurants, fast food restaurants and cafés. Some Chinese tourists have even used mobile payment platforms to pay for street food.
USAGE RATE OF MOBILE PAYMENTS BY CHINESE TOURISTS FOR SHOPPING AND DINING WHILE OVERSEAS
63%
交通场景:在境外当地交通消费场景中,打车(26%)是中国
游客应用移动支付较多的场景。
文娱场景:
在境外文娱场景中,中国游客在观看展览、演出、体育赛事以及酒吧、SPA休闲等消费中使用移动支付。
52%
62%
58%
48% 47%
Duty-Free Shops
Large Supermarkets
Department Stores
25%
24%
18%
12%
11%
Restaurant
Fast FoodRestaurants
Café
Dessert shop
Roadside snacks
33%
24%
23%
20%
12%
Extra spending attourist attractions
Admission tickets
47%
31%
Hotel
Homestay
TransitAccommodations
34%
21%
12%
Taxi
Bus & Subway
Car Rental
26%
16%
12%
Bars
Exhibitions &Performances
SPA
Concerts
Sports event
21%
16%
13%
12%
5%
Usage ratio by consumer scenario (Top 3)
Usage ratio by consumer scenario (Top 3)
Usage ratio by consumer scenario (Top 3)
Usage rate of mobile payments by Chinese tourists fortransportation and recreation while overseas
Usage rate of mobile payments by Chinese tourists on touristattractions and accommodations while overseas
Usage rate of mobile payments by Chinese tourists forshopping and dining while overseas
WHILE TRAVELING OVERSEAS, SHOPPING IS THE MOST COMMON ACTIVITY IN WHICH CHINESE TOURISTS USE MOBILE PAYMENT, FOLLOWED BY AT DINING AND TOURIST ATTRACTIONS.
For Chinese tourists, mobile payment is used to pay for many of their international travel expenses. Shopping accounts for most of the spending for Chinese tourists, and it is also where mobile payments are most commonly employed—63% of Chinese tourists have used mobile payments to pay for their shopping expenses. In addition, 62% of Chinese tourists have used mobile payments to pay for dining, while 58% of Chinese tourists have used mobile payment methods for tourist attraction expenses.Shopping, dining, and tourist attraction expenses are the three most common activities for which Chinese tourists prefer to use mobile payment platforms.
Shopping Dining
30 Outbound Chinese Tourism and Consumption Trends
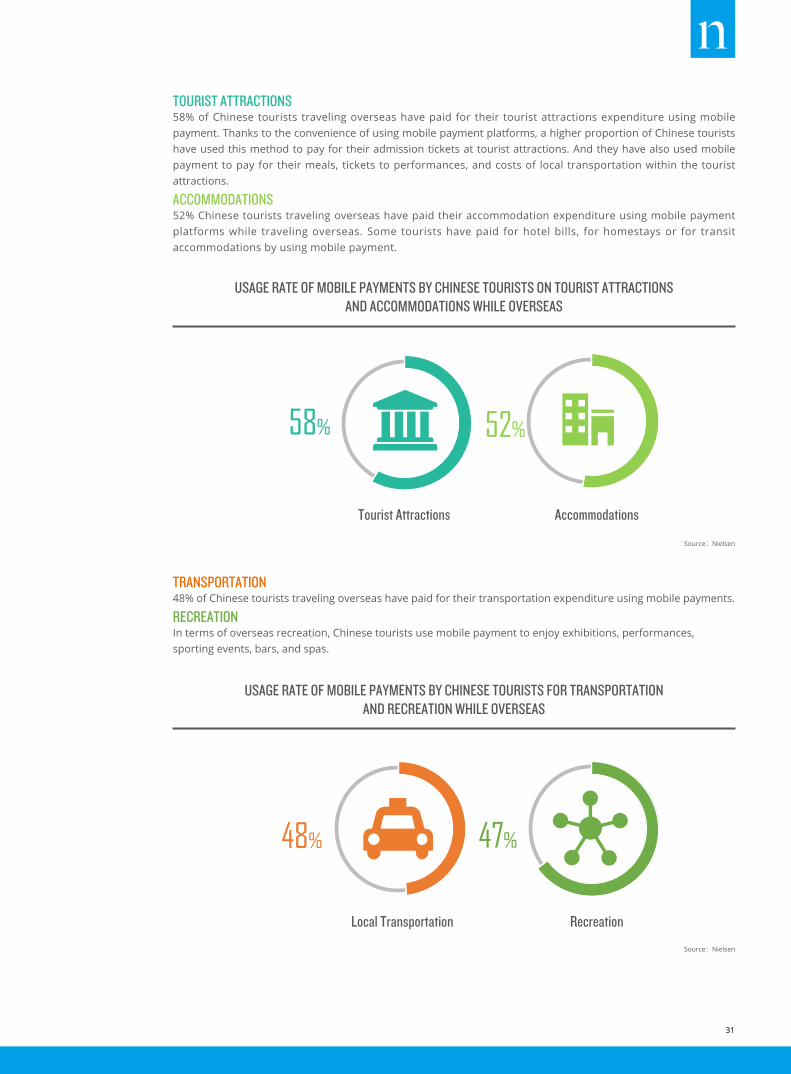
Source:Nielsen
Source:Nielsen
TOURIST ATTRACTIONS58% of Chinese tourists traveling overseas have paid for their tourist attractions expenditure using mobile payment. Thanks to the convenience of using mobile payment platforms, a higher proportion of Chinese tourists have used this method to pay for their admission tickets at tourist attractions. And they have also used mobile payment to pay for their meals, tickets to performances, and costs of local transportation within the tourist attractions.
ACCOMMODATIONS52% Chinese tourists traveling overseas have paid their accommodation expenditure using mobile payment platforms while traveling overseas. Some tourists have paid for hotel bills, for homestays or for transit accommodations by using mobile payment.
TRANSPORTATION48% of Chinese tourists traveling overseas have paid for their transportation expenditure using mobile payments.
RECREATIONIn terms of overseas recreation, Chinese tourists use mobile payment to enjoy exhibitions, performances, sporting events, bars, and spas.
USAGE RATE OF MOBILE PAYMENTS BY CHINESE TOURISTS ON TOURIST ATTRACTIONSAND ACCOMMODATIONS WHILE OVERSEAS
USAGE RATE OF MOBILE PAYMENTS BY CHINESE TOURISTS FOR TRANSPORTATIONAND RECREATION WHILE OVERSEAS
63%
交通场景: 在境外当地交通消费场景中,打车(26%)是中国
游客应用移动支付较多的场景。
文娱场景: 在境外文娱场景中,中国游客在观看展览、演出、
体育赛事以及酒吧、SPA休闲等消费中使用移动支付。
52%
62%
58%
48% 47%
Duty-Free Shops
Large Supermarkets
Department Stores
25%
24%
18%
12%
11%
Restaurant
Fast Food Restaurants
Café
Dessert shop
Roadside snacks
33%
24%
23%
20%
12%
Extra spending at tourist attractions
Admission tickets
47%
31%
Hotel
Homestay
Transit Accommodations
34%
21%
12%
Taxi
Bus & Subway
Car Rental
26%
16%
12%
Bars
Exhibitions & Performances
SPA
Concerts
Sports event
21%
16%
13%
12%
5%
Usage ratio by consumer scenario (Top 3)
Usage ratio by consumer scenario (Top 3)
Usage ratio by consumer scenario (Top 3)
Usage rate of mobile payments by Chinese tourists for transportation and recreation while overseas
Usage rate of mobile payments by Chinese tourists on tourist attractions and accommodations while overseas
Usage rate of mobile payments by Chinese tourists for shopping and dining while overseas
Tourist Attractions
Local Transportation
Accommodations
Recreation
31
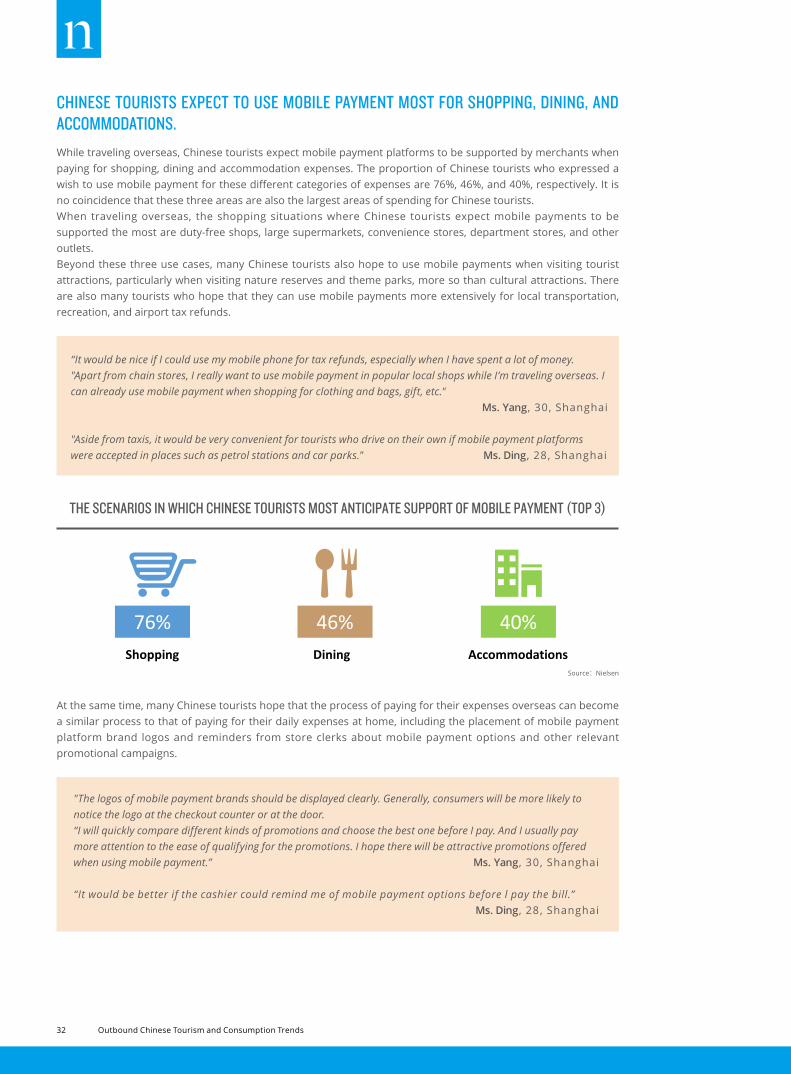
"The logos of mobile payment brands should be displayed clearly. Generally, consumers will be more likely to notice the logo at the checkout counter or at the door.“I will quickly compare different kinds of promotions and choose the best one before I pay. And I usually pay more attention to the ease of qualifying for the promotions. I hope there will be attractive promotions offered when using mobile payment.” Ms. Yang, 30, Shanghai
“It would be better if the cashier could remind me of mobile payment options before l pay the bill.” Ms. Ding, 28, Shanghai
At the same time, many Chinese tourists hope that the process of paying for their expenses overseas can become a similar process to that of paying for their daily expenses at home, including the placement of mobile payment platform brand logos and reminders from store clerks about mobile payment options and other relevant promotional campaigns.
Source:Nielsen
THE SCENARIOS IN WHICH CHINESE TOURISTS MOST ANTICIPATE SUPPORT OF MOBILE PAYMENT (TOP 3)
中国游客境外旅游最期望应用移动支付的场景,集中在消费支出占比最高的购物、餐饮和住宿上 当谈到去境外旅行时最期望在哪些场景使用移动支付的方式,中国游客的回答集中在购物、餐饮和
住宿场景上;对三个场景应用移动支付方式有需求的中国游客比例分别为76%、46%和40%。事实上,购物、餐饮和住宿正是中国游客境外旅游消费最高的三类支出。
中国游客对境外旅游支持用移动支付结算消费呼声较高的购物场景是免税店店、超市、便利店、百货商场等。
在三大期望应用场景之后,也有较多中国游客希望在景区使用移动支付,其中对自然景区和主题公园类景区的期望高于人文景区。另外还有游客表示希望可以在当地交通、文娱体验以及机场退税等方面广泛使用移动支付的方式。
76% 46% 40%
The scenarios in which Chinese tourists most anticipate support of mobile payment (top 3)
Shopping Dining Accommodations
While traveling overseas, Chinese tourists expect mobile payment platforms to be supported by merchants when paying for shopping, dining and accommodation expenses. The proportion of Chinese tourists who expressed a wish to use mobile payment for these different categories of expenses are 76%, 46%, and 40%, respectively. It is no coincidence that these three areas are also the largest areas of spending for Chinese tourists.When traveling overseas, the shopping situations where Chinese tourists expect mobile payments to be supported the most are duty-free shops, large supermarkets, convenience stores, department stores, and other outlets.Beyond these three use cases, many Chinese tourists also hope to use mobile payments when visiting tourist attractions, particularly when visiting nature reserves and theme parks, more so than cultural attractions. There are also many tourists who hope that they can use mobile payments more extensively for local transportation, recreation, and airport tax refunds.
CHINESE TOURISTS EXPECT TO USE MOBILE PAYMENT MOST FOR SHOPPING, DINING, AND ACCOMMODATIONS.
“It would be nice if I could use my mobile phone for tax refunds, especially when I have spent a lot of money."Apart from chain stores, I really want to use mobile payment in popular local shops while I’m traveling overseas. I can already use mobile payment when shopping for clothing and bags, gift, etc."
Ms. Yang, 30, Shanghai
"Aside from taxis, it would be very convenient for tourists who drive on their own if mobile payment platforms were accepted in places such as petrol stations and car parks." Ms. Ding, 28, Shanghai
32 Outbound Chinese Tourism and Consumption Trends
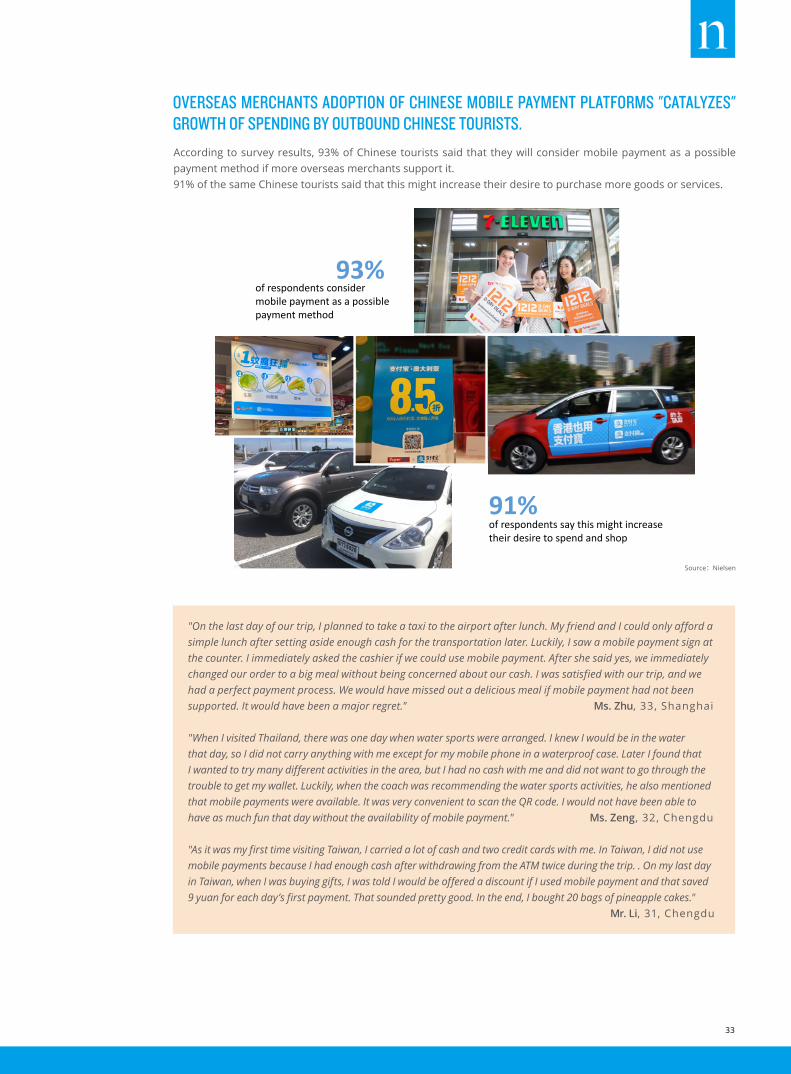
According to survey results, 93% of Chinese tourists said that they will consider mobile payment as a possible payment method if more overseas merchants support it.91% of the same Chinese tourists said that this might increase their desire to purchase more goods or services.
OVERSEAS MERCHANTS ADOPTION OF CHINESE MOBILE PAYMENT PLATFORMS "CATALYZES" GROWTH OF SPENDING BY OUTBOUND CHINESE TOURISTS.
46% 38% 35%
32% 23% 17%
Shopping Tourist Attractions
Dining
Accommodations Transportation Recreation
of tourists would consider choosing Alipay as one of
the payment methods
of tourists would consider using this
merchant
of tourists might buy more goods at
this
94% 92% 91%
If Alipay is accepted by a merchant overseas…
Usage ratio of Alipay by Chinese tourists in various overseas travel scenarios
"On the last day of our trip, I planned to take a taxi to the airport after lunch. My friend and I could only afford a simple lunch after setting aside enough cash for the transportation later. Luckily, I saw a mobile payment sign at the counter. I immediately asked the cashier if we could use mobile payment. After she said yes, we immediately changed our order to a big meal without being concerned about our cash. I was satisfied with our trip, and we had a perfect payment process. We would have missed out a delicious meal if mobile payment had not been supported. It would have been a major regret." Ms. Zhu, 33, Shanghai
"When I visited Thailand, there was one day when water sports were arranged. I knew I would be in the water that day, so I did not carry anything with me except for my mobile phone in a waterproof case. Later I found that I wanted to try many different activities in the area, but I had no cash with me and did not want to go through the trouble to get my wallet. Luckily, when the coach was recommending the water sports activities, he also mentioned that mobile payments were available. It was very convenient to scan the QR code. I would not have been able to have as much fun that day without the availability of mobile payment." Ms. Zeng, 32, Chengdu
"As it was my first time visiting Taiwan, I carried a lot of cash and two credit cards with me. In Taiwan, I did not use mobile payments because I had enough cash after withdrawing from the ATM twice during the trip. . On my last day in Taiwan, when I was buying gifts, I was told I would be offered a discount if I used mobile payment and that saved 9 yuan for each day’s first payment. That sounded pretty good. In the end, I bought 20 bags of pineapple cakes."
Mr. Li, 31, Chengdu
Source:Nielsen
调查数据显示, 93%的中国游客表示,如果有更多的国外商户支持使用中国移动支付品牌,他们愿意更多地使用移动支付来结算消费。
同时,91%的中国游客表示,这也会提升他们的消费和购物意愿。
93% of respondents consider mobile payment as a possible payment method
图片
91% of respondents say this might increase their desire to spend and shop 图片
调查数据显示, 93%的中国游客表示,如果有更多的国外商户支持使用中国移动支付品牌,他们愿意更多地使用移动支付来结算消费。
同时,91%的中国游客表示,这也会提升他们的消费和购物意愿。
93% of respondents consider mobile payment as a possible payment method
图片
91% of respondents say this might increase their desire to spend and shop 图片
33
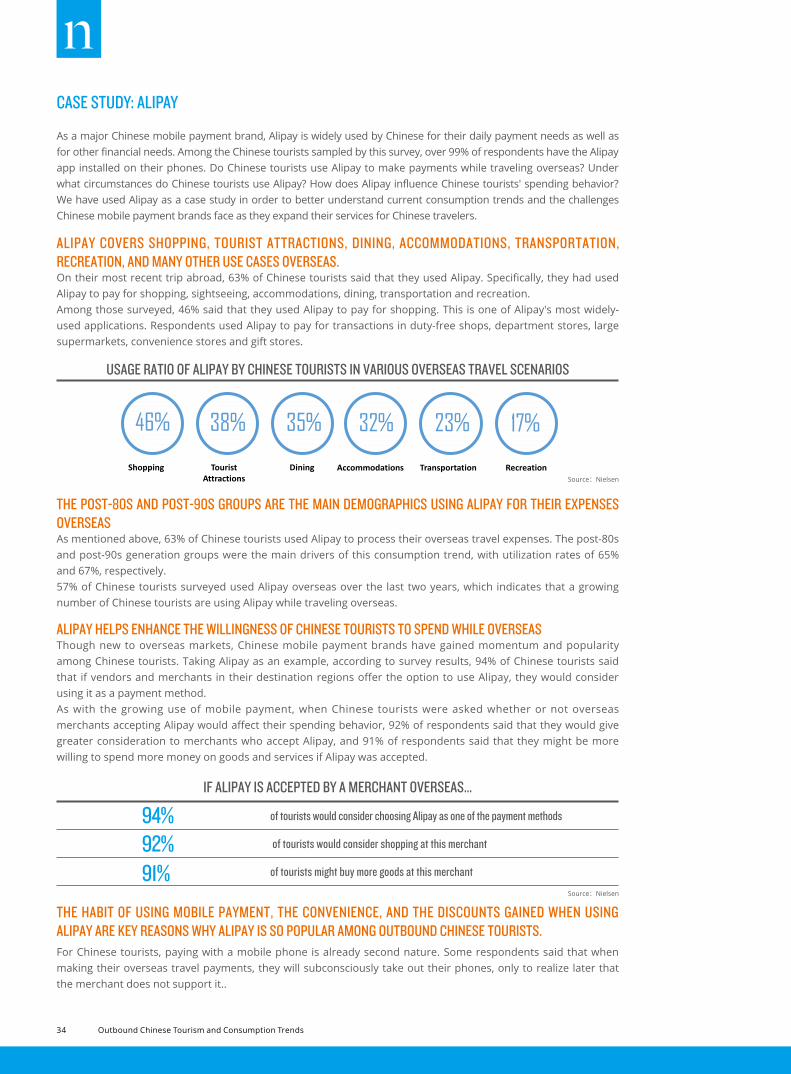
THE HABIT OF USING MOBILE PAYMENT, THE CONVENIENCE, AND THE DISCOUNTS GAINED WHEN USING ALIPAY ARE KEY REASONS WHY ALIPAY IS SO POPULAR AMONG OUTBOUND CHINESE TOURISTS.
THE POST-80S AND POST-90S GROUPS ARE THE MAIN DEMOGRAPHICS USING ALIPAY FOR THEIR EXPENSES OVERSEASAs mentioned above, 63% of Chinese tourists used Alipay to process their overseas travel expenses. The post-80s and post-90s generation groups were the main drivers of this consumption trend, with utilization rates of 65% and 67%, respectively.57% of Chinese tourists surveyed used Alipay overseas over the last two years, which indicates that a growing number of Chinese tourists are using Alipay while traveling overseas.
ALIPAY HELPS ENHANCE THE WILLINGNESS OF CHINESE TOURISTS TO SPEND WHILE OVERSEASThough new to overseas markets, Chinese mobile payment brands have gained momentum and popularity among Chinese tourists. Taking Alipay as an example, according to survey results, 94% of Chinese tourists said that if vendors and merchants in their destination regions offer the option to use Alipay, they would consider using it as a payment method.As with the growing use of mobile payment, when Chinese tourists were asked whether or not overseas merchants accepting Alipay would affect their spending behavior, 92% of respondents said that they would give greater consideration to merchants who accept Alipay, and 91% of respondents said that they might be more willing to spend more money on goods and services if Alipay was accepted.
94% of tourists would consider choosing Alipay as one of the payment methods
92% of tourists would consider shopping at this merchant
91% of tourists might buy more goods at this merchant
IF ALIPAY IS ACCEPTED BY A MERCHANT OVERSEAS…
Source:Nielsen
Source:Nielsen
CASE STUDY: ALIPAY
ALIPAY COVERS SHOPPING, TOURIST ATTRACTIONS, DINING, ACCOMMODATIONS, TRANSPORTATION, RECREATION, AND MANY OTHER USE CASES OVERSEAS.On their most recent trip abroad, 63% of Chinese tourists said that they used Alipay. Specifically, they had used Alipay to pay for shopping, sightseeing, accommodations, dining, transportation and recreation.Among those surveyed, 46% said that they used Alipay to pay for shopping. This is one of Alipay's most widely-used applications. Respondents used Alipay to pay for transactions in duty-free shops, department stores, large supermarkets, convenience stores and gift stores.
As a major Chinese mobile payment brand, Alipay is widely used by Chinese for their daily payment needs as well as for other financial needs. Among the Chinese tourists sampled by this survey, over 99% of respondents have the Alipay app installed on their phones. Do Chinese tourists use Alipay to make payments while traveling overseas? Under what circumstances do Chinese tourists use Alipay? How does Alipay influence Chinese tourists' spending behavior? We have used Alipay as a case study in order to better understand current consumption trends and the challenges Chinese mobile payment brands face as they expand their services for Chinese travelers.
46% 38% 35%
32% 23% 17%
Shopping Tourist Attractions
Dining
Accommodations Transportation Recreation
of tourists would consider choosing Alipay as one of
the payment methods
of tourists would consider using this
merchant
of tourists might buy more goods at
this
94% 92% 91%
If Alipay is accepted by a merchant overseas…
Usage ratio of Alipay by Chinese tourists in various overseas travel scenarios
USAGE RATIO OF ALIPAY BY CHINESE TOURISTS IN VARIOUS OVERSEAS TRAVEL SCENARIOS
For Chinese tourists, paying with a mobile phone is already second nature. Some respondents said that when making their overseas travel payments, they will subconsciously take out their phones, only to realize later that the merchant does not support it..
34 Outbound Chinese Tourism and Consumption Trends
"I have tried to use Alipay at the checkout many times without thinking about whether it is supported or not when shopping." "When shopping overseas at a supermarket, I would ask if Alipay is accepted. However, I would pay directly with my phone in a duty-free shop because I know that Alipay is available there." Ms. Wang, 22, Chengdu
"In China, I am accustomed to using Alipay, and I feel a bit annoyed when I want to use Alipay overseas but realize that I cannot." Ms. Deng, 32, Chengdu
"I am used to making payments with Alipay in Shanghai, so it feels familiar when I see Alipay logo overseas. It was familiar for me when I saw its logo on the taxi. I also saw Alipay’s logo on the sign of payment methods, and I asked the taxi driver if he would accept this method of payment. He said yes. It felt good to be able to pay this way. "
Ms. Shi, 32, Shanghai
"Alipay is a Chinese innovation. When I see its logo abroad, I feel at home. I have also seen OFO bikes. I was so surprised when I saw OFO bikes in Thailand. I instantly tried to unlock the bike with Alipay. It worked, and it’s so amazing! I got this feeling of empowerment, like we’ve really become global citizens.""Whenever I see Alipay’s logo, I will just use that to pay, no questions asked. But if I don’t see the logo, I will ask whether or not I can use it." Ms. Xiang, 25, Chengdu
"If I can pay with Alipay, it will be my preferred payment method since it is a Chinese brand. There is no reason in particular, but I feel comfortable when I see Chinese brands overseas." Ms. Wang, 22, Chengdu
CHALLENGES: INCREASE ACCEPTANCE AMONG OVERSEAS MERCHANTS AND IMPROVE THE PAYMENT EXPERIENCE FOR CHINESE TOURISTSChinese mobile payment brands have gradually gone global, and mobile payments have offered increasingly impressive solutions for Chinese tourists' needs. Many Chinese mobile payment brands, including Alipay, have undergone a variety of efforts and conducted numerous campaigns to expand coverage and improve the payment experience. The results speak for themselves.However, China's mobile payment brands are still facing numerous challenges, such as limited merchant coverage, and need to improve the payment service experience for Chinese tourists.
While traveling overseas, many Chinese tourists asked the merchants whether or not they supported mobile payments: 49% of Chinese tourists said that they would ask the merchant whether they supported mobile payments most of the time, 34% said they only asked occasionally, and only 17% said that they would not ask whether the merchants supported mobile payments.
Alipay is focused on providing Chinese tourists with greater convenience and discounts while traveling overseas. Most Chinese tourists found Alipay's services and promotions attractive. 59% of the users of Alipay said that using Alipay overseas was very convenient and very similar to its use in China. Some respondents also said that Alipay offers discounts for outbound tourists, and that using it saves the hassle of exchanging physical money, with added benefits such as favorable exchange rates.Alipay also offers users a reassuring familiarity with its brand logo, helping Chinese customers feel more at home even while traveling overseas. 50% of Alipay customers said that seeing the Alipay logo makes them feel familiar and proud while traveling overseas.
35
ABOUT NIELSENNielsen Holdings plc (NYSE: NLSN) is a global performance management company that provides a comprehensive understanding of what consumers want and buy. Nielsen’s Watch segment provides media and advertising clients with Total Audience measurement services for all devices on which content — video, audio and text — is consumed. The Buy segment offers consumer packaged goods manufacturers and retailers the industry's only global view of retail performance measurement. By integrating information from its Watch and Buy segments and other data sources, Nielsen also provides its clients with analytics that help improve performance. Nielsen, an S&P 500 company, has operations in more than 100 countries, covering more than 90% of the world’s population. Find more information: www.nielsen.com
RESEARCH METHOD AND STATEMENT The Outbound Chinese Tourism and Consumption Trends: 2017 Survey is a specialized survey conducted by Nielsen on the overseas spending and payment behavior of tourists from the Chinese mainland, the United States, the United Kingdom, France, Japan and South Korea, as well as the trends affecting their potential future behavior.
In December 2017, Nielsen conducted an extensive quantitative online survey with 2,009 residents from Chinese mainland and 613 non-Chinese residents as its research subjects, all of whom had travelled overseas in the past 12 months and plan to travel overseas in the next 12 months. In terms of the respondents from the Chinese mainland, to guarantee the representativeness of the samples, the survey took random samples from residents aged 20-50 (referred to as the “post-70s,” “post-80s” and “post-90s” generations) in first-tier cities such as Beijing, Shanghai, Guangzhou, and Shenzhen, second-tier cities such as Tianjin, Nanjing, Hangzhou, Chengdu, Chongqing, and Qingdao, and third-tier cities such as Jilin, Zaozhuang, Taiyuan, Zhuhai, and Shaoxing. The non-Chinese respondents in the survey were tourists from representative developed countries or regions (excluding Chinese nationals who were residing in those countries or regions). The data of non-Chinese tourists in the report was the sum of the statistical data of tourists from the countries or regions after weighing, which showed related values revealing a significant difference compared with the data of Chinese tourists.
Nielsen also invited 12 tourists who had returned to Shanghai or Chengdu from their travel overseas for face-to-face in-depth qualitative interviews where they were asked about their feelings and experiences before and after their travels.
This survey on Chinese tourists' overseas spending and payment was a one-for-one in-depth online survey by Nielsen, commissioned by Alipay. The results of the survey do not necessarily reflect the opinions of the commissioning party. All data collected and presented was based on the basic conditions of the populations and was only intended to be used for the purpose of this survey. Nielsen Consumer Finance Research Team designed this survey and based its opinions on it in an attempt to provide a reference material for the general market, the industry, and the general public. Nielsen shall not bear any responsibilities or liability for the data and the opinions contained herein.