nicce: a model for cycling of nitrogen and carbon isotopes in coniferous forest ecosystems
TRANSCRIPT
ELSEVIER Ecological Modelling 79 (1995) 255-275
NICCCE: a model for cycling of nitrogen and carbon isotopes in coniferous forest ecosystems
D. van Dam *, N. van Breemen Agricultural University, Department of Soil Science and Geology, Box 37, 6700AA Wageningen, Netherlands
Received 4 January 1993; accepted 22 September 1994
Abstract
A process-oriented dynamic simulation model for turnover of N and C isotopes in coniferous forest ecosystems has been developed. The mode1 is used to interpret results of experiments on nitrogen saturation and reversibility of nitrogen saturation conducted within a gradient of N-deposition in Europe. Observed and simulated nitrate concentrations in the soil solution both responded quickly to reduced input in an experiment, with N-input in throughfall excluded. Foliar N-concentrations decreased more slowly, and were observed to be unchanged over a 2-year period. Due to isotope fractionation processes 615N values of ecosystem compartments are predicted to increase for systems approaching N-saturation, due to output of nitrate and denitrification products being relatively depleted in 15N. Sensitivity analysis of the model revealed a strong influence of the microbial substrate-use efficiency for organic carbon on input/output budgets of N. Factors causing an increase of primary production such as increasing CO, concentration are predicted to result in decreased nitrate concentrations. The model has hitherto been calibrated with conventional r4N data. Labeling with 15N on the scale of forest stands, and small head-water catchments, is currently being carried out to follow the fate of atmospheric nitrogen input, and to compare model behavior with turnover of 15N in coniferous forest ecosystems.
Keywords: Carbon; Coniferous ecosystems; NICCCE; Nitrogen
1. Introduction
A process-oriented, deterministic model for heat, water, nitrogen and cling in coniferous forest has been
simulation carbon cy- developed.
search programme (Dise and Wright, 1992). The ultimate goal of NITREX is to increase under- standing of nitrogen cycling, and especially of nitrogen saturation in coniferous forest ecosys- terns, as it depends on atmospheric input of N.
The model (NICCCE; Nitrogen Isotopes and Carbon Cycling in Coniferous Ecosystems) is in- tended as a tool to interpret results of experi- ments on the atmospheric input of nitrogen to coniferous forest ecosystems in the NITREX re-
* Corresponding author.
Forest-stand and catchment-scale field experi- ments are conducted within a gradient of N-input in North-Western Europe, ranging from about 50-60 (the Netherlands) to 15-20 (Norway and Wales) kg ha-’ yr-‘. Within this gradient, nitro- gen addition and removal experiments are being carried out to evaluate nitrogen saturation and its reversibility, critical loads for nitrogen (Gunder-
0304-3800/95/$09.50 0 1995 Elsevier Science B.V. All rights reserved SSDI 0304-3800(94)00184-7
D. aan Dam, N. uan Breemen /Ecological Modelling 79 (1995) 255-275 256
sen, 1992), and potential effects of forest use and climate change on coniferous forest ecosystems.
Experiments with i5N as a tracer are a major part of NITREX, with turnover being determined from poolsize and changes in isotopic ratios. Whereas with conventional 14N-experiments poolsize (PI and inputs/outputs (i/o> have to be measured to calculate turnover, 15N experiments allow either P, i or o to be unknown. NICCCE was developed to interpret results of tracer exper- iments, and it has been used to predict the re- quired enrichment in throughfall that is sufficient to discriminate between variation in natural abundance and experimentally-added 15N. After 15N values in various pools have been measured for a number of years it is expected that narrower ranges for model parameters that regulate turnover of N can be derived. In this way mutual benefits between model development and design of field experiments may contribute to increased understanding of nitrogen cycling in coniferous ecosystems.
Apart from nitrogen isotopes, NICCCE simu- lates turnover of stable carbon isotopes (12C and 13C) as well. We did not include 14C in the model, but instead the mean carbon age of each pool is calculated, in order to calibrate turnover time of carbon pools on data of 14C-age. Our ultimate goal is to parametrize and calibrate a process-ori- ented model of nitrogen and carbon cyling that will be able to predict ecosystem response over a wide range of environmental conditions. The con- cepts developed in the present model will be incorporated in existing models on nutrient cy- cling and acidification in forest ecosystems such as RESAM (de Vries, 1990; de Vries et al., 1991) and MAGIC (Cosby et al., 1985a,b). These can be used to predict ecosystem respons to various de- position and climate change scenarios for envi- ronmental policy purposes.
2. General description of the model
2.1. Introduction
NICCCE is a mechanistic model, simulating processes such as heat transport, evapotranspira-
tion, primary production, mineralization, decom- position, root uptake, transport of solutes, and isotope fractionation of N and C (14N, 15N and i2C, 13C) for coniferous forest growing on a one- dimensional, multicompartment soil profile. The model is applicable to closed-canopy forests, older than about 20 years. Input data include atmo- spheric, and any experimental input of nitrogen compounds, as concentrations in throughfall, and canopy exchange, global short-wave radiation, precipitation, temperature, relative humidity, wind speed and concentration of CO, in the atmosphere. NICCCE is implemented as Quick- Basic (version 4.5) multimodule compiler code. The execution time of the model running on a 80486SX 33MHz PC with numeric coprocessor is l-2 minutes for a one-year simulation period if soil temperature and moisture are read from out- put files of previous model runs. However, it takes about 5 minutes if carbon and nitrogen cycling and heat and water transport are calcu- lated interactively.
Rates of processes in NICCCE are generally described by three kinds of kinetics: zero-order rate kinetics:
dS/dt = -k,
first-order rate kinetics:
dS/dt = -k, ‘S
Michaelis-Menten kinetics:
dS/dt = -k, . S/( k, + S)
in which: S = poolsize; dS/dt = rate of process; k, = zero-order rate constant; k, = first-order rate constant; k, = maximum transformation rate of pool; k, = saturation constant, i.e., concentra- tion of S for which dS/dt = OSk,.
Effects of environmental variables such as temperature, soil matric potential and foliar N concentrations on the rates of these processes are described using:
f(K) = I/(1 +exp(a@, -&i))), (1)
where f(E,) is a monotonically increasing envi- ronmental effect, E, is the actual value of an environmental variable, Eh, is the parameter value for which f(E,) = 0.5 and ui is the slope of the dose response curve at E,,. In case of an
D. uan Dam, N. uan Breemen /Ecological Modelling 79 (1995) 255-275 257
I 1 DECOMPOSITION,
Fig. 1. General structure of model for primary production.
optimum response curve the response above the optimum value of the environmental variable is
and the optimum curve is described as:
2.2. Primary production
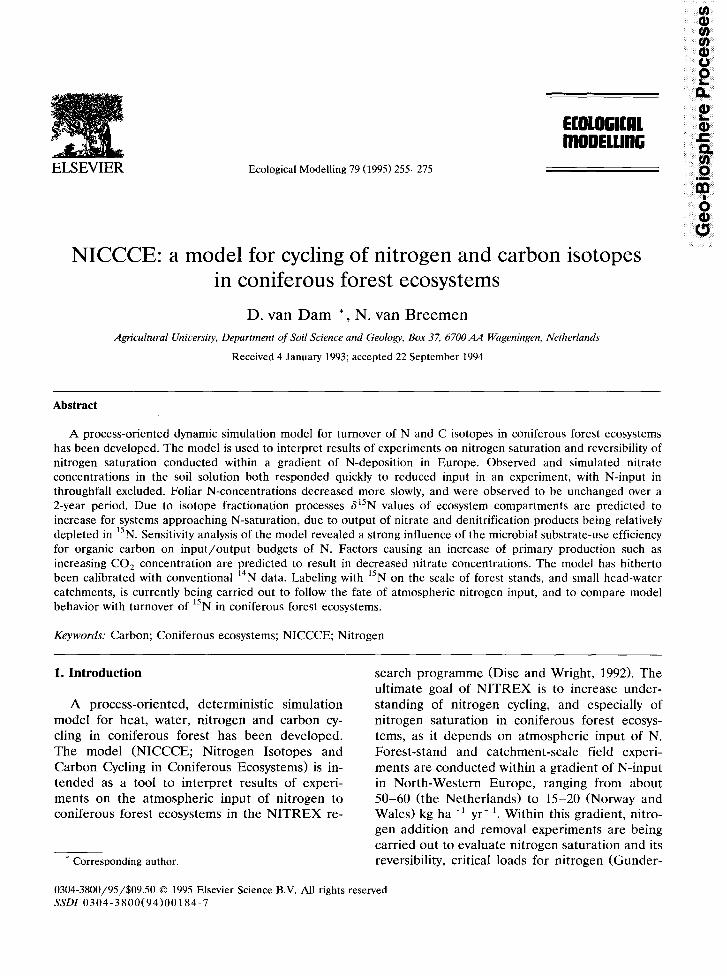
The model structure for calculation of primary production is illustrated in Fig. 1. Photosynthesis is calculated on an hourly basis. Hourly tempera- tures are evaluated from daylength and sinusoidal fluctuations around daily minima and maxima. Distribution of short-wave radiation during a day is assumed to be proportional to the distribution
of global solar radiation for cloudless conditions. The latter distribution is calculated from the so- lar constant, inclination of the solar beam over a day, and an extinction coefficient of solar radia- tion in a cloudless atmosphere. The forest canopy is considered to be a homogeneously-distributed mass of leaves, branches and stems. Part of the incoming radiation is reflected, with albedo for coniferous forests (0.117 & 0.032; Jarvis et al., 1976) being rather low compared to that of other vegetation types. Extinction of radiation within the canopy is treated as a Lambert-Beer process, with radiation absorbed by leaves I, calculated as:
(3)
where k = extinction coefficient, t = transmission coefficient and LA1 is leaf area index above the level in the canopy considered. This description is a simplified, lumped parameter model compared to more sophisticated models of light attenuation in forest canopies (Oker-Blom, 1985; Wang and Jarvis, 1990). The LA1 is calculated from specific leaf area and simulated biomass of leaves. Ab- sorbed radiation is calculated for five levels in the canopy to account for non-linear effects of photo- synthesis-light response curves. Canopy photo- synthesis is integrated over these levels and up to five age-classes of needles (current, lst, 2nd, 3rd and older cohorts).
The relation between absorbed photoactive ra- diation and gross photosynthesis of leaves is de- scribed as a non-rectangular hyperbola:
P, = 0.50
P,:
P,’ I,: Cl!:
0:
(4) maximum gross photosynthesis at saturating irradiance and 340 vppm CO, (kg C mm2 s-l); gross photosynthesis (kg C m-’ s-r); absorbed photoactive radiation (J me2 s-l); light-use efficiency, i.e. initial slope of photo- synthesis light response curve (kg C J- ‘>; rd/(rd + r,) with r,, = diffusion resistance of CO, (s m-l); rx = carboxylation resistance (s m-‘).
D. uan Dam. N. uan Breemen /Ecological Modelling 79 (1995) 255-275 258
0 is treated as an empirical parameter for opti- mal fitting of photosynthesis irradiance respons curves.
Maximum gross photosynthesis Pm is cor- rected for the effects of temperature, the nitro- gen content of needles, and the stomata1 conduc- tance, which itself is affected by vapour pressure deficit and soil moisture potential. The effect of atmospheric CO, concentration on maximum gross photosynthesis under saturating irradiance was taken from a fit to data from experiments with Douglas fir (Mohren, 1987), according to:
/(C,)=0.0328.(Ci-(C~-4.‘5~C,)“‘5), (5)
where Ci = 0.05 . C, + 25, with Ci and C, denot- ing internal and external CO, concentration (vppm). Maximum photosynthetic capacity de- pends on N content of foliage (Eq. 2). A positive correlation between N-content and net assimila- tion rate (kg C rnp2 leaf area s-l) has been found for many plant species, with net assimila- tion being strongly reduced below N contents of 1% (Field and Mooney, 1986; Hirose, 1988). For Douglas fir such a relation was demonstrated by Brix (1981). Because of enhanced photosynthesis for increasing, below-optimum foliar N concen- trations, and a decreasing net photosynthesis per unit of additional nitrogen, foliar N concentra- tions tend to stabilize at species-specific levels, but these are modified by environmental condi- tions. At extremely high N concentrations, phos- phorylation, photosynthesis and protein synthesis are hampered by ammonia, leading to accumula- tion of amino acids like arginine in needles of conifers (van Dijk and Roelofs, 1988; Pietila et al., 1991).
Photosynthesis and transpiration are both in- fluenced by stomata1 conductance. This therefore influences water-use-efficiency (g C fixed/g H,O transpired) (Farquhar, 1991) and nitrogen-use ef- ficiency (g C fixed/g N of leaves) (Field et al., 1983). With ‘increasing N-contents of leaves pho- tosynthesis tends to increase more strongly than transpiration, and thus water-use efficiency tends to increase.
Light-use efficiency depends on temperature
and concentration of CO,. For C-3 plants light- use efficiency cy can be expressed as:
‘Y=a0.(1-r/C02e), (6)
with I being the CO, compensation point, C, the external carbon dioxide concentration, and cyo the reference value for (Y. For Douglas fir the effect of temperature on I was approximated with a Q” value of 1.6, with reference values of 13°C and 27 vppm CO, (Mohren, 1987). We used relations between photosynthesis and irradiance from literature (Mohren, 1987; Jarvis, 1989) to estimate P,,, and (Y.
Net primary production (P,,) is calculated as the difference between gross photosynthesis (P,) and respiratory losses. Respiratory losses are due to maintenance respiration (R,) and growth res- piration (RF), with R, receiving priority. Mainte- nance respiration is calculated as a linear func- tion of nitrogen and mineral content of biomass compartments, corrected with a Q”-like function (fr) for temperature effects. Parameter values (yi and pi for maintenance respiration (Penning de Vries, 1975) are the same as used by Mohren (1987):
R,=((Y~.C~.~V~+P~.C~.M~).~T, (7) with R, maintenance respiration (g C me2 day-‘), Ci carbon weight (g me2), Ni nitrogen content (o/o), and Mi mineral content (%) of the ith tree compartment. Growth respiration, which depends on the type of structural biomass pro- duced (Thornley and Johnson, 1990, p. 352), was assumed to be 35% for conversion of available assimilates to all structural biomass components:
Rg=0.35.(Pg-RR,). (8)
The structural biomass components distin- guished are polysaccharides, proteins, (hemi)cel- lulose and lignin. The fractional contribution of these compounds to structural biomass of tree compartments is assumed to be dependent on nitrogen content. The fraction of C in proteins is estimated as % N/12, and the rest is divided between carbohydrates, (hemi)cellulose and lignin according to literature values of composition of coniferous trees. Cycling of cations is presently not considered in NICCCE, so the cation concen-
D. uan Dam, N. van Breemen /Ecological Modelling 79 (1995) 255-27s 259
GROWTH J!?
-UPTAKE P
3
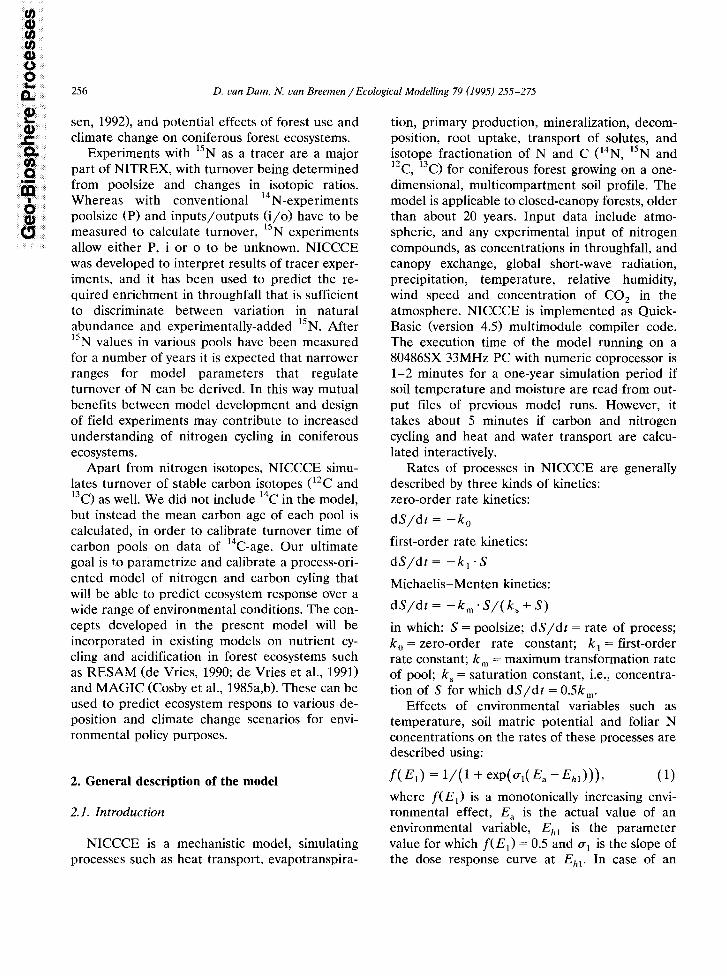
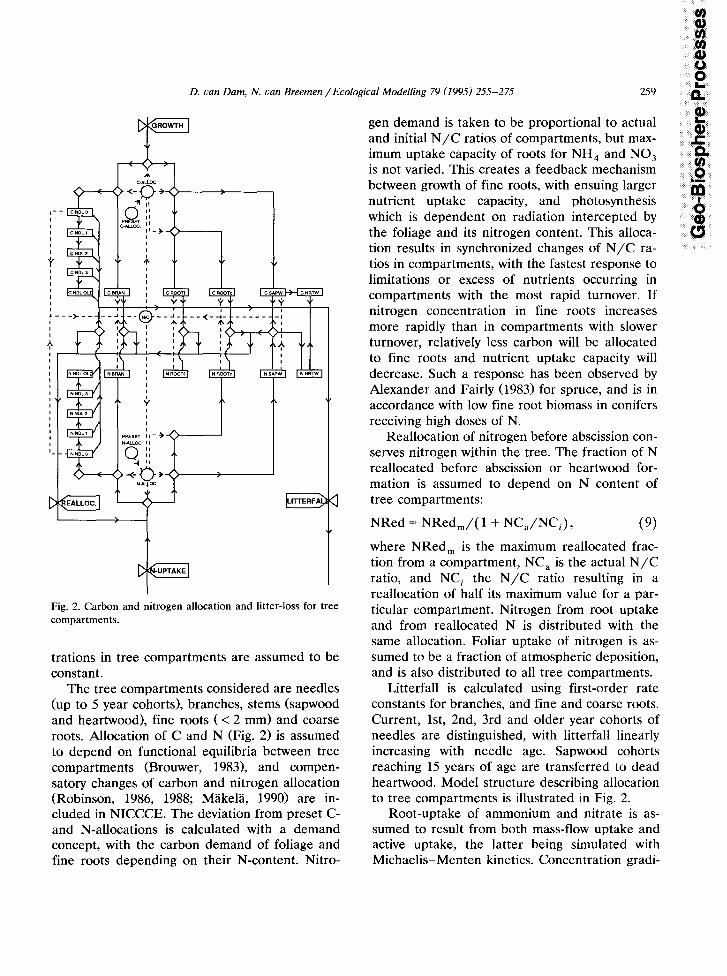
Fig. 2. Carbon and nitrogen allocation and litter-loss for tree compartments.
trations in tree compartments are assumed to be constant.
The tree compartments considered are needles (up to 5 year cohorts), branches, stems (sapwood and heartwood), fine roots ( < 2 mm) and coarse roots. Allocation of C and N (Fig. 2) is assumed to depend on functional equilibria between tree compartments (Brouwer, 1983), and compen- satory changes of carbon and nitrogen allocation (Robinson, 1986, 1988; MakelH, 1990) are in- cluded in NICCCE. The deviation from preset C- and N-allocations is calculated with a demand concept, with the carbon demand of foliage and fine roots depending on their N-content. Nitro-
gen demand is taken to be proportional to actual and initial N/C ratios of compartments, but max- imum uptake capacity of roots for NH, and NO, is not varied. This creates a feedback mechanism between growth of fine roots, with ensuing larger nutrient uptake capacity, and photosynthesis which is dependent on radiation intercepted by the foliage and its nitrogen content. This alloca- tion results in synchronized changes of N/C ra- tios in compartments, with the fastest response to limitations or excess of nutrients occurring in compartments with the most rapid turnover. If nitrogen concentration in fine roots increases more rapidly than in compartments with slower turnover, relatively less carbon will be allocated to fine roots and nutrient uptake capacity will decrease. Such a response has been observed by Alexander and Fairly (1983) for spruce, and is in accordance with low fine root biomass in conifers receiving high doses of N.
Reallocation of nitrogen before abscission con- serves nitrogen within the tree. The fraction of N reallocated before abscission or heartwood for- mation is assumed to depend on N content of tree compartments:
NRed = NRed,/( 1 + NCJNC,), (9)
where NRed, is the maximum reallocated frac- tion from a compartment, NC, is the actual N/C ratio, and NC, the N/C ratio resulting in a reallocation of half its maximum value for a par- ticular compartment. Nitrogen from root uptake and from reallocated N is distributed with the same allocation. Foliar uptake of nitrogen is as- sumed to be a fraction of atmospheric deposition, and is also distributed to all tree compartments.
Litterfall is calculated using first-order rate constants for branches, and fine and coarse roots. Current, lst, 2nd, 3rd and older year cohorts of needles are distinguished, with litterfall linearly increasing with needle age. Sapwood cohorts reaching 15 years of age are transferred to dead heartwood. Model structure describing allocation to tree compartments is illustrated in Fig. 2.
Root-uptake of ammonium and nitrate is as- sumed to result from both mass-flow uptake and active uptake, the latter being simulated with Michaelis-Menten kinetics. Concentration gradi-
260 D. uan Dam, N. uan Breemen /Ecological Modelling 79 (1995) 255-275
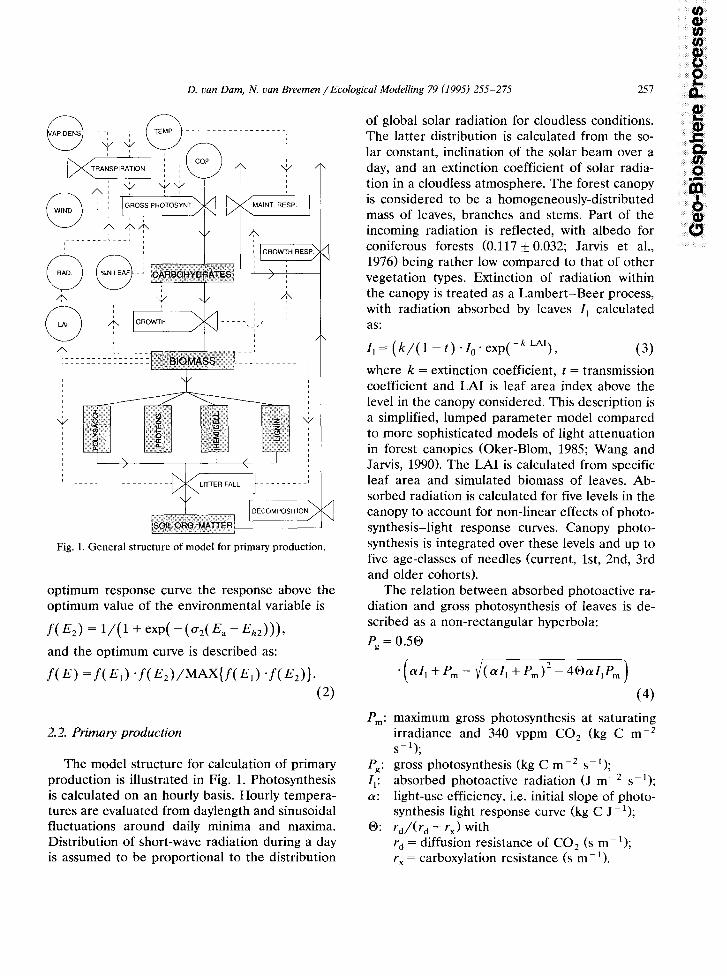
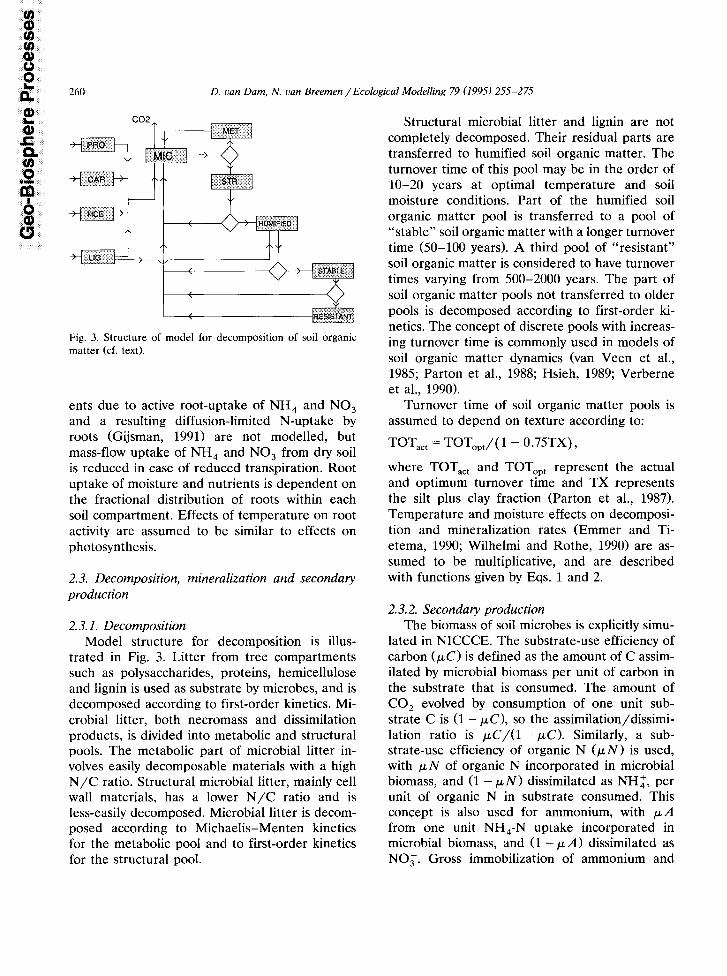
Fig. 3. Structure of model for decomposition of soil organic matter (cf. text).
ems due to active root-uptake of NH, and NO, and a resulting diffusion-limited N-uptake by roots (Gijsman, 1991) are not modelled, but mass-flow uptake of NH, and NO, from dry soil is reduced in case of reduced transpiration. Root uptake of moisture and nutrients is dependent on the fractional distribution of roots within each soil compartment. Effects of temperature on root activity are assumed to be similar to effects on photosynthesis.
2.3. Decomposition, mineralization and secondary production
2.3.1. Decomposition Model structure for decomposition is illus-
trated in Fig. 3. Litter from tree compartments such as polysaccharides, proteins, hemicellulose and lignin is used as substrate by microbes, and is decomposed according to first-order kinetics. Mi- crobial litter, both necromass and dissimilation products, is divided into metabolic and structural pools. The metabolic part of microbial litter in- volves easily decomposable materials with a high N/C ratio. Structural microbial litter, mainly cell wall materials, has a lower N/C ratio and is less-easily decomposed. Microbial litter is decom- posed according to Michaelis-Menten kinetics for the metabolic pool and to first-order kinetics for the structural pool.
Structural microbial litter and lignin are not completely decomposed. Their residual parts are transferred to humified soil organic matter. The turnover time of this pool may be in the order of lo-20 years at optimal temperature and soil moisture conditions. Part of the humified soil organic matter pool is transferred to a pool of “stable” soil organic matter with a longer turnover time (50-100 years). A third pool of “resistant” soil organic matter is considered to have turnover times varying from 500-2000 years. The part of soil organic matter pools not transferred to older pools is decomposed according to first-order ki- netics. The concept of discrete pools with increas- ing turnover time is commonly used in models of soil organic matter dynamics (van Veen et al., 1985; Parton et al., 1988; Hsieh, 1989; Verberne et al., 1990).
Turnover time of soil organic matter pools is assumed to depend on texture according to:
TOT,,, = TOT,& 1 - 0.75TX),
where TOT,,, and TOT,,, represent the actual and optimum turnover time and TX represents the silt plus clay fraction (Parton et al., 1987). Temperature and moisture effects on decomposi- tion and mineralization rates (Emmer and Ti- etema, 1990; Wilhelmi and Rothe, 1990) are as- sumed to be multiplicative, and are described with functions given by Eqs. 1 and 2.
2.3.2. Secondary production The biomass of soil microbes is explicitly simu-
lated in NICCCE. The substrate-use efficiency of carbon (PC) is defined as the amount of C assim- ilated by microbial biomass per unit of carbon in the substrate that is consumed. The amount of CO, evolved by consumption of one unit sub- strate C is (1 - PC>, so the assimilation/dissimi- lation ratio is pC/(l -PC). Similarly, a sub- strate-use efficiency of organic N (E.LN) is used, with PN of organic N incorporated in microbial biomass, and (1 - p.N) dissimilated as NH:, per unit of organic N in substrate consumed. This concept is also used for ammonium, with PLA from one unit NH,-N uptake incorporated in microbial biomass, and (1 - PA) dissimilated as NO;. Gross immobilization of ammonium and
D. van Dam, N. uan Breemen /Ecological Modelling 79 (1995) 255-275 261 r;:
0
6 a 10 12 14
C/N RATIO MICROBIAL POPULATION
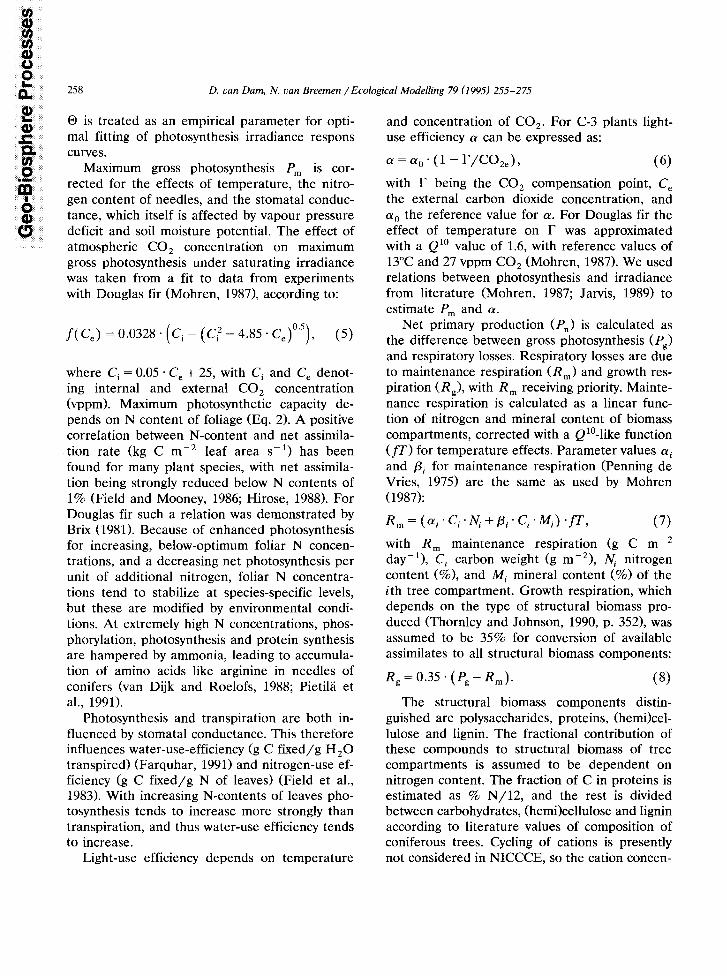
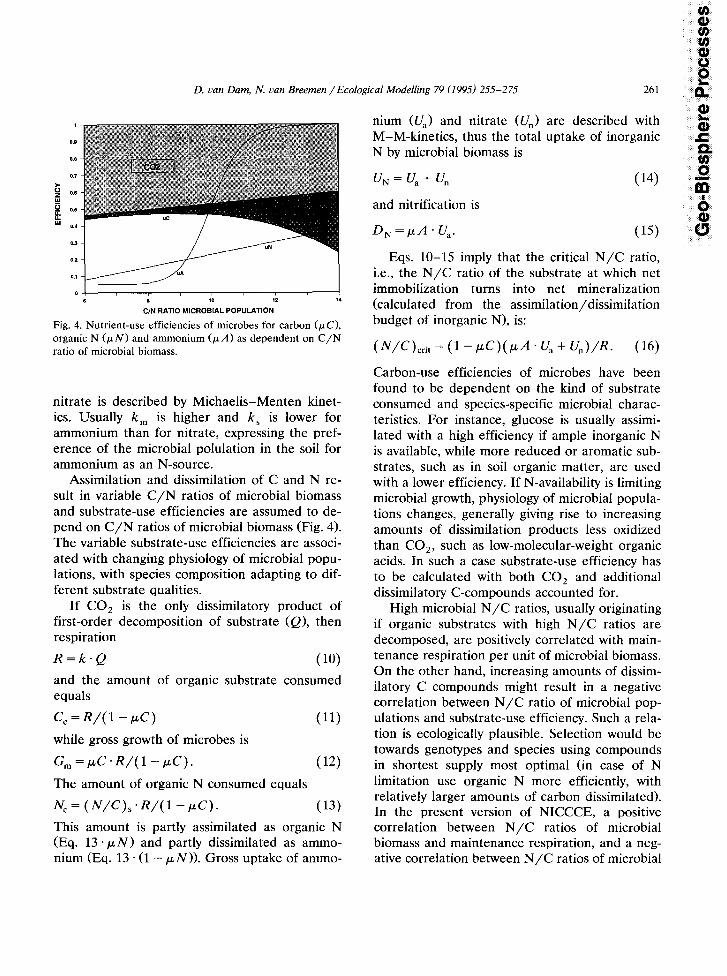
Fig. 4. Nutrient-use efficiencies of microbes for carbon (PC), organic N &N) and ammonium (PA) as dependent on C/N ratio of microbial biomass.
nitrate is described by Michaelis-Menten kinet- ics. Usually k, is higher and k, is lower for ammonium than for nitrate, expressing the pref- erence of the microbial polulation in the soil for ammonium as an N-source.
Assimilation and dissimilation of C and N re- sult in variable C/N ratios of microbial biomass and substrate-use efficiencies are assumed to de- pend on C/N ratios of microbial biomass (Fig. 4). The variable substrate-use efficiencies are associ- ated with changing physiology of microbial popu- lations, with species composition adapting to dif- ferent substrate qualities.
If CO, is the only dissimilatory product of first-order decomposition of substrate <Q>, then respiration
R=k.Q (10) and the amount of organic substrate consumed equals
c, =R/(l -/K) (11)
while gross growth of microbes is
G,,,=/_K.R/(l -/_X). (12)
The amount of organic N consumed equals
N,= (N/C);R/(l -/_LC). (13) This amount is partly assimilated as organic N (Eq. 13 . pN) and partly dissimilated as ammo- nium (Eq. 13 . (1 - pN)). Gross uptake of ammo-
nium (U,) and nitrate (U,,) are described with M-M-kinetics, thus the total uptake of inorganic N by microbial biomass is
u, = u, + u,
and nitrification is
(14)
D,=pA.U,. (15)
Eqs. lo-15 imply that the critical N/C ratio, i.e., the N/C ratio of the substrate at which net immobilization turns into net mineralization (calculated from the assimilation/dissimilation budget of inorganic N), is:
(N/C),,,,=(I-ELC)(E.LA.U~+U,)/R. (16)
Carbon-use efficiencies of microbes have been found to be dependent on the kind of substrate consumed and species-specific microbial charac- teristics. For instance, glucose is usually assimi- lated with a high efficiency if ample inorganic N is available, while more reduced or aromatic sub- strates, such as in soil organic matter, are used with a lower efficiency. If N-availability is limiting microbial growth, physiology of microbial popula- tions changes, generally giving rise to increasing amounts of dissimilation products less oxidized than CO,, such as low-molecular-weight organic acids. In such a case substrate-use efficiency has to be calculated with both CO, and additional dissimilatory C-compounds accounted for.
High microbial N/C ratios, usually originating if organic substrates with high N/C ratios are decomposed, are positively correlated with main- tenance respiration per unit of microbial biomass. On the other hand, increasing amounts of dissim- ilatory C compounds might result in a negative correlation between N/C ratio of microbial pop- ulations and substrate-use efficiency. Such a rela- tion is ecologically plausible. Selection would be towards genotypes and species using compounds in shortest supply most optimal (in case of N limitation use organic N more efficiently, with relatively larger amounts of carbon dissimilated). In the present version of NICCCE, a positive correlation between N/C ratios of microbial biomass and maintenance respiration, and a neg- ative correlation between N/C ratios of microbial
f! 1 8
.1
Pp & c5
262 D. uan Dam, N. uan Breemen /Ecological Model&g 79 (1995) 255-275
biomass and production of dissimilatory organic C-compounds has been assumed (Fig. 4).
The substrate-use efficiency of ammonium is described with a biological switch function:
PA = PAmin + ( PAmax - PAmin)
x(Nc;/(Nc;+Nc,“)), (17)
where PA,,,~,, and PA,, are minimum and maxi- mum ammonium-use efficiencies, NC,,, is the N/C ratio of the microbial population, NC, is the N/C ratio for which p A = &Am, - pA,,)/2, and exponent a determines the steep- ness of the switch function. Stated differently, we assume that in forest ecosystems with a microbial population with a low N/C ratio (dominated by fungi, decomposing substrates with low N-con- centrations such as hemicellulose and lignin, in an environment with low ammonium concentra- tions) nitrification will be limited, whereas in N-saturated ecosystems (with a larger bacterial part of the microbial population) a large part of the gross ammonium immobilization will be nitri- fied.
Microbial C-efficiencies and gross nitrogen transformations for litter from one of the NI- TREX research sites in the Netherlands (Speuld) have been determined by Tietema and Wessel (19911, and were used to estimate efficiency pa- rameters PA and PC as used in NICCCE. Fur- ther research, in a gradient of atmospheric N-in- put present between NITREX sites, is needed to investigate relations between N/C ratios of mi- crobial populations and their nutrient-use effi- ciencies.
It should be noted that autotrophic and het- erotrophic nitrification are not simulated sepa- rately; both types of nitrification are included in the concept of a variable ammonium-use effi- ciency, depending on the N/C ratio of microbial populations developing on substrates with differ- ent quality. Autotrophic, ureolytic nitrification (de Boer and Laanbroek, 1989; de Boer et al., 1989) has been described for acid forest soils. However, heterotrophic nitrification by bacteria and fungi in acid forest soils is also widespread, and de- pendent on metabolism of organic N (Focht and Verstraete, 1977; Kuenen and Robertson, 1988).
Ammonium-use efficiency of autotrophic nitri- fiers is extremely low, because nearly all ammo- nium is used for energy aquisition. In the absence of heterotrophic nitrification, ammonium-use ef- ficiency would equal I/(1 + N), with I = gross ammonium immobilization by heterotrophs, and N = nitrification by autotrophic nitrifiers.
Denitrification is modelled as being dependent on soil moisture potential, soil temperature and nitrate concentration using Michaelis-Menten ki- netics. “Potential denitrification” is multipled by these environmental effects to arrive at an esti- mate of actual denitrification.
2.4. Transport between soil compartments
Convective transport of solutes (ammonium, nitrate and chloride) is directly linked with mois- ture transport. Dispersive fluxes are included in the convective/dispersive transport equations ac- cording to:
Qdis = &/ax . (L . vp + D * p . e-y”),
with
(18)
&/ax = concentration gradient; L= dispersivity (ml;
- 2:
pore water velocity (m s- ‘1; D, . @ * T = effective diffusion coeffi- cient cm2 day-‘);
DO= diffusion coefficient in pure liquid (m2 day-‘);
T= tortuosity; @= volumetric water content (m3 mp3);
p and y empirical constants. Average concentrations of adjacent compart-
ments from a previous timestep are used to calcu- late upward or downward transport. Transport by diffusion between soil compartments is calculated from the product of concentration gradients and diffusion coefficients. Diffusion coefficients are corrected for temperature and tortuosity, the lat- ter being a function of soil water potential. Diffu- sion is usually of minor importance compared to convective/dispersive transport, but was espe- cially included in the transport equations to ac- count for its effect on isotope fractionation. Ad- sorbtion of NH, is simulated with a Langmuir isotherm.
D. van Dam, N. van Breemen /Ecological Modelling 79 (I 995) 255-275 263
Above-ground tree litter enters an organic sur- face litter (L-layer) with a short turn-over time (0.5-l year), and is then transferred to the more humified FH-layer. Bioturbation is assumed to be responsible for a first-order rate transfer of mate- rial from the FH-horizon to the next lower min- eral compartment of the soil profile. The thick- ness of L- and FH-layers is the result of litter input, decomposition, transfer to a next compart- ment, and bulk density.
3. Isotope ratios and kinetic isotope effects
The natural abundance of 15N in atmospheric N, (100 al5 N/(“N + l4 N)) is 0.3663 f 0.0004 atom% (lsN/14N = 0.0036765). It is used as a standard for mass-spectrometric determinations of “N content. Natural abundance of “N in various compartments of ecosystems (Shearer et al., 1978; LCtolle, 1980; Shearer and Kohl, 1986; Nadelhoffer and Fry, 1988; Gebauer and Schulze, 1991) is usually different from “N-abundance of atmospheric N, due to isotope fractionation. With R representing lsN/14N ratios, “N abundance is conveniently expressed as a 61sN-value (%o);
al'N = (LmpdRstan~ar~ - 1) . 1000. (19)
In NICCCE isotope fractionation is treated as a dynamic process, as opposed to steady-state mathematical models of isotope fractionation ac- companying nitrogen transformations (Shearer et al., 1974). Fluxes of 15N are modelled with similar
process formulations as for total N (14N + 15N), but accounting for different 15N/(15N + 14N) ra- tios in various pools, and for S1’N in experimen- tal input. In NICCCE the “N/(l’N + 14N) iso- tope ratio is denoted as IR. This ratio is calcu- lated for each pool after each timestep. Fluxes of total N (J > are calculated first, and concurrent fluxes of “N are calculated as J1sN = J, IR.
Kinetic isotope effects (Letolle et al., 1980; Mariotti et al., 1981) are accounted for by assign- ing isotope fractionation factors to rates of vari- ous processes of nitrogen turnover. Isotope frac- tionation takes place because usually the heavier isotope has a lower reaction rate due to a higher binding energy, and diffuses more slowly (result- ing in a lower collission frequency). For a reac- tion of any order an isotope fractionation factor P = k,/k, is defined, with k, and k, reaction rate constants for 14N and “N respectively. Re- sulting isotope discrimination (Y = 1 - p and thus k, = k,(l - a). Reaction rates for samples con- taining both 14N and “N (K) are essentially equal to reaction rates for 14N (k,). This is illus- trated with an example; let the ratio between 15N and 14N + “N be 0.004, and let the isotope dis- crimination against 15N have a (high) value of 0.050. For a first-order reaction resulting fluxes are:
J, = k, . QT. 0.996
J,=k,.Q,.0.004.(1-0.050)
/,=k,.Q,.0.99898=K.Q,
Table 1 Procedure to calculate isotope ratios in NICCCE model
Pool Rate constant
1 TOTN = 14N + 15N K 2 14N = (l/IR - 1) .15N k,:=K
Flux
JA = K. TOTN (auxilliary value) K. (l/IR - 1) .15N K. (l/IR - 1). IR . TOTN
3 15N = IR . (14N + “N)
2+3 TOTN
k,=k,.(l-a)=K.p =J,.(l -IR) K.~.IR.(~~N+~~N) =K.p.IR.TOTN =FLN.P.ZR K.IR.(l/IR- 1 +p).TOTN K.IR.(l/IR-a).TOTN =FLN-(l-a.IR)
The ratio between 15N and 14N + 15N is denoted as IR, p is the kinetic isotope fractionation factor, and LY = 1 - p is the isotope discrimination factor of 15N with respect to 14N.
264 D. uan Dam, N. uan Breemen /Ecological Modelling 79 (1995) 255-275
where J, = flux of the light isotope (14N), J, = flux of the heavy isotope (15N), Jr = sum of fluxes of both isotopes, and Qr = sum of poolsizes of both isotopes (Qr + Qn).
As the ratio between 15N and 14N + 15N in- creases, say to 10% (615N = 29220, the ratio between K and k, decreases to 0.995. In NIC- CCE the value for k,, i.e., the reaction rate of 14N, was assumed to be equal to K, i.e., the overall reaction rate of (14N + “N). The proce- dure followed in the model to calculate isotope fractionation is indicated in the scheme pre- sented in Table 1. An auxilliary value for the total flux of 14N + 15N (J,) is calculated first. The fluxes of 14N and 15N are calculated as JA. (1 - ZR) and JA. /3 * IR respectively, and the total flux of N is recalculated as Jr = JA. (1 - (Y . ZR). After each timestep fluxes of total N and 15N to and from a pool will result in new values for IR, calculated as:
ZR = (Q, + J,(in) - Ju(out))
/(Q, + J,(in) - Jdout)). Instantaneous fluxes during infinitely small timesteps as indicated in Table 1 can be calcu- lated as k. Q. For discrete timesteps fluxes are calculated as:
Q, - Q,,,, = Qt. Cl- eekAr). Isotope ratios during a timestep are estimated
as IR, + 0.5 *(IR,_A, - IR,), using a finite differ-
Table 2 Processes giving rise to isotope fractionation included in NICCCE
ence calculation scheme. Isotope fractionation is simulated for nitrogen and carbon transforma- tions indicated in Table 2. The isotope fractiona- tion factors apply to “kinetic” isotope fractiona- tion, resulting from irreversible, one-way reac- tions. For equilibrium reactions, such as cation exchange of ammonium, the equilibrium fraction- ation is equal to the ratio of the kinetic isotope effects of forward and backward reactions. Equi- librium fractionations are also involved in the CO, - CO,. aq - HCO; - CO:- system, influ- encing 13C/14C ratios in the atmosphere (Mook, 1986). Isotope fractionation effects for carbon included in our model apply to photosynthesis of C-3 and C-4 plants with a discrimination of about - 18 and -4%o with respect to atmospheric CO, (613C about -7.5%0), and to decomposition of soil organic matter (discrimination about - 3%0).
4. Heat and water transport
4.1. Compartmentalization and time discretization
Transport of water from aboveground biomass to the atmosphere is described with the Penman-Monteith equation. Water and heat transport in the soil is described with Richards’ and Fourier equations, combined with energy and mass conservation. The soil profile is divided into layers of varying thickness, with different physical
Process Range of isotope discrimination References
nitrification of NH, 0.000-0.040 mineralization of organic N 0.002-0.020 uptake of NH, and NO, (plants) 0.000-0.027 uptake of NH, and NO, (microbes) 0.005 denitrification 0.020-0.030 cation exchange of ammonium 0.001 N-redistribution to tree compartments 0.000-0.015 primary production C-3 plants 0.017-0.025 primary production C-4 plants 0.006-0.010 respiration by soil microbes 0.003 diffusion 1 - (D,/D,)“.5
[1,3,81 [II h91 131 [1,4,81 [3,71 [21 [91 [91 [61
[l] Mariotti et al., 1981; [2] Gebauer and Schulze, 1989; 131 Delwiche and Steyn, 1970; [4] Blackmer and Bremmer, 1977; [5] Mariotti et al., 1982; [6] Bertram, 1986; [7] Karamanos and Rennie, 1978; [8] Shearer and Kohl, 1991; [9] Farquhar (1989). D, and D, denote diffusion coefficients of light and heavy isotopes.
D. uan Dam, N. van Breemen /Ecological Modelling 79 (1995) 255-275 265
characteristics determining water and heat trans- port. To reduce numerical dispersion, the thick- ness of upper layers is required to be less than 5 cm, while the thickness of the deepest layers to calculate heat transport may be as thick as 1 m. A litter layer is taken into account if its thickness exceeds 2 cm. With litter layers thinner than 2 cm a steady state between input and output to the next lower mineral layer is assumed in order to reduce execution time of the model. A snow cover (> 2 cm> can be simulated as well. If throughfall fluxes exceed maximum infiltration capacity, ponding is simulated. Runoff will occur if the depth of ponding exceeds some specified maximum value. Aboveground biomass is consid- ered as one homogeneous compartment for tem- porary storage of intercepted precipitation. Heat capacity of the aboveground compartment is not considered.
An explicit, forward-difference scheme of inte- gration (Euler method) is applied. However, de- pending on boundary conditions (global radia- tion, air temperature, precipitation), numerically- stable flux values may not be obtained at rela- tively large time and small depth intervals. For optimal execution time, temporal integration in- tervals are made dependent on fluxes. A first estimate of maximum timestep is obtained from its value during a previous day and the amount of precipitation during the current day. For each time interval accepted solutions involve fluxes of water and heat to or from any compartment less than 20% of pools. Time steps are allowed to increase 25% compared to values for a preceding day, while maximum time step is 1 hour. In case of unstable solutions reiteration is neccessary, and time step is decreased by 50%, starting with conditions of pools at the beginning of a day.
4.2. Boundary conditions
Daylength is calculated as a function of lati- tude and the sun’s declination, assuming a circu- lar earth’s orbit. Maximum and minimum daily air temperatures and daylength are used to gen- erate a continuous, time-dependent function of temperature. Temperature during a day is calcu-
lated with sinusoidal functions for three separate periods during a day; from midnight to 30 min after sunrise (minimum), from this time to 14:00 hours (maximum), and from 14.00 h to midnight. The distribution of global short-wave radiation during a day is calculated from solar inclination. Maximum solar radiation during a day is deter- mined from the solar constant and an extinction coefficient for solar radiation in a cloudless atmo- sphere. The fractions of direct and diffuse short- wave radiation are calculated from the ratio be- tween maximum and actually observed values of global short-wave radiation. Vapour density is calculated from mean daily relative humidity, and variation of relative humidity during a day is obtained from the ratio of mean daily relative vapour density and saturated vapour density cor- responding to the varying diurnal temperature. Wind speed is assumed to vary sinusoidally over a day, with a seasonally varying amplitude. Up to 3 individual rain events are generated from daily input values of precipitation. Number of rain- events and rainfall intensity are dependent on seasonal and daily frequency distributions. Rain- fall intensity is calculated on an hourly basis. The stochastic character of rainfall is used to retain non-linear effects of rainfall intensity on inter- ception evaporation, litter evaporation, transpira- tion and soil water transport. Throughfall fluxes of water are simulated, but concentrations of solutes in throughfall are input to the model.
For the deepest soil layer (NL) it is assumed that gradients of hydraulic head and temperature at its upper and lower boundary are equal. Other lower boundary conditions require a time series of input values for hydraulic head and tempera- ture for layer NL + 1. The lower boundary for calculation of soil heat fluxes is chosen at a depth of about 10 m, where the annual fluctuation of temperature is negligible.
4.3. Soil heat jlow
Soil surface temperature is taken to be equal to the temperature of the evaporating surface as calculated from the Penman-Monteith equation. Soil heat flow (Qh) is considered to result from
266 D. uan Dam, N. van Breemen /Ecological Modelling 79 (1995) 255-275
conductive heat flow and convective transport of liquid water (Q,):
Q,,= -K,.i3T/az+C;T.Q,. (20) where: K, = thermal conductivity; C = heat ca- pacity; T = temperature.
Combined with energy conservation within each compartment, with latent heat of freezing or thawing CL,) taken into account as well, this results in:
a(C. T)
at a =-
az
a(T* Qw) az (21)
Heat capacity is calculated from the fractional contribution of minerals, organics, and water (or ice) and their specific heat capacities; the contri- bution of air to heat capacity of a compartment is ignored.
Thermal conductivity of porous materials made up of many constituents is a very complex func- tion of geometry and thermal conductivity of the individual constituents. Thermal conductivity of soil material near saturation (pF0) is derived from literature values (de Vries, 1975; Flint and Childs, 1987), and is a function of bulk density. In the present model a simple empirical relation be- tween soil moisture potential and thermal con- ductivity is used:
K hpF = K,,. (0.04 + l/((pF - 1)” + l)),
forpF>=l, K hpF=KhO-(l-PF).(Khl-KhO),
for pF < 1 (22) with K,, representing thermal conductivity of the soil at pF = 0 and at 10°C. Thermal conduc- tivity of frozen soil is calculated from the volume of ice and dry bulk density.
Rates of freezing and thawing are calculated according to the amount of latent heat involved in these processes, with the convention of zero heat content at 0°C. Heat content resulting from only conductive and convective heat transport is calculated first and negative heat contents will result in freezing if water is still present, whereas ice and concurrent positive values for heat con-
tent will result in thawing with transfer of latent heat from ice to water. Thickness of a snowcover is calculated from bulk density and the water equivalent of snow, with melting of snow being a function of air temperature and global short-wave radiation.
4.4. Evapotranspiration and througfall
Evapotranspiration is calculated with the Pen- man-Monteith equation from data on global ra- diation, temperature, relative humidity and wind speed. Analogies between momentum, sensible heat and latent heat transport are used to calcu- late evapotranspiration. In near-neutral condi- tions of thermal stability wind speed u at height h can be approximated as:
u(z) =(~*/k).ln[(z-d)/z,] (23) where: u * = friction velocity; k = von Karman’s constant (usually taken as 0.4); z = reference height; d = zero-plane displacement; z0 = aerodynamic roughness.
Profile gradients are assumed to be analogous for momentum, potential temperature and spe- cific humidity, and evapotranspiration is calcu- lated as:
hE= A.(R,-G)+D;C;(e,-e).c,
A+~.(l+cJc,) (24)
where: A = latent heat of vaporization of water; R, = net radiation; D, = density of air; C, = specific heat of air at constant pressure; A = gradient of saturated vapour pressure curve at air temperature; e, = saturated vapour pressure; e = actual vapour pressure; c, = surface conductance; c, = aerodynamic conductance; T = psychrometric “constant”; G = soil heat flux.
Net radiation is the sum of incoming global short-wave radiation (0.3-3 km>, reflected short- wave radiation, long-wave thermal radiation (3- 100 pm) from the sky and long-wave radiation emitted from the surface. Because measurements of these radiation compounds are not generally available, net radiation is estimated from an em- pirical regression equation:
R, = R, . p - fRH. fsUN ’ e. aT4. (25)
D. uan Dam, N. uan Breemen /Ecological Modelling 79 (1995) 255-275 267
The coefficient p can be interpreted as being related to reflection of global radiation, fan is a function of relative humidity (fRH = (rh - OS)‘?,
f SUN is a function of relative sunshine duration
(fS”N = (0.05 + DURs,,)0.5), e = emissivity of the surface (0.97), c = Stefan-Bolzman constant and T = air temperature. Eq. 25 resulted in a correlation coefficient of 0.981 between mea- sured and predicted daily net radiation above short grass vegetation at Wageningen for six years (1986-1992) of analyzed data.
Aerodynamic conductance is calculated as (Businger, 1956):
c,=k’au/(ln[(z-d)/zo12). (26)
For coniferous forests values for z. = h .0.076 f 0.047, and values for d = h .0.78 f 0.09 have been reported (Jarvis et al., 1976). In addition to aero- dynamic conductance a surface conductance pa- rameter is required to calculate evapotranspira- tion with the Penman-Monteith equation. A day-time average value for surface conductance of coniferous forest is some 0.008-0.013 m s-l (Shuttleworth, 1989), whereas aerodynamic con- ductance is usually much higher, 0.04-0.20 m s- ‘. As a consequence surface conductance has usu- ally an overriding influence, except for periods with interception evaporation. Surface conduc- tance has been shown to be dependent on vapor pressure deficit, solar radiation, temperature and water potential in the soil (Meinzer, 1982a,b; Avissar et al., 1985; Stewart, 1988; Dickinson et al., 1991; Avissar and Pielke, 1991). Following Avissar and Pielke (1991) surface conductance is described as:
c, = (cm + (CM - %I) .fR .fr .fv.fn)/%, (27)
where c, = minimal conductance which occurs through the leaf cuticle and stomata when stom- ata are maximally closed, C~ = maximal conduc- tance when stomata are completely opened. Each of the four functions refers to effects of environ- mental variables on stomata1 conductance, R for radiation, T for temperature, I/ for vapor density deficit and fl for soil water potential. The effect of soil water potential on surface conductance is adapted from the SWACROP model (Wesseling
et al., 1989), with surface conductance being re- duced for decreasing soil moisture potential (a) according to:
fa = 1 - (log( -n)“)/(4.2’), (28)
with b being a curvature parameter. In this equa- tion R is integrated over the rooting zone, with the fractional distribution of roots in each soil compartment taken into account, while reduced uptake from dry layers is partly compensated for by increased uptake from layers with higher mois- ture potential. It is generally recognized that sur- face conductance of forest stands is dependent on stand age. We used this empirical finding by including it in a logistic function relating c, with stand age.
It should be noted that surface conductance c, as used in the Penman-Monteith equation differs from leaf conductance, because the canopy is made up of individual leaves with leaf conduc- tances in parallel. The conductance for the whole canopy can be estimated to be P,/LAI smaller than that of a representative leaf, with a so-called shelter factor P, calculated from the empirical expression P, = 0.3 . LA1 + 1.2 (Mascart, 1991).
The saturation vapor pressure at the tempera- ture of the evaporating surface is calculated using Teten’s formula. Temperature of the evaporating surface is calculated as:
T=T. + (R,-G).(c,‘+c,‘)-h(es-e) s air ++Y(~+c,/c,)
(29) Evapotranspiration and surface temperature are calculated in an iterative loop to correct for the influence of surface temperature on emission of long-wave radiation. Moreover iteration is used to account for soil heat flux G, which depends on temperature of the evaporating surface calculated in a previous timestep.
Evaporation of intercepted water is calculated with a one-layer canopy model, using a canopy storage capacity (s) and free throughfall coeffi- cient (f > (Rutter et al., 1971, 1975). Precipitation (P) reaching the canopy (1 -f >. P is input to the canopy storage compartment (actual storage CS), while interception evaporation (i) and canopy
268 D. uan Dam, N. uan Breemen /Ecological Modelling 79 (1995) 255-275
drip (d) is output from this compartment. Surface conductance is appreciably enhanced for a wet canopy as compared to dry conditions. Surface conductance for a (partly) wet canopy is de- scribed as:
‘dry + ‘wet = (1 - CS/s) . c, + (CS/s)O.’ . CM. w
(30)
where w = ratio of surface conductance for a completely saturated canopy and maximum sur- face conductance when dry. Evapotranspiration is divided between transpiration and interception evaporation, with interception evaporation calcu- lated as:
INTEV = A E . c,,/( cdry + ~,,a) (31)
Potential soil evaporation is approximated from the fraction of global radiation reaching the for- est floor (cf. Eq. 3). Potential soil evaporation is reduced as a function of soil moisture tension of the litter layer to arrive at actual soil evaporation.
Transport of soil moisture between soil com- partments (saturated and unsaturated upward and downward transport) is simulated with a Richards’ equation. Moisture content 0 from a previous timestep is used to calculate hydraulic head and hydraulic conductivity, which are both dependent on 0. Soil moisture potential and hydraulic con- ductivity as a function of moisture content (parametrized according to van Genuchten, 1980) are derived from a data base with transfer func- tions between conductivity and soil texture/ organic matter content (W&ten et al., 1986).
5. Model applications
NICCCE has been used for simulation of ni- trogen cycling in two NITREX-sites, i.e., Speuld in The Netherlands and the Solling site in Ger- many (Bredemeier et al., 1994). Here model ap- plication is illustrated for the Speuld site.
Speuld has been a major research location within the Dutch Priority Programme on Acidifi- cation (Heij and Schneider, 1991; van Breemen and Verstraten, 1991). The forest stand is an even-aged plantation, planted in 1962 as two-
year-old seedlings, of Douglas fir (Z’seudotsugu menziessi) without undergrowth. Soils are Typic Dystrochrepts developed on ice-pushed Rhine deposits with a sandy loam and loamy sand tex- ture. Monitoring of atmospheric deposition, soil solution concentrations and nutrient turnover in biomass compartments started in 1987 (van der Maas, 1990). In January 1990 transparent roofs were constructed, 2-3 m above the forest floor to intercept throughfall water. Collected throughfall from the roofs is added to the forest floor, but with NH,, NO, and SO, excluded for a “roof clean” treatment. Soil solution concentrations and nutrient contents in needles have been monitored since June 1990 in three plots; a “roof clean”, “roof ambient” and control plot (van Dijk et al., 1991).
NICCCE has been calibrated for the Speuld site, using meteorological data and measured throughfall concentrations collected during 1987, 1988 and 1989 (van der Maas, 1990) as input to the model. Soil physical characteristics (pF-curves and unsaturated hydraulic conductivity) and total C and N content in the soil were derived from Tiktak et al. (1988). Initial conditions in biomass compartments and root distribution are from Ev- ers (1990), Olsthoorn (1991), and Olsthoorn and Tiktak (1991).
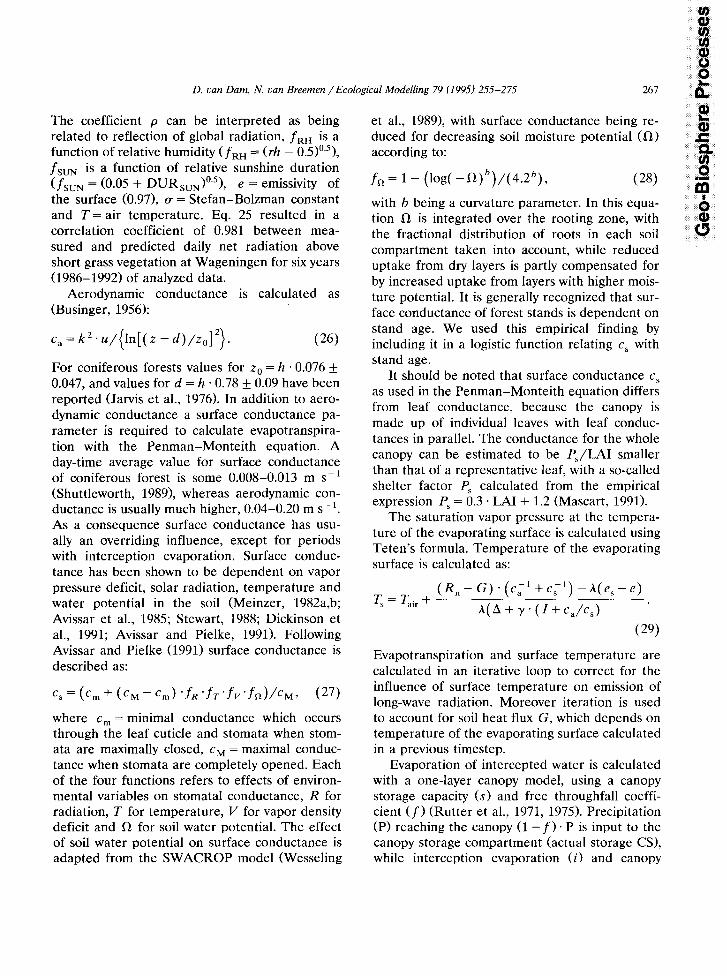
Measured soil temperatures at 90 and 200 cm depth are shown in Fig. 5. Measured values showed only minor differences between four
TIME (pa’)
Fig. 5. Measured and simulated (bold lines) soil temperature at 90 and 200 cm depth.
D. van Dam, N. van Breemen /Ecological Modelling 79 (1995) 255-275 269
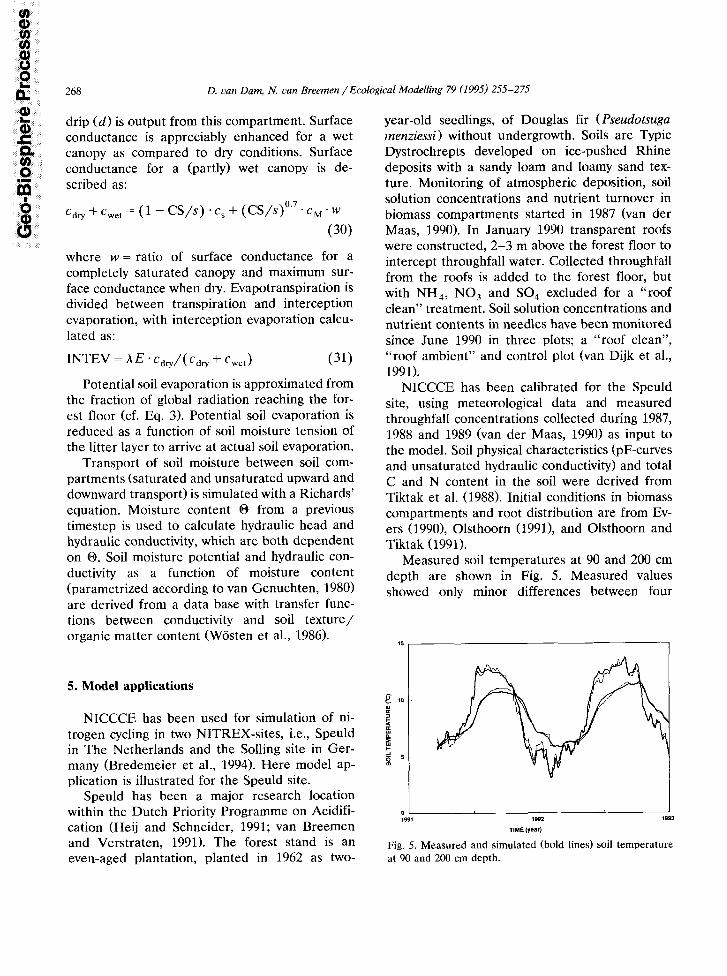
Fig. 6. Precipitation, throughfall and interception evaporation (cumulative values). Simulated throughfall is indicated with a bold line. Interception is calculated as the difference between throughfall (four replicate funnels) and precipitation.
replicate sensors. The average difference be- tween measured and simulated soil temperature was less than 0.2”C. At a depth of 90 cm the lower variance of simulated compared to ob- served temperatures at a time scale of a few days is due to numerical dispersion. However, nodal distances were not decreased any further, be- cause execution time of the model would increase disproportionally compared to a slightly better model performance.
1991 1992 1993
TIME (year)
Fig. 7. pF-values of soil moisture at 90 cm depth (three replicate sensors) and simulated drainage. The bold lines represent simulated pF-values at 90 cm (lower curve) and 60 cm depth (upper curve).
Measured and simulated throughfall are pre- sented in Fig. 6. Seasonal and yearly throughfall amounts were predicted very well, and apprecia- ble deviation from measured values was observed only for a few individual weekly samplings.
Soil water potential at a depth of 90 cm (i.e., below rooting depth, except for minor amounts of
Table 3 Most sensitive model parameters ranked according to Kolmogorov-Smirnov d-statistic
Parameter name Tested values Nitrate leaching N accum. trees
ksmm NRedLf LiUseEf SLA kmrn NDisBr CEff NRedSt ksrn RTRtf
min. max. optm.
40 60 50 27 40 38 24 36 29 82 122 100 24 36 31 49 87 72 45 58 51 20 30 28 97 144 103 80 120 98
optm.
C accum. trees
optm.
Three model outputs
Kolmogorov d-statistic
42 50 52 0.294 33 35 38 0.293 34 29 34 0.276
116 100 100 0.268 30 34 31 0.261 68 68 68 0.259 51 54 51 0.258 22 22 28 0.250
126 119 119 0.240 103 113 113 0.239
ksmm: M-M half-saturation constant for uptake from metabolic pool by soil microbes (g C me3); NRedLf: reallocation of N before abscission of needles (%); LiUseEf: light-use efficiency (pg C J-‘) * 10; SLA: specific leaf area (cm’ g C-‘); kmrn: M-M maximum uptake of nitrate by fine roots (mg NO,-N day-’ (g fine root)-‘)* 10, NDisBr: allocation of N-uptake to branches (%b)* 10; CEff: carbon-use efficiency of microbial population (%o); NRedSt: reallocation of N before hardwood formation (%); ksrn: M-M half-saturation constant for uptake of nitrate by roots (g NO,-N mm3)* 10; RTRtf: residence time of fine roots (yr)* 100.
D. uan Dam, N. uan Breemen /Ecological Modelling 79 (1995) 25.5-275
0
z 40 2 E so
k 20
CARBON USE EFFICIENCY
8
Y # 10
0
SO
SO CARBON USE EFFICIENCY
40
20
0
1 2 3 4 5 CLASS NUMBER OF PARAMETER VALUE
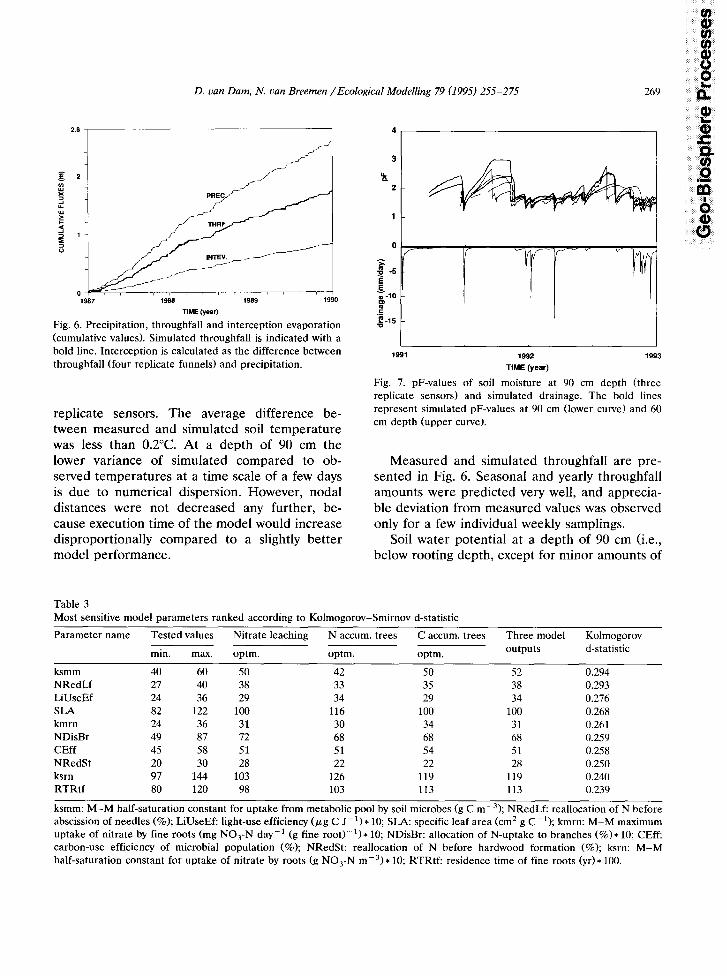
Fig. 8. Distribution of parameter values as derived from Monte-Carlo analysis (164 model runs, 52 parameters varied at random by 20%). (A) Carbon-use efficiency (PC) calibrated for nitrate leaching (80 runs accepted). (B) Carbon-use efficiency (WC) calibrated for three model outputs (see text). (C) Light-use efficiency ((Y) calibrated for three model outputs (see text). Parameter values corresponding to class numbers l-5 are 44.3-47.2, 47.2-49.0. 49.0-50.5, 50.0-51.9, 51.9-56.8 t%) for UC and 2.40-2.72, 2.72-2.86, 2.86-3.01, 3.01-3.21, 3.21-3.60 (pg C J-‘) for (Y.
8 B . . . . . . . . . . . . . . . . . . . . . . . . . . .).
N IN THROUGHFALL EXCLUDED
0 ! 1997 1988 lSS9 1990 ,991
TIME (y-r)
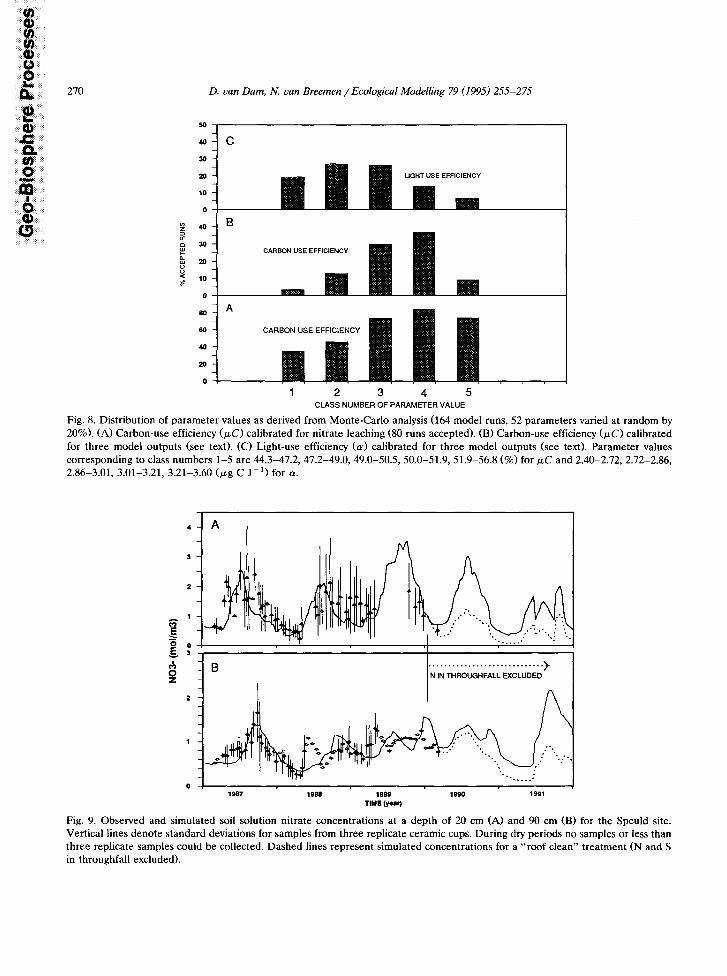
Fig. 9. Observed and simulated soil solution nitrate concentrations at a depth of 20 cm (A) and 90 cm (B) for the Speuld site. Vertical lines denote standard deviations for samples from three replicate ceramic cups. During dry periods no samples or less than three replicate samples could be collected. Dashed lines represent simulated concentrations for a “roof clean” treatment (N and S in throughfall excluded).
D. van Dam, N. van Breemen /Ecological Modelling 79 (1995) 255-275 271
roots penetrating any deeper) as measured with three replicate sensors is shown in Fig. 7. Espe- cially during summer spatial variability of soil water potential is high. Soil water potential is less spatially variable during periods with appreciably drainage, and for these periods measured values were simulated reasonably well.
After calibration of the submodel for heat and water transport uncertainty analysis for the main NICCCE model was carried out by a Monte-Carlo analysis, in which 52 parameters were varied si- multaneously at random by 20%. Three model outcomes were used to constrain parameter val- ues: a.
b.
C.
measured leaching of nitrate-N below rooting depth (3 _+ 0.5 g N me2 yr-‘I, during a 3-year measuring period (1987-1989); net accumulation of N in trees (0.50 + 0.50 g rnp2 yr-‘1; net accumulation of C in trees (35 * 5 g me2 yr-‘1.
Out of a total of 164 model runs 123 runs satis- fied criterion (a> and 29 runs satisfied the three criteria given above simultaneously. Cumulative probability distributions of parameters for re- jected and accepted runs were calculated, and parameters were ranked according to maximum differences between cumulative probability of ac- cepted and rejected runs (Kolmogorov d-statistic). The 10 most-sensitive model parameters from this analysis are given in Table 3. Distributions of parameter values for light-use efficiency and car- bon-use efficiency are shown as an example in Fig. 8.
The modelled soil solution nitrate concentra- tions are shown in Fig. 9, together with the mea- sured concentrations. Model predictions indicate that for a 3-year period (1987, 1988, 1989) 62% of the N-input of 3.62 km01 ha-’ yr-’ (NH, + NO, in throughfall + canopy exchange) is leached be- low a depth of 1 m. Nearly all output of N occurs as nitrate (2.23 km01 ha-’ yr-‘1, with a concur- rent leaching of sulphate and A13+ of 3.11 and 4.57 km01 ha-’ yr-’ respectively (van Breemen and Verstraten, 1991). Simulated nitrate concen- trations with N in throughfall excluded are shown as dashed lines in Fig. 9. In this case the model predicts a rapid decrease of NO,-concentrations
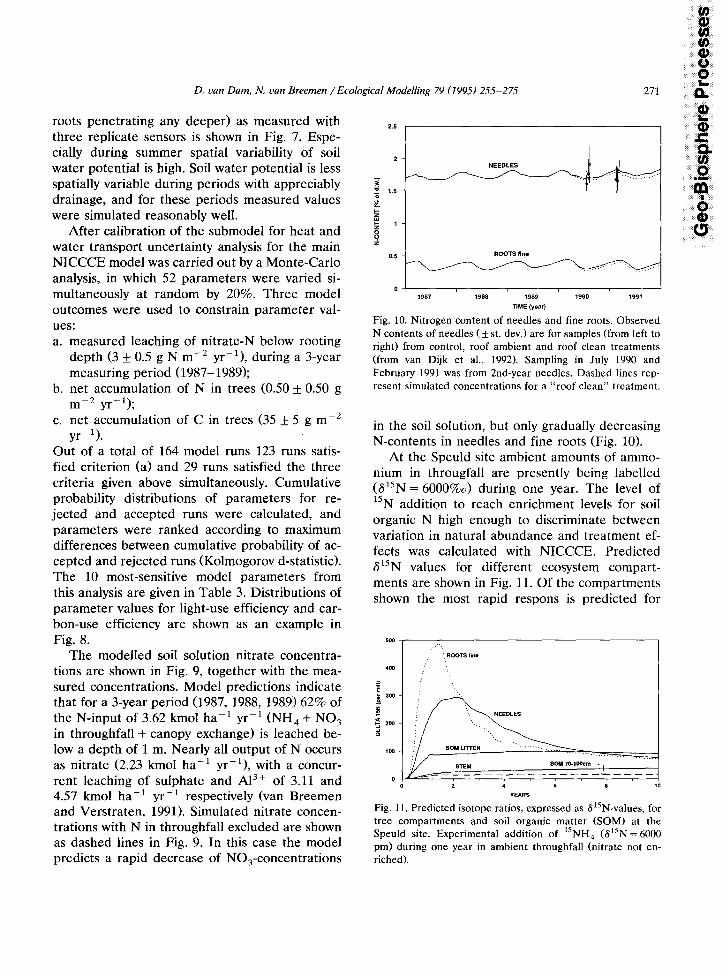
Fig. 10. Nitrogen content of needles and fine roots. Observed N contents of needles ( f st. dev.) are for samples (from left to right) from control, roof ambient and roof clean treatments (from van Dijk et al., 1992). Sampling in July 1990 and February 1991 was from 2nd-year needles. Dashed lines rep- resent simulated concentrations for a “roof clean” treatment.
in the soil solution, but only gradually decreasing N-contents in needles and fine roots (Fig. 10).
At the Speuld site ambient amounts of ammo- nium in througfall are presently being labelled (615N = 6000%0) during one year. The level of 15N addition to reach enrichment levels for soil organic N high enough to discriminate between variation in natural abundance and treatment ef- fects was calculated with NICCCE. Predicted 615N values for different ecosystem compart- ments are shown in Fig. 11. Of the compartments shown the most rapid respons is predicted for
500 .:..
Fig. 11. Predicted isotope ratios, expressed as ~?~‘N-values, for tree compartments and soil organic matter (SOM) at the Speuld site. Experimental addition of 15NH,, (615N = 6000 pm) during one year in ambient throughfall (nitrate not en- riched).
272 D. uan Dam, N. uan Breemen /Ecological Model&g 79 (1995) 255-275
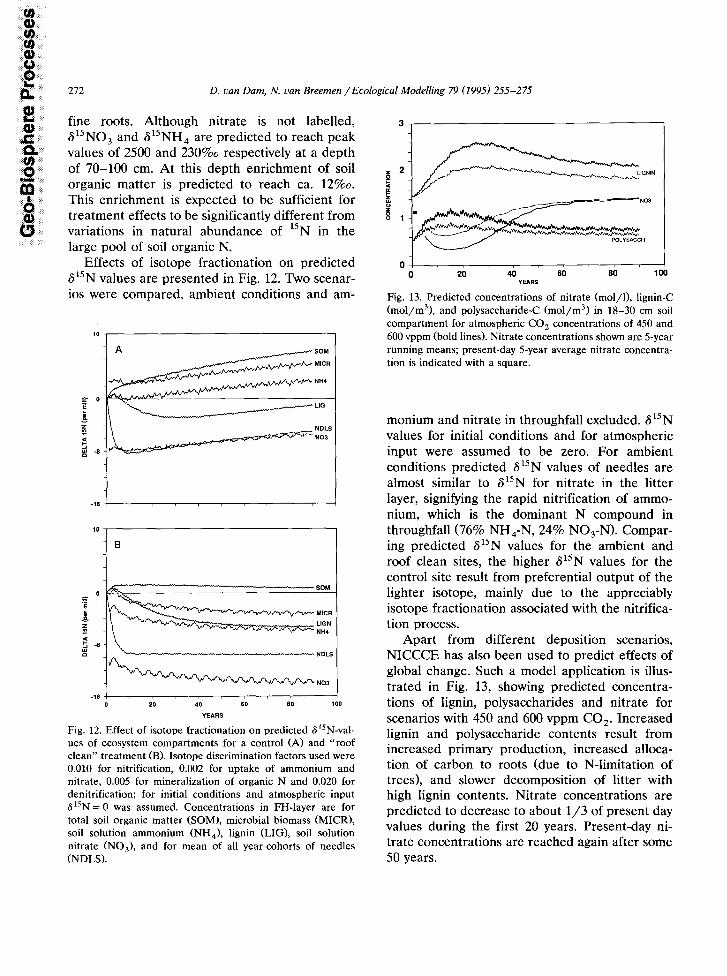
fine roots. Although nitrate is not labelled, 615N0, and 615NH, are predicted to reach peak values of 2500 and 230%0 respectively at a depth of 70-100 cm. At this depth enrichment of soil organic matter is predicted to reach ca. 12%0. This enrichment is expected to be sufficient for treatment effects to be significantly different from variations in natural abundance of 15N in the large pool of soil organic N.
Effects of isotope fractionation on predicted 615N values are presented in Fig. 12. Two scenar- ios were compared, ambient conditions and am-
-16 I
T-----7
Fig. 12. Effect of isotope fractionation on predicted S”N-val- ues of ecosystem compartments for a control (A) and “roof clean” treatment (B). Isotope discrimination factors used were 0.010 for nitrification, 0.002 for uptake of ammonium and nitrate, 0.005 for mineralization of organic N and 0.020 for denitrification; for initial conditions and atmospheric input 615N = 0 was assumed. Concentrations in FH-layer are for total soil organic matter (SOM), microbial biomass (MICR), soil solution ammonium (NH,), lignin (LIG), soil solution nitrate (NO,), and for mean of all year-cohorts of needles (NDLS).
3
e 2
d s 1 f ” 1
0 0 20 40 60 80 1
YEARS
Fig. 13. Predicted concentrations of nitrate (mol/l), lignin-C (mol/m3), and polysaccharide-C fmol/m3) in 18-30 cm soil compartment for atmospheric CO, concentrations of 450 and 600 vppm (bold lines). Nitrate concentrations shown are 5-year running means; present-day 5-year average nitrate concentra- tion is indicated with a square.
monium and nitrate in throughfall excluded. 615N values for initial conditions and for atmospheric input were assumed to be zero. For ambient conditions predicted 615N values of needles are almost similar to 615N for nitrate in the litter layer, signifying the rapid nitrification of ammo- nium, which is the dominant N compound in throughfall (76% NH,-N, 24% NO,-N). Compar- ing predicted S”N values for the ambient and roof clean sites, the higher 615N values for the control site result from preferential output of the lighter isotope, mainly due to the appreciably isotope fractionation associated with the nitrifica- tion process.
Apart from different deposition scenarios, NICCCE has also been used to predict effects of global change. Such a model application is illus- trated in Fig. 13, showing predicted concentra- tions of lignin, polysaccharides and nitrate for scenarios with 450 and 600 vppm CO,. Increased lignin and polysaccharide contents result from increased primary production, increased alloca- tion of carbon to roots (due to N-limitation of trees), and slower decomposition of litter with high lignin contents. Nitrate concentrations are predicted to decrease to about l/3 of present day values during the first 20 years. Present-day ni- trate concentrations are reached again after some 50 years.
D. van Dam, N. van Breemen /Ecological Modelling 79 (I 995) 255-275 273
Calibration has hitherto been performed for conventional r4N data only. At a timescale of a few years net uptake of trees and net changes in the large pool of N in soil organic matter can be measured more accurately by using “N as a tracer. This information, together with data on natural abundance of lSN will be available within a few years, and it is expected that narrower ranges for parameter values will then become available.
Acknowledgments
The work carried out in this project was fi- nanced by the Dutch Ministry of Housing, Physi- cal Planning and Environmental Protection (VROM).
References
Alexander, I.J. and Fairly, RI., 1983. Effects of N-fertilization on populations of fine roots and mycorrhiza in spruce humus. Plant Soil, 71: 49-53.
Avissar, R. and Pielke, R.A., 1991. The impact of plant stomata1 control on mesoscale atmospheric simulations. Agric. For. Meteorol., 54: 353-372.
Avissar, R., Avissar, P., Mahrer, Y. and Brado, B.A., 1985. A model to simulate response of plant stomata to environ- mental conditions. Agric. For. Meteorol., 35: 21-29.
Bertram, H.-G., 1986. Zur Rolle des Bodens im glohalen Kohlenstoffzyklus. Veriiffentlichungen der Naturforschen- den Gesellschaft zu Emden von 1814. Band 8, Serie 3-D3, pp. 1-144.
Blackmer, A.M. and Bremner, J.M., 1977. Nitrogen isotope discrimination in denitrification of nitrate in soils. Soil Biol. Biochem., 9: 73-77.
Bredemeier, M., Tiktak, A. and Van Heerden, C., 1994. The Solling spruce stand - Background information on the dataset. Ecol. Model. (in press).
Brix, H., 1981. Effects of nitrogen fertilizer source and appli- cation rates on foliar nitrogen concentration, photosynthe- sis, and growth of Douglas fir. Can. J. For. Res., 11: 775-780.
Brouwer, R., 1983. Functional equilibrium: sense or non- sense? Neth. J. Agri. Sci., 32: 335-348.
Businger, J.A., 1956. Some remarks on Penman’s equation for the evaporation. Neth. J. Agric. Sci., 4: 77-80.
Cosby, B.J., Hornberger, G.M., Galloway, J.N. and Wright, R.F., 1985a. Modelling the effects of acid deposition: assessment of a lumped-parameter model of soil water and streamwater chemistry. Water Resour. Res., 18: 51-63.
Cosby, B.J., Wright, R.F., Hornberger, G.M. and Galloway, J.N., 1985b. Modelling the effects of acid deposition: esti- mation of long-term water quality responses in a small forested catchment. Water Resour. Res., 21: 1591-1601.
De Boer, W. and Laanbroek, H.J., 1989. Ureolytic nitrifica- tion at low pH by Nitrospira spec. Arch. Microbial., 152: 178-181.
De Boer, W., Duyts, H. and Laanbroek, H.J., 1989. Acid-sen- sitive, chemolitotrophic nitrification in a fertilized, acid heathland soil. II. Effect of organic compounds. Soil Biol. Biochem., 21: 349-354.
Delwiche, C.C. and Stein, P.L., 1970. Nitrogen isotope frac- tionation in soils and microbial reactions. Environ. Sci. Technol., 4: 929-935.
De Vries, D.A., 1975. Heat transfer in soils. In: D.A. de Vries and N.H. Afgan (Editors), Heat and Mass Transfer in the Biosphere, Vol. 1. Wiley, New York, pp. 5-28.
De Vries, W., 1990. Philosopy, structure and application methodology of a soil acidification model for the Nether- lands. In: J. Kamiri (Editor), Impact Models to Assess Regional Acidification. Kluwer Academic Publishers, Dor- drecht, pp. 3-21.
Dickinson, R.E., Henderson-Sellers, A., Rosenzweig, C. and Sellers, P.J., 1991. Evapotranspiration models with canopy resistance for use in climate models, a review. Agric. For. Meteorol., 54: 373-388.
Emmer, I.M. and Tietema, A., 1990. Temperature-dependent nitrogen transformations in acid oak-beech forest litter in the Netherlands. Plant Soil, 122: 193-196.
Evers, P. (Editor), 1990. Impact of air pollution on ecophysio- logical relations in two Douglas fir stands in The Nether- lands. Dutch Priority Programme on Acidification, pro- jects 15, 105a and 105b, 250 pp.
Farquhar, G.D., 1991. Use of stable isotopes in evaluating plant water use efficiency. In: Proc. Stable Isotopes in Plant Nutrition, Soil Fertility and Environmental Studies, Proc. Int. Symp. Vienna, l-5 October 1990. IAEA, Vi- enna, pp. 475-488.
Farquhar, G.D., Ehleringer, J.R. and Hubick, K.T., 1989. Carbon isotope discrimination and photosynthesis. Annu. Rev. Plant Physiol. Plant Mol. Biol., 40: 503-537.
Field, C. and Mooney, H.A., 1986. The photosynthesis- nitrogen relationship in wild plants. In: T.H. Givnish (Edi- tor), On the Economy of Plant Form and Function. Cam- bridge Univ. Press, Cambridge, pp. 25-55.
Field, C., Merino, J. and Mooney, H.A., 1983. Compromises between water-use efficiency and nitrogen-use efficiency in five species of California evergreens. Oecologia, 60: 384-389.
Flint, A.L. and Childs, S.W., 1987. Field procedure for esti- mating soil thermal environments. Soil Sci. Sot. Am. J., 51: 1326-1331.
Focht, D.D. and Verstraete W., 1977. Biochemical ecology of nitrification and denitrification. Adv. Microbial. Ecol., 1: 135-214.
Gebauer, G. and Schulze, E.-D., 1991. Carbon and nitrogen isotope ratios in different compartments of a healthy and a
274 D. uan Dam, N. uan Breemen /Ecological Modelling 79 (1995) 255-275
declining Picea abies forest in the Fichtelgebirge, NE Meinzer, F.G., 1982b. The effect of vapor pressure on stom- Bavaria. Oecologia, 87: 198-207. atal control of gas exchange in Douglas Fir (Pseudofsuga
Gijsman, A., 1990. Nitrogen nutrition and rhizosphere pH of menziesii) saplings. Oecologia, 54: 236-242. Douglas-fir. PhD Thesis, Univ. of Groningen, 132 pp. Mohren, G.M.J., 1987. Simulation of forest growth, applied to
Gundersen, P., 1992. Mass Balance Approaches for Establish- Douglas fir stands in The Netherlands. Thesis, Agricul- ing Critical Loads for Nitrogen in Terrestrial Ecosystems. tural University, Wageningen. UN-ECE Workshop “Critical Loads for Nitrogen”, 6-10 Nadelhoffer, K.J. and Fry, B., 1988. Controls on natural April 1992, Lakeberg, Sweden. nitrogen-15 and carbon-13 abundances in forest soil or-
Heij, G.J. and Schneider, T. (Editors), 1991. Eindrapport ganic matter. Soil Sci. Sot. Am. J., 52: 1633-1640. tweede fase additioneel programma verzuringsonderzoek. Oker-Blom, P., 1985. Photosynthesis of a Scats pine shoot: Report no. 200-09, National Institute for Public Health simulation of the iradiance distribution and photosynthesis and Environmental Protection, Bilthoven, the Nether- of a shoot in different radiation fields. Agric. For. Meteo- lands. rol., 34: 31-40.
Hirose, T., 1988. Modelling the relative growth rate as a function of plant nitrogen concentration. Physiol. Plant., 72: 185-189.
Hsieh, Y.-P., 1992. Pool size and mean age of stable soil organic carbon in cropland. Soil Sci. Sot. Am. J., 56: 460-464.
Olsthoorn, A.F.M., 1991. Fine root density and root biomass of two Douglas-fir stands on sandy soils in the Nether- lands. 1. Root biomass in early summer. Neth. J. Agric. Sci., 39: 49-60.
Jarvis, P.G., 1989. Atmospheric carbon dioxide and forests. Phil. Trans. R. Sot. Lond. B, 324: 369-392.
Jarvis, P.G., James, G.B. and Landsberg J.J., 1976. Coniferous forests. In: J.L. Monteith (Editor), Vegetation and the Atmosphere, Vol. 2 (Case Studies). Academic Press, New York, pp. 171-240.
Olsthoorn, A.F.M. and Tiktak, A., 1991. Fine root density and root biomass of two Douglas-fir stands on sandy soils in The Netherlands. 2. Periodicity of fine root growth and estimation of belowground carbon allocation. Neth. J. Agric. Sci., 39: 61-77.
Kuenen, J.G. and Robertson, L.A., 1987. Ecology of nitrifica- tion and denitrification. In: J.A. Cole and S. Ferguson (Editors), The Nitrogen and Sulphur Cycles. Cambridge Univ. Press, Cambridge, UK, pp. 162-218.
Parton, W.J., Schimel, D.S., Cole, C.V. and Ojima, D.S., 1987. Analysis of factors controlling soil organic matter levels in Great Plains grasslands. Soil Sci. Sot. Am. J., 51: 1173- 1179.
Parton, W.J., Stewart, J.W.B. and Cole, C.V., 1988. Dynamics of C, N, P, and S in grassland soils: a model. Biogeochem- istry, 5: 109-132.
Letolle, R., 1980. Nitrogen-15 in the natural environment. In: P. Fritz and J.C. Fontes (Editors), Handbook of Environ- mental Isotope Geochemistry. Elsevier, Amsterdam, pp. 407-433.
Mikehi, A., 1990. Modeling structural-functional relationships in whole-tree growth: resource allocation. In: R.K. Dixon, R.S. Meldahl, G.A. Ruark and W.G. Warren (Editors), Process Modeling of Forest Growth Responses to Envi- ronmetal Stress. Timber Press, Inc., Portland, OR, pp. 81-95.
Penning De Vries, F.W.T., 1975. The cost of maintenance processes in plant cells. Ann. Bot., 39: 77-92.
Pietila, M., Lahdesmaki, P., Pietilainen, P., Ferm, A., Hyto- nen, J. and Patila, A., 1991. High nitrogen deposition causes changes in amino acid concentrations and protein spectra of the Scats pine (Pinus syluestris). Environ. Pollut., 72: 103-115.
Mariotti, A., Germon, J.C., Hubert, P., Kaiser, P., L&tolle, R.A. and Tardieux, P., 1981. Experimental determination of nitrogen kinetic isotope fractionation: some principles; illustration for the denitrification and nitrification pro- cesses. Plant Soil, 62: 413-430.
Robinson, D., 1986. Compensatory changes in the partitioning of dry matter in relation to nitrogen uptake and optimal variations in growth. Ann. Bot., 58: 841-848.
Rutter, A.J., Kershaw, K.A., Robins, P.C. and Morton A.J., 1971. A predictive model of rainfall interception in forests I. Derivation of the model from observations in some coniferous and hardwood stands. Agric. Meteorol., 9: 367- 384.
Mariotti, A., Mariotti, F., Champigny, M.L., Amarger, N. and Moyse, A., 1982. Nitrogen isotope fractionation associated with nitrate reductase activity and uptake of NO; by pearl millet. Plant Physiol., 69: 880-884.
Mascart, P., Taconet, O., Pinty, J.-P. and Ben Mehrez, M., 1991. Canopy resistance formulation and its effect in mesoscale models: a HAPEX perspective. Agric. For. Me- teorol., 54: 319-351.
Rutter, A.J., Kershaw, K.A. and Robins, P.C., 1975. A predic- tive model of rainfall interception in forests II. General- ization of the model and comparison with observations in some coniferous and hardwood stands. J. Appl. Ecol., vol.: ~~-380.
Shearer, G. and Kohl, D.H., 1986. N -fixation in field settings: Estimations based on natural B N abundance. Aust. J.
Meinzer, F.G., 1982a. Models of steady state and dynamic gas exchange responses to vapor pressure and light in Douglas Fir (Pseudotsuga menziesii) saplings. Oecologia, 55: 403- 408.
Plant Physiol., 13: 699-744. Shearer, G., Duffy, J., Kohl, D.H. and Commoner, B., 1974. A
steady-state model of isotopic fractionation accompanying nitrogen transformations in soil. Soil Sci. Sot. Am. Proc., 38: 315-322.
D. uan Dam, N. uan Breemen /Ecological Modelling 79 (1995) 255-275 275
Shearer, G., Kohl, D.H. and Chien, S-H., 1978. The nitrogen- 15 abundance in a wide variety of soils. Soil Sci. Sot. Am. J., 42: 899-902.
Shuttleworth, W.J., 1989. Micrometeorology of temperate and tropical forest. Phil. Trans. R. Sot. Lond. B, 324: 299-334.
Stewart, J.B., 1988. Modelling surface conductance of pine forest. Agric. For. Meteorol., 43: 19-35.
Thornley, J.H.M. and Johnson, I.A., 1990. Plant and Crop Modelling. A Mathematical Approach to Plant and Crop Physiology. Clarendon Press, Oxford, 669 pp.
Tietema, A. and Wessel, W.W., 1992. Gross nitrogen transfor- mations in the organic layer of acid forest ecosystems subjected to increased atmospheric nitrogen input. Soil Biol. Biochem., 24: 943-950.
Van Breemen, N. and Verstraten, J.M., 1991. Soil acidifica- tion and nitrogen cycling: Summary of research in the Dutch Priority Programme on Acidification. In: G.J. Heij and T. Schneider (Editors), Acidification Research in The Netherlands. Studies in Environmental Science 46. Else- vier, Amsterdam, pp. 289-352.
Tiktak, A., Konsten, C.J.M., Van Der Maas, R. and Bouten, W., 1988. Soil chemistry and physics of two Douglas-fir stands affected by acid atmospheric deposition on the Veluwe, the Netherlands. Dutch Priority Programme on Acidification, Report 03-01.
Van Der Maas, M.P., 1990. Hydrochemistry of two Douglas Fir ecosystems and a heather ecosystem in the Veluwe, The Netherlands. Dutch Priority Programme on Acidifica- tion, Report 102.1-01, Wageningen, 28 pp.
Van Dijk, H.F.G. and Roelofs, J.G.M., 1988. Effects of exces- sive ammonium deposition on the nutritional status and condition of pine needles. Physiol. Plant., 73: 494-501.
Van Dijk, H.F.G., Boxman, A.W. and Roelofs, J.G.M., 1992.
Effects of a decrease in atmospheric deposition of nitro- gen and sulphur on the mineral balance and vitality of a Scats pine and a Douglas fir stand in the Netherlands. Interim Project Report: 1988-1991. Dept. Ecology, Univ. Nijmegen.
Van Genuchten, M.T., 1980. A closed form equation for predicting the hydraulic conductivity of unsaturated soils. Soil Sci. Sot. Am. J., 44: 892-898.
Van Veen, J.A., Ladd, J.N. and Amato, M., 1985. Turnover of carbon and nitrogen through the microbial biomass in a sandy loam and a clay soil incubated with [ 14C(U)]glucose and [“N](NH,),S04 under different moisture regimes. Soil Biol. Biochem., 17: 747-756.
Verberne, E.L.J., Hassink, J., De Willigen, P., Groot, J.J.R. and Van Veen, J.A., 1990. Modelling organic matter dy- namics in different soils. Neth. J. Agric. Sci., 38: 221-238.
Wang, Y.P. and Jarvis, P.G., 1990. Description and validation of an array model - MAESTRO. Agric. For. Meteorol., 51: 257-280.
Wesseling, J.G., Kabat, P., Van Den Broek, B.J. and Feddes, R.A., 1989. SWACROP, Simulation model of the water balance of a cropped soil with different boundary condi- tions including the possibility of drainage and irrigation and the calculation of crop yield. Wageningen, Staring Centre, Simulation Software.
Wilhelmi, V. and Rothe, G.M., 1990. The effect of acid rain, soil temperature and humidity on C-mineralization rates in organic soil layers under spruce. Plant Soil, 121: 197- 202.
Wosten, J.H.M., Bannink, M.H., De Gruijter, J.J. and Bouma, J., 1986. A procedure to indentify different groups of hydraulic-conductivity and moisture-retention curves for soil horizons. J. Hydrol., 86: 133-145.