niagara river eutrophication...
TRANSCRIPT
1
Assessment
of
Eutrophication or Undesirable Algae
Beneficial Use Impairment
in the Niagara River (Ontario) Area of Concern
October 2017
2
Executive Summary
Algae are tiny plant-like organisms that are an important part of the food web as they are
the main source of food for planktivorous fishes and zooplankton. However, when algae are
overabundant (often referred to as an algal bloom) they can cause disruptions to the aquatic
ecosystem, result in fish kills, pose a risk to human health and/or impair recreational enjoyment
of the waterbody (boating, swimming). This is the reason Eutrophication or Undesirable Algae
is listed as one of the 14 potential beneficial use impairments (BUIs) in the Niagara River Area
of Concern (AOC). Pollution from human sources such as municipal and industrial wastewaters,
agricultural runoff, fertilizers on lawns and golf courses, and poorly maintained septic systems
are sources of nutrients that can contribute to “eutrophication”, a term that describes the
enrichment of nutrients within a waterbody. Natural sources of nutrients from sediments (due to
erosion) can also contribute to eutrophication.
The Niagara River is one of 36 remaining AOCs in the Great Lakes due to historical water
quality pollution from human sources. The Remedial Action Plan (RAP) process guides
restoration efforts with the ultimate goal of improved environmental conditions and subsequent
removal of the river from the list of Great Lakes AOCs. Historically, the boundaries of the AOC
included the Niagara River and its entire watershed. In 2012, the Great Lakes Water Quality
Agreement was revised indicating that the focus of AOCs is to include the “Waters of the Great
Lakes and the connecting river systems of St. Mary’s, St. Clair, Lake St. Clair, Detroit, Niagara,
and St. Lawrence at the international boundary or upstream from the point at which the river
becomes the international boundary between Canada and the United States, including all open
and nearshore waters.” The boundary for the Niagara River AOC is now defined as the
connecting channel itself flowing from the mouth of Lake Erie to Lake Ontario. Its tributaries are
considered as a potential source of impairment instead of part of the AOC itself.
The Eutrophication or Undesirable Algae BUI was first listed as impaired in the 1993
Stage 1 RAP Report; however, it was considered in two parts. The Eutrophication component of
the BUI was listed as “Impaired” due to issues in the Welland River; for Undesirable Algae, the
Niagara River AOC and its largest tributary was designated as “Not Impaired” because there
was no evidence of persistent algae. The status of the entire BUI was changed to “Impaired”
during the RAP Stage 2 Update (2009) for the Niagara River and its largest tributary based on
anecdotal evidence of poor water quality and observations of algae in the Welland River. Based
on the refinement of the AOC boundaries and in the absence of a data review for the Niagara
River, the RAP Team agreed to pursue an assessment of all relevant data to determine the
status of the Eutrophication or Undesirable Algae BUI for the Ontario portion of the Niagara
River.
The assessment initiated in 2014 examined all recent data (2003-2013) from multiple
sources collected in the Niagara River (and Chippawa Creek/Niagara power canal) from
multiple agencies for five key eutrophication metrics: total phosphorus (TP), phosphate/soluble
reactive phosphorus (SRP), chlorophyll a, dissolved oxygen (DO) and Secchi disc depth. A
scientific weight-of-evidence approach (as is used by other AOCs) was used to interpret data
and determine the status of the Eutrophication or Undesirable Algae BUI. The results of the
3
assessment indicate that there is no eutrophication or undesirable algae impairment in the
Niagara River.
Below is a summary of the scientific evidence indicating no eutrophication or undesirable
algae impairment in the Niagara River AOC.
• The 90th percentiles of TP concentrations did not unequivocally meet the criterion of
30 ug/L; however, this was attributed to TP sources upstream from the Niagara River
and out of scope of the RAP;
• Phosphate and chlorophyll a concentrations were generally equivalent to or less than
those measured in unimpaired reference areas (SRP data were inconclusive);
• Dissolved oxygen (DO) concentrations were generally above the screening criterion
of 6.5 mg/L. Of the two DO observations below 6.5 mg/L, impact to biota was not
expected;
• Historical Secchi disc depth values in the Niagara River were generally on par with or
better than current day values in unimpaired reference areas;
• The BUI is listed as Not Impaired on the New York side of the Niagara River (Niagara
River New York RAP, 2012).
Therefore, it is recommended that the status of Eutrophication or Undesirable Algae for
the Niagara River (Ontario) AOC be changed to “Not Impaired”.
4
Acknowledgements
Thanks are given to the following individuals who were instrumental in the compilation of data
that were used to complete the Technical Assessment of Eutrophication or Undesirable Algae
BUI for the Niagara River (Ontario) AOC:
• Paul Pu (Ontario Ministry of the Environment and Climate Change (MOECC)) – MOECC’s
Great Lakes Unit data
• Patrick McInnis, Nazma Khan & Carline Rocks (MOECC) – MOECC’s Drinking Water
Surveillance Program (DWSP) data
• Joshua Diamond (Niagara Peninsula Conservation Authority (NPCA)) - NPCA data
• Brad Hill (Environment Canada (EC)) - EC’s Upstream/Downstream (US/DS) data
• Margaret Novak and Jason Fagel (New York State Department of Environmental
Conservation (NYSDEC)) - NYSDEC data
• Joseph Mackarewicz (State University of New York (SUNY) at Brockport) – SUNY Brockport
data
Assistance in various forms is also much appreciated from the following individuals: Sarah Day
(MOECC), Fred Luckey (United States Environmental Protection Agency (US EPA)), Lisa
Richman (MOECC), Mary Ellen Scanlon (formerly MOECC), Don Williams (formerly EC), Paula
Zevin (US EPA).
Reviewers: Mark Filipski (NYSDEC), Martha Guy (EC), Veronique Hiriart-Baer (EC), Rimi
Kalinauskas (formerly EC), Don Zelazny (NYSDEC) and Cheriene Vieira (MOECC).
Background written by Valerie Cromie and updated by Natalie Green (Niagara River RAP Coordinators), Niagara Peninsula Conservation Authority (NPCA)
BUI Assessment and Evaluation written by: Tanya Long, Environmental Scientist, Great Lakes, Ontario Ministry of the Environment and Climate Change
Suggested citation: Long T, Green N, Vieira C, and V Cromie. 2017. Assessment of Eutrophication and Undesirable Algae Beneficial Use Impairment in the Niagara River (Ontario) Area of Concern. Niagara River (Ontario) Remedial Action Plan. Welland, ON. 53 pages.
5
Table of Contents
Executive Summary ................................................................................................................... 2
Acknowledgements .................................................................................................................... 4
1.0 Introduction ..................................................................................................................... 7
1.1 Historical review of the Eutrophication or Undesirable Algae BUI ..................................... 9
1.2 The U.S. Connection: Niagara River (New York) BUI status ............................................11
1.3 Purpose of Assessment ...................................................................................................11
2.0 BUI Assessment and Evaluation - Methodology ..................................................................12
2.1 Application of “Tiered” Approach to BUI Assessment ......................................................14
2.1.1 Tier 1 Assessment of Total Phosphorus (TP) and Dissolved Oxygen (DO) ...............15
2.1.2 Tier 2 Assessments of Phosphate and Chlorophyll a ................................................17
2.1.3 Tier 3 Assessment of Soluble Reactive Phosphorus (SRP) and Secchi Disc Depth ..17
2.1.4 Evaluation of all Indicators to Form Overall Impairment Status..................................18
2.2 Data Sources ...................................................................................................................19
2.2.1 Environment Canada’s Upstream/Downstream (US/DS) Program ............................20
2.2.2 Ontario Ministry of the Environment and Climate Change’s Great Lakes monitoring
data ....................................................................................................................................20
2.2.3 Ontario Ministry of the Environment and Climate Change’s Drinking Water
Surveillance Program .........................................................................................................20
2.2.4 Niagara Peninsula Conservation Authority’s monitoring data for Chippawa
Creek/Niagara power canal ................................................................................................22
2.2.5 New York State Department of Environmental Conservation (NYSDEC) monitoring
data for the Niagara River ..................................................................................................22
2.2.6 State University of New York (SUNY) at Brockport monitoring data for the Niagara
River ..................................................................................................................................23
3.0 BUI Assessment and Evaluation – Results and Discussion .................................................23
3.1 Total Phosphorus ............................................................................................................23
3.2 Phosphate and Soluble Reactive Phosphorus (SRP) ......................................................27
3.3 Chlorophyll a ...................................................................................................................32
3.4 Dissolved Oxygen ............................................................................................................33
6
3.5 Secchi Disc Depth ...........................................................................................................35
4.0 Conclusion ..........................................................................................................................38
5.0 References..........................................................................................................................40
Appendix I: The 2012 Protocol of the Great Lakes Water Quality Agreement. ..........................44
Appendix II: Summary of activities that address Stage 2 Goals to reduce nutrient inputs to the
Niagara River AOC. ..................................................................................................................46
Appendix III: Status and Delisting Objectives for the BUI Eutrophication or Undesirable Algae in
Binational, American and Canadian Connecting Channel and River* Areas of Concern (AOCs)
.................................................................................................................................................48
7
1.0 Introduction
Algae, tiny plant-like organisms that are an important part of the food web, are the main
source of food for planktivorous fishes and zooplankton. However, when algae are
overabundant (often referred to as an algal bloom) they can cause disruptions to the aquatic
ecosystem, result in fish kills, pose a risk to human health and/or impair recreational enjoyment
of the waterbody (boating, swimming). Furthermore, cyanobacteria, also known as blue-green
algae, can release a toxic chemical that may pose a risk to human health. This is the reason
Eutrophication or Undesirable Algae is listed as one of the 14 potential beneficial use
impairments (BUIs) in the Niagara River Area of Concern (AOC).
Eutrophication is the process by which a waterbody becomes overly enriched with
nutrients. Pollution from human sources such as municipal and industrial wastewaters,
agricultural runoff, fertilizers used on lawns and golf courses, and poorly maintained septic
systems are sources of nutrients that can contribute to eutrophication of a waterbody. Natural
sources of nutrients from sediments (due to erosion) can also contribute to eutrophication
The Niagara River is a 58 km binational connecting channel linking Lake Erie to Lake
Ontario. Waters from Lake Erie, the most productive of the Great Lakes, flow rapidly into the
Niagara River at a rate of 0.6 to 0.9 m/s and eventually discharge into Lake Ontario. Due to
historical water quality pollution from human sources the Niagara River is one of 36 remaining
Great Lakes Areas of Concern (AOCs) identified through the Canada-U.S. Great Lakes Water
Quality Agreement (GLWQA) (refer to Appendix 1). As part of the requirement of the GLWQA, a
Remedial Action Plan (RAP) was developed in collaboration with local residents, community
groups, First Nations and Métis, government, scientists and industry to identify, guide and
complete restoration efforts with the ultimate goal of improved environmental conditions and
subsequent removal of the river from the list of Great Lakes AOCs, referred to as “delisting”.
Delisting occurs when all locally-defined actions are completed and scientific evidence shows
that beneficial water uses (be it ecological, recreational and economic) are restored. When
something interferes with the functioning or enjoyment of a water use, it is called a beneficial
use impairment (BUI). There are 14 potential BUIs (see list below) identified in the GLWQA
(common to all AOCs) that the RAP uses to focus restoration needs, track progress and report
on success. To find out more about the current status of all of the Niagara River’s BUIs and to
track progress, visit our website: ourniagarariver.ca.
According to the Great Lakes Water Quality (2012), a BUI is a reduction in the chemical,
physical or biological integrity of the Waters of the Great Lakes to cause any of the
following:
1) restrictions on fish and wildlife consumption 2) tainting of fish and wildlife flavour 3) degradation of fish and wildlife populations 4) fish tumors or other deformities 5) bird or animal deformities or reproduction problems 6) degradation of benthos 7) restrictions on dredging activities 8) eutrophication or undesirable algae 9) restrictions on drinking water consumption, or taste and odor problems
8
10) beach closings 11) degradation of aesthetics 12) added costs to agriculture or industry 13) degradation of phytoplankton and zooplankton populations 14) loss of fish and wildlife habitat
Historically, the RAP defined the AOC as the Ontario side of the Niagara River including its
watersheds extending to the headwaters of the Welland River (NRRAP, 1993). However, the
boundaries of the Niagara River AOC were re-defined due to recent guidance from the GLWQA
(2012) indicating the focus of AOCs is to include the “Waters of the Great Lakes and the
connecting river systems of St. Mary’s, St. Clair, Lake St. Clair, Detroit, Niagara, and St.
Lawrence at the international boundary or upstream from the point at which the river becomes
the international boundary between Canada and the United States, including all open and
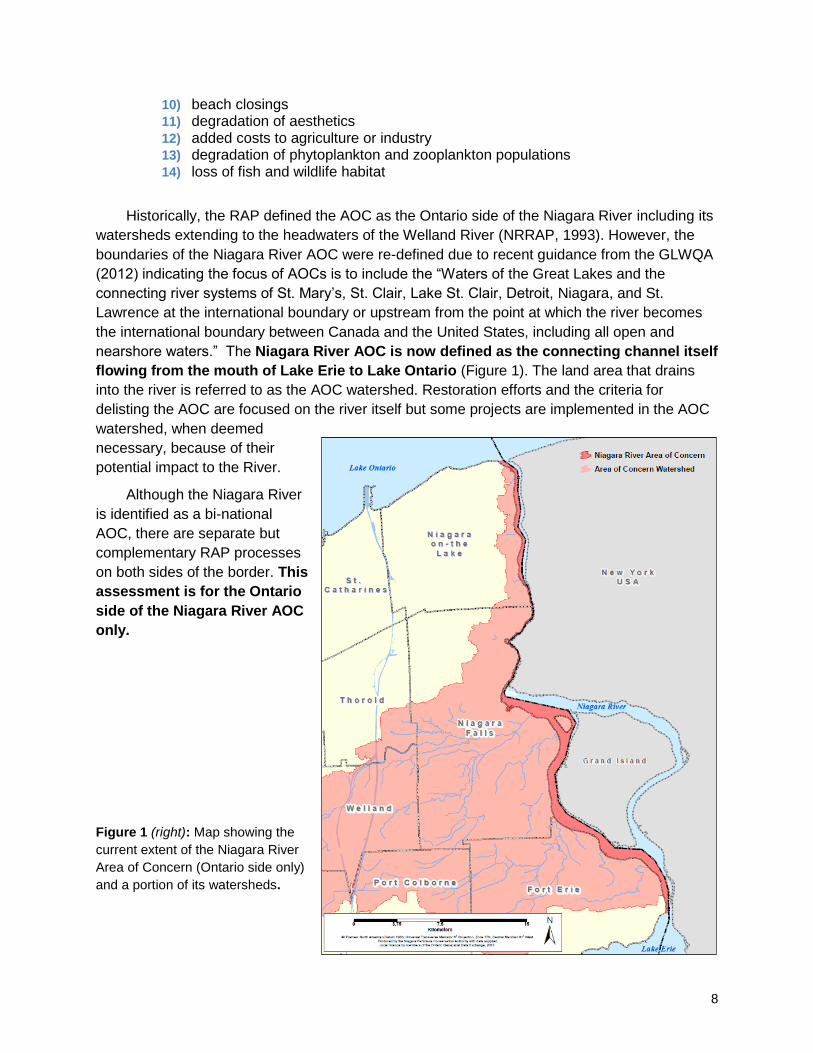
nearshore waters.” The Niagara River AOC is now defined as the connecting channel itself
flowing from the mouth of Lake Erie to Lake Ontario (Figure 1). The land area that drains
into the river is referred to as the AOC watershed. Restoration efforts and the criteria for
delisting the AOC are focused on the river itself but some projects are implemented in the AOC
watershed, when deemed
necessary, because of their
potential impact to the River.
Although the Niagara River
is identified as a bi-national
AOC, there are separate but
complementary RAP processes
on both sides of the border. This
assessment is for the Ontario
side of the Niagara River AOC
only.
Figure 1 (right): Map showing the
current extent of the Niagara River
Area of Concern (Ontario side only)
and a portion of its watersheds.
9
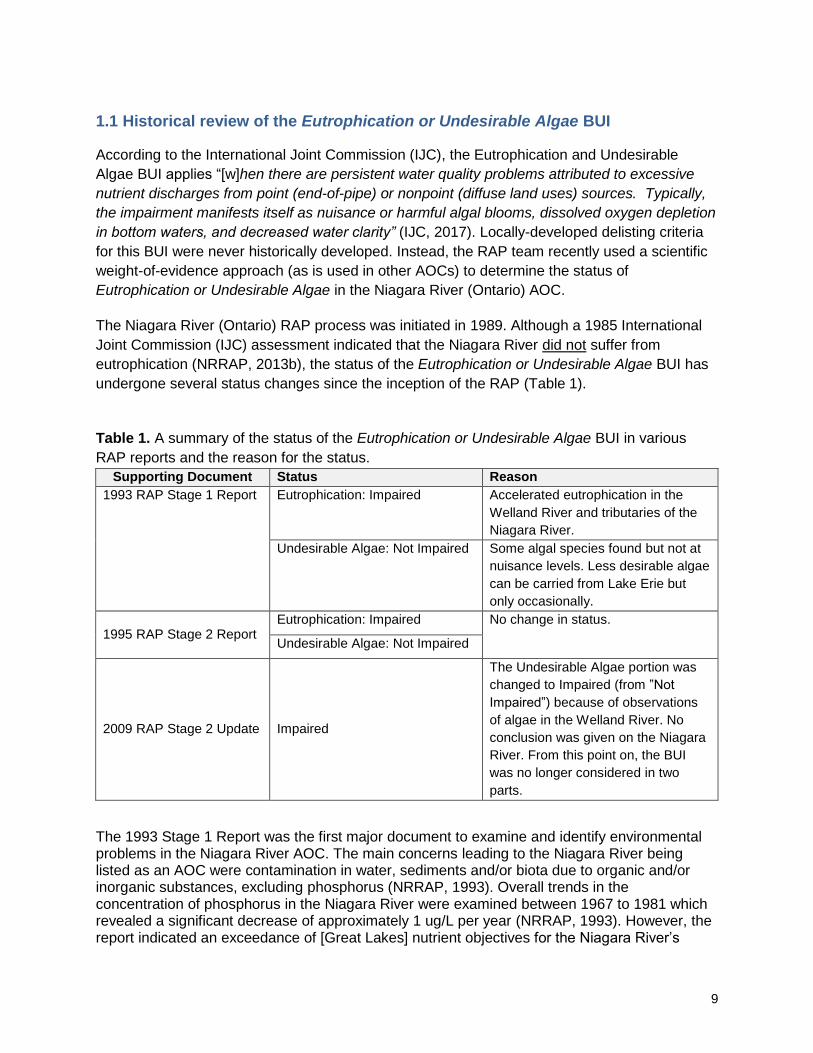
1.1 Historical review of the Eutrophication or Undesirable Algae BUI
According to the International Joint Commission (IJC), the Eutrophication and Undesirable
Algae BUI applies “[w]hen there are persistent water quality problems attributed to excessive
nutrient discharges from point (end-of-pipe) or nonpoint (diffuse land uses) sources. Typically,
the impairment manifests itself as nuisance or harmful algal blooms, dissolved oxygen depletion
in bottom waters, and decreased water clarity” (IJC, 2017). Locally-developed delisting criteria
for this BUI were never historically developed. Instead, the RAP team recently used a scientific
weight-of-evidence approach (as is used in other AOCs) to determine the status of
Eutrophication or Undesirable Algae in the Niagara River (Ontario) AOC.
The Niagara River (Ontario) RAP process was initiated in 1989. Although a 1985 International
Joint Commission (IJC) assessment indicated that the Niagara River did not suffer from
eutrophication (NRRAP, 2013b), the status of the Eutrophication or Undesirable Algae BUI has
undergone several status changes since the inception of the RAP (Table 1).
Table 1. A summary of the status of the Eutrophication or Undesirable Algae BUI in various
RAP reports and the reason for the status.
Supporting Document Status Reason
1993 RAP Stage 1 Report Eutrophication: Impaired
Accelerated eutrophication in the
Welland River and tributaries of the
Niagara River.
Undesirable Algae: Not Impaired Some algal species found but not at
nuisance levels. Less desirable algae
can be carried from Lake Erie but
only occasionally.
1995 RAP Stage 2 Report Eutrophication: Impaired No change in status.
Undesirable Algae: Not Impaired
2009 RAP Stage 2 Update Impaired
The Undesirable Algae portion was
changed to Impaired (from ”Not
Impaired”) because of observations
of algae in the Welland River. No
conclusion was given on the Niagara
River. From this point on, the BUI
was no longer considered in two
parts.
The 1993 Stage 1 Report was the first major document to examine and identify environmental problems in the Niagara River AOC. The main concerns leading to the Niagara River being listed as an AOC were contamination in water, sediments and/or biota due to organic and/or inorganic substances, excluding phosphorus (NRRAP, 1993). Overall trends in the concentration of phosphorus in the Niagara River were examined between 1967 to 1981 which revealed a significant decrease of approximately 1 ug/L per year (NRRAP, 1993). However, the report indicated an exceedance of [Great Lakes] nutrient objectives for the Niagara River’s
10
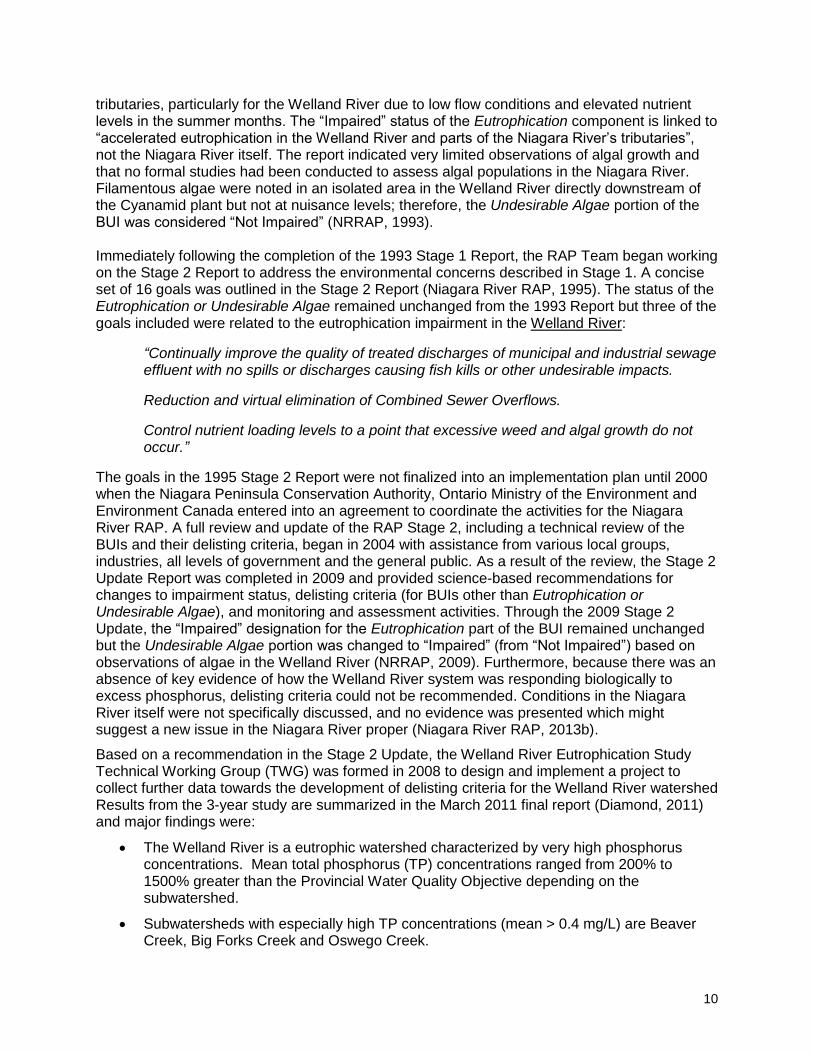
tributaries, particularly for the Welland River due to low flow conditions and elevated nutrient levels in the summer months. The “Impaired” status of the Eutrophication component is linked to “accelerated eutrophication in the Welland River and parts of the Niagara River’s tributaries”, not the Niagara River itself. The report indicated very limited observations of algal growth and that no formal studies had been conducted to assess algal populations in the Niagara River. Filamentous algae were noted in an isolated area in the Welland River directly downstream of the Cyanamid plant but not at nuisance levels; therefore, the Undesirable Algae portion of the BUI was considered “Not Impaired” (NRRAP, 1993). Immediately following the completion of the 1993 Stage 1 Report, the RAP Team began working on the Stage 2 Report to address the environmental concerns described in Stage 1. A concise set of 16 goals was outlined in the Stage 2 Report (Niagara River RAP, 1995). The status of the Eutrophication or Undesirable Algae remained unchanged from the 1993 Report but three of the goals included were related to the eutrophication impairment in the Welland River:
“Continually improve the quality of treated discharges of municipal and industrial sewage effluent with no spills or discharges causing fish kills or other undesirable impacts.
Reduction and virtual elimination of Combined Sewer Overflows.
Control nutrient loading levels to a point that excessive weed and algal growth do not occur.”
The goals in the 1995 Stage 2 Report were not finalized into an implementation plan until 2000 when the Niagara Peninsula Conservation Authority, Ontario Ministry of the Environment and Environment Canada entered into an agreement to coordinate the activities for the Niagara River RAP. A full review and update of the RAP Stage 2, including a technical review of the BUIs and their delisting criteria, began in 2004 with assistance from various local groups, industries, all levels of government and the general public. As a result of the review, the Stage 2 Update Report was completed in 2009 and provided science-based recommendations for changes to impairment status, delisting criteria (for BUIs other than Eutrophication or Undesirable Algae), and monitoring and assessment activities. Through the 2009 Stage 2 Update, the “Impaired” designation for the Eutrophication part of the BUI remained unchanged but the Undesirable Algae portion was changed to “Impaired” (from “Not Impaired”) based on observations of algae in the Welland River (NRRAP, 2009). Furthermore, because there was an absence of key evidence of how the Welland River system was responding biologically to excess phosphorus, delisting criteria could not be recommended. Conditions in the Niagara River itself were not specifically discussed, and no evidence was presented which might suggest a new issue in the Niagara River proper (Niagara River RAP, 2013b).
Based on a recommendation in the Stage 2 Update, the Welland River Eutrophication Study Technical Working Group (TWG) was formed in 2008 to design and implement a project to collect further data towards the development of delisting criteria for the Welland River watershed Results from the 3-year study are summarized in the March 2011 final report (Diamond, 2011) and major findings were:
• The Welland River is a eutrophic watershed characterized by very high phosphorus concentrations. Mean total phosphorus (TP) concentrations ranged from 200% to 1500% greater than the Provincial Water Quality Objective depending on the subwatershed.
• Subwatersheds with especially high TP concentrations (mean > 0.4 mg/L) are Beaver Creek, Big Forks Creek and Oswego Creek.
11
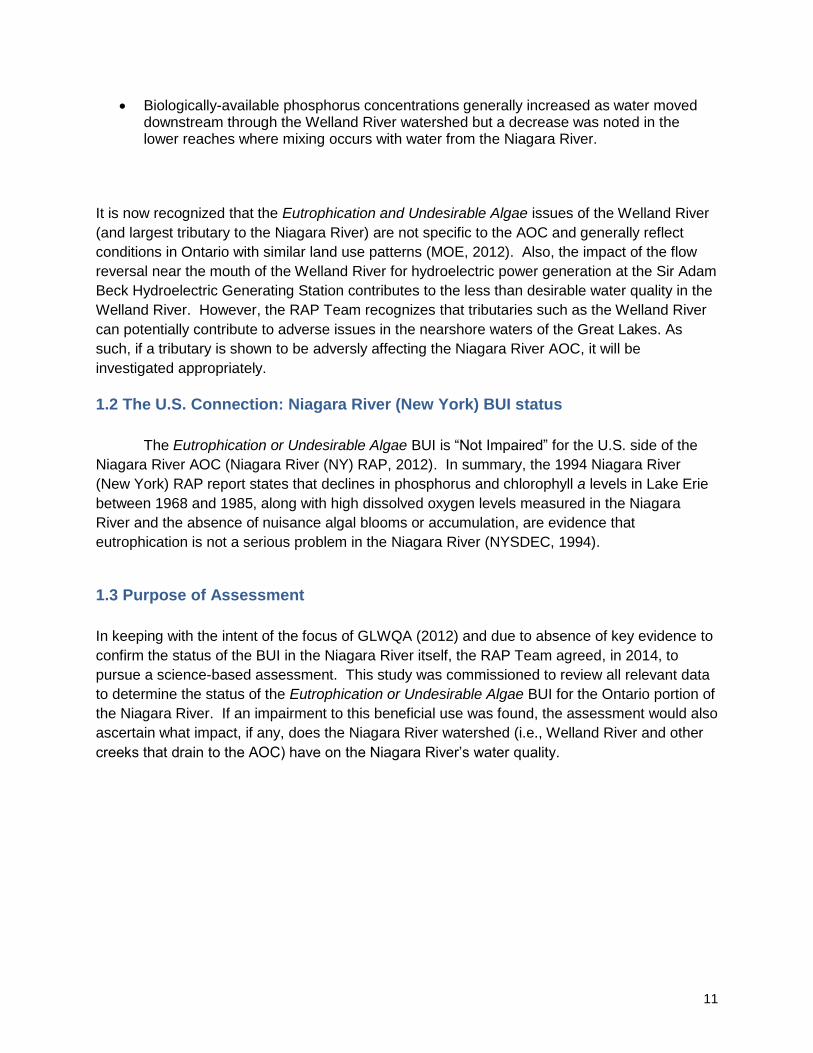
• Biologically-available phosphorus concentrations generally increased as water moved downstream through the Welland River watershed but a decrease was noted in the lower reaches where mixing occurs with water from the Niagara River.
It is now recognized that the Eutrophication and Undesirable Algae issues of the Welland River
(and largest tributary to the Niagara River) are not specific to the AOC and generally reflect
conditions in Ontario with similar land use patterns (MOE, 2012). Also, the impact of the flow
reversal near the mouth of the Welland River for hydroelectric power generation at the Sir Adam
Beck Hydroelectric Generating Station contributes to the less than desirable water quality in the
Welland River. However, the RAP Team recognizes that tributaries such as the Welland River
can potentially contribute to adverse issues in the nearshore waters of the Great Lakes. As
such, if a tributary is shown to be adversly affecting the Niagara River AOC, it will be
investigated appropriately.
1.2 The U.S. Connection: Niagara River (New York) BUI status
The Eutrophication or Undesirable Algae BUI is “Not Impaired” for the U.S. side of the
Niagara River AOC (Niagara River (NY) RAP, 2012). In summary, the 1994 Niagara River
(New York) RAP report states that declines in phosphorus and chlorophyll a levels in Lake Erie
between 1968 and 1985, along with high dissolved oxygen levels measured in the Niagara
River and the absence of nuisance algal blooms or accumulation, are evidence that
eutrophication is not a serious problem in the Niagara River (NYSDEC, 1994).
1.3 Purpose of Assessment
In keeping with the intent of the focus of GLWQA (2012) and due to absence of key evidence to
confirm the status of the BUI in the Niagara River itself, the RAP Team agreed, in 2014, to
pursue a science-based assessment. This study was commissioned to review all relevant data
to determine the status of the Eutrophication or Undesirable Algae BUI for the Ontario portion of
the Niagara River. If an impairment to this beneficial use was found, the assessment would also
ascertain what impact, if any, does the Niagara River watershed (i.e., Welland River and other
creeks that drain to the AOC) have on the Niagara River’s water quality.
12
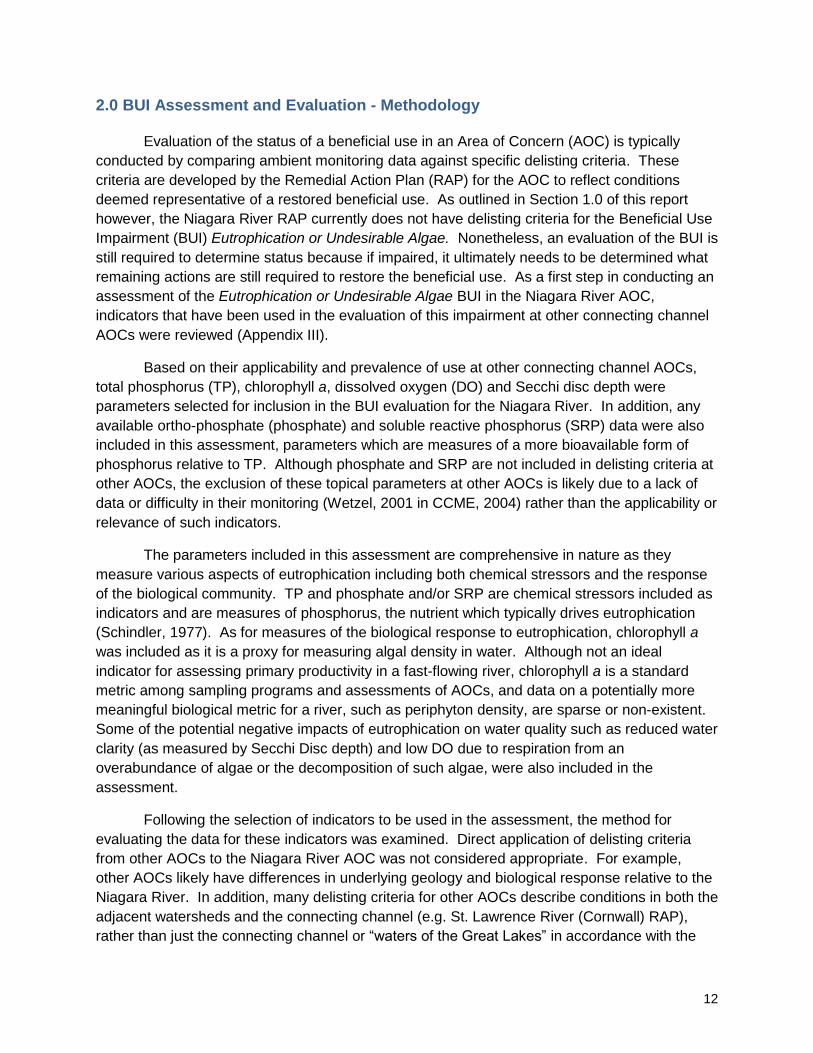
2.0 BUI Assessment and Evaluation - Methodology
Evaluation of the status of a beneficial use in an Area of Concern (AOC) is typically
conducted by comparing ambient monitoring data against specific delisting criteria. These
criteria are developed by the Remedial Action Plan (RAP) for the AOC to reflect conditions
deemed representative of a restored beneficial use. As outlined in Section 1.0 of this report
however, the Niagara River RAP currently does not have delisting criteria for the Beneficial Use
Impairment (BUI) Eutrophication or Undesirable Algae. Nonetheless, an evaluation of the BUI is
still required to determine status because if impaired, it ultimately needs to be determined what
remaining actions are still required to restore the beneficial use. As a first step in conducting an
assessment of the Eutrophication or Undesirable Algae BUI in the Niagara River AOC,
indicators that have been used in the evaluation of this impairment at other connecting channel
AOCs were reviewed (Appendix III).
Based on their applicability and prevalence of use at other connecting channel AOCs,
total phosphorus (TP), chlorophyll a, dissolved oxygen (DO) and Secchi disc depth were
parameters selected for inclusion in the BUI evaluation for the Niagara River. In addition, any
available ortho-phosphate (phosphate) and soluble reactive phosphorus (SRP) data were also
included in this assessment, parameters which are measures of a more bioavailable form of
phosphorus relative to TP. Although phosphate and SRP are not included in delisting criteria at
other AOCs, the exclusion of these topical parameters at other AOCs is likely due to a lack of
data or difficulty in their monitoring (Wetzel, 2001 in CCME, 2004) rather than the applicability or
relevance of such indicators.
The parameters included in this assessment are comprehensive in nature as they
measure various aspects of eutrophication including both chemical stressors and the response
of the biological community. TP and phosphate and/or SRP are chemical stressors included as
indicators and are measures of phosphorus, the nutrient which typically drives eutrophication
(Schindler, 1977). As for measures of the biological response to eutrophication, chlorophyll a
was included as it is a proxy for measuring algal density in water. Although not an ideal
indicator for assessing primary productivity in a fast-flowing river, chlorophyll a is a standard
metric among sampling programs and assessments of AOCs, and data on a potentially more
meaningful biological metric for a river, such as periphyton density, are sparse or non-existent.
Some of the potential negative impacts of eutrophication on water quality such as reduced water
clarity (as measured by Secchi Disc depth) and low DO due to respiration from an
overabundance of algae or the decomposition of such algae, were also included in the
assessment.
Following the selection of indicators to be used in the assessment, the method for
evaluating the data for these indicators was examined. Direct application of delisting criteria
from other AOCs to the Niagara River AOC was not considered appropriate. For example,
other AOCs likely have differences in underlying geology and biological response relative to the
Niagara River. In addition, many delisting criteria for other AOCs describe conditions in both the
adjacent watersheds and the connecting channel (e.g. St. Lawrence River (Cornwall) RAP),
rather than just the connecting channel or “waters of the Great Lakes” in accordance with the
13
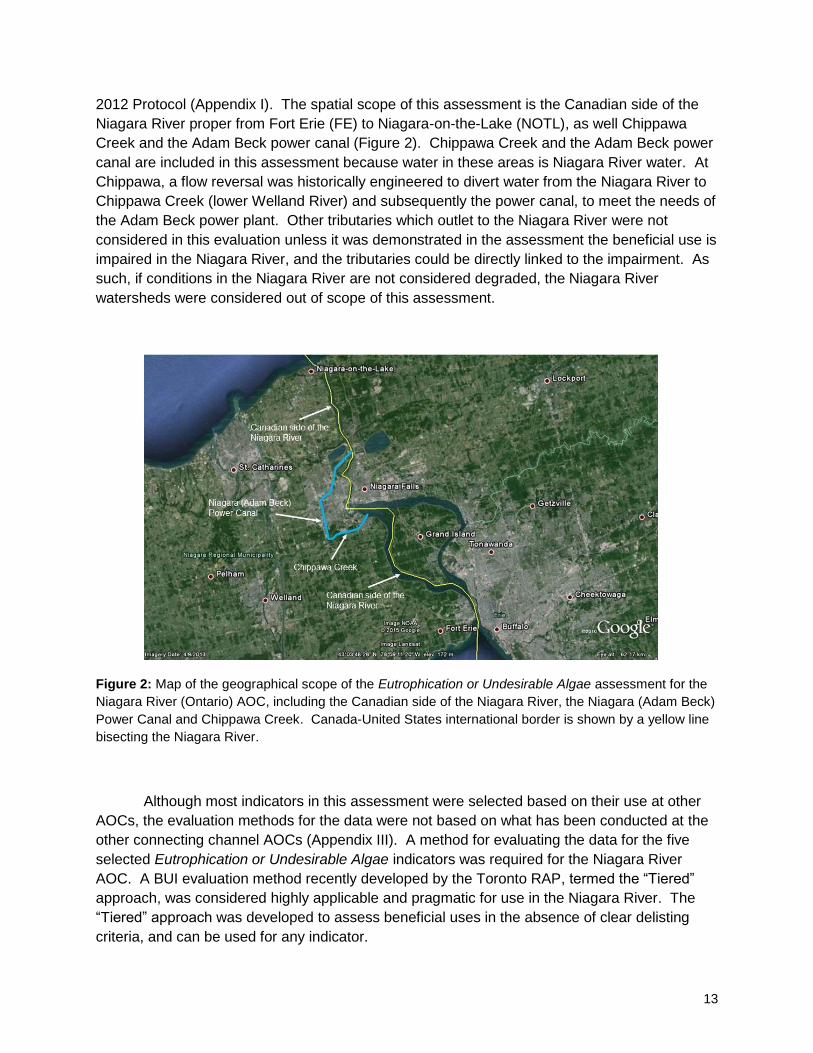
2012 Protocol (Appendix I). The spatial scope of this assessment is the Canadian side of the
Niagara River proper from Fort Erie (FE) to Niagara-on-the-Lake (NOTL), as well Chippawa
Creek and the Adam Beck power canal (Figure 2). Chippawa Creek and the Adam Beck power
canal are included in this assessment because water in these areas is Niagara River water. At
Chippawa, a flow reversal was historically engineered to divert water from the Niagara River to
Chippawa Creek (lower Welland River) and subsequently the power canal, to meet the needs of
the Adam Beck power plant. Other tributaries which outlet to the Niagara River were not
considered in this evaluation unless it was demonstrated in the assessment the beneficial use is
impaired in the Niagara River, and the tributaries could be directly linked to the impairment. As
such, if conditions in the Niagara River are not considered degraded, the Niagara River
watersheds were considered out of scope of this assessment.
Figure 2: Map of the geographical scope of the Eutrophication or Undesirable Algae assessment for the
Niagara River (Ontario) AOC, including the Canadian side of the Niagara River, the Niagara (Adam Beck)
Power Canal and Chippawa Creek. Canada-United States international border is shown by a yellow line
bisecting the Niagara River.
Although most indicators in this assessment were selected based on their use at other
AOCs, the evaluation methods for the data were not based on what has been conducted at the
other connecting channel AOCs (Appendix III). A method for evaluating the data for the five
selected Eutrophication or Undesirable Algae indicators was required for the Niagara River
AOC. A BUI evaluation method recently developed by the Toronto RAP, termed the “Tiered”
approach, was considered highly applicable and pragmatic for use in the Niagara River. The
“Tiered” approach was developed to assess beneficial uses in the absence of clear delisting
criteria, and can be used for any indicator.
14
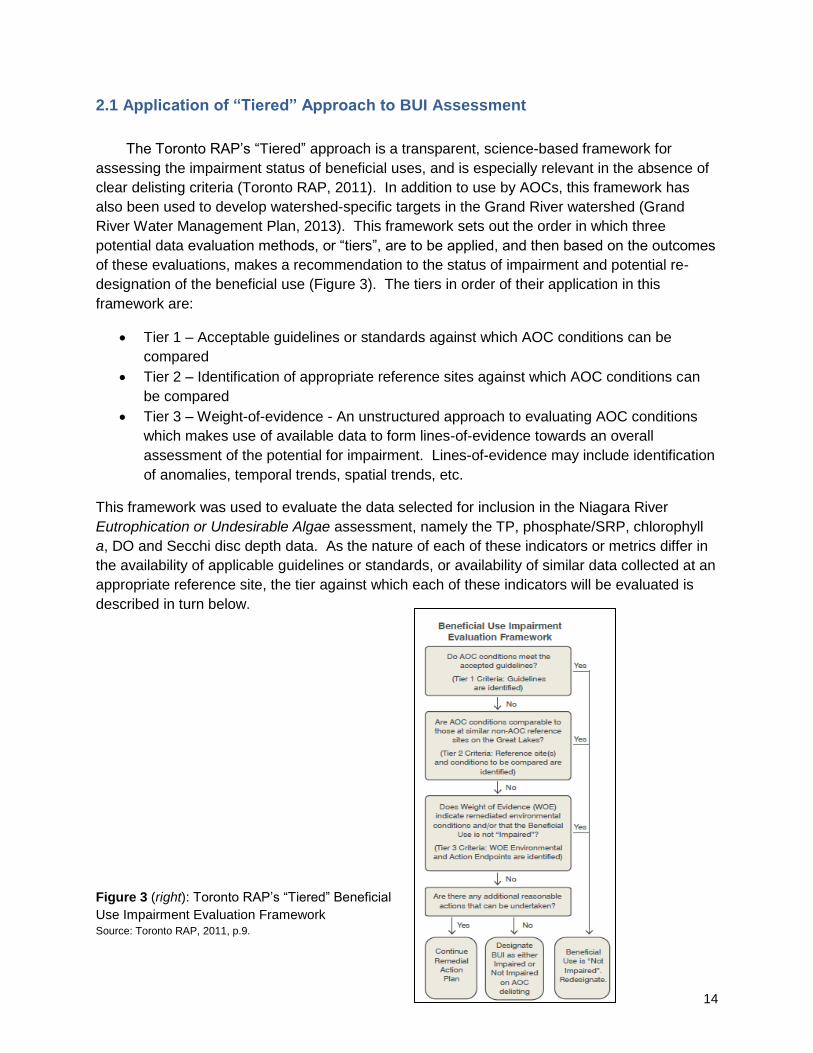
2.1 Application of “Tiered” Approach to BUI Assessment
The Toronto RAP’s “Tiered” approach is a transparent, science-based framework for
assessing the impairment status of beneficial uses, and is especially relevant in the absence of
clear delisting criteria (Toronto RAP, 2011). In addition to use by AOCs, this framework has
also been used to develop watershed-specific targets in the Grand River watershed (Grand
River Water Management Plan, 2013). This framework sets out the order in which three
potential data evaluation methods, or “tiers”, are to be applied, and then based on the outcomes
of these evaluations, makes a recommendation to the status of impairment and potential re-
designation of the beneficial use (Figure 3). The tiers in order of their application in this
framework are:
• Tier 1 – Acceptable guidelines or standards against which AOC conditions can be
compared
• Tier 2 – Identification of appropriate reference sites against which AOC conditions can
be compared
• Tier 3 – Weight-of-evidence - An unstructured approach to evaluating AOC conditions
which makes use of available data to form lines-of-evidence towards an overall
assessment of the potential for impairment. Lines-of-evidence may include identification
of anomalies, temporal trends, spatial trends, etc.
This framework was used to evaluate the data selected for inclusion in the Niagara River
Eutrophication or Undesirable Algae assessment, namely the TP, phosphate/SRP, chlorophyll
a, DO and Secchi disc depth data. As the nature of each of these indicators or metrics differ in
the availability of applicable guidelines or standards, or availability of similar data collected at an
appropriate reference site, the tier against which each of these indicators will be evaluated is
described in turn below.
Figure 3 (right): Toronto RAP’s “Tiered” Beneficial
Use Impairment Evaluation Framework Source: Toronto RAP, 2011, p.9.
15
2.1.1 Tier 1 Assessment of Total Phosphorus (TP) and Dissolved Oxygen (DO)
A Tier 1 assessment of TP and DO concentrations in the Niagara River was conducted
as there are relevant guidelines against which TP and DO concentrations can be evaluated.
The TP concentrations were compared to the interim Provincial Water Quality Objective
(PWQO) of 30 ug/L for TP in rivers which was set to prevent excessive plant growth (MOEE,
1994a). TP concentrations in the Niagara River were considered to meet the guideline if the
majority (i.e. 90th percentile) of recent data were below this benchmark. The choice of using the
90th percentile over a mean or median value is a more conservative approach as it does not
allow extreme values to occur as frequently. Relative to “average” conditions, extreme TP
concentrations are more of a concern for eutrophication as they are believed to be a major
driver behind the formation and/or promotion of algal blooms. Water quality guidelines and
standards are designed such that each individual measurement can be evaluated for context
against the benchmark, however, not all observed TP concentrations are required to be below
the 30 ug/L target. It is recognized that some degree of environmental variability occurs
naturally, and further, not all TP concentration peaks have a direct biological consequence.
That is, elevated TP concentrations do not always result in an accumulation of undesirable
algae as algal growth is determined by a number of different factors, not TP concentrations
alone. Use of the 90th percentile in an overall assessment is consistent with the allowable
exceedance frequency endorsed by the US EPA (i.e. 10% allowable exceedance; US EPA,
1997). It is also consistent with recent changes and updates by the Hamilton Harbour Remedial
Action Plan (HH RAP) to their TP concentration goal. Following a recent review, the HH RAP
now allows a 10% exceedance frequency during each year’s monitoring season to the TP goal
of a maximum of 20 ug/L (HH RAP, 2012). It is important to note that use of the 90th percentile
is more conservative (protective) than the Ontario Ministry of the Environment’s “Green Book”
default of using a 75th percentile standard to determine acceptable background water quality in
evaluations of surface water bodies in Ontario (MOEE, 1994b).
Other relevant phosphorus benchmarks were also examined, but were not considered
appropriate for the context of the Niagara River Eutrophication Assessment. While there is a
Great Lakes Water Quality Agreement (GLWQA) TP target of 10 ug/L, this target is for the open
waters of the lower Great Lakes and use of it in a connecting channel such as the Niagara River
is not an appropriate application of the target. TP processes differ between lakes and rivers, as
reflected by the higher PWQO for TP in rivers and streams of 30 ug/L relative to the PWQO for
TP in lakes of 10-20 ug/L. There is no GLWQA target for connecting channels, which
themselves are unique surface water bodies due to the vast volume of water moving quickly
between the lakes.
Additionally, there is no federal Canadian Water Quality Guideline (CWQG) for
phosphorus, although the Canadian Council of Ministers of the Environment (CCME) do have a
guidance framework which accommodates the non-toxic endpoint associated with phosphorus
loading and permits site-specific management of phosphorus based on desired trophic status
and pre-defined “trigger ranges” (CCME, 2004). Because use of the CCME approach requires
that reference conditions are established to determine which “trigger range” will be used for
16
comparison to the site of interest, this approach is more consistent with a “Tier 2” rather than
“Tier 1” assessment. Nonetheless, the PWQO of 30 ug/L is in the CWQG “meso-eutrophic”
trigger-range of 20 – 35 ug/L for lakes and rivers, thus use of the PWQO is consistent with the
CWQG approach whereby TP concentrations below 30 ug/L should prevent eutrophication.
Alternative TP targets have recently been developed through other processes and resulted in
the Ontario Ecoregion Phosphorus Guidelines (Gartner Lee Limited, 2006) and the National
Agri-Environmental Standards Initiative (NAESI) (Chambers et al., 2008). Application of these
guidelines are also not applicable, however, as the frame of reference for these approaches is
undisturbed conditions (Grand River Water Management Plan, 2013) which is inconsistent with
the goals of a RAP which are intended to restore beneficial uses, not restore water quality to
pristine or pre-colonial conditions.
The DO concentrations in the Niagara River were also compared to relevant guidelines,
specifically the PWQOs, as well as the federal CWQGs. DO guidelines are designed to be
protective of fish, and are based on the different habitat needs of warmwater and coldwater fish
communities. As the Niagara River supports a diversity of fish communities including coldwater
species such salmon and trout which have more stringent DO requirements, selection of
coldwater DO guidelines is the more conservative approach. The coldwater species PWQO is a
range in DO concentrations spanning different ambient temperatures; at the upper end of the
temperature range, DO concentrations should be a minimum of 5 mg/L at 25°C, and at the
lower end of the range, DO should have a minimum concentration of 8 mg/L at 0°C (MOEE,
1994a). Similarly, the coldwater CWQG for DO has more than one guideline, but is based on
life stage, with a minimum DO concentration of 9.5 mg/L for early life stages, and 6.5 mg/L for
all other life stages (CCME, 1999). Due to the differences in recommended DO concentrations
by the available guidelines and the variable nature of DO needs pending ambient temperatures
and/or biotic life stage, DO concentrations in the Niagara River were initially screened against
the CWQG of 6.5 mg/L for non-early life stages, which corresponds to the PWQO for coldwater
biota down to a temperature of 5 – 10°C. The more conservative CWQG of 9.5 mg/L and
PWQO of 8 mg/L at 0°C, both for coldwater species, were not used in the initial screening as
these DO guidelines were considered overly conservative given the context of the assessment.
RAPs are intended to mitigate BUIs, rather than restore water quality to pristine conditions. For
any measured DO concentrations below 6.5 mg/L, further analysis was then conducted to
assess whether a less stringent DO guideline might be appropriate due to the ambient
temperatures at the time of the measurement, or if data in fact suggested potential stress on
aquatic biota.
During this assessment, the context of DO as a secondary indicator of eutrophication
was considered. The PWQO and CWQG for DO reflect the direct habitat needs of fish and are
not designed to be indicative of an oxygen deficit due directly to eutrophication processes. The
DO guidelines are nonetheless still relevant for indicating if DO concentrations in the Niagara
River are less than optimal, and thus, impaired. If DO concentrations were to be considered
impaired, other lines-of-evidence would be needed to determine whether nutrient-driven
processes were the cause of low DO, or if other factors outside the scope of this assessment
(e.g. high loadings of substances with high biological oxygen demand (BOD), nitrogeneous
17
oxygen demand (NOD) or chemical oxygen demand (COD)) were likely the primary cause of
hypoxia or anoxia.
2.1.2 Tier 2 Assessments of Phosphate and Chlorophyll a
There are no relevant guidelines against which phosphate and chlorophyll a
concentrations in a river or connecting channel can be evaluated. As a result, a Tier 2
assessment of phosphate and chlorophyll a concentrations in the Niagara River was conducted
using data collected in reference areas. Other AOCs are generally not recommended for use as
reference sites as specified in the “Tiered” approach (Figure 2), however, all connecting
channels on the Great Lakes have AOCs which suggests that a Tier 2 approach cannot be used
for connecting channels on the Great Lakes. In this assessment focused on one BUI however,
other connecting channels will be used as reference sites because Eutrophication or
Undesirable Algae is not impaired in the Detroit River and St. Clair River AOCs, and in the main
channel of the St. Lawrence River (Cornwall) AOC (only watersheds are impaired); the rationale
for the unimpaired status of this BUI at these three AOCs are outlined in Appendix III. As such,
available phosphate and chlorophyll a data from the Detroit River, St. Clair River and St.
Lawrence River were considered reference site conditions for the Niagara River in the strict
context of evaluating the beneficial use Eutrophication or Undesirable Algae. Important to note
in this report, the St. Lawrence River as a reference area only refers to the Ontario portion of the
river, that is, from Wolfe Island to Cornwall. Conditions in the Niagara River were considered
unimpaired with regard to Eutrophication or Undesirable Algae if recent data were comparable
to or better than current day conditions in the connecting channel reference areas.
2.1.3 Tier 3 Assessment of Soluble Reactive Phosphorus (SRP) and Secchi Disc Depth
Reference area data for soluble reactive phosphorus (SRP) concentrations were not
available so a Tier 3 assessment on the Niagara River data was conducted. A spatial
comparison was conducted to determine any increases in SRP concentration along the length
of the river which might suggest a Niagara River source. SRP data were evaluated by
comparing all available data for each location and monitoring program against one another.
Statistically significant differences among locations were determined by the Kruskal-Wallis
statistical test and subsequent Mann-Whitney pairwise comparisons. Statistics were run in the
PAST software package (Hammer, 2009) and results were considered statistically significant for
p-values less than 0.05. Time trends in SRP concentrations were also examined as increasing
concentrations over time may be indicative of a problematic SRP source.
A Tier 3 or weight-of-evidence approach was also used to evaluate Secchi disc depth as
recent (collected within the past decade) Secchi disc depth data were not available for the
Niagara River. Historical data are however available, and these data were examined for long-
term temporal trends as a line-of-evidence on the impairment status of this indicator. In
addition, the magnitude of historical Secchi disc depths were compared to those recently
measured in reference areas as another line-of-evidence. Instead of using the 90th percentile to
18
evaluate whether the majority of the data reflected desirable water clarity, the 10th percentile
was used as greater Secchi disc depths (greater water clarity) are more desirable than smaller
depths (reduced water clarity), the converse of the situation when examining chemical
parameters such as TP concentrations. A spatial trend along the length of the river (i.e. a
comparison between upstream and downstream concentrations) was not conducted because it
was hypothesized that the falls and turbulence of the lower Niagara River increase suspended
sediment concentrations which in turn influences Secchi disc depth. As such, it is suspected
that a comparison of water clarity between the upper and lower Niagara River would not reveal
meaningful data on any difference in algal density between these two stretches of the Niagara
River as water clarity data may be overwhelmed by inorganic particulate which is a result of the
hydrology of the River.
Further to this caveat about use of Secchi disc depth as a non-ideal proxy for algal
density in an environment such as the Niagara River, this assessment further acknowledges
that use of this metric is not ideal simply due to the high velocity of the Niagara River. In many
cases, only rough estimates of Secchi disc depth could be made by survey crew, especially in
the Upper Niagara River. The deployed Secchi disc extended out behind the survey vessel at
some distance due to the strong currents, and due to the extreme angle of the line, the gauged
depths were not accurate (C. DeBarros, 2013, pers. comm.). The extensive nature of caveats
for use of Secchi disc depth suggest that little would be lost from eliminating this metric from the
suite of indicators used in this assessment, however, Secchi disc depth data that are available
are presented to be consistent with use of this indicator at other AOCs and to ensure due
diligence was conducted in this assessment. Care was taken to not over-interpret the available
Secchi disc depth data, and caution was employed to ensure that any conclusions based on this
metric followed common sense given trends observed for other metrics and parameters.
2.1.4 Evaluation of all Indicators to Form Overall Impairment Status
Following the independent assessments of TP, phosphate/SRP, chlorophyll a, DO and
Secchi disc depth data, findings from each of these five assessments were used together to
form an holistic evaluation of the Eutrophication or Undesirable Algae beneficial use. Nutrient
concentrations were interpreted with caution because as mentioned previously, elevated
nutrient concentrations do not always result in an accumulation of undesirable algae. This is
especially relevant for rivers where scouring due to high flow or flow through may prevent
formation of local algal blooms. It is the biological response which is the utmost concern, as
controlling levels of the chemical stressors such as TP and phosphate/SRP are only a means to
an end, as understood through the context of the PWQO for TP which was set for the protection
against “excessive plant growth” (MOEE, 1994a).
In addition, it is reasonable to assume that one or more metrics may be more greatly
influenced by factors other than eutrophication, and may be reflecting issues out of scope of this
assessment. For example, low DO concentrations can result from the presence of oxygen-
demanding chemicals in the water, rather than the decomposition of algae near the sediment
bed. Similarly, low Secchi disc depths or water clarity can result from high concentrations of
seston (suspended solids), rather than high algal densities. Further, the geographical scope of
19
this assessment was another caveat in the interpretation of data. Designation of a BUI is
contingent on the source of the issue being within the boundary of the AOC. As illustrated in
Figure 3, the final question in the “Tiered” approach is “Are there any additional reasonable
actions that can be undertaken?” If a source is shown to originate upstream from the AOC
boundary, it is also out of scope as the source cannot be addressed by management actions of
the Niagara River RAP. Thus, it is the impairment status suggested by the majority of the
indicator assessments and emphasis on the biological-response metrics and geographical
scope that was used to determine the overall status of Eutrophication or Undesirable Algae for
the Niagara River AOC.
2.2 Data Sources
Existing data collected by Environment Canada (EC), the Ontario Ministry of the
Environment and Climate Change (MOECC), the Niagara Peninsula Conservation Authority
(NPCA), New York State Department of Environmental Conservation (NYSDEC) and State
University of New York (SUNY) at Brockport were used to assess the eutrophication status of
the Niagara River. Data collected over the past 10 years (2003 to 2013) were used to
characterize current conditions, and any historical data (collected up to and including 2002)
were only used in in the assessment if there was a gap in the dataset for the past decade.
Although not within the Niagara River (Ontario) AOC boundary, data collected from the
American side of the lower Niagara River were also considered in this assessment to increase
sample size and to be as comprehensive as possible given scarcity of data for some
parameters. Although the data collected by NYSDEC and SUNY at Brockport were a vital part
of this assessment due to data gaps in the Canadian monitoring programs, there is a caveat to
the inclusion of data collected from the American side of the Niagara River. “While there have
not been any definitive source inputs identified along the lower reach of the river, any
contaminant inputs downstream of the rapids would not be well mixed and would tend to flow
along the shoreline from which they were released” (Hill and Klawunn, 2011).
Programs and data sources that were used in the Eutrophication or Undesirable Algae
assessment for the Niagara River include:
• EC’s Upstream/Downstream (US/DS) monitoring program;
• MOECC’s Great Lakes Unit monitoring data;
• MOECC’s Drinking Water Surveillance Program (DWSP);
• NPCA’s monitoring data for Chippawa Creek/Niagara power canal;
• NYSDEC data;
• SUNY Brockport data.
Additional data sources that were considered for this study include MOECC’s West
Central Region Technical Support Section’s monitoring data, and the MOECC’s Great Lakes
Intake Program data; however, no data within scope were available from these monitoring
programs. The Niagara Falls drinking water plant is not included in the Great Lakes Intake
Program which focuses on long-term trends of nutrient status and phytoplankton in the Great
20
Lakes. Fort Erie’s Rosehill water treatment plant is included in the Great Lakes Intake Program,
however, data from this plant was determined to be outside of the geographical scope of this
eutrophication assessment as water is drawn from Lake Erie, not the Niagara River. All the
data sources used in this eutrophication assessment are described in turn below.
2.2.1 Environment Canada’s Upstream/Downstream (US/DS) Program
For the past few decades, Environment Canada has collected water quality data at
monitoring stations at Fort Erie (FE; upstream location) and Niagara-on-the-Lake (NOTL;
downstream location) with the primary goal of quantifying Niagara River sources of
contaminants. Details of the upstream/downstream (US/DS) program including frequency of
sampling, sampling protocols and analytical methods are described elsewhere (Hill and
Klawunn, 2011). TP and SRP data collected since 1975 were compiled for this evaluation; EC
has no data for chlorophyll a, DO or Secchi disc depth.
2.2.2 Ontario Ministry of the Environment and Climate Change’s Great Lakes
monitoring data
The MOECC’s Great Lakes monitoring staff have been collecting water quality data in
the Niagara River for the past few decades for a variety of projects and surveys. These data
were initially collected by the Ontario Water Resources Branch, but are now collected by the
Great Lakes Monitoring Unit at the MOECC’s Environmental Monitoring and Reporting Branch.
Data collected since 1967 were available for the Niagara River eutrophication assessment and
included data on TP, phosphate, chlorophyll a, DO and Secchi disc depth.
Phosphate, chlorophyll a and Secchi disc depth data from the Detroit River, St. Clair
River and St. Lawrence River, also collected through MOECC Great Lakes monitoring
programs, were used in the Niagara River eutrophication assessment to establish reference
area conditions where appropriate. Important to note is that DO data collected by the MOECC
are spot measurements and not from deployment of continuous data loggers.
2.2.3 Ontario Ministry of the Environment and Climate Change’s Drinking Water
Surveillance Program
The MOECC’s Drinking Water Surveillance Program (DWSP) was initiated in 1986 and
collects raw water samples from intakes at select water treatment plants (WTPs) in Ontario for
research purposes. The WTP for the City of Niagara Falls, Ontario, is included in the DWSP
program, and is described as follows:
The Niagara Falls Water Treatment Plant (WTP) draws its water from the Chippawa
Creek, which is the portion of Welland River just upstream of the point of confluence with the
Niagara River. At this point, the normal flows of the Welland River have been artificially reversed
by an Ontario Power Generation hydroelectric plant diversion. The plant's raw water is therefore
taken from the Niagara River (P. McInnis, 2013, pers. comm).
21
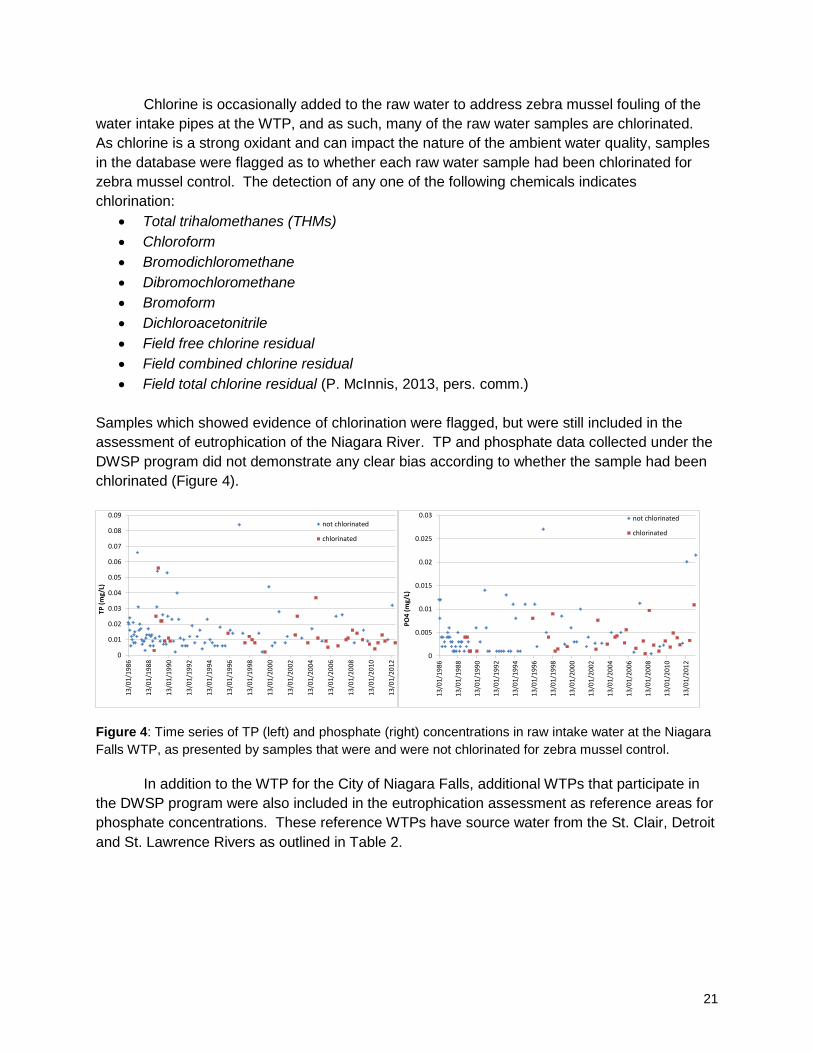
Chlorine is occasionally added to the raw water to address zebra mussel fouling of the
water intake pipes at the WTP, and as such, many of the raw water samples are chlorinated.
As chlorine is a strong oxidant and can impact the nature of the ambient water quality, samples
in the database were flagged as to whether each raw water sample had been chlorinated for
zebra mussel control. The detection of any one of the following chemicals indicates
chlorination:
• Total trihalomethanes (THMs)
• Chloroform
• Bromodichloromethane
• Dibromochloromethane
• Bromoform
• Dichloroacetonitrile
• Field free chlorine residual
• Field combined chlorine residual
• Field total chlorine residual (P. McInnis, 2013, pers. comm.)
Samples which showed evidence of chlorination were flagged, but were still included in the
assessment of eutrophication of the Niagara River. TP and phosphate data collected under the
DWSP program did not demonstrate any clear bias according to whether the sample had been
chlorinated (Figure 4).
0
0.01
0.02
0.03
0.04
0.05
0.06
0.07
0.08
0.09
13
/01
/19
86
13
/01
/19
88
13
/01
/19
90
13
/01
/19
92
13
/01
/19
94
13
/01
/19
96
13
/01
/19
98
13
/01
/20
00
13
/01
/20
02
13
/01
/20
04
13
/01
/20
06
13
/01
/20
08
13
/01
/20
10
13
/01
/20
12
TP (
mg
/L)
not chlorinated
chlorinated
0
0.005
0.01
0.015
0.02
0.025
0.03
13
/01
/19
86
13
/01
/19
88
13
/01
/19
90
13
/01
/19
92
13
/01
/19
94
13
/01
/19
96
13
/01
/19
98
13
/01
/20
00
13
/01
/20
02
13
/01
/20
04
13
/01
/20
06
13
/01
/20
08
13
/01
/20
10
13
/01
/20
12
PO
4 (
mg
/L)
not chlorinated
chlorinated
Figure 4: Time series of TP (left) and phosphate (right) concentrations in raw intake water at the Niagara
Falls WTP, as presented by samples that were and were not chlorinated for zebra mussel control.
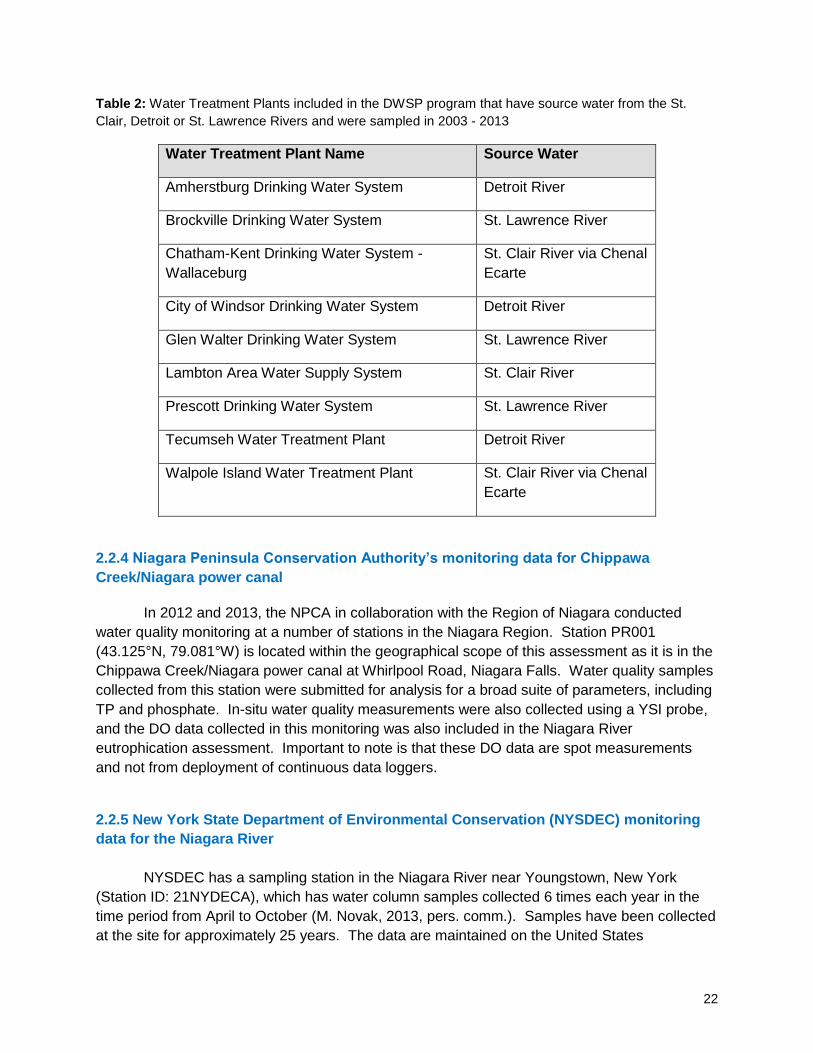
In addition to the WTP for the City of Niagara Falls, additional WTPs that participate in
the DWSP program were also included in the eutrophication assessment as reference areas for
phosphate concentrations. These reference WTPs have source water from the St. Clair, Detroit
and St. Lawrence Rivers as outlined in Table 2.
22
Table 2: Water Treatment Plants included in the DWSP program that have source water from the St.
Clair, Detroit or St. Lawrence Rivers and were sampled in 2003 - 2013
Water Treatment Plant Name Source Water
Amherstburg Drinking Water System Detroit River
Brockville Drinking Water System St. Lawrence River
Chatham-Kent Drinking Water System -
Wallaceburg
St. Clair River via Chenal
Ecarte
City of Windsor Drinking Water System Detroit River
Glen Walter Drinking Water System St. Lawrence River
Lambton Area Water Supply System St. Clair River
Prescott Drinking Water System St. Lawrence River
Tecumseh Water Treatment Plant Detroit River
Walpole Island Water Treatment Plant St. Clair River via Chenal
Ecarte
2.2.4 Niagara Peninsula Conservation Authority’s monitoring data for Chippawa
Creek/Niagara power canal
In 2012 and 2013, the NPCA in collaboration with the Region of Niagara conducted
water quality monitoring at a number of stations in the Niagara Region. Station PR001
(43.125°N, 79.081°W) is located within the geographical scope of this assessment as it is in the
Chippawa Creek/Niagara power canal at Whirlpool Road, Niagara Falls. Water quality samples
collected from this station were submitted for analysis for a broad suite of parameters, including
TP and phosphate. In-situ water quality measurements were also collected using a YSI probe,
and the DO data collected in this monitoring was also included in the Niagara River
eutrophication assessment. Important to note is that these DO data are spot measurements
and not from deployment of continuous data loggers.
2.2.5 New York State Department of Environmental Conservation (NYSDEC) monitoring
data for the Niagara River
NYSDEC has a sampling station in the Niagara River near Youngstown, New York
(Station ID: 21NYDECA), which has water column samples collected 6 times each year in the
time period from April to October (M. Novak, 2013, pers. comm.). Samples have been collected
at the site for approximately 25 years. The data are maintained on the United States
23
Environmental Protection Agency (US EPA) STORET national data warehouse, which can be
accessed from the EPA website or through the national water quality portal at
http://www.waterqualitydata.us/.
2.2.6 State University of New York (SUNY) at Brockport monitoring data for the Niagara
River
Water quality data were collected 4 to 16 times per year from two locations in the
Niagara River by SUNY at Brockport for 2003-2005, 2007, 2009 and 2013. Both stations are
located near Youngstown, New York, although one station is located near the shoreline
(43.2597° N, 79.0580° W) and one is located mid-channel (43.2576° N, 79.0602° W), close to
the Canada-United States international border. The 2013 mid-channel data were collected by
the United States Fish and Wildlife Service. All the water quality analyses were done in the
SUNY Brockport ELAP certified lab (J. Makarewicz, 2013, pers. comm.).
3.0 BUI Assessment and Evaluation – Results and Discussion
3.1 Total Phosphorus
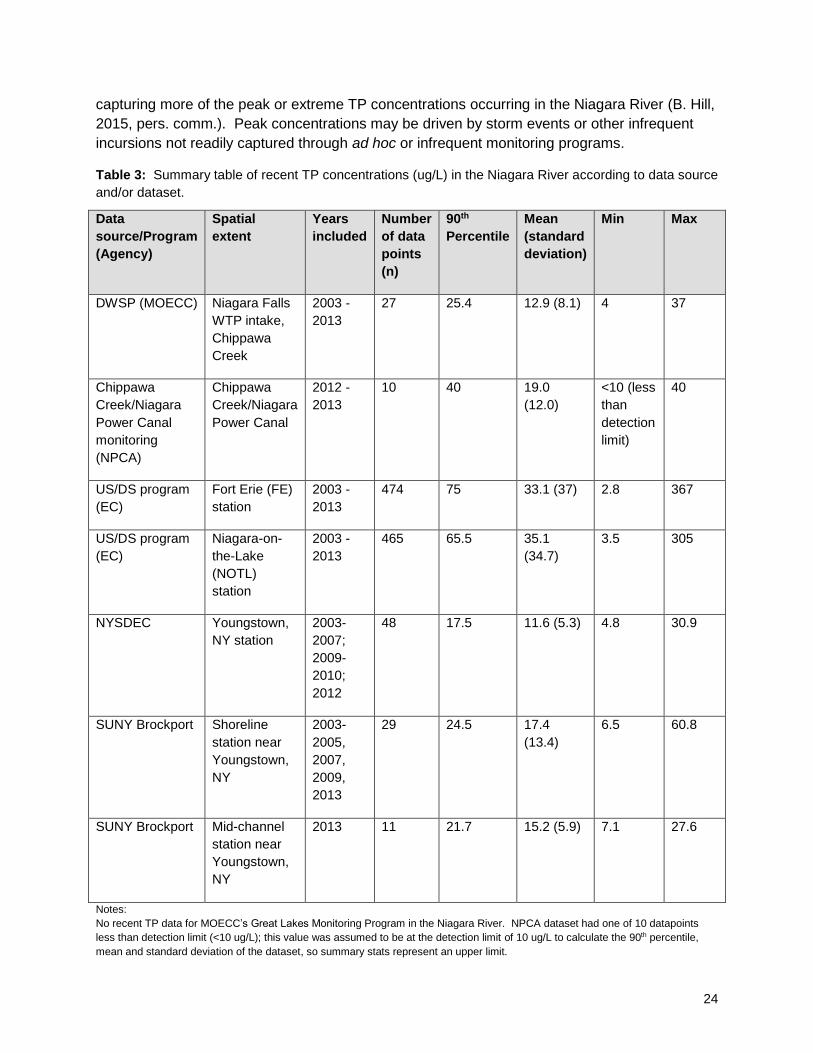
Total phosphorus (TP) concentrations underwent a Tier 1 assessment and samples
collected from the Niagara River over the past decade were compared to the PWQO of 30 ug/L.
TP concentrations demonstrated high variability among datasets, and variability was high even
within a single sampling station and dataset. As such, there was inconsistency in results among
the datasets as the 90th percentile of TP concentrations collected through MOECC’s DWSP
monitoring, NYSDEC’s monitoring, and SUNY’s Brockport monitoring (both shoreline and mid-
channel) met the PWQO of 30 ug/L, while the 90th percentile of TP concentrations collected
through NPCA’s Chippawa Creek/Niagara Power Canal monitoring and EC’s US/DS monitoring
program (FE and NOTL) did not meet the PWQO of 30 ug/L (Table 3).
Initially in this eutrophication assessment, TP data collected through EC’s US/DS
program were flagged as potentially anomalous as these TP concentrations were substantially
higher relative to results collected through other agency monitoring programs. In particular, the
comparison between TP concentrations measured at EC’s NOTL station with NYSDEC and
SUNY Brockport samples was notable given two-fold higher TP concentrations at NOTL despite
the close proximity with the monitoring stations on the US side of the Niagara River.
In part due to the large difference in TP concentrations obtained through the US/DS
program relative to other Niagara River data, EC initiated a Quality Assurance/Quality Control
(QA/QC) investigation into their dataset. Initial findings have suggested that TP concentrations
collected under the auspices of EC’s US/DS monitoring program are valid (B. Hill, 2015, pers.
comm.). Although a final report on EC’s QA/QC investigations is pending, the preliminary
assessment of the US/DS dataset has suggested that TP concentrations may be higher relative
to other sampling programs because the higher sampling frequency of the US/DS program is
24
capturing more of the peak or extreme TP concentrations occurring in the Niagara River (B. Hill,
2015, pers. comm.). Peak concentrations may be driven by storm events or other infrequent
incursions not readily captured through ad hoc or infrequent monitoring programs.
Table 3: Summary table of recent TP concentrations (ug/L) in the Niagara River according to data source
and/or dataset.
Data
source/Program
(Agency)
Spatial
extent
Years
included
Number
of data
points
(n)
90th
Percentile
Mean
(standard
deviation)
Min Max
DWSP (MOECC) Niagara Falls
WTP intake,
Chippawa
Creek
2003 -
2013
27 25.4 12.9 (8.1) 4 37
Chippawa
Creek/Niagara
Power Canal
monitoring
(NPCA)
Chippawa
Creek/Niagara
Power Canal
2012 -
2013
10 40 19.0
(12.0)
<10 (less
than
detection
limit)
40
US/DS program
(EC)
Fort Erie (FE)
station
2003 -
2013
474 75 33.1 (37) 2.8 367
US/DS program
(EC)
Niagara-on-
the-Lake
(NOTL)
station
2003 -
2013
465 65.5 35.1
(34.7)
3.5 305
NYSDEC Youngstown,
NY station
2003-
2007;
2009-
2010;
2012
48 17.5 11.6 (5.3) 4.8 30.9
SUNY Brockport Shoreline
station near
Youngstown,
NY
2003-
2005,
2007,
2009,
2013
29 24.5 17.4
(13.4)
6.5 60.8
SUNY Brockport Mid-channel
station near
Youngstown,
NY
2013 11 21.7 15.2 (5.9) 7.1 27.6
Notes:
No recent TP data for MOECC’s Great Lakes Monitoring Program in the Niagara River. NPCA dataset had one of 10 datapoints
less than detection limit (<10 ug/L); this value was assumed to be at the detection limit of 10 ug/L to calculate the 90th percentile,
mean and standard deviation of the dataset, so summary stats represent an upper limit.
25
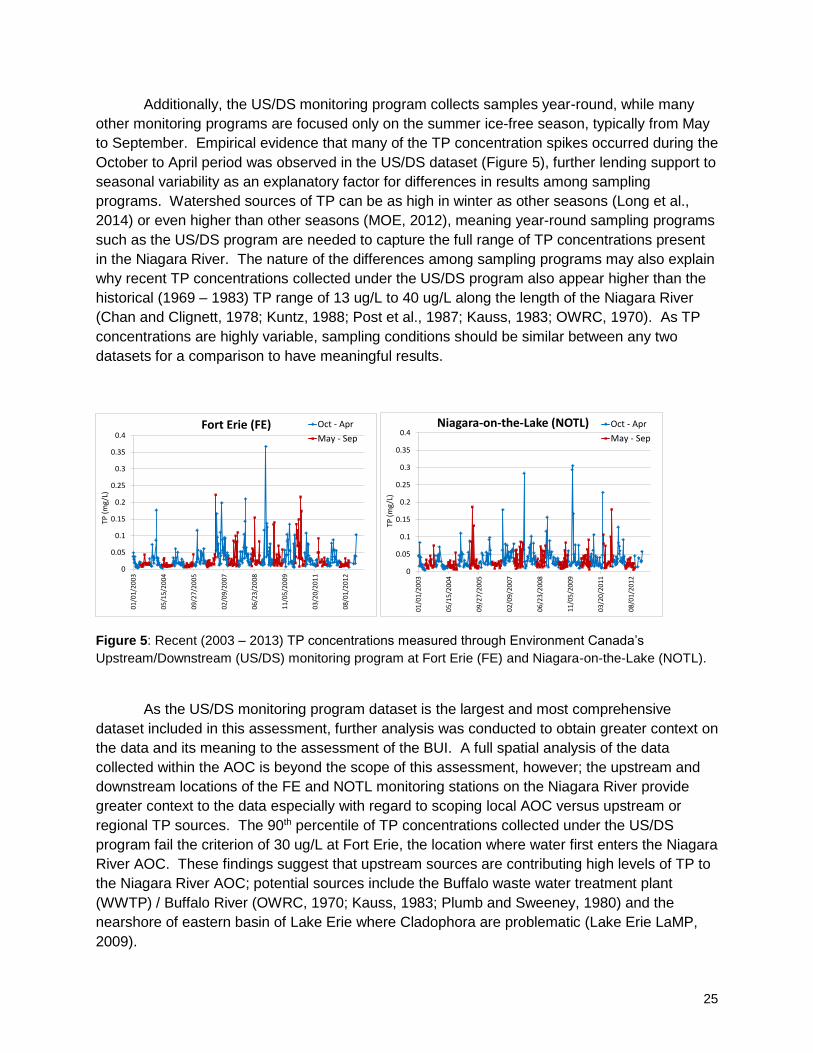
Additionally, the US/DS monitoring program collects samples year-round, while many
other monitoring programs are focused only on the summer ice-free season, typically from May
to September. Empirical evidence that many of the TP concentration spikes occurred during the
October to April period was observed in the US/DS dataset (Figure 5), further lending support to
seasonal variability as an explanatory factor for differences in results among sampling
programs. Watershed sources of TP can be as high in winter as other seasons (Long et al.,
2014) or even higher than other seasons (MOE, 2012), meaning year-round sampling programs
such as the US/DS program are needed to capture the full range of TP concentrations present
in the Niagara River. The nature of the differences among sampling programs may also explain
why recent TP concentrations collected under the US/DS program also appear higher than the
historical (1969 – 1983) TP range of 13 ug/L to 40 ug/L along the length of the Niagara River
(Chan and Clignett, 1978; Kuntz, 1988; Post et al., 1987; Kauss, 1983; OWRC, 1970). As TP
concentrations are highly variable, sampling conditions should be similar between any two
datasets for a comparison to have meaningful results.
0
0.05
0.1
0.15
0.2
0.25
0.3
0.35
0.4
01
/01
/20
03
05
/15
/20
04
09
/27
/20
05
02
/09
/20
07
06
/23
/20
08
11
/05
/20
09
03
/20
/20
11
08
/01
/20
12
TP (
mg
/L)
Fort Erie (FE) Oct - Apr
May - Sep
0
0.05
0.1
0.15
0.2
0.25
0.3
0.35
0.4
01
/01
/20
03
05
/15
/20
04
09
/27
/20
05
02
/09
/20
07
06
/23
/20
08
11
/05
/20
09
03
/20
/20
11
08
/01
/20
12
TP (
mg
/L)
Niagara-on-the-Lake (NOTL) Oct - Apr
May - Sep
Figure 5: Recent (2003 – 2013) TP concentrations measured through Environment Canada’s
Upstream/Downstream (US/DS) monitoring program at Fort Erie (FE) and Niagara-on-the-Lake (NOTL).
As the US/DS monitoring program dataset is the largest and most comprehensive
dataset included in this assessment, further analysis was conducted to obtain greater context on
the data and its meaning to the assessment of the BUI. A full spatial analysis of the data
collected within the AOC is beyond the scope of this assessment, however; the upstream and
downstream locations of the FE and NOTL monitoring stations on the Niagara River provide
greater context to the data especially with regard to scoping local AOC versus upstream or
regional TP sources. The 90th percentile of TP concentrations collected under the US/DS
program fail the criterion of 30 ug/L at Fort Erie, the location where water first enters the Niagara
River AOC. These findings suggest that upstream sources are contributing high levels of TP to
the Niagara River AOC; potential sources include the Buffalo waste water treatment plant
(WWTP) / Buffalo River (OWRC, 1970; Kauss, 1983; Plumb and Sweeney, 1980) and the
nearshore of eastern basin of Lake Erie where Cladophora are problematic (Lake Erie LaMP,
2009).
26
Additionally, there was no significant difference between 2003-2013 TP concentrations
at the FE and NOTL stations (t = 0.85, p(two-tailed) = 0.39) suggesting minimal TP sources being
contributed from within the AOC boundary relative to upstream sources. This finding is
consistent with historical investigations on the Niagara River which demonstrated an absence of
major phosphorus sources in the Chippawa Channel of the Niagara River (the Canadian side of
Grand Island in the upper Niagara River) and the lower Niagara River (Kauss, 1983). That is,
although the Welland River and other tributaries to the Niagara River may have local impacts,
they do not appear to be overall directly impacting TP concentrations in the Niagara River; TP
concentrations at the Niagara River inflow is equivalent to that at the outlet. Should a desire
exist to reduce TP concentrations in the Niagara River, management actions will need to target
upstream sources which are outside the scope of the Niagara River (Ontario) RAP.
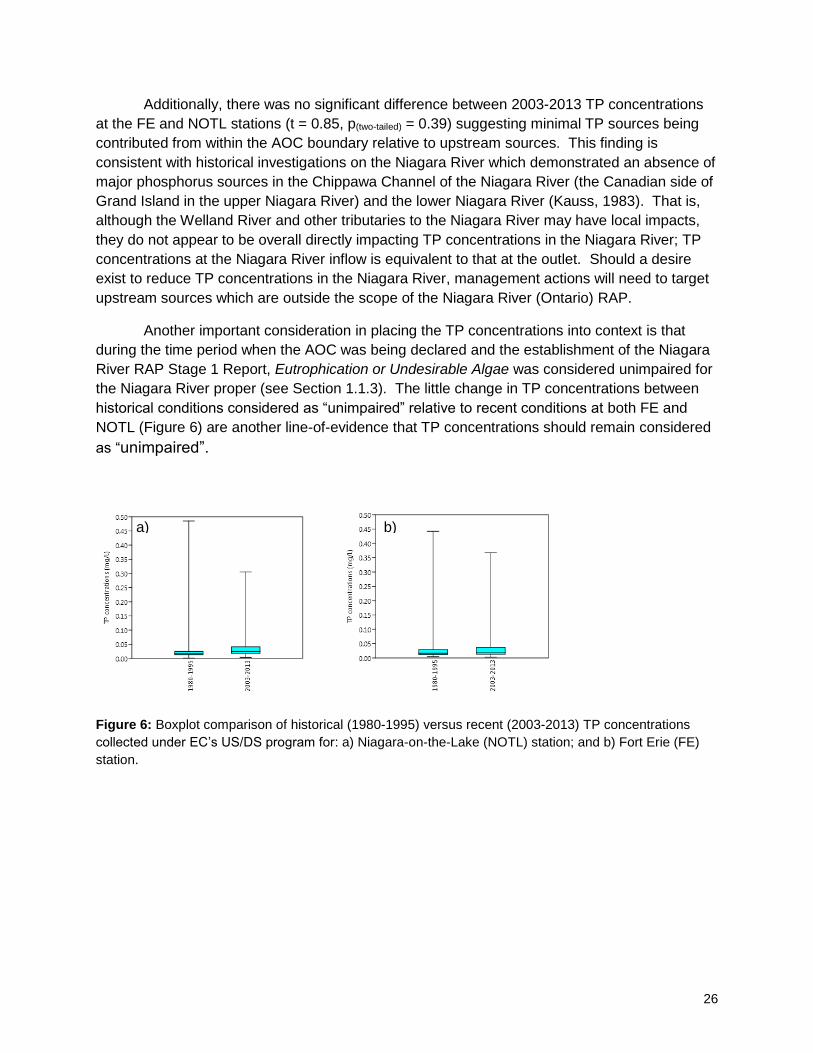
Another important consideration in placing the TP concentrations into context is that
during the time period when the AOC was being declared and the establishment of the Niagara
River RAP Stage 1 Report, Eutrophication or Undesirable Algae was considered unimpaired for
the Niagara River proper (see Section 1.1.3). The little change in TP concentrations between
historical conditions considered as “unimpaired” relative to recent conditions at both FE and
NOTL (Figure 6) are another line-of-evidence that TP concentrations should remain considered
as “unimpaired”.
Figure 6: Boxplot comparison of historical (1980-1995) versus recent (2003-2013) TP concentrations
collected under EC’s US/DS program for: a) Niagara-on-the-Lake (NOTL) station; and b) Fort Erie (FE)
station.
a) b)
27
3.2 Phosphate and Soluble Reactive Phosphorus (SRP)
As mentioned in Section 2 of this report, one reason phosphate and soluble reactive
phosphorus (SRP) have not been incorporated into the suite of delisting parameters at other
AOCs is the challenge associated with the monitoring and analysis of these forms of
phosphorus. Variability in sampling and analysis protocols among the different agencies and
labs which have collected samples and reported phosphate and SRP data was an issue that
was encountered in this assessment as well. It was found that the differences in reporting
among laboratories were not always clear and further, it is questioned if results were different
among labs and studies because there was a real difference in phosphate or SRP
concentrations, or if results were simply not directly comparable between labs. For example,
some labs reported “phosphate as P” and others “phosphate as PO4”, and if it was known which
of these two analysis methods was used, a conversion factor was used to standardize the
reported results to “phosphate as P”. Such was the case for the NPCA phosphate data, and
“phosphate as PO4” as reported by the lab was converted to “phosphate as P” for use in this
report by multiplying by 0.326 (J. Diamond, 2013, pers. comm.). This increased the
comparability of the NPCA data; however, often labs do not specify the reporting metric making
such anomalies in other datasets unknown.
Other reasons why data may not be directly comparable include the resolution of the
reporting increments, and differences in detection limits. While such issues are always present
when comparing data among different labs and agencies, it is especially pronounced for
phosphate. For example, the NPCA dataset has phosphate reported in increments of 10 ug/L
and has a detection limit of 30 ug/L; because the resolution in the reporting increments is large
relative to the actual magnitude of ambient phosphate concentrations in the Niagara River, and
the detection limit is the same as the PWQO for total phosphorus (of which a portion is
composed of phosphate), little can be gained from data at this resolution except for using the
results to screen for anomalously high phosphate concentrations indicative of a clear problem.
This reporting framework introduces a high degree of imprecision into the reported data.
Despite all these noted data quality concerns, the available phosphate and SRP data are
reported with caveats in this report, and because of the overall uncertainty in the results, a
greater difference between Niagara River data and reference area data would be required to
declare an impairment, relative to other parameters where uncertainty in the reported results is
not as great.
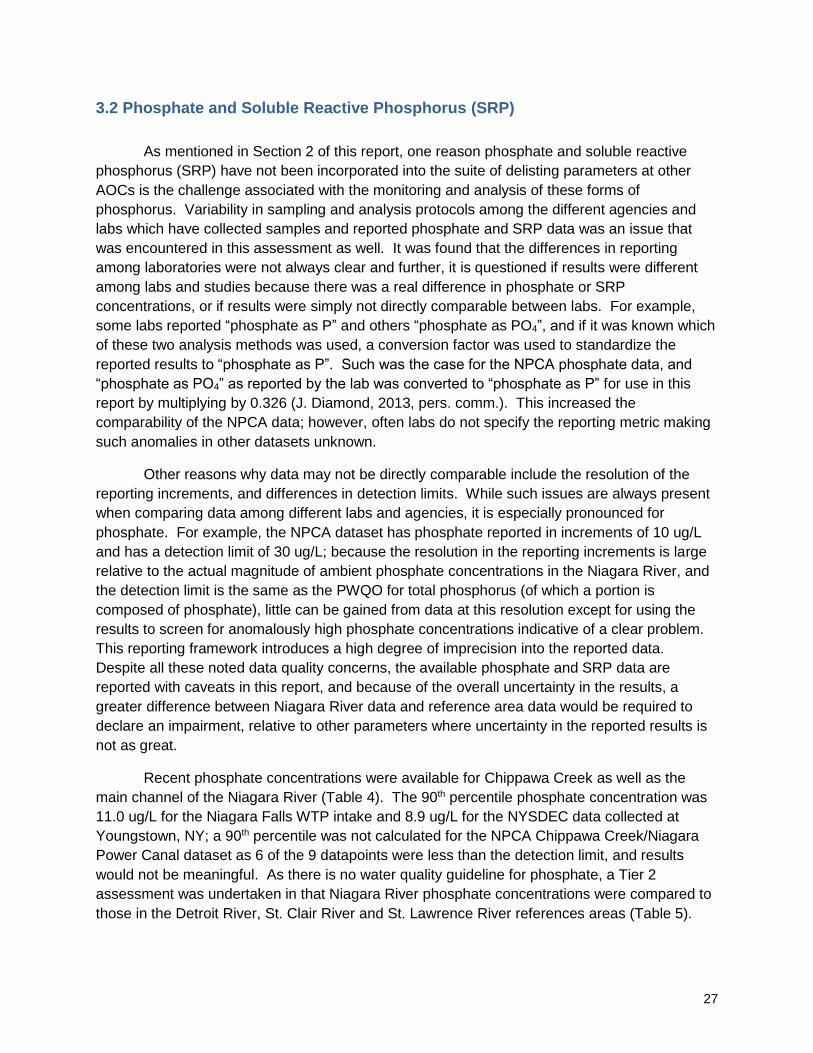
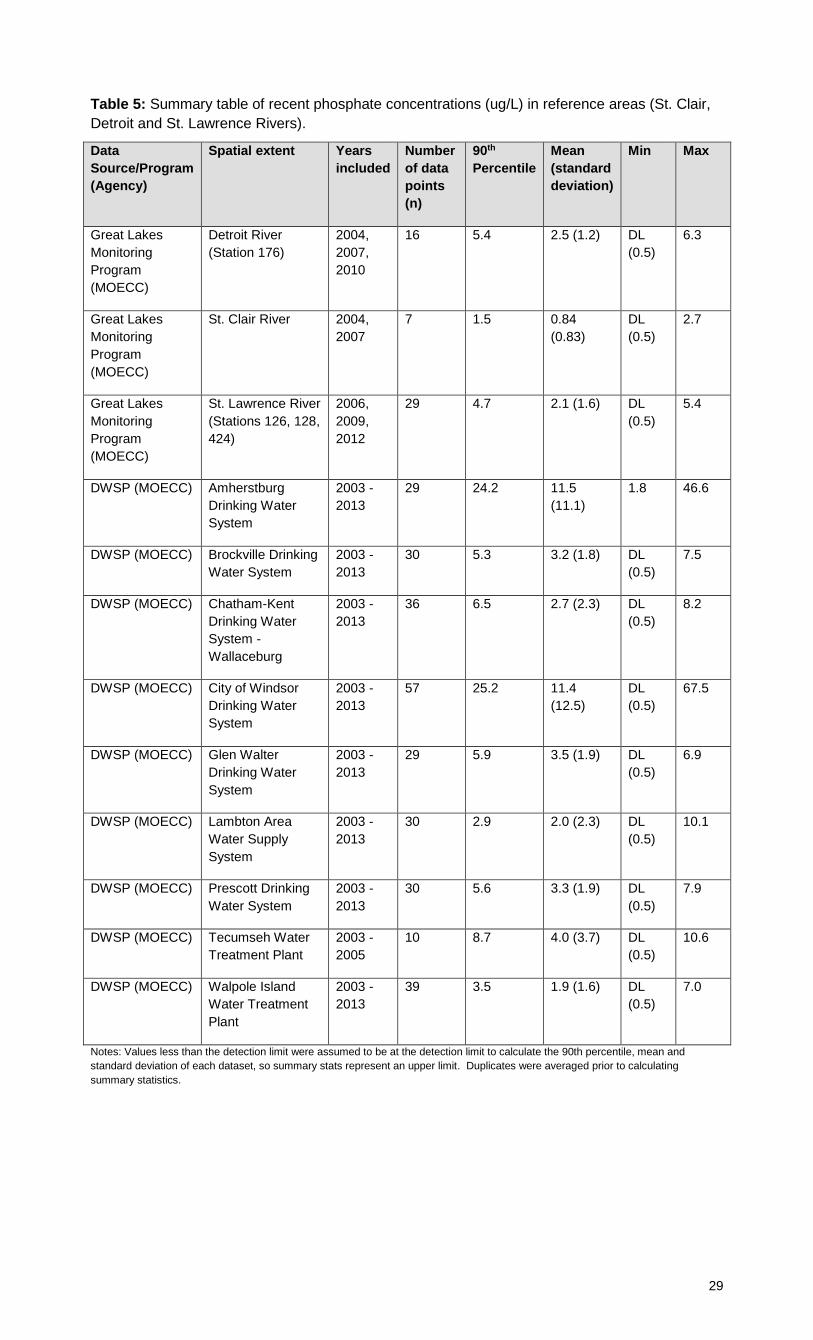
Recent phosphate concentrations were available for Chippawa Creek as well as the
main channel of the Niagara River (Table 4). The 90th percentile phosphate concentration was
11.0 ug/L for the Niagara Falls WTP intake and 8.9 ug/L for the NYSDEC data collected at
Youngstown, NY; a 90th percentile was not calculated for the NPCA Chippawa Creek/Niagara
Power Canal dataset as 6 of the 9 datapoints were less than the detection limit, and results
would not be meaningful. As there is no water quality guideline for phosphate, a Tier 2
assessment was undertaken in that Niagara River phosphate concentrations were compared to
those in the Detroit River, St. Clair River and St. Lawrence River references areas (Table 5).
28
Table 4: Summary table of recent phosphate concentrations (ug/L) in the Niagara River.
Data
Source/Program
Spatial
extent
Years
included
Number
of data
points
(n)
90th
Percentile
Mean
(standard
deviation)
Min Max
DWSP (MOECC) Niagara Falls
WTP intake,
Chippawa
Creek
2003 -
2013
29 11.0* 4.9 (5.2)* <0.5
(less
than
detection
limit)
21.5
Chippawa
Creek/Niagara
Power Canal
monitoring
(NPCA)
Chippawa
Creek/Niagara
Power Canal
2012 -
2013
9 n/a
(6 of 9
datapoints
below
detection
limit)
n/a
(6 of 9
datapoints
below
detection
limit)
<10 (less
than
detection
limit)
10
NYSDEC Youngstown,
NY station
2006-
2009;
2011-
2012
36 8.9* 5.5 (4.6)* <2 (less
than
detection
limit)
25.1
Notes: No recent phosphate data for EC’s US/DS program or MOECC’s Great Lakes Monitoring Program in the Niagara River.
NPCA phosphate data was reported as “phosphate as PO4”; these values were converted to “phosphate as P” for reporting in this
table by multiplying “phosphate as PO4” results by 0.326. NYSDEC phosphate data was a mix of numerous reporting metrics
(phosphate as P, phosphate as PO4, total, dissolved, etc.); as such, those metrics that were not believed to be comparable to the
rest of the dataset were removed from the above summary.
*DWSP (MOECC) dataset had 2 of 29 datapoints less than detection limit (<0.5 ug/L) and the NYSDEC dataset had 6 of 36
datapoints less than detection limit (<2 ug/L). The <DL values were assumed to be at the detection limit to calculate the 90th
percentile, mean and standard deviation of each dataset, so summary stats represent an upper limit.
29
Table 5: Summary table of recent phosphate concentrations (ug/L) in reference areas (St. Clair,
Detroit and St. Lawrence Rivers).
Data
Source/Program
(Agency)
Spatial extent Years
included
Number
of data
points
(n)
90th
Percentile
Mean
(standard
deviation)
Min Max
Great Lakes
Monitoring
Program
(MOECC)
Detroit River
(Station 176)
2004,
2007,
2010
16 5.4 2.5 (1.2) DL
(0.5)
6.3
Great Lakes
Monitoring
Program
(MOECC)
St. Clair River 2004,
2007
7 1.5 0.84
(0.83)
DL
(0.5)
2.7
Great Lakes
Monitoring
Program
(MOECC)
St. Lawrence River
(Stations 126, 128,
424)
2006,
2009,
2012
29 4.7 2.1 (1.6) DL
(0.5)
5.4
DWSP (MOECC) Amherstburg
Drinking Water
System
2003 -
2013
29 24.2 11.5
(11.1)
1.8 46.6
DWSP (MOECC) Brockville Drinking
Water System
2003 -
2013
30 5.3 3.2 (1.8) DL
(0.5)
7.5
DWSP (MOECC) Chatham-Kent
Drinking Water
System -
Wallaceburg
2003 -
2013
36 6.5 2.7 (2.3) DL
(0.5)
8.2
DWSP (MOECC) City of Windsor
Drinking Water
System
2003 -
2013
57 25.2 11.4
(12.5)
DL
(0.5)
67.5
DWSP (MOECC) Glen Walter
Drinking Water
System
2003 -
2013
29 5.9 3.5 (1.9) DL
(0.5)
6.9
DWSP (MOECC) Lambton Area
Water Supply
System
2003 -
2013
30 2.9 2.0 (2.3) DL
(0.5)
10.1
DWSP (MOECC) Prescott Drinking
Water System
2003 -
2013
30 5.6 3.3 (1.9) DL
(0.5)
7.9
DWSP (MOECC) Tecumseh Water
Treatment Plant
2003 -
2005
10 8.7 4.0 (3.7) DL
(0.5)
10.6
DWSP (MOECC) Walpole Island
Water Treatment
Plant
2003 -
2013
39 3.5 1.9 (1.6) DL
(0.5)
7.0
Notes: Values less than the detection limit were assumed to be at the detection limit to calculate the 90th percentile, mean and
standard deviation of each dataset, so summary stats represent an upper limit. Duplicates were averaged prior to calculating
summary statistics.
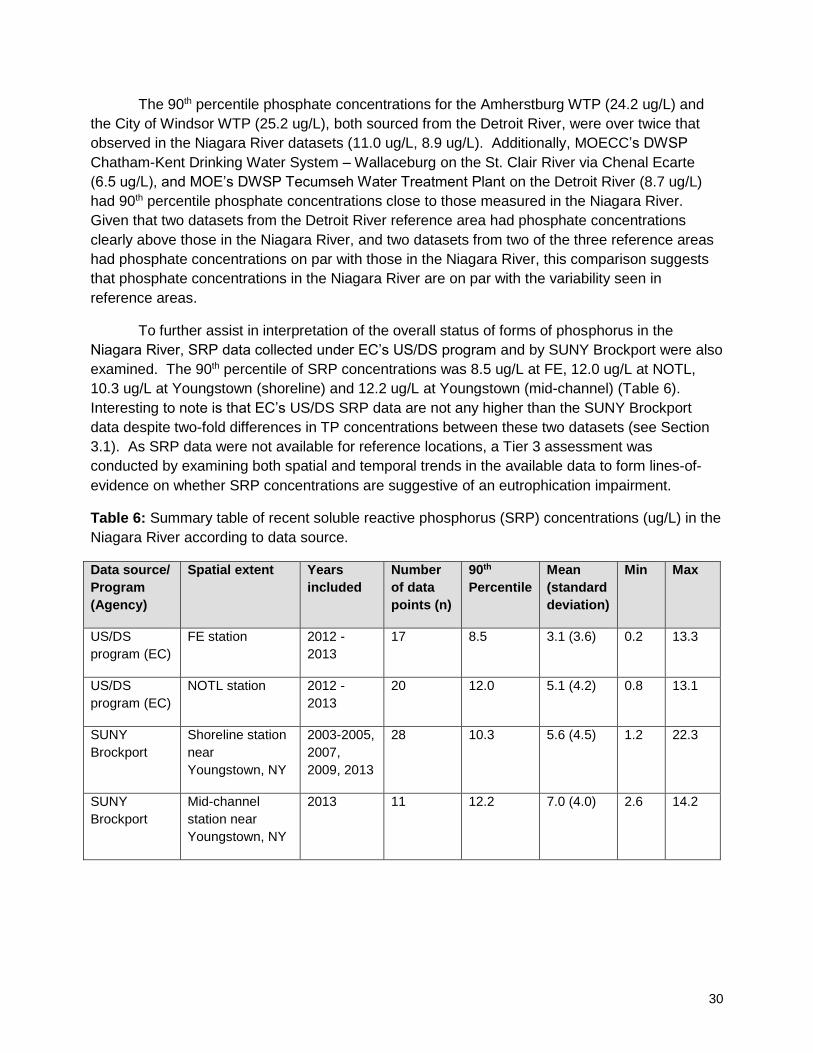
30
The 90th percentile phosphate concentrations for the Amherstburg WTP (24.2 ug/L) and
the City of Windsor WTP (25.2 ug/L), both sourced from the Detroit River, were over twice that
observed in the Niagara River datasets (11.0 ug/L, 8.9 ug/L). Additionally, MOECC’s DWSP
Chatham-Kent Drinking Water System – Wallaceburg on the St. Clair River via Chenal Ecarte
(6.5 ug/L), and MOE’s DWSP Tecumseh Water Treatment Plant on the Detroit River (8.7 ug/L)
had 90th percentile phosphate concentrations close to those measured in the Niagara River.
Given that two datasets from the Detroit River reference area had phosphate concentrations
clearly above those in the Niagara River, and two datasets from two of the three reference areas
had phosphate concentrations on par with those in the Niagara River, this comparison suggests
that phosphate concentrations in the Niagara River are on par with the variability seen in
reference areas.
To further assist in interpretation of the overall status of forms of phosphorus in the
Niagara River, SRP data collected under EC’s US/DS program and by SUNY Brockport were also
examined. The 90th percentile of SRP concentrations was 8.5 ug/L at FE, 12.0 ug/L at NOTL,
10.3 ug/L at Youngstown (shoreline) and 12.2 ug/L at Youngstown (mid-channel) (Table 6).
Interesting to note is that EC’s US/DS SRP data are not any higher than the SUNY Brockport
data despite two-fold differences in TP concentrations between these two datasets (see Section
3.1). As SRP data were not available for reference locations, a Tier 3 assessment was
conducted by examining both spatial and temporal trends in the available data to form lines-of-
evidence on whether SRP concentrations are suggestive of an eutrophication impairment.
Table 6: Summary table of recent soluble reactive phosphorus (SRP) concentrations (ug/L) in the
Niagara River according to data source.
Data source/
Program
(Agency)
Spatial extent Years
included
Number
of data
points (n)
90th
Percentile
Mean
(standard
deviation)
Min Max
US/DS
program (EC)
FE station 2012 -
2013
17 8.5 3.1 (3.6) 0.2 13.3
US/DS
program (EC)
NOTL station 2012 -
2013
20 12.0 5.1 (4.2) 0.8 13.1
SUNY
Brockport
Shoreline station
near
Youngstown, NY
2003-2005,
2007,
2009, 2013
28 10.3 5.6 (4.5) 1.2 22.3
SUNY
Brockport
Mid-channel
station near
Youngstown, NY
2013 11 12.2 7.0 (4.0) 2.6 14.2
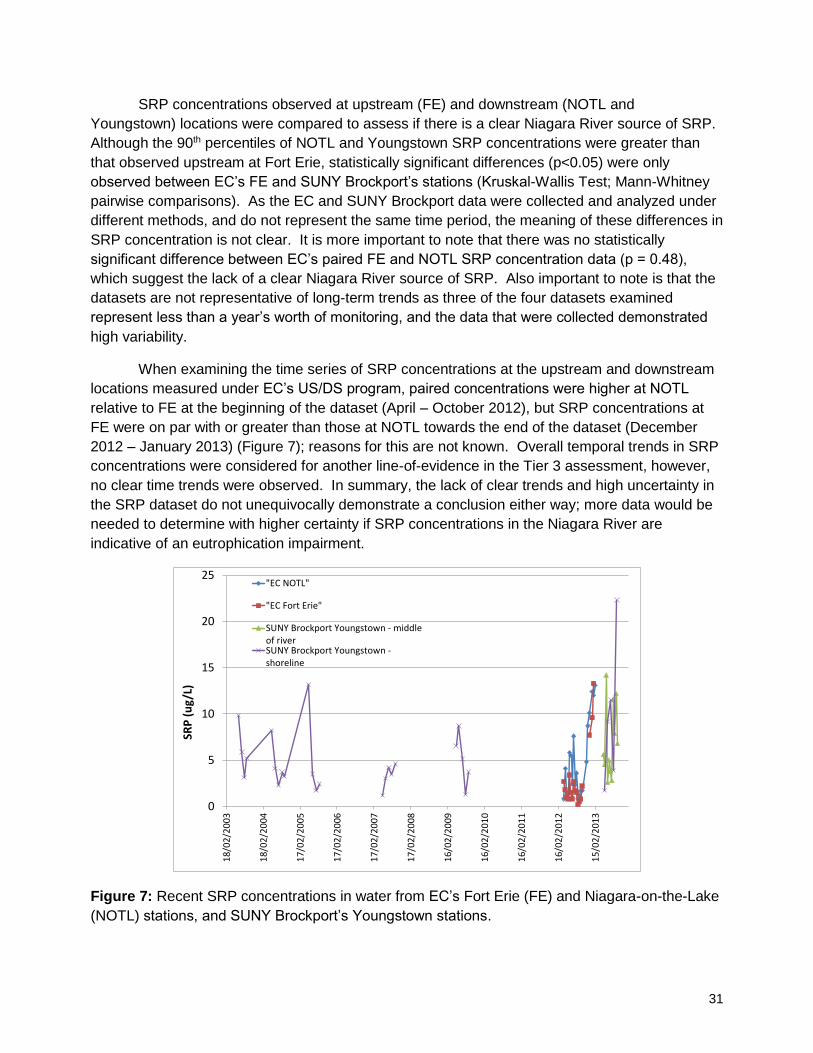
31
SRP concentrations observed at upstream (FE) and downstream (NOTL and
Youngstown) locations were compared to assess if there is a clear Niagara River source of SRP.
Although the 90th percentiles of NOTL and Youngstown SRP concentrations were greater than
that observed upstream at Fort Erie, statistically significant differences (p<0.05) were only
observed between EC’s FE and SUNY Brockport’s stations (Kruskal-Wallis Test; Mann-Whitney
pairwise comparisons). As the EC and SUNY Brockport data were collected and analyzed under
different methods, and do not represent the same time period, the meaning of these differences in
SRP concentration is not clear. It is more important to note that there was no statistically
significant difference between EC’s paired FE and NOTL SRP concentration data (p = 0.48),
which suggest the lack of a clear Niagara River source of SRP. Also important to note is that the
datasets are not representative of long-term trends as three of the four datasets examined
represent less than a year’s worth of monitoring, and the data that were collected demonstrated
high variability.
When examining the time series of SRP concentrations at the upstream and downstream
locations measured under EC’s US/DS program, paired concentrations were higher at NOTL
relative to FE at the beginning of the dataset (April – October 2012), but SRP concentrations at
FE were on par with or greater than those at NOTL towards the end of the dataset (December
2012 – January 2013) (Figure 7); reasons for this are not known. Overall temporal trends in SRP
concentrations were considered for another line-of-evidence in the Tier 3 assessment, however,
no clear time trends were observed. In summary, the lack of clear trends and high uncertainty in
the SRP dataset do not unequivocally demonstrate a conclusion either way; more data would be
needed to determine with higher certainty if SRP concentrations in the Niagara River are
indicative of an eutrophication impairment.
0
5
10
15
20
25
18
/02
/20
03
18
/02
/20
04
17
/02
/20
05
17
/02
/20
06
17
/02
/20
07
17
/02
/20
08
16
/02
/20
09
16
/02
/20
10
16
/02
/20
11
16
/02
/20
12
15
/02
/20
13
SRP
(u
g/L
)
"EC NOTL"
"EC Fort Erie"
SUNY Brockport Youngstown - middleof riverSUNY Brockport Youngstown -shoreline
Figure 7: Recent SRP concentrations in water from EC’s Fort Erie (FE) and Niagara-on-the-Lake
(NOTL) stations, and SUNY Brockport’s Youngstown stations.
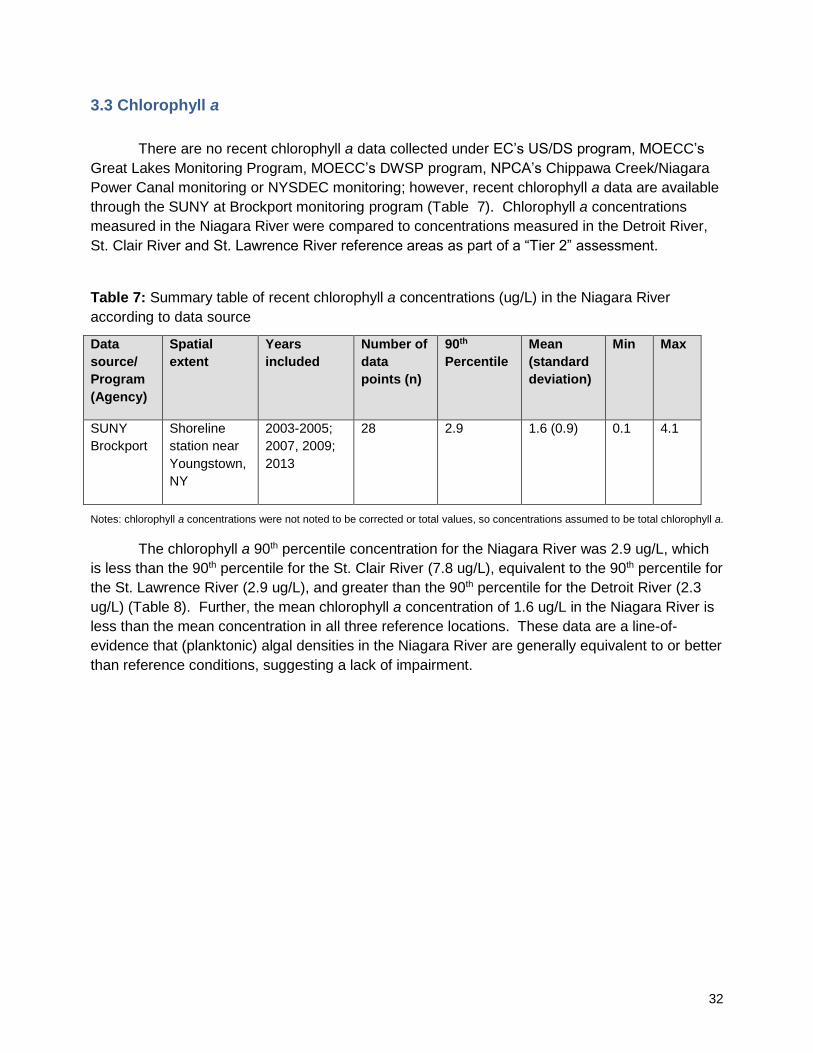
32
3.3 Chlorophyll a
There are no recent chlorophyll a data collected under EC’s US/DS program, MOECC’s
Great Lakes Monitoring Program, MOECC’s DWSP program, NPCA’s Chippawa Creek/Niagara
Power Canal monitoring or NYSDEC monitoring; however, recent chlorophyll a data are available
through the SUNY at Brockport monitoring program (Table 7). Chlorophyll a concentrations
measured in the Niagara River were compared to concentrations measured in the Detroit River,
St. Clair River and St. Lawrence River reference areas as part of a “Tier 2” assessment.
Table 7: Summary table of recent chlorophyll a concentrations (ug/L) in the Niagara River
according to data source
Data
source/
Program
(Agency)
Spatial
extent
Years
included
Number of
data
points (n)
90th
Percentile
Mean
(standard
deviation)
Min Max
SUNY
Brockport
Shoreline
station near
Youngstown,
NY
2003-2005;
2007, 2009;
2013
28 2.9 1.6 (0.9) 0.1 4.1
Notes: chlorophyll a concentrations were not noted to be corrected or total values, so concentrations assumed to be total chlorophyll a.
The chlorophyll a 90th percentile concentration for the Niagara River was 2.9 ug/L, which
is less than the 90th percentile for the St. Clair River (7.8 ug/L), equivalent to the 90th percentile for
the St. Lawrence River (2.9 ug/L), and greater than the 90th percentile for the Detroit River (2.3
ug/L) (Table 8). Further, the mean chlorophyll a concentration of 1.6 ug/L in the Niagara River is
less than the mean concentration in all three reference locations. These data are a line-of-
evidence that (planktonic) algal densities in the Niagara River are generally equivalent to or better
than reference conditions, suggesting a lack of impairment.
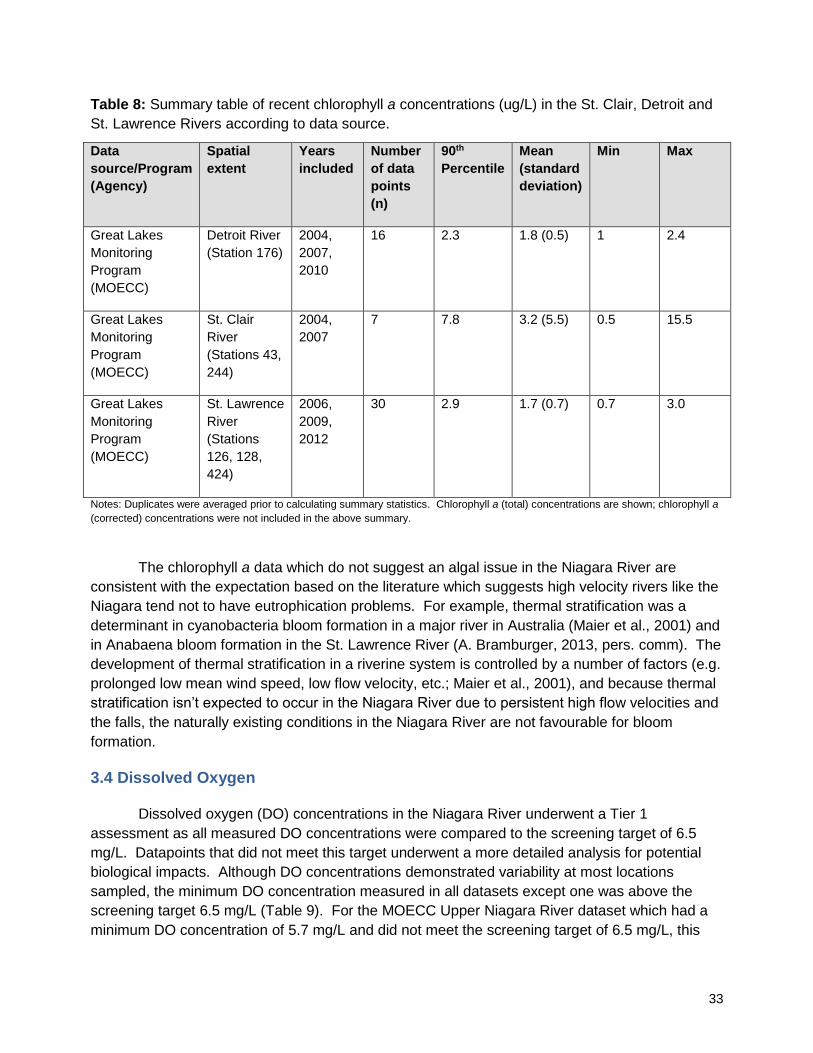
33
Table 8: Summary table of recent chlorophyll a concentrations (ug/L) in the St. Clair, Detroit and
St. Lawrence Rivers according to data source.
Data
source/Program
(Agency)
Spatial
extent
Years
included
Number
of data
points
(n)
90th
Percentile
Mean
(standard
deviation)
Min Max
Great Lakes
Monitoring
Program
(MOECC)
Detroit River
(Station 176)
2004,
2007,
2010
16 2.3 1.8 (0.5) 1 2.4
Great Lakes
Monitoring
Program
(MOECC)
St. Clair
River
(Stations 43,
244)
2004,
2007
7 7.8 3.2 (5.5) 0.5 15.5
Great Lakes
Monitoring
Program
(MOECC)
St. Lawrence
River
(Stations
126, 128,
424)
2006,
2009,
2012
30 2.9 1.7 (0.7) 0.7 3.0
Notes: Duplicates were averaged prior to calculating summary statistics. Chlorophyll a (total) concentrations are shown; chlorophyll a
(corrected) concentrations were not included in the above summary.
The chlorophyll a data which do not suggest an algal issue in the Niagara River are
consistent with the expectation based on the literature which suggests high velocity rivers like the
Niagara tend not to have eutrophication problems. For example, thermal stratification was a
determinant in cyanobacteria bloom formation in a major river in Australia (Maier et al., 2001) and
in Anabaena bloom formation in the St. Lawrence River (A. Bramburger, 2013, pers. comm). The
development of thermal stratification in a riverine system is controlled by a number of factors (e.g.
prolonged low mean wind speed, low flow velocity, etc.; Maier et al., 2001), and because thermal
stratification isn’t expected to occur in the Niagara River due to persistent high flow velocities and
the falls, the naturally existing conditions in the Niagara River are not favourable for bloom
formation.
3.4 Dissolved Oxygen
Dissolved oxygen (DO) concentrations in the Niagara River underwent a Tier 1
assessment as all measured DO concentrations were compared to the screening target of 6.5
mg/L. Datapoints that did not meet this target underwent a more detailed analysis for potential
biological impacts. Although DO concentrations demonstrated variability at most locations
sampled, the minimum DO concentration measured in all datasets except one was above the
screening target 6.5 mg/L (Table 9). For the MOECC Upper Niagara River dataset which had a
minimum DO concentration of 5.7 mg/L and did not meet the screening target of 6.5 mg/L, this
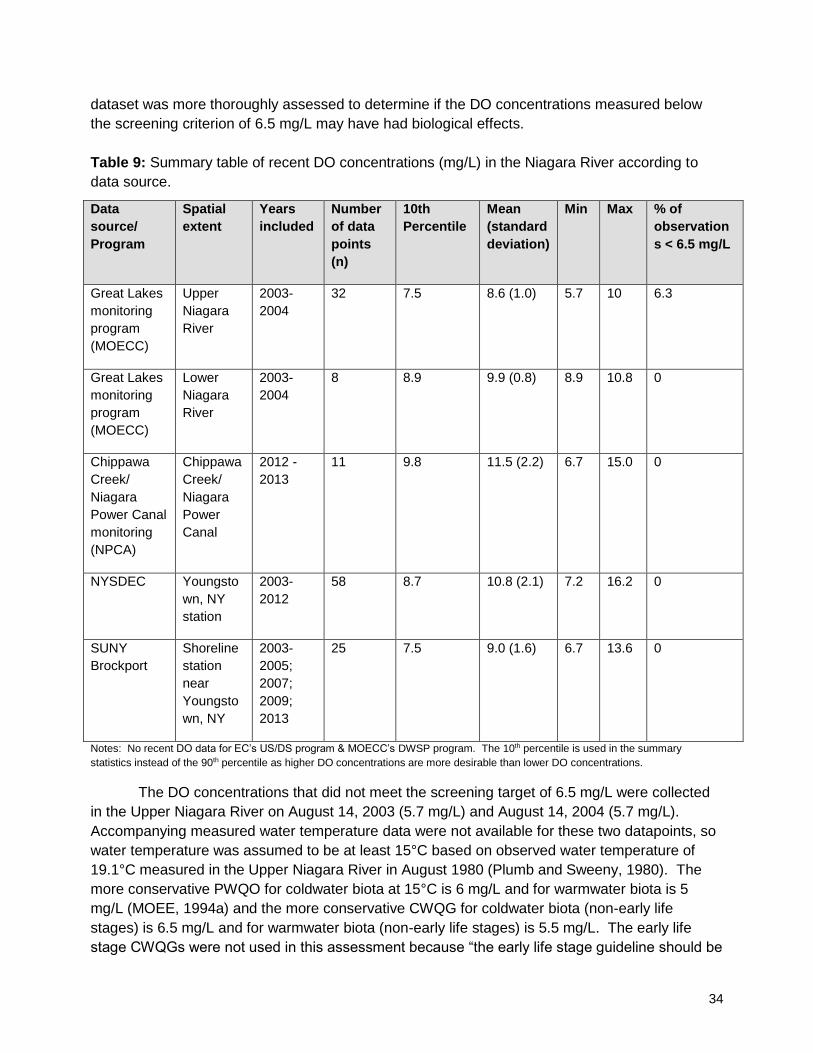
34
dataset was more thoroughly assessed to determine if the DO concentrations measured below
the screening criterion of 6.5 mg/L may have had biological effects.
Table 9: Summary table of recent DO concentrations (mg/L) in the Niagara River according to
data source.
Data
source/
Program
Spatial
extent
Years
included
Number
of data
points
(n)
10th
Percentile
Mean
(standard
deviation)
Min Max % of
observation
s < 6.5 mg/L
Great Lakes
monitoring
program
(MOECC)
Upper
Niagara
River
2003-
2004
32 7.5 8.6 (1.0) 5.7 10 6.3
Great Lakes
monitoring
program
(MOECC)
Lower
Niagara
River
2003-
2004
8 8.9 9.9 (0.8) 8.9 10.8 0
Chippawa
Creek/
Niagara
Power Canal
monitoring
(NPCA)
Chippawa
Creek/
Niagara
Power
Canal
2012 -
2013
11 9.8 11.5 (2.2) 6.7 15.0 0
NYSDEC Youngsto
wn, NY
station
2003-
2012
58 8.7 10.8 (2.1) 7.2 16.2 0
SUNY
Brockport
Shoreline
station
near
Youngsto
wn, NY
2003-
2005;
2007;
2009;
2013
25 7.5 9.0 (1.6) 6.7 13.6 0
Notes: No recent DO data for EC’s US/DS program & MOECC’s DWSP program. The 10th percentile is used in the summary
statistics instead of the 90th percentile as higher DO concentrations are more desirable than lower DO concentrations.
The DO concentrations that did not meet the screening target of 6.5 mg/L were collected
in the Upper Niagara River on August 14, 2003 (5.7 mg/L) and August 14, 2004 (5.7 mg/L).
Accompanying measured water temperature data were not available for these two datapoints, so
water temperature was assumed to be at least 15°C based on observed water temperature of
19.1°C measured in the Upper Niagara River in August 1980 (Plumb and Sweeny, 1980). The
more conservative PWQO for coldwater biota at 15°C is 6 mg/L and for warmwater biota is 5
mg/L (MOEE, 1994a) and the more conservative CWQG for coldwater biota (non-early life
stages) is 6.5 mg/L and for warmwater biota (non-early life stages) is 5.5 mg/L. The early life
stage CWQGs were not used in this assessment because “the early life stage guideline should be
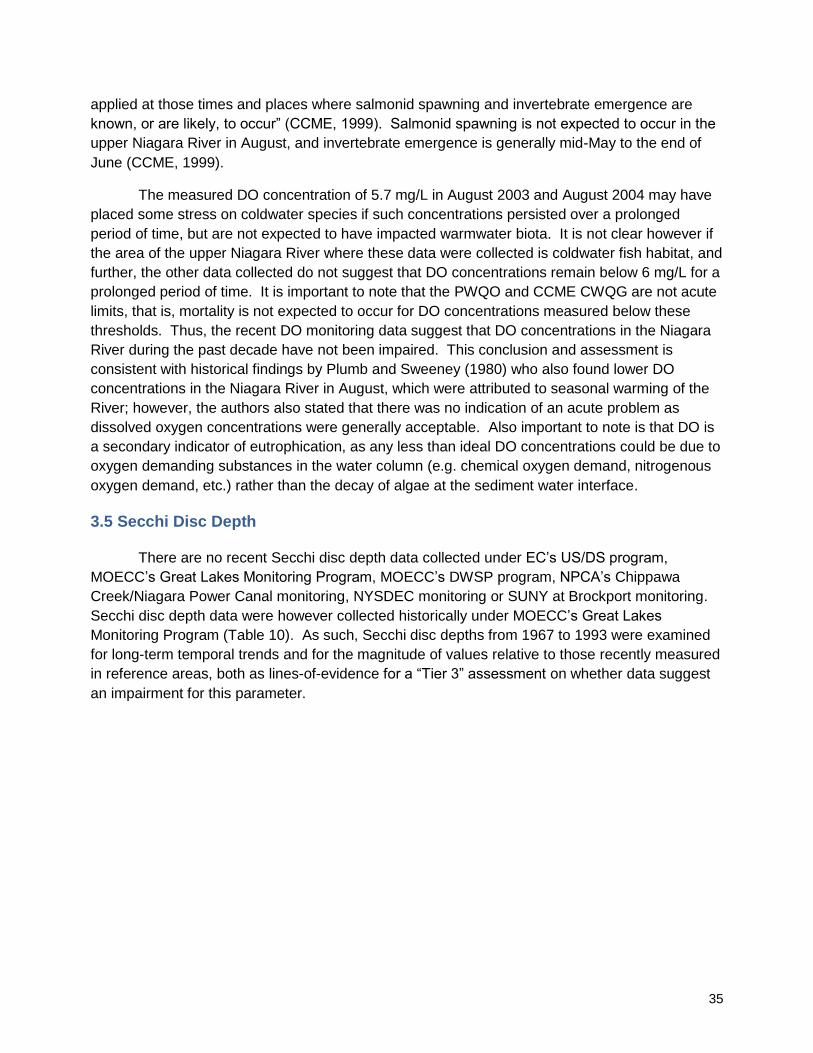
35
applied at those times and places where salmonid spawning and invertebrate emergence are
known, or are likely, to occur” (CCME, 1999). Salmonid spawning is not expected to occur in the
upper Niagara River in August, and invertebrate emergence is generally mid-May to the end of
June (CCME, 1999).
The measured DO concentration of 5.7 mg/L in August 2003 and August 2004 may have
placed some stress on coldwater species if such concentrations persisted over a prolonged
period of time, but are not expected to have impacted warmwater biota. It is not clear however if
the area of the upper Niagara River where these data were collected is coldwater fish habitat, and
further, the other data collected do not suggest that DO concentrations remain below 6 mg/L for a
prolonged period of time. It is important to note that the PWQO and CCME CWQG are not acute
limits, that is, mortality is not expected to occur for DO concentrations measured below these
thresholds. Thus, the recent DO monitoring data suggest that DO concentrations in the Niagara
River during the past decade have not been impaired. This conclusion and assessment is
consistent with historical findings by Plumb and Sweeney (1980) who also found lower DO
concentrations in the Niagara River in August, which were attributed to seasonal warming of the
River; however, the authors also stated that there was no indication of an acute problem as
dissolved oxygen concentrations were generally acceptable. Also important to note is that DO is
a secondary indicator of eutrophication, as any less than ideal DO concentrations could be due to
oxygen demanding substances in the water column (e.g. chemical oxygen demand, nitrogenous
oxygen demand, etc.) rather than the decay of algae at the sediment water interface.
3.5 Secchi Disc Depth
There are no recent Secchi disc depth data collected under EC’s US/DS program,
MOECC’s Great Lakes Monitoring Program, MOECC’s DWSP program, NPCA’s Chippawa
Creek/Niagara Power Canal monitoring, NYSDEC monitoring or SUNY at Brockport monitoring.
Secchi disc depth data were however collected historically under MOECC’s Great Lakes
Monitoring Program (Table 10). As such, Secchi disc depths from 1967 to 1993 were examined
for long-term temporal trends and for the magnitude of values relative to those recently measured
in reference areas, both as lines-of-evidence for a “Tier 3” assessment on whether data suggest
an impairment for this parameter.
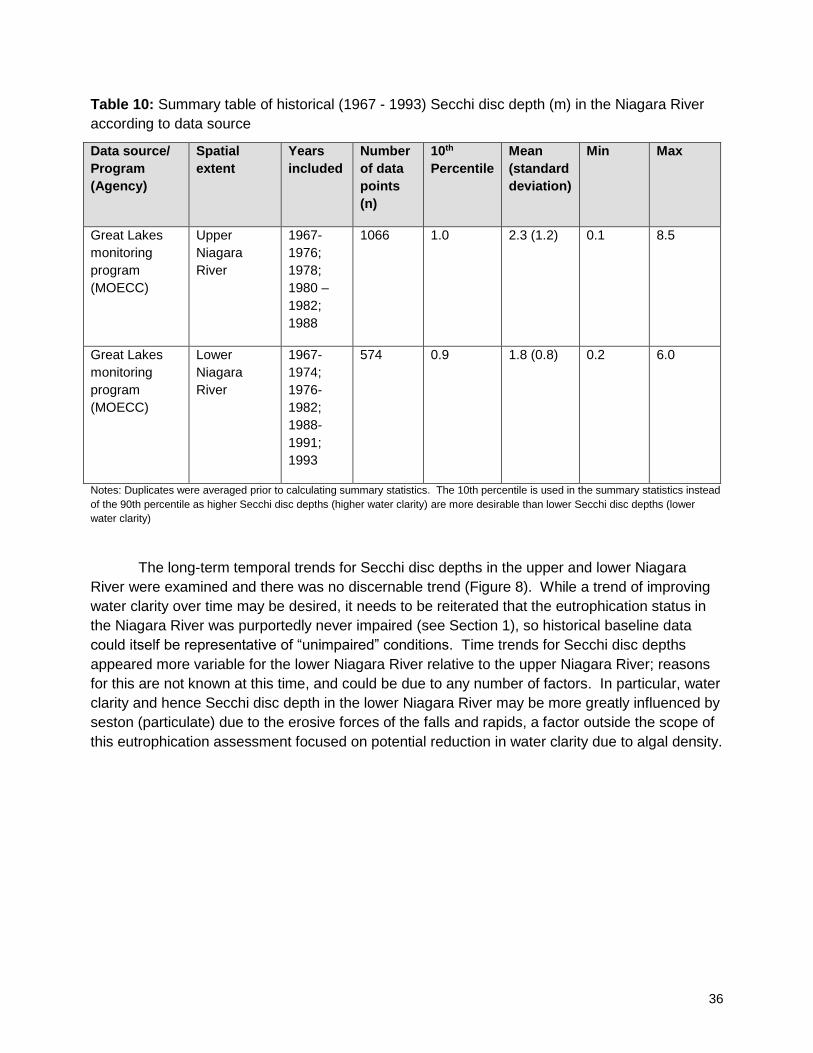
36
Table 10: Summary table of historical (1967 - 1993) Secchi disc depth (m) in the Niagara River
according to data source
Data source/
Program
(Agency)
Spatial
extent
Years
included
Number
of data
points
(n)
10th
Percentile
Mean
(standard
deviation)
Min Max
Great Lakes
monitoring
program
(MOECC)
Upper
Niagara
River
1967-
1976;
1978;
1980 –
1982;
1988
1066 1.0 2.3 (1.2) 0.1 8.5
Great Lakes
monitoring
program
(MOECC)
Lower
Niagara
River
1967-
1974;
1976-
1982;
1988-
1991;
1993
574 0.9 1.8 (0.8) 0.2 6.0
Notes: Duplicates were averaged prior to calculating summary statistics. The 10th percentile is used in the summary statistics instead
of the 90th percentile as higher Secchi disc depths (higher water clarity) are more desirable than lower Secchi disc depths (lower
water clarity)
The long-term temporal trends for Secchi disc depths in the upper and lower Niagara
River were examined and there was no discernable trend (Figure 8). While a trend of improving
water clarity over time may be desired, it needs to be reiterated that the eutrophication status in
the Niagara River was purportedly never impaired (see Section 1), so historical baseline data
could itself be representative of “unimpaired” conditions. Time trends for Secchi disc depths
appeared more variable for the lower Niagara River relative to the upper Niagara River; reasons
for this are not known at this time, and could be due to any number of factors. In particular, water
clarity and hence Secchi disc depth in the lower Niagara River may be more greatly influenced by
seston (particulate) due to the erosive forces of the falls and rapids, a factor outside the scope of
this eutrophication assessment focused on potential reduction in water clarity due to algal density.
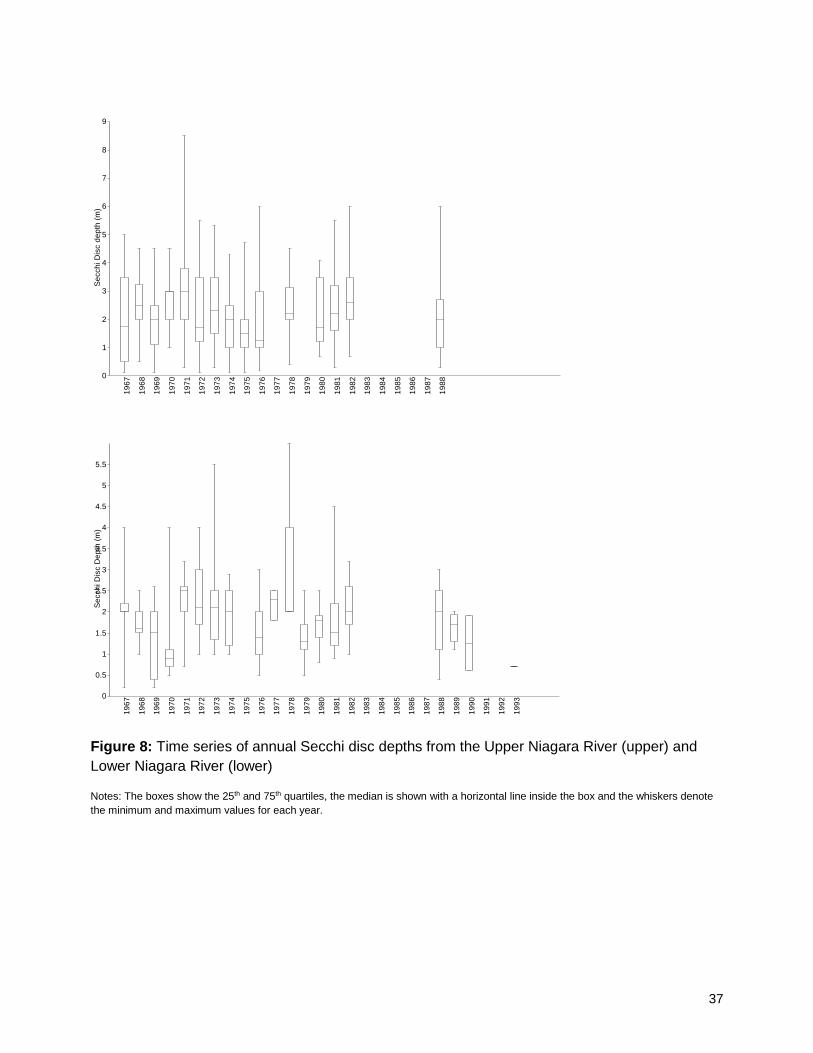
37
19
67
19
68
19
69
19
70
19
71
19
72
19
73
19
74
19
75
19
76
19
77
19
78
19
79
19
80
19
81
19
82
19
83
19
84
19
85
19
86
19
87
19
880
1
2
3
4
5
6
7
8
9
Se
cch
i D
isc d
ep
th (
m)
19
67
19
68
19
69
19
70
19
71
19
72
19
73
19
74
19
75
19
76
19
77
19
78
19
79
19
80
19
81
19
82
19
83
19
84
19
85
19
86
19
87
19
88
19
89
19
90
19
91
19
92
19
930
0.5
1
1.5
2
2.5
3
3.5
4
4.5
5
5.5
Se
cch
i D
isc D
ep
th (
m)
Figure 8: Time series of annual Secchi disc depths from the Upper Niagara River (upper) and
Lower Niagara River (lower)
Notes: The boxes show the 25th and 75th quartiles, the median is shown with a horizontal line inside the box and the whiskers denote
the minimum and maximum values for each year.
38
The historical Secchi disc depths in the Niagara River (Table 10) were compared to current day
values in three reference areas - the St. Clair River, Detroit River and St. Lawrence River (Table
11). The 10th percentile and mean values in the upper and lower Niagara River were better than
values in the Detroit River, better than or on par with values in the St. Clair River, and worse than
values in the St. Lawrence River. As historical Secchi disc depths from the Niagara River are on
par with or better than those recently measured in two of the three reference areas, this indicator
does not suggest a water clarity impairment in the Niagara River, even if water clarity hasn’t
improved since the late 1980s/early 1990s (Figure 8).
Table 11: Summary table of recent Secchi Disc Depths (m) in the St. Clair, Detroit and St.
Lawrence Rivers according to data source.
Data source/
Program
(Agency)
Spatial
extent
Years
included
Number
of data
points
(n)
10th
Percentile
Mean
(standard
deviation)
Min Max
Great Lakes
Monitoring
Program
(MOECC)
Detroit River
(Station 176)
2004,
2007,
2010
8 0.7 1.1 (0.3) 0.6 1.7
Great Lakes
Monitoring
Program
(MOECC)
St. Clair
River
(Stations 43,
244)
2004,
2007
5 1.0 1.9 (1.1) 0.6 3.5
Great Lakes
Monitoring
Program
(MOECC)
St. Lawrence
River
(Stations
126, 513)
2004,
2006,
2012
7 2.6 4.9 (2.1) 1.0 7.4
Notes: Duplicates were averaged prior to calculating summary statistics
4.0 Conclusion
Water quality data collected from the Niagara River over the past decade were examined
to determine the overall impairment status of the beneficial use Eutrophication or Undesirable
Algae in the Niagara River (Ontario) AOC. The five metrics used in the assessment were TP,
phosphate/SRP, chlorophyll a, DO and Secchi disc depth and were assessed using the “Tiered”
approach. Based on the weight-of-evidence, this assessment concludes that Eutrophication
or Undesirable Algae is Not Impaired in the Niagara River (Ontario) AOC. The lines-of-
evidence investigated in this assessment which support this conclusion include:
39
• The 90th percentiles of TP concentrations did not unequivocally meet the criterion of 30 ug/L;
however, this was attributed to sources upstream from the Niagara AOC and out of scope of
the Niagara River RAP;
• Phosphate and chlorophyll a concentrations in the Niagara River are generally equivalent to
or less than those measured in unimpaired reference areas (SRP data were inconclusive);
• DO concentrations in the Niagara River are generally above the screening criterion of 6.5
mg/L, and for the two observations below 6.5 mg/L, impact to biota was not expected;
• Historical Secchi disc depth values in the Niagara River are generally on par with or better
than current day values in unimpaired reference areas.
The conclusion of this assessment is consistent with other lines-of-evidence which have also
suggested the lack of impairment for Eutrophication or Undesirable Algae in the Niagara River
(Ontario) AOC. These include:
• the literature which has suggested that high flows such as those in the Niagara River are
unlikely to support undesirable algal growth (Dodds, 2006; Maier et al., 2001);
• the lack of pervasive public opinion that algae is a problem in the NR;
• The historical “Not Impaired” status of this beneficial use in the Niagara River (Ontario) AOC
(Niagara River RAP, 1993), and little evidence that eutrophication indicators have since
changed (Figure 6); and
• The “Not Impaired” status for Eutrophication or Undesirable Algae in the Niagara River (New
York) AOC. The Niagara River (New York) RAP has stated that the American side of the
Niagara River is not impaired according to the following rationale:
Declines in phosphorus and chlorophyll a levels in Lake Erie between 1968 and 1985 along with high dissolved oxygen levels measured in the Niagara River and the absence of nuisance algal blooms or accumulation are evidence that eutrophication is not a serious problem in the River. (NYSDEC, 2008)
Thus, the finding of an unimpaired status in this assessment should not be considered a novel
description of the trophic status of the Niagara River AOC.
In conclusion, it is recommended that the Niagara River (Ontario) RAP change the status
of Eutrophication or Undesirable Algae to “Not Impaired”.
40
5.0 References
Canadian Council of Ministers of the Environment (CCME). 1999. Canadian Council of
Ministers of the Environment. 1999. Canadian water quality guidelines for the protection of
aquatic life: Dissolved oxygen (freshwater). In: Canadian environmental quality guidelines,
1999, Canadian Council of Ministers of the Environment, Winnipeg.
Canadian Council of Ministers of the Environment (CCME). 2004. Canadian water quality
guidelines for the protection of aquatic life: Phosphorus: Canadian Guidance Framework
for the Management of Freshwater Systems. In: Canadian environmental quality
guidelines, 2004, Canadian Council of Ministers of the Environment, Winnipeg.
Chambers, P.A., R. B. Brua, D.J. McGoldrick, B.L. Upsdell, C. Vis, J.M. Culp and G.A. Benoy.
2008. Nitrogen and Phosphorus Standards to Protect Ecological Condition of Canadian
Streams in Agricultural Watersheds. National Agri-Environmental Standards Initiative
Technical Series. Report No. 4-56. 101 p.
Chan, C.H. and A.H. Clignett. 1978. Short-Term Variation of the Chemical Composition of the
Niagara River. Fisheries and Environment Canada.Scientific Series No. 90. Inland Waters
Directorate, Ontario Region, Water Quality Branch, Burlington, Ontario, 1978.
Diamond, J. 2011. The Welland River Eutrophication Study in the Niagara River Area of
Concern in Support of the Beneficial Use Impairment: Eutrophication and Undesirable
Algae. Written By: Joshua Diamond, Niagara Peninsula Conservation Authority, On
Behalf: Welland River Eutrophication Technical Working Group, Niagara River Remedial
Action Plan. March 2011.
Dickman, M., Prescott, C., and K.L. Kaiser. 1983. Variations in the Aquatic Vegetation of the
Welland River (Ontario, Canada) Above and Below an Industrial Waste Discharge.
Journal of Great Lakes Research, v.9. pp.317-25.
Dodds, W.K. 2006. Eutrophication and trophic state in rivers and streams. Limnol. Oceanogr.,
51(1, part 2), 671–680.
Environmental Consulting & Technology Inc. 2005. Restoration Criteria for the Clinton River
Area of Concern: Phase I – Final Report. Submitted to Clinton River Watershed Council &
Clinton River Public Advisory Council, October 30, 2005.
Gartner Lee Limited. 2006. Development of Ecoregion Based Phosphorus Guidelines for
Canada: Ontario as a Case Study. Report Prepared for the Water Quality Task Group of
the Canadian Council of Ministers of the Environment. Canadian Council of Ministers of
the Environment.PN 1373. 65pp.
Government of the United States of America and Government of Canada. 2012. Protocol
Amending the Agreement between the United States of America and Canada on Great
Lakes Water Quality, 1978, as Amended on October 16, 1983 and on November 18,
1987.
41
Grand River Water Management Plan. 2013. Water Quality Targets to Support Healthy and
Resilient Aquatic Ecosystems in the Grand River Watershed. Prepared by the Water
Quality Working Group.Grand River Conservation Authority, Cambridge, ON.
Green, N.D., Cargnelli, L., Briggs, T., Drouin, R., Child, M., Esbjerg, J., Valiante, M., Henderson,
T., McGregor, D., and D. Munro, eds. 2010. Detroit River Canadian Remedial Action
Plan: Stage 2 Report. Detroit River Canadian Cleanup, Publication No. 1, Essex, Ontario,
Canada.
Hamilton Harbour Remedial Action Plan (HH RAP). 2012. Hamilton Harbour Remedial Action
Plan Beneficial Uses 2012 Fact Sheets. Approved by the 2012 HH RAP Stakeholder
Forum.
Hammer, Ø. 2009. PAST PAleontological STatistics, Version 1.94. Øyvind Hammer, Natural
History Museum, University of Oslo.
Hill, R.B. and P. Klawunn. 2011. The Niagara River Upstream/Downstream Program 1986/87 –
2004/05. Concentrations, Loads and Trends. Environment Canada, Water Quality
Monitoring & Surveillance – Ontario, Locator # WQMS10-003, Contribution # 10-253.
International Joint Commission (IJC). 2017. What are the impairments in Great Lakes AOCs?
[online] Available at: http://ijc.org/en_/aoc/Desc_Impairments (Accessed Oct. 18, 2017).
Kauss, P.B. 1983. Studies of trace contaminants, nutrients, and bacteria levels in the Niagara
River. J. Great Lakes Res. 9(2): 249-273.
Kuntz, K.W. 1988. Recent Trends in Water Quality of the Niagara River. Technical Bulletin No.
146.Inland Waters Directorate, Ontario Region, Water Quality Branch, Burlington, Ontario,
1988.
Lake Erie Lakewide Management Plan (LaMP). 2009. Status of Nutrients in the Lake Erie
Basin. Prepared by the Lake Erie Nutrient Science Task Group for the Lake Erie
Lakewide Management Plan.
Long, T., Boyd, D., Wellen, C., Arhonditsis, G.., 2014. Characterization of water quality
dynamics in the urban and agricultural watersheds of Hamilton Harbour following an
intensive two year event based monitoring program in Hamilton and Burlington, Ontario,
Canada. Journal of Great Lakes Research, 40, 964-979,
http://dx.doi.org/10.1016/j.jglr.2014.09.017
Maier, H.R., Burch, M.D., M. Bormans. 2001. Flow management strategies to control blooms of
the cyanobacterium, Anabaena Circinalis, in the River Murray at Morgan, South Australia.
Regul. Rivers Res. Mgmt. 17: 637–650.
42
Mayne, G. 2003. The St. Clair River Area of Concern Remedial Action Plan Progress Report
Volume 1 - Synthesis Report Environmental Conditions and Implementation Actions
(1998-2003). Research, writing and editing by: Greg Mayne, Environment Canada.
Editing by: Sandra George, Jennifer Vincent and Luca Cargnelli, Environment Canada;
Ted Briggs and Stewart Thornley, Ontario Ministry of the Environment; Shanna Draheim,
Michigan Department of Environmental Quality. Original draft copy provided by: North-
South Environmental Inc., Campbellville, ON.
Ministry of the Environment (MOE). 2012. Water quality of 15 streams in agricultural
watersheds of Southwestern Ontario 2004-2009. Seasonal patterns, regional
comparisons, and the influence of land use. Queen’s Printer for Ontario, August 2012.
Ministry of the Environment and Energy (MOEE). 1994a. Policies, guidelines, provincial Water
Quality Objectives of the Ontario Ministry of Environment and Energy. July 1994.
Ministry of the Environment and Energy (MOEE). 1994b. Deriving Receiving-water based,
point-source effluent requirements for Ontario waters. July 1994.
New York State Department of Environmental Conservation (NYSDEC). 2008. Niagara River
Area of Concern Delisting Targets. Submitted to United States Environmental Protection
Agency, December 9, 2008.
New York State Department of Environmental Conservation (NYSDEC). 1994. Niagara River
Remedial Action Plan. September 1994.
Niagara Peninsula Conservation Authority (NPCA). 1999. Welland River Watershed Strategy.
November 1999.
Niagara Peninsula Conservation Authority (NPCA). 2000. Niagara River Remedial Action Plan
Implementation Annex. November 2000.
Niagara River Remedial Action Plan (RAP). 1993. Stage 1: Environmental Conditions and
Problem Definition. September 1993.
Niagara River Remedial Action Plan (RAP). 1995. Stage 2: The Cleanup Connection.
Niagara River (Ontario) Remedial Action Plan (RAP). 2007. Environment Canada Restoration
Programs. Technical Review of Impairments and Delisting Criteria. Final Draft. Appendix
H. June 2007.
Niagara River Remedial Action Plan (RAP). 2009. Stage 2 Update report. December 2009.
Niagara River Remedial Action Plan (RAP). 2013a. Nutrient Trackdown in Beaver Creek and
Big Fork Creek Watersheds in the Niagara River Area of Concern in Support of the
Beneficial Use Impairment: Eutrophication and Undesirable Algae. July 2013. (DRAFT)
Niagara River Remedial Action Plan (RAP). 2013b. Niagara River RAP Beneficial Use
Impairment (BUI) Status Sheet 2013 (11-2013).
43
Niagara River (New York) RAP. 2012. Remedial Action Plan Stage 2 Addendum Niagara River
Area of Concern. January 2012. Available:
http://www.dec.ny.gov/docs/water_pdf/nrstage2addfinal.pdf [Last accessed February 20,
2015].
North-South Environmental Inc.. 2003. Lake Superior and St. Marys River AOCs Delisting
Criteria and Re-evaluation of BUI’s. Prepared for: Lake Superior Binational Program Work
Group. March 2003.
Ontario Water Resources Commission (OWRC). 1970. Report to the IJC on the Niagara River.
Status of compliance with IJC objectives based on evaluation of 1969 water quality data.
Ontario Water Resources Commission (OWRC). 1965. Water Quality Survey of the Welland
River 1964-1965
Plumb, R.H. and R.A. Sweeney. 1980. 1980 Niagara River-Lake Ontario Monitoring
Preliminary Results. Great Lakes Laboratory. State University College at Buffalo.
Post, L.E., Kauss, P.B. and J. Anderson. 1987. Surface Water Quality of the Niagara River
1980 – 1982. Queen’s Printer for Ontario.
Rouge River Remedial Action Plan. 2004. 2004 Rouge River Remedial Action Plan Revision
Schindler, D.W. 1977. Evolution of Phosphorus Limitation in Lakes. Science. 21: pp.260-262.
St. Lawrence River Restoration Council (SLRRC). 2012. St. Lawrence River (Cornwall) Area of
Concern. Stage 3 Remedial Action Plan (RAP) Report. August 2012.
Toronto RAP. 2011. Public Guide to the Toronto and Region Remedial Action Plan Beneficial
Use Impairment Criteria Review and Update, April 2011.
United States Environmental Protection Agency (US EPA). 1997. Guidelines for Preparation of
the Comprehensive State Water Quality Assessments. U.S. Washington, DC:
Environmental Protection Agency. Office of Water.
Wetzel, R.G. 2001. Limnology. Academic Press, New York. 1006 pp.
44
Appendix I: The 2012 Protocol of the Great Lakes Water Quality Agreement.
Under the 2012 Protocol, the commitment to ensure that RAPs are developed, periodically updated, and implemented for each AOC is laid out in Annex 1. Each RAP will:
• Identify beneficial use impairments (BUIs - see section 1.1.1) and causes
• Include criteria for restoring beneficial uses to be established in consultation with the local community. “Delisting criteria” are measurable environmental conditions or performance measures that must be achieved for each BUI in order to conclude that the BUI has been completely addressed. The delisting criteria assist the RAP stakeholders to determine when the work of the RAP has been completed and accomplished its objectives;
• Identify remedial measures to be taken and entities responsible for implementing these measures. These actions are undertaken by public, private and community organizations. The scale of these projects can range from outreach and education programs to complex environmental remediation or public infrastructure projects. Funding comes from both public and private sector sources.
• Summarize how remedial measures have been implemented and provide updates on the status of the beneficial uses; and
• Describe surveillance and monitoring processes to track effectiveness and confirm restoration of beneficial uses (Government of the United States of America and the Government of Canada, 2012; Annex 1).
The Protocol also changed the previous reporting requirements for Remedial Action Plans. Up to this point the Niagara RAP met the previous requirements. A Stage 1 report defined the environmental problems of the AOC and the ways in which use and enjoyment of the Great Lakes has been affected by degraded water quality. The Stage 2 and Stage 2 Update reports provided recommendations for actions to restore the beneficial uses that were impaired and defined in the Stage 1 report. In the 2012 GLWQA Protocol, the emphasis is to report on incremental progress and to provide evidence the BUIs are being restored in a timely fashion. Progress is to be reported to the IJC every three years through the Progress Report of the Parties. Further information on the Great Lakes Water Quality Protocol of 2012 is found in http://www.ec.gc.ca/grandslacs-greatlakes/default.asp?lang=En&n=45B79BF9-1 An AOC is delisted when the beneficial use impairments have been addressed. At this point all remedial actions have been completed and monitoring has confirmed that water quality and ecosystem health (i.e., the beneficial uses) have been restored. Or, the status of the AOC could be changed to Area in Recovery if all actions had been implemented and time was needed for the ecosystem to recover. It should be noted that when an AOC is delisted, it means that the water quality issues that caused the AOC to be originally designated at Stage 1 have been addressed. Therefore, conditions in the AOC are comparable to surrounding watersheds. It does not mean that the area has been restored to pristine or pre-settlement conditions. After delisting, it is anticipated that local stakeholders, including government agencies, will continue to maintain and enhance the environmental gains made under the RAP. The decision to delist a Canadian AOC is made by the Government of Canada in consultation
with the Province of Ontario, local RAP partners and the public and, for Niagara, with the U.S.
RAP state and federal officials. It is possible for one side of the River to delist before the other.
Delisting an AOC is also undertaken with input from the International Joint Commission.
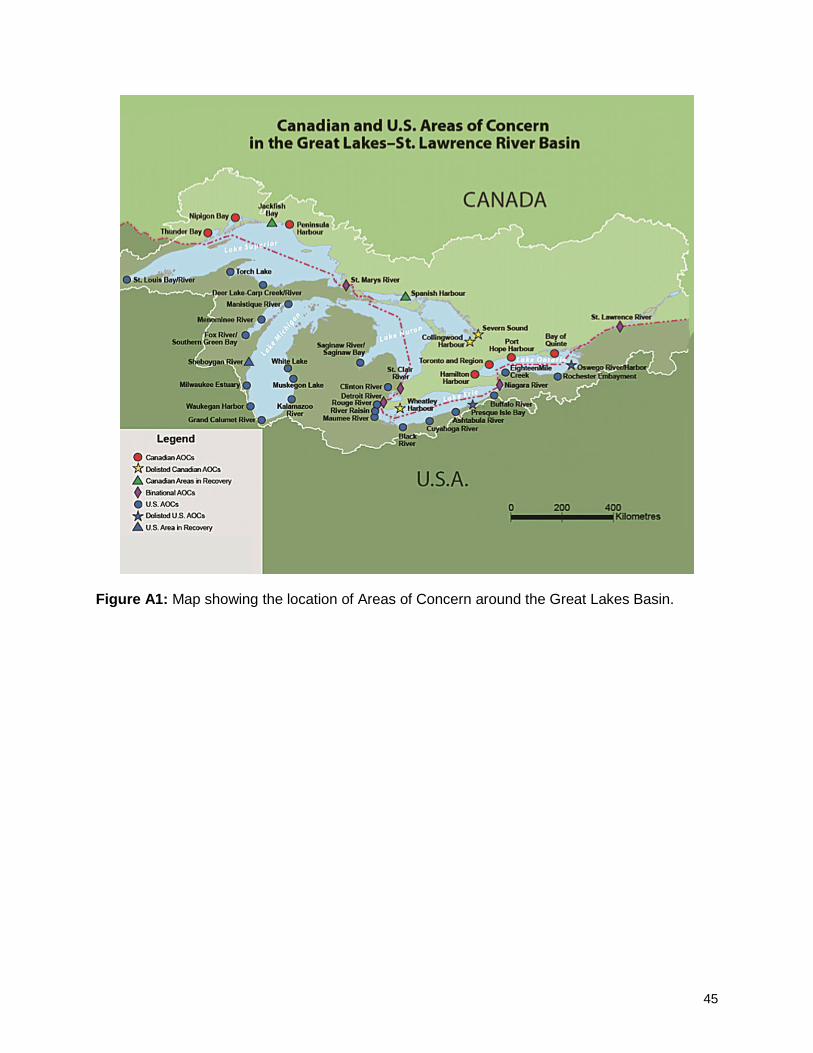
45
Figure A1: Map showing the location of Areas of Concern around the Great Lakes Basin.
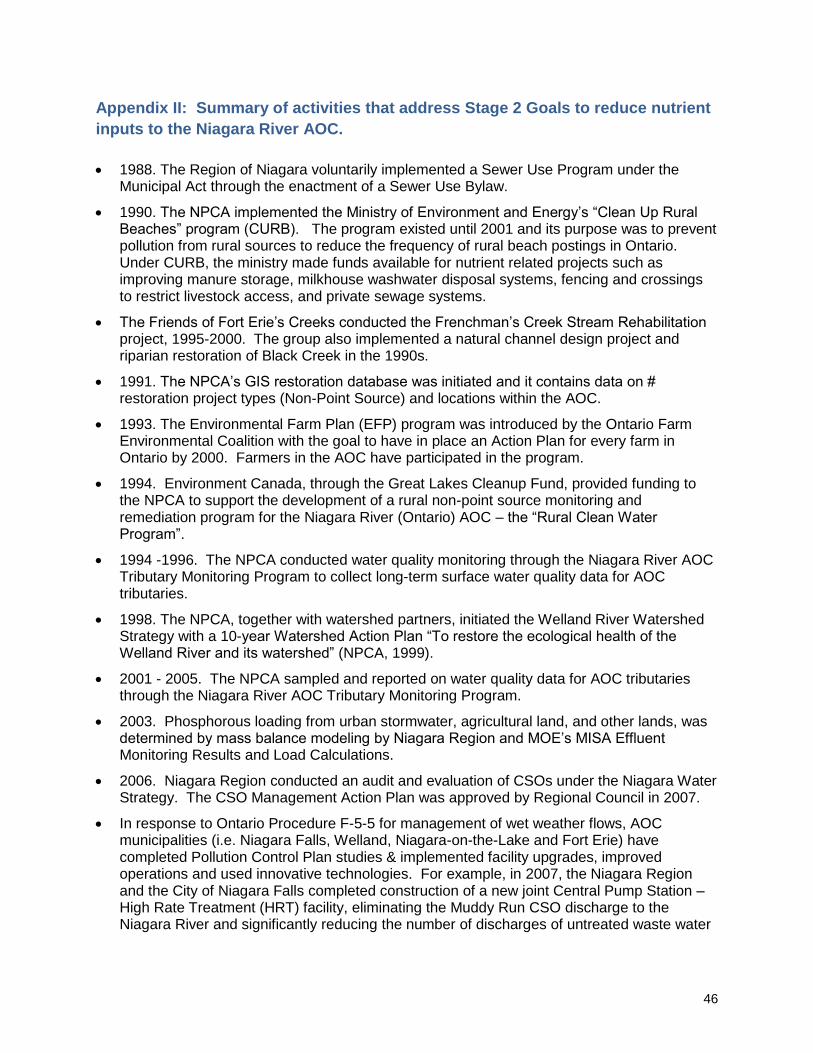
46
Appendix II: Summary of activities that address Stage 2 Goals to reduce nutrient
inputs to the Niagara River AOC.
• 1988. The Region of Niagara voluntarily implemented a Sewer Use Program under the Municipal Act through the enactment of a Sewer Use Bylaw.
• 1990. The NPCA implemented the Ministry of Environment and Energy’s “Clean Up Rural Beaches” program (CURB). The program existed until 2001 and its purpose was to prevent pollution from rural sources to reduce the frequency of rural beach postings in Ontario. Under CURB, the ministry made funds available for nutrient related projects such as improving manure storage, milkhouse washwater disposal systems, fencing and crossings to restrict livestock access, and private sewage systems.
• The Friends of Fort Erie’s Creeks conducted the Frenchman’s Creek Stream Rehabilitation project, 1995-2000. The group also implemented a natural channel design project and riparian restoration of Black Creek in the 1990s.
• 1991. The NPCA’s GIS restoration database was initiated and it contains data on # restoration project types (Non-Point Source) and locations within the AOC.
• 1993. The Environmental Farm Plan (EFP) program was introduced by the Ontario Farm Environmental Coalition with the goal to have in place an Action Plan for every farm in Ontario by 2000. Farmers in the AOC have participated in the program.
• 1994. Environment Canada, through the Great Lakes Cleanup Fund, provided funding to the NPCA to support the development of a rural non-point source monitoring and remediation program for the Niagara River (Ontario) AOC – the “Rural Clean Water Program”.
• 1994 -1996. The NPCA conducted water quality monitoring through the Niagara River AOC Tributary Monitoring Program to collect long-term surface water quality data for AOC tributaries.
• 1998. The NPCA, together with watershed partners, initiated the Welland River Watershed Strategy with a 10-year Watershed Action Plan “To restore the ecological health of the Welland River and its watershed” (NPCA, 1999).
• 2001 - 2005. The NPCA sampled and reported on water quality data for AOC tributaries through the Niagara River AOC Tributary Monitoring Program.
• 2003. Phosphorous loading from urban stormwater, agricultural land, and other lands, was determined by mass balance modeling by Niagara Region and MOE’s MISA Effluent Monitoring Results and Load Calculations.
• 2006. Niagara Region conducted an audit and evaluation of CSOs under the Niagara Water Strategy. The CSO Management Action Plan was approved by Regional Council in 2007.
• In response to Ontario Procedure F-5-5 for management of wet weather flows, AOC municipalities (i.e. Niagara Falls, Welland, Niagara-on-the-Lake and Fort Erie) have completed Pollution Control Plan studies & implemented facility upgrades, improved operations and used innovative technologies. For example, in 2007, the Niagara Region and the City of Niagara Falls completed construction of a new joint Central Pump Station – High Rate Treatment (HRT) facility, eliminating the Muddy Run CSO discharge to the Niagara River and significantly reducing the number of discharges of untreated waste water
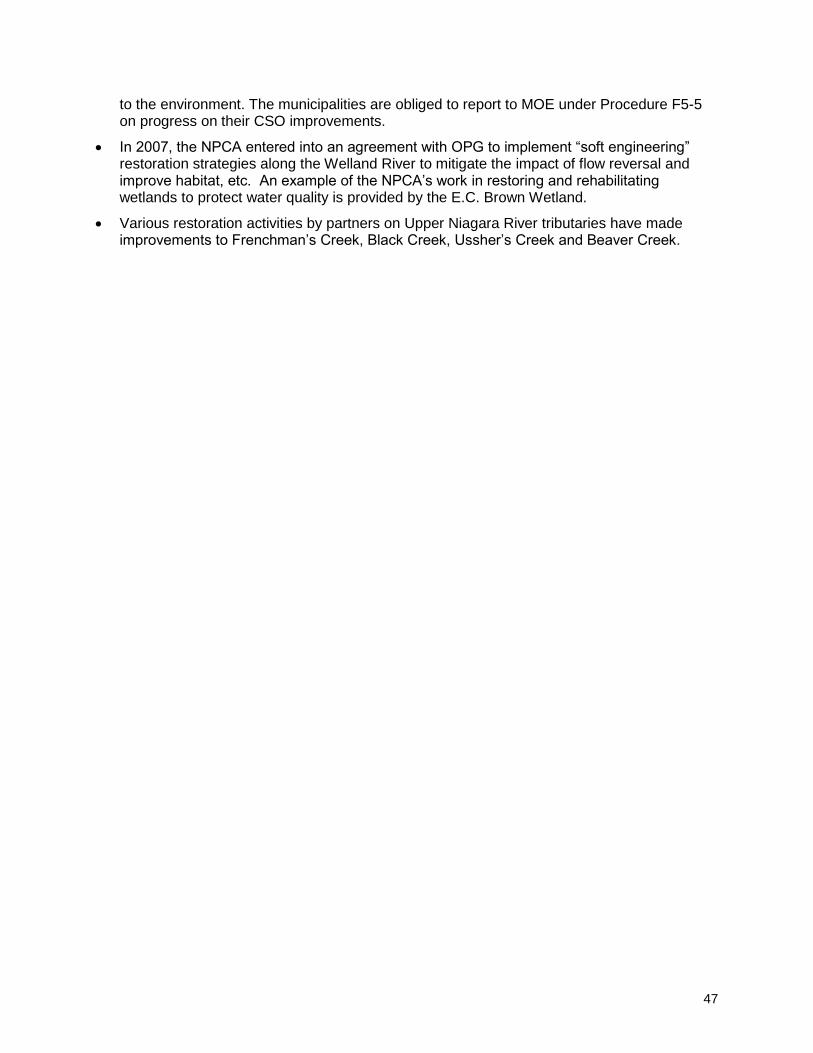
47
to the environment. The municipalities are obliged to report to MOE under Procedure F5-5 on progress on their CSO improvements.
• In 2007, the NPCA entered into an agreement with OPG to implement “soft engineering” restoration strategies along the Welland River to mitigate the impact of flow reversal and improve habitat, etc. An example of the NPCA’s work in restoring and rehabilitating wetlands to protect water quality is provided by the E.C. Brown Wetland.
• Various restoration activities by partners on Upper Niagara River tributaries have made improvements to Frenchman’s Creek, Black Creek, Ussher’s Creek and Beaver Creek.
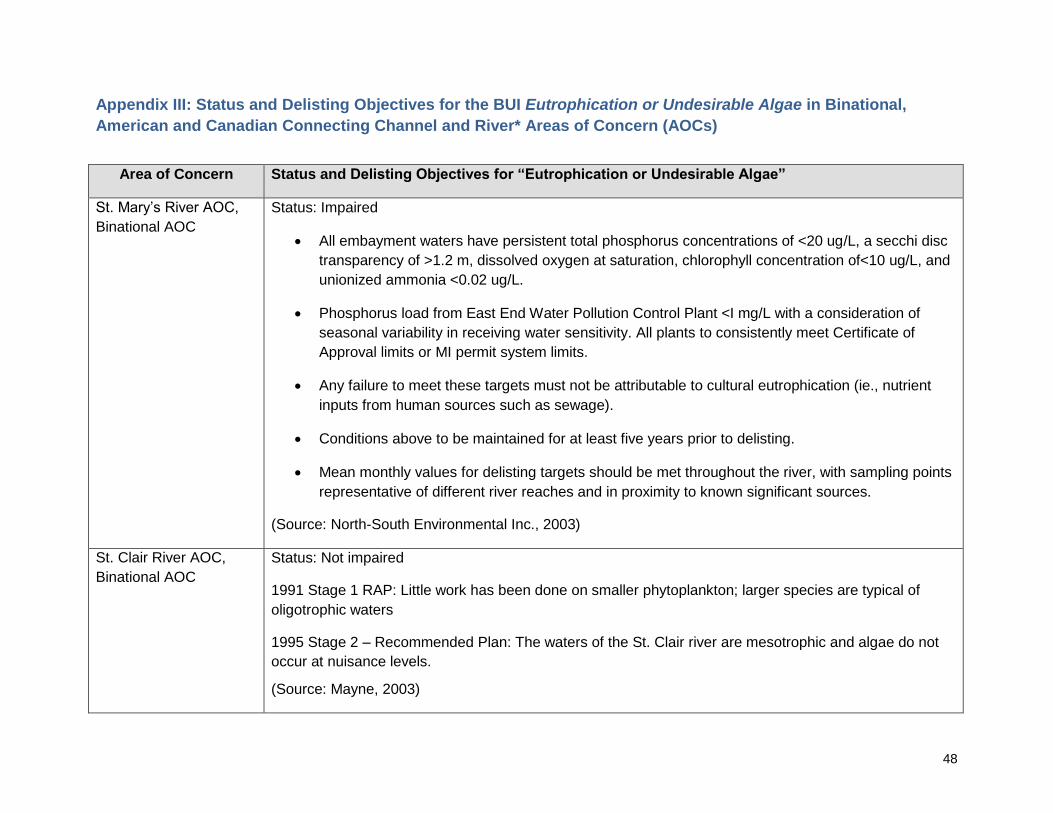
48
Appendix III: Status and Delisting Objectives for the BUI Eutrophication or Undesirable Algae in Binational,
American and Canadian Connecting Channel and River* Areas of Concern (AOCs)
Area of Concern Status and Delisting Objectives for “Eutrophication or Undesirable Algae”
St. Mary’s River AOC,
Binational AOC
Status: Impaired
• All embayment waters have persistent total phosphorus concentrations of <20 ug/L, a secchi disc
transparency of >1.2 m, dissolved oxygen at saturation, chlorophyll concentration of<10 ug/L, and
unionized ammonia <0.02 ug/L.
• Phosphorus load from East End Water Pollution Control Plant <I mg/L with a consideration of
seasonal variability in receiving water sensitivity. All plants to consistently meet Certificate of
Approval limits or MI permit system limits.
• Any failure to meet these targets must not be attributable to cultural eutrophication (ie., nutrient
inputs from human sources such as sewage).
• Conditions above to be maintained for at least five years prior to delisting.
• Mean monthly values for delisting targets should be met throughout the river, with sampling points
representative of different river reaches and in proximity to known significant sources.
(Source: North-South Environmental Inc., 2003)
St. Clair River AOC,
Binational AOC
Status: Not impaired
1991 Stage 1 RAP: Little work has been done on smaller phytoplankton; larger species are typical of
oligotrophic waters
1995 Stage 2 – Recommended Plan: The waters of the St. Clair river are mesotrophic and algae do not
occur at nuisance levels.
(Source: Mayne, 2003)
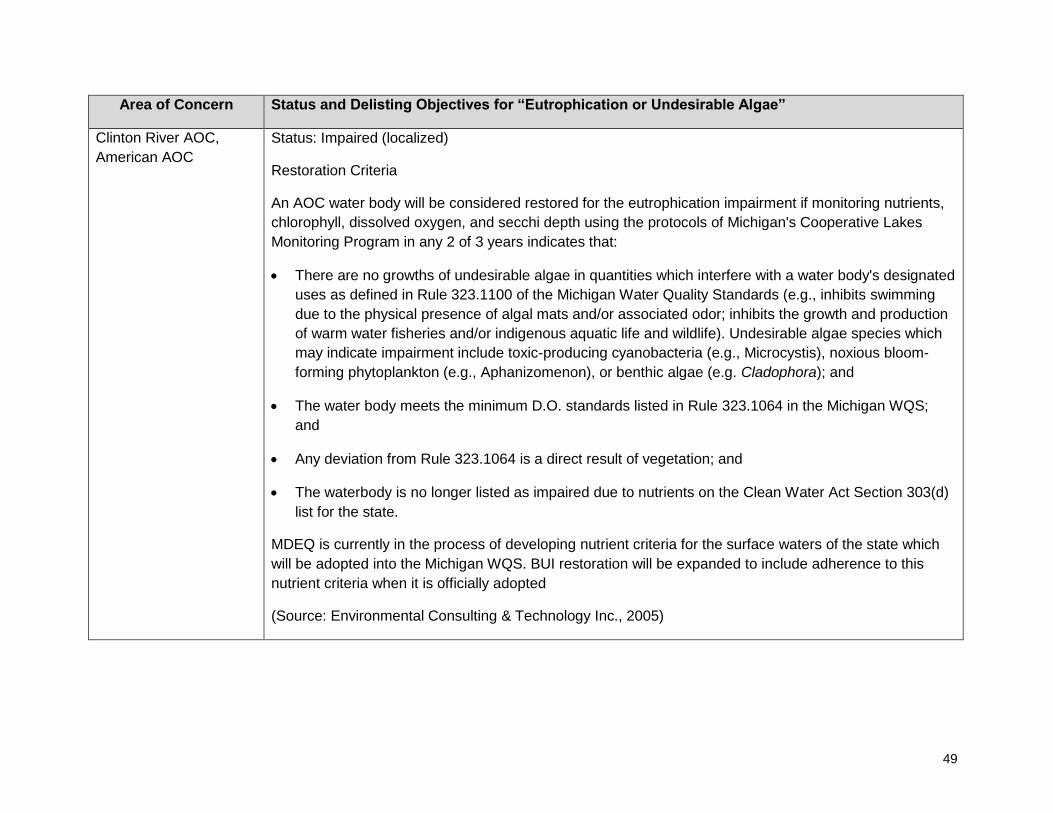
49
Area of Concern Status and Delisting Objectives for “Eutrophication or Undesirable Algae”
Clinton River AOC,
American AOC
Status: Impaired (localized)
Restoration Criteria
An AOC water body will be considered restored for the eutrophication impairment if monitoring nutrients,
chlorophyll, dissolved oxygen, and secchi depth using the protocols of Michigan's Cooperative Lakes
Monitoring Program in any 2 of 3 years indicates that:
• There are no growths of undesirable algae in quantities which interfere with a water body's designated
uses as defined in Rule 323.1100 of the Michigan Water Quality Standards (e.g., inhibits swimming
due to the physical presence of algal mats and/or associated odor; inhibits the growth and production
of warm water fisheries and/or indigenous aquatic life and wildlife). Undesirable algae species which
may indicate impairment include toxic-producing cyanobacteria (e.g., Microcystis), noxious bloom-
forming phytoplankton (e.g., Aphanizomenon), or benthic algae (e.g. Cladophora); and
• The water body meets the minimum D.O. standards listed in Rule 323.1064 in the Michigan WQS;
and
• Any deviation from Rule 323.1064 is a direct result of vegetation; and
• The waterbody is no longer listed as impaired due to nutrients on the Clean Water Act Section 303(d)
list for the state.
MDEQ is currently in the process of developing nutrient criteria for the surface waters of the state which
will be adopted into the Michigan WQS. BUI restoration will be expanded to include adherence to this
nutrient criteria when it is officially adopted
(Source: Environmental Consulting & Technology Inc., 2005)
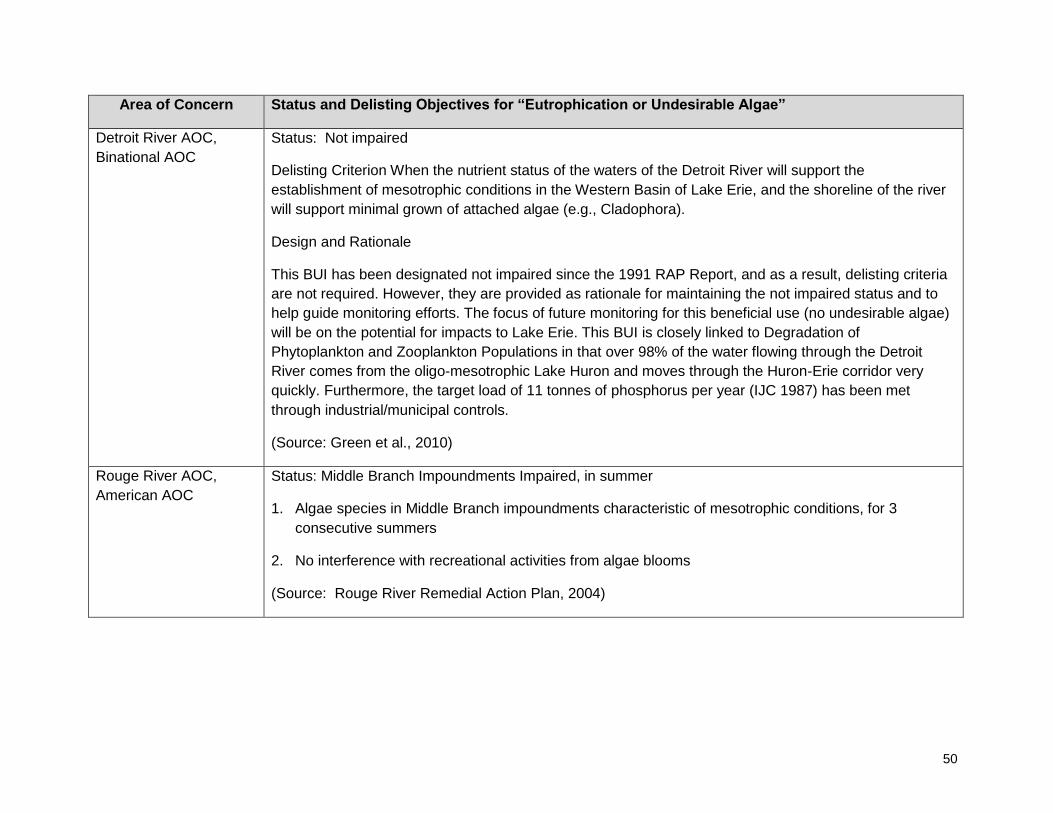
50
Area of Concern Status and Delisting Objectives for “Eutrophication or Undesirable Algae”
Detroit River AOC,
Binational AOC
Status: Not impaired
Delisting Criterion When the nutrient status of the waters of the Detroit River will support the
establishment of mesotrophic conditions in the Western Basin of Lake Erie, and the shoreline of the river
will support minimal grown of attached algae (e.g., Cladophora).
Design and Rationale
This BUI has been designated not impaired since the 1991 RAP Report, and as a result, delisting criteria
are not required. However, they are provided as rationale for maintaining the not impaired status and to
help guide monitoring efforts. The focus of future monitoring for this beneficial use (no undesirable algae)
will be on the potential for impacts to Lake Erie. This BUI is closely linked to Degradation of
Phytoplankton and Zooplankton Populations in that over 98% of the water flowing through the Detroit
River comes from the oligo-mesotrophic Lake Huron and moves through the Huron-Erie corridor very
quickly. Furthermore, the target load of 11 tonnes of phosphorus per year (IJC 1987) has been met
through industrial/municipal controls.
(Source: Green et al., 2010)
Rouge River AOC,
American AOC
Status: Middle Branch Impoundments Impaired, in summer
1. Algae species in Middle Branch impoundments characteristic of mesotrophic conditions, for 3
consecutive summers
2. No interference with recreational activities from algae blooms
(Source: Rouge River Remedial Action Plan, 2004)
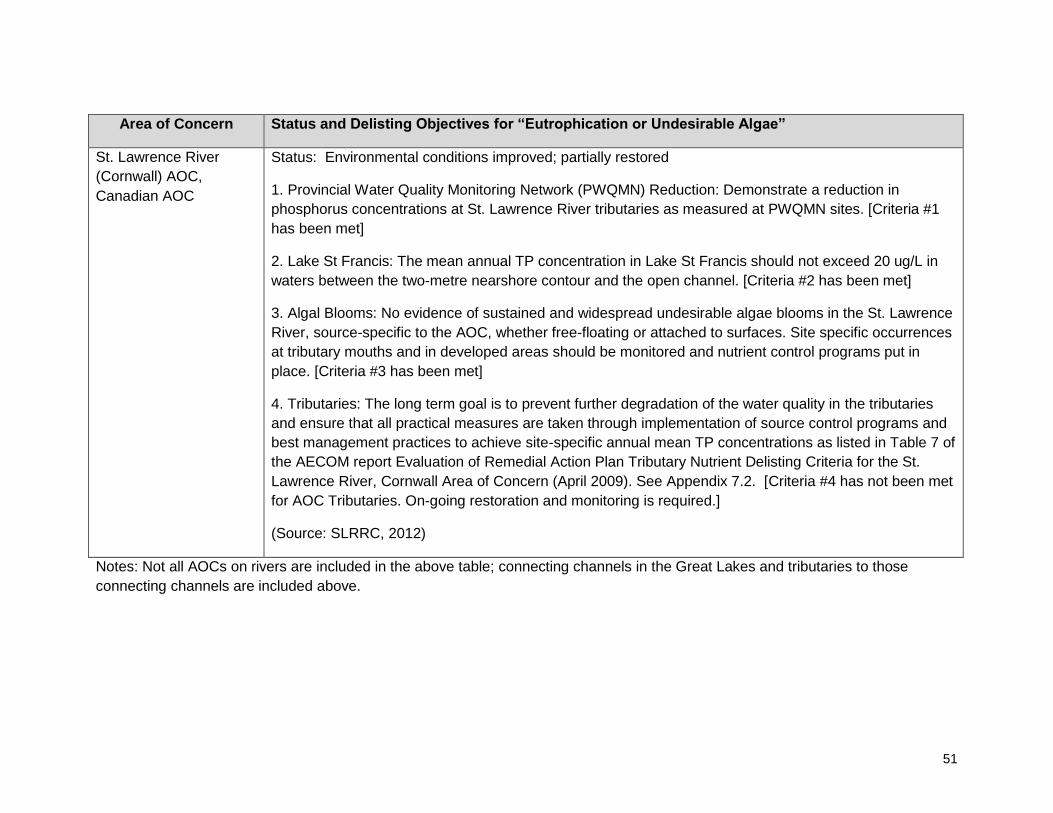
51
Area of Concern Status and Delisting Objectives for “Eutrophication or Undesirable Algae”
St. Lawrence River
(Cornwall) AOC,
Canadian AOC
Status: Environmental conditions improved; partially restored
1. Provincial Water Quality Monitoring Network (PWQMN) Reduction: Demonstrate a reduction in
phosphorus concentrations at St. Lawrence River tributaries as measured at PWQMN sites. [Criteria #1
has been met]
2. Lake St Francis: The mean annual TP concentration in Lake St Francis should not exceed 20 ug/L in
waters between the two-metre nearshore contour and the open channel. [Criteria #2 has been met]
3. Algal Blooms: No evidence of sustained and widespread undesirable algae blooms in the St. Lawrence
River, source-specific to the AOC, whether free-floating or attached to surfaces. Site specific occurrences
at tributary mouths and in developed areas should be monitored and nutrient control programs put in
place. [Criteria #3 has been met]
4. Tributaries: The long term goal is to prevent further degradation of the water quality in the tributaries
and ensure that all practical measures are taken through implementation of source control programs and
best management practices to achieve site-specific annual mean TP concentrations as listed in Table 7 of
the AECOM report Evaluation of Remedial Action Plan Tributary Nutrient Delisting Criteria for the St.
Lawrence River, Cornwall Area of Concern (April 2009). See Appendix 7.2. [Criteria #4 has not been met
for AOC Tributaries. On-going restoration and monitoring is required.]
(Source: SLRRC, 2012)
Notes: Not all AOCs on rivers are included in the above table; connecting channels in the Great Lakes and tributaries to those
connecting channels are included above.