next generation competition · next generation competition 2 • next generation access (nga)...
TRANSCRIPT

Next Generation CompetitionDriving Innovation in Telecommunications
October 2009
Table of contents
i. Key messages / pg. 1
ii. Background and approach / pg. 3
iii. Executive summary / pg. 5
1. The European telecom market today / pg. 11
a) Importance of the telecommunications sectorb) Overview of the telecommunications market c) Competitive landscape
2. The evolution of telecommunications competition in Europe / pg. 23
3. The state of availability of competing fixed access infrastructures in Europe / pg. 27
4. Forces of change / pg. 31
a) Technology developmentb) Consumer demand and preferences
5. Broadband upgrade economics / pg. 45
6. The potential competitive evolution of Europe’s telecommunications market / pg. 53
a) Framework descriptionb) Future market structures
October 2009
1
i. Key messages
• Europe has one of the most competitive telecom markets globally. Especially at the infrastructure level, competition has intensified in the past decade. We are seeing an accelerated pace of innovation and convergence leading the market to the NextGeneration Competition.
• The €250 billion Western European telecommunications market is of vital importanceto Europe’s economic growth and competitiveness. The broadband sector which rep-resented 14 per cent of the market in 2008 is rapidly expanding with revenues grow-ing at 28 per cent per year since 2004 compared with overall growth of 3 per cent forthe overall market.
• Broadband access is increasingly at the epicenter of competition between telecomproviders. Many applications are carried on broadband. Voice is already used, video is following, competing with traditional providers such as satellite, cable and digitalterrestrial television (DTT), with more applications potentially to follow.
• Broadband innovations have led to a series of significant speed upgrades. Accordingto Akamai, for example, the average download speed for 19 European countries is closeto 4 Mbit/s. With further upgrades to existing infrastructure, significantly higher speedscan be expected.
• Projecting the known applications that are most frequently used by the largest major-ity of consumers today—and accounting for the growing appetite for high-bandwidthapplications by more and more consumers over the next few years—it is reasonable to believe that bandwidth of 30 Mbit/s to 40 Mbit/s will represent a very significantenhancement of the services currently available to the majority of consumers as theygradually increase their demand for bandwidth.
• In the absence of any disruptive “new to the world” high-bandwidth applications, it isreasonable to believe that the most economically efficient objective for infrastructureproviders over the next three to five years is to gradually increase speeds available tothe mass market and move up the “consumer sweet spot,” which in the context of thisreport means the majority of consumer demand for applications supported by broad-band. Whilst gradually enabling higher speeds for the mass market, providers will likelycontinue to roll out and market ultra-high (>>100 Mbit/s) bandwidths.
• Industry estimates of where this mass-market sweet spot will be across Europe by2014 vary widely, depending on a number of factors, including variations in supplyand demand for high-speed broadband in different markets.
Next Generation Competition
2
• Next Generation Access (NGA) won’t be accomplished by a “single leap forward”. Mostfixed infrastructures today can, in fact, be upgraded to NGA with the right investmentincentives. It remains uncertain how much consumers are willing to pay for higher-bandwidth. As a result, broadband providers so far appear to be more inclined to follow a natural pace of experimentation and adaptation to consumer demand, ratherthan invest in major system-wide network upgrades.
• High-speed broadband has so far followed a pattern of continuous, counter-cyclicalwaves of innovation and investments. That is especially true where there is competitionamong access infrastructure providers, as one player’s progress in network upgrades tohigher speeds usually triggers competitive responses from other players.
• Next Generation Competition is likely to evolve along similar lines, as a number ofdifferent infrastructure providers seek to balance investments in technology advancesand product innovations against emerging consumer needs—with the objective of ensuring investors can recoup a return on their investments.
• A major challenge confronting the companies engaged in Next Generation Competitionis how to earn sustainable returns in markets with multiple wireline access infrastructures,except in some of the most densely populated markets. The analysis so far indicatesthat two fixed infrastructures with wireless challenger infrastructure competition(satellite-TV, DTT, 3G–4G voice and data) create a dynamic competitive market witheconomically sustainable competition.
• Consolidation among subscale or regional players and service resellers is expected.This scenario is more likely in countries with fragmented cable and fragmentedbroadband provider landscapes. Consolidation, in turn, will shape the competitive dynamics, with improved economies of scale from procurement, marketing and over-heads for the merged entities being the foundation of more competitive intensity at a national level.
• Markets with one single fixed access infrastructure lack the competitive dynamic between access infrastructure owners with the incentives of “first mover investmentadvantage” and operate with heavier regulations. These factors may have the effect ofslowing investments in innovation and network upgrades in some markets. Creativebreak-out solutions may stimulate innovation more rapidly.
• Despite delivering lower speeds, wireless infrastructure providers are emerging ascompetitors to wireline companies in broadband markets throughout Europe in a significant part of the market. Next generation wireless technologies such as long-term evolution (LTE) will further intensify this wireless-wireline competition.
October 2009
3
ii. Background and approach
Europe has built one of the most competitive telecommunications markets in the world.It is balancing the objective of stimulating effective competition in the market with socialeconomic policies relating to an inclusive Information Society. Particularly, Europe’s lead-ing broadband nations rank amongst the most competitive digital economies along withthe US, Japan and Korea.
In order to maintain its broadband leadership and accelerate growth in the European digitaleconomy, the European Union has reinforced its commitment to a number of policiesunder its “Digital Europe” strategy in support of the EU’s new social economic objectiveof a “radical transformation towards a Knowledge-Based Society”i. The EU’s objectives arethat all Europeans have access to broadband Internet by 2010, and to high-speed broadbandInternet by 2013ii, although specific speeds have not been defined.
The deployment of Next Generation Access (NGA) networks has become a priority and akey approach for the European Commission (EC) to meet these Digital Europe objectives.In this report, networks are considered to be NGA if they offer broadband speeds of morethan 50 Mbit/s. Such speeds would, for example, enable consumers to view multiple high-definition video streams, allow for video communication and a multitude of further servicessuch as telemedicine. The challenge facing both broadband providers and policy-makers is to use this next wave of telecom innovation to provide significant upgrades from today’sbroadband products for the largest possible group of EU citizens.
Following EC priority setting, we are witnessing an accelerating push for upgrades andbuild-out of these infrastructures across Europe over the next five years. Regulators andgovernments are still in the process of formulating their approach on how to stimulatethe transition and some market participants are eagerly awaiting those decisions beforemaking major investments.
The magnitude of macroeconomic value of a next generation infrastructure expansion isstill much debated in the academic and governmental communities. Some reports indicatehigh short-term gross domestic product (GDP) and employment gains levelling off overtime. A recent EU report estimates NGA roll-out in Europe could create up to one millionnew jobs and result in €850 billion in economic activity.
Given what may be at stake and the rapidly changing market, regulators, governmentsand market participants will need to set a vision for the shape of the market over the nextfive years. This will require making informed choices on key questions such as:
• How fast will demand for high-bandwidth applications develop and what is drivingthis development?
i Barroso, Jose Manuel, President of the European Commission, Letter to European Heads of State and Government of Member States, 17 June 2009 [http://ec.eu-
ropa.eu/commission_barroso/president/pdf/statement_20090618_en.pdf ].ii Reding, Viviane, “Digital Europe—Europe’s Fast Track to Economic Recovery”, The Ludwig Erhard Lecture 2009, Lisbon Council, Brussels 9 July 2009.
Next Generation Competition
4
• How fast will—and should—broadband networks migrate to higher-bandwidthand what are the drivers of this transition?
• How much access infrastructure competition is desirable and sustainable?
• How to avoid a digital divide once NGA becomes a prevalent standard?
• How to balance the investment risk between investors and market participants?
The answer will vary from country to country—and within nations (for example, rural versusurban areas). A key driver of answering these questions in each market is the starting position of the country or region. What is the current country or regional infrastructurecoverage? With are the technical capabilities? How many players exist? What are the keyconsumer trends? What is the current regulatory environment?
This report takes stock of the current state of play of the European telecommunicationsmarket. It focuses mainly on the consumer segment and describes the past evolution andits drivers. It also provides a perspective on possible future market structures and potentialpathways going forward.
In order to understand the challenges and opportunities for Next Generation Competitionacross Europe, we use the following approach:
1. We analyse the major factors that influenced the evolution of telecommunicationsin the past—including market forces, competitor dynamics and business strategies—and then assess the potential impact of these factors on the future development oftelecommunications in Europe.
2. To account for differences in market conditions across the various Europeancountries, we analyse countries with similar conditions.
3. We describe the potential paths the future evolution of telecommunications mighttake in specific countries.
4. We present likely scenarios of future market structures, taking into account thepossible evolution of telecom infrastructure and consumer demand.
October 2009
5
iii. Executive summary
IntroductionIn the last two decades, the telecommunications sector in most European countries hasevolved from a national, state-owned monopoly to a vibrant, competitive marketplacewhere multiple providers—telecom operators, cable operators and service providers—arevying to provide customers a wide array of telecommunication services: from traditionalfixed-voice telephony to cutting-edge, over-the-top video streaming. This competitive marketplace and regulatory environment has resulted in significant consumer benefits—for example, telecom service prices have declined by 28 per cent since 1996 in Europe according to Eurostatiii.
The broadband market segment has become the fastest growing segment, increasing on average by 28 per cent between 2004 and 2007, driven by the improved availability of broadband networks and the increasing consumer demand for higher-speed access.With the potential to create more than one million jobs in the next few years, the telecomsector is crucial to Europe’s future competitiveness and can help to better navigate throughthe current economic downturn—but, at the same time, it represents a challenge for market players and regulators, as they grapple to define the shape and pace of Next Generation Competition.
While everyone shares a common vision for the future—to ensure that European con-sumers have access to the latest, world-class telecommunications services at prices thatare fair and equitable, that there is no compromise in quality and that consumers haveplenty of choice in terms of providers—there are many paths to achieving that goal. Ourresearch shows that each has its advantages and pitfalls. Add to that the unpredictable nature of two key forces influencing the future of European telecom—technological developments and consumers preferences—and forecasting the future of Europeantelecom becomes even more complex.
European regulators and market players understand they have to make choices—and thegoal of this report is to help them understand market dynamics and develop a practicalframework for decision making. We have focused our analyses on the “natural” marketdynamics of competition to identify those areas where competition will spur the transition tohigher-bandwidth networks, and those areas where the competitive stimulus might not besufficient to achieve the desired migration, with the risk of a digital divide.
Intensified competition in the European telecom market
Liberalisation in the European telecommunications market has led to increased competitionover the past 15 years. Today, competition exists not just at the telecommunications servicelevel but also at the infrastructure level where the key bottlenecks existed—a substantial
iiiEurostat July 2009; Countries in the study include BE, DE, IE, GR, ES, FR, IT, LU, NL, AT, PT, FI
Next Generation Competition
6
change from the time when each country had just one national telecom operator. Now,Europe’s telecom market has reached another important crossroads: “Next GenerationCompetition” offers an opportunity to review past approaches and frameworks andconsider options over the crucial next few years, as the global economy resets.
In doing so, it is important to consider the changing contours of competition:
• Competition for the same customers and same services has intensified between fixedand mobile network operators. In voice services in 2009, the total mobile voice trafficin Western Europeiv exceeded the total number of fixed voice calls; and increasingly, indata services too, consumers in specific segments like single households are switchingfrom fixed to mobile. That trend will intensify with the further roll-out of third-gener-ation mobile networks and investments in LTE networks, which will provide consumerswith much higher bandwidth speeds on mobile devices.
• In European markets where a second wireline access infrastructure is widely available(most frequently cable in residential households), telecom and cable operators are increasingly competing in one another’s traditional markets. This competition is alsospurring momentum for the upgrade of wireline networks, pushing them to providehigher broadband speeds. In countries such as the Netherlands, Belgium and Switzer-land which have two competing fixed infrastructures covering more than 80 per centof the population, consumers already experience higher average broadband speeds of5.3 Mbit/s compared with 4.0 Mbit/s in other Western European markets. In addition,in these three countries broadband penetration is at 32 per cent of the populationcompared with 25 per cent in other Western European countries.
A sustainable degree of infrastructure access competition is more likely tomake available required bandwidth more efficiently and in line with demandthan “top-down target setting”.
Like all digital consumers worldwide, European consumers also have an increasing appetitefor bandwidth and it is hard to predict what European consumers will be willing to payfor improved broadband services. Therefore, “bandwidth speed target setting” can resultin high-bandwidth speeds that appeal only to consumer niches, lacking a broad consumerbase willing to pay for the increase in capacity. One alternative, which appears to have greatereconomic rationale, is to focus on bringing the whole market to higher average accessspeeds, to a “consumer sweet spot” in line with what will likely be needed, appreciatedand paid for by mass audiences. By “sweet spot,” we mean the majority of consumerdemand for applications.
• Extending the offering significantly beyond current usage patterns can be done withspeeds up to 40 Mbit/s. For example, these speeds would allow for a household to simultaneously use several currently known applications and services (for example,the simultaneous use of voice, data, P2P sharing and up to three HD channels).
iv Countries included are: AT, BE, DK, FI, FR, DE, GR, IE, IT, NL, NO, PT, ES, SE, CH, UK
October 2009
7
• Due to uncertainty of consumer interest in high-bandwidth applications and theirwillingness to pay, it is unclear whether consumer pull will provide sufficient investmentincentives to migrate to NGA networks within the next five years.
• Separate from consumer pull, technology push by infrastructure owners may allowearlier consumer penetration of higher-bandwidth offerings at affordable prices.Continuous fixed and mobile infrastructure upgrades in broadband performance levels will move (and are moving now) the “consumer sweet spot” of the market upward—but not in one quantum leap.
Given the high levels of capital investment required, analysis so far indicatesthat it is difficult for most markets to support multiple fixed access infrastruc-tures—and two seems to be a more viable environment to promote technologyinnovation than the alternatives: either a myriad of failures of financiallyunsustainable players or a monopoly without infrastructure competition tostimulate innovation.
Two access infrastructures are the most sustainable level of achievable wireline infrastruc-ture competition. Under reasonable economic assumptions, including return on investment,it is difficult to economically justify more than two nationwide NGA networks in the resi-dential market. This economic “law of gravity” is an important factor in driving additionalsector consolidation, which generates mixed reactions but in practice often results in morevibrant competition compared with a multitude of regional or service/reseller-basedsmaller players.
• The nature of investment in dedicated wireline access to each household is highlycapital intensive and has high barriers to entry.
• As a consequence most typical consumer areas in a given country can support a maximum of two wireline access infrastructures—assuming that they leverage“brownfield” networks rather than greenfield build-outs. This applies to most consumer areas, with some exceptions in high-density regions.
• Historically, attempts to establish a multitude of fixed infrastructures beyond selecteddense geographies have failed due to unsustainable financials. In the UK market, forexample, 80 per cent of challengers either merged or went bankrupt within eightyears of entering the market.
• One likely result: Small players will increasingly team up to consolidate to create viable fixed national competitors, thus improving the competitive dynamics.
• Whilst challenging each other, dual fixed infrastructures typically compete as wellwith alternative infrastructures such as satellite, DTT and mobile, which provide bothsubstitution in certain segments and complement the offering in parts of the marketin which they have unique advantages.
Next Generation Competition
8
In countries with a sustainable number of access infrastructures, high-speedbroadband has so far followed a pattern of continuous, counter-cyclicalwaves of innovation and investments.
Countries where more than one fixed access infrastructure is available to the majority ofthe households appear to provide the most vibrant evolution to faster migration to higher-speed broadband. We observe this dynamic in a number of countries (representingapproximately 45 per cent of European households in terms of homes passed, althoughclose to 30 per cent in terms of homes actually connected). In these countries, generally,former PTT networks, cable and challenger fibre networks compete directly in access in-frastructure. In particular in the Netherlands, Belgium and Switzerland, most consumershave a real choice between competing infrastructures.
• Infrastructure competition provides strong incentives for infrastructure owners tocontinuously upgrade their networks and to invest in the next technology. Where dualfixed infrastructures exist each infrastructure owner has an incentive to invest (eitherselectively or nationwide) in the next generation of technology to provide consumerswith superior bandwidth performance in order to acquire or retain customers. Thistypically stimulates the competing network towards a counter-wave of investmentwhich, in turn, generates a further response from the other access provider.
• The recent consumer bandwidth race in many countries in this category has, for example,seen European cable operators upgrading to DOCSIS 3.0 to achieve NGA bandwidthperformance levels, benefiting from the lower and more gradual network upgradecosts. The likely result, already playing out in some markets including Germany andthe UK, is an acceleration of telecommunication companies’ investment to respondwith their own technological solution.
• In countries where fixed access infrastructure operators are a collection of regional orsmaller players, consolidation into a national competitor can have the effect of furtherstimulating competition as a result of scale efficiencies in multiple areas (branding,content, procurement), providing additional room for network investment.
Next Generation Competition: matching consumer needs, technology innovationand investor returns.
Sustainable infrastructure competition seems to be the most effective stimulant for continuous innovation and network expansion.
• Most fixed infrastructures today are, in fact, NGA-capable with the right investmentincentives, given that the existing telecommunication and cable networks are in essencebrownfield plant capable to evolve into NGA infrastructure. NGA network build-outshould therefore not be seen as a “quantum change” from today’s telecommunicationnetworks but rather a natural (and in most cases gradual) evolution build-out of allNGA-capable networks in a given market.
October 2009
9
• Next Generation Competition can be defined as infrastructure-based competition thatenables a healthy pace of technological development and NGA network roll-out allowingfor investors to recoup their returns while meeting evolving consumer uptake ofhigh-speed connections.
• There is likely to be no end state of infrastructure and competition in the telecommu-nications market; after the upcoming NGA era there will probably be a new generationof network technology satisfying the ever-increasing consumer demand for bandwidth.Having some degree of infrastructure competition will provide the foundation for thenext round of NGA.
Markets with underdeveloped challenger access infrastructure will be lookingfor creative alternatives and “out of the box” solutions.
In countries where a widespread nationwide access infrastructure alternative is missing orunavailable to a majority, new solutions are being contemplated. There are very significanteconomic challenges to additional national build-up of alternative greenfield NGA networks,due to the very high up-front investments versus the risk-adjusted returns. The situationin these markets may also result in a slower speed of upgrade of the existing infrastructure,given that single access infrastructure owners today are heavily regulated and investors inthese companies are understandably concerned about the risks of investing more. In thosemarkets, alternative solutions are likely to be experimented with to accelerate the migrationof existing infrastructures to NGA.
• A few international examples of solutions attempted include some form of regulatedlocal-loop structural carve-out of the single access infrastructure (for example, in theUK). This approach has been correlated to a stimulus in DSL roll-out, a proliferationof DSL resellers, moving into unbundlers once they achieved a certain scale and thenby a round of consolidation of these providers, although this approach does not resolveper se the issue of driving a fundamental network upgrade.
• Some countries have experimented with public vehicles or publicly funded incentivemechanisms (state aid, grants, tax holidays, regulatory exemptions, reverse auctionsfor local licences and so on) aimed at upgrading the existing single access infrastruc-ture. However these solutions have natural limitations given that they do not providesustainable long-term competitive tension to stimulate the next phase of innovation.
• There are few examples of approaches geared towards public stimuli aimed at sup-porting a single—either greenfield or brownfield—alternative access infrastructure.This approach may appear counter-intuitive (why use public funds to create redundantinfrastructure?), but it may produce, as a long-term outcome, impetus to innovationand future migration to the next technological wave.
• Wireless broadband can provide a powerful additional level of competition, albeit less so inthe ultra-high-bandwidth segment where wireless performance reaches natural limitations.
• Wireless broadband can also provide a solution to covering white spots in those marketswhere unfavourable economics make fixed access infrastructure build-out unfeasible.
Next Generation Competition
10
There is no one-size-fits-all approach
The future of Digital Europe is a mosaic. Each country’s telecommunications market willevolve based on its past investments, the number of players, the extent of the infrastructurecoverage and, of course, the willingness of its consumers to pay for the next generation of telecommunications services. As regulators and governments find the balance betweenstimulating consumer demand and encouraging market players to invest in the future,there will be corrections and mid-course adjustments. Technological change, after all, isoften disruptive and the migration to the Next Generation Access networks might well bea bumpy ride for some European countries.
October 2009
11
1. The European telecom market today
The European telecommunications market is of vital importance to Europe’s economicgrowth and competitiveness. The market is made up of four sub-segments—fixed voice,mobile voice, Internet and television (TV)—each with unique competitive dynamics andeconomics. Furthermore, for each of these sub-segments, the competitive and consumerdynamics of the market varies for each European country. In this chapter, we will providea brief overview of the market and the competitive landscape across Europe to set the stagefor our discussion of Next Generation Competition in the sector. For the purpose of thisreport, we define Europe as the 27 member states of the European Union (EU) as well asSwitzerland unless otherwise stated.
a) Importance of the telecommunications sectorThe European economy is in the midst of a world-wide economic crisis, experiencingsome of the most severe decline witnessed over the last 50 years. Across Europe, gross domestic product (GDP) has declined 4.7 per cent since its peak in the first quarter of2008, and the European Stock Index, the Euro Stoxx 501, has dropped by 49 per centsince July 20072. While the telecom sector represents 2.2 per cent of European GDP inrevenues3, its impact on the economy is much larger. According to a report published bythe World Bank, the information and communications technologies (ICT) sector has asignificant impact on the growth of an economy4,5.
Europe will need to continue investing in the sector to remain competitive during the current recession and prepare for the eventual recovery. In her July 9, 2009, speech at the Lisbon Council, EU Commissioner for Telecoms and Media Viviane Reding expressedthe European Commission’s belief that high-speed Internet deployment (fixed or wireless)“could create around one million jobs in Europe, and spur broadband-related growth ineconomic activity to the tune of €850 billion”6.
With this in mind, the European Commission and other national regulators are reviewingtheir policies to ensure competition in the market and stimulate investments in next gener-ation access (NGA) networks. Another important objective is to bridge the digital divide byproviding close to 100 per cent broadband coverage to Europe’s underserved rural areasby 2010.
1 The Dow Jones EURO STOXX 50 Index covers 50 Blue-chip stocks from 12 Eurozone countries.2 As of 10 July, 2009; Bloomberg3 EITO; Eurostat, European GDP defined as GDP of EU27 at €12.5 trillion in 2008; revenues of €250 billion in 2008 for fixed voice, mobile voice, broadband and TV
(includes some double counting in inter-operator revenues and termination rates)4 The report assessed the impact of a 10-point increase in penetration of telecommunications services such as fixed voice and broadband on economic growth (mea-
sured by percentage point increase in GDP). The analysis was conducted for multiple countries, which were split between high- and low-income economies.5 “ICAD 2009: Extending Reach and Increasing Impact”, The World Bank Group, 20096 “Digital Europe—Europe’s Fast Track to Economic Recovery”, Reding, Viviane, The Ludwig Erhard Lecture 2009, Lisbon Council, Brussels, July 9, 2009
Next Generation Competition
12
b) Overview of the telecommunications market Definition
This report defines the telecommunications market as the services offered to consumers:fixed voice, mobile voice, broadband and TV. We have focused more on the consumermarket, as it is less developed than the business market, where telecommunications competition first emerged.
The blurring of telecom service boundaries and the increased ability of market participantsto offer more than one product or service to consumers are changing the competitivelandscape. For example, cable operators such as Virgin Media that traditionally derived amajority of their revenues from TV subscriptions now see two-thirds of their revenuescome from either fixed-line telephony or broadband Internet. The emergence of Internetprotocol TV (IPTV), delivered by telecom operators over fibre or very high bit-rate digitalsubscriber line (VDSL) allows telecom operators to compete with cable and satelliteproviders in the TV market.
Similarly, mobile infrastructure is increasingly competing with wireline infrastructure,with mobile prices dropping closer to fixed-line prices. For example, in countries with lowmobile price levels like Austria, already 70 per cent of the voice traffic minutes are carriedover mobile networks compared with 45 per cent for the rest of Europe7.
The boundaries between the traditional product segments are blurring, too. Increasingly,consumers can access user-friendly and high-quality voice, video and live-TV applicationsover the Internet. These changes are steering the market towards a more bundled futurewhere the traditional fixed products become applications over a broadband connection.
Market size, growth and profitability
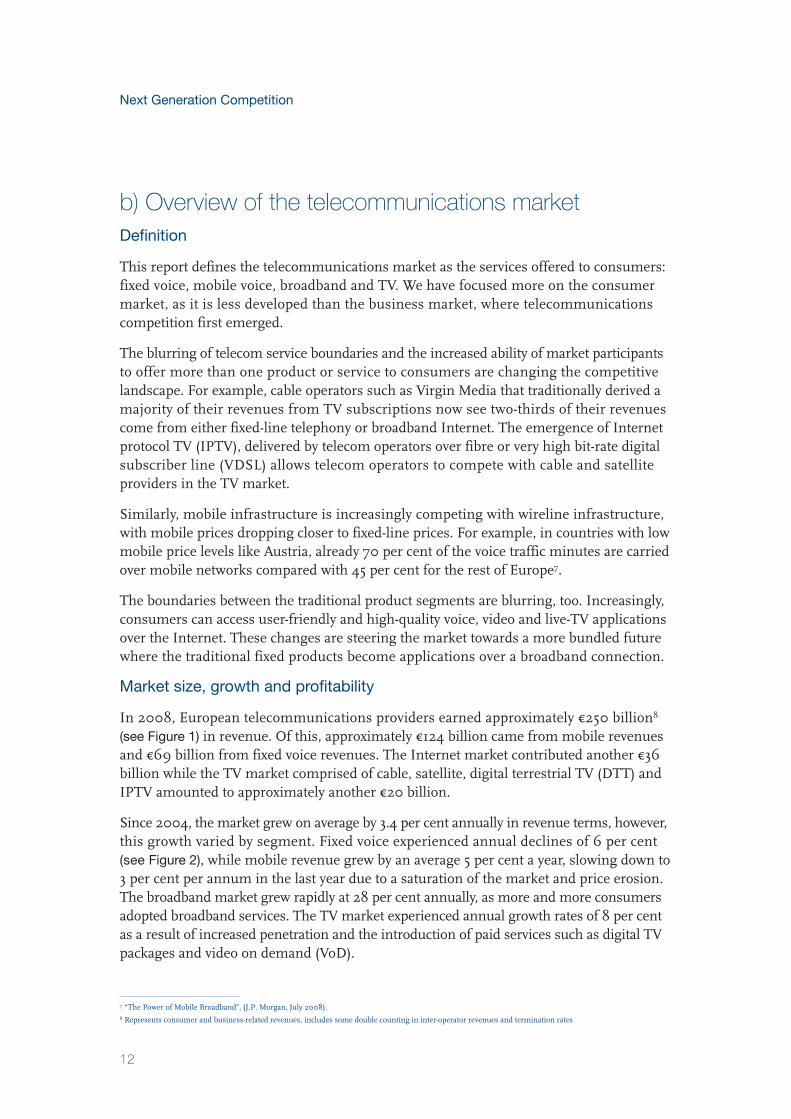
In 2008, European telecommunications providers earned approximately €250 billion8
(see Figure 1) in revenue. Of this, approximately €124 billion came from mobile revenuesand €69 billion from fixed voice revenues. The Internet market contributed another €36billion while the TV market comprised of cable, satellite, digital terrestrial TV (DTT) andIPTV amounted to approximately another €20 billion.
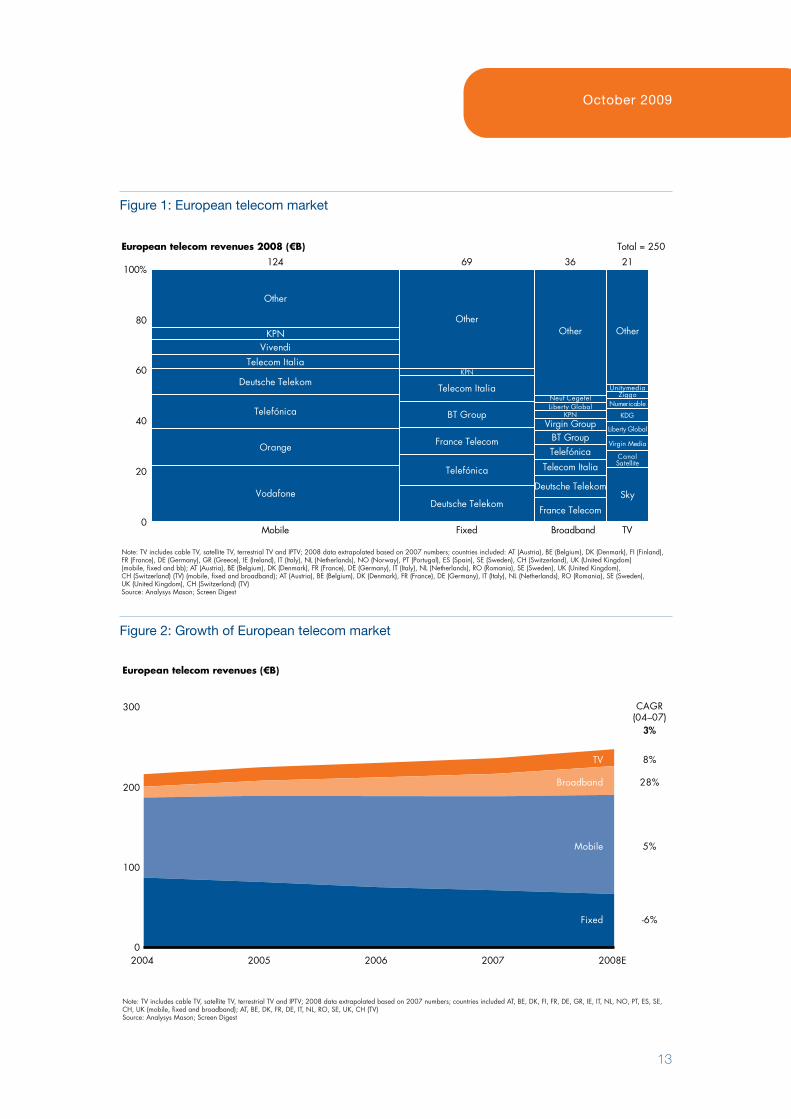
Since 2004, the market grew on average by 3.4 per cent annually in revenue terms, however,this growth varied by segment. Fixed voice experienced annual declines of 6 per cent(see Figure 2), while mobile revenue grew by an average 5 per cent a year, slowing down to3 per cent per annum in the last year due to a saturation of the market and price erosion.The broadband market grew rapidly at 28 per cent annually, as more and more consumersadopted broadband services. The TV market experienced annual growth rates of 8 per centas a result of increased penetration and the introduction of paid services such as digital TVpackages and video on demand (VoD).
7 “The Power of Mobile Broadband”, (J.P. Morgan, July 2008).8 Represents consumer and business-related revenues, includes some double counting in inter-operator revenues and termination rates
October 2009
13
Figure 1: European telecom market
Telefónica
Deutsche Telekom
Vodafone
Orange
KPN
Other
Telecom ItaliaVivendi
France Telecom
Telefónica
Deutsche Telekom
BT Group
Other
KPN
Telecom Italia
TelefónicaBT Group
Telecom Italia
France Telecom
Deutsche Telekom
Neuf CegetelLiberty Global
Virgin Group
Other Other
KPN
Virgin Media
Liberty Global
CanalSatellite
KDG
Unitymedia
NumericableZiggo
Sky
0
20
40
60
80
100%
Mobile
124
Fixed
69
Broadband
36
TV
21
European telecom revenues 2008 (€B) Total = 250
Note: TV includes cable TV, satellite TV, terrestrial TV and IPTV; 2008 data extrapolated based on 2007 numbers; countries included: AT (Austria), BE (Belgium), DK (Denmark), FI (Finland),FR (France), DE (Germany), GR (Greece), IE (Ireland), IT (Italy), NL (Netherlands), NO (Norway), PT (Portugal), ES (Spain), SE (Sweden), CH (Switzerland), UK (United Kingdom)(mobile, fixed and bb); AT (Austria), BE (Belgium), DK (Denmark), FR (France), DE (Germany), IT (Italy), NL (Netherlands), RO (Romania), SE (Sweden), UK (United Kingdom),CH (Switzerland) (TV) (mobile, fixed and broadband); AT (Austria), BE (Belgium), DK (Denmark), FR (France), DE (Germany), IT (Italy), NL (Netherlands), RO (Romania), SE (Sweden),UK (United Kingdom), CH (Switzerland) (TV)Source: Analysys Mason; Screen Digest
Figure 2: Growth of European telecom market
0
100
200
300
2004 2005 2006 2007 2008E
�6%
5%
28%
8%
3%
European telecom revenues (€B)
TV
Broadband
Mobile
Fixed
CAGR(04–07)
Note: TV includes cable TV, satellite TV, terrestrial TV and IPTV; 2008 data extrapolated based on 2007 numbers; countries included AT, BE, DK, FI, FR, DE, GR, IE, IT, NL, NO, PT, ES, SE,CH, UK (mobile, fixed and broadband); AT, BE, DK, FR, DE, IT, NL, RO, SE, UK, CH (TV)Source: Analysys Mason; Screen Digest
Next Generation Competition
14
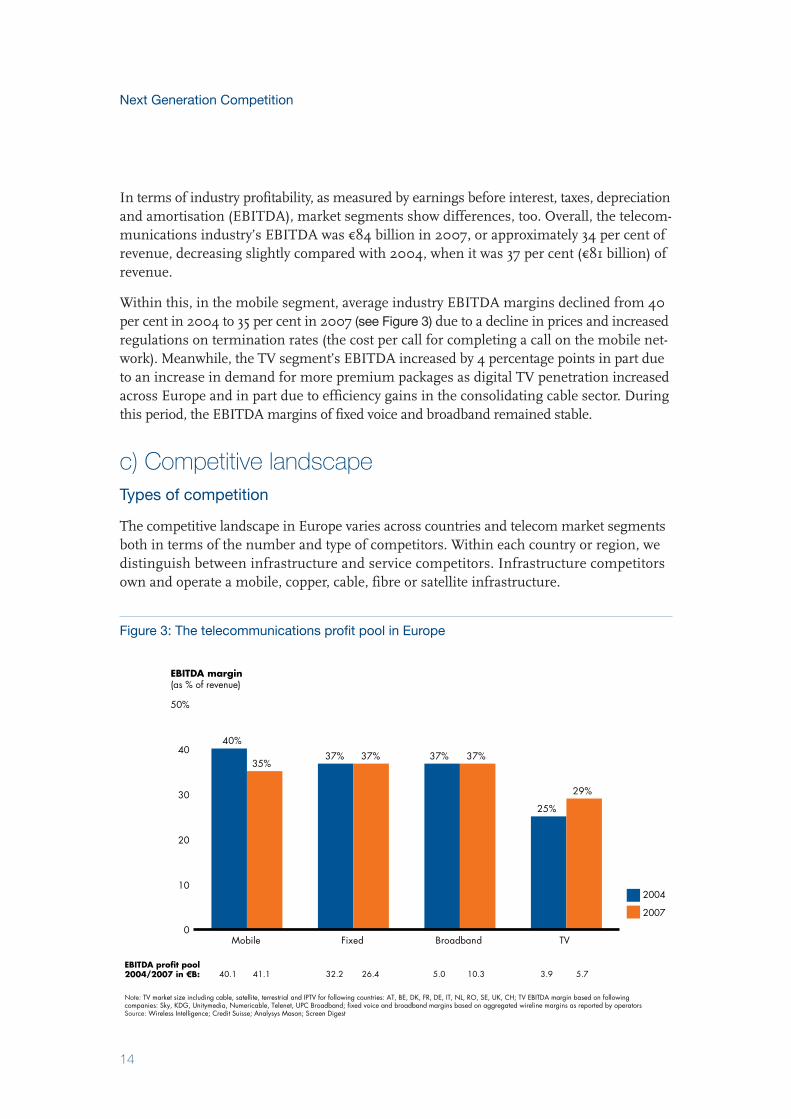
In terms of industry profitability, as measured by earnings before interest, taxes, depreciationand amortisation (EBITDA), market segments show differences, too. Overall, the telecom-munications industry’s EBITDA was €84 billion in 2007, or approximately 34 per cent ofrevenue, decreasing slightly compared with 2004, when it was 37 per cent (€81 billion) ofrevenue.
Within this, in the mobile segment, average industry EBITDA margins declined from 40per cent in 2004 to 35 per cent in 2007 (see Figure 3) due to a decline in prices and increasedregulations on termination rates (the cost per call for completing a call on the mobile net-work). Meanwhile, the TV segment’s EBITDA increased by 4 percentage points in part dueto an increase in demand for more premium packages as digital TV penetration increasedacross Europe and in part due to efficiency gains in the consolidating cable sector. Duringthis period, the EBITDA margins of fixed voice and broadband remained stable.
c) Competitive landscapeTypes of competition
The competitive landscape in Europe varies across countries and telecom market segmentsboth in terms of the number and type of competitors. Within each country or region, wedistinguish between infrastructure and service competitors. Infrastructure competitorsown and operate a mobile, copper, cable, fibre or satellite infrastructure.
Figure 3: The telecommunications profit pool in Europe
EBITDA profit pool2004/2007 in €B:
0
10
20
30
40
50%
Mobile
40%
37% 37% 37% 37%
25%
29%
EBITDA margin(as % of revenue)
35%
41.1 26.4 10.3 5.740.1 32.2 5.0 3.9
2004
2007
Fixed Broadband TV
Note: TV market size including cable, satellite, terrestrial and IPTV for following countries: AT, BE, DK, FR, DE, IT, NL, RO, SE, UK, CH; TV EBITDA margin based on followingcompanies: Sky, KDG, Unitymedia, Numericable, Telenet, UPC Broadband; fixed voice and broadband margins based on aggregated wireline margins as reported by operators Source: Wireless Intelligence; Credit Suisse; Analysys Mason; Screen Digest
October 2009
15
For copper, cable and fibre, they own the “last mile” to the customer, which is also knownas the local-loop infrastructure. Service providers include a broad range of companieswith different degrees of their own facilities and can include some owned infrastructure,for example: Backbone capacity; leased access to the local loop of an infrastructure owner;or long haul lines and switches.
Fixed voice market
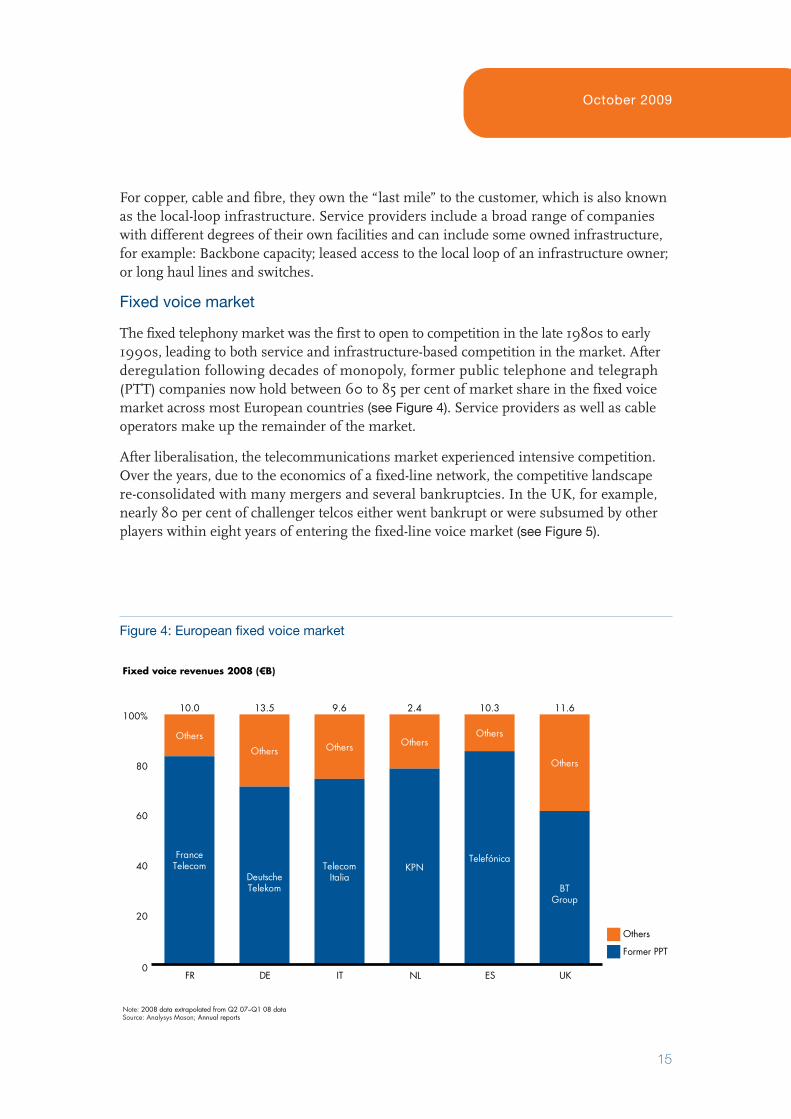
The fixed telephony market was the first to open to competition in the late 1980s to early1990s, leading to both service and infrastructure-based competition in the market. Afterderegulation following decades of monopoly, former public telephone and telegraph(PTT) companies now hold between 60 to 85 per cent of market share in the fixed voicemarket across most European countries (see Figure 4). Service providers as well as cableoperators make up the remainder of the market.
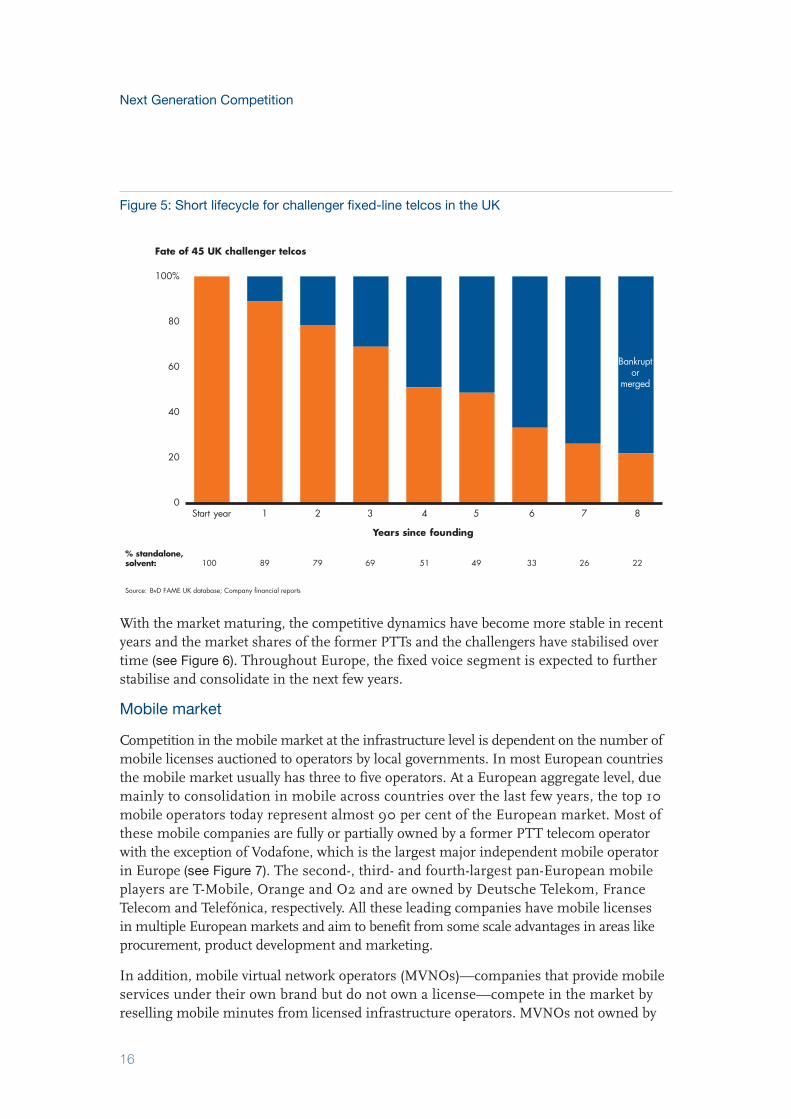
After liberalisation, the telecommunications market experienced intensive competition.Over the years, due to the economics of a fixed-line network, the competitive landscapere-consolidated with many mergers and several bankruptcies. In the UK, for example,nearly 80 per cent of challenger telcos either went bankrupt or were subsumed by otherplayers within eight years of entering the fixed-line voice market (see Figure 5).
Figure 4: European fixed voice market
Note: 2008 data extrapolated from Q2 07–Q1 08 data Source: Analysys Mason; Annual reports
Others
Former PPT
0
20
40
60
80
100%
FR
10.0
DE
Others
13.5
IT
Others
TelecomItalia
9.6
NL
Others
KPN
2.4
ES
Others
Telefónica
10.3
UK
Others
BTGroup
11.6
Fixed voice revenues 2008 (€B)
Others
FranceTelecom
DeutscheTelekom
With the market maturing, the competitive dynamics have become more stable in recentyears and the market shares of the former PTTs and the challengers have stabilised overtime (see Figure 6). Throughout Europe, the fixed voice segment is expected to further stabilise and consolidate in the next few years.
Mobile market
Competition in the mobile market at the infrastructure level is dependent on the number ofmobile licenses auctioned to operators by local governments. In most European countriesthe mobile market usually has three to five operators. At a European aggregate level, duemainly to consolidation in mobile across countries over the last few years, the top 10 mobile operators today represent almost 90 per cent of the European market. Most ofthese mobile companies are fully or partially owned by a former PTT telecom operatorwith the exception of Vodafone, which is the largest major independent mobile operatorin Europe (see Figure 7). The second-, third- and fourth-largest pan-European mobileplayers are T-Mobile, Orange and O2 and are owned by Deutsche Telekom, FranceTelecom and Telefónica, respectively. All these leading companies have mobile licenses in multiple European markets and aim to benefit from some scale advantages in areas likeprocurement, product development and marketing.
In addition, mobile virtual network operators (MVNOs)—companies that provide mobileservices under their own brand but do not own a license—compete in the market by reselling mobile minutes from licensed infrastructure operators. MVNOs not owned by
Next Generation Competition
16
Figure 5: Short lifecycle for challenger fixed-line telcos in the UK
Source: BvD FAME UK database; Company financial reports
% standalone,solvent:
0
20
40
60
80
100%
Start year 1 2 3 4 5 6 7 8
100 89 79 69 51 49 33 26 22
Bankruptor
merged
Years since founding
Fate of 45 UK challenger telcos

October 2009
17
Figure 6: Former PTTs with stable market share in the fixed voice segment
Fixed voice market share
50
75
100%
BT
Deutsche Telekom
France Telecom
2004 2005 2006 2007 2008
Swisscom
KPN
Telecom Italia
Source: Analysys Mason; Company financials
Figure 7: European mobile market
Mobile service revenues for 12 months to March 2008 (€B)
Source: Analysys Mason; Company financials
0
20
40
60
80
100%
AT BE DK FI FR DE GR IE IT NL NO PT ES SE CH UK
Ora
nge
Deu
tsche
Tel
ekom
Tele
kom
Aus
tria
KPN
Fran
ce T
elec
omBe
lgac
om
Tele
nor
Telia
Sone
raTD
C
Finn
etEl
isa
Telia
Sone
ra
Bouy
gues
Tele
com
Vive
ndi
Fran
ce T
elec
om
Telefónica
KPN
Deu
tsche
Tel
ekom
Voda
fone
Win
dVo
dafo
neO
TE
Eirc
omTe
lefó
nica
Voda
fone
Win
dVo
dafo
neTe
leco
m It
alia
Voda
fone
KPN
Telia
Sone
raTe
leno
r
Sona
eSG
PSVo
dafo
nePo
rtuga
l Tel
ecom
Voda
fone
Tele
fóni
ca
Tele
nor
Tele
2Te
liaSo
nera
TDC
Swis
scom
Deu
tsche
Tele
kom
Deu
tsche
Tele
kom
Fran
ceTe
leco
m
Fran
ceTe
leco
m
Fran
ceTe
leco
m
Voda
fone
Tele
fóni
ca
Hutchison Hutchison Hutchison Hutchison HutchisonHutchison
National former PTT International former PTT Independent telecom
Next Generation Competition
18
infrastructure-based mobile operators serve less than 10 per cent of subscribers in the European market with 10 to 20 per cent market presence in the UK, Netherlands andScandinavia; they are virtually nonexistent in other markets such as Italy and Spain9.
Broadband market
The level and type of competition in the European broadband market varies significantlyby country. Inter-platform competition is defined as that which occurs among infrastruc-tures (cable companies, former PTTs, mobile operators), and intra-platform is defined ascompetition occurring among service providers (some of which are facilities based) thatuse the network of the infrastructure owners.
Service competitors can participate in the market by accessing the local loop of an infra-structure provider, typically the former PTT of a country. This is possible due to the un-bundling of the local loop (the connection from the telephone exchange’s main office tothe customer premises) of the former PTT. The service provider co-locates its equipmentat the former PTT’s exchange, thus gaining access to the last mile to the customer. Theservice provider typically pays the former PTT a regulated cost plus fee for co-location. To ensure that the former PTT provides fair access of its facilities to service providers, a number of regulatory rules have been put in place. These include requirements for theformer PTT to provide easy access, apply equipment and safety rules that do not exceedits internal requirements and allow for the equipment of the challenger to be co-locatedeven if it includes switching or enhanced services equipment.
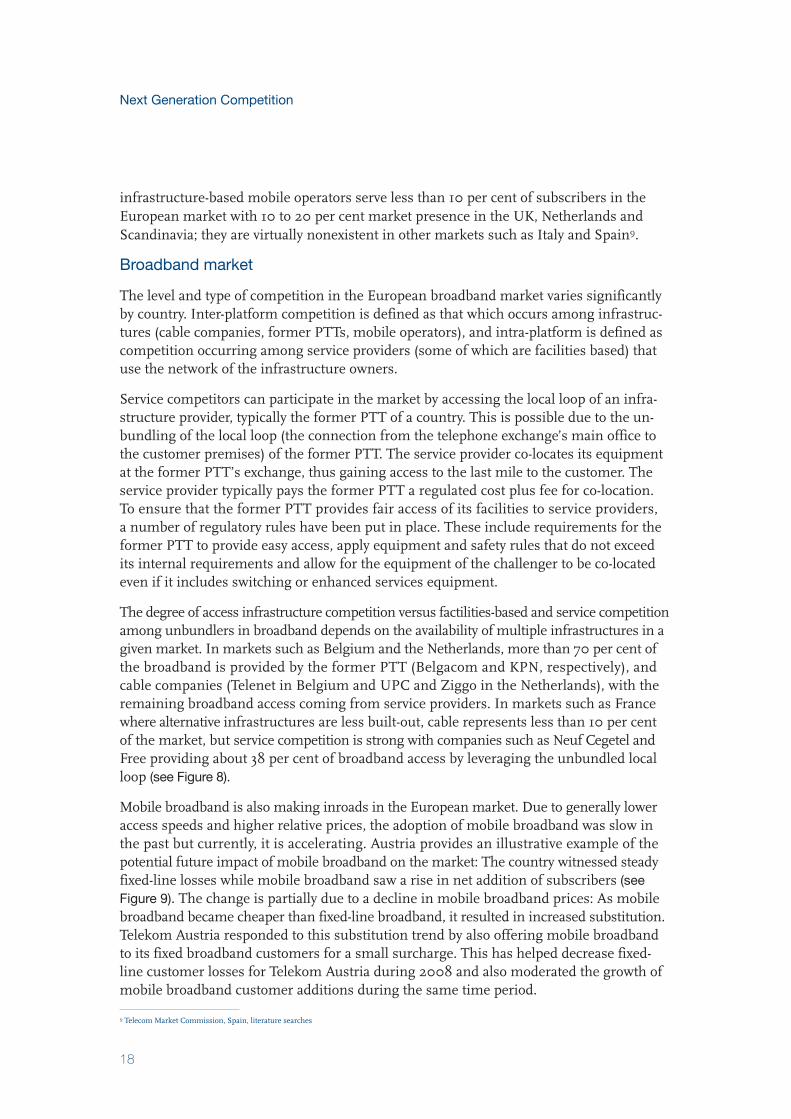
The degree of access infrastructure competition versus factilities-based and service competitionamong unbundlers in broadband depends on the availability of multiple infrastructures in agiven market. In markets such as Belgium and the Netherlands, more than 70 per cent ofthe broadband is provided by the former PTT (Belgacom and KPN, respectively), andcable companies (Telenet in Belgium and UPC and Ziggo in the Netherlands), with the remaining broadband access coming from service providers. In markets such as Francewhere alternative infrastructures are less built-out, cable represents less than 10 per centof the market, but service competition is strong with companies such as Neuf Cegetel andFree providing about 38 per cent of broadband access by leveraging the unbundled localloop (see Figure 8).
Mobile broadband is also making inroads in the European market. Due to generally loweraccess speeds and higher relative prices, the adoption of mobile broadband was slow inthe past but currently, it is accelerating. Austria provides an illustrative example of the potential future impact of mobile broadband on the market: The country witnessed steadyfixed-line losses while mobile broadband saw a rise in net addition of subscribers (see Figure 9). The change is partially due to a decline in mobile broadband prices: As mobilebroadband became cheaper than fixed-line broadband, it resulted in increased substitution.Telekom Austria responded to this substitution trend by also offering mobile broadbandto its fixed broadband customers for a small surcharge. This has helped decrease fixed-line customer losses for Telekom Austria during 2008 and also moderated the growth ofmobile broadband customer additions during the same time period.
9 Telecom Market Commission, Spain, literature searches
October 2009
19
Figure 8: European broadband market
Broadband revenues for four quarters trailing Q1 08 (€B)
*Service provider category comprises a broad variety of players, from resellers without any facilities to service providers with investments into some infrastructure (e.g., for ULL) Note: 2008 data extrapolated from Q2 07–Q1 08 dataSource: Analysys Mason; Company financials
Former PTT Cable operator Service provider* Other (service or infrastructure competitor)
0.8
0
20
40
60
80
100%
0
20
40
60
80
100%
BE
1.0
FR
4.2
IT
3.0
NL
1.9
ES
3.2
UK
4.8
CH
0.8
DE
5.2
Others
Versatel
Scarlet
Telenet
Belgacom
OthersNumericable
Free
FranceTelecom
Others
Swisscom
TelecoItalia
Others
UPC
Ziggo
KPN
Others
Jazztel
ONO
Telefónica
Others
Orange
Tiscali
TalkTalk
BTGroup
Others
Sunrise
Cablecom
Swisscom
Others
freenetVersatel
Vodafone
1&1
DeutschTelekom
Alice
Tiscali
Wind Orange
NeufCegetel
VirginMedia
Figure 9: Fixed-mobile substitution in Austria
Mobile broadband andfixed�line KPIs
Source: J.P. Morgan
Fixed�line losses (k customers) Mobile broadband net adds (k customers)
�50
0
50
100
150K
26
�16
27
�28
-4
44 48
�34
54
�38
78
�41
132
�34
Q106
Q206
Q306
Q406
Q107
Q207
Q307
Mobile broadband andfixed�line KPIs
�50
0
50
100
150K
40
�52
20
�36
15
�35
23
�29
54
Q407
Q108
Q208
Q308
Q408
Substitution of fixed bymobile broadband—Austria
Substitution of fixed bymobile broadband—Telekom Austria
Next Generation Competition
20
TV market
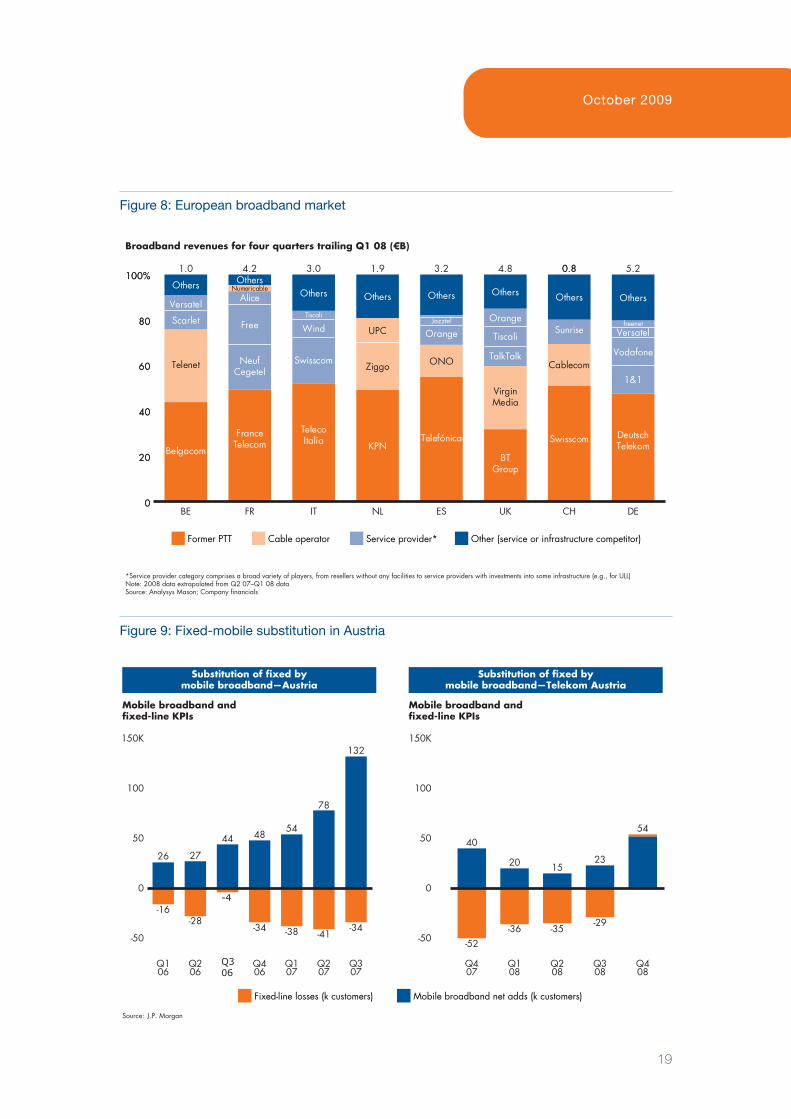
Today, competition in Europe’s TV market is among four technologies—cable, satellite,digital terrestrial TV (DTT) and IPTV (delivered through multiple broadband platforms),although in some countries only one or two of the TV access technologies may be available.For example, based on data available on nine West European countries for 2008, 31 percent of households in Western Europe10 accessed TV by subscribing to cable; satellite had a 16 per cent share; DTT 2 per cent; and IPTV 4 per cent. Free TV, which includes freesatellite and terrestrial, covered the remaining 47 per cent of households11. Each technologyhas different shares within different European countries due to different terrestrial regu-lations, penetration of cable and the historic evolution of competition. For example, in theUK, satellite TV is strong with Sky as a leading player and Virgin Media as a challenger. Inthe Netherlands, cable is the market leader while competing infrastructures such assatellite, DTT and IPTV have a much smaller share of the market (see Figure 10).
The state of development of IPTV varies across markets, as former PTTs have deployed verydifferent investment and marketing approaches. For example, in France, IPTV penetration wasabout 15 per cent in 2008, which is significantly higher than most other European markets.
Figure 10: European TV market in 2008
Note: Per cent of free�TV households calculated as residual; Free TV includes both terrestrial and satellite; NL excludes FibreSource: Screen Digest; Telecompaper; Dataxis; OneSource
Analogue cable Digital cable Satellite DTT IPTV Free TV
Number of TV users by infrastructure (Q2 08)
0
20
40
60
80
100%
DTT penetration(in %):
BE
~4.5M
0
8
DK
~2.5M
0
2
SE
~4M
15
9
FR
~25M
3
15
AT
~3.5M
0
2
IT
~23M
0
2
DE
~38M
0
1
UK
~26M
2
1
NL
~7M
9
3IPTV penetration(in %):
10Percentage based on nine Western European countries (NL, BE, DK, SE, FR, AT, UK, IT, DE) 11 Data based on nine markets in Figure 10
October 2009
21
Some credit for the significant penetration of IPTV in the French market goes to Free, agood example of a challenger that has contributed to the popularity of IPTV in the Frenchmarket. Free was established as an Internet service provider (ISP) in 1999 and began offering IPTV service in December 2003. It offers a triple bundle of services—phone, Internet and IPTV with more than 200 television channels and VoD. Subscribers need a set-top box (Freebox modem) to receive the service and only pay for voice and Internet.Free’s customers get the basic IPTV service free of charge and only pay for premium TVchannels. Today, Free is one of the largest IPTV providers in the world to more than “2.5million IPTV-enabled homes in France with an estimated 1.4 million cumulative IPTVconnections in 2008”12. Following Free’s success, France Telecom has also started bundlingits Internet and telephone services with IPTV.
The four markets we reviewed are increasingly converging, blurring the boundaries betweenvoice, data and video in the future. This is leading to more complex competitive dynamicswhere market participants compete across traditional market and geographical boundariesand for a more diverse set of customers.
12http://www.variety.com/article/VR1117988460.html?categoryid=19&cs=1&nid=2570

Next Generation Competition
22
October 2009
23
2. The evolution of telecommunications competition in Europe
Over the last 15 years, the European telecommunications sector has witnessed radicalchanges. Often, regulation has played a crucial role in enabling and shaping competition inthe telecommunications sector. In fact, regulators pursued liberalisation of the telecommuni-cations market with the belief that a competitive market would result in lower prices forconsumers and increase innovation.
Until the late 1980s, the telecommunications sector in most European countries was amonopoly. The sheer costs and high economies of scale associated with owning and operatingthe telecommunications infrastructure encouraged such structures. This was especially trueat the local-loop level connecting households to the local switch, since duplicating these“last mile” copper wires was prohibitively expensive. In almost all countries, state-ownedPTTs provided all local and long-distance voice telecommunications services to consumersand businesses.
Liberalisation and privatisation of the telecommunications sector in Europe started in thelate 1980s and carried through the 1990s with the approval of two directives from the EU in 1990 (in parallel with national liberalisation initiatives pursued by individual govern-ments, starting from the UK). The Telecom Services Directive established the deadlines forfull liberalisation on the continent and the Open Network Provision Directive established theframework for access to and use of public telecommunications networks and services13.Multiple other directives followed that specified the steps that needed to be taken to liberalise the market further. By 1996, four European countries opened the market tocompetition—the UK, Sweden, Finland and Denmark. These were followed by theNetherlands in 1997 and Austria, Belgium, France, Germany, Italy and Spain in 1998.Since then, Ireland, Portugal and Greece have also followed suit.
Each country followed a slightly different path towards liberalisation, but in each an independent telecom regulatory body was established—a national regulatory authority(NRA)—which then developed regulations for competition within the sector. For example,in Germany, the 1996 German Telecom Act committed the country to fundamental telecomreform with the goal to “promote competition, to guarantee appropriate and adequate servicesthroughout the country and to provide for frequency regulation.” The Act led to theprivatisation of Deutsche Telekom through the sale of 26 per cent of its shares. TheGerman government then created an independent regulatory body in 1998 that setbenchmarks for interconnection rates. Most deregulation was accompanied by at leastpartial privatisation of former monopoly PTTs.
Historically, European regulators encouraged both service- and infrastructure-levelcompetition in the sector. Service-level competition allowed new service providers to usethe former PTT network, especially the local loop, at regulated prices. The entry of service
13 “Privatization and Liberalization in the European Union”, Business America, July 1997, Denny-Brown, Myles,
http://findarticles.com/p/articles/mi_m1052/is_n7_v118/ai_19605321/?tag=content;col1
Next Generation Competition
24
competitors resulted in greater competition and better options for consumers such aslower retail prices and more choice. However, the service provider business model (by itsvery nature of relying on a common underlying platform and infrastructure and becauseof the low barriers to entry) is an “arbitrage” business, leveraging the price difference between retail and interconnection prices. Over time service providers’ margins got slim-mer, making it more difficult to attract new customers and survive as a competitor purelyon the basis of price. Therefore, while service providers succeeded in taking away marketshare from former PTTs, they have been generally less profitable and prone to consolida-tion over time.
Consider the German mobile market. When it first opened up to service providers, severalplayers entered the market, providing network operators with the much needed salesforcerequired to penetrate the evolving market. After a long process of consolidation, todayonly one major player—the recently merged Mobilcom-Debitel—is left. Controlling 10per cent of the market, it is much larger than its next largest rival—Drillisch—which hasaround 1 per cent market share14. With the network operators increasingly focusing on optimising their sales effectiveness—for example, by introducing sub-brands aimed atethnic groups and discount brands—and the overall market saturating, the future outlookfor service providers in Germany is challenging.
In addition to allowing service competitors to enter the market, the European Commissionencouraged from the start infrastructure competition. As a result, in both the local loopand in long distance, a number of investors in telecom infrastructure started providingservices to the same consumer creating competition:
• In fixed voice between former PTTs, cable operators and in selected areas other access providers;
• In mobile voice between three to five overlapping mobile operators;
• In TV between cable, satellite and digital terrestrial TV;
• In broadband between former PTTs and cable operators and increasingly even mobile providers for the low end of bandwidth requirements.
Infrastructure competition in wireless was based on the auctioning of spectrum licensesand resulted generally in three to five national providers with full coverage and competinginfrastructures. In wireline, the situation was mixed—in some areas (either in central businessdistricts or residential areas) a number of competing infrastructures were developed. Equally,in backbone and long distance a number of concurrent infrastructures have been deployed.However, in the majority of residential areas, the economies of deploying a greenfieldinfrastructure in addition to the former PTT’s copper lines has proved very challengingwith the exception of the situation where existing cable infrastructure (originally only ableto deliver analog TV) was repurposed for broadband, voice and Internet services. The root
14http://www.welt.de/webwelt/article2163486/Debitel_darf_iPhone_im_Media_Markt_verkaufen.html
October 2009
25
cause lies in the economics and the civil works associated in building a dedicated wireline toa home versus the more modular build-out of wireless network where multiple users ina catchment area effectively “share” a radio loop among themselves.
Regulation in many countries therefore moved to use other levers to stimulate furthercompetition, creating a framework for unbundling what they considered the most importantbottleneck to competition: wireline access. This resulted in unbundling of the local loop,effectively a form of “cost plus” reselling of the former PTT last mile, moving over timesome of the competition at the “facilities” level (such as the co-location of the new entrant’sfacilities at the former PTT’s exchange).
Especially where cable and former PTTs compete, the telecommunications market hascontinued to evolve into a phase of convergence, which we define as the blurring of defi-nitions of vertical market segments. For example, a voice call can now be transmittedthrough the public switched telecom network (PSTN) of a former PTT or the cable networkof a cable operator. Moreover, these multiple networks—cable, copper, third-party fibre—can deliver a multitude of services. As convergence occurs, companies are no longer confinedto their original markets such as telecom operators to voice or cable companies to TV.Fixed and mobile operators increasingly offer content in addition to a bundled (voice, Internet, TV) telecommunications product. Content providers, in turn, expand their distribution channels using all available access networks to reach the consumer.
In a number of academic studies the benefits and outcomes of infrastructure competitionhave consistently shown that infrastructure-based competition leads to higher innovationand penetration rates 15, 16, 17. Studies also show that infrastructure-based competition has apositive downward effect on prices, which remain stable afterwards.
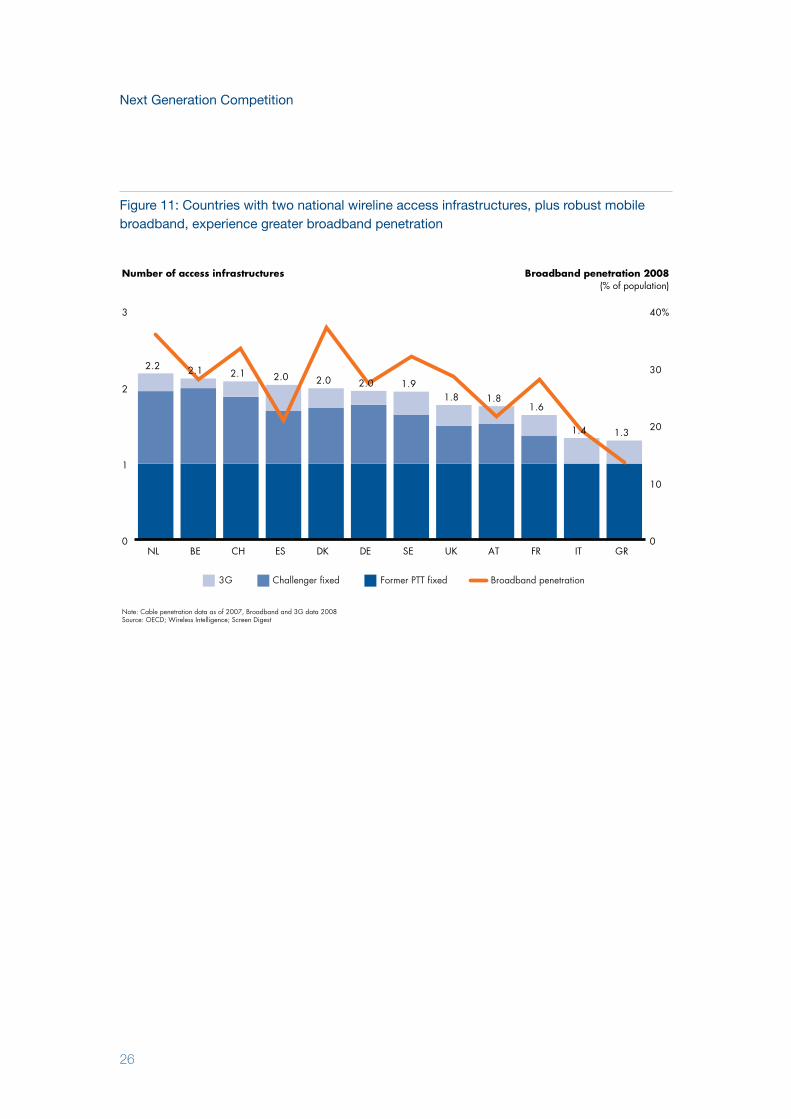
Current data on the European broadband market seem to confirm that some nationwidecompetiton in access infrastructure is associated with greater broadband penetration. Weanalysed the number of available infrastructures in each country measured by penetrationof each infrastructure in the market. Every country had close to 100 per cent copper pene-tration, which we counted as 1.0, variable cable penetration varying from none to almost100 per cent in markets such as Belgium and the Netherlands, and variable 3G mobile cov-erage, which is to a large extent a complement to the two fixed-line infrastructures. Look-ing at broadband penetration for each market we can see that while the correlation is notperfect, markets with more available infrastructures tended to have higher broadbandpenetration (see Figure 11).
15 Kittl, J, Lundborg, M, Ruhle E, 2006, “Infrastructure-Based Versus Service-Based: Competition in Telecommunications”, Communications and Strategies16Denni, M and Gruber H, 2005, “The Diffusion of Broadband Telecommunications: The Role of Competition”, working paper17Bouckaert, J, vanDijk, T, Verboven, F, 2008, “Regulation and Broadband Penetration—What Is Required to Regain Speed in Belgium?”, working paper
Next Generation Competition
26
Figure 11: Countries with two national wireline access infrastructures, plus robust mobilebroadband, experience greater broadband penetration
Note: Cable penetration data as of 2007, Broadband and 3G data 2008Source: OECD; Wireless Intelligence; Screen Digest
0
1
2
3
0
10
20
30
40%
NL
2.2
BE
2.1
CH
2.1
ES
2.0
DK
2.0
DE
2.0
SE
1.9
UK
1.8
AT
1.8
FR
1.6
IT
1.4
GR
1.3
Number of access infrastructures Broadband penetration 2008(% of population)
3G Former PTT fixed Broadband penetrationChallenger fixed
October 2009
27
3. The state of availability of competing fixedaccess infrastuctures in Europe
The degree of penetration of competing fixed access infrastructures, as well as consumerdemand and technology adoption, varies significantly across Europe. Some countries andsub-markets (regions within a country) boast of two or more competing fixed access (local-loop) infrastructures, which provide broadband access to consumers. Typically, these consistof a former PTT operator and the cable company or other fibre providers. There are, however,still a number of countries and regions that rely predominantly on the former PTT’slocal-loop infrastructure for broadband access to consumers.
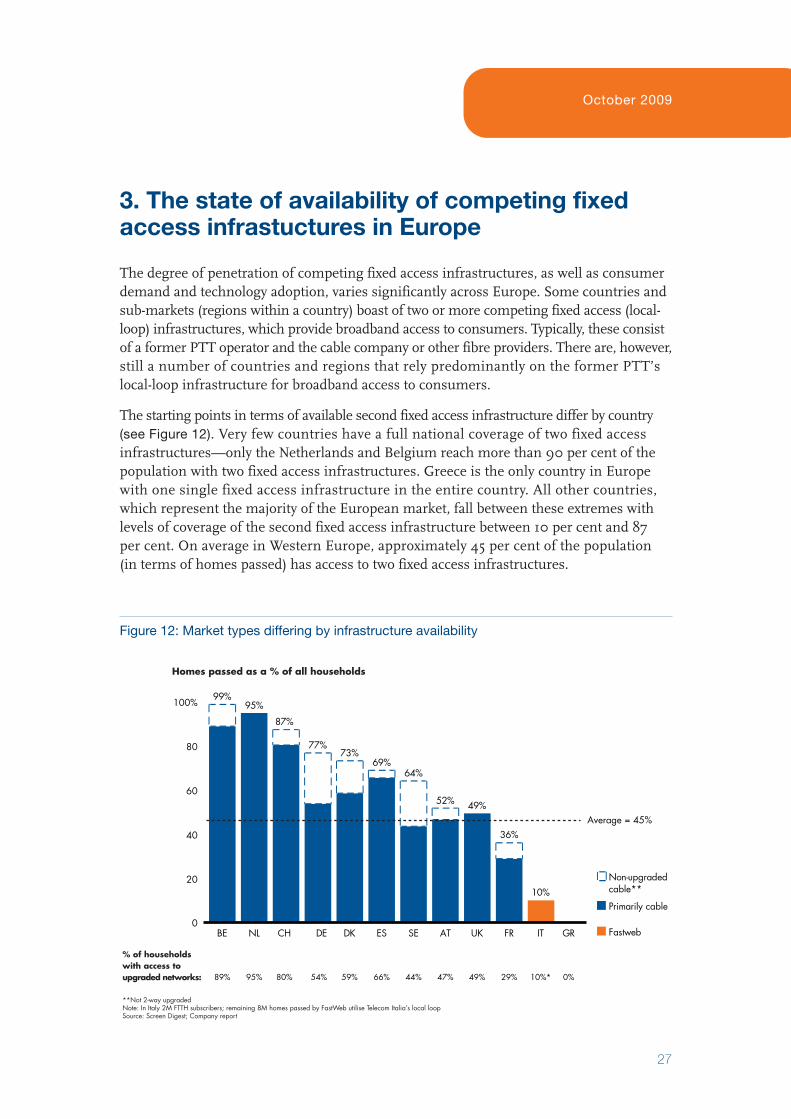
The starting points in terms of available second fixed access infrastructure differ by country(see Figure 12). Very few countries have a full national coverage of two fixed access infrastructures—only the Netherlands and Belgium reach more than 90 per cent of thepopulation with two fixed access infrastructures. Greece is the only country in Europewith one single fixed access infrastructure in the entire country. All other countries,which represent the majority of the European market, fall between these extremes withlevels of coverage of the second fixed access infrastructure between 10 per cent and 87 per cent. On average in Western Europe, approximately 45 per cent of the population (in terms of homes passed) has access to two fixed access infrastructures.
Figure 12: Market types differing by infrastructure availability
0
20
40
60
80
100%
BE
99%
NL
95%
CH
87%
DE
77%
DK
73%
ES
69%
SE
64%
AT
52%
UK
49%
FR
36%
IT
10%
GR
95% 47%44% 29% 0%89% 80% 66%59%54% 10%*49%
Primarily cable
Fastweb
Non�upgraded cable**
Average = 45%
**Not 2�way upgradedNote: In Italy 2M FTTH subscribers; remaining 8M homes passed by FastWeb utilise Telecom Italia’s local loop Source: Screen Digest; Company report
Homes passed as a % of all households
% of households with access to upgraded networks:
Next Generation Competition
28
At one end of the spectrum, countries (for example, Greece) and some sub-regions in mostEuropean markets have seen limited roll-out of cable and other alternative infrastructuresfor historical and economic reasons. Such countries or sub-regions rely on a former PTT’scopper access infrastructure for broadband and fixed voice services. Typically, in these instances, the copper infrastructure market is regulated to enable service competition.
At the other end, countries such as the Netherlands, Belgium and Switzerland have twofully rolled out competing fixed infrastructures covering more than 80 per cent of themarket. In addition, some areas are currently experiencing the emergence of local fibrecompetitors offering a third infrastructure option in certain towns and municipalities. InSwitzerland, for example, local utilities are stepping up to participate in the roll-out of thefibre infrastructure and in the Netherlands various fibre network operators exist in the market.
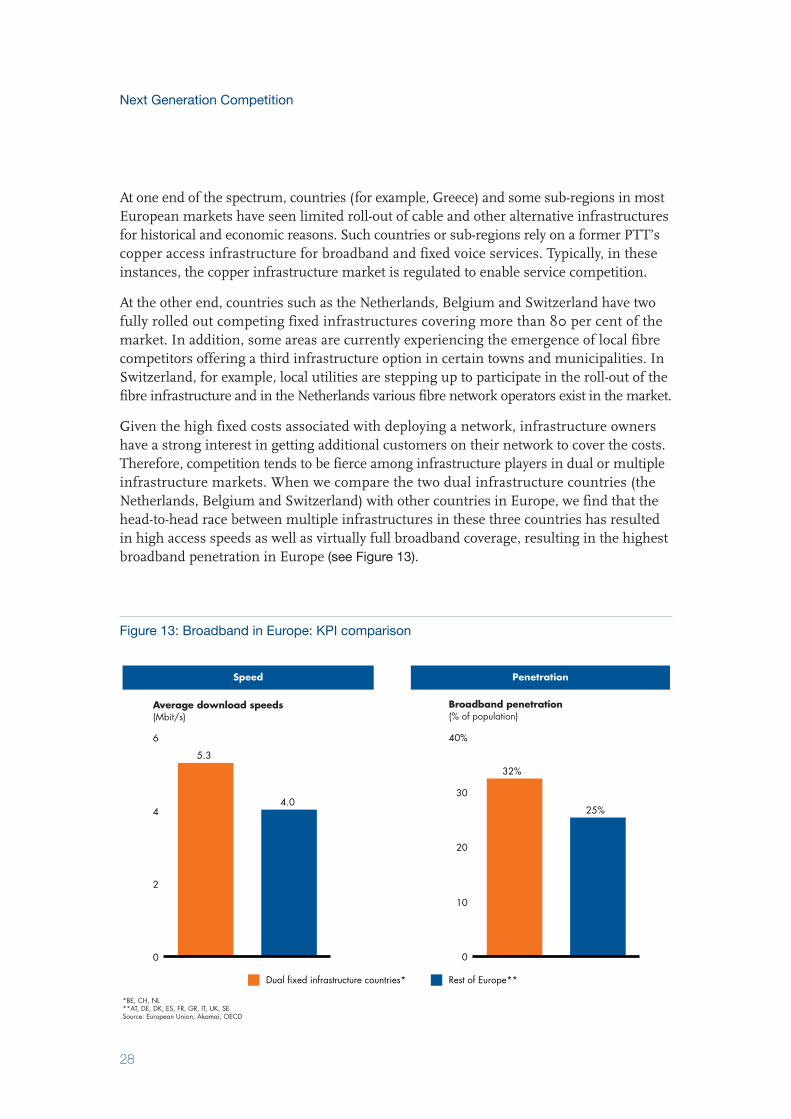
Given the high fixed costs associated with deploying a network, infrastructure ownershave a strong interest in getting additional customers on their network to cover the costs.Therefore, competition tends to be fierce among infrastructure players in dual or multipleinfrastructure markets. When we compare the two dual infrastructure countries (theNetherlands, Belgium and Switzerland) with other countries in Europe, we find that thehead-to-head race between multiple infrastructures in these three countries has resultedin high access speeds as well as virtually full broadband coverage, resulting in the highestbroadband penetration in Europe (see Figure 13).
Figure 13: Broadband in Europe: KPI comparison
0
2
4
6
5.3
4.0
0
10
20
30
40%
32%
25%
Speed Penetration
Dual fixed infrastructure countries* Rest of Europe**
*BE, CH, NL**AT, DE, DK, ES, FR, GR, IT, UK, SESource: European Union; Akamai; OECD
Average download speeds(Mbit/s)
Broadband penetration(% of population)
October 2009
29
In these dual infrastructure countries, NGA network roll-out has begun early and hasreached the highest roll-out levels compared with other European countries. In theNetherlands, for example, cable operators began upgrading their networks to EuroDOC-SIS 3.0 in September 2008 and aim to achieve full upgrade coverage by the end of 2010.
In the Netherlands, KPN has entered into a partnership with independent fibre playerReggefiber in an effort to accelerate fibre to the home (FTTH) coverage. Together withother fibre players they have achieved a 4 per cent18 household penetration and are expectedto reach more than 13 per cent penetration by 2013. Also, Tele2 is rolling out VDSL offeringspeeds of up to 60 Mbit/s.
In Switzerland, Swisscom is following a multiple fibre strategy, in cooperation with localutilities, to deploy several optical fibres in one duct and thus improve the economics ofdeployment. This approach is expected to result in FTTH household penetration of morethan 12 per cent by the end of 201319.
In the majority of the remaining countries in Europe there is a certain amount of secondfixed access infrastructure in many regions of the country in addition to the former PTTinfrastructure. Frequently, this second infrastructure is cable, but is fragmented andprimarily covers metropolitan areas.
Those networks have typically relatively limited scale and reach versus former PTTs andoften have not yet been broadband and voice-enabled. For example, in Germany, whilecable runs past 74 per cent of all households, so far only about 50 per cent of total house-holds are connected to a two-way upgraded network and are able to receive broadband access20 from their cable operator. In Germany’s cable industry, different players operate at different levels of the infrastructure. Many smaller players are unable to invest in upgrading their networks. Other fixed infrastructure challengers in Germany are localproviders such as NetCologne, which has a limited footprint in the Cologne-Aachen region and M-Net, which operates in Munich. These players were often created as start-ups by local utilities when the market was liberalised.
In the UK, there have been a variety of infrastructure-based fixed line operators. In additionto the former PTT BT, the UK has experienced proliferation and eventually consolidationof several alternative network operators. The principal alternative residential access infra-structure in the UK, however, has been cable networks, covering approximately 50 percent of all households. Having originated on a very fragmented local/regional basis, UKcable consolidated over a period of decades, eventually under the brand name Virgin Media.Though cable is only available to half the UK households, competition for households in thoseareas is fierce between Virgin Media and the many service providers using BT Openreach’sinfrastructure (including the retail arm of BT).
18Cullen International research19 http://www.ftthcouncil.eu/documents/studies/Market_Forecast.pdf 20“European Broadband Cable 2008”, Screen Digest

Next Generation Competition
30
Despite these challenges, countries in which a second fixed infrastructure partially existssee the benefits of increased competition in terms of greater broadband penetration.While DSL in Germany is still the primary broadband technology today with more than90 per cent of households subscribing, cable operators are increasingly gaining sharewith more than 20 per cent of new customers choosing cable over DSL21.
21WestLB 2008
October 2009
31
4. Forces of change
To see how the market will develop in the future we need to take a look at the underlyingforces driving the evolution going forward—and estimate how they will change. We haveidentified four key forces of change that have driven—and will continue to drive—theevolution of the sector:
• Technological developments;
• Consumer demand and preferences;
• Evolving business models;
• Governmental intervention/regulation.
It is important to note that while these forces shape the competitive environment, theyare also interdependent. Technological developments, such as the emergence of a newwireless technology, for example, will prompt new regulatory action. Regulatory intervention(for example, pushing for lower retail prices by setting lower interconnection charges)may lead to increased consumer demand.
Given the uncertainty of technology and consumer demand we will focus most on thesetwo key drivers of future competition in the market.
a) Technology developmentTechnological developments are a key enabler for continued innovation in the telecom-munications market and have resulted in the proliferation of telecommunication services.In turn, technological developments are supported by competition amongst providers employing different technologies.
In the early days of market liberalisation, most basic voice and data telecommunicationsservices were provided through copper-based technologies such as the public switchedtelephone network (PSTN) and simple copper-based data networks. Since then, technologicaldevelopments have significantly shaped the competitive landscape. The most importantdevelopments include:
• The Internet protocol (IP) has allowed data networks to provide multiple services, suchas video, voice and information over the same infrastructure, creating infrastructurecompetition for traditional PSTN-based networks.
• Wireless technology has moved from a complementary infrastructure for use “on themove”, to an increasingly important substitute for wireline infrastructure. This sub-stitution has been very significant for low-bandwidth services like voice. There is increasing substitution of wireless for wireline voice in markets such as Austriawith low relative prices for wireless voice or where fixed-line penetration was traditionallylow (for example, in developing countries, where wireless may “leapfrog” wireline).
Next Generation Competition
32
• The introduction of fibre at different levels of the network, including at the accesslevel, is providing users with access speeds of more than 50 Mbit/s. This enables theviewing of multiple high-definition video streams and makes video communicationpossible. Technologically, these NGA networks will be based on: Former PTTs’ copper-based networks upgraded with fibre; coaxial cable-based networks; and newly deployedfibre-only networks (such as those from alternative network operators).
Telecommunication networks
In most European countries, the network of the former PTT has undergone a steadyevolution from a copper-based PSTN providing early connectivity services, to an increasinglyfibre-based, all-IP network providing high-speed broadband access and other services.Other than a few exceptions, the transition from copper to optical fibre has been anongoing process that started in the late 1980s, beginning with “backbone” core networksand moving gradually towards the edge of the network, to the homes of the customers.Fibre has been a means to deliver much higher-capacity links, and as it has moved to theedge of the network, the bandwidth available to consumers has increased significantly.
With current ADSL (asymmetric digital subscriber line) technology, fibre is built out tothe local exchange and the connection between the exchange and the household is deliveredvia a copper network, up to a distance of 7 km between the exchange and the household.ADSL allows consumers to receive bandwidths of up to 25 Mbit/s22.
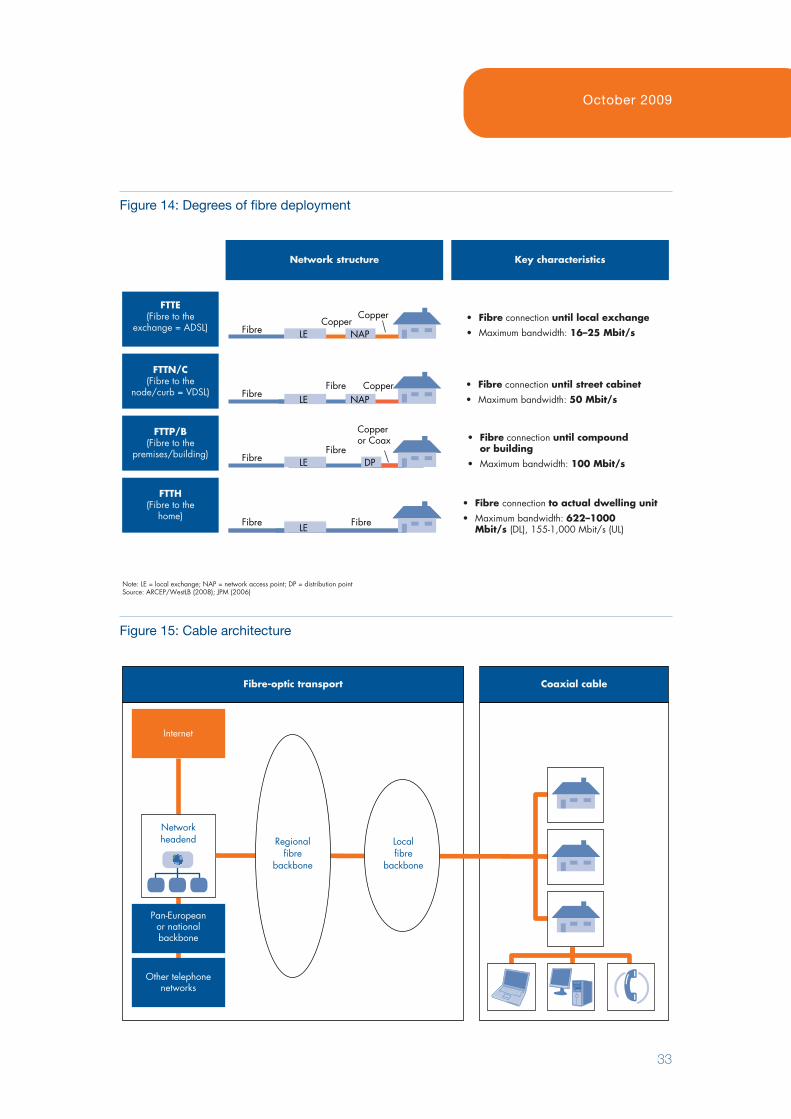
Faster bandwidth speeds can be achieved by using fibre closer to the customer’s premises.This can be done either in the form of fibre to the node/curb (FTTN) or fibre to the home(FTTH) (see Figure 14). The former relies on traditional copper lines from the node toconnect to the customer via VDSL technology. While this requires less investment in fibredeployment, the speeds provided are limited to 50 to 60 Mbit/s depending on the distancebetween the customer and the DSLAM at the exchange. FTTH requires a more costlydirect optical connection to the user’s home.
Cable TV networks
Television cable networks have followed a similar path, with increasing deployment of fibre.Cable networks have evolved from all coax networks to hybrid fibre coaxial networkswhere the coax part of the network is restricted to the last few hundred metres. Upgradingcoax networks to HFC (hybrid fibre coax) has required cable operators to put a significantamount of fibre in the ground, to aggregate small segments of homes that are connectedvia coax to the fibre backbone and to install new hardware at the network head-ends (seeFigure 15).
Across Europe, cable operators are currently making further investments to upgrade theirnetworks to EuroDOCSIS 3.0. EuroDOCSIS 3.0 represents an important technologicaldevelopment for the cable industry’s role as a key high-speed infrastructure provider in Europe.
22Speeds vary within the ADSL family; e.g., indicative differences are ADSL: 8 Mbit/s; ADSL2: 12MBit/s; ADSL2+: 25 Mbit/s
October 2009
33
Figure 14: Degrees of fibre deployment
FTTE(Fibre to the
exchange = ADSL)
FTTH(Fibre to the
home)
FTTN/C(Fibre to the
node/curb = VDSL)
FTTP/B(Fibre to the
premises/building)
Network structure Key characteristics
FibreFibre Copper
LE NAP
Fibre LE FibreLE
LE NAPFibreCopper
Copper
FibreFibre
Copperor Coax
LE DP
• Fibre connection until local exchange• Maximum bandwidth: 16–25 Mbit/s
• Fibre connection until street cabinet• Maximum bandwidth: 50 Mbit/s
• Fibre connection until compound or building
• Maximum bandwidth: 100 Mbit/s
• Fibre connection to actual dwelling unit• Maximum bandwidth: 622–1000 Mbit/s (DL), 155�1,000 Mbit/s (UL)
Note: LE = local exchange; NAP = network access point; DP = distribution pointSource: ARCEP/WestLB (2008); JPM (2006)
Figure 15: Cable architecture
Coaxial cableFibre�optic transport
Internet
Regionalfibre
backbone
Localfibre
backbone
Networkheadend
Pan�Europeanor nationalbackbone
Other telephonenetworks
Next Generation Competition
34
Upgrading the networks to HFC has permitted cable operators to offer a new range ofservices such as high-speed data and phone services that provide two-way capabilities.These new services are enhanced with the introduction of EuroDOCSIS 3.0, which enablescable operators to offer further increases in downstream and upstream speeds in excessof 100 Mbit/s.
Wireless and mobile networks
In the 1980s, mass market wireless services largely consisted of analogue voice and basicpaging, reliant on first-generation wireless technologies. In contrast to first-generationwireless technology, second-generation (2G) wireless technology (including GPRS/EDGEand CDMA) introduced during the 1990s was capable of not only voice but also broaderdata and messaging services. Yet, 2G allowed only very limited speeds of a theoreticalmaximum of 55 Kbit/s—though typical usage speed was closer to 9 Kbit/s.
The advent of third-generation (3G) wireless technology suggested potential data accessspeeds of 2 Mbit/s. While initial 3G deployments did not immediately deliver thosespeeds, the level of deployment has grown—also thanks to technology evolution such asHSDPA/HSUPA—and delivered higher speeds and enabled new applications. Despiterelatively high coverage of 3G networks in Europe today, in the first quarter of 2009 only25 per cent of European mobile subscribers used 3G23. Most consumers still have 2Ghandsets and therefore cannot use 3G. Nevertheless, 3G has been a milestone in introducingwireless data transfer at speeds sufficient for basic Internet browsing and emailing.
Fourth-generation (4G) wireless technologies offer greater access speeds and are in a nascent stage of deployment. 4G encompasses both WiMax, basically an enhancement of current WiFi24 with a much greater range, and long-term evolution (LTE), representingthe next stage of WCDMA mobile technology beyond 3G. There are very limited commercialWiMax deployments to date and while wide-scale deployment of LTE is expected to occuracross major European countries, industry experts believe it will only happen in a limitedway till 2014. While 4G technology demonstrates headline access speeds close to those offixed NGNs under laboratory conditions, some experts believe that in practice the speedscould be slower—perhaps closer to 10 to 20 Mbit/s—due to the natural constraints ofspectrum, planning constraints and the economics of deployment of radio access.
Satellite networks
Satellites have been used for various means of communications ever since their deploymentin the late 1960s. In the consumer segment, satellite TV has captured a significant marketshare in some markets like the UK. Satellites are also emerging as a means of providingInternet connectivity and were recently positioned as a solution to bridge the digital dividein broadband. For example, SES Astra already offers its Internet-via-satellite serviceAstra2Connect in 14 countries. Currently 40,000 customers use the service since itsintroduction two years ago25. EUTELSAT’s Tooway service has offered 3.6 Mbit/s downloads
23 Wireless Intelligence; Gartner24WiFi is a trademark name for wireless local area networks (WLAN) based on the IEEE 802.11 standards and has become synonymous with wireless local networks25 http://www.astra2connect.com/press/index.php
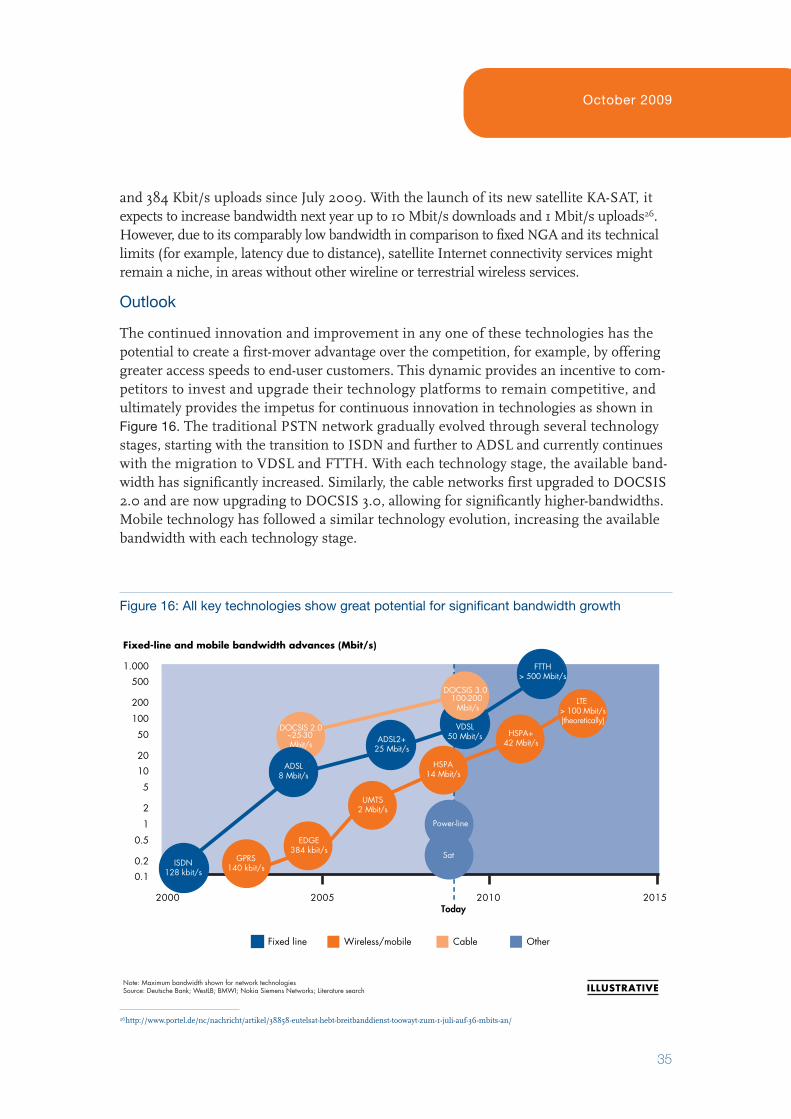
October 2009
35
and 384 Kbit/s uploads since July 2009. With the launch of its new satellite KA-SAT, itexpects to increase bandwidth next year up to 10 Mbit/s downloads and 1 Mbit/s uploads26.However, due to its comparably low bandwidth in comparison to fixed NGA and its technicallimits (for example, latency due to distance), satellite Internet connectivity services might remain a niche, in areas without other wireline or terrestrial wireless services.
Outlook
The continued innovation and improvement in any one of these technologies has the potential to create a first-mover advantage over the competition, for example, by offeringgreater access speeds to end-user customers. This dynamic provides an incentive to com-petitors to invest and upgrade their technology platforms to remain competitive, and ultimately provides the impetus for continuous innovation in technologies as shown inFigure 16. The traditional PSTN network gradually evolved through several technologystages, starting with the transition to ISDN and further to ADSL and currently continueswith the migration to VDSL and FTTH. With each technology stage, the available band-width has significantly increased. Similarly, the cable networks first upgraded to DOCSIS2.0 and are now upgrading to DOCSIS 3.0, allowing for significantly higher-bandwidths.Mobile technology has followed a similar technology evolution, increasing the availablebandwidth with each technology stage.
Figure 16: All key technologies show great potential for significant bandwidth growth
Note: Maximum bandwidth shown for network technologiesSource: Deutsche Bank; WestLB; BMWI; Nokia Siemens Networks; Literature search
Fixed�line and mobile bandwidth advances (Mbit/s)
0.1
0.2
0.5
1
2
5
10
20
50
100
200
500
1.000
2005 2010 2015
ADSL2+25 Mbit/s
LTE > 100 Mbit/s(theoretically)
HSPA+42 Mbit/s
UMTS2 Mbit/s
EDGE384 kbit/s
DOCSIS 2.0~25�30 Mbit/s
ADSL8 Mbit/s
Today
FTTH> 500 Mbit/s
2000
Power�line
HSPA14 Mbit/s
VDSL50 Mbit/s
DOCSIS 3.0 100�200
Mbit/s
Fixed line Wireless/mobile Cable Other
ISDN128 kbit/s
GPRS140 kbit/s
Sat
ILLUSTRATIVE
26http://www.portel.de/nc/nachricht/artikel/38858-eutelsat-hebt-breitbanddienst-toowayt-zum-1-juli-auf-36-mbits-an/
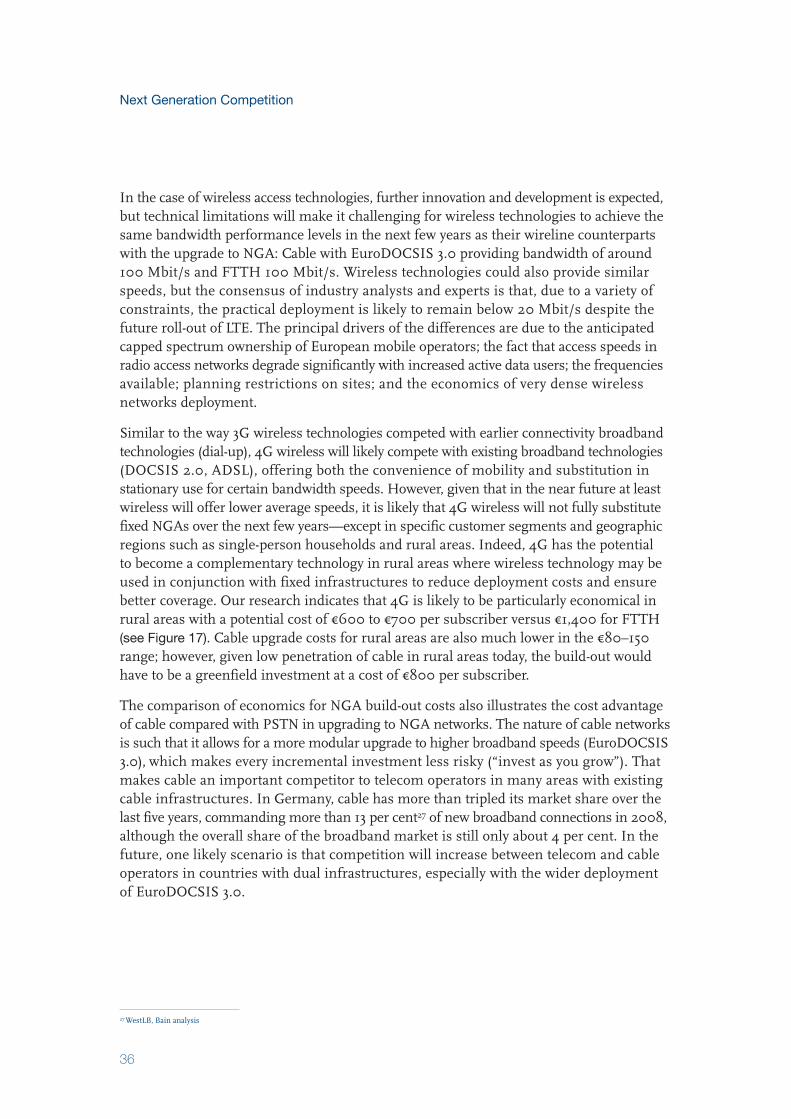
Next Generation Competition
36
In the case of wireless access technologies, further innovation and development is expected,but technical limitations will make it challenging for wireless technologies to achieve thesame bandwidth performance levels in the next few years as their wireline counterpartswith the upgrade to NGA: Cable with EuroDOCSIS 3.0 providing bandwidth of around100 Mbit/s and FTTH 100 Mbit/s. Wireless technologies could also provide similarspeeds, but the consensus of industry analysts and experts is that, due to a variety ofconstraints, the practical deployment is likely to remain below 20 Mbit/s despite the future roll-out of LTE. The principal drivers of the differences are due to the anticipatedcapped spectrum ownership of European mobile operators; the fact that access speeds inradio access networks degrade significantly with increased active data users; the frequenciesavailable; planning restrictions on sites; and the economics of very dense wirelessnetworks deployment.
Similar to the way 3G wireless technologies competed with earlier connectivity broadbandtechnologies (dial-up), 4G wireless will likely compete with existing broadband technologies(DOCSIS 2.0, ADSL), offering both the convenience of mobility and substitution instationary use for certain bandwidth speeds. However, given that in the near future at leastwireless will offer lower average speeds, it is likely that 4G wireless will not fully substitutefixed NGAs over the next few years—except in specific customer segments and geographicregions such as single-person households and rural areas. Indeed, 4G has the potential to become a complementary technology in rural areas where wireless technology may beused in conjunction with fixed infrastructures to reduce deployment costs and ensurebetter coverage. Our research indicates that 4G is likely to be particularly economical inrural areas with a potential cost of €600 to €700 per subscriber versus €1,400 for FTTH(see Figure 17). Cable upgrade costs for rural areas are also much lower in the €80–150range; however, given low penetration of cable in rural areas today, the build-out wouldhave to be a greenfield investment at a cost of €800 per subscriber.
The comparison of economics for NGA build-out costs also illustrates the cost advantageof cable compared with PSTN in upgrading to NGA networks. The nature of cable networksis such that it allows for a more modular upgrade to higher broadband speeds (EuroDOCSIS3.0), which makes every incremental investment less risky (“invest as you grow”). Thatmakes cable an important competitor to telecom operators in many areas with existingcable infrastructures. In Germany, cable has more than tripled its market share over thelast five years, commanding more than 13 per cent27 of new broadband connections in 2008,although the overall share of the broadband market is still only about 4 per cent. In thefuture, one likely scenario is that competition will increase between telecom and cableoperators in countries with dual infrastructures, especially with the wider deploymentof EuroDOCSIS 3.0.
27 WestLB, Bain analysis
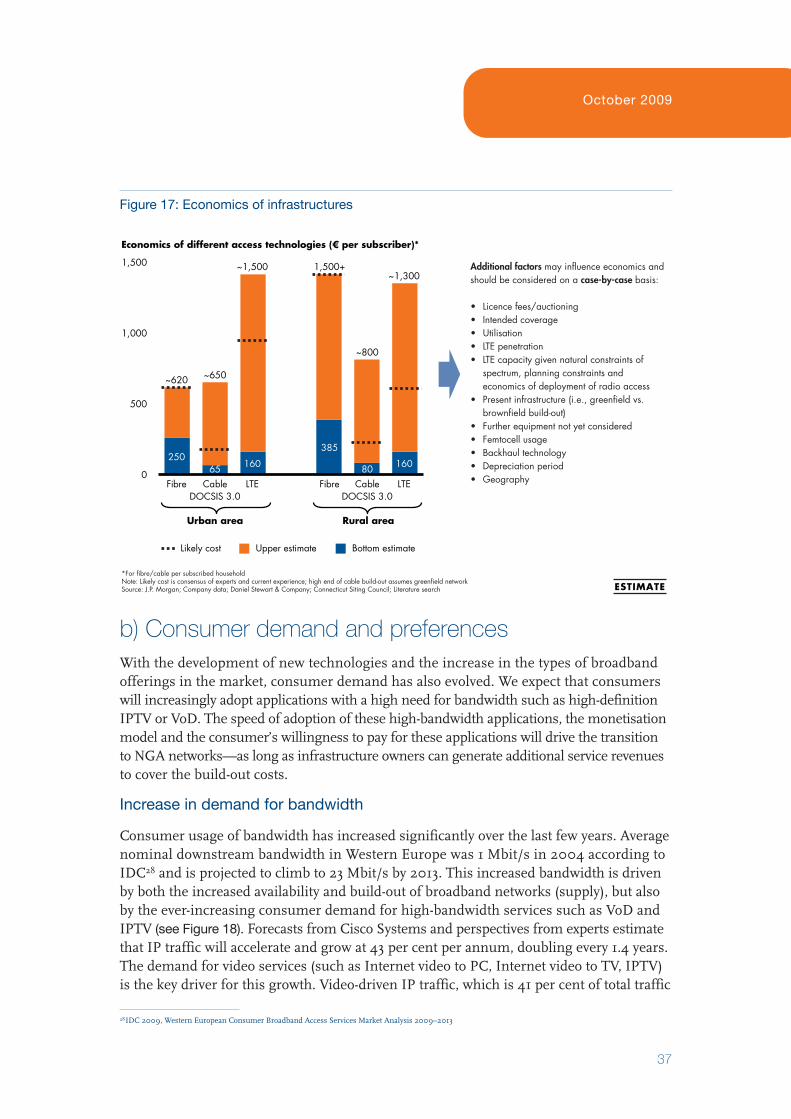
October 2009
37
b) Consumer demand and preferencesWith the development of new technologies and the increase in the types of broadband offerings in the market, consumer demand has also evolved. We expect that consumerswill increasingly adopt applications with a high need for bandwidth such as high-definitionIPTV or VoD. The speed of adoption of these high-bandwidth applications, the monetisationmodel and the consumer’s willingness to pay for these applications will drive the transitionto NGA networks—as long as infrastructure owners can generate additional service revenuesto cover the build-out costs.
Increase in demand for bandwidth
Consumer usage of bandwidth has increased significantly over the last few years. Averagenominal downstream bandwidth in Western Europe was 1 Mbit/s in 2004 according toIDC28 and is projected to climb to 23 Mbit/s by 2013. This increased bandwidth is drivenby both the increased availability and build-out of broadband networks (supply), but alsoby the ever-increasing consumer demand for high-bandwidth services such as VoD andIPTV (see Figure 18). Forecasts from Cisco Systems and perspectives from experts estimatethat IP traffic will accelerate and grow at 43 per cent per annum, doubling every 1.4 years.The demand for video services (such as Internet video to PC, Internet video to TV, IPTV)is the key driver for this growth. Video-driven IP traffic, which is 41 per cent of total traffic
Figure 17: Economics of infrastructures
*For fibre/cable per subscribed household Note: Likely cost is consensus of experts and current experience; high end of cable build�out assumes greenfield networkSource: J.P. Morgan; Company data; Daniel Stewart & Company; Connecticut Siting Council; Literature search
Additional factors may influence economics and should be considered on a case�by�case basis:
• Licence fees/auctioning• Intended coverage• Utilisation• LTE penetration• LTE capacity given natural constraints of spectrum, planning constraints and economics of deployment of radio access• Present infrastructure (i.e., greenfield vs. brownfield build�out)• Further equipment not yet considered• Femtocell usage• Backhaul technology• Depreciation period• Geography
Economics of different access technologies (€ per subscriber)*
0
500
1,000
1,500
Fibre
250
~620
CableDOCSIS 3.0
Urban area Rural area
65
~650
LTE
160
~1,500
Fibre
385
1,500+
CableDOCSIS 3.0
80
~800
LTE
160
~1,300
Likely cost Upper estimate Bottom estimate
ESTIMATE
28IDC 2009, Western European Consumer Broadband Access Services Market Analysis 2009–2013
Next Generation Competition
38
today, is expected to be 61 per cent by 2012 due to increased penetration of IPTV and Internet video to the computer. For example, 70 per cent of online29 users in the US todaywatch video online and that percentage is expected to increase in the future; trends aresimilar in Europe.
Video-related applications require much more bandwidth than the transfer of text orvoice-related data. A single high-definition (HD) video stream requires 7 to 9 Mbit/s. By contrast, a standard-definition (SD) stream requires only a quarter of the bandwidth,about 2 Mbit/s (see Figure 19). Other typical online applications such as Web browsing,voice over Internet protocol (VoIP) or VoD may benefit from bandwidths higher than 3Mbit/s, although the improvement in quality is imperceptible.
While in the future the appetite for high-bandwidth applications is projected to grow, today,most consumers still remain at the low end of the bandwidth spectrum, with 84 per centusing connections under 8 Mbit/s (see Figure 20). The reason for this is multifold. First,many households in Europe still do not have access to high-speed access networks. Second,even if the service is available, not all households subscribe to the service. High-speedoffers have only recently been introduced in most markets and consumers are either notaware of these offers or they are priced at levels at which consumers do not yet see avalue in subscribing to them. Third, even if consumers subscribe to the service, experienceshows they do not consistently experience 8 Mbit/s speeds. For example, in the UK,
29Bain survey of US consumers
Figure 18: Video-over-Internet usage is rapidly growing
38%
36%
19%36%53%
64%
106%
72%
Web, mail, data: includes Web, email, instant messaging, newsgroups and file transfer (excl. P2P and commercial file transfer such as iTunes)P2P: includes peer�to�peer traffic from all recognized P2P systems such as BitTorrent, eDonkey, etc.Gaming: includes casual online gaming, networked console gaming and multiplayer virtual world gamingVideo communications: includes PC�based video calling, webcam viewing, and Web�based video monitoringVoIP: includes traffic from retail VoIP services and PC�based VoIP, but excludes wholesale VoIP transportInternet Video to PC: free or pay TV or VoD viewed on a PC, excludes P2P video file downloadsInternet Video to TV: free or pay TV or VoD delivered via Internet but viewed on a TV screen using a STB or media gatewayIPTV: Commercial TV service within the footprint of a single service providerNote: Cable VoD not shownSource: Cisco (VNI FC & methodology 07�12 & 2008–2013 white paper)
Consumer IP traffic by segment(pentabyte per month) CAGR
(06�13)46%
0
2,000
4,000
6,000
8,000
10,000
2006A
557
2007A
897
2008F
1,829
2009F
2,572
2010F
3,553
2011F
5,137
2012F
6,877
2013F
IPTV
Other8,660
VoIP
Video to TV
Videoto PC
File sharing/
P2P
Web, mail, data
Video comm’s
Internet gaming
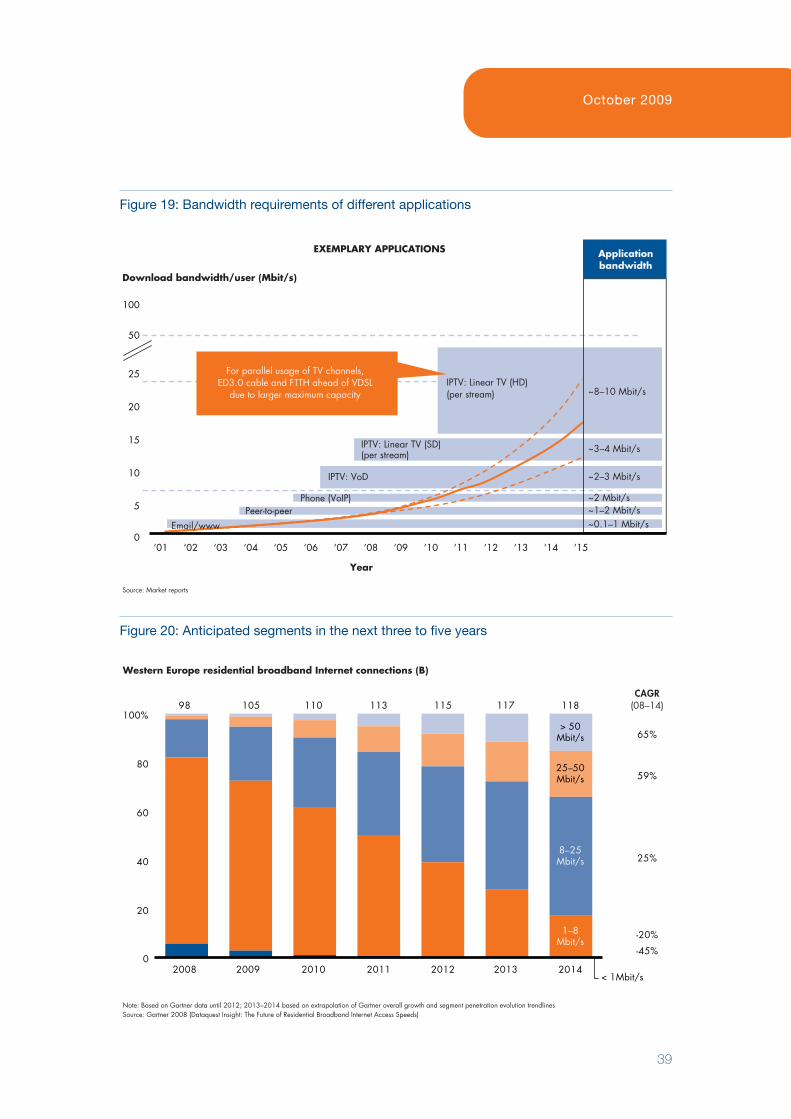
October 2009
39
Figure 19: Bandwidth requirements of different applications
Source: Market reports
‘01 ‘02 ‘04 ‘05 ‘06 ‘07 ‘08 ‘10 ‘11 ‘12 ‘13 ‘14 ‘15‘03 ‘090
5
10
15
20
25
100
50
Year
Download bandwidth/user (Mbit/s)
For parallel usage of TV channels,ED3.0 cable and FTTH ahead of VDSL
due to larger maximum capacity
EXEMPLARY APPLICATIONS Applicationbandwidth
IPTV: Linear TV (HD)(per stream) ~8–10 Mbit/s
IPTV: Linear TV (SD)(per stream)
IPTV: VoD
Phone (VoIP)Peer�to�peer
Email/www
~3–4 Mbit/s
~2–3 Mbit/s
~2 Mbit/s~1–2 Mbit/s~0.1–1 Mbit/s
Figure 20: Anticipated segments in the next three to five years
0
20
40
60
80
100%
2008
98
2009
105
2010
110
2011
113
2012
115
2013
117
2014
> 50Mbit/s
25–50Mbit/s
8–25Mbit/s
1–8Mbit/s
118
�45%
�20%
25%
59%
65%
< 1Mbit/s
CAGR(08–14)
Note: Based on Gartner data until 2012; 2013–2014 based on extrapolation of Gartner overall growth and segment penetration evolution trendlines Source: Gartner 2008 (Dataquest Insight: The Future of Residential Broadband Internet Access Speeds)
Western Europe residential broadband Internet connections (B)
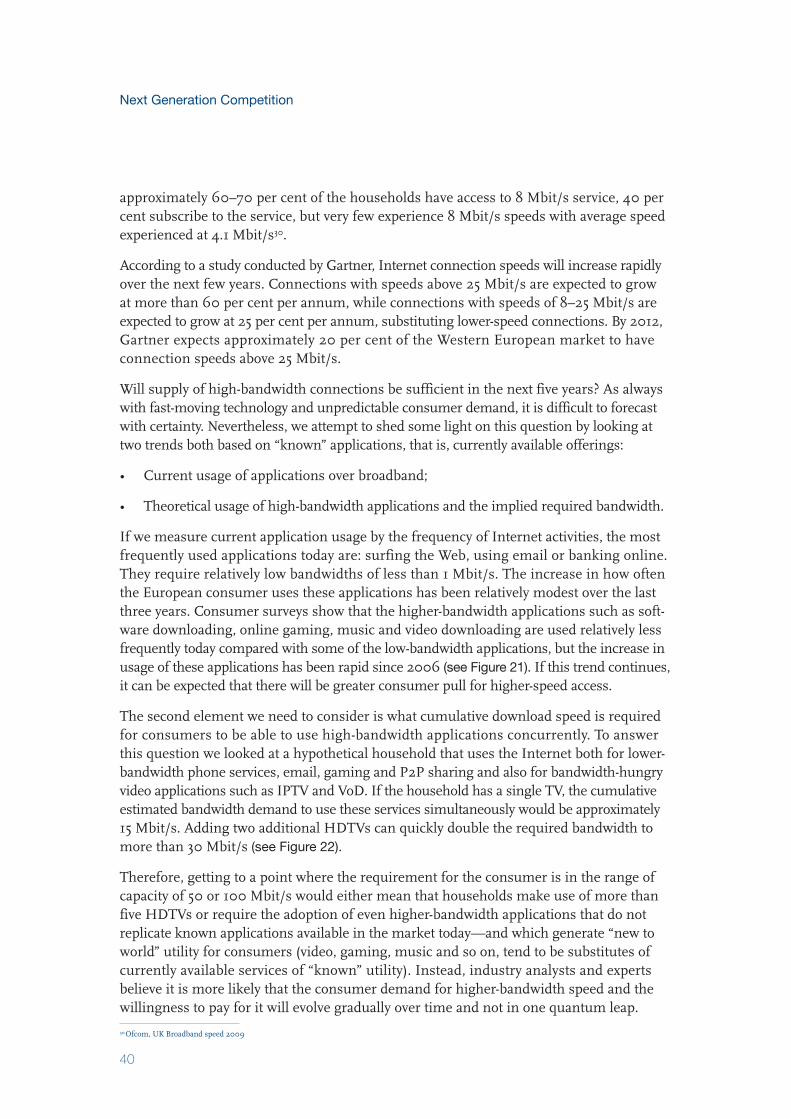
Next Generation Competition
40
approximately 60–70 per cent of the households have access to 8 Mbit/s service, 40 percent subscribe to the service, but very few experience 8 Mbit/s speeds with average speedexperienced at 4.1 Mbit/s30.
According to a study conducted by Gartner, Internet connection speeds will increase rapidlyover the next few years. Connections with speeds above 25 Mbit/s are expected to grow at more than 60 per cent per annum, while connections with speeds of 8–25 Mbit/s areexpected to grow at 25 per cent per annum, substituting lower-speed connections. By 2012,Gartner expects approximately 20 per cent of the Western European market to haveconnection speeds above 25 Mbit/s.
Will supply of high-bandwidth connections be sufficient in the next five years? As alwayswith fast-moving technology and unpredictable consumer demand, it is difficult to forecastwith certainty. Nevertheless, we attempt to shed some light on this question by looking attwo trends both based on “known” applications, that is, currently available offerings:
• Current usage of applications over broadband;
• Theoretical usage of high-bandwidth applications and the implied required bandwidth.
If we measure current application usage by the frequency of Internet activities, the mostfrequently used applications today are: surfing the Web, using email or banking online.They require relatively low bandwidths of less than 1 Mbit/s. The increase in how oftenthe European consumer uses these applications has been relatively modest over the lastthree years. Consumer surveys show that the higher-bandwidth applications such as soft-ware downloading, online gaming, music and video downloading are used relatively lessfrequently today compared with some of the low-bandwidth applications, but the increase inusage of these applications has been rapid since 2006 (see Figure 21). If this trend continues,it can be expected that there will be greater consumer pull for higher-speed access.
The second element we need to consider is what cumulative download speed is requiredfor consumers to be able to use high-bandwidth applications concurrently. To answer this question we looked at a hypothetical household that uses the Internet both for lower-bandwidth phone services, email, gaming and P2P sharing and also for bandwidth-hungryvideo applications such as IPTV and VoD. If the household has a single TV, the cumulativeestimated bandwidth demand to use these services simultaneously would be approximately15 Mbit/s. Adding two additional HDTVs can quickly double the required bandwidth tomore than 30 Mbit/s (see Figure 22).
Therefore, getting to a point where the requirement for the consumer is in the range ofcapacity of 50 or 100 Mbit/s would either mean that households make use of more thanfive HDTVs or require the adoption of even higher-bandwidth applications that do notreplicate known applications available in the market today—and which generate “new toworld” utility for consumers (video, gaming, music and so on, tend to be substitutes ofcurrently available services of “known” utility). Instead, industry analysts and experts believe it is more likely that the consumer demand for higher-bandwidth speed and thewillingness to pay for it will evolve gradually over time and not in one quantum leap.
30Ofcom, UK Broadband speed 2009
October 2009
41
Figure 21: High-bandwidth applications are growing fastest
0
20
40
60
80
100%
Percent of respondents
5% 50% �8%8% 21% 76% 38% 15% 30% 35% �9%Increase 06–08(as % of 06):
Source: LGI customer survey
“WHAT ACTIVITY DO YOU ENGAGE IN WHEN ACCESSING THE INTERNET?”
Low bandwidthapplications
High bandwidthapplications
Surf theWeb
Email Online banking
Download software
Onlinegaming
Buy/reserve/
sell products/services
Down�loadmusic
Streaming Chat Down�load
videos
Maintainwebsite/weblog
20062008
Figure 22: Adequate headroom in bandwidth to result in major upgrade of customer experience
Note: Assumes MPEG 4 video compressionSource: Market reports
0
10
20
30
40
Phone (VoIP)
0.2
1.0
Gaming
1.5
Data
8.0
P2P
2.0
IPTV
VoDLinear TV (SD)
LinearTV (HD)
8.0
Allapplications
20.7
Extra HDTVor parallelrecording
8.0
Extravideo
8.0
Upperrange
Fullhousehold
36.7
Cumulative download bandwidth (Mbit/s)
SIMULATION
Next Generation Competition
42
Demand for bundled services
Networks today are able to deliver multiple services simultaneously. Consequently, giventhe economies of scope, they are increasingly offering bundled services. Bundling refersto the offering of two or more telecommunications services under a single package andcan be in the form of a double, triple or quadruple offer. In 2008, according to IDC, bundlesalready represented close to 50 per cent of telecom revenues world-wide. Double-playbundles were most prevalent, representing 70 per cent of all bundle revenues. The mostpopular combinations are the so-called household bundles, which include “broadbandplus TV” and are typically offered by cable operators and “fixed voice plus broadband”offered by telco operators. The most prevalent triple-play bundles include “fixed voice plusbroadband plus TV”, and are provided by telcos and cable companies. The broadbandproduct is the anchor for bundles in the market today.
The penetration of bundled services varies by country significantly (see Figure 23). Countrieswith high penetration of bundles include France, the UK and the US while bundlepenetration is significantly lower in Denmark and Switzerland. This is more due to theavailability of attractive bundles in the market than by different buying behaviour ofconsumers in different countries. For example, in the UK, Virgin Media pursued the strategyto heavily incentivise full-product bundles, launching a quadruple-play offer in September2006. BT followed suit in December 2006, launching its quadruple-play offering, BTVision. Virgin reaped significant benefits from the bundled offer, reducing its monthlysubscriber churn to 1.2 per cent in the first quarter of 2008, its lowest since 2004.
From the consumer perspective, bundle purchases today are primarily driven by the pricediscount that accompanies them. Research conducted by IDC, Forrester Research andGartner demonstrates that US consumers cite price discounts as the predominant reasonfor selecting a bundled product—over choice and the ability to integrate services into asingle bill (see Figure 24).
The offering of bundles could further accelerate the demand for high-bandwidth packages,as operators offer bundles of high-speed access together with high-bandwidth applicationssuch as IPTV at attractive prices.
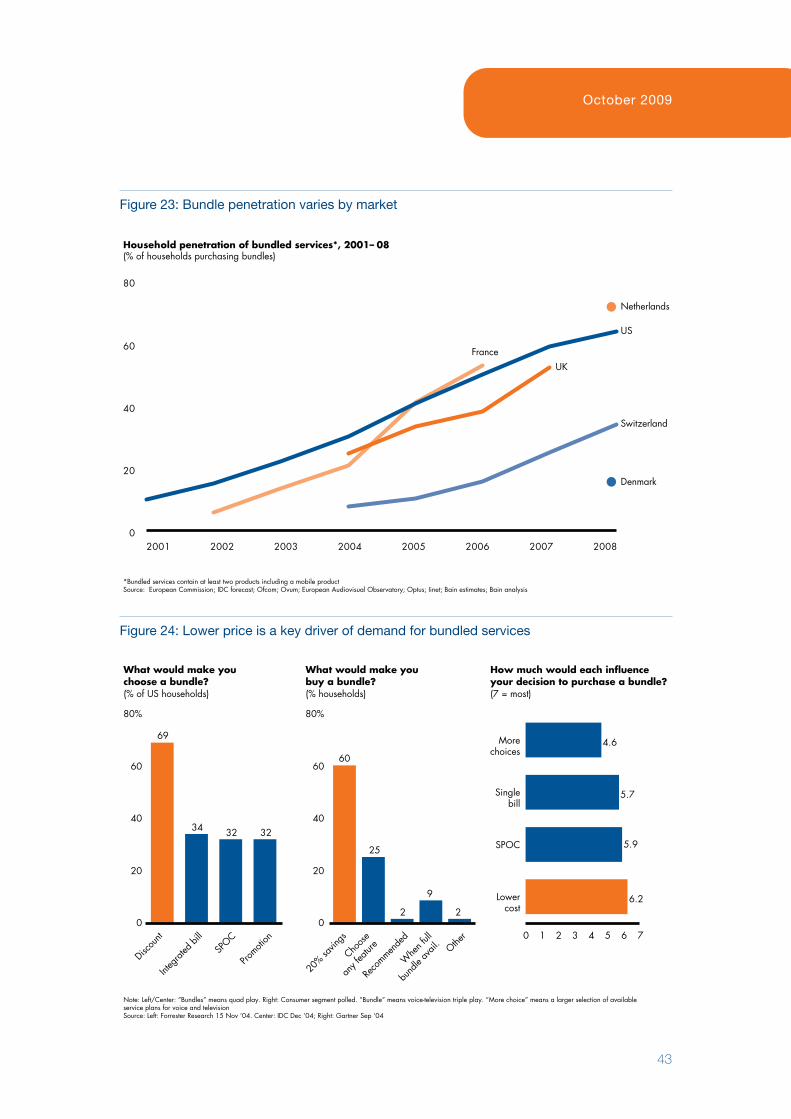
October 2009
43
Figure 23: Bundle penetration varies by market
*Bundled services contain at least two products including a mobile productSource: European Commission; IDC forecast; Ofcom; Ovum; European Audiovisual Observatory; Optus; Iinet; Bain estimates; Bain analysis
0
20
40
60
80
Switzerland
2001 2002 2003 2004 2005 2006 2007 2008
Household penetration of bundled services*, 2001– 08(% of households purchasing bundles)
Denmark
Netherlands
FranceUK
US
Figure 24: Lower price is a key driver of demand for bundled services
Note: Left/Center: “Bundles” means quad play. Right: Consumer segment polled. “Bundle” means voice�television triple play. “More choice” means a larger selection of availableservice plans for voice and televisionSource: Left: Forrester Research 15 Nov ‘04. Center: IDC Dec ’04; Right: Gartner Sep ‘04
Discou
nt
Integ
rated
bill
SPOC
Promoti
on
20% sa
vings
Choos
e
any f
eatur
e
Reco
mmende
d
Whe
n full
bund
le av
ail.
Other 0 1 2 3 4 5 6 7
0
20
40
60
80%
69
34 32 32
What would make youchoose a bundle?(% of US households)
0
20
40
60
80%
60
25
2
9
2
What would make youbuy a bundle?(% households)
6.2
5.9
5.7
4.6
Lowercost
SPOC
Singlebill
Morechoices
How much would each influenceyour decision to purchase a bundle?(7 = most)

Next Generation Competition
44
October 2009
45
5. Broadband upgrade economics
Current state and ambitions for broadband upgradesand NGA network expansionAcross Europe, the forces influencing the roll-out of NGA networks31 are technological advances, consumer usage patterns, and an increased focus by regulators and governmentson the societal and economic benefits of high-speed Internet. However, the future rate oftelecom upgrades across the continent is still uncertain. The European Commission is determining its approach for NGA regulation including questions on how to regulateduct access, what level of risk premium to award for unbundled fibre loops and risk sharingbetween investors and access seekers. At the national level too, goals and regulatoryapproaches are in their infancy with most national regulatory authorities (NRAs) waitingto see how the debate in Brussels evolves.
Despite these uncertainties, the gradual roll-out of NGA networks is happening across the continent with increasing coverage and aggressive targets in certain markets. FormerPTTs are upgrading their networks by adding more fibre and cable operators are upgradingto DOCSIS 3.0. According to Cullen International, a sample of 15 countries in WesternEurope has already achieved coverage of 17 per cent32 primarily with cable DOCSIS 3.0and FTTC/N. The coverage and plans are even more ambitious in some countries withSwisscom announcing 80 per cent achieved coverage in Switzerland and Belgacomannouncing 87 per cent achieved coverage in Belgium. Assuming that the targets forcoverage in terms of per cent of households passed (including FTTH, FTTC and HFCcable) are achieved (see Figure 25), NGA networks could reach 35 per cent of Europeanhouseholds over the next three to five years. However, the use of NGA network services byconsumers is significantly lower, still at approximately 1 per cent, and is concentratedprimarily in Scandinavia (Sweden leads the way at approximately 10 per cent as it starteddeployment of fibre in 2004, earlier than other markets) and the Netherlands33.
FTTH/B roll-outs across Europe have been led by either former PTTs (France, Finland,Slovenia) or by municipalities and utilities such as in Denmark, Norway and Sweden. Inthe Netherlands, KPN is doing both—it has a joint venture with local provider Reggefiberfor rural regions and is planning to roll out its own fibre in urban areas.
An interesting approach has been taken by Swisscom. The company initially favored aFTTN/C approach using VDSL technology to bridge the last mile to the house. In lightof the competitive dynamics—municipal utilities starting to build FTTH in urban areasand Cablecom upgrading its network to EuroDOCSIS 3.0—Swisscom recently altered itsstrategy focusing on FTTH in urban areas while using VDSL for the more rural areas.
31 While regulation for NGAs is yet being decided, the EC did provide a revised definition of NGAs in its June 12th draft recommendation which includes FTTH,
FTTC /N and cable DOCSIS 3.0 technologies, but at least at this stage does not include mobile broadband networks (WiMax, 3.5G/4G) in the definition. 32We calculate 17 per cent as the weighed average of 15 countries by their population. These countries are: FI, AT, PT, IE, IT, ES, NL, NO, FR, SE, DK, DE, UK, CH and BE.33Cullen International research
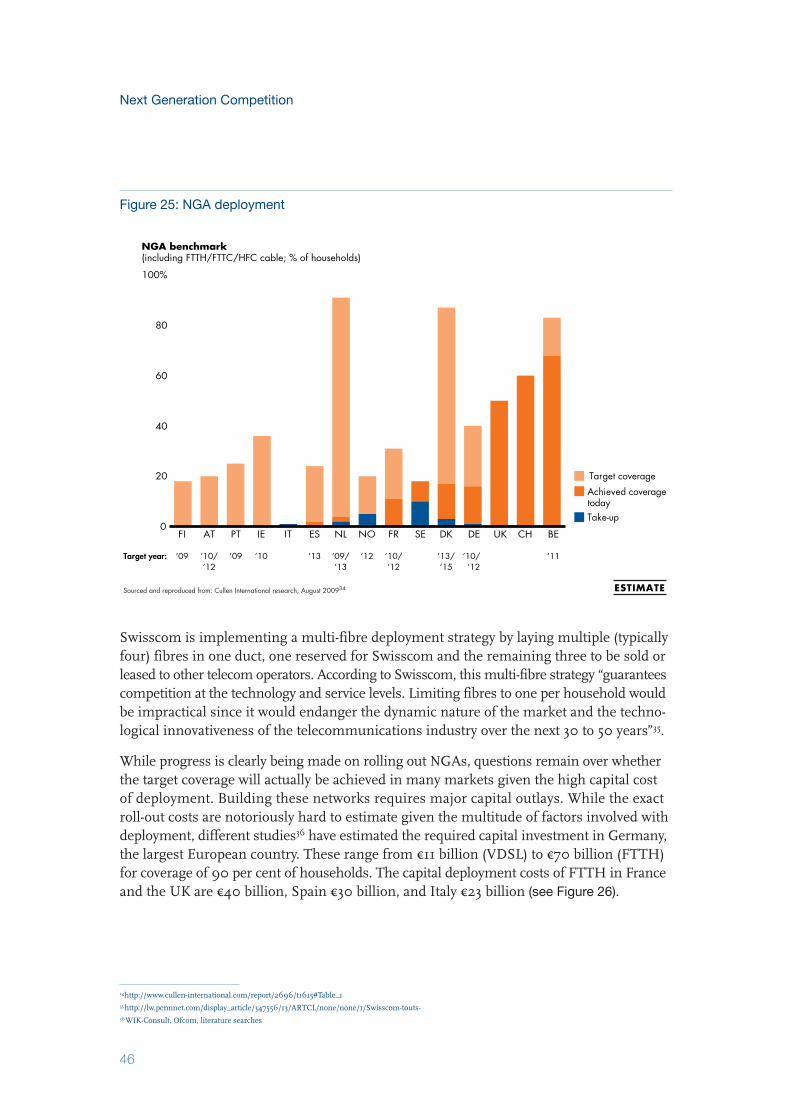
Next Generation Competition
46
Swisscom is implementing a multi-fibre deployment strategy by laying multiple (typicallyfour) fibres in one duct, one reserved for Swisscom and the remaining three to be sold orleased to other telecom operators. According to Swisscom, this multi-fibre strategy “guaranteescompetition at the technology and service levels. Limiting fibres to one per household wouldbe impractical since it would endanger the dynamic nature of the market and the techno-logical innovativeness of the telecommunications industry over the next 30 to 50 years”35.
While progress is clearly being made on rolling out NGAs, questions remain over whetherthe target coverage will actually be achieved in many markets given the high capital costof deployment. Building these networks requires major capital outlays. While the exactroll-out costs are notoriously hard to estimate given the multitude of factors involved withdeployment, different studies36 have estimated the required capital investment in Germany,the largest European country. These range from €11 billion (VDSL) to €70 billion (FTTH)for coverage of 90 per cent of households. The capital deployment costs of FTTH in Franceand the UK are €40 billion, Spain €30 billion, and Italy €23 billion (see Figure 26).
Figure 25: NGA deployment
Sourced and reproduced from: Cullen International research, August 200934 ESTIMATE
0
20
40
60
80
100%
FI AT PT IE IT ES NL NO FR SE DK DE UK CH BE
NGA benchmark(including FTTH/FTTC/HFC cable; % of households)
‘09 ‘13/‘15
‘10/‘12
‘11‘10/‘12
‘09 ‘10 ‘13 ‘09/‘13
‘12 ‘10/‘12
Target year:
Take�up
Achieved coveragetoday
Target coverage
34http://www.cullen-international.com/report/2696/t1615#Table_1 35http://lw.pennnet.com/display_article/347556/13/ARTCL/none/none/1/Swisscom-touts-36WIK-Consult, Ofcom, literature searches
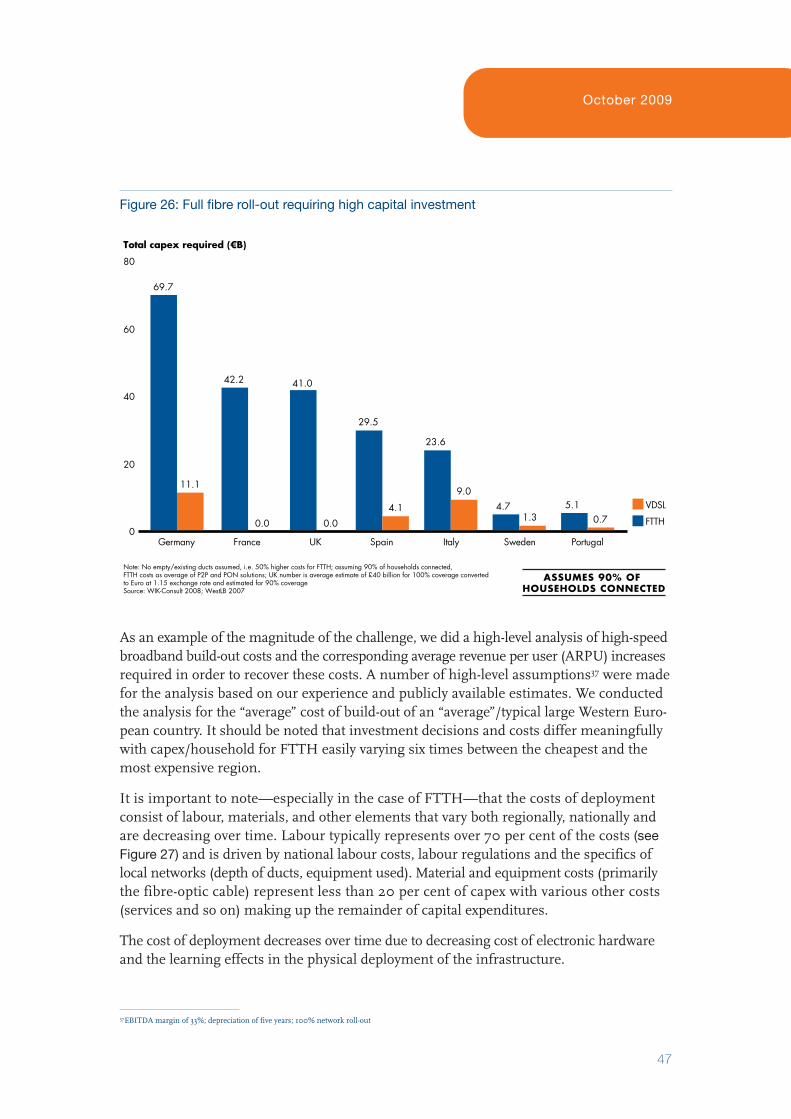
October 2009
47
As an example of the magnitude of the challenge, we did a high-level analysis of high-speedbroadband build-out costs and the corresponding average revenue per user (ARPU) increasesrequired in order to recover these costs. A number of high-level assumptions37 were madefor the analysis based on our experience and publicly available estimates. We conductedthe analysis for the “average” cost of build-out of an “average”/typical large Western Euro-pean country. It should be noted that investment decisions and costs differ meaningfullywith capex/household for FTTH easily varying six times between the cheapest and themost expensive region.
It is important to note—especially in the case of FTTH—that the costs of deploymentconsist of labour, materials, and other elements that vary both regionally, nationally andare decreasing over time. Labour typically represents over 70 per cent of the costs (seeFigure 27) and is driven by national labour costs, labour regulations and the specifics oflocal networks (depth of ducts, equipment used). Material and equipment costs (primarilythe fibre-optic cable) represent less than 20 per cent of capex with various other costs (services and so on) making up the remainder of capital expenditures.
The cost of deployment decreases over time due to decreasing cost of electronic hardwareand the learning effects in the physical deployment of the infrastructure.
Figure 26: Full fibre roll-out requiring high capital investment
Note: No empty/existing ducts assumed, i.e. 50% higher costs for FTTH; assuming 90% of households connected,FTTH costs as average of P2P and PON solutions; UK number is average estimate of £40 billion for 100% coverage convertedto Euro at 1.15 exchange rate and estimated for 90% coverageSource: WIK�Consult 2008; WestLB 2007
0
20
40
60
80
Germany
69.7
11.1
France
42.2
0.0
UK
41.0
0.0
Spain
29.5
4.1
Italy
23.6
9.0
Sweden
4.71.3
Portugal
5.10.7
Total capex required (€B)
FTTH
VDSL
ASSUMES 90% OF HOUSEHOLDS CONNECTED
37EBITDA margin of 33%; depreciation of five years; 100% network roll-out
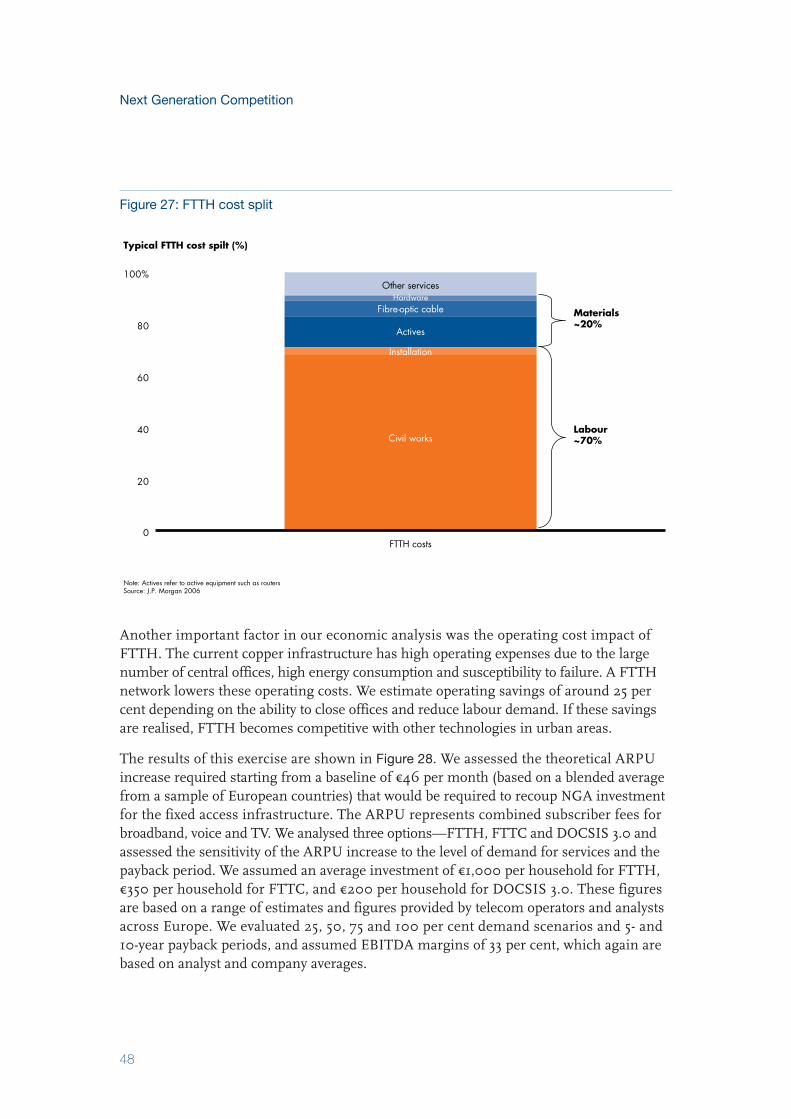
Next Generation Competition
48
Another important factor in our economic analysis was the operating cost impact ofFTTH. The current copper infrastructure has high operating expenses due to the largenumber of central offices, high energy consumption and susceptibility to failure. A FTTHnetwork lowers these operating costs. We estimate operating savings of around 25 percent depending on the ability to close offices and reduce labour demand. If these savingsare realised, FTTH becomes competitive with other technologies in urban areas.
The results of this exercise are shown in Figure 28. We assessed the theoretical ARPU increase required starting from a baseline of €46 per month (based on a blended averagefrom a sample of European countries) that would be required to recoup NGA investmentfor the fixed access infrastructure. The ARPU represents combined subscriber fees forbroadband, voice and TV. We analysed three options—FTTH, FTTC and DOCSIS 3.0 andassessed the sensitivity of the ARPU increase to the level of demand for services and thepayback period. We assumed an average investment of €1,000 per household for FTTH,€350 per household for FTTC, and €200 per household for DOCSIS 3.0. These figuresare based on a range of estimates and figures provided by telecom operators and analystsacross Europe. We evaluated 25, 50, 75 and 100 per cent demand scenarios and 5- and10-year payback periods, and assumed EBITDA margins of 33 per cent, which again arebased on analyst and company averages.
Figure 27: FTTH cost split
Note: Actives refer to active equipment such as routersSource: J.P. Morgan 2006
0
20
40
60
80
100%
FTTH costs
Other services
Materials~20%
Labour~70%
Typical FTTH cost spilt (%)
Civil works
Installation
Fibre�optic cableHardware
Actives
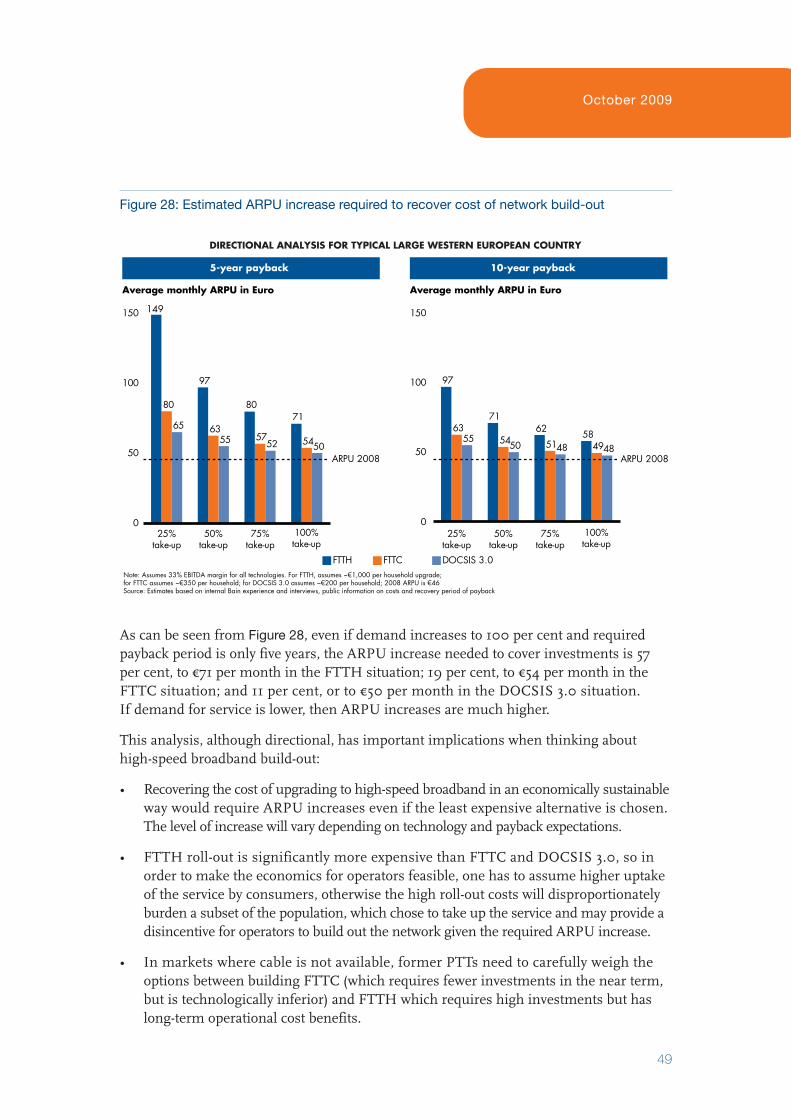
October 2009
49
As can be seen from Figure 28, even if demand increases to 100 per cent and requiredpayback period is only five years, the ARPU increase needed to cover investments is 57per cent, to €71 per month in the FTTH situation; 19 per cent, to €54 per month in theFTTC situation; and 11 per cent, or to €50 per month in the DOCSIS 3.0 situation. If demand for service is lower, then ARPU increases are much higher.
This analysis, although directional, has important implications when thinking abouthigh-speed broadband build-out:
• Recovering the cost of upgrading to high-speed broadband in an economically sustainableway would require ARPU increases even if the least expensive alternative is chosen.The level of increase will vary depending on technology and payback expectations.
• FTTH roll-out is significantly more expensive than FTTC and DOCSIS 3.0, so inorder to make the economics for operators feasible, one has to assume higher uptakeof the service by consumers, otherwise the high roll-out costs will disproportionatelyburden a subset of the population, which chose to take up the service and may provide adisincentive for operators to build out the network given the required ARPU increase.
• In markets where cable is not available, former PTTs need to carefully weigh the options between building FTTC (which requires fewer investments in the near term, but is technologically inferior) and FTTH which requires high investments but haslong-term operational cost benefits.
Figure 28: Estimated ARPU increase required to recover cost of network build-out
Note: Assumes 33% EBITDA margin for all technologies. For FTTH, assumes ~€1,000 per household upgrade;for FTTC assumes ~€350 per household; for DOCSIS 3.0 assumes ~€200 per household; 2008 ARPU is €46Source: Estimates based on internal Bain experience and interviews, public information on costs and recovery period of payback
0
50
100
150
ARPU 2008
25%take�up
65
80
149
50%take�up
5563
97
75%take�up
5257
80
100%take�up
25%take�up
50%take�up
75%take�up
100%take�up
5054
71
Average monthly ARPU in Euro
FTTH FTTC DOCSIS 3.0
0
50
100
150
Average monthly ARPU in Euro
ARPU 2008
5563
97
5054
71
4851
62
484958
5�year payback 10�year payback
DIRECTIONAL ANALYSIS FOR TYPICAL LARGE WESTERN EUROPEAN COUNTRY
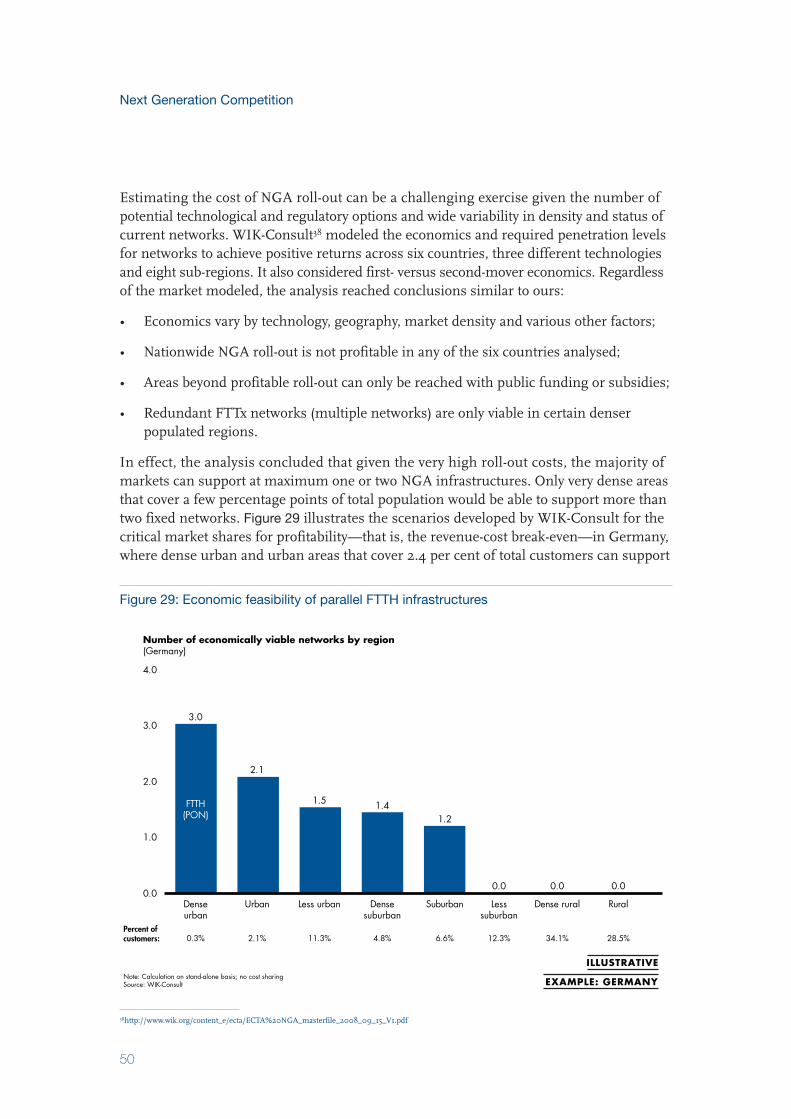
Next Generation Competition
50
Estimating the cost of NGA roll-out can be a challenging exercise given the number of potential technological and regulatory options and wide variability in density and status ofcurrent networks. WIK-Consult38 modeled the economics and required penetration levelsfor networks to achieve positive returns across six countries, three different technologiesand eight sub-regions. It also considered first- versus second-mover economics. Regardlessof the market modeled, the analysis reached conclusions similar to ours:
• Economics vary by technology, geography, market density and various other factors;
• Nationwide NGA roll-out is not profitable in any of the six countries analysed;
• Areas beyond profitable roll-out can only be reached with public funding or subsidies;
• Redundant FTTx networks (multiple networks) are only viable in certain denser populated regions.
In effect, the analysis concluded that given the very high roll-out costs, the majority ofmarkets can support at maximum one or two NGA infrastructures. Only very dense areasthat cover a few percentage points of total population would be able to support more thantwo fixed networks. Figure 29 illustrates the scenarios developed by WIK-Consult for thecritical market shares for profitability—that is, the revenue-cost break-even—in Germany,where dense urban and urban areas that cover 2.4 per cent of total customers can support
Figure 29: Economic feasibility of parallel FTTH infrastructures
Note: Calculation on stand�alone basis; no cost sharingSource: WIK�Consult
Percent ofcustomers:
0.0
1.0
2.0
3.0
4.0
Denseurban
FTTH(PON)
3.0
Urban
2.1
Less urban
1.5
Densesuburban
1.4
Suburban
1.2
Lesssuburban
0.0
Dense rural
0.0
Rural
0.0
0.3% 2.1% 11.3% 4.8% 6.6% 12.3% 34.1% 28.5%
Number of economically viable networks by region(Germany)
ILLUSTRATIVE
EXAMPLE: GERMANY
38http://www.wik.org/content_e/ecta/ECTA%20NGA_masterfile_2008_09_15_V1.pdf
October 2009
51
up to two or three FTTH networks. On the other hand, less urban and suburban areasthat represent 35 per cent of customers can support one to three networks depending onthe technology. In rural areas where 63 per cent of the population resides, the economicsof building out an NGA network are extremely challenging.
In addition to difficult economics, migrating customers to FTTH presents its own set ofchallenges, including issues such as:
• Whether customers would be allowed to maintain a copper connection in addition tothe fibre one;
• How voice services would be delivered and priced to the consumer;
• How access to premises will be coordinated to install substantial FTTH equipment onor inside the home;
• If—and how—traditional “lifeline” services (where a household that does not pay fora voice package may still be able to call emergency services, even in the event of apower failure) will be provided via fibre.
The challenging economics and customer migration approach lead to an even broaderquestion. Is broad NGA coverage across Europe the right objective for the EC and Europeancountries over the next five years? While there is no easy answer, infrastructure competitionand continuous innovation are likely to remain strong driving forces for the evolution oftelecommunications technology—just as they have often in the past. Competition will invariably lead to greater NGA build-out, but at a pace sustainable for the market andmore in line with increasing consumer demand for bandwidth. Technologically, mostfixed infrastructures today are, in fact, already NGA-capable and only require the right financial investments.
Therefore, we define next generation competition as a “sustainable” infrastructure-basedcompetition that enables a healthy, economically feasible pace of technological developmentand NGA network roll-out, while meeting evolving consumer demand for high-speedconnections. Given the importance of defining “sustainability” of infrastructure competitionin the market, our last chapter will provide a framework for assessing next generationcompetition in the market and apply this framework to evaluate the likely evolution ofcompetition in a number of European markets.

Next Generation Competition
52
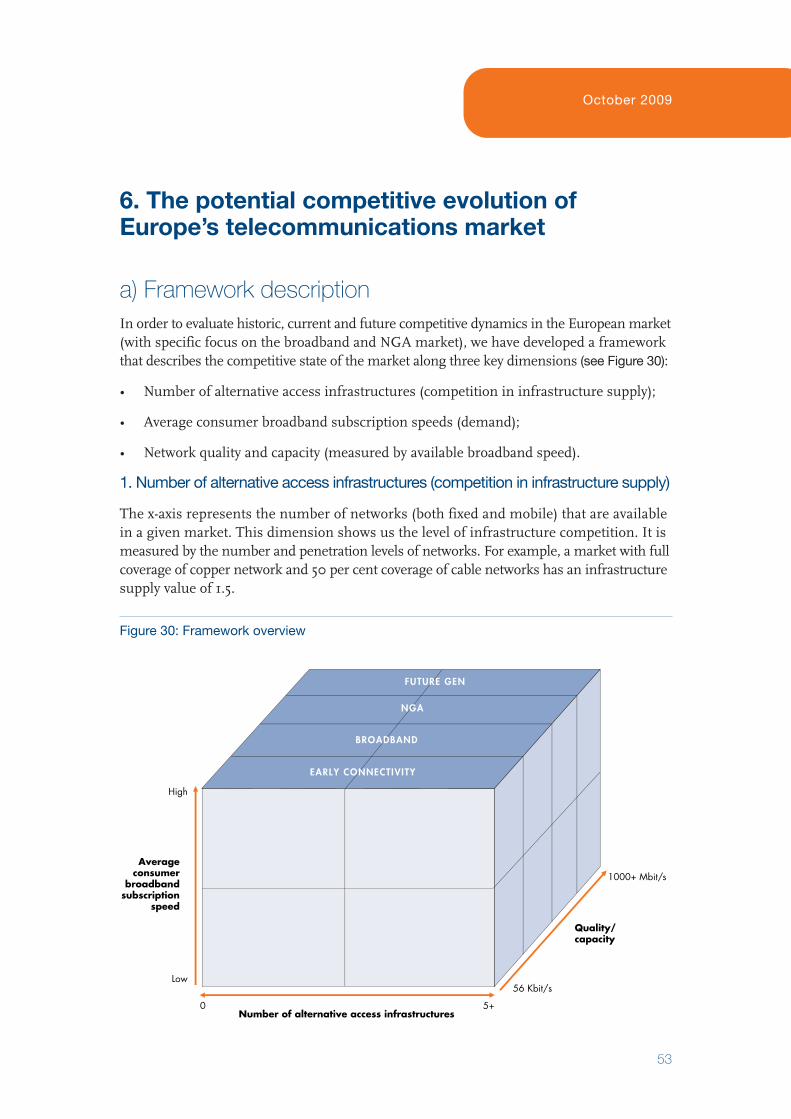
October 2009
53
6. The potential competitive evolution of Europe’s telecommunications market
a) Framework descriptionIn order to evaluate historic, current and future competitive dynamics in the European market(with specific focus on the broadband and NGA market), we have developed a frameworkthat describes the competitive state of the market along three key dimensions (see Figure 30):
• Number of alternative access infrastructures (competition in infrastructure supply);
• Average consumer broadband subscription speeds (demand);
• Network quality and capacity (measured by available broadband speed).
1. Number of alternative access infrastructures (competition in infrastructure supply)
The x-axis represents the number of networks (both fixed and mobile) that are available in a given market. This dimension shows us the level of infrastructure competition. It ismeasured by the number and penetration levels of networks. For example, a market with fullcoverage of copper network and 50 per cent coverage of cable networks has an infrastructuresupply value of 1.5.
Figure 30: Framework overview
High
Low
0 5+
1000+ Mbit/s
56 Kbit/s
Quality/capacity
Number of alternative access infrastructures
Averageconsumer
broadbandsubscription
speed
EARLY CONNECTIVITY
BROADBAND
NGA
FUTURE GEN
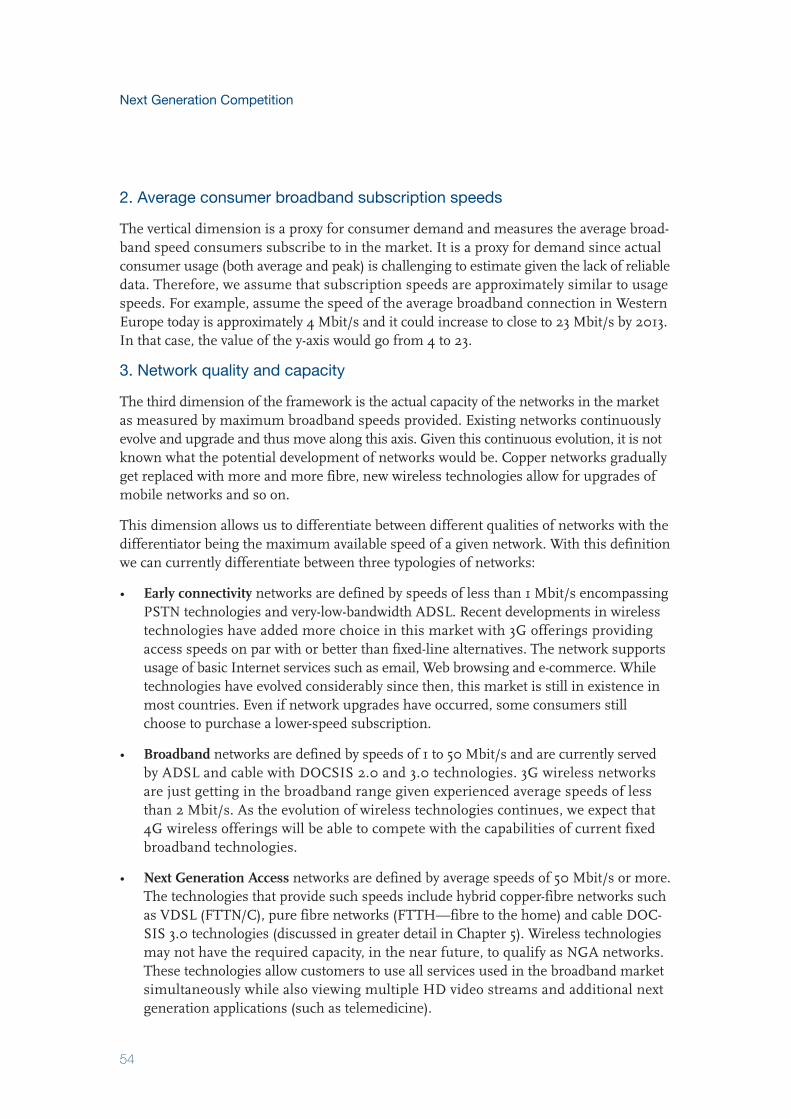
Next Generation Competition
54
2. Average consumer broadband subscription speeds
The vertical dimension is a proxy for consumer demand and measures the average broad-band speed consumers subscribe to in the market. It is a proxy for demand since actualconsumer usage (both average and peak) is challenging to estimate given the lack of reliabledata. Therefore, we assume that subscription speeds are approximately similar to usagespeeds. For example, assume the speed of the average broadband connection in WesternEurope today is approximately 4 Mbit/s and it could increase to close to 23 Mbit/s by 2013.In that case, the value of the y-axis would go from 4 to 23.
3. Network quality and capacity
The third dimension of the framework is the actual capacity of the networks in the marketas measured by maximum broadband speeds provided. Existing networks continuouslyevolve and upgrade and thus move along this axis. Given this continuous evolution, it is notknown what the potential development of networks would be. Copper networks graduallyget replaced with more and more fibre, new wireless technologies allow for upgrades ofmobile networks and so on.
This dimension allows us to differentiate between different qualities of networks with thedifferentiator being the maximum available speed of a given network. With this definitionwe can currently differentiate between three typologies of networks:
• Early connectivity networks are defined by speeds of less than 1 Mbit/s encompassingPSTN technologies and very-low-bandwidth ADSL. Recent developments in wirelesstechnologies have added more choice in this market with 3G offerings providingaccess speeds on par with or better than fixed-line alternatives. The network supportsusage of basic Internet services such as email, Web browsing and e-commerce. Whiletechnologies have evolved considerably since then, this market is still in existence inmost countries. Even if network upgrades have occurred, some consumers stillchoose to purchase a lower-speed subscription.
• Broadband networks are defined by speeds of 1 to 50 Mbit/s and are currently servedby ADSL and cable with DOCSIS 2.0 and 3.0 technologies. 3G wireless networksare just getting in the broadband range given experienced average speeds of lessthan 2 Mbit/s. As the evolution of wireless technologies continues, we expect that4G wireless offerings will be able to compete with the capabilities of current fixedbroadband technologies.
• Next Generation Access networks are defined by average speeds of 50 Mbit/s or more.The technologies that provide such speeds include hybrid copper-fibre networks suchas VDSL (FTTN/C), pure fibre networks (FTTH—fibre to the home) and cable DOC-SIS 3.0 technologies (discussed in greater detail in Chapter 5). Wireless technologiesmay not have the required capacity, in the near future, to qualify as NGA networks.These technologies allow customers to use all services used in the broadband marketsimultaneously while also viewing multiple HD video streams and additional nextgeneration applications (such as telemedicine).
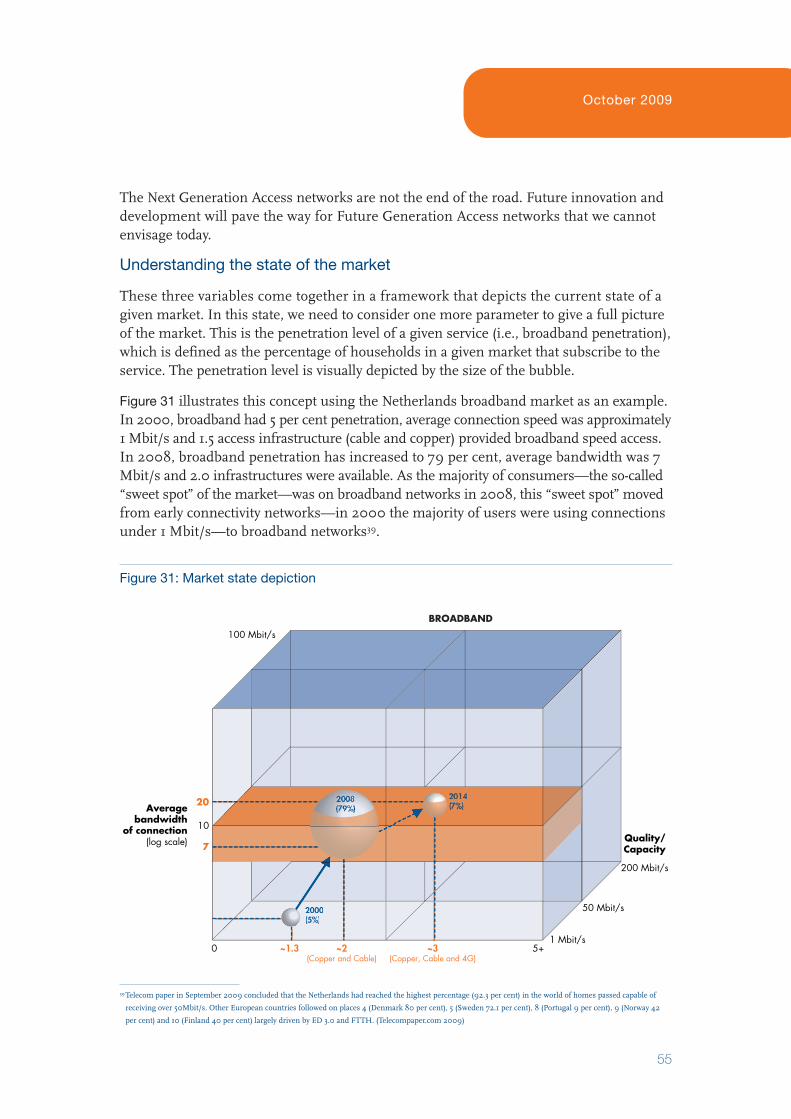
October 2009
55
The Next Generation Access networks are not the end of the road. Future innovation anddevelopment will pave the way for Future Generation Access networks that we cannot envisage today.
Understanding the state of the market
These three variables come together in a framework that depicts the current state of agiven market. In this state, we need to consider one more parameter to give a full pictureof the market. This is the penetration level of a given service (i.e., broadband penetration),which is defined as the percentage of households in a given market that subscribe to theservice. The penetration level is visually depicted by the size of the bubble.
Figure 31 illustrates this concept using the Netherlands broadband market as an example.In 2000, broadband had 5 per cent penetration, average connection speed was approximately1 Mbit/s and 1.5 access infrastructure (cable and copper) provided broadband speed access.In 2008, broadband penetration has increased to 79 per cent, average bandwidth was 7Mbit/s and 2.0 infrastructures were available. As the majority of consumers—the so-called“sweet spot” of the market—was on broadband networks in 2008, this “sweet spot” movedfrom early connectivity networks—in 2000 the majority of users were using connectionsunder 1 Mbit/s—to broadband networks39.
Figure 31: Market state depiction
10
100 Mbit/s
~2(Copper and Cable)
~1.3 ~3(Copper, Cable and 4G)
7
20Average
bandwidthof connection
(log scale)
BROADBAND
2000(5%)
0 5+1 Mbit/s
50 Mbit/s
200 Mbit/s
Quality/Capacity
2000(5%)
39Telecom paper in September 2009 concluded that the Netherlands had reached the highest percentage (92.3 per cent) in the world of homes passed capable of
receiving over 50Mbit/s. Other European countries followed on places 4 (Denmark 80 per cent), 5 (Sweden 72.1 per cent), 8 (Portugal 9 per cent), 9 (Norway 42
per cent) and 10 (Finland 40 per cent) largely driven by ED 3.0 and FTTH. (Telecompaper.com 2009)
Next Generation Competition
56
b) Future market structures European markets show different starting points in terms of available wireline infrastructure(see Chapter 3) and as a consequence different competitive dynamics resulting in variousspeeds of migration to higher-bandwidth access networks. There are few countries inEurope that achieve close to 100 per cent coverage of two competing wireline accessinfrastructures (mainly the Netherlands and Belgium with above 90 per cent penetration)and also few that only have one wireline access infrastructure everywhere (mainly Greece).Most European markets fall between these extremes with dual fixed access infrastructurein some regions, typically the urban areas, and only one fixed access infrastructure in lessdensely populated regions.
In order to understand the possible migration to NGA networks we separately analysedual and single fixed access infrastructure regions and assess their likely evolution. Formost of the European countries that do not fall into these extremes (like the Netherlands,Belgium and Greece), their evolution will be a mixture of the shown outcomes of dualand single fixed access infrastructure regions as described at the end of this report.
1. Potential evolution of dual fixed access infrastructure markets
Dual fixed infrastructure markets exist in countries where cable networks have been builtwith national or close to national coverage in the past in addition to the fixed infrastructureof the former PTT. In Europe those markets can be found at the national level in theNetherlands, Belgium and Switzerland and at the regional level in 49 per cent40 of theUK, 54 per cent of Germany and 29 per cent of France. In these countries and sub-regions,cable operators and former PTTs already compete head-to-head today: Cable operatorshave entered the voice and Internet/broadband businesses of telecom operators, whereastelecom operators have recently entered the TV market with their own IPTV offerings tocompete with cable TV.
Established dual fixed infrastructure markets benefit from the fact that they have competitionon both the service and the infrastructure level. Service-level competition impact has itslimits given the service provider is dependent on a single access infrastructure and thisimpacts the viability to differentiate on quality and service. It can even reduce the investmentfrom challenger infrastructure players. Competition between infrastructures providessignificant incentives to their owners to continuously invest and outperform, or at leastremain competitive in terms of available bandwidth.
We focus on four key questions to understand the future market structure and the potentialmigration path towards further innovation of existing networks in these established dualfixed access infrastructure markets:
• Will both fixed access infrastructures upgrade their networks to higher capacities andwhat is driving the speed of this upgrade?
40Measured as homes passed as a percentage of all households
October 2009
57
• Will infrastructure competition allow for full national coverage of broadband andNGA capacity networks and if not, what are the potential scenarios to bridge this gap?
• Is there likelihood of additional fixed broadband infrastructure build-out and how eco-nomically sustainable would these high-capacity networks be?
• What is the role wireless can play in a dual fixed infrastructure market?
We investigate each of these questions in more detail below and provide the rationale fortheir answers in order to illustrate our perspective on the future market structure and itsmigration path towards higher-capacity networks.
Upgrading the existing fixed infrastructures
The continuous upgrading of existing infrastructures to higher capacities has alreadystarted in dual fixed infrastructure markets over the last two to three years and is an ongoingprocess. Our analyses of these markets show very significant progress on broadband andNGA build-out for both cable operators and former PTTs:
• In dual fixed access infrastructure countries (the Netherlands, Switzerland, Belgium)and on a regional basis (UK, France, Germany cable regions) cable operators arealready upgrading major parts of their networks to EuroDOCSIS 3.0. While roll-outnumbers have not been announced, given the past and current investment level ofcable operators, we estimate upgrade levels could reach over 90 per cent by 2010 in a majority of these markets. Therefore, NGA networks will become to a large extentavailable in areas with cable coverage, which is around 95 per cent of the populationin the Netherlands, 99 per cent in Belgium and 88 per cent in Switzerland41.
• Telecom operators have recently started to roll out VDSL and FTTH in dual access infrastructure markets. They have announced major investment plans; for example,Swisscom plans to invest €5 billion over the next six years, to accelerate build-out andtransition its current network. Therefore, we expect today’s availability of VDSL andFTTH—which stands at less than 5 per cent in the Netherlands, but more than 60per cent in Belgium and Switzerland42—to increase significantly.
This high-broadband capacity network build-out has been the result of the competitive dynamics in the country or regional market. Both telecom operators and cable operatorshave an incentive to invest into higher-capacity networks to build a competitive edge intheir offering by providing higher bandwidth to consumers. The first mover has the advantage of offering a superior product that cannot at that moment be matched by thelagging infrastructure owner—and as a consequence, gaining market share in thosesegments of the market that appreciate the higher-bandwidth offering. This first-moveradvantage goes beyond the incremental revenues of the NGA network as some of theseconsumers opt for bundles of products that increase the operator’s share of wallet withthe customer.
41“European Broadband Cable 2008” – Screen Digest42Cullen International research
Next Generation Competition
58
The speed of market share gain depends—among other factors (such as brand, customerservice and so on)—on the superiority of the offer (in terms of higher-bandwidth) andconsumer demand for such high-speeds. The greater demand for high-speeds picks upand goes beyond what the lagging infrastructure owner can offer, the higher the marketshare gain of the upgraded infrastructure owner will be. As a consequence, the otherinfrastructure owner has a strong incentive to upgrade its network as well in order toremain competitive and reduce churn and revenue loss. Given the time required to upgrade the network, this process needs to start ahead of demand, reaching the threshold of significant market share losses.
The market dynamic of gaining or losing customers depending on the ability to offerhigher-bandwidth is the main reason why dual fixed access infrastructure markets arebetter positioned for a fast high-bandwidth network roll-out compared with single fixed-infrastructure markets. Assuming rational investment behaviour, an infrastructure ownerin a single fixed infrastructure market will primarily base its upgrade business case on theadditional ARPU it can generate with its customer base. This depends on the consumers’willingness to pay for higher-bandwidth and the applications offered through the high-bandwidth network to recover the significant required investments. In dual fixed accessinfrastructure markets, the infrastructure owners will also consider in their business casethe revenue impact of share gains or losses of customers to the competing infrastructureowner, including the complementary product revenues with these customers. Experienceshows that considering these competitive dynamics in the network build-out businesscase will lead infrastructure owners to invest in high-capacity networks faster, either tocreate a competitive advantage or to close the gap to the competing infrastructure owners.Therefore, competition among the two infrastructures provides strong incentives for their own-ers to continuously upgrade their networks and to invest in the next technology.
This competitive dynamic between infrastructure owners can be observed when analysinginvestment levels of former PTTs and cable operators in dual fixed access infrastructurecountries (sub-regional data not available for the purposes of this analysis). We looked at theaverage capex/sales ratio of former PTTs and the largest cable operator in the Netherlandsand Switzerland in two intervals over time: From 2006 to 2008 and the forecastedcapex/sales ratio from 2008 to 2011 (see Figure 32).
In recent years, there has been an upgrade of cable, which is also reflected in a high averagecapex ratio. These high investments were driven by upgrading to bi-directional networks,CPE investments to drive penetration of advanced services; and recently by migration toDOCSIS 3.0. After this upgrade, it is reasonable to assume that investments will dropsomewhat for the next three years and cable operators will focus on recovering a returnon capital invested before they move towards the next generation of technology. Thisupgrade allows cable operators a competitive advantage—and some breathing space interms of new investments—by offering bandwidth speeds which former PTTs only canmatch when they migrate to FTTH.
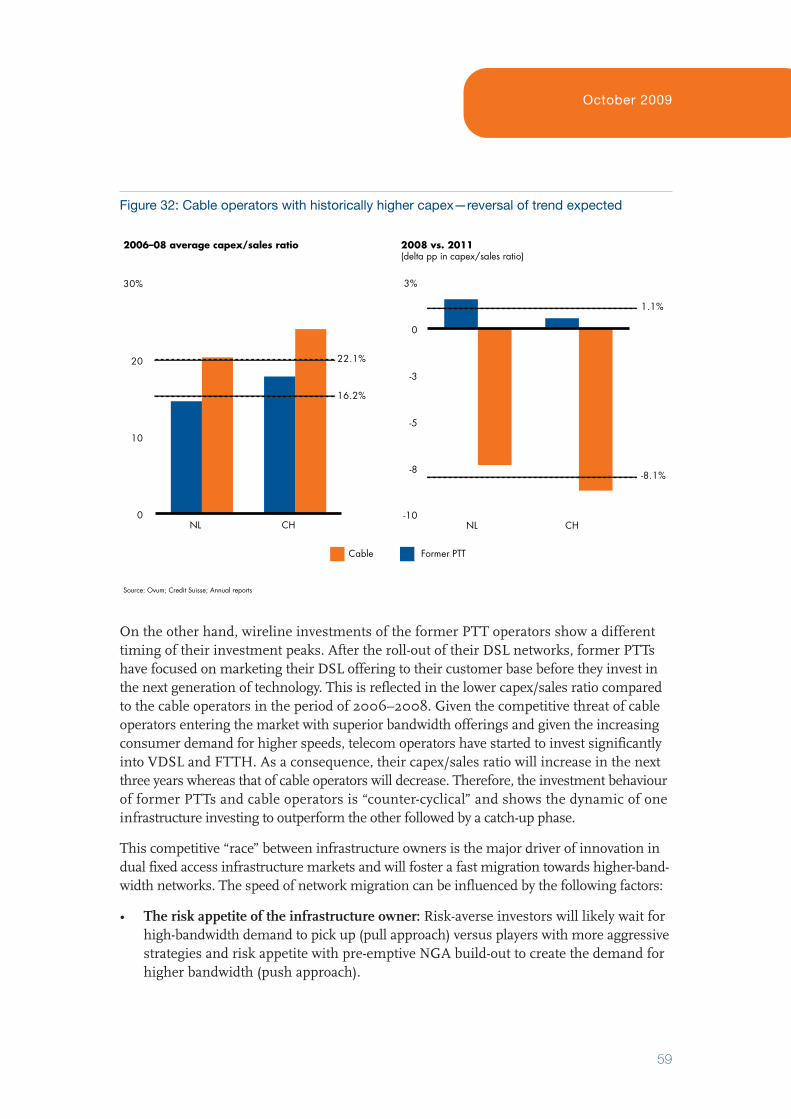
October 2009
59
On the other hand, wireline investments of the former PTT operators show a differenttiming of their investment peaks. After the roll-out of their DSL networks, former PTTshave focused on marketing their DSL offering to their customer base before they invest inthe next generation of technology. This is reflected in the lower capex/sales ratio comparedto the cable operators in the period of 2006–2008. Given the competitive threat of cableoperators entering the market with superior bandwidth offerings and given the increasingconsumer demand for higher speeds, telecom operators have started to invest significantlyinto VDSL and FTTH. As a consequence, their capex/sales ratio will increase in the nextthree years whereas that of cable operators will decrease. Therefore, the investment behaviourof former PTTs and cable operators is “counter-cyclical” and shows the dynamic of oneinfrastructure investing to outperform the other followed by a catch-up phase.
This competitive “race” between infrastructure owners is the major driver of innovation indual fixed access infrastructure markets and will foster a fast migration towards higher-band-width networks. The speed of network migration can be influenced by the following factors:
• The risk appetite of the infrastructure owner: Risk-averse investors will likely wait forhigh-bandwidth demand to pick up (pull approach) versus players with more aggressivestrategies and risk appetite with pre-emptive NGA build-out to create the demand forhigher bandwidth (push approach).
Figure 32: Cable operators with historically higher capex—reversal of trend expected
Source: Ovum; Credit Suisse; Annual reports
�10
�8
�5
�3
0
3%
1.1%
�8.1%
NL CH
2008 vs. 2011(delta pp in capex/sales ratio)
0
10
20
30%
16.2%
22.1%
NL CH
2006–08 average capex/sales ratio
Former PTTCable
Next Generation Competition
60
• The rate of demand increase and willingness to pay for high bandwidth: This is affectedby the pick up of high-bandwidth applications like IPTV and VoD which vary by country.
• Regulatory intervention: As the regulatory regime (e.g., access of service providers tohigh-capacity network infrastructure; level of interconnection charges for use of theinfrastructure) influences the attractiveness of the business case of infrastructure owners,regulatory intervention might increase or reduce the speed of the migration to higher-bandwidth networks. A study conducted by the European School of Management andTechnology in 2007 and recently refreshed for additional European markets43 concludedthat higher intensity of access regulation discourages infrastructure investments inparticular by cable operators and by challengers. Experience also shows that sometimes,uncertainty around the NGA regulatory regime might even delay investment decisionsby infrastructure owners, based on how they perceive the risk of recouping the network investment44.
• Subsidies to speed-up network build-out: Subsidies can provide additional incentivesto infrastructure owners for an early, pre-emptive migration to the next technologylevel of networks. For example, in Singapore, the government decided to invest S$1 billion as subsidy to speed up the roll-out of a single NGA network for Singapore.Clearly, subsidisation of this nature is assumed to be balanced among providers togenerate the desired effect.
• Technology development: Innovation and increasing scale can lead to a reduction inthe cost of network equipment and therefore lower the threshold for profitable invest-ments. However, this effect is limited as the equipment investments may only accountfor approximately 20 per cent45 of the total investment cost of upgrading to NGA (forexample, in FTTH).
Most of these factors are weighed to a different extent by different countries and thereforewill lead to different network migration speeds among dual infrastructure markets.
Coverage of future high-capacity networks
Given the significant investment of NGA build-out, a key question for all infrastructureowners is to what extent they should upgrade their network. As the investments are largelyincremental, an infrastructure owner could opt to migrate only parts of the network—for example, in urban areas—to higher bandwidth.
As discussed in Chapter 5, from a pure economic perspective, building out a NGA networkwith national coverage might not be feasible as some areas with low density will notgenerate enough revenues to justify the higher investments required in such areas.The threshold when network investments recover their costs depends on the expecteddemand and willingness to pay of consumers, the density of the area (lower-densitydrives higher costs) and the type of infrastructure/technology. Therefore, different
43ESMT Competition Analysis, Analysing the Relationship Between Regulation and Investment in the Telecom Sector, Friederiszick Grajek Röller November 28, 200744http://telephonyonline.com/residential_services/news/ftth-regulatory-challenges-0113/45While in the case of FTTH deployment, equipment costs account for about 20 per cent, in the case of DOCSIS 3.0 and FTTC upgrades, the percentage of equipment
costs is higher due to lower civil costs involved.
October 2009
61
degrees of high-capacity network build-out are likely depending on the country and typeof infrastructure owner:
• As explained in Chapters 4 and 5 cable benefits from lower investment requirementsfor upgrading to EuroDOCSIS 3.0 which can be less than 10 per cent on average ofthe initial cost of upgrading to an FTTH network, for example. Given the lower investment requirements, cable operators seem to have chosen to upgrade their exist-ing networks entirely to NGA. However, in areas with no existing cable infrastructureit would seem reasonable to believe that any new cable builds would be the exceptionrather than the rule, due to the very high costs of a greenfield approach.
• NGA investment requirements, both for VDSL and FTTH, are significantly higher for telecom operators and can reach levels beyond €1,400 per subscriber for FTTH inrural areas46. As shown in Chapter 5, recovering this investment must be predicatedon very significant ARPU increases, which can be challenging to justify. As a conse-quence, we see former PTTs with a national telecom infrastructure, investing first inthe urban areas and more selectively investing in rural areas where the economicsjustify the high investments. Several former PTTs have announced plans to buildFTTH networks in the largest cities while using FTTC/VDSL in smaller midsizecities. In Switzerland for instance, Swisscom has abandoned its VDSL plans in themore urban areas and instead plans to cover Zurich, Geneva, Basel, St. Gallen, Berne,Lausanne and the canton of Fribourg with FTTH by 2015, while VDSL is intended tobe rolled out in the more rural areas.
• The economic perspective of former PTTs too will be influenced by competitor actions.For example, it’s not hard to imagine that if cable operators were to enter rural areaswith high-capacity broadband offerings, it might lead to a build-out of VDSL andFTTH by the PTT to secure the revenues streams from the existing customer base in rural areas.
Therefore, the risk of white spots in broadband or NGA coverage is generally higher indual fixed access infrastructure countries in the following circumstances:
• Where the existing cable infrastructure does not have national coverage;
• Where population density is low;
• Where the willingness of consumers to pay for higher-bandwidth is low.
A key question for policy-makers is how can the gap in high-capacity broadband networkcoverage be bridged and what potential scenarios exist. These scenarios are driven bycompetitive dynamics, technology development and governmental intervention:
• LTE Wireless: White spots where the economics are unattractive for wireline infra-structure owners to invest in high-capacity networks could be covered by wirelesstechnology, which requires relatively less investment in low density areas. Mobile
46See Chapter 4, Figure 17
Next Generation Competition
62
operators as well as satellite operators like Astra have already positioned themselvesin the current broadband policy discussion as a potential solution to bridging the digitaldivide. Industry analysts believe mobile technology will be able to provide speeds ofup to 20 Mbit/s with the migration to LTE, addressing a significant part of future consumer demand. With further technology breakthroughs, the bandwidth of mobiletechnology could further improve—however, many experts believe that given the technological limitations of wireless technology it is not likely to reach the upperbandwidth speeds that cable’s EuroDOCSIS 3.0 and FTTH can provide.
• Governmental subsidies: Governments always have the option to use subsidies as atool for driving the market. Some European governments might decide, for social-economic reasons, for example, to subsidise the build-out of high-capacity broadbandnetworks in economically unattractive areas to ensure full national coverage.
• Auctioning of exclusive rights to build alternative mechanisms contemplated includereverse auctions for exclusive licences in particular areas: Two players have to bidagainst each other to win the exclusive rights to build in the area.
• Direct consumer cross-subsidies: In the UK, a proposed solution to the funding problemis to have consumers, in addition to the government, subsidise NGA network build-out.The proposal is to levy a 50 pence tax on all fixed telephone lines to go towards a NextGeneration Fund in order to deliver next generation broadband coverage to 90 percent of the UK population by 201747. The fund is expected to yield £150–175 millionper year, which will be used as an investment to connect the final third of the populationthat still does not have broadband access. This additional investment is an attempt tohelp operators make the connection to the last third of the population as economicallyviable as connecting to the first two-thirds of the population.
To summarise our conclusions, the likelihood of full national fixed high-bandwidth coverage is high for dual fixed access infrastructure markets, which today have two fixedinfrastructures with national coverage. White spots can be addressed by either mobiletechnology with bandwidth of up to 20 Mbit/s based on LTE or by other proactive actionsthat encourage higher-speed network access in low density areas.
Likelihood of additional fixed broadband infrastructures
Competing broadband infrastructures need to share the same future revenue pool withinthe regional market they are serving. In the early market development phase this revenuepool can be larger due to the stronger marketing and sales power of more market participantsleading to faster penetration of high-speed Internet services and applications; this effectcan also be achieved by the introduction of service competition and does not require thebuild-up of several high-capacity broadband infrastructures in parallel. In the long run,the number of available infrastructures does not fundamentally change the market potential,and as demonstrated in Chapter 5, multiple infrastructures are economically viable only inthe denser parts of the market.
47 http://www.culture.gov.uk/images/publications/digitalbritain-finalreport-jun09.pdf
October 2009
63
Sharing the revenue pool among more than two fixed infrastructure owners makes itmore difficult to justify the high investments required for the network build-out. Therefore,the business case for each of the infrastructure owners becomes challenging when morethan two broadband infrastructures compete with one another. Given the uncertainty ofdemand for high-bandwidth and of consumers’ willingness to pay for higher speeds,there is a low likelihood that investors will take this high investment risk.
This conclusion is supported by the evolution of infrastructure competition in the telecommarket since liberalisation. Across Europe there is no evidence for the build-up of morethan one competing residential access fixed-line infrastructure in addition to the one ofthe former PTT in the consumer market, except for market niches primarily in the businesscustomer segment (for example, fibre-ring networks in large metropolitan areas to serve largebusiness customers).
Therefore, the likelihood of three or more competing fixed broadband infrastructures isvery low in the consumer market. Despite this conclusion, in some countries we canobserve the emergence of new, very selective broadband infrastructure owners in addition to (but not neccessarily in direct competition with) the former PTT and cable operator:
• Existing wireline service competitors or wireless might decide to invest into wirelineinfrastructure and build own high-capacity broadband networks. For example, in Germany Vodafone and some other players are considering plans to build local fibrenetwork in selected cities—however, in cooperation with Deutsche Telekom to avoidthe build-up of redundant access infrastructures in the same region. Therefore, theywould build the fibre network in areas where Deutsche Telekom does not have fibreand each infrastructure owner then sells access to its infrastructure to the competitorto allow for service competition48. This type of cooperation of NGA build-out is lesslikely to create competing networks, and instead lead to complementary ones.
• In a few countries like Switzerland we observe the market entry of utilities rolling out local fibre networks with the objective of building a wholesale business. Theseutilities sometimes do not want to enter the retail (consumer) business given the lackof scale and capabilities and instead plan to offer their network capacity to serviceproviders that want to serve the connected households. The economic viability of theirbusiness case remains to be seen if there are already two existing infrastructures inthe same area—the former PTT’s and the cable operator’s—and both infrastructuresare migrating to NGA. Many local utilities have opted to cooperate with the formerPTT to avoid infrastructure competition, which leads to unattractive economics.
• While the likelihood of market entry of new fibre operators might seem low given thevery high cost of new greenfield build-outs, in a few European markets this phenomenacan be observed. Such a new market entrant typically focuses on regional marketswhere there is only one existing fixed infrastructure and does not compete on a nationalscale in dual fixed infrastructure markets. The long-term sustainability of these players
48http://www.ftd.de/it-medien/it-telekommunikation/:kartellverfahren-gegen-deutsche-telekom-vodafone-und-ewetel/50004701.html
Next Generation Competition
64
is yet to be proven and there is a significant likelihood that these players get acquiredby one of the existing infrastructure owners. A first evidence of this potential develop-ment can be observed in the Netherlands where Reggefiber has entered the market asa new fibre operator building FTTH networks in selected cities and communities.Since May 2008 Reggefiber has teamed up with KPN to create a joint venture andjointly build fibre networks in the Netherlands.
Therefore, it is fair to assume that there is low likelihood of more than two profitablecompeting high-capacity fixed access broadband infrastructures that cover a substantialpart of the market in dual fixed access infrastructure markets—and profitability remains a challenge beyond two players. While infrastructure providers do emerge at a regionallevel, they have a limited reach and none has national scale or size. Moreover, additionalinfrastructure owners tend to be complementary players in the market, cooperating withan existing infrastructure owner rather than a full competitor to both the former PTTand the cable operator in that market.
Potential role of wireless technology
Given the competition between the fixed infrastructures in the dual infrastructure marketsthe question arises whether the role of wireless will be reduced to a complementary oneby providing bandwidth for use on the move or if wireless can also substitute for stationaryuse and therefore compete with the fixed infrastructures. The market drivers whichdetermine the answer to this question are the same as in single fixed access infrastructuremarkets, although the outcomes can be different.
Fixed infrastructures compete with each other—among other factors—on price-per-band-width and push their higher-bandwidth offerings into the market. This, in turn, tends to accelerate the demand for these offerings. The more rapidly the bandwidth demand in amarket grows, the more challenging it is for wireless to compete with fixed infrastructure.However, wireless does play a particularly important role in certain niches of the dualfixed access infrastructure markets:
• For single-person households who do not have high-bandwidth demand, wireless can be a substitute, especially if priced at the same or even lower level than wirelineofferings. However, as bandwidth demand of these households grows over time,some single-person households might also opt for the higher-bandwidth offeringsof the fixed infrastructure players.
• For those rural areas where migration to high-capacity broadband fixed networks isnot economically viable, wireless can fill the gap to avoid a digital divide—althoughthese areas may not be able to get the same maximum bandwidth speeds as thoseareas which will be covered by fixed networks.
The role of wireless as a complement to fixed broadband infrastructures for use of higher-bandwidth services on the move will be very relevant and offer consumers a uniquemobility proposition. In particular with the migration to 4G, consumers will be able touse bandwidth of up to 20 Mbit/s for mobile use.
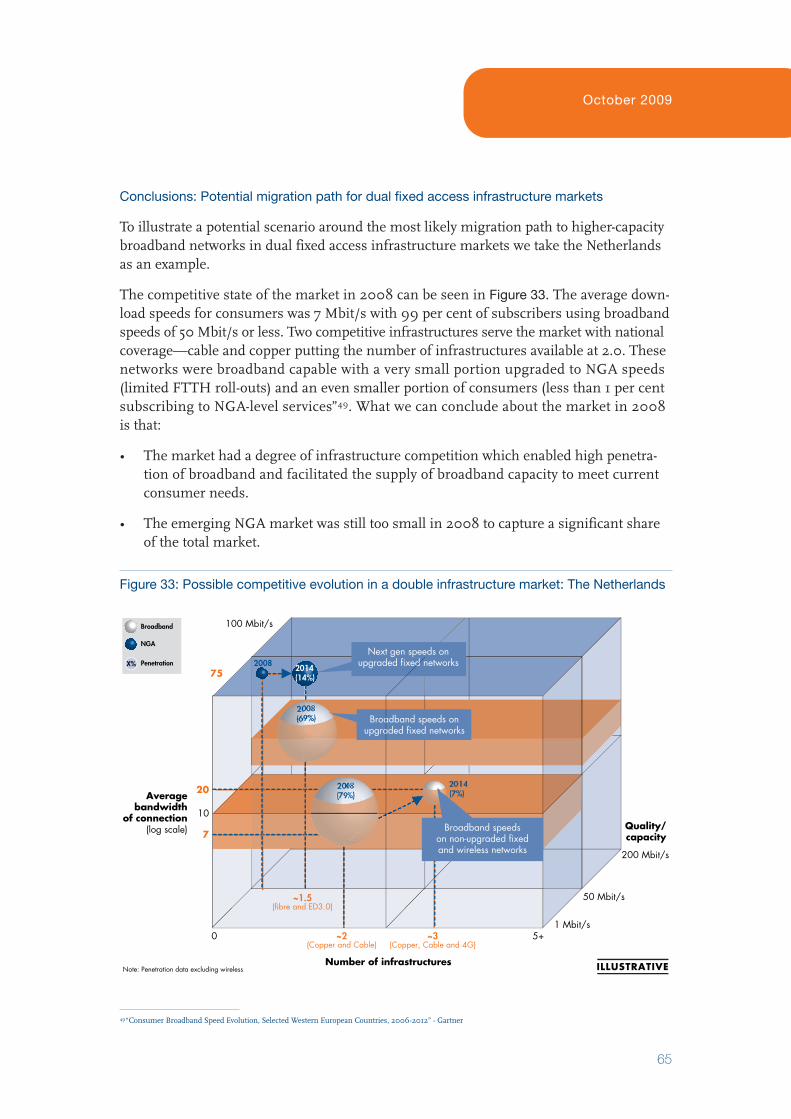
October 2009
65
Conclusions: Potential migration path for dual fixed access infrastructure markets
To illustrate a potential scenario around the most likely migration path to higher-capacitybroadband networks in dual fixed access infrastructure markets we take the Netherlandsas an example.
The competitive state of the market in 2008 can be seen in Figure 33. The average down-load speeds for consumers was 7 Mbit/s with 99 per cent of subscribers using broadbandspeeds of 50 Mbit/s or less. Two competitive infrastructures serve the market with nationalcoverage—cable and copper putting the number of infrastructures available at 2.0. Thesenetworks were broadband capable with a very small portion upgraded to NGA speeds(limited FTTH roll-outs) and an even smaller portion of consumers (less than 1 per centsubscribing to NGA-level services”49. What we can conclude about the market in 2008 is that:
• The market had a degree of infrastructure competition which enabled high penetra-tion of broadband and facilitated the supply of broadband capacity to meet currentconsumer needs.
• The emerging NGA market was still too small in 2008 to capture a significant shareof the total market.
Figure 33: Possible competitive evolution in a double infrastructure market: The Netherlands
0 5+
10
100 Mbit/s
1 Mbit/s
50 Mbit/s
200 Mbit/s
7
20
75
7Averagebandwidth
of connection(log scale)
~2(Copper and Cable)
~1.5(fibre and ED3.0)
~3(Copper, Cable and 4G)
(7%)
2008 2014(14%)
Next gen speeds onupgraded fixed networks
Broadband
NGA
PenetrationX%
Note: Penetration data excluding wirelessNumber of infrastructures
~1.5(fibre and ED3.0)
(7%)
2008(69%) Broadband speeds on
upgraded fixed networks
ILLUSTRATIVE
Quality/capacity
Broadband speedson non�upgraded fixedand wireless networks
49“Consumer Broadband Speed Evolution, Selected Western European Countries, 2006-2012” - Gartner
Next Generation Competition
66
In 2014, the market and competitive landscape could become more complex. One potentialscenario may have the following characteristics:
• By 2014 the expectation is that wireless LTE may have been rolled out partially in theDutch market by at least two of the three mobile operators (KPN, T-Mobile and Vodafone)with possible roll-out levels of 40–60 per cent,50 which would “add” one more networkthat can serve the broadband market. This would result in an increase in the degree of infrastructure competition (as represented on the horizontal access in Figure 33).
• According to external available estimates, it is expected that fixed networks will havesubstantially upgraded to NGA technology with cable 100 per cent upgraded and KPNaround 30 per cent upgraded51. In our methodology, this would mean that fixed NGAnetwork availability is at least 1.3, with a small part of the market having only broadbandcapacity coverage. This implies that the “supply” of NGA level networks is there—i.e., the market is ready for consumers to pick up those services.
• Consumer service demand could be on average 29 Mbit/s according to Gartner forecastsand extrapolations of those forecasts. At this time, 15 per cent of the market wouldsubscribe to NGA-level speeds while 85 per cent would still have only broadbandsubscriptions52. However, the vast majority of those consumers would be covered byNGA capacity networks. The consumer service uptake situation leads to a number ofinteresting observations. First, although NGA network “supply” is there, consumer“demand” for these high-speed offerings is still emerging. Second, the broadbandmarket still represents the majority of the market and is now served by wireless,broadband-level fixed and NGA upgraded fixed networks.
In this scenario for the Netherlands, the competition among wireline, coupled with theemergence of a supplementary wireless infrastructure, may lead to an effective build-outof high-bandwidth infrastructures. These may be underutilised for the next few years butwill be ready to meet the longer-term consumer needs for high-bandwidths.
2. Potential evolution of single fixed access infrastructure markets
For single fixed access infrastructure regions—which can include either an entire country(Greece) or a region within a country (Austria, Sweden, Norway, Denmark)—with onlyone existing fixed telecommunications infrastructure, three key questions come into focuswhen analysing the transition to higher-capacity broadband networks:
• How fast will the existing fixed access infrastructure be upgraded to higher capacitiesand what drives the speed of build-out?
• Is there the likelihood for more than one fixed broadband infrastructure and in whichcases could this become a reality?
50 No concrete roll-out plans exist yet, but we assume that roll-out of LTE starts in 2012 and given the size of the country, 80% penetration is reached in four years with
two of the three wireless networks investing in upgrades.51 Cullen International52“Consumer Broadband Speed Evolution, Selected Western European Countries, 2006-2012” – Gartner
October 2009
67
• What role can wireless play in single fixed access infrastructure regions with regard tomoving towards next generation competition and higher-capacity network build-out?
The answers to these questions will determine to what extent and how fast migration tohigher-bandwidth networks will happen in the future.
Upgrading the existing fixed infrastructure
Starting with the first question, the existing fixed access infrastructure in many countriesis the copper/fibre network of the former PTT. In most cases, this is likely to be the high-capacity infrastructure in the future, as upgrading an existing network (“brownfield” approach)is significantly cheaper than building a new fixed access infrastructure from scratch(“greenfield” approach). There have been limited greenfield regional roll-outs but theyhave not gone to a national scale. (A brownfield operator can use its existing backbonenetwork and some of its ducts to reduce build-out costs.)
Due to the lack of infrastructure competition, the existing infrastructure owner only hasan incentive to invest into innovation of the network if there is a compelling businesscase which justifies the high network investments. The attractiveness of this businesscase depends on several key drivers, among those are:
• Level of increased revenues from high-speed Internet and applications (for example,VoD, IPTV): As the take-up rates will vary by country, the attractiveness of the businesscase will differ by country.
• Regulatory regime: The open access regime and the level of interconnection chargesinfluence the economics of the business case for the infrastructure owner.
• State of existing network infrastructure: The typology of the network operations drivesthe savings in operating expenses a network operator can achieve when moving toFTTH/C. These savings differ strongly between operators.
Uncertainty around these drivers (in particular, around the demand for high-speed Internet and applications and consumers’ willingness to pay for it, and the regulatoryregime), might delay investment decisions by infrastructure owners. This phenomenoncan be observed today where some telecom operators are currently evaluating their net-work investment decisions.
Regulators are focusing on areas where the existing infrastructure owner has no incentiveto upgrade infrastructure in low population density areas. To ensure broadband networkbuild-out in such areas, the EC has released guidelines on the applicability of state aidand has earmarked €1B to help rural areas get online53:
• In “white” areas—characterised by the current absence of broadband infrastructureand the unlikelihood of near-term development—the EC strongly favours financialgovernmental aid as only means to guarantee ubiquitous coverage.
53European Commission Community Guidelines for the application of State aid rules in relation to rapid deployment of broadband networks
Next Generation Competition
68
• In areas where a single broadband infrastructure exists—so-called “grey” areas—theEuropean Commission takes a more cautious stance calling for a detailed assessmentof each case. Here governmental aid may be suitable if the existing network is notable to deliver services to a certain degree of quality and or not at a price comparableto its peer countries.
• “Black” areas are identified by the EC as areas where more than one network exist or de-ployment is in process, these areas are considered to be unsuitable for state intervention.
Some markets outside Europe have followed various routes to deal with governmentintervention. For example, in Singapore, the government decided to invest S$1 billion as a subsidy to speed up the roll-out of a single NGA network for Singapore. This funding wassplit between an Operating Company (OpCo), to be allocated S$250 million, and a NetworkCompany (NetCo,) which received S$750 million. A SingTel-led consortium (SingTel beingthe former PTT), won the tender to become the NetCo, whereas the cable operator StarHubwon the tender to become the OpCo. Retail companies were allowed to use this NGAnetwork at a price set by the regulator. As both major infrastructure owners, the telecomand the cable operator, are involved in building and operating the new NGA network, theyhave a strong incentive to use the NGA network instead of their own not-upgraded infra-structure to deliver high-bandwidth services to the consumers. It is still too early to assessthe success of this new model given the the NGA migration is still ongoing, however, it hasled to an accelerated NGA roll-out.
Australia is currently exploring alternative approaches with regulatory intervention to accelerate the migration to NGA networks. Among those options currently debated arethe build-up of a greenfield NGA funded by the government (and separate from the former PTT Telstra), functional separation of Telstra into a network company and a retailarm, and the sell-off of its cable infrastructure.
Likelihood of more than one fixed broadband infrastructure
Given the very high investments required to build a second greenfield fixed access infra-structure, the likelihood for more than one fixed broadband network is lower for single fixed access infrastructure regions—but cannot be ruled out. Depending on the competitive dynamics,more than one fixed broadband infrastructure might be feasible under certain conditions:
• The former PTT might choose to lay several fibres to the households and offer the additional fibres to competitors. This approach has been chosen by Swisscom (seeChapter 5) by laying four fibres to the households in large cities. However, this is lesslikely to happen in rural areas.
• New fibre operators might enter the market and compete with the former PTT. Anexample mentioned in Chapter 3 is small start-ups created by local utilities in Germany(NetCologne, M-Net) that are building out their fibre networks. Utilities in marketslike Switzerland have also entered the telecommunications market by building localfibre networks. These operators are often focused on regional markets which couldhave high population density but a small footprint (for example, Paris) and are notcompeting with a full national broadband network.
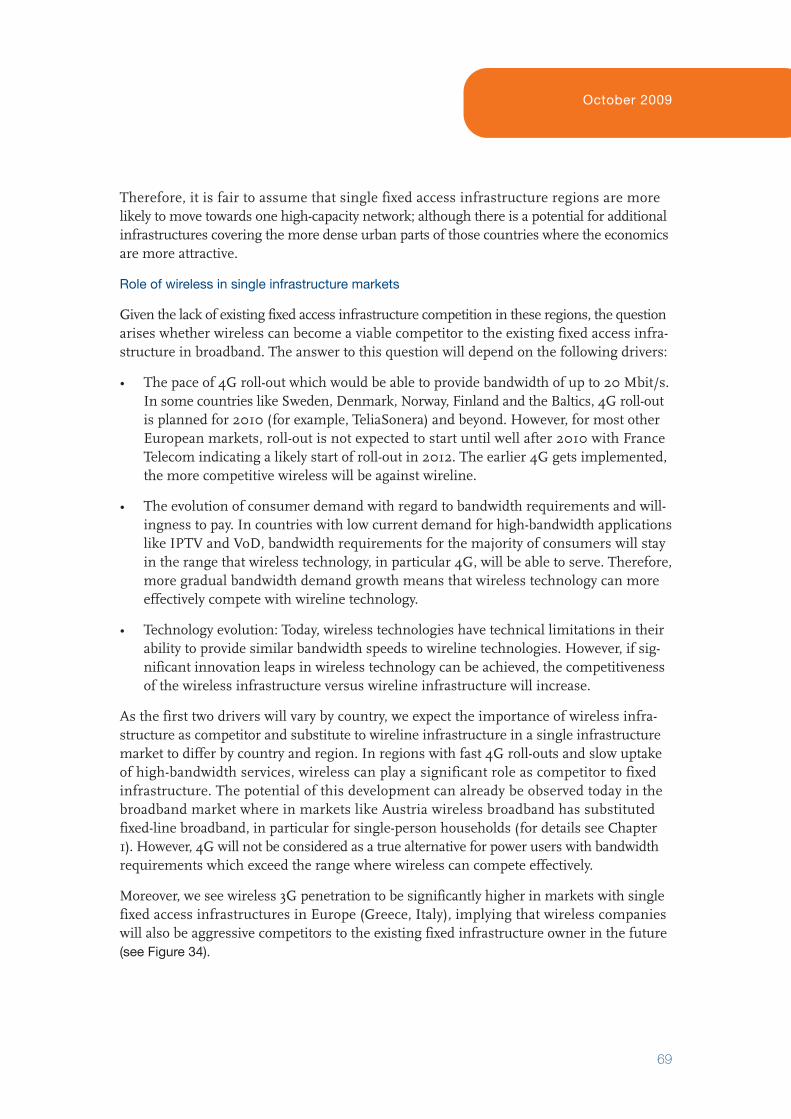
October 2009
69
Therefore, it is fair to assume that single fixed access infrastructure regions are morelikely to move towards one high-capacity network; although there is a potential for additionalinfrastructures covering the more dense urban parts of those countries where the economicsare more attractive.
Role of wireless in single infrastructure markets
Given the lack of existing fixed access infrastructure competition in these regions, the questionarises whether wireless can become a viable competitor to the existing fixed access infra-structure in broadband. The answer to this question will depend on the following drivers:
• The pace of 4G roll-out which would be able to provide bandwidth of up to 20 Mbit/s.In some countries like Sweden, Denmark, Norway, Finland and the Baltics, 4G roll-outis planned for 2010 (for example, TeliaSonera) and beyond. However, for most otherEuropean markets, roll-out is not expected to start until well after 2010 with FranceTelecom indicating a likely start of roll-out in 2012. The earlier 4G gets implemented,the more competitive wireless will be against wireline.
• The evolution of consumer demand with regard to bandwidth requirements and will-ingness to pay. In countries with low current demand for high-bandwidth applicationslike IPTV and VoD, bandwidth requirements for the majority of consumers will stayin the range that wireless technology, in particular 4G, will be able to serve. Therefore,more gradual bandwidth demand growth means that wireless technology can moreeffectively compete with wireline technology.
• Technology evolution: Today, wireless technologies have technical limitations in theirability to provide similar bandwidth speeds to wireline technologies. However, if sig-nificant innovation leaps in wireless technology can be achieved, the competitivenessof the wireless infrastructure versus wireline infrastructure will increase.
As the first two drivers will vary by country, we expect the importance of wireless infra-structure as competitor and substitute to wireline infrastructure in a single infrastructuremarket to differ by country and region. In regions with fast 4G roll-outs and slow uptakeof high-bandwidth services, wireless can play a significant role as competitor to fixed infrastructure. The potential of this development can already be observed today in thebroadband market where in markets like Austria wireless broadband has substitutedfixed-line broadband, in particular for single-person households (for details see Chapter1). However, 4G will not be considered as a true alternative for power users with bandwidthrequirements which exceed the range where wireless can compete effectively.
Moreover, we see wireless 3G penetration to be significantly higher in markets with singlefixed access infrastructures in Europe (Greece, Italy), implying that wireless companieswill also be aggressive competitors to the existing fixed infrastructure owner in the future(see Figure 34).
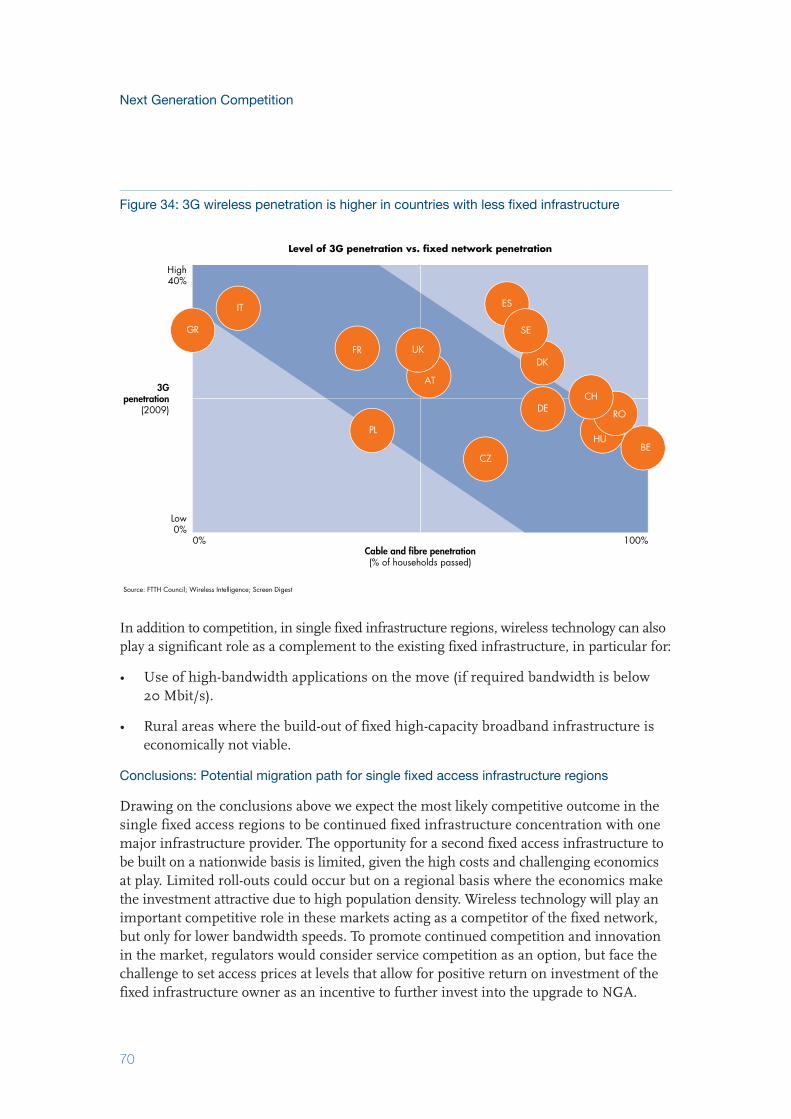
Next Generation Competition
70
In addition to competition, in single fixed infrastructure regions, wireless technology can alsoplay a significant role as a complement to the existing fixed infrastructure, in particular for:
• Use of high-bandwidth applications on the move (if required bandwidth is below 20 Mbit/s).
• Rural areas where the build-out of fixed high-capacity broadband infrastructure is economically not viable.
Conclusions: Potential migration path for single fixed access infrastructure regions
Drawing on the conclusions above we expect the most likely competitive outcome in thesingle fixed access regions to be continued fixed infrastructure concentration with onemajor infrastructure provider. The opportunity for a second fixed access infrastructure tobe built on a nationwide basis is limited, given the high costs and challenging economicsat play. Limited roll-outs could occur but on a regional basis where the economics makethe investment attractive due to high population density. Wireless technology will play animportant competitive role in these markets acting as a competitor of the fixed network,but only for lower bandwidth speeds. To promote continued competition and innovationin the market, regulators would consider service competition as an option, but face thechallenge to set access prices at levels that allow for positive return on investment of thefixed infrastructure owner as an incentive to further invest into the upgrade to NGA.
Figure 34: 3G wireless penetration is higher in countries with less fixed infrastructure
3Gpenetration
(2009)
Cable and fibre penetration(% of households passed)
Level of 3G penetration vs. fixed network penetration
High40%
Low0%
100%0%
Source: FTTH Council; Wireless Intelligence; Screen Digest
DE
GR
IT
FR
AT
BE
DK
ES
HUPL
RO
CZ
SE
CH
UK
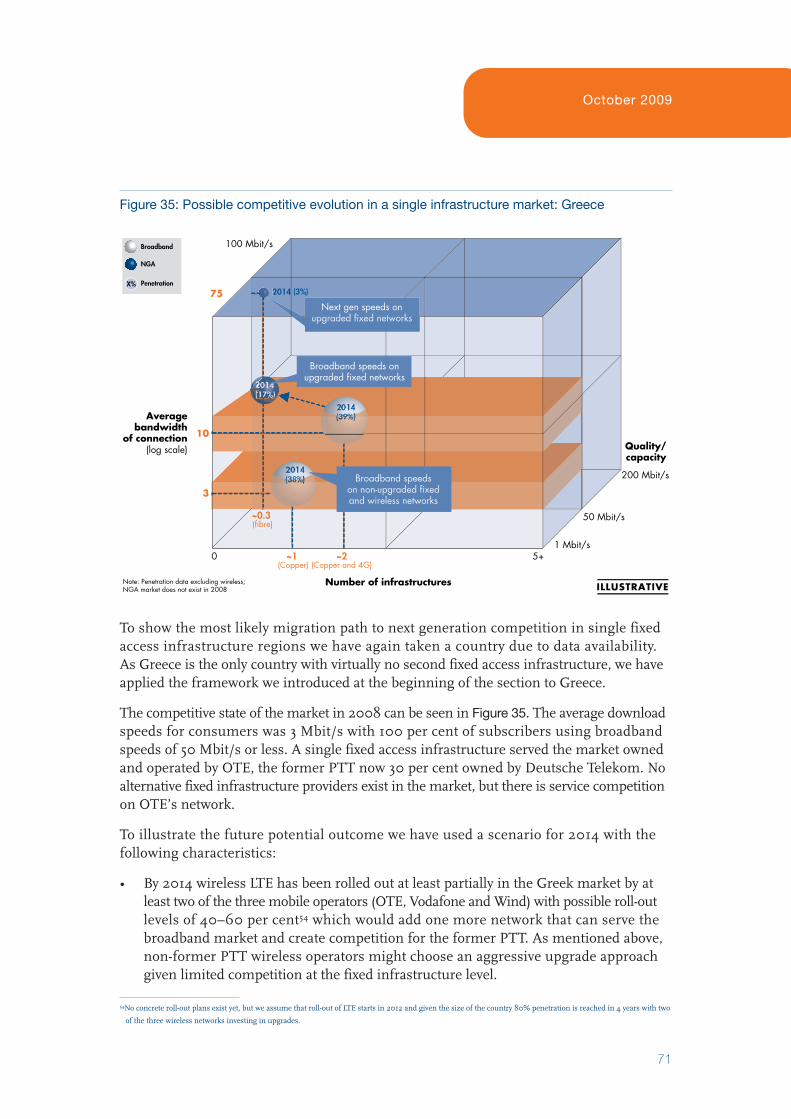
October 2009
71
To show the most likely migration path to next generation competition in single fixedaccess infrastructure regions we have again taken a country due to data availability.As Greece is the only country with virtually no second fixed access infrastructure, we haveapplied the framework we introduced at the beginning of the section to Greece.
The competitive state of the market in 2008 can be seen in Figure 35. The average downloadspeeds for consumers was 3 Mbit/s with 100 per cent of subscribers using broadbandspeeds of 50 Mbit/s or less. A single fixed access infrastructure served the market ownedand operated by OTE, the former PTT now 30 per cent owned by Deutsche Telekom. Noalternative fixed infrastructure providers exist in the market, but there is service competitionon OTE’s network.
To illustrate the future potential outcome we have used a scenario for 2014 with the following characteristics:
• By 2014 wireless LTE has been rolled out at least partially in the Greek market by atleast two of the three mobile operators (OTE, Vodafone and Wind) with possible roll-outlevels of 40–60 per cent54 which would add one more network that can serve thebroadband market and create competition for the former PTT. As mentioned above,non-former PTT wireless operators might choose an aggressive upgrade approachgiven limited competition at the fixed infrastructure level.
Figure 35: Possible competitive evolution in a single infrastructure market: Greece
100 Mbit/s
50 Mbit/s
200 Mbit/s
Averagebandwidth
of connection(log scale)
Broadband
NGA
PenetrationX%
0 5+
10
1 Mbit/s
3
75
~2(Copper and 4G)
~1(Copper)
~0.3(fibre)
2014 (3%)
2(17%)
2014 (3%)
Note: Penetration data excluding wireless;NGA market does not exist in 2008
Next gen speeds onupgraded fixed networks
Broadband speedson non�upgraded fixedand wireless networks
Number of infrastructures
~0.3(fibre)
222222222222217%)7717%)7(17%)7(17%)(17%)(17(1(1(1
upgraded fixed networks
Broadband speedson non�upgraded fixedand wireless networks
upgraded fixed networks
Broadband speeds onupgraded fixed networks
ILLUSTRATIVE
Quality/capacity
54No concrete roll-out plans exist yet, but we assume that roll-out of LTE starts in 2012 and given the size of the country 80% penetration is reached in 4 years with two
of the three wireless networks investing in upgrades.
Next Generation Competition
72
• Given limited infrastructure competition, in September 2008 the Greek Ministry ofTransport and Communications announced a national FTTx strategy aiming to con-nect 2 million households (50 per cent of total) by 2017 with deployment starting in200955. The proposed plan was to invest in a single passive infrastructure with threeinvestors awarded contracts. The network would be then open to service providers(communications providers) that would provide retail services to end users. Theestimated cost of the project is €2.1 billion with €700 million contributed by thegovernment over seven years. Due to the bureaucratic challenges of this plan OTErecently announced plans to start upgrading its network to VDSL to speed up thedelivery of high-speed services to consumers.
• Given challenges with supply of NGA-capacity networks, average uptake speeds areforecasted to be 13 Mbit/s in 2014 based on extrapolated Gartner forecasts. About 3per cent of the market would subscribe to NGA-level speeds while 97 per cent willstill have only broadband subscriptions56. Wireless could play an important role inbroadband, both in increasing supply of services and also in bridging the digital divide.
In summary, it is less likely that the Greek market will achieve self-sustaining momentum towards penetration levels on par with dual fixed access infrastructure markets like theones at the opposite end of the spectrum (for example, the Netherlands). Regulatory inter-vention, subsidisation and open access to the former PTT’s network are more likely toend up being the tools used to achieve coverage with at least one network.
3. Implications for countries with single and dual fixed access regions
Very few European countries have just a single national fixed access infrastructure (Greece) ordual national fixed access infrastructures (the Netherlands, Belgium, Switzerland)57 coveringthe entire country. Most European countries fall in between these two extremes. Theyhave some degree of dual fixed access infrastructure, ranging from 10 per cent coveragein Italy to 77 per cent in Germany. Such countries therefore show the characteristics ofboth single and dual fixed access infrastructure regions.
For these countries one possible path for the evolution of their telecommunications market might be as follows:
• Within the same country, the regions with dual fixed access infrastructure have ahigher likelihood for migration to higher-bandwidth networks than those regions with a single fixed infrastructure. These dual fixed access infrastructure regions benefit from the competitive dynamic between the infrastructure owners where oneplayer might choose to upgrade the network to create a first-mover advantage and acquire more customers.
55http://www.telegeography.com/cu/article.php?article_id=2490256 “Consumer Broadband Speed Evolution, Selected Western European Countries, 2006-2012” – Gartner57 Chapter 3, Figure 12
October 2009
73
• The single fixed access infrastructure regions in these countries might also still experience the migration to higher-bandwidth networks. In such regions, consumerwillingness to pay for higher speeds can be high enough to justify the required investment or the infrastructure owner (for example, the former PTT or cable operator)might opt to offer the same service level in its entire franchise, independent of thedifference in the economics between regions. An example is Swisscom, which intro-duced its IPTV offering on a national scale despite very challenging economics inSwitzerland’s less densely populated areas. Similarly, cable operators these days seem toupgrade their entire networks to DOCSIS 3.0 instead of “cherry picking” regions.
• Given the different dynamics in dual and single fixed access regions in these countries,the migration to higher-bandwidth networks could happen in dual fixed infrastructureregions earlier than in single fixed access infrastructure regions. Infrastructure ownersmay often be more likely to invest first in those areas where they are facing thestrongest competitive threat.
• The higher the share of households with dual fixed access infrastructures in a country,the more widely will high-bandwidth networks become available, driven by thecompetitive dynamic between infrastructure owners.
• The market entry of new fibre operators is more likely to happen in the single fixedaccess infrastructure regions of these countries as the business economics of a newoperator is more challenging if the available revenue pool needs to be shared betweenthree instead of two market players. However, the business economics are also influencedby the density and attractiveness of an area, so market entry of new fibre operators canalso happen in very attractive (high density, high willingness to pay for high-speeds)dual fixed access infrastructure regions.
• The risk of digital divide in single or dual fixed access infrastructure regions in thesecountries can be reduced by the roll-out of next generation wireless technologies andthe evolution of these technologies.
Therefore, countries with both regions—single and dual fixed access infrastructure—willexperience migration to higher-bandwidth networks; however, the degree of migrationwill vary significantly between countries. It will depend on, for example, the extent ofdual fixed access infrastructure regions and the availability of local-loop infrastructures.Where this migration does not happen, policy-makers are expected to consider alternativeapproaches to foster the migration to NGA networks. In these markets, the open issuestill remains of how to then create a self-sustaining momentum that will generate thenext wave of innovation.

Next Generation Competition
74

Bain & Company has been commissioned to undertake an objective analysis of the key trends in Europe’sdigital broadband infrastructure. The results of this study may hold insights for many of the key playersin this evolving industry as they try to plan for developments over the next five years, anticipate therole of regulatory authorities and structure their investments accordingly.
For additional information, please visit www.Bain.com or contact Cheryl Krauss at [email protected].