new york state ffy 2015 highway safety …safeny.ny.gov/annualrpt/2015gtscannualreport.pdfnew york...
TRANSCRIPT
New York State
FFY 2015 HIGHWAY SAFETY
ANNUAL REPORT
New York State Governor’s Traffic Safety Committee
Andrew M. Cuomo, Governor
Charles R. DeWeese, Assistant Commissioner
NYS Department of Motor Vehicles Governor’s Traffic Safety Committee
December 2015

NEW YORK STATE FFY 2015
HIGHWAY SAFETY ANNUAL REPORT
TABLE OF CONTENTS
Page
FFY 2015 NYS Highway Safety Program ................................................................................1
FFY 2015 Performance Report ..............................................................................................5
Statewide Performance Measures .......................................................................................7
Impaired Driving ..................................................................................................................9
Police Traffic Services ........................................................................................................ 25
Motorcycle Safety ............................................................................................................. 47
Pedestrian, Bicycle, and Wheel-Sport Safety ...................................................................... 53
Occupant Protection .......................................................................................................... 67
Community Traffic Safety Programs ................................................................................... 83
Traffic Records .................................................................................................................. 93
Program Management ..................................................................................................... 101

2015 Highway Safety Annual Report Statewide Highway Safety Program - 1
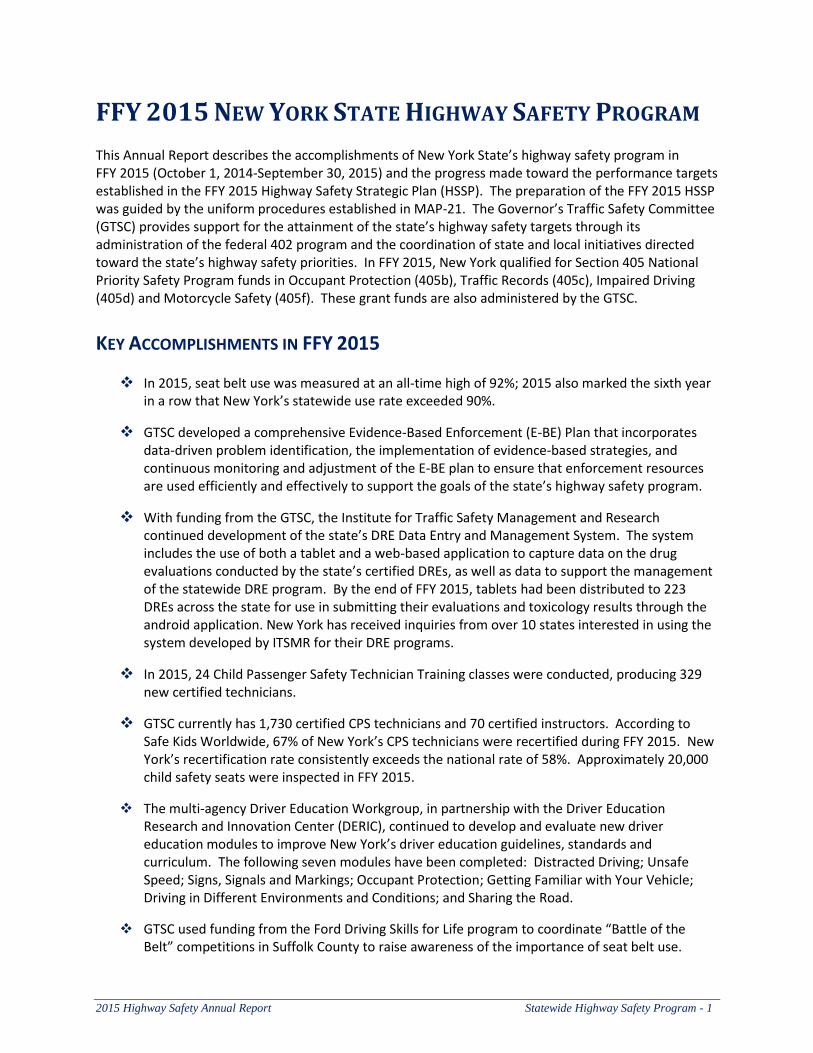
FFY 2015 NEW YORK STATE HIGHWAY SAFETY PROGRAM This Annual Report describes the accomplishments of New York State’s highway safety program in FFY 2015 (October 1, 2014-September 30, 2015) and the progress made toward the performance targets established in the FFY 2015 Highway Safety Strategic Plan (HSSP). The preparation of the FFY 2015 HSSP was guided by the uniform procedures established in MAP-21. The Governor’s Traffic Safety Committee (GTSC) provides support for the attainment of the state’s highway safety targets through its administration of the federal 402 program and the coordination of state and local initiatives directed toward the state’s highway safety priorities. In FFY 2015, New York qualified for Section 405 National Priority Safety Program funds in Occupant Protection (405b), Traffic Records (405c), Impaired Driving (405d) and Motorcycle Safety (405f). These grant funds are also administered by the GTSC.
KEY ACCOMPLISHMENTS IN FFY 2015
In 2015, seat belt use was measured at an all-time high of 92%; 2015 also marked the sixth year in a row that New York’s statewide use rate exceeded 90%.
GTSC developed a comprehensive Evidence-Based Enforcement (E-BE) Plan that incorporates data-driven problem identification, the implementation of evidence-based strategies, and continuous monitoring and adjustment of the E-BE plan to ensure that enforcement resources are used efficiently and effectively to support the goals of the state’s highway safety program.
With funding from the GTSC, the Institute for Traffic Safety Management and Research continued development of the state’s DRE Data Entry and Management System. The system includes the use of both a tablet and a web-based application to capture data on the drug evaluations conducted by the state’s certified DREs, as well as data to support the management of the statewide DRE program. By the end of FFY 2015, tablets had been distributed to 223 DREs across the state for use in submitting their evaluations and toxicology results through the android application. New York has received inquiries from over 10 states interested in using the system developed by ITSMR for their DRE programs.
In 2015, 24 Child Passenger Safety Technician Training classes were conducted, producing 329 new certified technicians.
GTSC currently has 1,730 certified CPS technicians and 70 certified instructors. According to Safe Kids Worldwide, 67% of New York’s CPS technicians were recertified during FFY 2015. New York’s recertification rate consistently exceeds the national rate of 58%. Approximately 20,000 child safety seats were inspected in FFY 2015.
The multi-agency Driver Education Workgroup, in partnership with the Driver Education Research and Innovation Center (DERIC), continued to develop and evaluate new driver education modules to improve New York’s driver education guidelines, standards and curriculum. The following seven modules have been completed: Distracted Driving; Unsafe Speed; Signs, Signals and Markings; Occupant Protection; Getting Familiar with Your Vehicle; Driving in Different Environments and Conditions; and Sharing the Road.
GTSC used funding from the Ford Driving Skills for Life program to coordinate “Battle of the Belt” competitions in Suffolk County to raise awareness of the importance of seat belt use.
Statewide Highway Safety Program - 2 2015 Highway Safety Annual Report
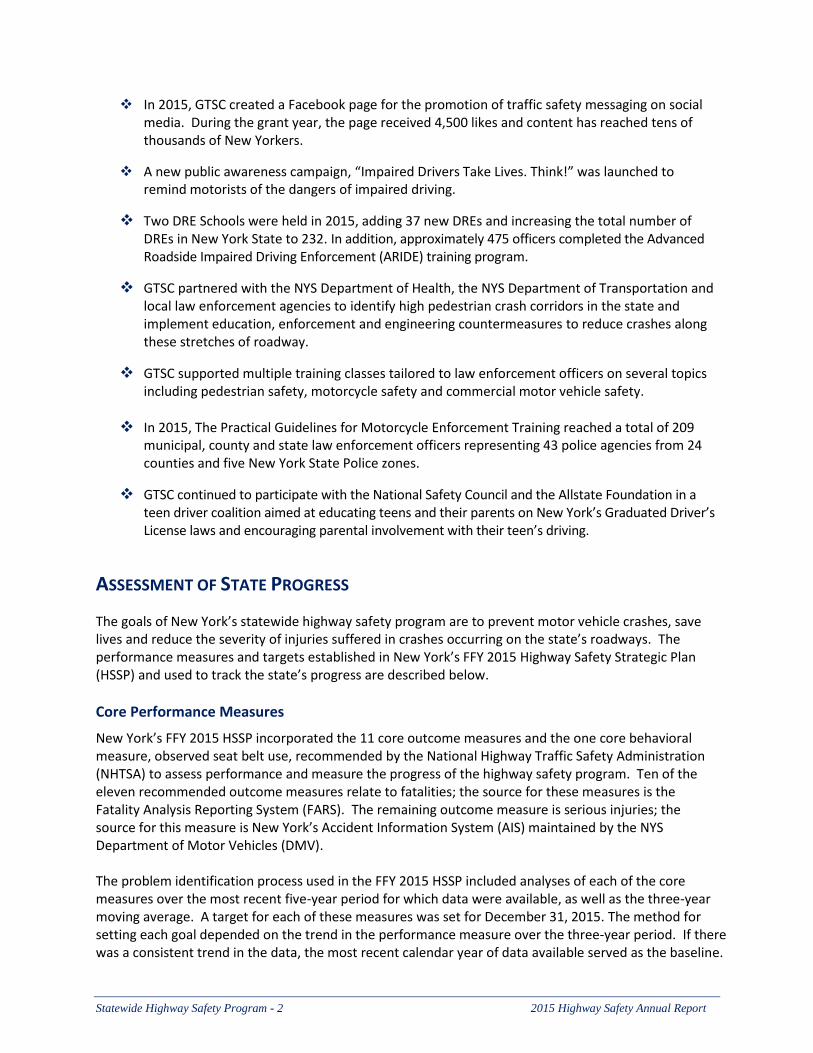
In 2015, GTSC created a Facebook page for the promotion of traffic safety messaging on social media. During the grant year, the page received 4,500 likes and content has reached tens of thousands of New Yorkers.
A new public awareness campaign, “Impaired Drivers Take Lives. Think!” was launched to remind motorists of the dangers of impaired driving.
Two DRE Schools were held in 2015, adding 37 new DREs and increasing the total number of DREs in New York State to 232. In addition, approximately 475 officers completed the Advanced Roadside Impaired Driving Enforcement (ARIDE) training program.
GTSC partnered with the NYS Department of Health, the NYS Department of Transportation and local law enforcement agencies to identify high pedestrian crash corridors in the state and implement education, enforcement and engineering countermeasures to reduce crashes along these stretches of roadway.
GTSC supported multiple training classes tailored to law enforcement officers on several topics including pedestrian safety, motorcycle safety and commercial motor vehicle safety.
In 2015, The Practical Guidelines for Motorcycle Enforcement Training reached a total of 209 municipal, county and state law enforcement officers representing 43 police agencies from 24 counties and five New York State Police zones.
GTSC continued to participate with the National Safety Council and the Allstate Foundation in a teen driver coalition aimed at educating teens and their parents on New York’s Graduated Driver’s License laws and encouraging parental involvement with their teen’s driving.
ASSESSMENT OF STATE PROGRESS
The goals of New York’s statewide highway safety program are to prevent motor vehicle crashes, save lives and reduce the severity of injuries suffered in crashes occurring on the state’s roadways. The performance measures and targets established in New York’s FFY 2015 Highway Safety Strategic Plan (HSSP) and used to track the state’s progress are described below.
Core Performance Measures
New York’s FFY 2015 HSSP incorporated the 11 core outcome measures and the one core behavioral measure, observed seat belt use, recommended by the National Highway Traffic Safety Administration (NHTSA) to assess performance and measure the progress of the highway safety program. Ten of the eleven recommended outcome measures relate to fatalities; the source for these measures is the Fatality Analysis Reporting System (FARS). The remaining outcome measure is serious injuries; the source for this measure is New York’s Accident Information System (AIS) maintained by the NYS Department of Motor Vehicles (DMV). The problem identification process used in the FFY 2015 HSSP included analyses of each of the core measures over the most recent five-year period for which data were available, as well as the three-year moving average. A target for each of these measures was set for December 31, 2015. The method for setting each goal depended on the trend in the performance measure over the three-year period. If there was a consistent trend in the data, the most recent calendar year of data available served as the baseline.
2015 Highway Safety Annual Report Statewide Highway Safety Program - 3
If there was no clear trend in the measure over this period, i.e., the measure did not increase or decrease consistently, the target was set based on the most recent three-year average. The standardized goal statement format recommended by GHSA and NHTSA was used for each target. The source for the one behavioral measure, observed seat belt use, is the state’s annual seat belt observation survey. The survey is conducted using a research design developed in accordance with uniform criteria established by NHTSA. The statewide seat belt use rate derived from the 2015 seat belt observation survey is included in this report. The method described above used to set the targets for the core outcome measures was also applied to set the target for the statewide seat belt use rate. To assess the state’s progress for this Annual Report, each core measure was updated with the most recent data available: 2014 FARS data, 2014 AIS data and the 2015 seat belt use rate. A table with historical and current data for each core measure is included on the following page.
Other Performance Measures
In addition to the core measures identified by NHTSA, other performance measures are used by New York to track progress in specific program areas. Two new performance measures were added to the FFY 2015 HSSP. One of the new performance measures, Fatal and Personal Injury Crashes Involving Cell Phone Use or Texting, was added to the Police Traffic Services program area to track distracted driving. The second performance measure, Fatalities in Drug-Related Crashes, was added to track the involvement of drugged driving in crashes. Injury performance measures are also tracked, including injuries in alcohol-related crashes and injured motorcyclists, bicyclists and pedestrians. The source for all of these additional measures is New York’s AIS crash file.
Activity Measures
The following activity performance measures are also tracked: seat belt citations, speeding citations and impaired driving arrests. The numbers are reported under the appropriate program areas and include all citations/arrests issued for these violations on a calendar year basis. The state’s Traffic Safety Law Enforcement and Disposition (TSLED) and Administrative Adjudication (AA) systems are the sources for speeding and seat belt citations. TSLED and the New York City Police Department are the sources for data on impaired driving arrests.
Driver Behavior Measures
Another tool for monitoring changes and assessing progress are surveys of driver behaviors, attitudes, perceptions and awareness related to major traffic safety issues. These surveys are conducted annually at five Department of Motor Vehicles offices; three of the DMV offices are in the Upstate region: Albany (Albany County), Syracuse (Onondaga County), and White Plains (Westchester County); one is in New York City (Brooklyn) and one is on Long Island (Medford, Suffolk County). The 2015 survey included a total of 12 questions related to seat belt use, speeding, drinking and driving, cell phone use and texting. More than 1,500 drivers participated in the 2015 survey conducted in May and June; a minimum of 300 surveys were completed at each of the five DMV offices. Analyses were conducted for the total sample and by gender and age group. Selected results are reported in this Annual Report under the relevant program areas: Impaired Driving, Police Traffic Services and Occupant Protection. Results from previous surveys are included to identify any changes and trends that have occurred over time in the reported behaviors, perceptions and awareness of traffic safety issues among New York State drivers.
Statewide Highway Safety Program - 4 2015 Highway Safety Annual Report
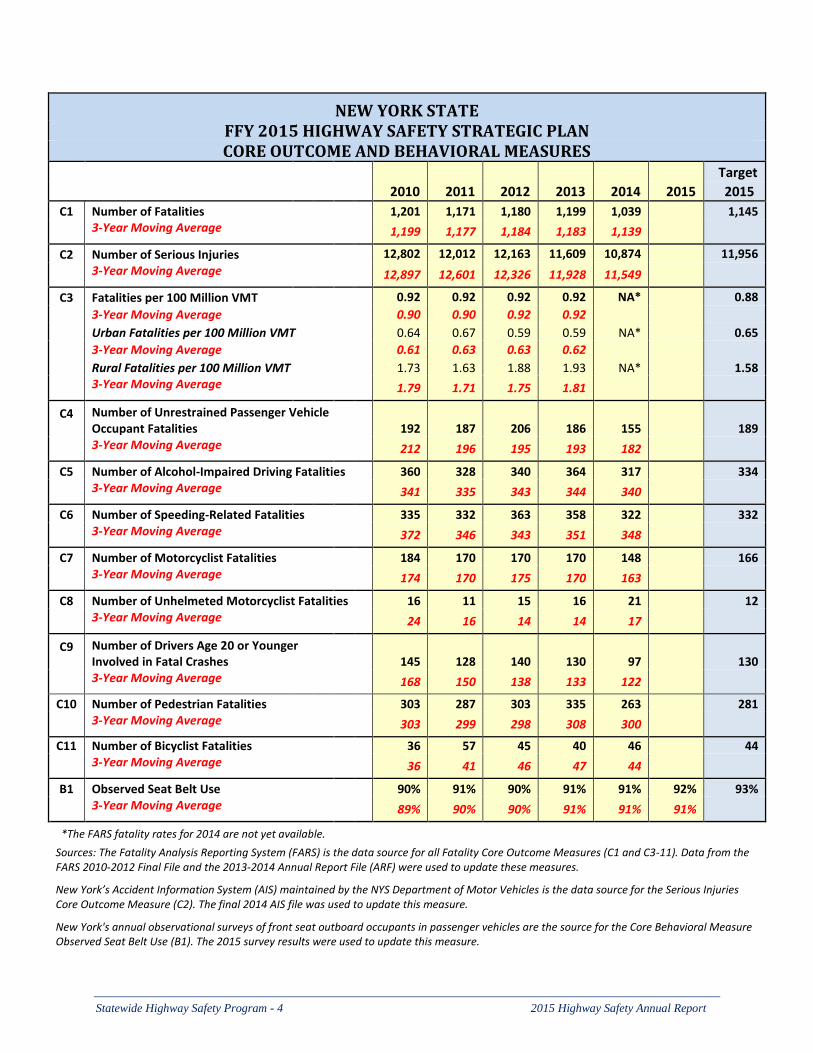
NEW YORK STATE FFY 2015 HIGHWAY SAFETY STRATEGIC PLAN CORE OUTCOME AND BEHAVIORAL MEASURES
Target
2010 2011 2012 2013 2014 2015 2015
C1 Number of Fatalities
1,201 1,171 1,180 1,199 1,039 1,145
3-Year Moving Average
1,199 1,177 1,184 1,183 1,139
C2 Number of Serious Injuries
12,802 12,012 12,163 11,609 10,874 11,956
3-Year Moving Average
12,897 12,601 12,326 11,928 11,549
C3 Fatalities per 100 Million VMT
0.92 0.92 0.92 0.92 NA* 0.88
3-Year Moving Average
0.90 0.90 0.92 0.92
Urban Fatalities per 100 Million VMT 0.64 0.67 0.59 0.59 NA* 0.65
3-Year Moving Average
0.61 0.63 0.63 0.62
Rural Fatalities per 100 Million VMT
1.73 1.63 1.88 1.93 NA* 1.58
3-Year Moving Average 1.79 1.71 1.75 1.81
C4 Number of Unrestrained Passenger Vehicle Occupant Fatalities 192 187 206 186 155 189
3-Year Moving Average
212 196 195 193 182
C5 Number of Alcohol-Impaired Driving Fatalities 360 328 340 364 317 334
3-Year Moving Average 341 335 343 344 340
C6 Number of Speeding-Related Fatalities 335 332 363 358 322 332
3-Year Moving Average
372 346 343 351 348
C7 Number of Motorcyclist Fatalities
184 170 170 170 148 166
3-Year Moving Average
174 170 175 170 163
C8 Number of Unhelmeted Motorcyclist Fatalities 16 11 15 16 21 12
3-Year Moving Average
24 16 14 14 17
C9 Number of Drivers Age 20 or Younger Involved in Fatal Crashes 145 128 140 130 97 130
3-Year Moving Average 168 150 138 133 122
C10 Number of Pedestrian Fatalities
303 287 303 335 263 281
3-Year Moving Average
303 299 298 308 300
C11 Number of Bicyclist Fatalities 36 57 45 40 46 44
3-Year Moving Average 36 41 46 47 44
B1 Observed Seat Belt Use 90% 91% 90% 91% 91% 92% 93%
3-Year Moving Average
89% 90% 90% 91% 91% 91%
*The FARS fatality rates for 2014 are not yet available.
Sources: The Fatality Analysis Reporting System (FARS) is the data source for all Fatality Core Outcome Measures (C1 and C3-11). Data from the FARS 2010-2012 Final File and the 2013-2014 Annual Report File (ARF) were used to update these measures.
New York’s Accident Information System (AIS) maintained by the NYS Department of Motor Vehicles is the data source for the Serious Injuries Core Outcome Measure (C2). The final 2014 AIS file was used to update this measure.
New York's annual observational surveys of front seat outboard occupants in passenger vehicles are the source for the Core Behavioral Measure Observed Seat Belt Use (B1). The 2015 survey results were used to update this measure.
2015 Highway Safety Annual Report FFY 2015 Performance Report - 5
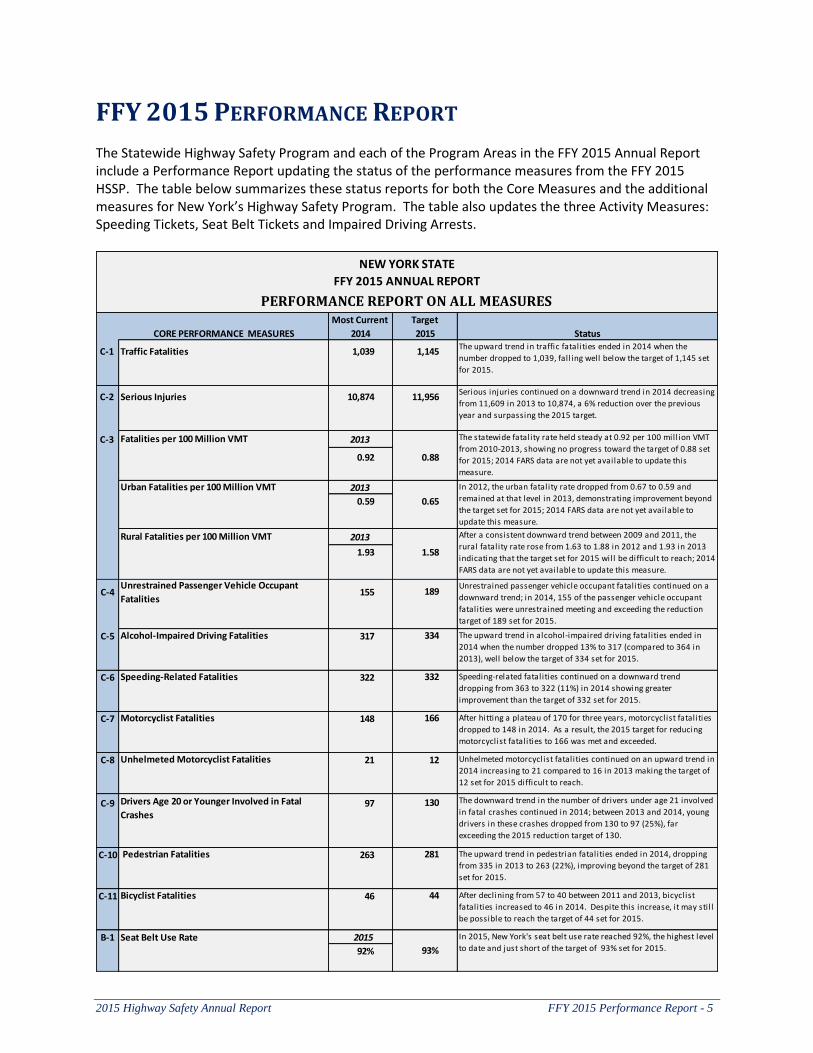
FFY 2015 PERFORMANCE REPORT The Statewide Highway Safety Program and each of the Program Areas in the FFY 2015 Annual Report include a Performance Report updating the status of the performance measures from the FFY 2015 HSSP. The table below summarizes these status reports for both the Core Measures and the additional measures for New York’s Highway Safety Program. The table also updates the three Activity Measures: Speeding Tickets, Seat Belt Tickets and Impaired Driving Arrests.
Most Current
2014
C-1 1,039
C-2 10,874
C-3 2013
0.92
2013
0.59
2013
1.93
C-4 155
C-5 317
C-6 322
C-7 148
C-8 21
C-9 97
C-10 263
C-11 46
B-1 2015
92%
Drivers Age 20 or Younger Involved in Fatal
Crashes 130 The downward trend in the number of drivers under age 21 involved
in fatal crashes continued in 2014; between 2013 and 2014, young
drivers in these crashes dropped from 130 to 97 (25%), far
exceeding the 2015 reduction target of 130.
Pedestrian Fatalities 281 The upward trend in pedestrian fatalities ended in 2014, dropping
from 335 in 2013 to 263 (22%), improving beyond the target of 281
set for 2015.
Seat Belt Use Rate In 2015, New York's seat belt use rate reached 92%, the highest level
to date and just short of the target of 93% set for 2015. 93%
Bicyclist Fatalities 44 After declining from 57 to 40 between 2011 and 2013, bicyclist
fatalities increased to 46 in 2014. Despite this increase, it may stil l
be possible to reach the target of 44 set for 2015.
Unhelmeted Motorcyclist Fatalities 12 Unhelmeted motorcyclist fatalities continued on an upward trend in
2014 increasing to 21 compared to 16 in 2013 making the target of
12 set for 2015 difficult to reach.
Motorcyclist Fatalities 166 After hitting a plateau of 170 for three years, motorcyclist fatalities
dropped to 148 in 2014. As a result, the 2015 target for reducing
motorcyclist fatalities to 166 was met and exceeded.
Speeding-Related Fatalities 332 Speeding-related fatalities continued on a downward trend
dropping from 363 to 322 (11%) in 2014 showing greater
improvement than the target of 332 set for 2015.
Alcohol-Impaired Driving Fatalities 334 The upward trend in alcohol-impaired driving fatalities ended in
2014 when the number dropped 13% to 317 (compared to 364 in
2013), well below the target of 334 set for 2015.
Urban Fatalities per 100 Million VMT In 2012, the urban fatality rate dropped from 0.67 to 0.59 and
remained at that level in 2013, demonstrating improvement beyond
the target set for 2015; 2014 FARS data are not yet available to
update this measure.
0.88
0.65
Fatalities per 100 Million VMT
Unrestrained Passenger Vehicle Occupant
Fatalities189
Unrestrained passenger vehicle occupant fatalities continued on a
downward trend; in 2014, 155 of the passenger vehicle occupant
fatalities were unrestrained meeting and exceeding the reduction
target of 189 set for 2015.
1.58
NEW YORK STATE
FFY 2015 ANNUAL REPORT
PERFORMANCE REPORT ON ALL MEASURESTarget
StatusCORE PERFORMANCE MEASURES 2015
Traffic Fatalities 1,145The upward trend in traffic fatalities ended in 2014 when the
number dropped to 1,039, fall ing well below the target of 1,145 set
for 2015.
Serious Injuries 11,956Serious injuries continued on a downward trend in 2014 decreasing
from 11,609 in 2013 to 10,874, a 6% reduction over the previous
year and surpassing the 2015 target.
The statewide fatality rate held steady at 0.92 per 100 mill ion VMT
from 2010-2013, showing no progress toward the target of 0.88 set
for 2015; 2014 FARS data are not yet available to update this
measure.
Rural Fatalities per 100 Million VMT After a consistent downward trend between 2009 and 2011, the
rural fatality rate rose from 1.63 to 1.88 in 2012 and 1.93 in 2013
indicating that the target set for 2015 will be difficult to reach; 2014
FARS data are not yet available to update this measure.
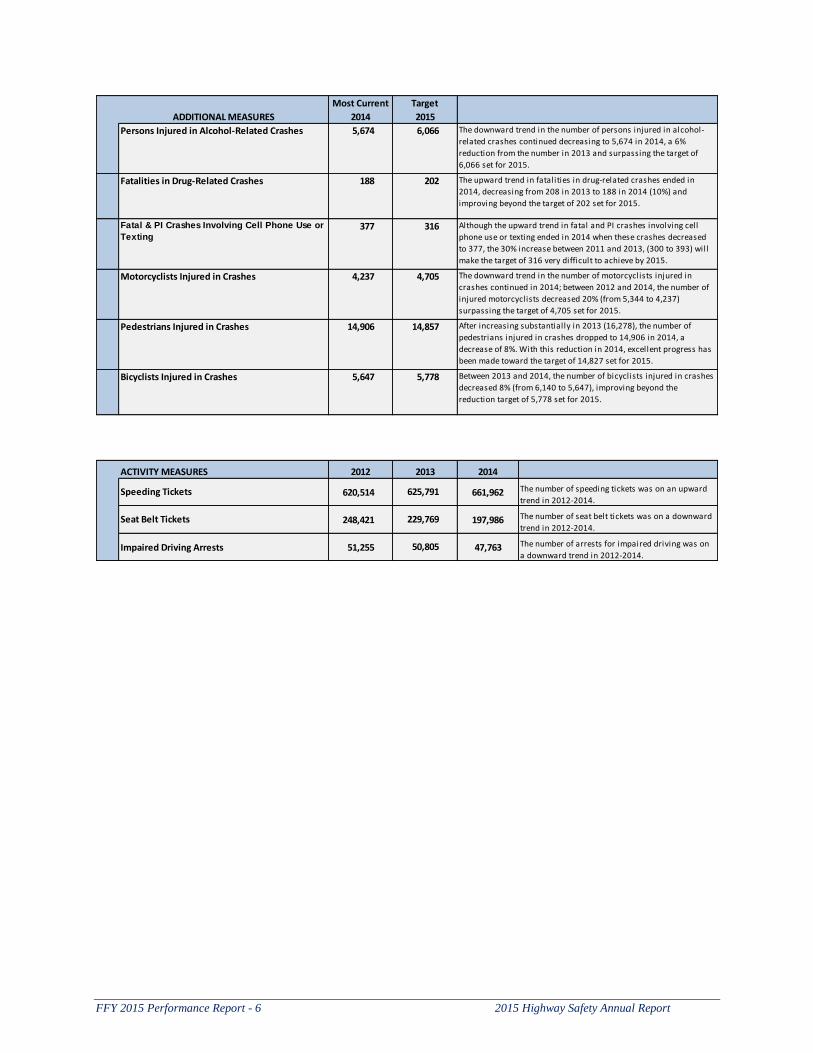
FFY 2015 Performance Report - 6 2015 Highway Safety Annual Report
Most Current
2014
5,674
188
377
4,237
14,906
5,647
ACTIVITY MEASURES 2012 2014
620,514 661,962
248,421 197,986
Impaired Driving Arrests 51,255 47,763
Motorcyclists Injured in Crashes 4,705 The downward trend in the number of motorcyclists injured in
crashes continued in 2014; between 2012 and 2014, the number of
injured motorcyclists decreased 20% (from 5,344 to 4,237)
surpassing the target of 4,705 set for 2015.
50,805
Pedestrians Injured in Crashes 14,857 After increasing substantially in 2013 (16,278), the number of
pedestrians injured in crashes dropped to 14,906 in 2014, a
decrease of 8%. With this reduction in 2014, excellent progress has
been made toward the target of 14,827 set for 2015.
Bicyclists Injured in Crashes 5,778 Between 2013 and 2014, the number of bicyclists injured in crashes
decreased 8% (from 6,140 to 5,647), improving beyond the
reduction target of 5,778 set for 2015.
2013
Speeding Tickets 625,791
Seat Belt Tickets 229,769
The number of speeding tickets was on an upward
trend in 2012-2014.
Persons Injured in Alcohol-Related Crashes 6,066 The downward trend in the number of persons injured in alcohol-
related crashes continued decreasing to 5,674 in 2014, a 6%
reduction from the number in 2013 and surpassing the target of
6,066 set for 2015.
Fatal & PI Crashes Involving Cell Phone Use or
Texting316 Although the upward trend in fatal and PI crashes involving cell
phone use or texting ended in 2014 when these crashes decreased
to 377, the 30% increase between 2011 and 2013, (300 to 393) will
make the target of 316 very difficult to achieve by 2015.
Fatalities in Drug-Related Crashes 202 The upward trend in fatalities in drug-related crashes ended in
2014, decreasing from 208 in 2013 to 188 in 2014 (10%) and
improving beyond the target of 202 set for 2015.
ADDITIONAL MEASURES
Target
2015
The number of seat belt tickets was on a downward
trend in 2012-2014.
The number of arrests for impaired driving was on
a downward trend in 2012-2014.
2015 Highway Safety Annual Report Statewide Performance Measures - 7
STATEWIDE PERFORMANCE MEASURES ASSESSMENT OF PROGRESS
Statewide Targets for FFY 2015
The following performance targets for New York’s statewide highway safety program were established in the state’s FFY 2015 HSSP:
Decrease traffic fatalities 3 percent from the 2010-2012 calendar year average of 1,180 to 1,145 by December 31, 2015
Decrease serious traffic injuries 3 percent from the 2010-2012 calendar year average of 12,326 to 11,956 by December 31, 2015
Decrease fatalities/100M VMT 3 percent from the 2009-2011 calendar base year average of 0.90 to 0.88 by December 31, 2014 (This measure was not updated in the FFY 2015 HSSP due to the delay in the availability of more recent FARS data.)
Decrease urban fatalities/100M VMT 3 percent from 0.67 in 2011 to 0.65 by December 31, 2014 (This measure was not updated in the FFY 2015 HSSP due to the delay in the availability of more recent FARS data.)
Decrease rural fatalities/100M VMT 3 percent from 1.63 in 2011 to 1.58 by December 31, 2014 (This measure was not updated in the FFY 2015 HSSP due to the delay in the availability of more recent FARS data.)
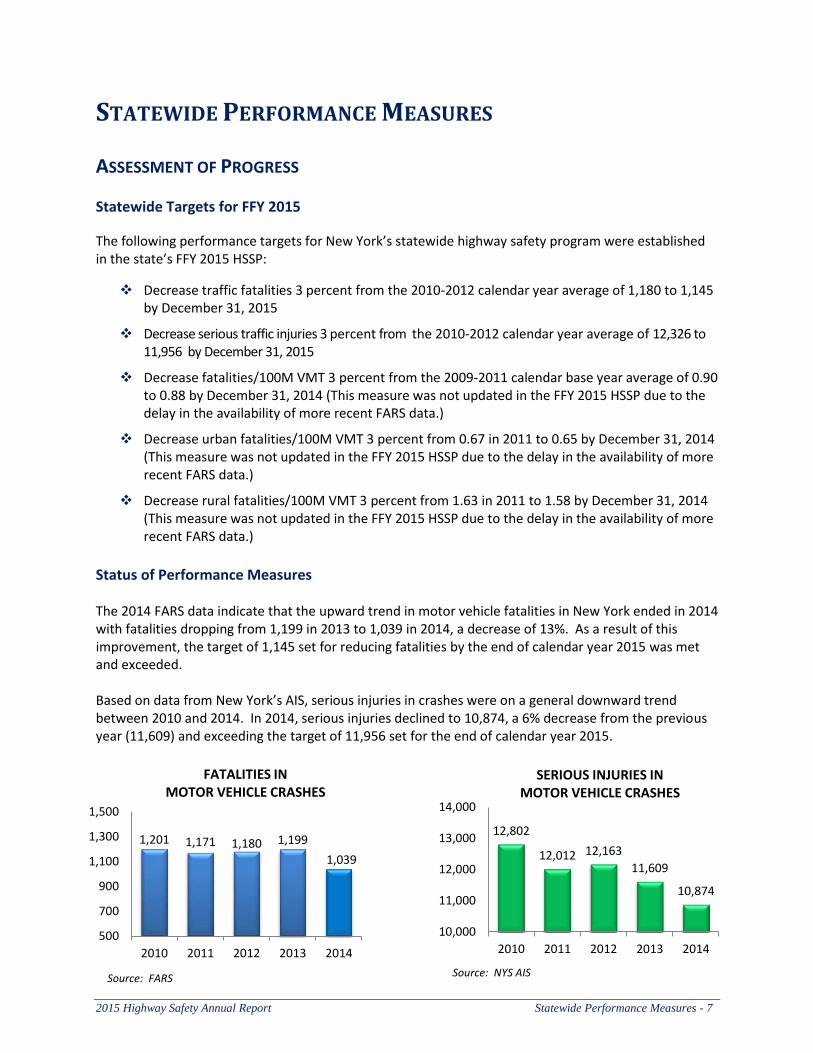
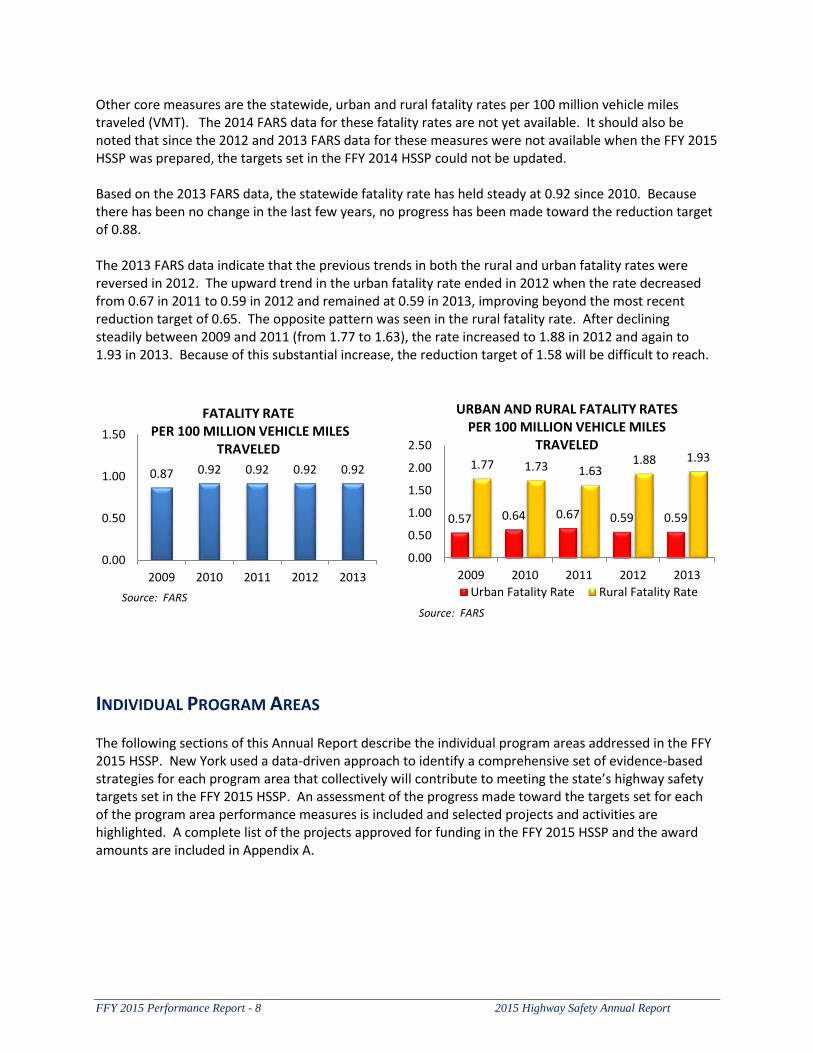
Status of Performance Measures The 2014 FARS data indicate that the upward trend in motor vehicle fatalities in New York ended in 2014 with fatalities dropping from 1,199 in 2013 to 1,039 in 2014, a decrease of 13%. As a result of this improvement, the target of 1,145 set for reducing fatalities by the end of calendar year 2015 was met and exceeded. Based on data from New York’s AIS, serious injuries in crashes were on a general downward trend between 2010 and 2014. In 2014, serious injuries declined to 10,874, a 6% decrease from the previous year (11,609) and exceeding the target of 11,956 set for the end of calendar year 2015.
1,201 1,171 1,180 1,199
1,039
500
700
900
1,100
1,300
1,500
2010 2011 2012 2013 2014
FATALITIES IN MOTOR VEHICLE CRASHES
Source: FARS
12,802
12,012 12,163
11,609
10,874
10,000
11,000
12,000
13,000
14,000
2010 2011 2012 2013 2014
SERIOUS INJURIES IN MOTOR VEHICLE CRASHES
Source: NYS AIS
FFY 2015 Performance Report - 8 2015 Highway Safety Annual Report
Other core measures are the statewide, urban and rural fatality rates per 100 million vehicle miles traveled (VMT). The 2014 FARS data for these fatality rates are not yet available. It should also be noted that since the 2012 and 2013 FARS data for these measures were not available when the FFY 2015 HSSP was prepared, the targets set in the FFY 2014 HSSP could not be updated. Based on the 2013 FARS data, the statewide fatality rate has held steady at 0.92 since 2010. Because there has been no change in the last few years, no progress has been made toward the reduction target of 0.88. The 2013 FARS data indicate that the previous trends in both the rural and urban fatality rates were reversed in 2012. The upward trend in the urban fatality rate ended in 2012 when the rate decreased from 0.67 in 2011 to 0.59 in 2012 and remained at 0.59 in 2013, improving beyond the most recent reduction target of 0.65. The opposite pattern was seen in the rural fatality rate. After declining steadily between 2009 and 2011 (from 1.77 to 1.63), the rate increased to 1.88 in 2012 and again to 1.93 in 2013. Because of this substantial increase, the reduction target of 1.58 will be difficult to reach.
INDIVIDUAL PROGRAM AREAS The following sections of this Annual Report describe the individual program areas addressed in the FFY 2015 HSSP. New York used a data-driven approach to identify a comprehensive set of evidence-based strategies for each program area that collectively will contribute to meeting the state’s highway safety targets set in the FFY 2015 HSSP. An assessment of the progress made toward the targets set for each of the program area performance measures is included and selected projects and activities are highlighted. A complete list of the projects approved for funding in the FFY 2015 HSSP and the award amounts are included in Appendix A.
0.57 0.64 0.67 0.59 0.59
1.77 1.73 1.63 1.88 1.93
0.00
0.50
1.00
1.50
2.00
2.50
2009 2010 2011 2012 2013
URBAN AND RURAL FATALITY RATES PER 100 MILLION VEHICLE MILES
TRAVELED
Urban Fatality Rate Rural Fatality Rate
Source: FARS
0.87 0.92 0.92 0.92 0.92
0.00
0.50
1.00
1.50
2009 2010 2011 2012 2013
Source: FARS
FATALITY RATE PER 100 MILLION VEHICLE MILES
TRAVELED
2015 Highway Safety Annual Report Impaired Driving Program - 9
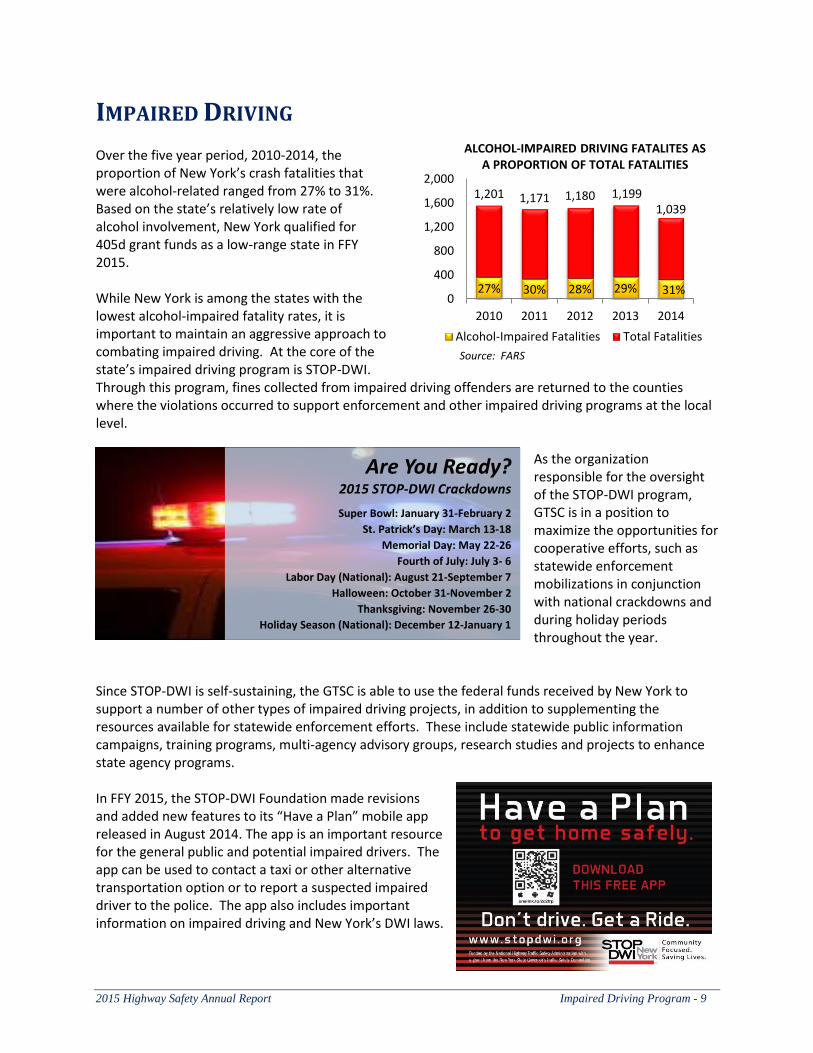
IMPAIRED DRIVING Over the five year period, 2010-2014, the proportion of New York’s crash fatalities that were alcohol-related ranged from 27% to 31%. Based on the state’s relatively low rate of alcohol involvement, New York qualified for 405d grant funds as a low-range state in FFY 2015. While New York is among the states with the lowest alcohol-impaired fatality rates, it is important to maintain an aggressive approach to combating impaired driving. At the core of the state’s impaired driving program is STOP-DWI. Through this program, fines collected from impaired driving offenders are returned to the counties where the violations occurred to support enforcement and other impaired driving programs at the local level.
As the organization responsible for the oversight of the STOP-DWI program, GTSC is in a position to maximize the opportunities for cooperative efforts, such as statewide enforcement mobilizations in conjunction with national crackdowns and during holiday periods throughout the year.
Since STOP-DWI is self-sustaining, the GTSC is able to use the federal funds received by New York to support a number of other types of impaired driving projects, in addition to supplementing the resources available for statewide enforcement efforts. These include statewide public information campaigns, training programs, multi-agency advisory groups, research studies and projects to enhance state agency programs. In FFY 2015, the STOP-DWI Foundation made revisions and added new features to its “Have a Plan” mobile app released in August 2014. The app is an important resource for the general public and potential impaired drivers. The app can be used to contact a taxi or other alternative transportation option or to report a suspected impaired driver to the police. The app also includes important information on impaired driving and New York’s DWI laws.
Are You Ready? 2015 STOP-DWI Crackdowns
Super Bowl: January 31-February 2
St. Patrick’s Day: March 13-18
Memorial Day: May 22-26
Fourth of July: July 3- 6
Labor Day (National): August 21-September 7
Halloween: October 31-November 2
Thanksgiving: November 26-30
Holiday Season (National): December 12-January 1
27% 30% 28% 29% 31%
1,201 1,171 1,180 1,199 1,039
0
400
800
1,200
1,600
2,000
2010 2011 2012 2013 2014
ALCOHOL-IMPAIRED DRIVING FATALITES AS A PROPORTION OF TOTAL FATALITIES
Alcohol-Impaired Fatalities Total Fatalities
Source: FARS
Impaired Driving Program - 10 2015 Highway Safety Annual Report
The STOP-DWI Foundation also developed a statewide plan to promote the STOP-DWI NY mobile app utilizing printed materials, PSAs and social media. County STOP-DWI programs integrated the app into their local programs and outreach and the app was also highlighted through the various hockey sports venues targeted throughout the state. The app can be accessed at www.stopdwi.org/mobileapp. The STOP-DWI Foundation also provided a number of training programs throughout FFY 2015 including three training sessions covering the topics of DWI Test Refusals and the Role of the DRE. The attendees at these sessions included STOP-DWI Coordinators, police officers, Probation Officers, District Attorneys, Public Defenders, emergency service personnel and treatment professionals.
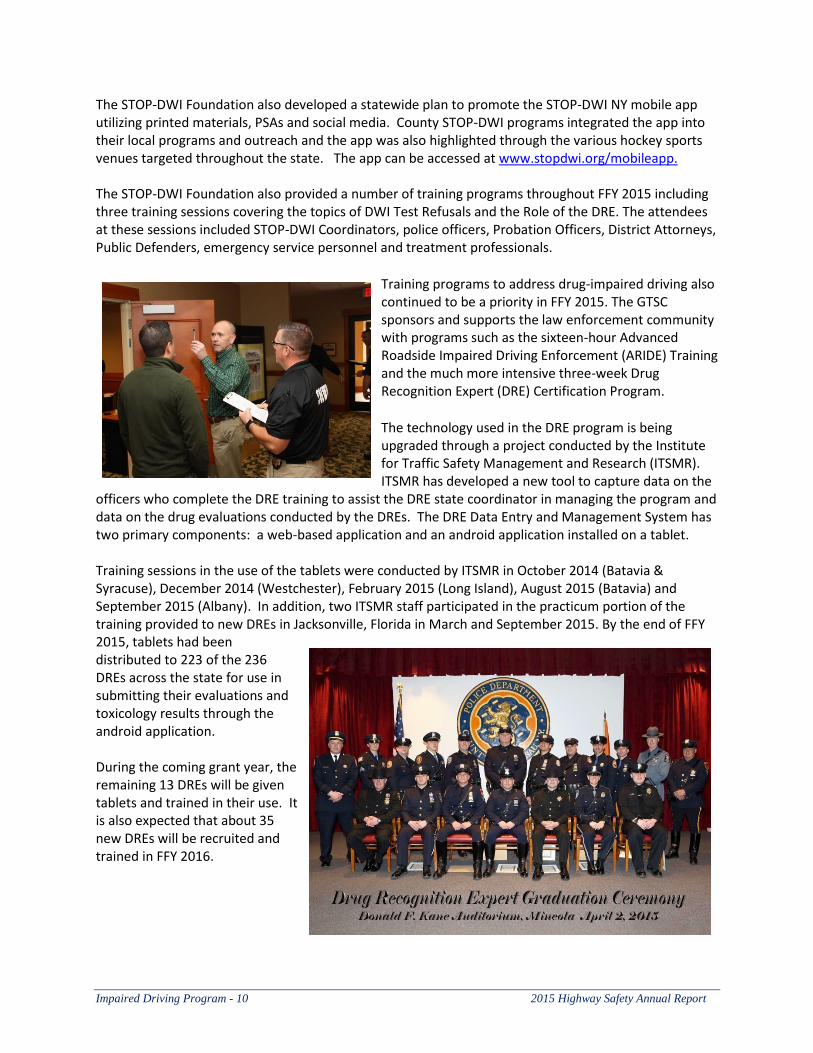
Training programs to address drug-impaired driving also continued to be a priority in FFY 2015. The GTSC sponsors and supports the law enforcement community with programs such as the sixteen-hour Advanced Roadside Impaired Driving Enforcement (ARIDE) Training and the much more intensive three-week Drug Recognition Expert (DRE) Certification Program.
The technology used in the DRE program is being upgraded through a project conducted by the Institute for Traffic Safety Management and Research (ITSMR). ITSMR has developed a new tool to capture data on the
officers who complete the DRE training to assist the DRE state coordinator in managing the program and data on the drug evaluations conducted by the DREs. The DRE Data Entry and Management System has two primary components: a web-based application and an android application installed on a tablet. Training sessions in the use of the tablets were conducted by ITSMR in October 2014 (Batavia & Syracuse), December 2014 (Westchester), February 2015 (Long Island), August 2015 (Batavia) and September 2015 (Albany). In addition, two ITSMR staff participated in the practicum portion of the training provided to new DREs in Jacksonville, Florida in March and September 2015. By the end of FFY 2015, tablets had been distributed to 223 of the 236 DREs across the state for use in submitting their evaluations and toxicology results through the android application. During the coming grant year, the remaining 13 DREs will be given tablets and trained in their use. It is also expected that about 35 new DREs will be recruited and trained in FFY 2016.
2015 Highway Safety Annual Report Impaired Driving Program - 11
ASSESSMENT OF PROGRESS
Impaired Driving Targets for FFY 2015
Decrease alcohol-impaired driving fatalities 3 percent from the 2010-2012 calendar year average of
344 to 334 by December 31, 2015
Reduce the number of persons injured in alcohol-related crashes 3 percent from the 2010-2012 calendar year average of 6,254 to 6,066 by December 31, 2015
Decrease the number of fatalities in drug-related crashes 7 percent from the 2010-2012 calendar
year average of 217 to 202 by December 31, 2015
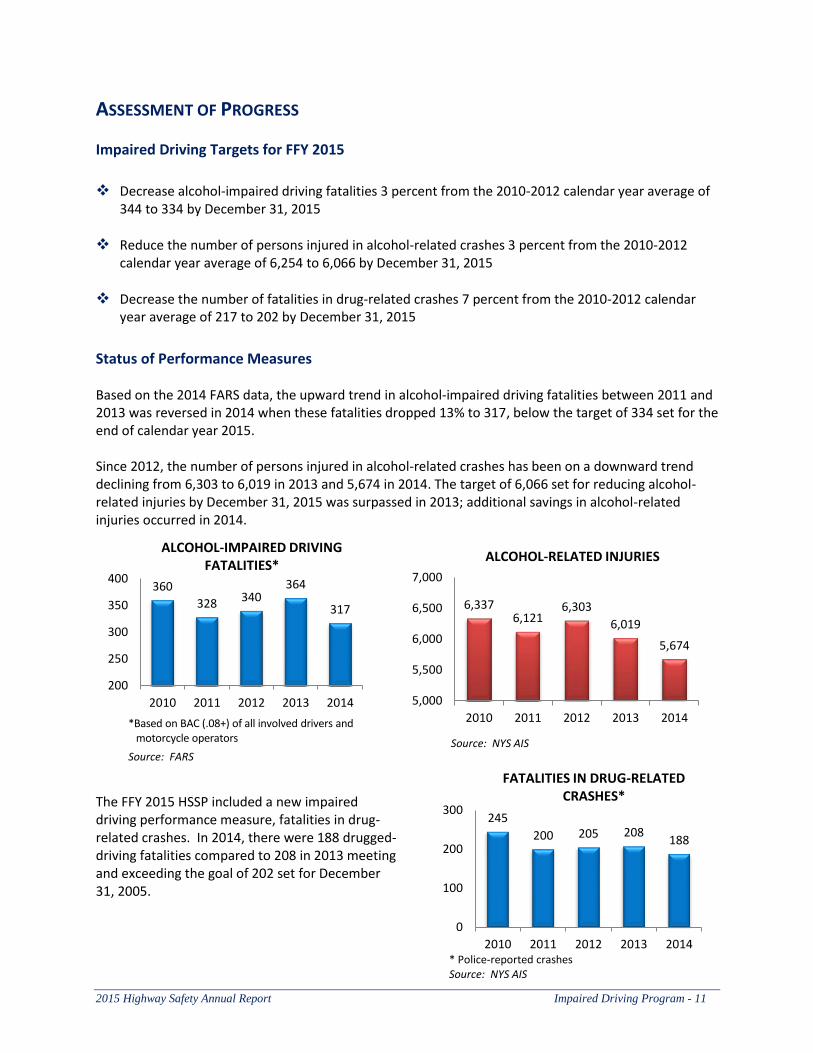
Status of Performance Measures Based on the 2014 FARS data, the upward trend in alcohol-impaired driving fatalities between 2011 and 2013 was reversed in 2014 when these fatalities dropped 13% to 317, below the target of 334 set for the end of calendar year 2015. Since 2012, the number of persons injured in alcohol-related crashes has been on a downward trend declining from 6,303 to 6,019 in 2013 and 5,674 in 2014. The target of 6,066 set for reducing alcohol-related injuries by December 31, 2015 was surpassed in 2013; additional savings in alcohol-related injuries occurred in 2014.
The FFY 2015 HSSP included a new impaired driving performance measure, fatalities in drug-related crashes. In 2014, there were 188 drugged-driving fatalities compared to 208 in 2013 meeting and exceeding the goal of 202 set for December 31, 2005.
360
328 340 364
317
200
250
300
350
400
2010 2011 2012 2013 2014
*Based on BAC (.08+) of all involved drivers and motorcycle operators
Source: FARS
ALCOHOL-IMPAIRED DRIVING FATALITIES*
6,337 6,121
6,303
6,019
5,674
5,000
5,500
6,000
6,500
7,000
2010 2011 2012 2013 2014
ALCOHOL-RELATED INJURIES
Source: NYS AIS
245
200 205 208 188
0
100
200
300
2010 2011 2012 2013 2014
FATALITIES IN DRUG-RELATED CRASHES*
* Police-reported crashes Source: NYS AIS
Impaired Driving Program - 12 2015 Highway Safety Annual Report
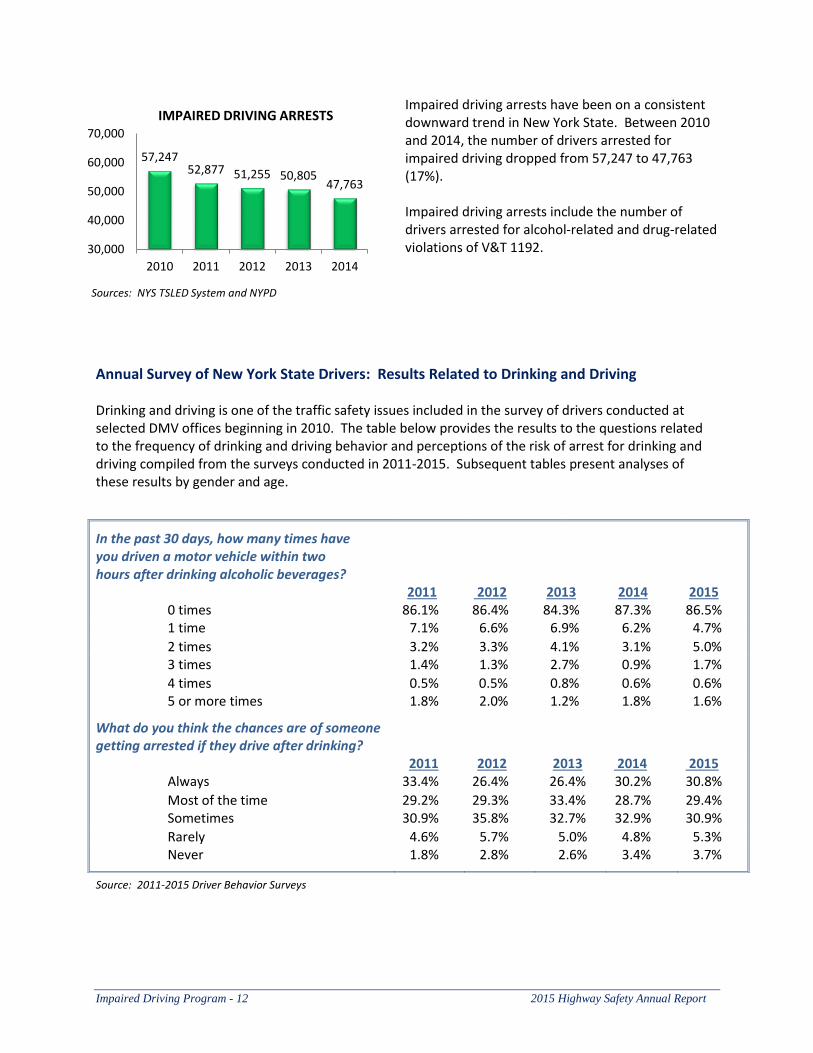
57,247 52,877 51,255 50,805
47,763
30,000
40,000
50,000
60,000
70,000
2010 2011 2012 2013 2014
IMPAIRED DRIVING ARRESTS
Sources: NYS TSLED System and NYPD
Impaired driving arrests have been on a consistent downward trend in New York State. Between 2010 and 2014, the number of drivers arrested for impaired driving dropped from 57,247 to 47,763 (17%). Impaired driving arrests include the number of drivers arrested for alcohol-related and drug-related violations of V&T 1192.
Annual Survey of New York State Drivers: Results Related to Drinking and Driving Drinking and driving is one of the traffic safety issues included in the survey of drivers conducted at selected DMV offices beginning in 2010. The table below provides the results to the questions related to the frequency of drinking and driving behavior and perceptions of the risk of arrest for drinking and driving compiled from the surveys conducted in 2011-2015. Subsequent tables present analyses of these results by gender and age.
Source: 2011-2015 Driver Behavior Surveys
In the past 30 days, how many times have you driven a motor vehicle within two hours after drinking alcoholic beverages?
2011 2012 2013 2014 2015 0 times 86.1% 86.4% 84.3% 87.3% 86.5% 1 time 7.1% 6.6% 6.9% 6.2% 4.7%
2 times 3.2% 3.3% 4.1% 3.1% 5.0% 3 times 1.4% 1.3% 2.7% 0.9% 1.7%
4 times 0.5% 0.5% 0.8% 0.6% 0.6% 5 or more times 1.8% 2.0% 1.2% 1.8% 1.6%
What do you think the chances are of someone getting arrested if they drive after drinking?
2011 2012 2013 2014 2015 Always 33.4% 26.4% 26.4% 30.2% 30.8%
Most of the time 29.2% 29.3% 33.4% 28.7% 29.4% Sometimes 30.9% 35.8% 32.7% 32.9% 30.9%
Rarely 4.6% 5.7% 5.0% 4.8% 5.3% Never 1.8% 2.8% 2.6% 3.4% 3.7%
2015 Highway Safety Annual Report Impaired Driving Program - 13
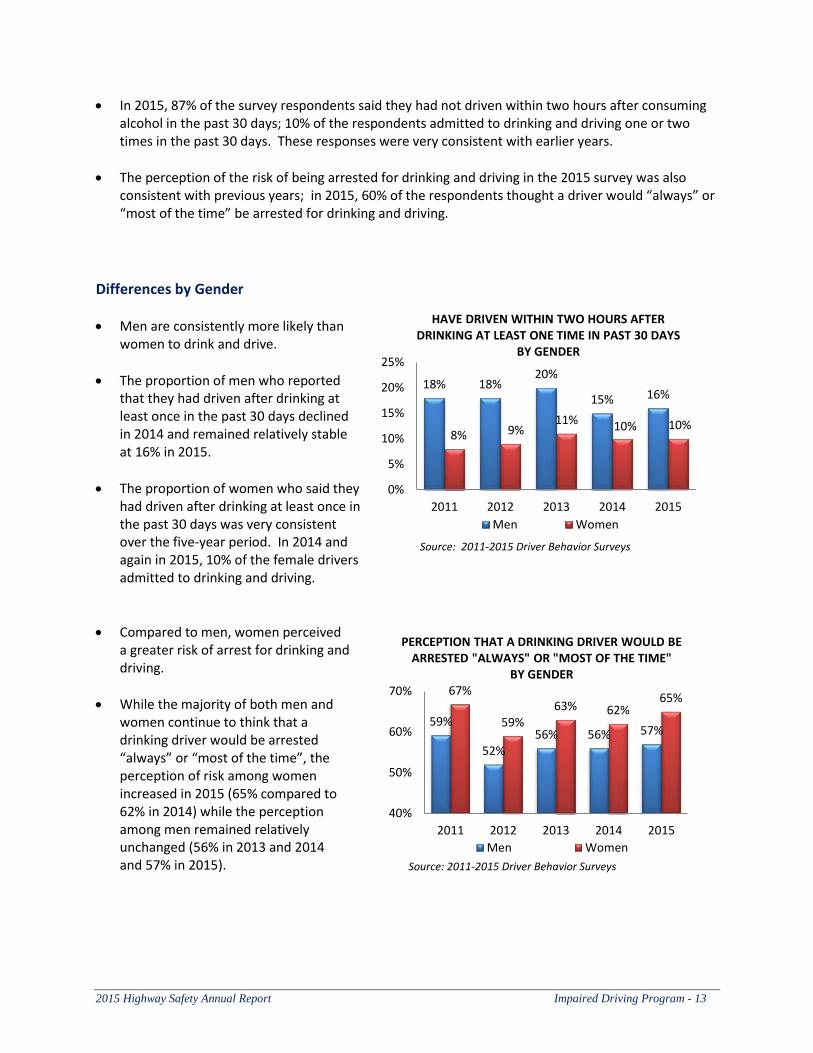
59%
52% 56% 56% 57%
67%
59% 63% 62%
65%
40%
50%
60%
70%
2011 2012 2013 2014 2015
Men Women
Source: 2011-2015 Driver Behavior Surveys
PERCEPTION THAT A DRINKING DRIVER WOULD BE ARRESTED "ALWAYS" OR "MOST OF THE TIME"
BY GENDER
18% 18% 20%
15% 16%
8% 9% 11% 10% 10%
0%
5%
10%
15%
20%
25%
2011 2012 2013 2014 2015
Men Women
Source: 2011-2015 Driver Behavior Surveys
HAVE DRIVEN WITHIN TWO HOURS AFTER DRINKING AT LEAST ONE TIME IN PAST 30 DAYS
BY GENDER
In 2015, 87% of the survey respondents said they had not driven within two hours after consuming alcohol in the past 30 days; 10% of the respondents admitted to drinking and driving one or two times in the past 30 days. These responses were very consistent with earlier years.
The perception of the risk of being arrested for drinking and driving in the 2015 survey was also consistent with previous years; in 2015, 60% of the respondents thought a driver would “always” or “most of the time” be arrested for drinking and driving.
Differences by Gender
Men are consistently more likely than women to drink and drive.
The proportion of men who reported that they had driven after drinking at least once in the past 30 days declined in 2014 and remained relatively stable at 16% in 2015.
The proportion of women who said they had driven after drinking at least once in the past 30 days was very consistent over the five-year period. In 2014 and again in 2015, 10% of the female drivers admitted to drinking and driving.
Compared to men, women perceived a greater risk of arrest for drinking and driving.
While the majority of both men and women continue to think that a drinking driver would be arrested “always” or “most of the time”, the perception of risk among women increased in 2015 (65% compared to 62% in 2014) while the perception among men remained relatively unchanged (56% in 2013 and 2014 and 57% in 2015).
Impaired Driving Program - 14 2015 Highway Safety Annual Report
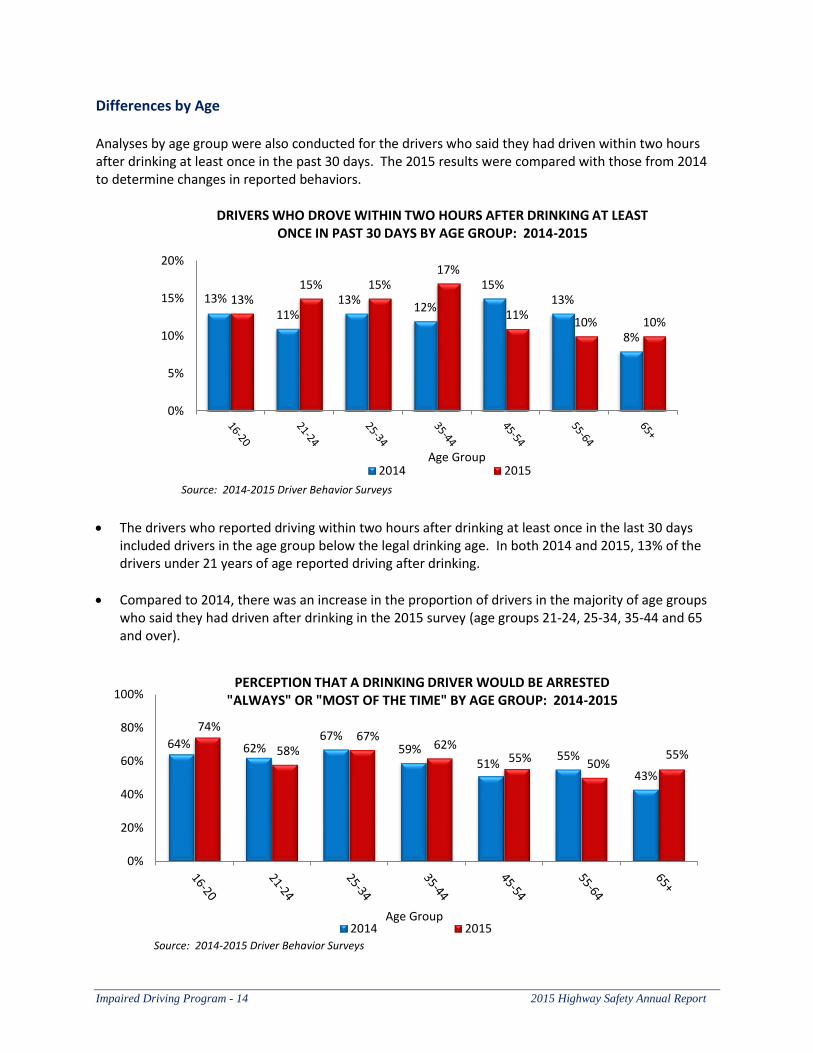
Differences by Age Analyses by age group were also conducted for the drivers who said they had driven within two hours after drinking at least once in the past 30 days. The 2015 results were compared with those from 2014 to determine changes in reported behaviors.
The drivers who reported driving within two hours after drinking at least once in the last 30 days included drivers in the age group below the legal drinking age. In both 2014 and 2015, 13% of the drivers under 21 years of age reported driving after drinking.
Compared to 2014, there was an increase in the proportion of drivers in the majority of age groups who said they had driven after drinking in the 2015 survey (age groups 21-24, 25-34, 35-44 and 65 and over).
64% 62% 67%
59% 51%
55%
43%
74%
58% 67%
62% 55% 50%
55%
0%
20%
40%
60%
80%
100%PERCEPTION THAT A DRINKING DRIVER WOULD BE ARRESTED
"ALWAYS" OR "MOST OF THE TIME" BY AGE GROUP: 2014-2015
2014 2015Age Group
Source: 2014-2015 Driver Behavior Surveys
13% 11%
13% 12%
15% 13%
8%
13% 15% 15%
17%
11% 10% 10%
0%
5%
10%
15%
20%
DRIVERS WHO DROVE WITHIN TWO HOURS AFTER DRINKING AT LEAST ONCE IN PAST 30 DAYS BY AGE GROUP: 2014-2015
2014 2015Age Group
Source: 2014-2015 Driver Behavior Surveys
2015 Highway Safety Annual Report Impaired Driving Program - 15
In general, the perception of the risk of getting a ticket decreases with age; in 2015, 74% of the drivers under 21 thought that someone who was drinking and driving would be arrested “always” or “most of the time” compared to 50%-55% of drivers age 45 and older.
Between 2014 and 2015, the perception of risk of being arrested for driving after drinking increased the most among drivers ages 16-20 (from 64% to 74%) and ages 65 and older (from 43% to 55%).
IMPAIRED DRIVING PROJECTS AND ACTIVITIES FUNDED IN FFY 2015 New York used a data-driven approach to identify a comprehensive set of strategies for the state’s Impaired Driving program that collectively will contribute to progress in meeting the state’s highway safety targets set in the FFY 2015 HSSP. Included under the strategies listed below are descriptions of selected projects that highlight the activities undertaken. The complete list of projects implemented in FFY 2015 is included as Appendix A. The project title, number and amount of funds awarded are provided for each project.
Enforcement of Impaired Driving Laws
“Drive Sober or Get Pulled Over”
In FFY 2015, New York’s crackdown on impaired driving continued to incorporate the national slogan, “Drive Sober or Get Pulled Over.” The crackdown is a cooperative effort involving the State Police, County Sheriffs and local police agencies. The NYS STOP-DWI Foundation also encourages county STOP-DWI Programs across the state to develop and conduct coordinated county-based enforcement efforts. The national crackdown periods coincide with the times when large numbers of impaired drivers are likely to be on the roadway --Halloween, December Holiday Season, Super Bowl, St. Patrick’s Day, Memorial Day , the 4th of July and late summer into Labor Day. In FFY 2015, each county was asked to develop multi-agency efforts utilizing saturation patrols and checkpoints involving their local DREs. In addition, counties were reimbursed for expenses for DRE call outs throughout the grant period. Thirty-four counties participated; each county tailored their efforts to personnel availability and activities significant to their community. Due to the cooperation and support of all county STOP-DWI program coordinators statewide, there was widespread participation by the police agencies across New York State during the crackdowns. In addition to specific target saturation patrols and checkpoints, each enforcement detail required the onsite availability of a certified Drug Recognition Expert. The results of the grant-funded crackdown initiative in FFY 2015 are as follows:
26 counties participated in the Halloween Crackdown resulting in 77 DWI/DWAI arrests, 11 DWAI-Drugs only arrests, 85 other arrests and 904 V&T summonses.
31 counties participated in the Thanksgiving Crackdown period resulting in 89 DWI/DWAI arrests, 11 DWAI-Drugs only arrests, 113 other arrests and 1,437 V&T summonses.
Impaired Driving Program - 16 2015 Highway Safety Annual Report
34 counties participated in the Holiday Season Crackdown resulting in 145 DWI/DWAI arrests, 10 DWAI-Drug only arrests, 175 other arrests and 2,140 V&T summonses.
28 counties participated in the Super Bowl Crackdown resulting in 102 DWI/DWAI arrests, 5 DWAI-Drug only arrests, 82 other arrests and 1,096 V&T summonses.
34 counties participated in the St. Patrick’s Day Crackdown resulting in 122 DWI/DWAI arrests, 9 DWAI-Drug only arrests, 202 other arrests and 2,127 V&T summonses.
33 counties participated in the Memorial Day Crackdown resulting in 141 DWI/DWAI arrests, 16 DWAI-Drug only arrests, 147 other arrests and 1,874 V&T summonses.
34 counties participated in the 4th of July Crackdown resulting in 137 DWI/DWAI arrests, 14 DWAI-Drug only arrests, 154 other arrests and 1,746 V&T summonses.
41 counties participated in the Labor Day Crackdown resulting in 237 DWI/DWAI arrests, 17 DRE Evaluations, 26 DWAI-Drug only arrests, 317 other arrests and 3,484 V&T summonses.
Last Drink Location
The NYS Division of Criminal Justice Services (DCJS) and the New York State Police are making information available on the last location where an arrested impaired driver drank, as well as the exact location of the arrest, to all STOP-DWI programs throughout the state. The data are collected through the breath test instruments used at the time of the arrest. The location data are being used by STOP-DWI and law enforcement agencies to develop programs in various counties to work with local establishments with liquor licenses to prevent intoxicated patrons from being served and then driving from the establishment in an impaired condition. This information also provides an invaluable tool to law enforcement in their targeted impaired driving enforcement efforts. DCJS Impaired Driver Training and Technology Program
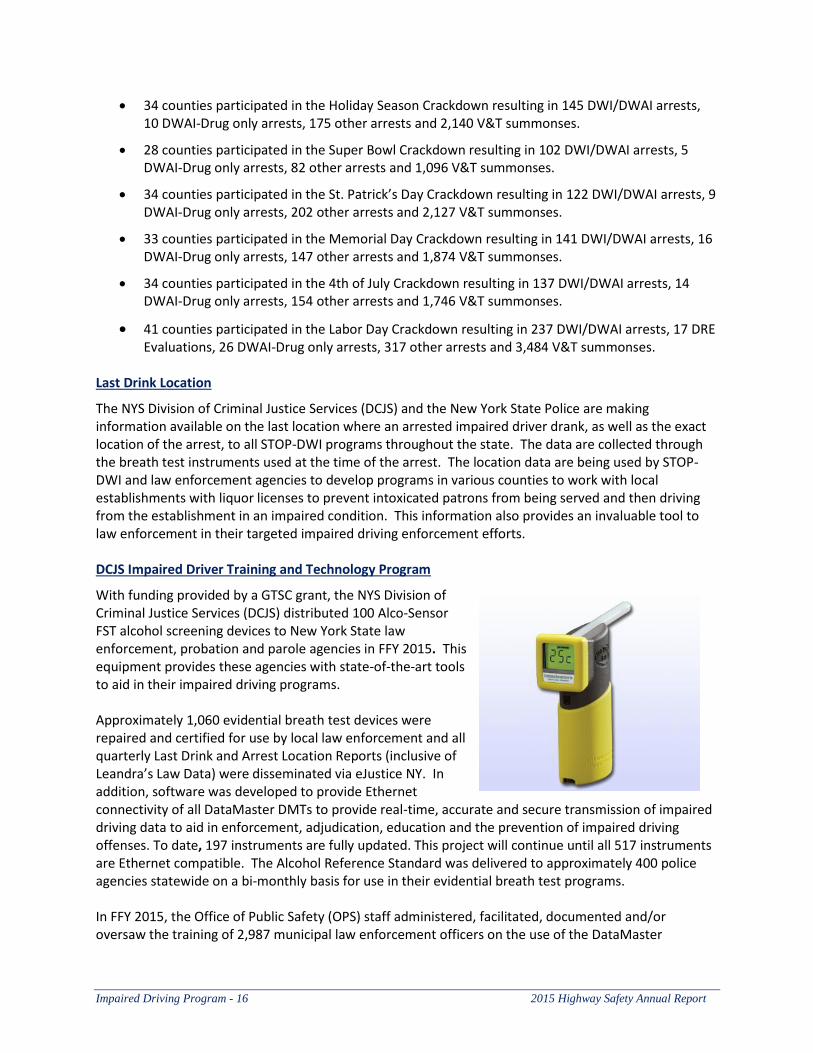
With funding provided by a GTSC grant, the NYS Division of Criminal Justice Services (DCJS) distributed 100 Alco-Sensor FST alcohol screening devices to New York State law enforcement, probation and parole agencies in FFY 2015. This equipment provides these agencies with state-of-the-art tools to aid in their impaired driving programs. Approximately 1,060 evidential breath test devices were repaired and certified for use by local law enforcement and all quarterly Last Drink and Arrest Location Reports (inclusive of Leandra’s Law Data) were disseminated via eJustice NY. In addition, software was developed to provide Ethernet connectivity of all DataMaster DMTs to provide real-time, accurate and secure transmission of impaired driving data to aid in enforcement, adjudication, education and the prevention of impaired driving offenses. To date, 197 instruments are fully updated. This project will continue until all 517 instruments are Ethernet compatible. The Alcohol Reference Standard was delivered to approximately 400 police agencies statewide on a bi-monthly basis for use in their evidential breath test programs. In FFY 2015, the Office of Public Safety (OPS) staff administered, facilitated, documented and/or oversaw the training of 2,987 municipal law enforcement officers on the use of the DataMaster
2015 Highway Safety Annual Report Impaired Driving Program - 17
DMT. This total includes officers who attended the Breath Analysis Operator course, Breath Analysis Operator Instructor course and Breath Analysis Recertification courses. In addition to the DataMaster DMT training, a total of 1,541 police officers attended Standardized Field Sobriety Testing courses, including the Standardized Field Sobriety Instructor course and Standardized Field Sobriety Testing student course. The Crash Management Series, Basic through Technical, was attended by 367 police officers and 29 police officers attended the DWI Documentation and Courtroom Testimony Course developed by OPS staff to insure appropriate documentation and prosecution of impaired driving offenses. In FFY 2015, the Office of Public Safety also continued to present its newest course entitled The Impaired Driver – From the Arrest to the Test. This course is designed to train prosecutors on the technology, physiology, and documentation of the detection, arrest and processing of the impaired driver. A total of 110 participants have attended the course since its inception. In total, during FFY 2015, the OPS provided quality training to 4,657 municipal law enforcement officers across the state.
Prosecution and Adjudication of DWI Offenders Prosecutor Training
During FFY 2015, the New York Prosecutors Training Institute (NYPTI) provided training to prosecutors and law enforcement officers on a variety of impaired driving topics. These included trainings on investigating and prosecuting drugged driving, trial advocacy training for new prosecutors, crash reconstruction training, electronic data recorders, TDNA (Technology Defendants Normally Access), and vehicular homicide trial preparation. Many of the live training sessions were webcasted to make them available in real time to those unable to travel. Under this project, the GTSC also continued to fund two Traffic Safety Resource Prosecutors (TSRPs) to assist New York State prosecutors with impaired driving prosecutions. Hundreds of prosecutors are trained by the TSRPs annually and have access to information from NYPTI and the TSRPs via a statewide listserv, NYPTI's Prosecutors' Encyclopedia and NYPTI's public website www.nypti.org. Toxicologist Training
The New York State Police Forensic Laboratory System provides alcohol and drug testing for state and local agencies throughout New York. Continuing education is critical to the toxicologists' role in highway safety; these professionals need to be kept up-to-date on the latest technology enhancements for testing, as well as the current state of research on the effects of alcohol and drugs on driving performance. With funding from the GTSC, toxicologists from the New York State Police Forensic Investigation Center were able to receive scientific training from both national and international experts over the past year. The training venues included the Society of Forensic Toxicologists (SOFT) Annual Meeting, the American Academy of Forensic Sciences (AAFS) Annual Meeting, and the International Association of Chemical Testing (IACT) Annual Meeting. Staff also participated in advanced degree coursework. These activities are essential to maintaining expert witness qualifications. Being active members of the forensic toxicology profession allows NYSP staff to serve in critical roles shaping the future of forensics on both a state and national level. NYSP Toxicology staff are members of the National Institute of Standards and Technology (NIST) Organization of Scientific Area Committees (OSAC) Toxicology Subcommittee which is developing standards of practice for forensic toxicology; the
Impaired Driving Program - 18 2015 Highway Safety Annual Report
National Safety Council’s Alcohol, Drugs and Impairment Division which publishes guidelines for DUID laboratories; the SOFT/AAFS Drugs & Driving Committee which is assisting labs to meet those published guidelines; and the IACT Training Committee which provides high quality breath and blood alcohol training. Improvement of Toxicology Services for Impaired Driving Enforcement
Forensic toxicology services are essential to the effective enforcement of New York’s impaired driving laws. The volume and complexity of the testing needed to support the state’s impaired driving investigations has far exceeded the resources available within the laboratories. GTSC is supporting the toxicology labs throughout New York by updating aging laboratory equipment and investing in toxicologist training. In FFY 2015, GTSC partnered with the New York State Police Crime Laboratory (the largest provider of impaired driving toxicology services in the state) to develop a sustainable staffing model that will provide the necessary toxicology services throughout the state. Due to the lengthy hiring process and intense training program, the benefits of this partnership will develop over the next several years. Outcomes will include faster turn-around times for lab results, an increase in the number of drugs that can be detected, the addition of quantitative services and enhanced expert testimony.
DWI Offender Treatment, Monitoring, Control NYS Office of Probation and Correctional Alternatives (OPCA) Traffic Safety and Sanctions Project
The Child Passenger Protection Act or "Leandra's Law" was signed into law in New York State on November 18, 2009. One of the key provisions of this important law, effective December 18, 2009, made DWI with a child under 16 years of age in a motor vehicle a Class E felony offense. As of October 20, 2015, 5,915 drivers have been arrested for violating the law. A second provision of Leandra's Law is the requirement that individuals convicted of DWI must install an ignition interlock device in any motor vehicle they "own or operate." Since the August 15, 2010 effective date of this provision, 24,489 ignition interlock devices (IIDs) have been installed in the vehicles of drivers convicted of DWI. The Division of Criminal Justice Services Office of Probation and Correctional Alternatives (OPCA) is responsible for developing regulations and monitoring the implementation of the IID program. Leandra's Law was updated in 2013 through Chapter 169 of the Laws of 2013. This law made a few major changes including: requiring a minimum IID installation period of 12 months; allowing IIDs installed in advance of sentence to be applied to the required installation period; confirming that the law applies to Youthful Offenders in full; and requiring offenders who do not install an IID to assert under oath that the do not own and will not operate a vehicle. Major activities conducted in FFY 2015 are described below.
OPCA continued to closely monitor IID vendors for adherence to Title 9 NYCRR, Part 358 regulations and contractual requirements. Currently, four manufacturers (Consumer Safety Technology, SmartStart, LifeSafer and Draeger) are under contract to provide IID services in New York State.
2015 Highway Safety Annual Report Impaired Driving Program - 19
OPCA released an updated guidance document: New York State Probation Practitioner Handbook for the Management of the DWI Offender. This handbook was developed utilizing research from a variety of available sources including national resources such as NHTSA and the APPA and New York State resources such as ITSMR and the Office of Alcoholism and Substance Abuse (OASAS).
In 2015, OPCA partnered with a number of agencies, including the Department of Motor Vehicles (DMV) and OASAS to provide four live meetings for probation officers, Office of Court Administration staff, OASAS providers and IID manufacturers. The topics included Drugged Driving, Quarterly Reporting, the OASAS LOCADTR, and Supervision and Monitoring of Ignition Interlock Device (IID) Non-Installers; 636 individuals viewed the original trainings and all four were made available for continued viewing via the eJustice portal and the original Live Meeting link.
In July 2015, OPCA hosted its Sixth Annual Qualified Ignition Interlock Manufacturers Conference in Albany. Panelists representing the manufacturers discussed device functionality, NHTSA specifications, the implementation of 2013 devices within and outside of New York, promising practices and lessons learned in other jurisdictions, increasing installation rates and advancing technologies. The afternoon panel consisting of probation and conditional discharge monitors, a judge and a defense attorney discussed the strengths and challenges of implementing an effective interlock device program, Leandra’s Law revisions, installation rates, and negative events/failed tests and graduated responses. The conference closed with a presentation on DWIs in town and village courts. The conference also included data presentations by the Institute for Traffic Safety Management and Research and OPCA.
OPCA drafted an update to the NYCRR Title 9 Part 358 regulations that is currently being reviewed for submission to the Governor’s Office.
OPCA staff participated in numerous Leandra's Law trainings and information sessions for law enforcement, probation officers, judges and court personnel and assisted the county monitors with the development of and access to monitoring tools. For example, sessions were conducted at three regional judicial training events across the state providing two hours of updated Leandra’s Law training to over two hundred judges. OPCA also provided instruction at magistrate meetings and at the New York State Highway Safety Symposium.
Prevention, Communications, Public Information and Educational Outreach STOP-DWI Foundation Training and PI&E Outreach
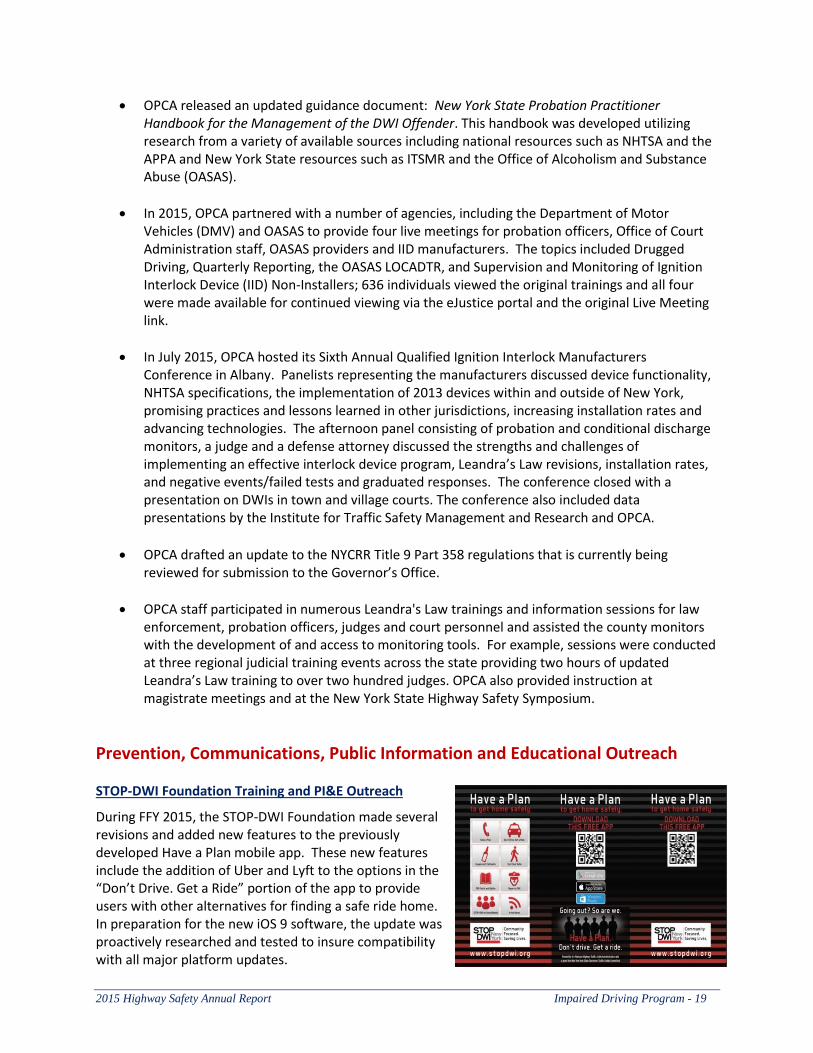
During FFY 2015, the STOP-DWI Foundation made several revisions and added new features to the previously developed Have a Plan mobile app. These new features include the addition of Uber and Lyft to the options in the “Don’t Drive. Get a Ride” portion of the app to provide users with other alternatives for finding a safe ride home. In preparation for the new iOS 9 software, the update was proactively researched and tested to insure compatibility with all major platform updates.
Impaired Driving Program - 20 2015 Highway Safety Annual Report
Updates to the app also included combining the “DWI Facts and Myths”, “In the News”, “STOP-DWI Social Media” and a new “County Initiatives” feature into one section resulting in the home screen having six buttons instead of the previous eight. One revision was having a taxi locator fix installed. This fix uses YellowPages.com to lookup the name of the city the individual is currently in and feed it to the app allowing the taxi locator to work correctly.
Education and promotional materials continue to be developed and distributed to further promote the app. To date, the app has 7,110 users with 61% of the users falling within the target age group of 18-34 years of age.
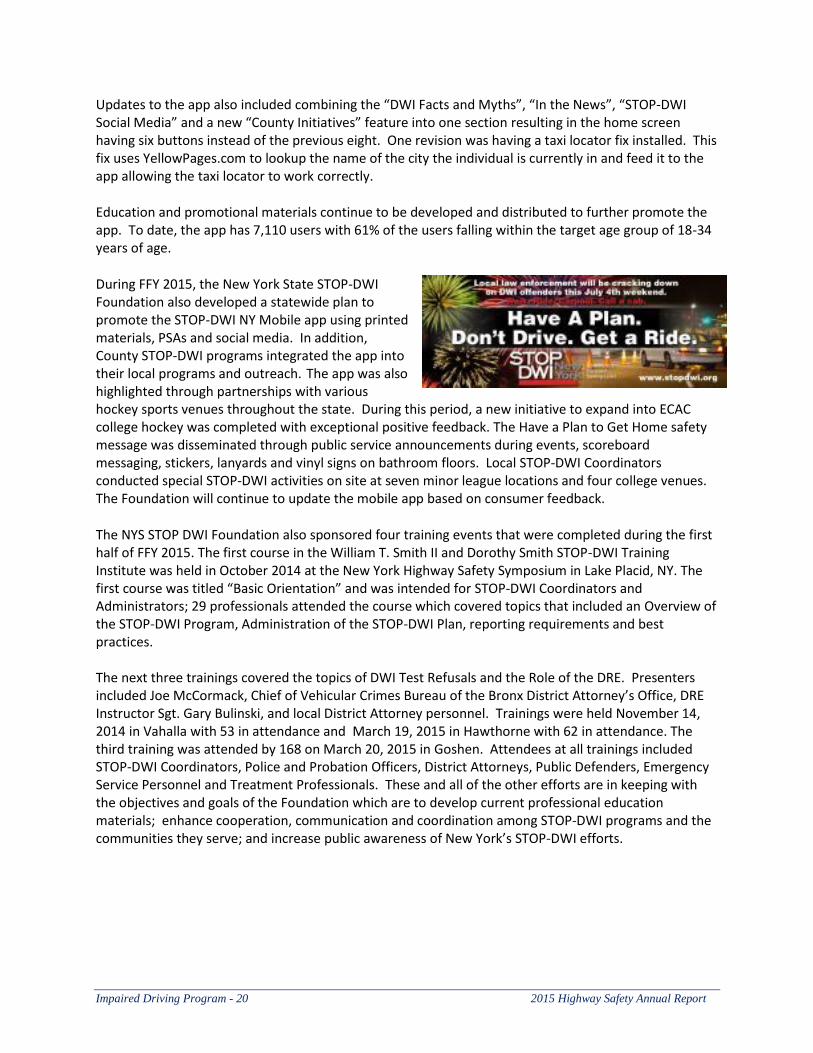
During FFY 2015, the New York State STOP-DWI Foundation also developed a statewide plan to promote the STOP-DWI NY Mobile app using printed materials, PSAs and social media. In addition, County STOP-DWI programs integrated the app into their local programs and outreach. The app was also highlighted through partnerships with various hockey sports venues throughout the state. During this period, a new initiative to expand into ECAC college hockey was completed with exceptional positive feedback. The Have a Plan to Get Home safety message was disseminated through public service announcements during events, scoreboard messaging, stickers, lanyards and vinyl signs on bathroom floors. Local STOP-DWI Coordinators conducted special STOP-DWI activities on site at seven minor league locations and four college venues. The Foundation will continue to update the mobile app based on consumer feedback.
The NYS STOP DWI Foundation also sponsored four training events that were completed during the first half of FFY 2015. The first course in the William T. Smith II and Dorothy Smith STOP-DWI Training Institute was held in October 2014 at the New York Highway Safety Symposium in Lake Placid, NY. The first course was titled “Basic Orientation” and was intended for STOP-DWI Coordinators and Administrators; 29 professionals attended the course which covered topics that included an Overview of the STOP-DWI Program, Administration of the STOP-DWI Plan, reporting requirements and best practices. The next three trainings covered the topics of DWI Test Refusals and the Role of the DRE. Presenters included Joe McCormack, Chief of Vehicular Crimes Bureau of the Bronx District Attorney’s Office, DRE Instructor Sgt. Gary Bulinski, and local District Attorney personnel. Trainings were held November 14, 2014 in Vahalla with 53 in attendance and March 19, 2015 in Hawthorne with 62 in attendance. The third training was attended by 168 on March 20, 2015 in Goshen. Attendees at all trainings included STOP-DWI Coordinators, Police and Probation Officers, District Attorneys, Public Defenders, Emergency Service Personnel and Treatment Professionals. These and all of the other efforts are in keeping with the objectives and goals of the Foundation which are to develop current professional education materials; enhance cooperation, communication and coordination among STOP-DWI programs and the communities they serve; and increase public awareness of New York’s STOP-DWI efforts.
2015 Highway Safety Annual Report Impaired Driving Program - 21
Underage Drinking and Alcohol-Impaired Driving New York State Police Impaired Driver Identification and Underage Drinking Enforcement Program
In FFY 2015, the New York State Police continued to conduct a comprehensive multifaceted strategy which included the following components: deterrence, detection, officer training, public education and underage enforcement. Each Troop developed specific action plans for targeting impaired driving issues within the Troop. The following is a list of activities that were conducted during the grant period:
Underage Drinking Identification Details: The State Police conducted a cumulative total of 160 Underage Drinking Identification (UDI) enforcement details during which 2,147 retail stores and 294 bars and taverns were checked. Of these, 231 bars (79%) and 1,927 retail stores (90%) were in compliance. The details resulted in 246 arrests for violations of the ABC law and 226 arrests for violations of the Penal Law.
Sobriety Checkpoints: Each Troop conducted, at a minimum, one checkpoint each month; multi-agency checkpoints were also conducted. In total, 386 fixed sobriety checkpoints were conducted, resulting in 596 DWI and 463 criminal arrests.
Dedicated DWI Patrols: Each Troop conducted, at a minimum, four dedicated DWI details per month per zone and four additional details at other locations identified by the Troop. Overall, a total of 2,228 dedicated DWI patrols were conducted resulting in 445 DWI and 398 criminal arrests.
Training: Division DRE instructors assisted with the DRE schools conducted in Batavia, NY and with the field certification training. At GTSC’s request, Division instructors also assisted with ARIDE training events. Standardized Field Sobriety Testing training was provided to all recruits attending the Basic School at the New York State Police Academy. Division personnel also assisted with four NYPTI (New York Prosecutors Training Institute) impaired driving training sessions for prosecutors.
National Holiday Crackdown: During the National Crackdown and New Year's period, the State Police conducted 18 Sobriety Checkpoints resulting in 47 DWI arrests and 165 dedicated DWI patrols resulting in 42 DWI and 19 criminal arrests. Also during this time period, 12 Underage Drinking Identification details were conducted; 32 of the 39 bars checked, as well as 128 of the 145 retail establishments, were in compliance. A total of 21 arrests for violations of the ABC law and 14 Penal Law arrests were made. During the New Year’s weekend the State Police conducted nine Sobriety Checkpoints, making seven DWI arrests. Statewide, Troopers arrested 711 individuals for DWI during the National Crackdown.
Public Information and Education: Efforts continued to develop effective PI&E materials for both DWI and underage drinking issues. In a coordinated effort among programs (seatbelts, motorcycle and speed enforcement), information cards as well as other commodities were purchased emphasizing the necessary combined messages. These PI&E materials were developed and disseminated statewide to schools and at fairs and other events.
Operation Prevent – Stop Bad ID
Operation Prevent is conducted by the DMV Division of Field Investigation (DFI) in conjunction with local law enforcement across the state. The purpose of this program is to prevent underage drinking and the use of fraudulent or altered documents by minors to gain access to places where alcohol is served. As part of this project, DFI targets licensed liquor establishments that have been identified as selling alcohol
Impaired Driving Program - 22 2015 Highway Safety Annual Report
to underage patrons by state and local law enforcement agencies, the NY State Liquor Authority and other sources such as County STOP-DWI Coordinators. The DFI also attempts to identify the source of the illegal documents in order to shut down the operation and terminate the production of fraudulent documents. Between FFY 2007 and FFY 2015, DFI Investigators visited 1,074 establishments that serve alcohol, made 4,987 arrests and seized 3,931 illegal documents from persons under the age of 21. The investigations have led to the closure of fraudulent document operations making it much more difficult for minors to obtain illegal or altered licenses.
Drugged Driving
Drug Recognition Expert Statewide Coordinator
The Drug Recognition Expert (DRE) program continues to be coordinated in New York by a member of the GTSC staff. The State Coordinator is responsible for coordinating and scheduling training programs that provide existing DREs the opportunity to maintain certifications that adhere to the national and New York State standards. In the continuing effort to provide the most efficient and relevant training, the State Coordinator, in conjunction with the Technical Advisory Panel (TAP), is tasked with the oversight, review and implementation of the training curriculum and sets the standards for instructor qualifications and certifications. DRE Training Programs
The GTSC staff coordinates the state's Drug Recognition Expert (DRE) program through the DRE Steering Committee. The committee has been working with the state’s enforcement agencies to ensure that as many officers as possible maintain certification in the SFST and DRE programs. The DRE training course was offered in February 2015 and August 2015 with a total of 37 new certified Drug Recognition Experts. A total of 232 DREs are now deployed across the state. Advanced Roadside Impaired Driving Enforcement (ARIDE)
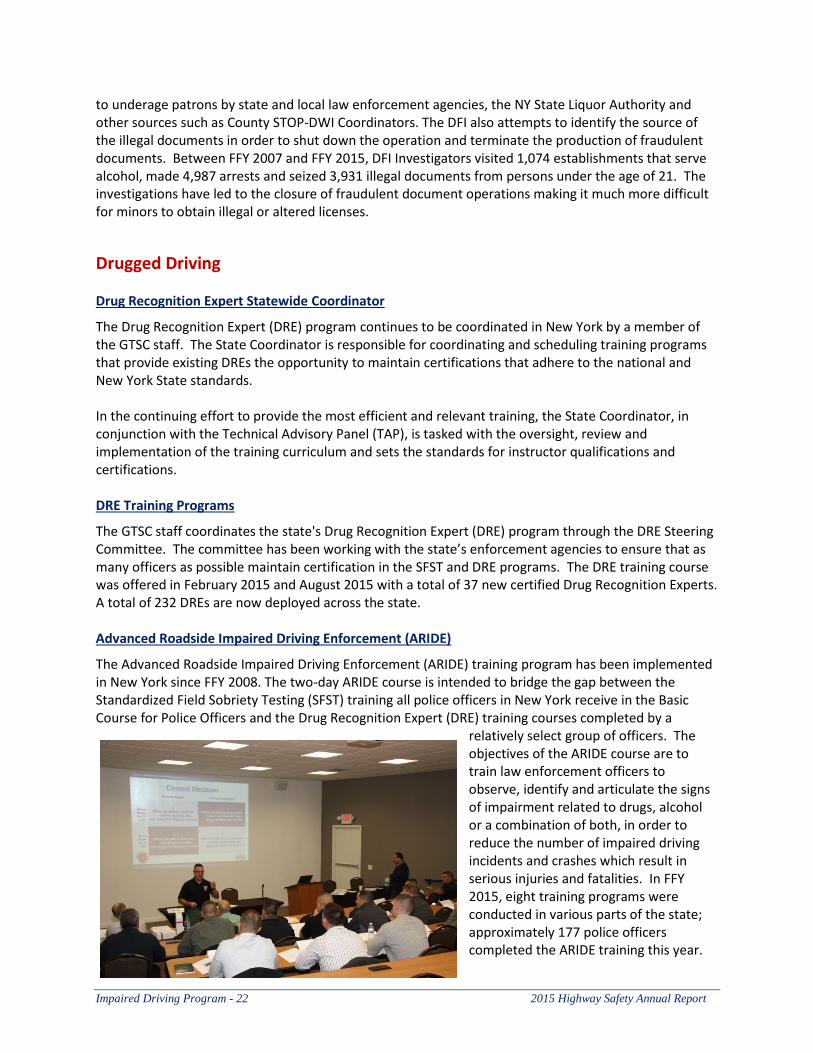
The Advanced Roadside Impaired Driving Enforcement (ARIDE) training program has been implemented in New York since FFY 2008. The two-day ARIDE course is intended to bridge the gap between the Standardized Field Sobriety Testing (SFST) training all police officers in New York receive in the Basic Course for Police Officers and the Drug Recognition Expert (DRE) training courses completed by a
relatively select group of officers. The objectives of the ARIDE course are to train law enforcement officers to observe, identify and articulate the signs of impairment related to drugs, alcohol or a combination of both, in order to reduce the number of impaired driving incidents and crashes which result in serious injuries and fatalities. In FFY 2015, eight training programs were conducted in various parts of the state; approximately 177 police officers completed the ARIDE training this year.
2015 Highway Safety Annual Report Impaired Driving Program - 23
Research, Evaluation and Analytical Support for New York’s Performance-Based Impaired Driving Program Institute for Traffic Safety Management and Research Impaired Driving Research Projects
Research Studies, Fact Sheets and Presentations In FFY 2015, the Institute for Traffic Safety Management and Research (ITSMR) compiled Fact Sheets on alcohol-related crashes (2010-2014) and drug-related crashes (2010-2014). These fact sheets are available on the ITSMR website (www.itsmr.org). In FFY 2015, ITSMR project staff also prepared and delivered several PowerPoint presentations on the topic of impaired driving. These presentations included: Drug Involvement in Crashes and Arrests on New York Roadways (NYS DDP Directors’ Association Annual Meeting, May 15, 2015); Impaired Driving in New York State: A Status Report (NYS Sixth Annual Ignition Interlock Manufacturers’ Conference, July 10, 2015); and Drug-Related Driving in New York State: A Status Report (NYS Advisory Council on Impaired Driving, July 23, 2015).
Enhancement of the Drug Recognition Expert (DRE) Data Entry and Management System ITSMR project staff continued work on the development of a DRE data entry and management system that is being used to conduct and monitor the DRE program. This system is being designed to capture data on officers who complete the DRE training and data on the drug evaluations conducted by these DREs. The DRE Data Entry and Management System has two primary components, a web-based application and an android application, that can be used by DREs in the field to submit their evaluations and corresponding toxicology results into the DRE database developed by ITSMR. By the end of FFY 2015, tablets had been distributed to 223 of New York’s 236 DREs for use in submitting their evaluations and toxicology results through the android application.
Training sessions in the use of the tablets were conducted by ITSMR in October (Batavia & Syracuse), December (Westchester), February (Long Island), August (Batavia) and September (Albany). In addition, two ITSMR staff participated in the practicum portion of the training provided to new DREs in Jacksonville, Florida in March and September. During the coming grant year, it is expected that the remaining 13 DREs will be given tablets and trained in their use. It is also expected that about 35 new DREs will be recruited and trained in FFY 2016. DRE Android Application Updates to the android application were completed and released in October 2014 (Versions 2.0.5 & 2.0.5.1) and July 2015 (Version 2.0.6). Patches to Version 2.0.6 were released on July 15 and July 23. To make both the tablet and its application as secure as possible, a number of security measures/features were identified and implemented, including 256 bit encryptions of the database and the messages going back forth between the tablet and the web. In addition, MobileIron software is being installed on each tablet enabling ITSMR’s technical staff to deploy, secure, monitor and manage the tablets in the field. A User Agreement form has been installed on the tablet requiring the DRE to agree to the terms of appropriate use before being allowed to log on. Staff has begun a re-write of the application to make it platform independent; this will enable the app to run on android, iOS and Windows platforms.
Impaired Driving Program - 24 2015 Highway Safety Annual Report
DRE Web-based Application Updates to the web application were issued in December 2014, March 2015 and May-August 2015. At the close of FFY 2015, Version 3.0.5 1237 was the most recent version being used. A User Agreement form was implemented with the May release (Version 3.0). A data dictionary for the DRE database was also prepared. Other States During FFY 2015, a number of states contacted ITSMR for information on the DRE tablet application and asked for an opportunity to try it out. As a result, in February, ITSMR staff provided demo versions of the DRE tablet and web-based applications to 10 other states (CA, KS, MA, MD, MT, PA, RI, TN, VT, and WV). In addition, with the support of the GTSC, ITSMR has customized the tablet application and set up separate databases for Vermont and West Virginia so that they can be included in ITSMR’s pilot test of the applications. ITSMR has provided training to both West Virginia and Vermont and the DRE tablet app is currently being used by the DREs in these two states. Evaluation of Leandra’s Law ITSMR completed its evaluation of Leandra’s Law designed to determine whether the expansion of the ignition interlock sanction is effective in reducing the incidence of impaired driving. In designing and implementing the study, ITSMR project staff faced two significant challenges. The first challenge was to select an appropriate measure of effectiveness. Based on a review of the available data, the number of convictions for alcohol-related traffic offenses was selected as the most appropriate measure since conviction data have been reliably and consistently reported over time; the number of alcohol-related crashes was selected as a second measure of effectiveness. The second challenge involved the selection of an appropriate comparison group. Drivers who were convicted of a misdemeanor or felony DWI (VTL 1192.2, 1192.2a and 1192.3) before Leandra’s Law was implemented were selected as the comparison group. As a result, the study included two groups of drivers: an Interlock Group and a Comparison Group. The data needed to address the above research question were obtained from three sources: 1) the NYS Department of Motor Vehicles driver license file, 2) the NYS Office of Probation and Correctional Alternatives (OPCA) quarterly reports on drivers sentenced to an ignition interlock device (IID) and 3) the four ignition interlock vendors who had contracts with New York State to install IIDs as of January 1, 2014 (Draeger, Intoxalock, LifeSafer and SmartStart). The primary objective of the analyses was to measure any differences between the Interlock Group and the Comparison Group with regard to their subsequent drinking and driving behavior. Two sets of analyses were conducted. The first set of analyses examined differences between the Interlock Group and the Comparison Group with regard to their demographic characteristics (age, gender and county), while the second set of analyses focused on differences between the Interlock Group and the Comparison Group with regard to their subsequent drinking and driving behavior. The driving history data for each driver included in the study were analyzed to determine whether a driver had been 1) reconvicted of a VTL 1192 impaired driving offense and/or 2) involved in a subsequent alcohol-related crash. For the Interlock Group, analyses were also conducted to determine whether a driver was convicted of a VTL 1198 offense; VTL 1198 covers violations related to the installation and operation of ignition interlock devices. The additional analyses related to VTL 1198 violations were designed to provide information to the OPCA, as well as the state’s traffic safety community, on the extent to which drivers sentenced to an IID circumvent the provisions of the ignition interlock law.
2015 Highway Safety Annual Report Police Traffic Services - 25
NYPD 31%
Other Local 26%
State Police 28%
County 15%
PROPORTION OF TICKETS ISSUED BY TYPE OF POLICE AGENCY: 2014
Sources: NYS TSLED and AA systems
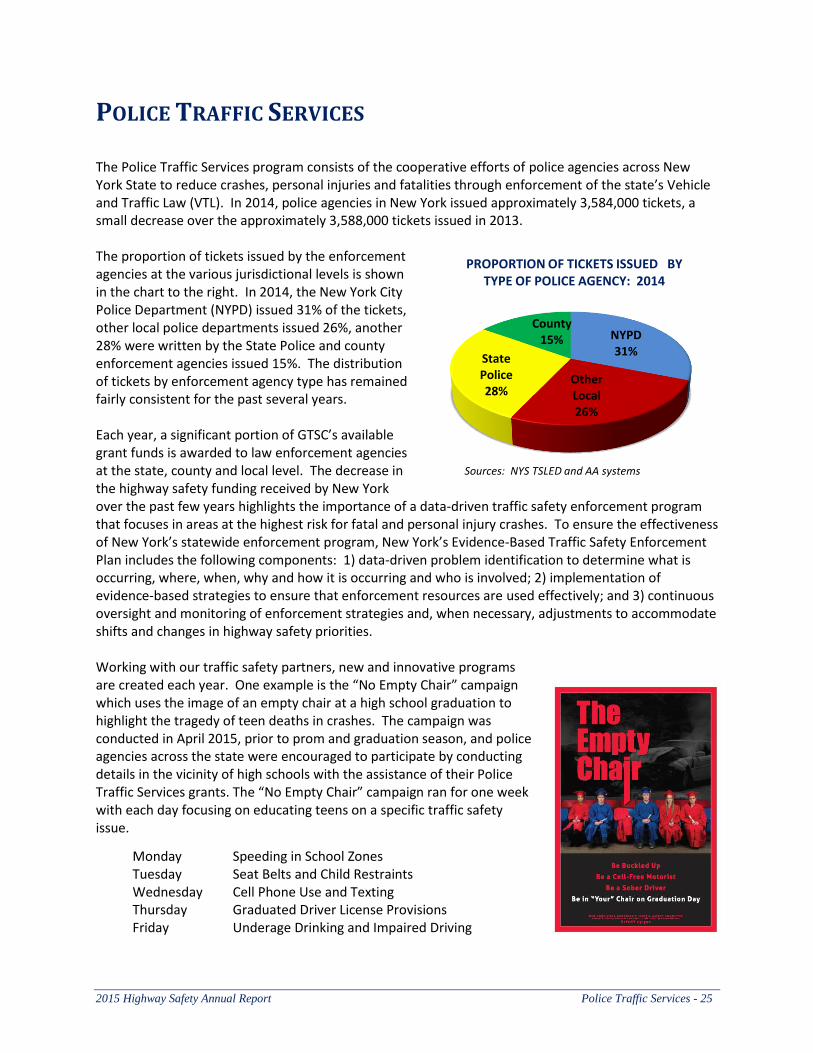
POLICE TRAFFIC SERVICES The Police Traffic Services program consists of the cooperative efforts of police agencies across New York State to reduce crashes, personal injuries and fatalities through enforcement of the state’s Vehicle and Traffic Law (VTL). In 2014, police agencies in New York issued approximately 3,584,000 tickets, a small decrease over the approximately 3,588,000 tickets issued in 2013. The proportion of tickets issued by the enforcement agencies at the various jurisdictional levels is shown in the chart to the right. In 2014, the New York City Police Department (NYPD) issued 31% of the tickets, other local police departments issued 26%, another 28% were written by the State Police and county enforcement agencies issued 15%. The distribution of tickets by enforcement agency type has remained fairly consistent for the past several years. Each year, a significant portion of GTSC’s available grant funds is awarded to law enforcement agencies at the state, county and local level. The decrease in the highway safety funding received by New York over the past few years highlights the importance of a data-driven traffic safety enforcement program that focuses in areas at the highest risk for fatal and personal injury crashes. To ensure the effectiveness of New York’s statewide enforcement program, New York’s Evidence-Based Traffic Safety Enforcement Plan includes the following components: 1) data-driven problem identification to determine what is occurring, where, when, why and how it is occurring and who is involved; 2) implementation of evidence-based strategies to ensure that enforcement resources are used effectively; and 3) continuous oversight and monitoring of enforcement strategies and, when necessary, adjustments to accommodate shifts and changes in highway safety priorities. Working with our traffic safety partners, new and innovative programs are created each year. One example is the “No Empty Chair” campaign which uses the image of an empty chair at a high school graduation to highlight the tragedy of teen deaths in crashes. The campaign was conducted in April 2015, prior to prom and graduation season, and police agencies across the state were encouraged to participate by conducting details in the vicinity of high schools with the assistance of their Police Traffic Services grants. The “No Empty Chair” campaign ran for one week with each day focusing on educating teens on a specific traffic safety issue.
Monday Speeding in School Zones Tuesday Seat Belts and Child Restraints Wednesday Cell Phone Use and Texting Thursday Graduated Driver License Provisions Friday Underage Drinking and Impaired Driving
Police Traffic Services - 26 2015 Highway Safety Annual Report
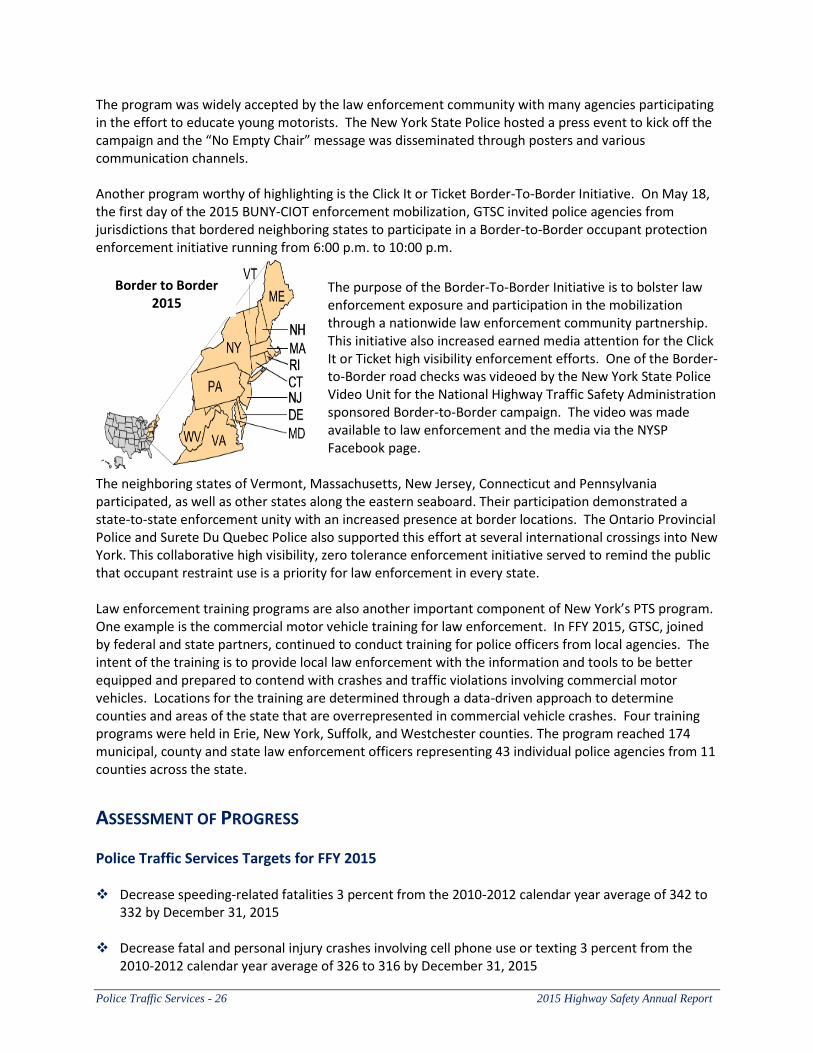
The program was widely accepted by the law enforcement community with many agencies participating in the effort to educate young motorists. The New York State Police hosted a press event to kick off the campaign and the “No Empty Chair” message was disseminated through posters and various communication channels. Another program worthy of highlighting is the Click It or Ticket Border-To-Border Initiative. On May 18, the first day of the 2015 BUNY-CIOT enforcement mobilization, GTSC invited police agencies from jurisdictions that bordered neighboring states to participate in a Border-to-Border occupant protection enforcement initiative running from 6:00 p.m. to 10:00 p.m.
The purpose of the Border-To-Border Initiative is to bolster law enforcement exposure and participation in the mobilization through a nationwide law enforcement community partnership. This initiative also increased earned media attention for the Click It or Ticket high visibility enforcement efforts. One of the Border-to-Border road checks was videoed by the New York State Police Video Unit for the National Highway Traffic Safety Administration sponsored Border-to-Border campaign. The video was made available to law enforcement and the media via the NYSP Facebook page.
The neighboring states of Vermont, Massachusetts, New Jersey, Connecticut and Pennsylvania participated, as well as other states along the eastern seaboard. Their participation demonstrated a state-to-state enforcement unity with an increased presence at border locations. The Ontario Provincial Police and Surete Du Quebec Police also supported this effort at several international crossings into New York. This collaborative high visibility, zero tolerance enforcement initiative served to remind the public that occupant restraint use is a priority for law enforcement in every state. Law enforcement training programs are also another important component of New York’s PTS program. One example is the commercial motor vehicle training for law enforcement. In FFY 2015, GTSC, joined by federal and state partners, continued to conduct training for police officers from local agencies. The intent of the training is to provide local law enforcement with the information and tools to be better equipped and prepared to contend with crashes and traffic violations involving commercial motor vehicles. Locations for the training are determined through a data-driven approach to determine counties and areas of the state that are overrepresented in commercial vehicle crashes. Four training programs were held in Erie, New York, Suffolk, and Westchester counties. The program reached 174 municipal, county and state law enforcement officers representing 43 individual police agencies from 11 counties across the state.
ASSESSMENT OF PROGRESS
Police Traffic Services Targets for FFY 2015 Decrease speeding-related fatalities 3 percent from the 2010-2012 calendar year average of 342 to
332 by December 31, 2015
Decrease fatal and personal injury crashes involving cell phone use or texting 3 percent from the 2010-2012 calendar year average of 326 to 316 by December 31, 2015
Border to Border 2015
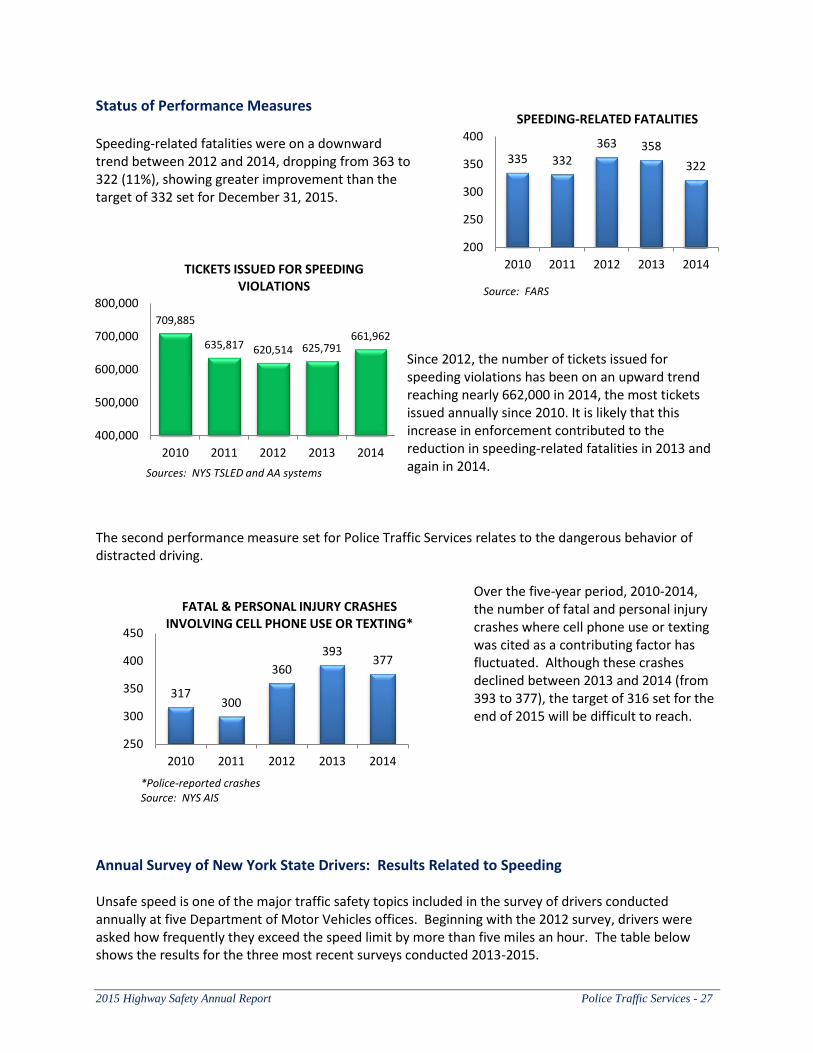
2015 Highway Safety Annual Report Police Traffic Services - 27
335 332
363 358
322
200
250
300
350
400
2010 2011 2012 2013 2014
SPEEDING-RELATED FATALITIES
Source: FARS
317 300
360
393 377
250
300
350
400
450
2010 2011 2012 2013 2014
FATAL & PERSONAL INJURY CRASHES INVOLVING CELL PHONE USE OR TEXTING*
*Police-reported crashes Source: NYS AIS
Status of Performance Measures Speeding-related fatalities were on a downward trend between 2012 and 2014, dropping from 363 to 322 (11%), showing greater improvement than the target of 332 set for December 31, 2015.
Since 2012, the number of tickets issued for speeding violations has been on an upward trend reaching nearly 662,000 in 2014, the most tickets issued annually since 2010. It is likely that this increase in enforcement contributed to the reduction in speeding-related fatalities in 2013 and again in 2014.
The second performance measure set for Police Traffic Services relates to the dangerous behavior of distracted driving.
Over the five-year period, 2010-2014, the number of fatal and personal injury crashes where cell phone use or texting was cited as a contributing factor has fluctuated. Although these crashes declined between 2013 and 2014 (from 393 to 377), the target of 316 set for the end of 2015 will be difficult to reach.
Annual Survey of New York State Drivers: Results Related to Speeding Unsafe speed is one of the major traffic safety topics included in the survey of drivers conducted annually at five Department of Motor Vehicles offices. Beginning with the 2012 survey, drivers were asked how frequently they exceed the speed limit by more than five miles an hour. The table below shows the results for the three most recent surveys conducted 2013-2015.
709,885
635,817 620,514 625,791 661,962
400,000
500,000
600,000
700,000
800,000
2010 2011 2012 2013 2014
TICKETS ISSUED FOR SPEEDING VIOLATIONS
Sources: NYS TSLED and AA systems
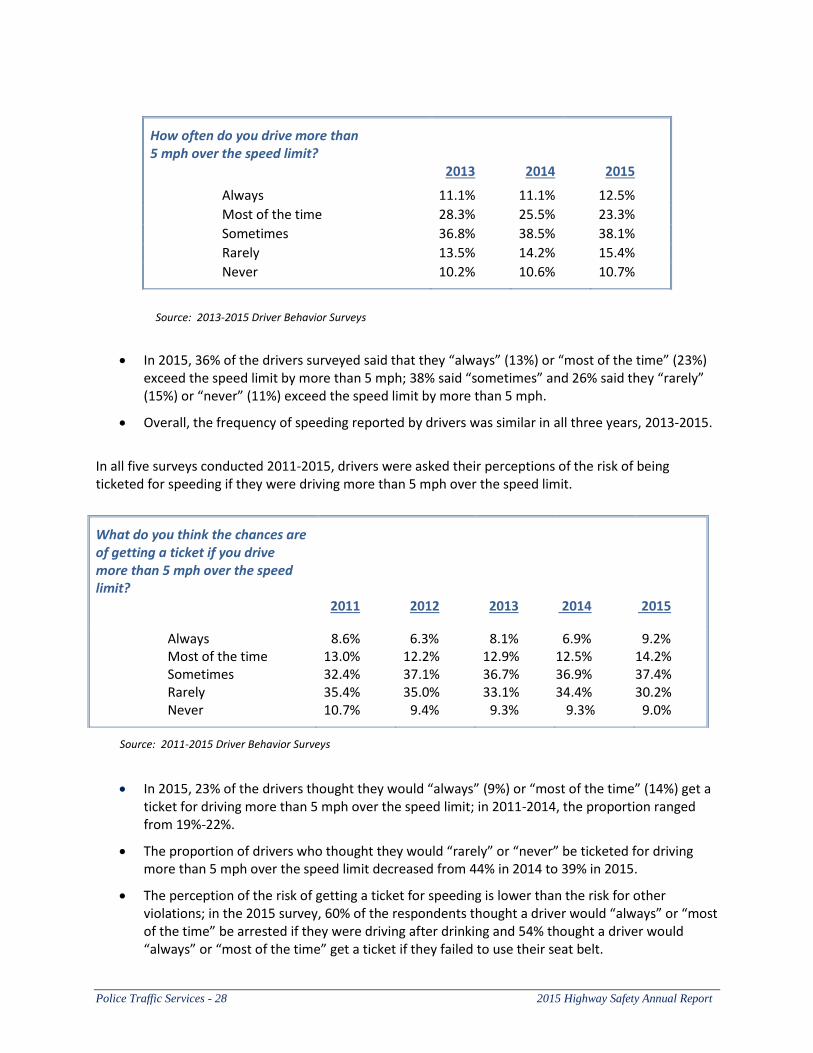
Police Traffic Services - 28 2015 Highway Safety Annual Report
Source: 2013-2015 Driver Behavior Surveys
In 2015, 36% of the drivers surveyed said that they “always” (13%) or “most of the time” (23%) exceed the speed limit by more than 5 mph; 38% said “sometimes” and 26% said they “rarely” (15%) or “never” (11%) exceed the speed limit by more than 5 mph.
Overall, the frequency of speeding reported by drivers was similar in all three years, 2013-2015.
In all five surveys conducted 2011-2015, drivers were asked their perceptions of the risk of being ticketed for speeding if they were driving more than 5 mph over the speed limit.
Source: 2011-2015 Driver Behavior Surveys
In 2015, 23% of the drivers thought they would “always” (9%) or “most of the time” (14%) get a ticket for driving more than 5 mph over the speed limit; in 2011-2014, the proportion ranged from 19%-22%.
The proportion of drivers who thought they would “rarely” or “never” be ticketed for driving more than 5 mph over the speed limit decreased from 44% in 2014 to 39% in 2015.
The perception of the risk of getting a ticket for speeding is lower than the risk for other violations; in the 2015 survey, 60% of the respondents thought a driver would “always” or “most of the time” be arrested if they were driving after drinking and 54% thought a driver would “always” or “most of the time” get a ticket if they failed to use their seat belt.
How often do you drive more than 5 mph over the speed limit?
2013 2014 2015
Always 11.1% 11.1% 12.5%
Most of the time 28.3% 25.5% 23.3%
Sometimes 36.8% 38.5% 38.1%
Rarely 13.5% 14.2% 15.4%
Never 10.2% 10.6% 10.7%
What do you think the chances are of getting a ticket if you drive more than 5 mph over the speed limit?
2011 2012 2013 2014 2015
Always 8.6% 6.3% 8.1% 6.9% 9.2% Most of the time 13.0% 12.2% 12.9% 12.5% 14.2% Sometimes 32.4% 37.1% 36.7% 36.9% 37.4% Rarely 35.4% 35.0% 33.1% 34.4% 30.2% Never 10.7% 9.4% 9.3% 9.3% 9.0%
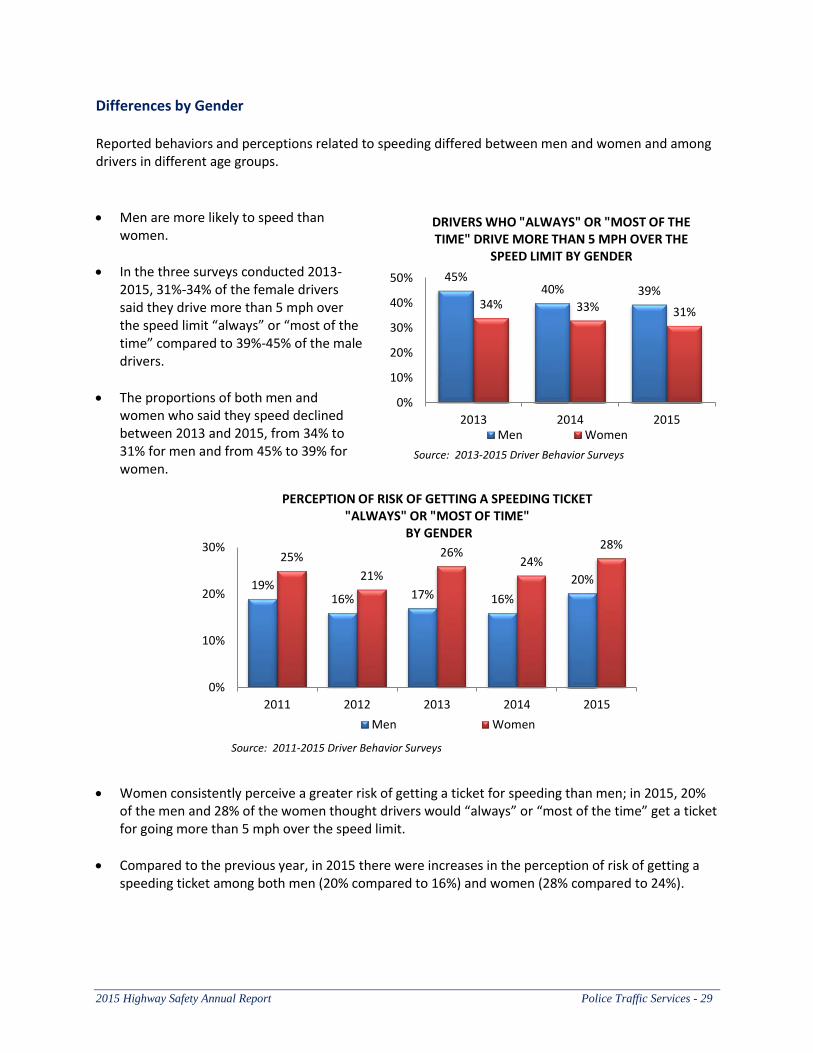
2015 Highway Safety Annual Report Police Traffic Services - 29
45% 40% 39%
34% 33% 31%
0%
10%
20%
30%
40%
50%
2013 2014 2015
DRIVERS WHO "ALWAYS" OR "MOST OF THE TIME" DRIVE MORE THAN 5 MPH OVER THE
SPEED LIMIT BY GENDER
Men Women
Source: 2013-2015 Driver Behavior Surveys
Differences by Gender Reported behaviors and perceptions related to speeding differed between men and women and among drivers in different age groups.
Men are more likely to speed than women.
In the three surveys conducted 2013-2015, 31%-34% of the female drivers said they drive more than 5 mph over the speed limit “always” or “most of the time” compared to 39%-45% of the male drivers.
The proportions of both men and women who said they speed declined between 2013 and 2015, from 34% to 31% for men and from 45% to 39% for women.
Women consistently perceive a greater risk of getting a ticket for speeding than men; in 2015, 20% of the men and 28% of the women thought drivers would “always” or “most of the time” get a ticket for going more than 5 mph over the speed limit.
Compared to the previous year, in 2015 there were increases in the perception of risk of getting a speeding ticket among both men (20% compared to 16%) and women (28% compared to 24%).
19% 16% 17% 16%
20%
25%
21%
26% 24%
28%
0%
10%
20%
30%
2011 2012 2013 2014 2015
PERCEPTION OF RISK OF GETTING A SPEEDING TICKET "ALWAYS" OR "MOST OF TIME"
BY GENDER
Men Women
Source: 2011-2015 Driver Behavior Surveys
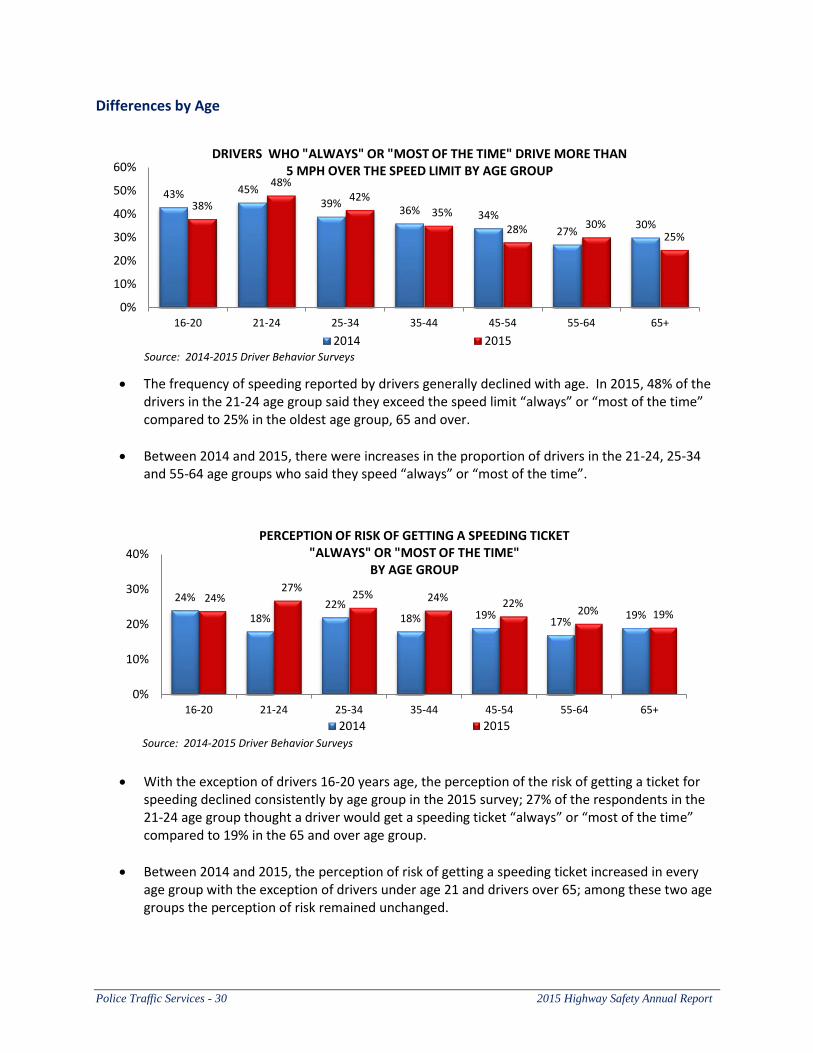
Police Traffic Services - 30 2015 Highway Safety Annual Report
Differences by Age
The frequency of speeding reported by drivers generally declined with age. In 2015, 48% of the
drivers in the 21-24 age group said they exceed the speed limit “always” or “most of the time” compared to 25% in the oldest age group, 65 and over.
Between 2014 and 2015, there were increases in the proportion of drivers in the 21-24, 25-34 and 55-64 age groups who said they speed “always” or “most of the time”.
With the exception of drivers 16-20 years age, the perception of the risk of getting a ticket for
speeding declined consistently by age group in the 2015 survey; 27% of the respondents in the 21-24 age group thought a driver would get a speeding ticket “always” or “most of the time” compared to 19% in the 65 and over age group.
Between 2014 and 2015, the perception of risk of getting a speeding ticket increased in every age group with the exception of drivers under age 21 and drivers over 65; among these two age groups the perception of risk remained unchanged.
43% 45% 39%
36% 34%
27% 30%
38%
48% 42%
35%
28% 30% 25%
0%
10%
20%
30%
40%
50%
60%
16-20 21-24 25-34 35-44 45-54 55-64 65+
DRIVERS WHO "ALWAYS" OR "MOST OF THE TIME" DRIVE MORE THAN 5 MPH OVER THE SPEED LIMIT BY AGE GROUP
2014 2015Source: 2014-2015 Driver Behavior Surveys
24%
18% 22%
18% 19% 17%
19%
24% 27%
25% 24% 22% 20% 19%
0%
10%
20%
30%
40%
16-20 21-24 25-34 35-44 45-54 55-64 65+
PERCEPTION OF RISK OF GETTING A SPEEDING TICKET "ALWAYS" OR "MOST OF THE TIME"
BY AGE GROUP
2014 2015
Source: 2014-2015 Driver Behavior Surveys
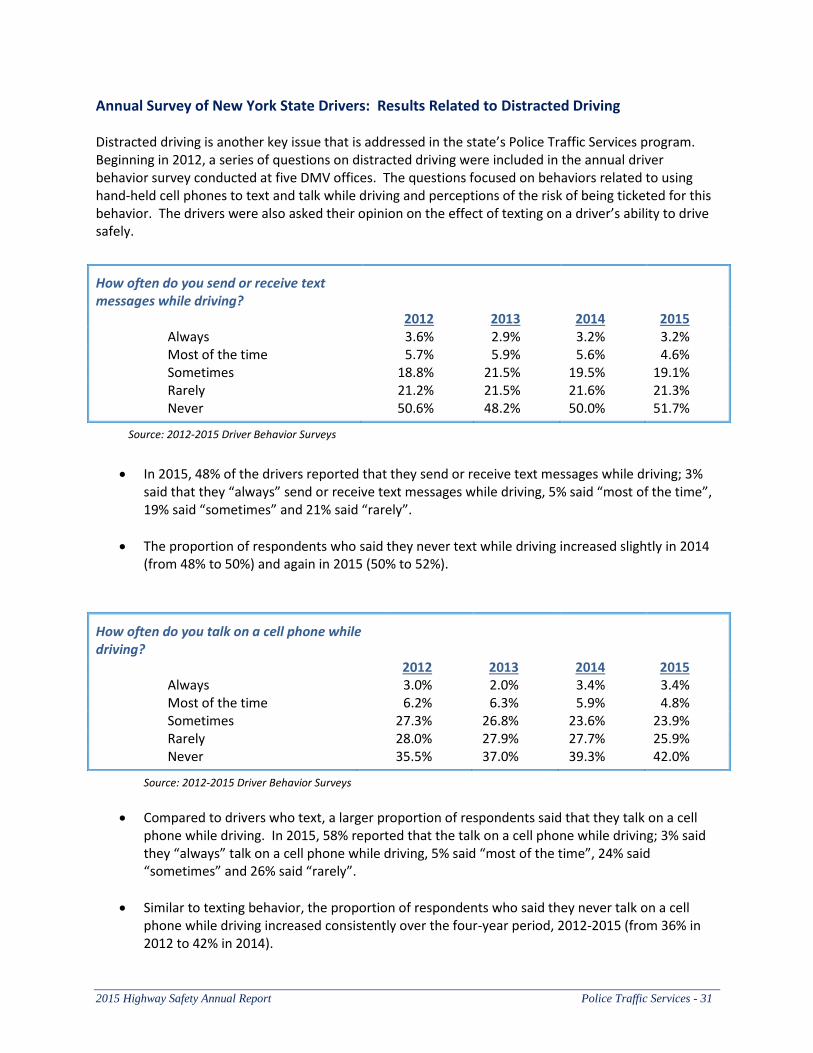
2015 Highway Safety Annual Report Police Traffic Services - 31
Annual Survey of New York State Drivers: Results Related to Distracted Driving Distracted driving is another key issue that is addressed in the state’s Police Traffic Services program. Beginning in 2012, a series of questions on distracted driving were included in the annual driver behavior survey conducted at five DMV offices. The questions focused on behaviors related to using hand-held cell phones to text and talk while driving and perceptions of the risk of being ticketed for this behavior. The drivers were also asked their opinion on the effect of texting on a driver’s ability to drive safely.
Source: 2012-2015 Driver Behavior Surveys
In 2015, 48% of the drivers reported that they send or receive text messages while driving; 3% said that they “always” send or receive text messages while driving, 5% said “most of the time”, 19% said “sometimes” and 21% said “rarely”.
The proportion of respondents who said they never text while driving increased slightly in 2014 (from 48% to 50%) and again in 2015 (50% to 52%).
Source: 2012-2015 Driver Behavior Surveys
Compared to drivers who text, a larger proportion of respondents said that they talk on a cell phone while driving. In 2015, 58% reported that the talk on a cell phone while driving; 3% said they “always” talk on a cell phone while driving, 5% said “most of the time”, 24% said “sometimes” and 26% said “rarely”.
Similar to texting behavior, the proportion of respondents who said they never talk on a cell phone while driving increased consistently over the four-year period, 2012-2015 (from 36% in 2012 to 42% in 2014).
How often do you send or receive text messages while driving?
2012 2013 2014 2015 Always 3.6% 2.9% 3.2% 3.2% Most of the time 5.7% 5.9% 5.6% 4.6% Sometimes 18.8% 21.5% 19.5% 19.1% Rarely 21.2% 21.5% 21.6% 21.3% Never 50.6% 48.2% 50.0% 51.7%
How often do you talk on a cell phone while driving?
2012 2013 2014 2015 Always 3.0% 2.0% 3.4% 3.4% Most of the time 6.2% 6.3% 5.9% 4.8% Sometimes 27.3% 26.8% 23.6% 23.9% Rarely 28.0% 27.9% 27.7% 25.9% Never 35.5% 37.0% 39.3% 42.0%
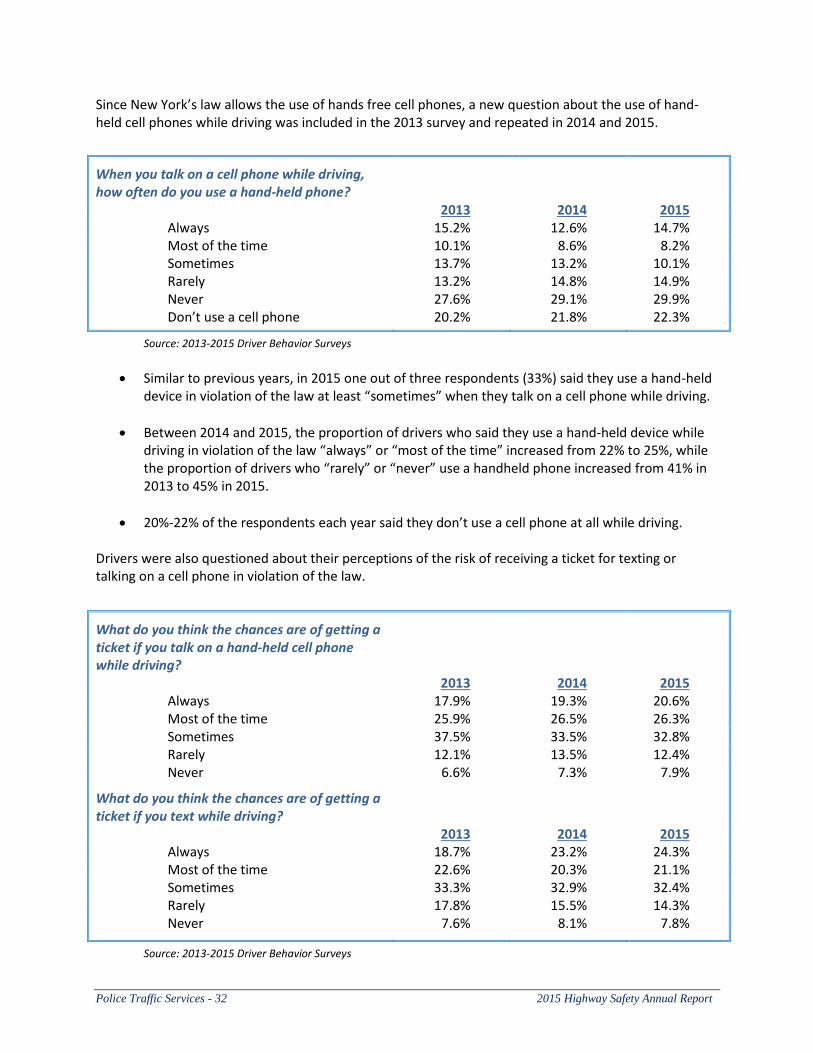
Police Traffic Services - 32 2015 Highway Safety Annual Report
Since New York’s law allows the use of hands free cell phones, a new question about the use of hand-held cell phones while driving was included in the 2013 survey and repeated in 2014 and 2015.
Source: 2013-2015 Driver Behavior Surveys
Similar to previous years, in 2015 one out of three respondents (33%) said they use a hand-held device in violation of the law at least “sometimes” when they talk on a cell phone while driving.
Between 2014 and 2015, the proportion of drivers who said they use a hand-held device while driving in violation of the law “always” or “most of the time” increased from 22% to 25%, while the proportion of drivers who “rarely” or “never” use a handheld phone increased from 41% in 2013 to 45% in 2015.
20%-22% of the respondents each year said they don’t use a cell phone at all while driving.
Drivers were also questioned about their perceptions of the risk of receiving a ticket for texting or talking on a cell phone in violation of the law.
Source: 2013-2015 Driver Behavior Surveys
When you talk on a cell phone while driving, how often do you use a hand-held phone?
2013 2014 2015 Always 15.2% 12.6% 14.7% Most of the time 10.1% 8.6% 8.2% Sometimes 13.7% 13.2% 10.1% Rarely 13.2% 14.8% 14.9% Never 27.6% 29.1% 29.9% Don’t use a cell phone 20.2% 21.8% 22.3%
What do you think the chances are of getting a ticket if you talk on a hand-held cell phone while driving?
2013 2014 2015 Always 17.9% 19.3% 20.6% Most of the time 25.9% 26.5% 26.3% Sometimes 37.5% 33.5% 32.8% Rarely 12.1% 13.5% 12.4% Never 6.6% 7.3% 7.9%
What do you think the chances are of getting a ticket if you text while driving?
2013 2014 2015 Always 18.7% 23.2% 24.3% Most of the time 22.6% 20.3% 21.1% Sometimes 33.3% 32.9% 32.4% Rarely 17.8% 15.5% 14.3% Never 7.6% 8.1% 7.8%
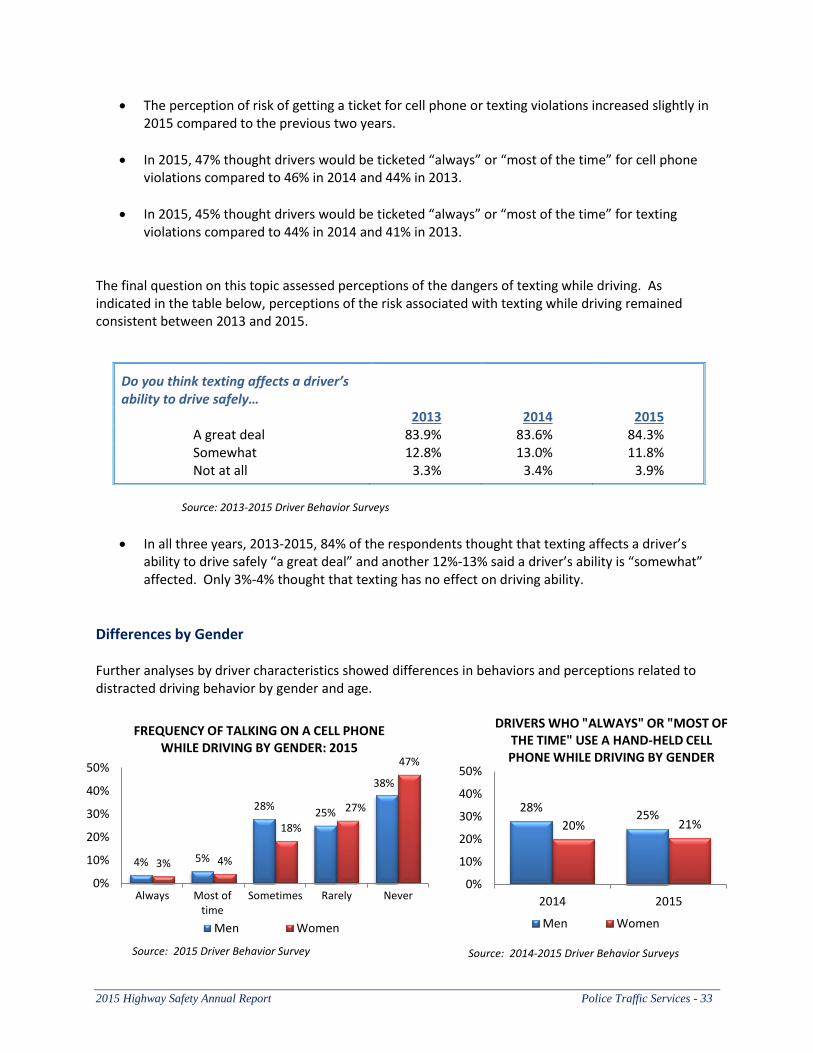
2015 Highway Safety Annual Report Police Traffic Services - 33
4% 5%
28% 25%
38%
3% 4%
18%
27%
47%
0%
10%
20%
30%
40%
50%
Always Most oftime
Sometimes Rarely Never
FREQUENCY OF TALKING ON A CELL PHONE WHILE DRIVING BY GENDER: 2015
Men Women
Source: 2015 Driver Behavior Survey
28% 25%
20% 21%
0%
10%
20%
30%
40%
50%
2014 2015
DRIVERS WHO "ALWAYS" OR "MOST OF THE TIME" USE A HAND-HELD CELL PHONE WHILE DRIVING BY GENDER
Men Women
Source: 2014-2015 Driver Behavior Surveys
The perception of risk of getting a ticket for cell phone or texting violations increased slightly in 2015 compared to the previous two years.
In 2015, 47% thought drivers would be ticketed “always” or “most of the time” for cell phone violations compared to 46% in 2014 and 44% in 2013.
In 2015, 45% thought drivers would be ticketed “always” or “most of the time” for texting violations compared to 44% in 2014 and 41% in 2013.
The final question on this topic assessed perceptions of the dangers of texting while driving. As indicated in the table below, perceptions of the risk associated with texting while driving remained consistent between 2013 and 2015.
Source: 2013-2015 Driver Behavior Surveys
In all three years, 2013-2015, 84% of the respondents thought that texting affects a driver’s
ability to drive safely “a great deal” and another 12%-13% said a driver’s ability is “somewhat” affected. Only 3%-4% thought that texting has no effect on driving ability.
Differences by Gender Further analyses by driver characteristics showed differences in behaviors and perceptions related to distracted driving behavior by gender and age.
Do you think texting affects a driver’s ability to drive safely…
2013 2014 2015 A great deal 83.9% 83.6% 84.3% Somewhat 12.8% 13.0% 11.8% Not at all 3.3% 3.4% 3.9%
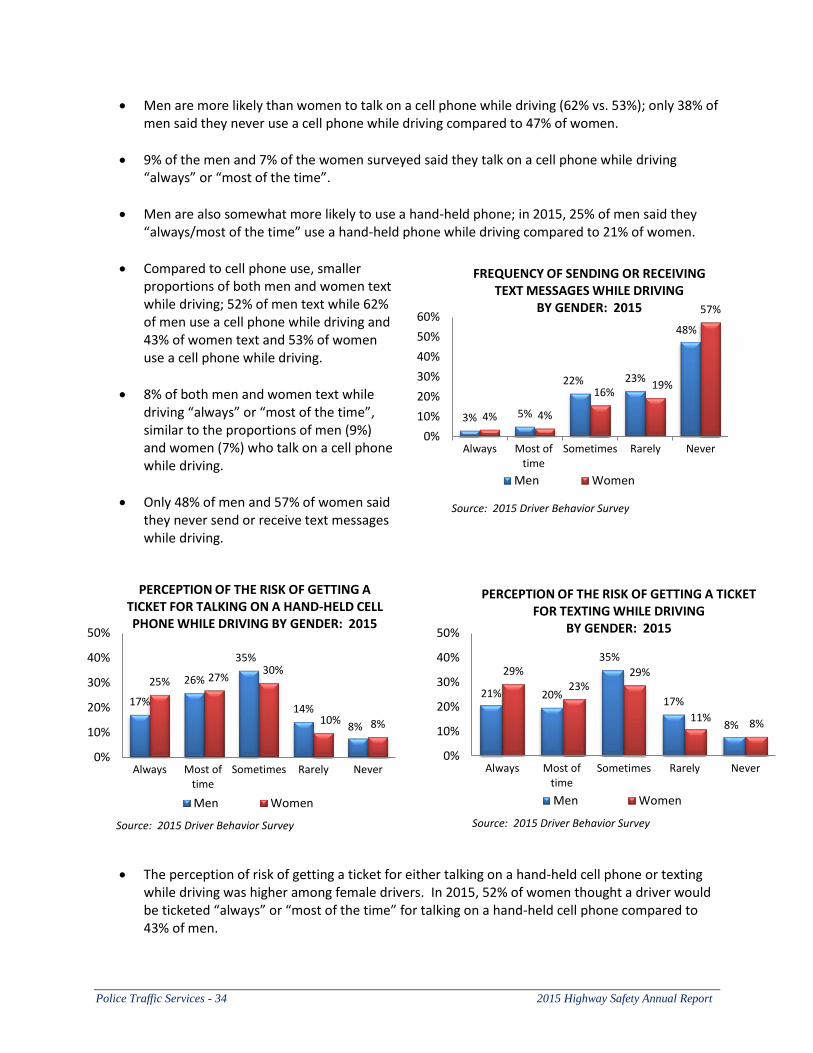
Police Traffic Services - 34 2015 Highway Safety Annual Report
21% 20%
35%
17%
8%
29%
23% 29%
11% 8%
0%
10%
20%
30%
40%
50%
Always Most oftime
Sometimes Rarely Never
PERCEPTION OF THE RISK OF GETTING A TICKET FOR TEXTING WHILE DRIVING
BY GENDER: 2015
Men Women
Source: 2015 Driver Behavior Survey
3% 5%
22% 23%
48%
4% 4%
16% 19%
57%
0%
10%
20%
30%
40%
50%
60%
Always Most oftime
Sometimes Rarely Never
FREQUENCY OF SENDING OR RECEIVING TEXT MESSAGES WHILE DRIVING
BY GENDER: 2015
Men Women
Source: 2015 Driver Behavior Survey
17%
26%
35%
14%
8%
25% 27% 30%
10% 8%
0%
10%
20%
30%
40%
50%
Always Most oftime
Sometimes Rarely Never
PERCEPTION OF THE RISK OF GETTING A TICKET FOR TALKING ON A HAND-HELD CELL PHONE WHILE DRIVING BY GENDER: 2015
Men Women
Source: 2015 Driver Behavior Survey
Men are more likely than women to talk on a cell phone while driving (62% vs. 53%); only 38% of men said they never use a cell phone while driving compared to 47% of women.
9% of the men and 7% of the women surveyed said they talk on a cell phone while driving “always” or “most of the time”.
Men are also somewhat more likely to use a hand-held phone; in 2015, 25% of men said they “always/most of the time” use a hand-held phone while driving compared to 21% of women.
Compared to cell phone use, smaller proportions of both men and women text while driving; 52% of men text while 62% of men use a cell phone while driving and 43% of women text and 53% of women use a cell phone while driving.
8% of both men and women text while driving “always” or “most of the time”, similar to the proportions of men (9%) and women (7%) who talk on a cell phone while driving.
Only 48% of men and 57% of women said they never send or receive text messages while driving.
The perception of risk of getting a ticket for either talking on a hand-held cell phone or texting while driving was higher among female drivers. In 2015, 52% of women thought a driver would be ticketed “always” or “most of the time” for talking on a hand-held cell phone compared to 43% of men.
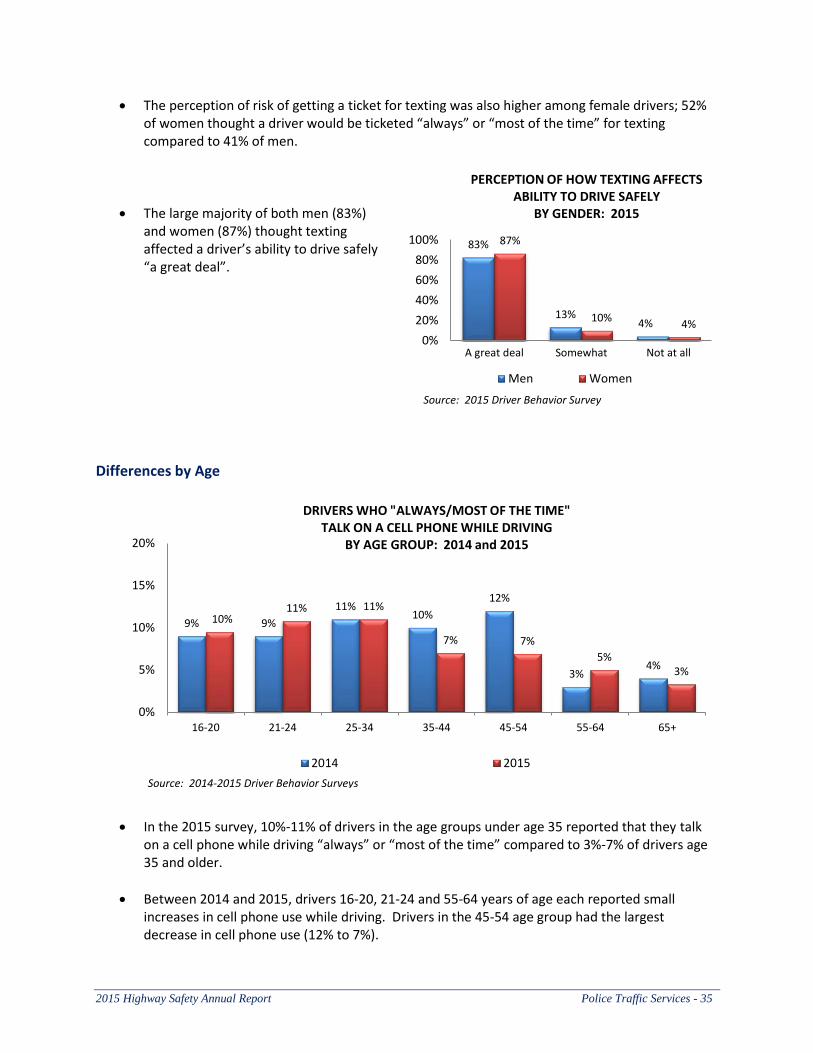
2015 Highway Safety Annual Report Police Traffic Services - 35
83%
13% 4%
87%
10% 4%
0%
20%
40%
60%
80%
100%
A great deal Somewhat Not at all
PERCEPTION OF HOW TEXTING AFFECTS ABILITY TO DRIVE SAFELY
BY GENDER: 2015
Men Women
Source: 2015 Driver Behavior Survey
The perception of risk of getting a ticket for texting was also higher among female drivers; 52% of women thought a driver would be ticketed “always” or “most of the time” for texting compared to 41% of men.
The large majority of both men (83%) and women (87%) thought texting affected a driver’s ability to drive safely “a great deal”.
Differences by Age
In the 2015 survey, 10%-11% of drivers in the age groups under age 35 reported that they talk on a cell phone while driving “always” or “most of the time” compared to 3%-7% of drivers age 35 and older.
Between 2014 and 2015, drivers 16-20, 21-24 and 55-64 years of age each reported small increases in cell phone use while driving. Drivers in the 45-54 age group had the largest decrease in cell phone use (12% to 7%).
9% 9%
11% 10%
12%
3% 4%
10% 11% 11%
7% 7%
5% 3%
0%
5%
10%
15%
20%
16-20 21-24 25-34 35-44 45-54 55-64 65+
DRIVERS WHO "ALWAYS/MOST OF THE TIME" TALK ON A CELL PHONE WHILE DRIVING
BY AGE GROUP: 2014 and 2015
2014 2015
Source: 2014-2015 Driver Behavior Surveys
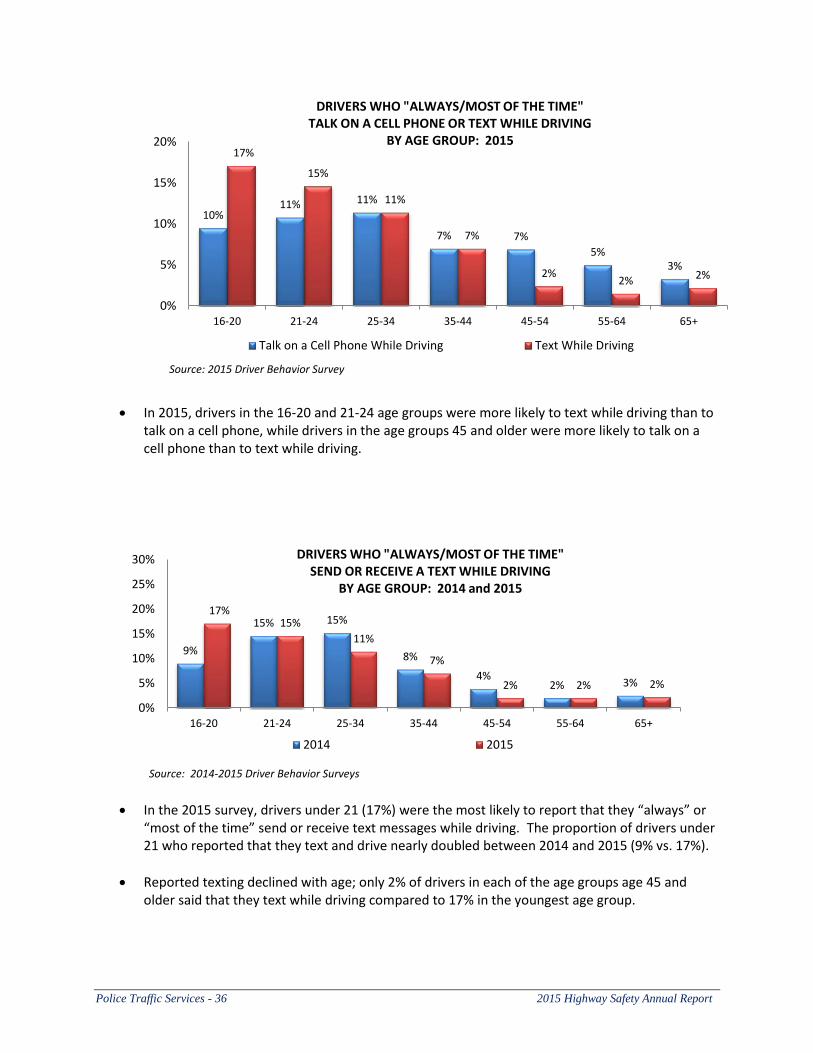
Police Traffic Services - 36 2015 Highway Safety Annual Report
In 2015, drivers in the 16-20 and 21-24 age groups were more likely to text while driving than to
talk on a cell phone, while drivers in the age groups 45 and older were more likely to talk on a cell phone than to text while driving.
In the 2015 survey, drivers under 21 (17%) were the most likely to report that they “always” or “most of the time” send or receive text messages while driving. The proportion of drivers under 21 who reported that they text and drive nearly doubled between 2014 and 2015 (9% vs. 17%).
Reported texting declined with age; only 2% of drivers in each of the age groups age 45 and older said that they text while driving compared to 17% in the youngest age group.
10% 11% 11%
7% 7%
5% 3%
17%
15%
11%
7%
2% 2% 2%
0%
5%
10%
15%
20%
16-20 21-24 25-34 35-44 45-54 55-64 65+
DRIVERS WHO "ALWAYS/MOST OF THE TIME" TALK ON A CELL PHONE OR TEXT WHILE DRIVING
BY AGE GROUP: 2015
Talk on a Cell Phone While Driving Text While Driving
Source: 2015 Driver Behavior Survey
9%
15% 15%
8%
4% 2% 3%
17% 15%
11%
7%
2% 2% 2%
0%
5%
10%
15%
20%
25%
30%
16-20 21-24 25-34 35-44 45-54 55-64 65+
DRIVERS WHO "ALWAYS/MOST OF THE TIME" SEND OR RECEIVE A TEXT WHILE DRIVING
BY AGE GROUP: 2014 and 2015
2014 2015
Source: 2014-2015 Driver Behavior Surveys
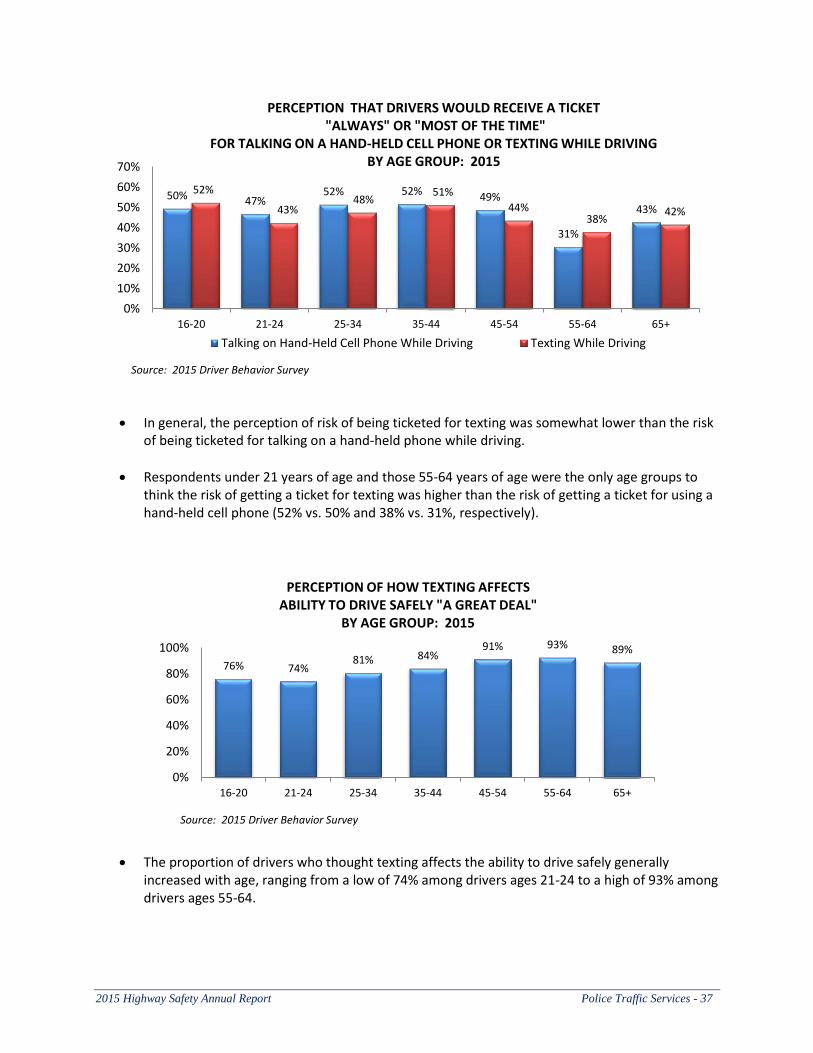
2015 Highway Safety Annual Report Police Traffic Services - 37
In general, the perception of risk of being ticketed for texting was somewhat lower than the risk of being ticketed for talking on a hand-held phone while driving.
Respondents under 21 years of age and those 55-64 years of age were the only age groups to think the risk of getting a ticket for texting was higher than the risk of getting a ticket for using a hand-held cell phone (52% vs. 50% and 38% vs. 31%, respectively).
The proportion of drivers who thought texting affects the ability to drive safely generally increased with age, ranging from a low of 74% among drivers ages 21-24 to a high of 93% among drivers ages 55-64.
50% 47% 52% 52% 49%
31%
43%
52%
43% 48%
51%
44% 38%
42%
0%
10%
20%
30%
40%
50%
60%
70%
16-20 21-24 25-34 35-44 45-54 55-64 65+
PERCEPTION THAT DRIVERS WOULD RECEIVE A TICKET "ALWAYS" OR "MOST OF THE TIME"
FOR TALKING ON A HAND-HELD CELL PHONE OR TEXTING WHILE DRIVING BY AGE GROUP: 2015
Talking on Hand-Held Cell Phone While Driving Texting While Driving
Source: 2015 Driver Behavior Survey
76% 74% 81% 84%
91% 93% 89%
0%
20%
40%
60%
80%
100%
16-20 21-24 25-34 35-44 45-54 55-64 65+
PERCEPTION OF HOW TEXTING AFFECTS ABILITY TO DRIVE SAFELY "A GREAT DEAL"
BY AGE GROUP: 2015
Source: 2015 Driver Behavior Survey
Police Traffic Services - 38 2015 Highway Safety Annual Report
POLICE TRAFFIC SERVICES PROJECTS AND ACTIVITIES FUNDED IN FFY 2015 New York used a data-driven approach to identify a comprehensive set of strategies for the state’s Police Traffic Services program that collectively will contribute to progress in meeting the state’s highway safety targets set in the FFY 2015 HSSP. The Police Traffic Services grant program provided funding to law enforcement agencies to conduct enforcement of the Vehicle and Traffic Law. This objective is consistent with New York State’s ongoing commitment to reduce motor vehicle crashes and their resulting injuries and fatalities. Included under the strategies listed below are descriptions of selected projects that highlight the activities undertaken. The complete list of projects implemented in FFY 2015 is included as Appendix A. The project title, number and amount of funds awarded are provided for each project.
Enforcement of Traffic Violations Traffic enforcement plays a vital role in New York’s efforts to reduce crashes, injuries and fatalities through the funding awarded to law enforcement agencies each year. The specific evidence-based strategies implemented by these agencies are described under the Police Traffic Services program, as well as under other program areas including impaired driving, occupant protection and motorcycle safety. Enforcement deployment strategies are continually evaluated and adjusted to accommodate shifts and changes in priorities identified through monitoring key measures. This data-driven approach ensures continued progress toward the established performance goals. Police Traffic Services Programs
Through its Police Traffic Services (PTS) grant program, the Governor’s Traffic Safety Committee continued to award both individual and county block grants in FFY 2015 to a large number of municipal and county police agencies. The streamlined PTS grant program combines the former Selective Traffic Enforcement Program (STEP) and Buckle Up New York (BUNY) programs and is designed to reduce crashes through targeted high visibility traffic law enforcement. PTS enforcement efforts are directed toward local traffic safety problems including, but not limited to, speeding, aggressive driving, distracted driving, motorcycle and pedestrian safety and occupant restraint use. All agencies receiving a PTS grant are required to participate in the 14-day national Click It or Ticket seat belt enforcement mobilization conducted in May of each year. Police agencies of all types and sizes, from the New York City Police Department with more than 30,000 sworn officers to small police departments staffed only by part-time personnel, may apply for PTS grants. A fairly sustained level of federal funding continued in FFY 2015, resulting in similar award amounts for most agencies. However, many agencies experienced contractually-required salary increases that further reduced the total hours of enforcement provided by the grants. Despite these issues, many participating law enforcement agencies continued to have a positive impact on traffic safety within their communities.
2015 Highway Safety Annual Report Police Traffic Services - 39
Examples of the projects funded under the PTS grant program in FFY 2015 are provided below.
The City of Batavia with a population of over 15,000 is the largest municipality in Genesee County; its location between the cities of Buffalo and Rochester and the high volume of commercial truck traffic entering and exiting the NYS Thruway compound its traffic safety concerns. During grant-funded patrols, Batavia police officers issued a total of 1,839 traffic tickets, an increase of 391 over the previous year and 330 over the three-year average (2012-2014). Increases in tickets for speeding (166), aggressive driving (348), distracted driving (29) and occupant restraint violations (42) accounted for the increase in total tickets. These enforcement efforts contributed to a decrease in personal injury crashes (102 in 2014 compared to 108 in 2013). In addition, no motor vehicle related fatalities have been reported in the past three-year period.
The Town of Brighton lies in a highly traveled traffic corridor of Monroe County at the southeast border of the City of Rochester. The Brighton Police Department identified speeding, aggressive driving and distracted driving as the leading contributing factors in crashes within its jurisdiction and used grant funds to conduct enforcement details targeting these violations. Over the three-year period, 2012-2014, the total number of tickets issued by the police department increased by 23% to 5,564; this included a 52% increase in speeding tickets (to 865) and a 57% increase in aggressive driving tickets (to 1,110). An average of 329 tickets were also issued each year for cell phone and texting violations. Over the three-year period, total reported crashes decreased by 10% and personal injury crashes decreased by 24%.
Chenango County is located in central New York and has a population of 50,000. Over the three-year period, 2012-2014, motor vehicle crashes have steadily declined; in 2014, personal injury crashes were at the lowest level on record (70). The Chenango County Sheriff’s Office receives grant funding to maintain this positive trend. Between April 1 and September 30, 2015, the Sheriff’s Office issued 8% more traffic tickets when compared with the same time period in 2014 and crashes decreased by 12%.
Delaware County is a rural county with a population of 48,000 located in the Southern Tier and Catskill Mountain region of New York. With the assistance of funding provided by the GTSC, the Delaware County Sheriff’s Office reports a 42% increase in the number of traffic tickets issued in 2014 compared to the previous year. In addition, there was a 20% decrease in total motor vehicle crashes and a 31% decrease in personal injury crashes. It was also reported that while on a grant- funded detail a deputy stopped a vehicle for speeding and after an investigation arrested the driver for Criminal Possession of a Controlled Substance 5th degree.
Located in Ontario County, the City of Canandaigua with a population of over 10,000 is served by a patrol force consisting of 13 fulltime and one part-time officer. The traffic problem in this jurisdiction is similar to many small municipalities where a state route, in this case four-lane State Route 323, runs through the center. State Routes 5 and 20 also intersect in close proximity to the busy business district. In 2014, the Canandaigua police agency issued 3,637 tickets, exceeding the previous year’s output by 884; speeding citations nearly doubled (from 794 to 1,499) and aggressive driving tickets increased from 43 to 367 in 2014. During 2014, 270 tickets were issued per patrol officer and the ratio of tickets to reported crashes was seven to one. In addition, only 10.5% of the crashes involved personal injury.
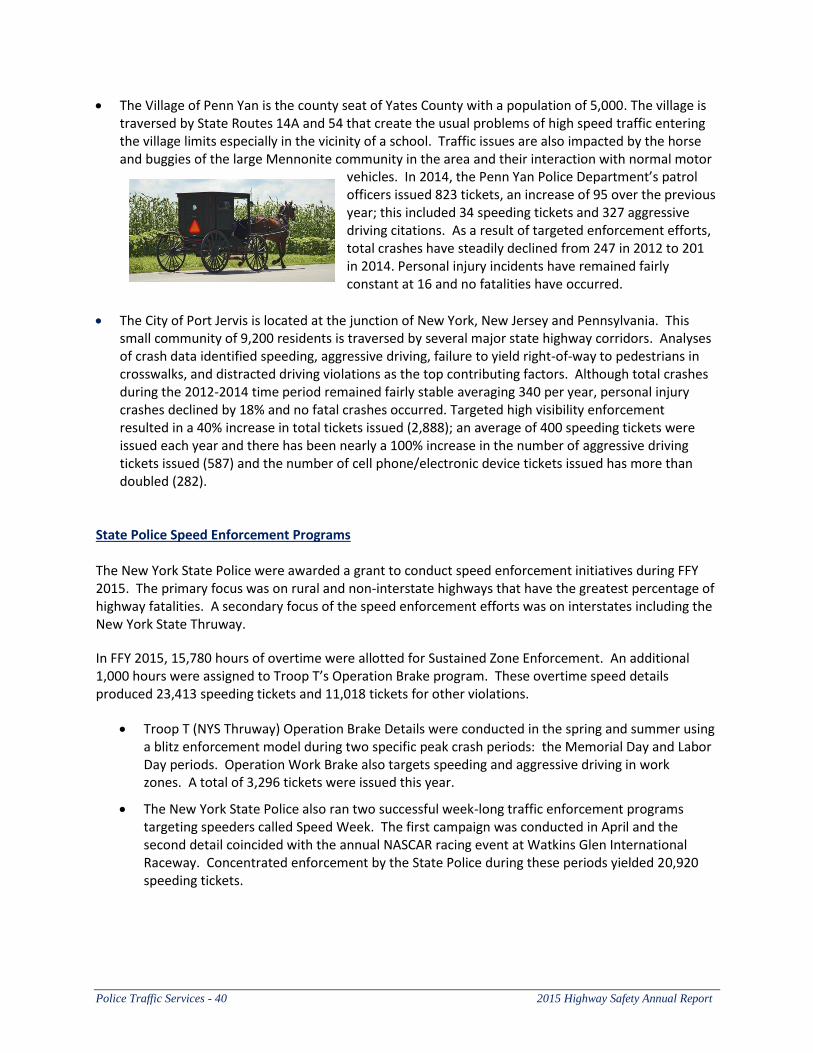
Police Traffic Services - 40 2015 Highway Safety Annual Report
The Village of Penn Yan is the county seat of Yates County with a population of 5,000. The village is traversed by State Routes 14A and 54 that create the usual problems of high speed traffic entering the village limits especially in the vicinity of a school. Traffic issues are also impacted by the horse and buggies of the large Mennonite community in the area and their interaction with normal motor
vehicles. In 2014, the Penn Yan Police Department’s patrol officers issued 823 tickets, an increase of 95 over the previous year; this included 34 speeding tickets and 327 aggressive driving citations. As a result of targeted enforcement efforts, total crashes have steadily declined from 247 in 2012 to 201 in 2014. Personal injury incidents have remained fairly constant at 16 and no fatalities have occurred.
The City of Port Jervis is located at the junction of New York, New Jersey and Pennsylvania. This small community of 9,200 residents is traversed by several major state highway corridors. Analyses of crash data identified speeding, aggressive driving, failure to yield right-of-way to pedestrians in crosswalks, and distracted driving violations as the top contributing factors. Although total crashes during the 2012-2014 time period remained fairly stable averaging 340 per year, personal injury crashes declined by 18% and no fatal crashes occurred. Targeted high visibility enforcement resulted in a 40% increase in total tickets issued (2,888); an average of 400 speeding tickets were issued each year and there has been nearly a 100% increase in the number of aggressive driving tickets issued (587) and the number of cell phone/electronic device tickets issued has more than doubled (282).
State Police Speed Enforcement Programs The New York State Police were awarded a grant to conduct speed enforcement initiatives during FFY 2015. The primary focus was on rural and non-interstate highways that have the greatest percentage of highway fatalities. A secondary focus of the speed enforcement efforts was on interstates including the New York State Thruway.
In FFY 2015, 15,780 hours of overtime were allotted for Sustained Zone Enforcement. An additional 1,000 hours were assigned to Troop T’s Operation Brake program. These overtime speed details produced 23,413 speeding tickets and 11,018 tickets for other violations.
Troop T (NYS Thruway) Operation Brake Details were conducted in the spring and summer using a blitz enforcement model during two specific peak crash periods: the Memorial Day and Labor Day periods. Operation Work Brake also targets speeding and aggressive driving in work zones. A total of 3,296 tickets were issued this year.
The New York State Police also ran two successful week-long traffic enforcement programs targeting speeders called Speed Week. The first campaign was conducted in April and the second detail coincided with the annual NASCAR racing event at Watkins Glen International Raceway. Concentrated enforcement by the State Police during these periods yielded 20,920 speeding tickets.
2015 Highway Safety Annual Report Police Traffic Services - 41
Sheriffs’ Cooperative Rural Traffic Safety Initiative In FFY 2015, GTSC supported the traffic law enforcement efforts of 15 Sheriffs’ Offices through a grant to the New York State Sheriffs’ Association (NYSSA). Sheriffs in the counties of Cayuga, Genesee, Livingston, Madison, Ontario, Orleans, Oswego, Saratoga, Schenectady, Seneca, Steuben, Washington, Wayne, Wyoming and Yates received funding for traditional Selective Traffic Enforcement Program (STEP) patrols. Support was also provided for preliminary Data Driven Approach to Crime and Traffic Safety (DDACTS) efforts in the Sheriffs’ Offices in Genesee, Livingston, Madison, Ontario and Wayne counties. Similar to a traditional STEP but more analytically based, DDACTS encourages the use of local crash and crime data to more efficiently deploy patrol units and is designed to promote flexibility in addressing local traffic safety problems. Although the funding is primarily used for enforcement, a portion of the funding is available to support other related traffic safety efforts. The following is a brief overview of the activity of selected counties participating in the project.
Cayuga County Sheriff’s Office: Deputies issued 250 tickets during the reporting period which equals GTSC’s suggested standard of one per funded hour. This was an increase of 61 (32%) total tickets over the same period last year. Speeding tickets increased by more than 100, equating to over a 300% increase compared to FFY 2014 and aggressive driving tickets increased by 17%. Crashes reported by this agency demonstrated measurable reductions; although fatal crashes remained constant at two, personal injury crashes fell by 64% and total reported crashes by 61%.
Livingston County Sheriff’s Office: During the project a total of 942 uniform traffic tickets were written during 612 hours of grant-funded patrol; this effort equates to 1.53 tickets per hour. The 942 total was an increase of 170 (22%) over the number of tickets written in the same period in FFY 2014. Of these tickets, 363 were issued for speeding, 98 for aggressive driving and 481 for other violations of the Vehicle and Traffic Law (VTL) and/or Transportation Law. Ten hours of specialized patrol were dedicated to Operation Safe Stop on April 16, 2014 and an additional four hours were assigned to school bus details on September 8, the first day of school. In addition to the VTL charges, ten Penal Law arrests were made including four involving drugs as a result of traffic stops. A total of 264 dedicated patrols were assigned to the 14 townships in the county during the grant period. Comparing the last half of FFY 2015 to the same period in FFY 2014, total crashes fell by 143, injury crashes by 26 and fatal crashes by seven.
Oswego County Sheriff’s Office: The 269 grant-funded hours used by the Oswego County Sheriff’s Office resulted in 311 tickets; compared to the previous year, fewer hour of enforcement were conducted but the number of tickets issued increased by 42. An average of 1.2 tickets were written per funded hour; 212 or 68% were written for speeding violations indicating that the radar units purchased with grant funding are being put to good use. It is also important to note that over 10% of the total tickets written were for a variety of violations related to traffic control devices and stop signs.
Saratoga County Sheriff’s Office: As a first-year recipient of GTSC grant funding, details deployed by the Saratoga County deputies made 247 traffic stops that resulted in 273 tickets issued. Of this total, 86 tickets were issued for speeding, 32 for cell phone/electronic device violations, five for seat belt violations, 33 for aggressive driving violations and 117 for other violations of the VTL.
Police Traffic Services - 42 2015 Highway Safety Annual Report
Wyoming County Sheriff’s Office: The Wyoming County Sheriff’s Office used its FFY 2015 allocation of grant funding to support 220 hours of traffic enforcement dedicated patrols. As a result of these efforts, 236 traffic tickets (over 1 per hour) were issued; 167 (71%) were issued for speeding, 22 (9%) for failure to obey a traffic control device, 11 for seat belt violations, four for cell phone/ electronic device violations and the remainder for other violations of the VTL. In addition to the tickets issued, 38 motorists were stopped and given verbal warnings.
New York State Police Distracted Driving Program During FFY 2015, the New York State Police conducted several successful initiatives related to distracted driving, in particular, enforcement of cell phone and texting violations. Over 5,000 hours of overtime were used to complete more than 820 distracted driving details around the state, resulting in the issuance of over 7,800 tickets for distracted driving and other Vehicle and Traffic Law violations. The State Police also conducted an additional distracted driving traffic enforcement program called Operation Hang Up. Motorists who use their cell phone and other electronic devices while driving are the focus of the program. In FFY 2015, Operation Hang Up was implemented during two time periods: November 27-30, 2014 and April 10-15, 2015. The two waves yielded 2,813 tickets for talking and texting while driving. Operation Safe Stop In New York State, it is estimated that 50,000 times each school day school buses are passed by motorists who fail to stop when the red lights are flashing. To reduce the frequency of this behavior and better protect children while they are in the process of getting on and off school buses, the GTSC, in conjunction with a number of other concerned agencies and organizations, developed the Operation
Safe Stop program. Operation Safe Stop brings together law enforcement and the pupil transportation community to keep our children safe during the loading and unloading of school buses. On April 16, 2015, a statewide Operation Safe Stop enforcement program was conducted to educate motorists on the dangers of passing stopped school buses. To promote this year’s Operation Safe Stop enforcement day, the New York Association for Pupil Transportation (NYAPT) held a statewide press event in Monroe
County on April 16, 2015. The event was hosted by the Rochester Area Transportation Supervisors’ Association. Peter Mannella, Executive Director of NYAPT; David Adam, President of NYAPT; Thomas A. Weeks, Chairman of the NYAPT Operation Safe Stop Committee and various representatives from law enforcement and the pupil transportation community spoke at the event.
TICKETS ISSUED BY STATE POLICE DURING DISTRACTED DRIVING DETAILS IN FFY 2015
VTL Violation 1225C (Cell Phone) 3,428
1225D (Texting) 1,074
Total 1225 C&D 4,502
Other VTL 3,318
Total 1225 & Other VTL 7,820
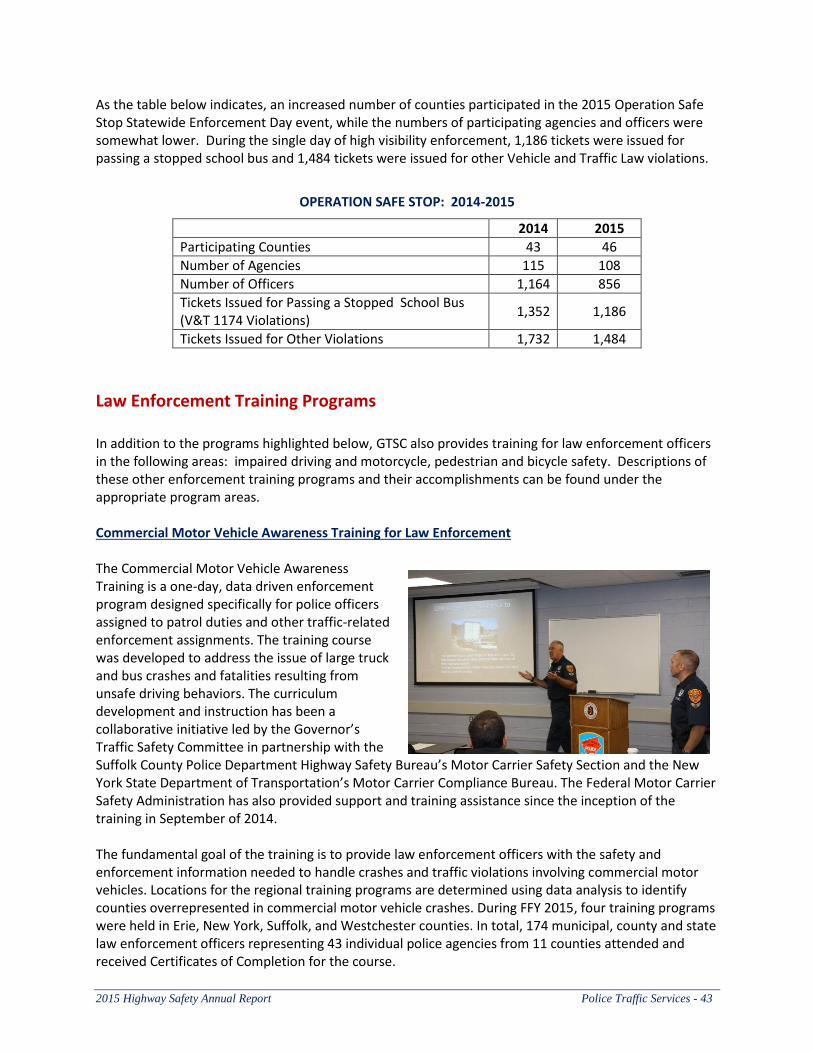
2015 Highway Safety Annual Report Police Traffic Services - 43
As the table below indicates, an increased number of counties participated in the 2015 Operation Safe Stop Statewide Enforcement Day event, while the numbers of participating agencies and officers were somewhat lower. During the single day of high visibility enforcement, 1,186 tickets were issued for passing a stopped school bus and 1,484 tickets were issued for other Vehicle and Traffic Law violations.
OPERATION SAFE STOP: 2014-2015
2014 2015
Participating Counties 43 46
Number of Agencies 115 108
Number of Officers 1,164 856
Tickets Issued for Passing a Stopped School Bus (V&T 1174 Violations)
1,352 1,186
Tickets Issued for Other Violations 1,732 1,484
Law Enforcement Training Programs In addition to the programs highlighted below, GTSC also provides training for law enforcement officers in the following areas: impaired driving and motorcycle, pedestrian and bicycle safety. Descriptions of these other enforcement training programs and their accomplishments can be found under the appropriate program areas. Commercial Motor Vehicle Awareness Training for Law Enforcement The Commercial Motor Vehicle Awareness Training is a one-day, data driven enforcement program designed specifically for police officers assigned to patrol duties and other traffic-related enforcement assignments. The training course was developed to address the issue of large truck and bus crashes and fatalities resulting from unsafe driving behaviors. The curriculum development and instruction has been a collaborative initiative led by the Governor’s Traffic Safety Committee in partnership with the Suffolk County Police Department Highway Safety Bureau’s Motor Carrier Safety Section and the New York State Department of Transportation’s Motor Carrier Compliance Bureau. The Federal Motor Carrier Safety Administration has also provided support and training assistance since the inception of the training in September of 2014. The fundamental goal of the training is to provide law enforcement officers with the safety and enforcement information needed to handle crashes and traffic violations involving commercial motor vehicles. Locations for the regional training programs are determined using data analysis to identify counties overrepresented in commercial motor vehicle crashes. During FFY 2015, four training programs were held in Erie, New York, Suffolk, and Westchester counties. In total, 174 municipal, county and state law enforcement officers representing 43 individual police agencies from 11 counties attended and received Certificates of Completion for the course.
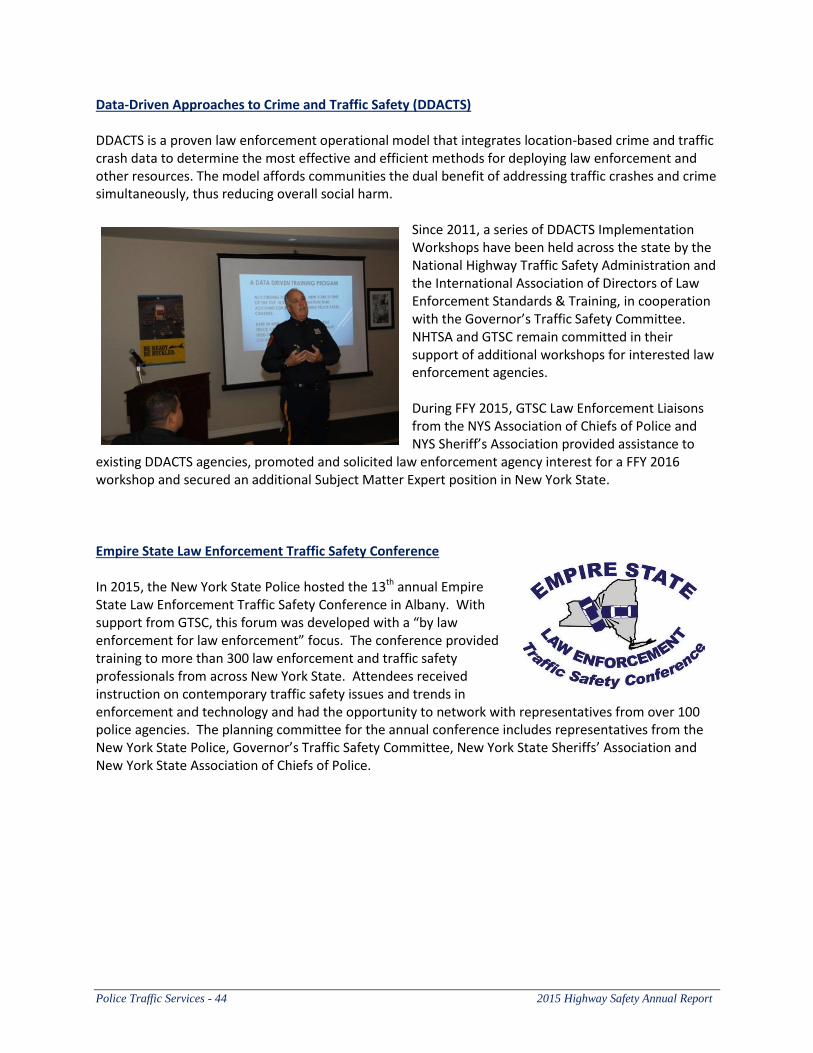
Police Traffic Services - 44 2015 Highway Safety Annual Report
Data-Driven Approaches to Crime and Traffic Safety (DDACTS) DDACTS is a proven law enforcement operational model that integrates location-based crime and traffic crash data to determine the most effective and efficient methods for deploying law enforcement and other resources. The model affords communities the dual benefit of addressing traffic crashes and crime simultaneously, thus reducing overall social harm.
Since 2011, a series of DDACTS Implementation Workshops have been held across the state by the National Highway Traffic Safety Administration and the International Association of Directors of Law Enforcement Standards & Training, in cooperation with the Governor’s Traffic Safety Committee. NHTSA and GTSC remain committed in their support of additional workshops for interested law enforcement agencies. During FFY 2015, GTSC Law Enforcement Liaisons from the NYS Association of Chiefs of Police and NYS Sheriff’s Association provided assistance to
existing DDACTS agencies, promoted and solicited law enforcement agency interest for a FFY 2016 workshop and secured an additional Subject Matter Expert position in New York State. Empire State Law Enforcement Traffic Safety Conference
In 2015, the New York State Police hosted the 13th annual Empire State Law Enforcement Traffic Safety Conference in Albany. With support from GTSC, this forum was developed with a “by law enforcement for law enforcement” focus. The conference provided training to more than 300 law enforcement and traffic safety professionals from across New York State. Attendees received instruction on contemporary traffic safety issues and trends in enforcement and technology and had the opportunity to network with representatives from over 100 police agencies. The planning committee for the annual conference includes representatives from the New York State Police, Governor’s Traffic Safety Committee, New York State Sheriffs’ Association and New York State Association of Chiefs of Police.
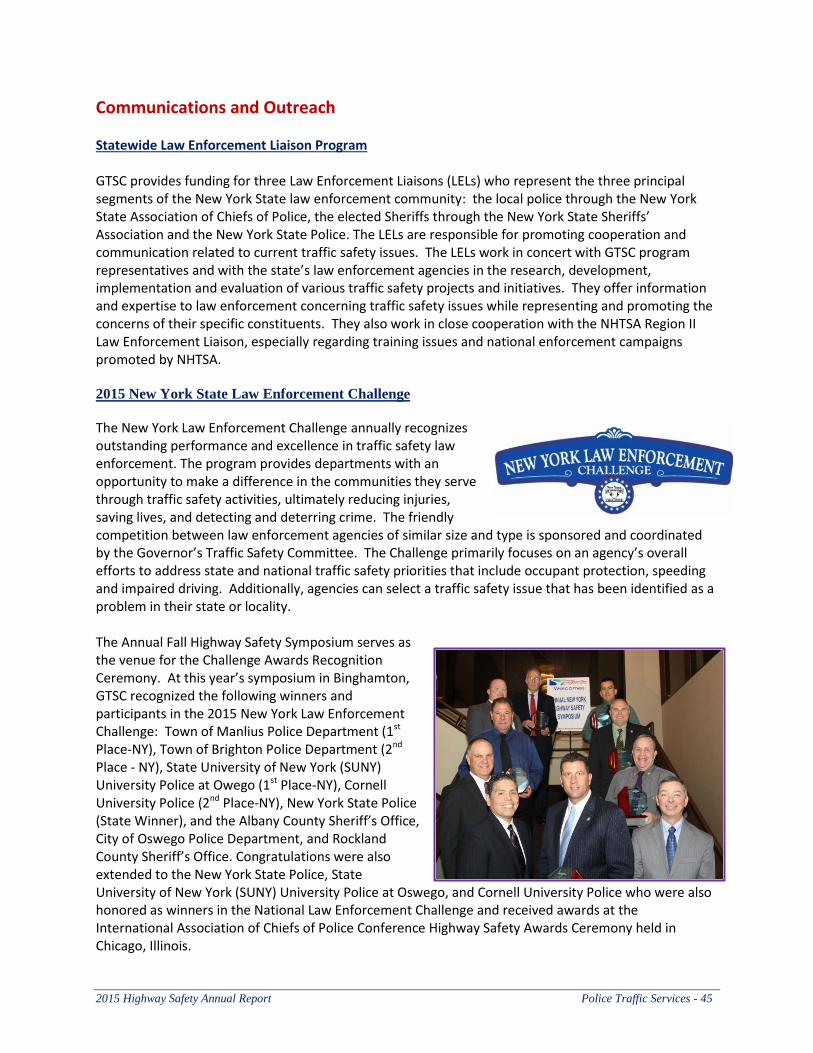
2015 Highway Safety Annual Report Police Traffic Services - 45
Communications and Outreach Statewide Law Enforcement Liaison Program GTSC provides funding for three Law Enforcement Liaisons (LELs) who represent the three principal segments of the New York State law enforcement community: the local police through the New York State Association of Chiefs of Police, the elected Sheriffs through the New York State Sheriffs’ Association and the New York State Police. The LELs are responsible for promoting cooperation and communication related to current traffic safety issues. The LELs work in concert with GTSC program representatives and with the state’s law enforcement agencies in the research, development, implementation and evaluation of various traffic safety projects and initiatives. They offer information and expertise to law enforcement concerning traffic safety issues while representing and promoting the concerns of their specific constituents. They also work in close cooperation with the NHTSA Region II Law Enforcement Liaison, especially regarding training issues and national enforcement campaigns promoted by NHTSA.
2015 New York State Law Enforcement Challenge
The New York Law Enforcement Challenge annually recognizes outstanding performance and excellence in traffic safety law enforcement. The program provides departments with an opportunity to make a difference in the communities they serve through traffic safety activities, ultimately reducing injuries, saving lives, and detecting and deterring crime. The friendly competition between law enforcement agencies of similar size and type is sponsored and coordinated by the Governor’s Traffic Safety Committee. The Challenge primarily focuses on an agency’s overall efforts to address state and national traffic safety priorities that include occupant protection, speeding and impaired driving. Additionally, agencies can select a traffic safety issue that has been identified as a problem in their state or locality. The Annual Fall Highway Safety Symposium serves as the venue for the Challenge Awards Recognition Ceremony. At this year’s symposium in Binghamton, GTSC recognized the following winners and participants in the 2015 New York Law Enforcement Challenge: Town of Manlius Police Department (1st Place-NY), Town of Brighton Police Department (2nd Place - NY), State University of New York (SUNY) University Police at Owego (1st Place-NY), Cornell University Police (2nd Place-NY), New York State Police (State Winner), and the Albany County Sheriff’s Office, City of Oswego Police Department, and Rockland County Sheriff’s Office. Congratulations were also extended to the New York State Police, State University of New York (SUNY) University Police at Oswego, and Cornell University Police who were also honored as winners in the National Law Enforcement Challenge and received awards at the International Association of Chiefs of Police Conference Highway Safety Awards Ceremony held in Chicago, Illinois.

Police Traffic Services - 46 2015 Highway Safety Annual Report
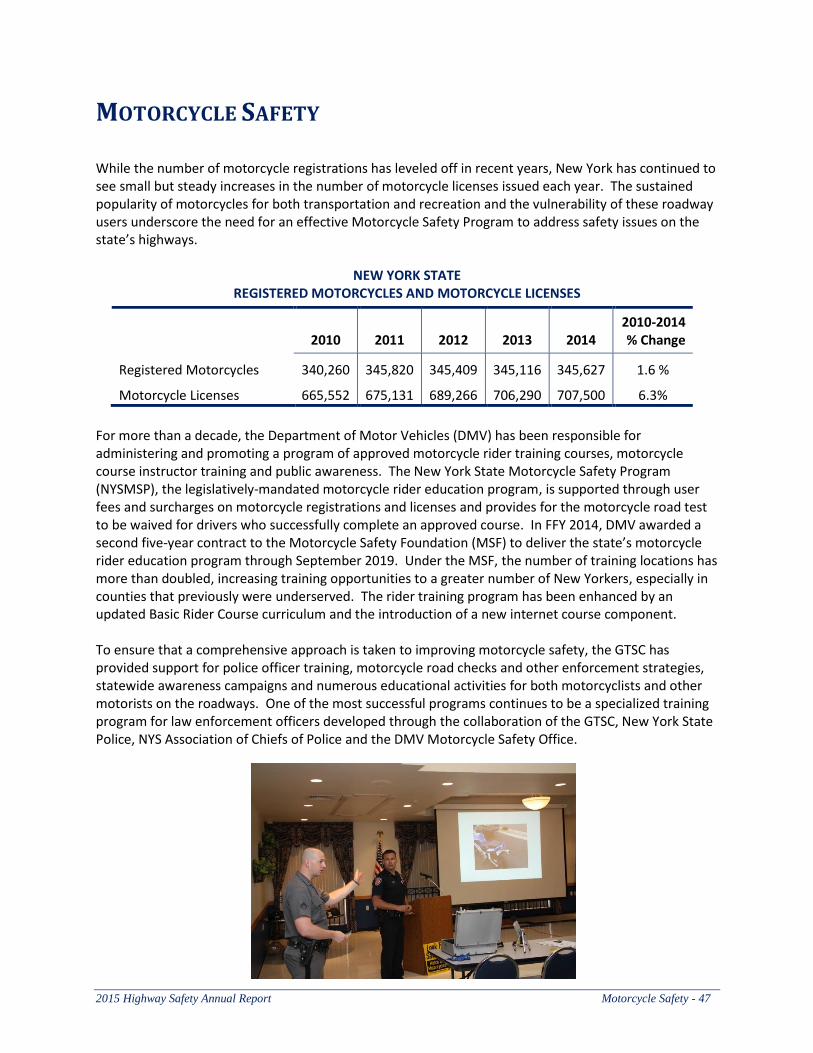
2015 Highway Safety Annual Report Motorcycle Safety - 47
MOTORCYCLE SAFETY While the number of motorcycle registrations has leveled off in recent years, New York has continued to see small but steady increases in the number of motorcycle licenses issued each year. The sustained popularity of motorcycles for both transportation and recreation and the vulnerability of these roadway users underscore the need for an effective Motorcycle Safety Program to address safety issues on the state’s highways.
NEW YORK STATE
REGISTERED MOTORCYCLES AND MOTORCYCLE LICENSES
2010 2011 2012 2013 2014 2010-2014 % Change
Registered Motorcycles 340,260 345,820 345,409 345,116 345,627 1.6 %
Motorcycle Licenses 665,552 675,131 689,266 706,290 707,500 6.3%
For more than a decade, the Department of Motor Vehicles (DMV) has been responsible for administering and promoting a program of approved motorcycle rider training courses, motorcycle course instructor training and public awareness. The New York State Motorcycle Safety Program (NYSMSP), the legislatively-mandated motorcycle rider education program, is supported through user fees and surcharges on motorcycle registrations and licenses and provides for the motorcycle road test to be waived for drivers who successfully complete an approved course. In FFY 2014, DMV awarded a second five-year contract to the Motorcycle Safety Foundation (MSF) to deliver the state’s motorcycle rider education program through September 2019. Under the MSF, the number of training locations has more than doubled, increasing training opportunities to a greater number of New Yorkers, especially in counties that previously were underserved. The rider training program has been enhanced by an updated Basic Rider Course curriculum and the introduction of a new internet course component. To ensure that a comprehensive approach is taken to improving motorcycle safety, the GTSC has provided support for police officer training, motorcycle road checks and other enforcement strategies, statewide awareness campaigns and numerous educational activities for both motorcyclists and other motorists on the roadways. One of the most successful programs continues to be a specialized training program for law enforcement officers developed through the collaboration of the GTSC, New York State Police, NYS Association of Chiefs of Police and the DMV Motorcycle Safety Office.
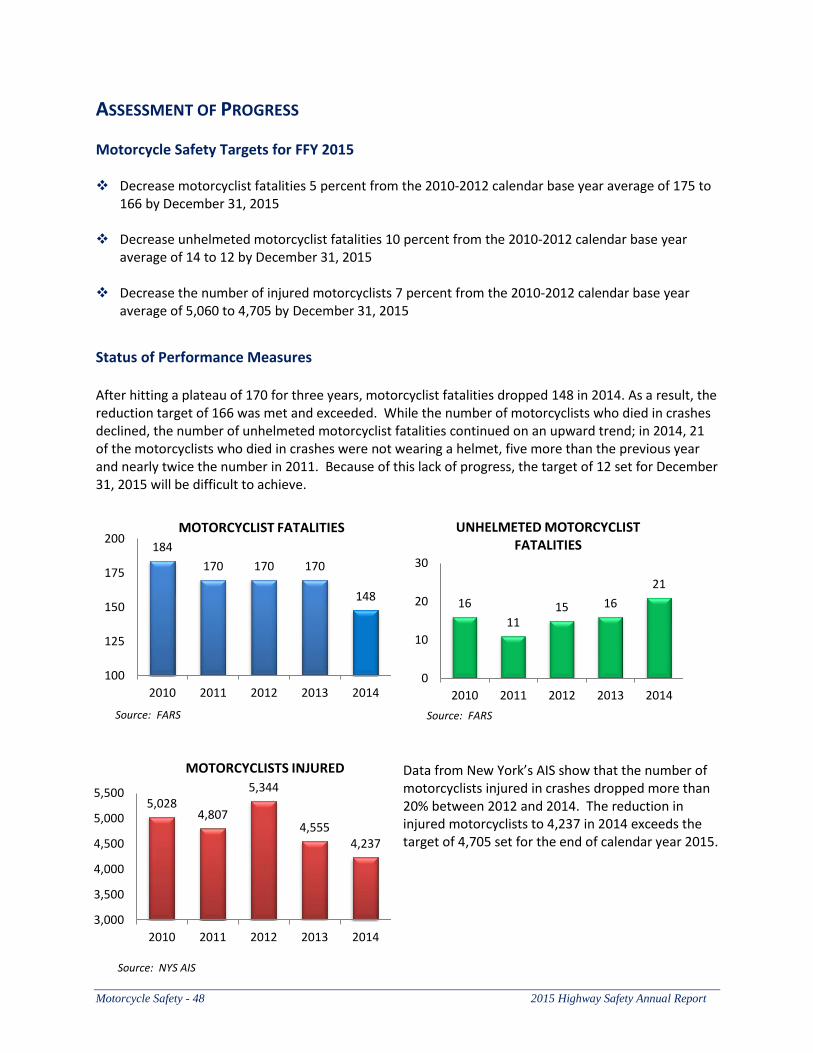
Motorcycle Safety - 48 2015 Highway Safety Annual Report
5,028 4,807
5,344
4,555 4,237
3,000
3,500
4,000
4,500
5,000
5,500
2010 2011 2012 2013 2014
MOTORCYCLISTS INJURED
Source: NYS AIS
ASSESSMENT OF PROGRESS
Motorcycle Safety Targets for FFY 2015
Decrease motorcyclist fatalities 5 percent from the 2010-2012 calendar base year average of 175 to 166 by December 31, 2015
Decrease unhelmeted motorcyclist fatalities 10 percent from the 2010-2012 calendar base year average of 14 to 12 by December 31, 2015
Decrease the number of injured motorcyclists 7 percent from the 2010-2012 calendar base year average of 5,060 to 4,705 by December 31, 2015
Status of Performance Measures After hitting a plateau of 170 for three years, motorcyclist fatalities dropped 148 in 2014. As a result, the reduction target of 166 was met and exceeded. While the number of motorcyclists who died in crashes declined, the number of unhelmeted motorcyclist fatalities continued on an upward trend; in 2014, 21 of the motorcyclists who died in crashes were not wearing a helmet, five more than the previous year and nearly twice the number in 2011. Because of this lack of progress, the target of 12 set for December 31, 2015 will be difficult to achieve.
Data from New York’s AIS show that the number of motorcyclists injured in crashes dropped more than 20% between 2012 and 2014. The reduction in injured motorcyclists to 4,237 in 2014 exceeds the target of 4,705 set for the end of calendar year 2015.
184
170 170 170
148
100
125
150
175
200
2010 2011 2012 2013 2014
MOTORCYCLIST FATALITIES
Source: FARS
16
11 15 16
21
0
10
20
30
2010 2011 2012 2013 2014
Source: FARS
UNHELMETED MOTORCYCLIST FATALITIES
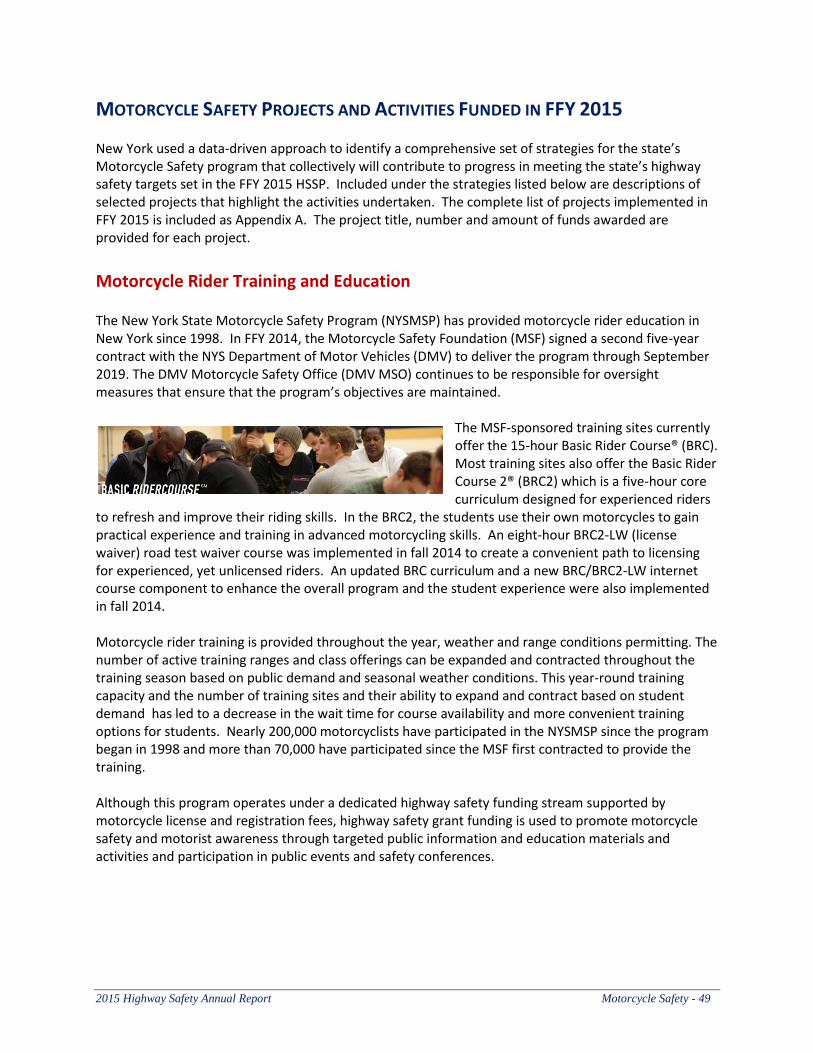
2015 Highway Safety Annual Report Motorcycle Safety - 49
MOTORCYCLE SAFETY PROJECTS AND ACTIVITIES FUNDED IN FFY 2015 New York used a data-driven approach to identify a comprehensive set of strategies for the state’s Motorcycle Safety program that collectively will contribute to progress in meeting the state’s highway safety targets set in the FFY 2015 HSSP. Included under the strategies listed below are descriptions of selected projects that highlight the activities undertaken. The complete list of projects implemented in FFY 2015 is included as Appendix A. The project title, number and amount of funds awarded are provided for each project.
Motorcycle Rider Training and Education The New York State Motorcycle Safety Program (NYSMSP) has provided motorcycle rider education in New York since 1998. In FFY 2014, the Motorcycle Safety Foundation (MSF) signed a second five-year contract with the NYS Department of Motor Vehicles (DMV) to deliver the program through September 2019. The DMV Motorcycle Safety Office (DMV MSO) continues to be responsible for oversight measures that ensure that the program’s objectives are maintained.
The MSF-sponsored training sites currently offer the 15-hour Basic Rider Course® (BRC). Most training sites also offer the Basic Rider Course 2® (BRC2) which is a five-hour core curriculum designed for experienced riders
to refresh and improve their riding skills. In the BRC2, the students use their own motorcycles to gain practical experience and training in advanced motorcycling skills. An eight-hour BRC2-LW (license waiver) road test waiver course was implemented in fall 2014 to create a convenient path to licensing for experienced, yet unlicensed riders. An updated BRC curriculum and a new BRC/BRC2-LW internet course component to enhance the overall program and the student experience were also implemented in fall 2014. Motorcycle rider training is provided throughout the year, weather and range conditions permitting. The number of active training ranges and class offerings can be expanded and contracted throughout the training season based on public demand and seasonal weather conditions. This year-round training capacity and the number of training sites and their ability to expand and contract based on student demand has led to a decrease in the wait time for course availability and more convenient training options for students. Nearly 200,000 motorcyclists have participated in the NYSMSP since the program began in 1998 and more than 70,000 have participated since the MSF first contracted to provide the training. Although this program operates under a dedicated highway safety funding stream supported by motorcycle license and registration fees, highway safety grant funding is used to promote motorcycle safety and motorist awareness through targeted public information and education materials and activities and participation in public events and safety conferences.
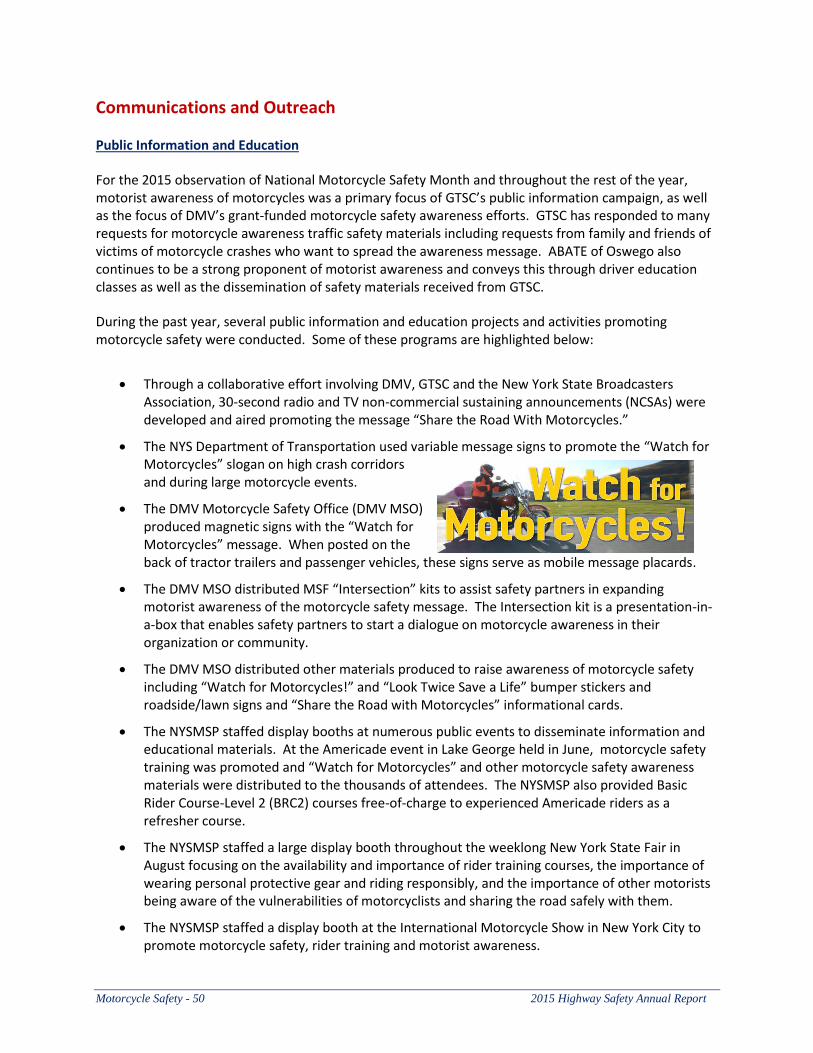
Motorcycle Safety - 50 2015 Highway Safety Annual Report
Communications and Outreach Public Information and Education
For the 2015 observation of National Motorcycle Safety Month and throughout the rest of the year, motorist awareness of motorcycles was a primary focus of GTSC’s public information campaign, as well as the focus of DMV’s grant-funded motorcycle safety awareness efforts. GTSC has responded to many requests for motorcycle awareness traffic safety materials including requests from family and friends of victims of motorcycle crashes who want to spread the awareness message. ABATE of Oswego also continues to be a strong proponent of motorist awareness and conveys this through driver education classes as well as the dissemination of safety materials received from GTSC.
During the past year, several public information and education projects and activities promoting motorcycle safety were conducted. Some of these programs are highlighted below:
Through a collaborative effort involving DMV, GTSC and the New York State Broadcasters Association, 30-second radio and TV non-commercial sustaining announcements (NCSAs) were developed and aired promoting the message “Share the Road With Motorcycles.”
The NYS Department of Transportation used variable message signs to promote the “Watch for Motorcycles” slogan on high crash corridors and during large motorcycle events.
The DMV Motorcycle Safety Office (DMV MSO) produced magnetic signs with the “Watch for Motorcycles” message. When posted on the back of tractor trailers and passenger vehicles, these signs serve as mobile message placards.
The DMV MSO distributed MSF “Intersection” kits to assist safety partners in expanding motorist awareness of the motorcycle safety message. The Intersection kit is a presentation-in-a-box that enables safety partners to start a dialogue on motorcycle awareness in their organization or community.
The DMV MSO distributed other materials produced to raise awareness of motorcycle safety including “Watch for Motorcycles!” and “Look Twice Save a Life” bumper stickers and roadside/lawn signs and “Share the Road with Motorcycles” informational cards.
The NYSMSP staffed display booths at numerous public events to disseminate information and educational materials. At the Americade event in Lake George held in June, motorcycle safety training was promoted and “Watch for Motorcycles” and other motorcycle safety awareness materials were distributed to the thousands of attendees. The NYSMSP also provided Basic Rider Course-Level 2 (BRC2) courses free-of-charge to experienced Americade riders as a refresher course.
The NYSMSP staffed a large display booth throughout the weeklong New York State Fair in August focusing on the availability and importance of rider training courses, the importance of wearing personal protective gear and riding responsibly, and the importance of other motorists being aware of the vulnerabilities of motorcyclists and sharing the road safely with them.
The NYSMSP staffed a display booth at the International Motorcycle Show in New York City to promote motorcycle safety, rider training and motorist awareness.
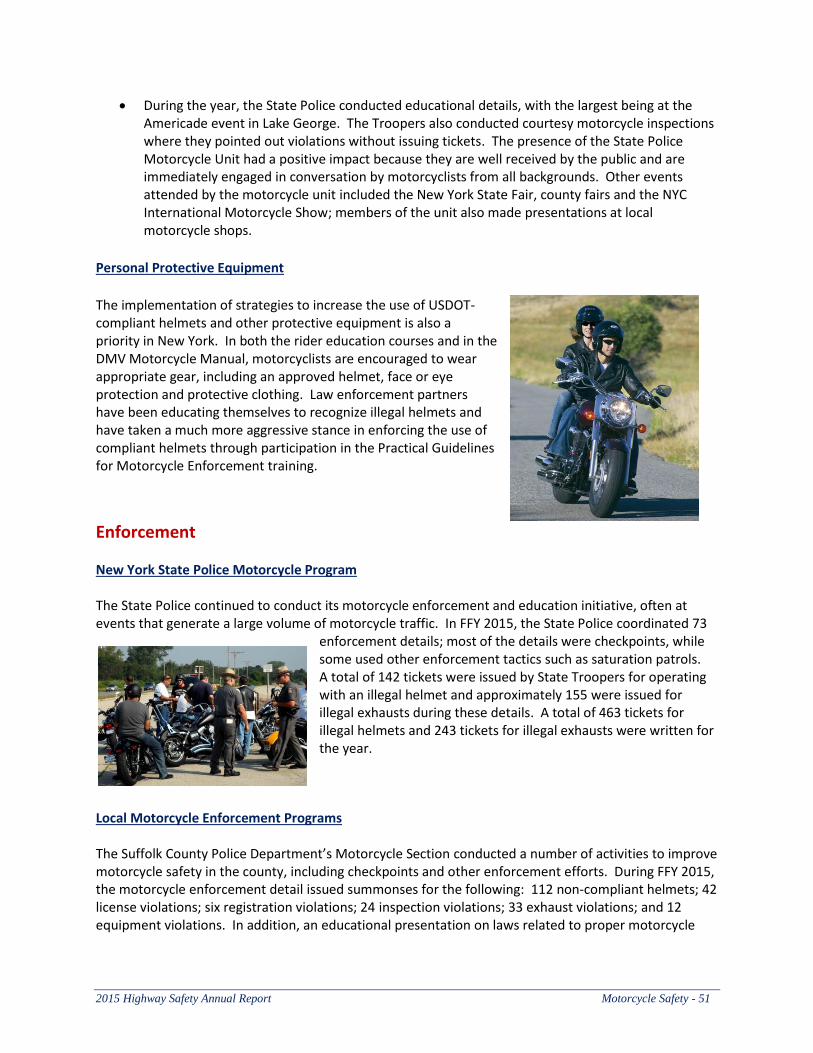
2015 Highway Safety Annual Report Motorcycle Safety - 51
During the year, the State Police conducted educational details, with the largest being at the Americade event in Lake George. The Troopers also conducted courtesy motorcycle inspections where they pointed out violations without issuing tickets. The presence of the State Police Motorcycle Unit had a positive impact because they are well received by the public and are immediately engaged in conversation by motorcyclists from all backgrounds. Other events attended by the motorcycle unit included the New York State Fair, county fairs and the NYC International Motorcycle Show; members of the unit also made presentations at local motorcycle shops.
Personal Protective Equipment
The implementation of strategies to increase the use of USDOT-compliant helmets and other protective equipment is also a priority in New York. In both the rider education courses and in the DMV Motorcycle Manual, motorcyclists are encouraged to wear appropriate gear, including an approved helmet, face or eye protection and protective clothing. Law enforcement partners have been educating themselves to recognize illegal helmets and have taken a much more aggressive stance in enforcing the use of compliant helmets through participation in the Practical Guidelines for Motorcycle Enforcement training.
Enforcement New York State Police Motorcycle Program The State Police continued to conduct its motorcycle enforcement and education initiative, often at events that generate a large volume of motorcycle traffic. In FFY 2015, the State Police coordinated 73
enforcement details; most of the details were checkpoints, while some used other enforcement tactics such as saturation patrols. A total of 142 tickets were issued by State Troopers for operating with an illegal helmet and approximately 155 were issued for illegal exhausts during these details. A total of 463 tickets for illegal helmets and 243 tickets for illegal exhausts were written for the year.
Local Motorcycle Enforcement Programs The Suffolk County Police Department’s Motorcycle Section conducted a number of activities to improve motorcycle safety in the county, including checkpoints and other enforcement efforts. During FFY 2015, the motorcycle enforcement detail issued summonses for the following: 112 non-compliant helmets; 42 license violations; six registration violations; 24 inspection violations; 33 exhaust violations; and 12 equipment violations. In addition, an educational presentation on laws related to proper motorcycle
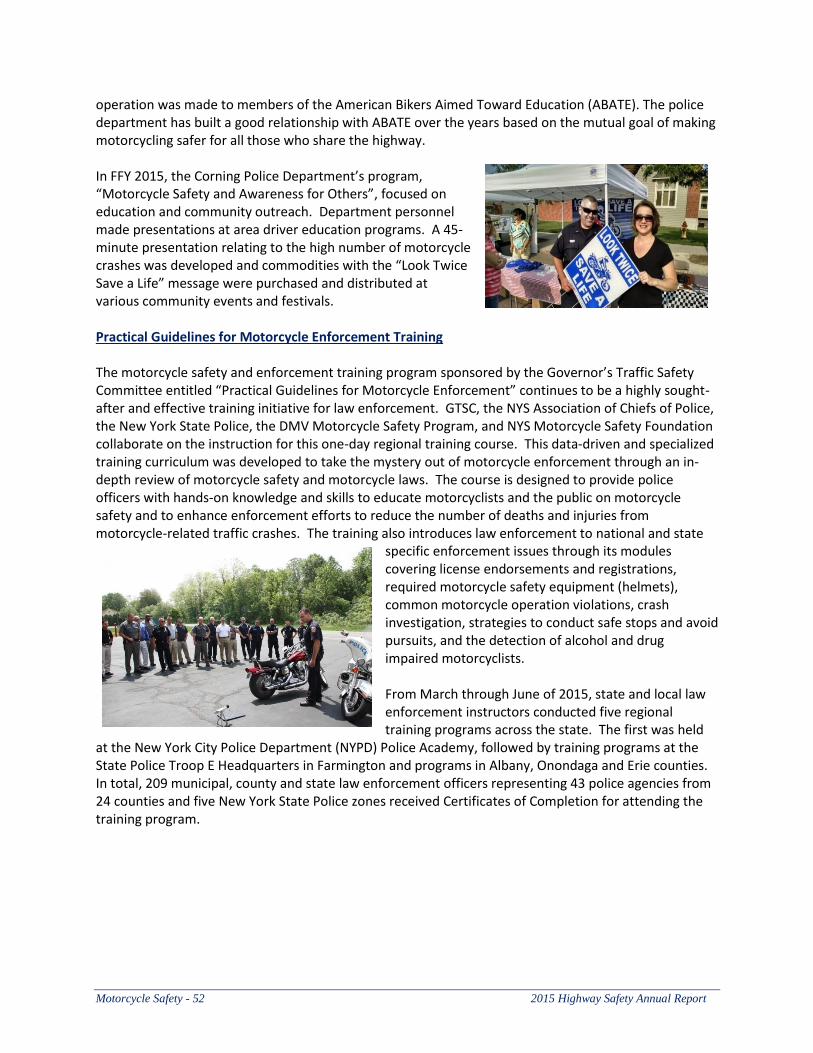
Motorcycle Safety - 52 2015 Highway Safety Annual Report
operation was made to members of the American Bikers Aimed Toward Education (ABATE). The police department has built a good relationship with ABATE over the years based on the mutual goal of making motorcycling safer for all those who share the highway.
In FFY 2015, the Corning Police Department’s program, “Motorcycle Safety and Awareness for Others”, focused on education and community outreach. Department personnel made presentations at area driver education programs. A 45-minute presentation relating to the high number of motorcycle crashes was developed and commodities with the “Look Twice Save a Life” message were purchased and distributed at various community events and festivals. Practical Guidelines for Motorcycle Enforcement Training The motorcycle safety and enforcement training program sponsored by the Governor’s Traffic Safety Committee entitled “Practical Guidelines for Motorcycle Enforcement” continues to be a highly sought-after and effective training initiative for law enforcement. GTSC, the NYS Association of Chiefs of Police, the New York State Police, the DMV Motorcycle Safety Program, and NYS Motorcycle Safety Foundation collaborate on the instruction for this one-day regional training course. This data-driven and specialized training curriculum was developed to take the mystery out of motorcycle enforcement through an in-depth review of motorcycle safety and motorcycle laws. The course is designed to provide police officers with hands-on knowledge and skills to educate motorcyclists and the public on motorcycle safety and to enhance enforcement efforts to reduce the number of deaths and injuries from motorcycle-related traffic crashes. The training also introduces law enforcement to national and state
specific enforcement issues through its modules covering license endorsements and registrations, required motorcycle safety equipment (helmets), common motorcycle operation violations, crash investigation, strategies to conduct safe stops and avoid pursuits, and the detection of alcohol and drug impaired motorcyclists. From March through June of 2015, state and local law enforcement instructors conducted five regional training programs across the state. The first was held
at the New York City Police Department (NYPD) Police Academy, followed by training programs at the State Police Troop E Headquarters in Farmington and programs in Albany, Onondaga and Erie counties. In total, 209 municipal, county and state law enforcement officers representing 43 police agencies from 24 counties and five New York State Police zones received Certificates of Completion for attending the training program.
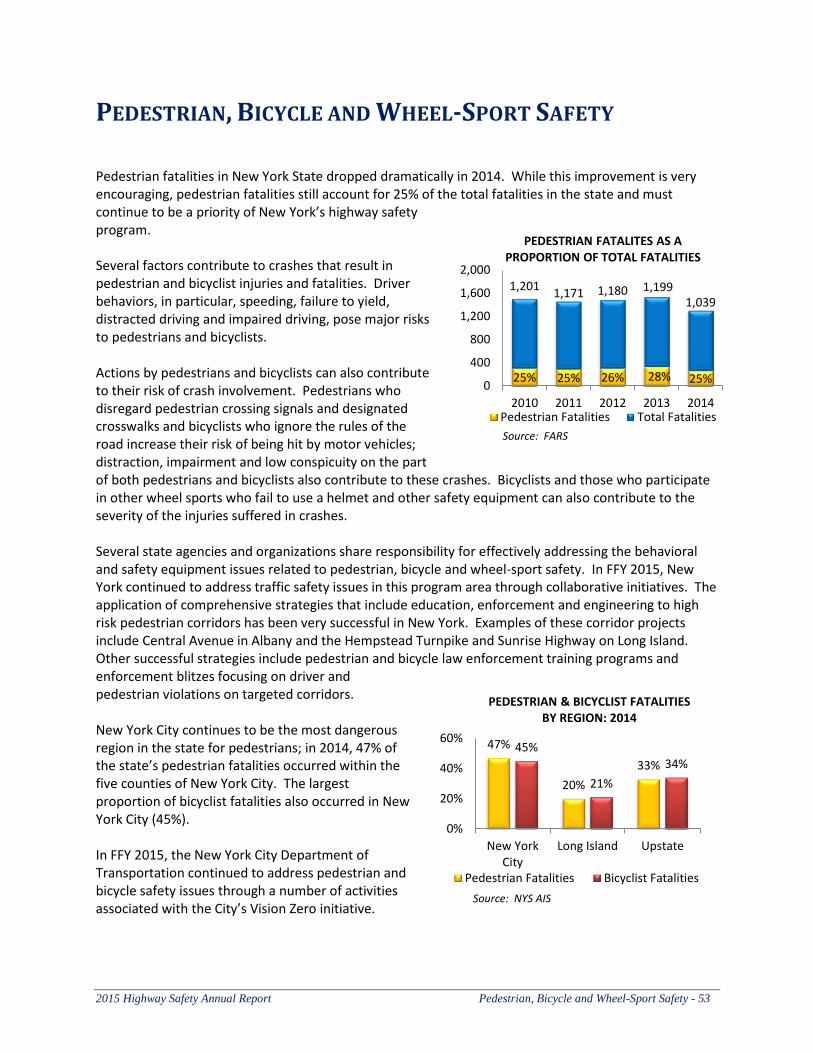
2015 Highway Safety Annual Report Pedestrian, Bicycle and Wheel-Sport Safety - 53
PEDESTRIAN, BICYCLE AND WHEEL-SPORT SAFETY Pedestrian fatalities in New York State dropped dramatically in 2014. While this improvement is very encouraging, pedestrian fatalities still account for 25% of the total fatalities in the state and must continue to be a priority of New York’s highway safety program. Several factors contribute to crashes that result in pedestrian and bicyclist injuries and fatalities. Driver behaviors, in particular, speeding, failure to yield, distracted driving and impaired driving, pose major risks to pedestrians and bicyclists. Actions by pedestrians and bicyclists can also contribute to their risk of crash involvement. Pedestrians who disregard pedestrian crossing signals and designated crosswalks and bicyclists who ignore the rules of the road increase their risk of being hit by motor vehicles; distraction, impairment and low conspicuity on the part of both pedestrians and bicyclists also contribute to these crashes. Bicyclists and those who participate in other wheel sports who fail to use a helmet and other safety equipment can also contribute to the severity of the injuries suffered in crashes. Several state agencies and organizations share responsibility for effectively addressing the behavioral and safety equipment issues related to pedestrian, bicycle and wheel-sport safety. In FFY 2015, New York continued to address traffic safety issues in this program area through collaborative initiatives. The application of comprehensive strategies that include education, enforcement and engineering to high risk pedestrian corridors has been very successful in New York. Examples of these corridor projects include Central Avenue in Albany and the Hempstead Turnpike and Sunrise Highway on Long Island. Other successful strategies include pedestrian and bicycle law enforcement training programs and enforcement blitzes focusing on driver and pedestrian violations on targeted corridors. New York City continues to be the most dangerous region in the state for pedestrians; in 2014, 47% of the state’s pedestrian fatalities occurred within the five counties of New York City. The largest proportion of bicyclist fatalities also occurred in New York City (45%). In FFY 2015, the New York City Department of Transportation continued to address pedestrian and bicycle safety issues through a number of activities associated with the City’s Vision Zero initiative.
25% 25% 26% 28% 25%
1,201 1,171 1,180 1,199
1,039
0
400
800
1,200
1,600
2,000
2010 2011 2012 2013 2014
PEDESTRIAN FATALITES AS A PROPORTION OF TOTAL FATALITIES
Pedestrian Fatalities Total Fatalities
Source: FARS
47%
20%
33%
45%
21%
34%
0%
20%
40%
60%
New YorkCity
Long Island Upstate
PEDESTRIAN & BICYCLIST FATALITIES BY REGION: 2014
Pedestrian Fatalities Bicyclist Fatalities
Source: NYS AIS
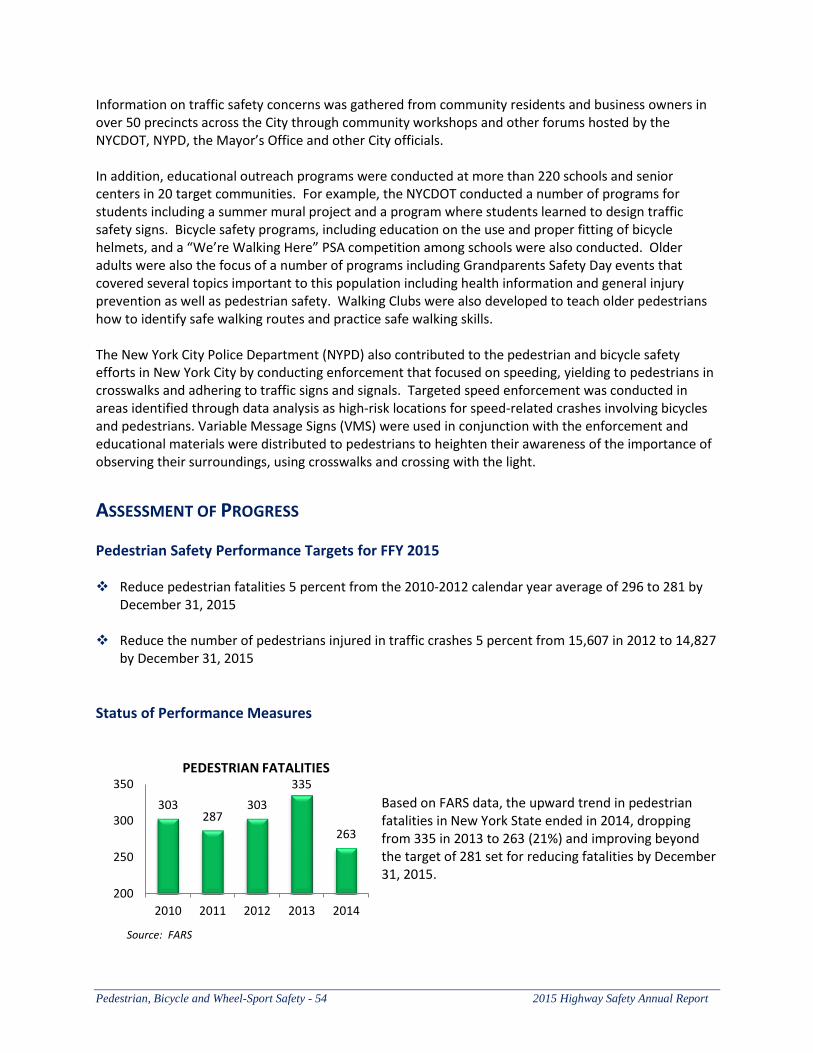
Pedestrian, Bicycle and Wheel-Sport Safety - 54 2015 Highway Safety Annual Report
Information on traffic safety concerns was gathered from community residents and business owners in over 50 precincts across the City through community workshops and other forums hosted by the NYCDOT, NYPD, the Mayor’s Office and other City officials. In addition, educational outreach programs were conducted at more than 220 schools and senior centers in 20 target communities. For example, the NYCDOT conducted a number of programs for students including a summer mural project and a program where students learned to design traffic safety signs. Bicycle safety programs, including education on the use and proper fitting of bicycle helmets, and a “We’re Walking Here” PSA competition among schools were also conducted. Older adults were also the focus of a number of programs including Grandparents Safety Day events that covered several topics important to this population including health information and general injury prevention as well as pedestrian safety. Walking Clubs were also developed to teach older pedestrians how to identify safe walking routes and practice safe walking skills. The New York City Police Department (NYPD) also contributed to the pedestrian and bicycle safety efforts in New York City by conducting enforcement that focused on speeding, yielding to pedestrians in crosswalks and adhering to traffic signs and signals. Targeted speed enforcement was conducted in areas identified through data analysis as high-risk locations for speed-related crashes involving bicycles and pedestrians. Variable Message Signs (VMS) were used in conjunction with the enforcement and educational materials were distributed to pedestrians to heighten their awareness of the importance of observing their surroundings, using crosswalks and crossing with the light.
ASSESSMENT OF PROGRESS
Pedestrian Safety Performance Targets for FFY 2015
Reduce pedestrian fatalities 5 percent from the 2010-2012 calendar year average of 296 to 281 by December 31, 2015
Reduce the number of pedestrians injured in traffic crashes 5 percent from 15,607 in 2012 to 14,827 by December 31, 2015
Status of Performance Measures
Based on FARS data, the upward trend in pedestrian fatalities in New York State ended in 2014, dropping from 335 in 2013 to 263 (21%) and improving beyond the target of 281 set for reducing fatalities by December 31, 2015.
303 287
303
335
263
200
250
300
350
2010 2011 2012 2013 2014
PEDESTRIAN FATALITIES
Source: FARS
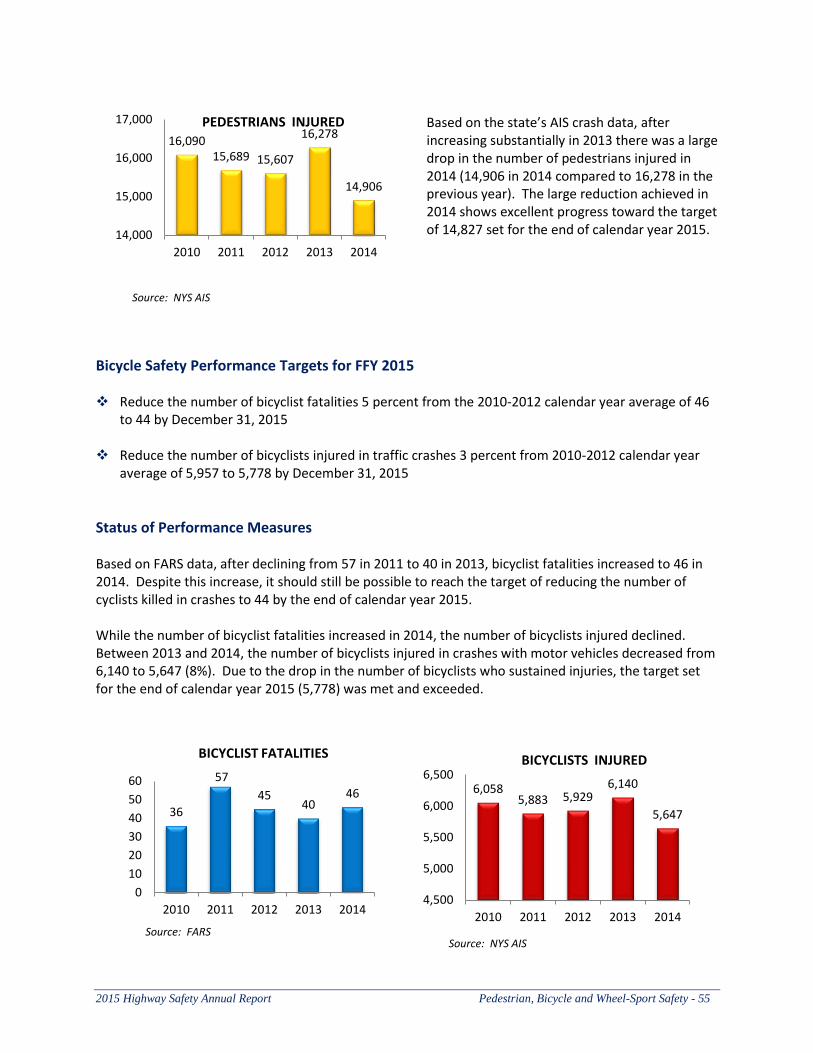
2015 Highway Safety Annual Report Pedestrian, Bicycle and Wheel-Sport Safety - 55
Based on the state’s AIS crash data, after increasing substantially in 2013 there was a large drop in the number of pedestrians injured in 2014 (14,906 in 2014 compared to 16,278 in the previous year). The large reduction achieved in 2014 shows excellent progress toward the target of 14,827 set for the end of calendar year 2015.
Bicycle Safety Performance Targets for FFY 2015 Reduce the number of bicyclist fatalities 5 percent from the 2010-2012 calendar year average of 46
to 44 by December 31, 2015
Reduce the number of bicyclists injured in traffic crashes 3 percent from 2010-2012 calendar year average of 5,957 to 5,778 by December 31, 2015
Status of Performance Measures Based on FARS data, after declining from 57 in 2011 to 40 in 2013, bicyclist fatalities increased to 46 in 2014. Despite this increase, it should still be possible to reach the target of reducing the number of cyclists killed in crashes to 44 by the end of calendar year 2015. While the number of bicyclist fatalities increased in 2014, the number of bicyclists injured declined. Between 2013 and 2014, the number of bicyclists injured in crashes with motor vehicles decreased from 6,140 to 5,647 (8%). Due to the drop in the number of bicyclists who sustained injuries, the target set for the end of calendar year 2015 (5,778) was met and exceeded.
16,090 15,689 15,607
16,278
14,906
14,000
15,000
16,000
17,000
2010 2011 2012 2013 2014
PEDESTRIANS INJURED
Source: NYS AIS
36
57
45 40
46
0
10
20
30
40
50
60
2010 2011 2012 2013 2014
BICYCLIST FATALITIES
Source: FARS
6,058 5,883 5,929
6,140
5,647
4,500
5,000
5,500
6,000
6,500
2010 2011 2012 2013 2014
BICYCLISTS INJURED
Source: NYS AIS
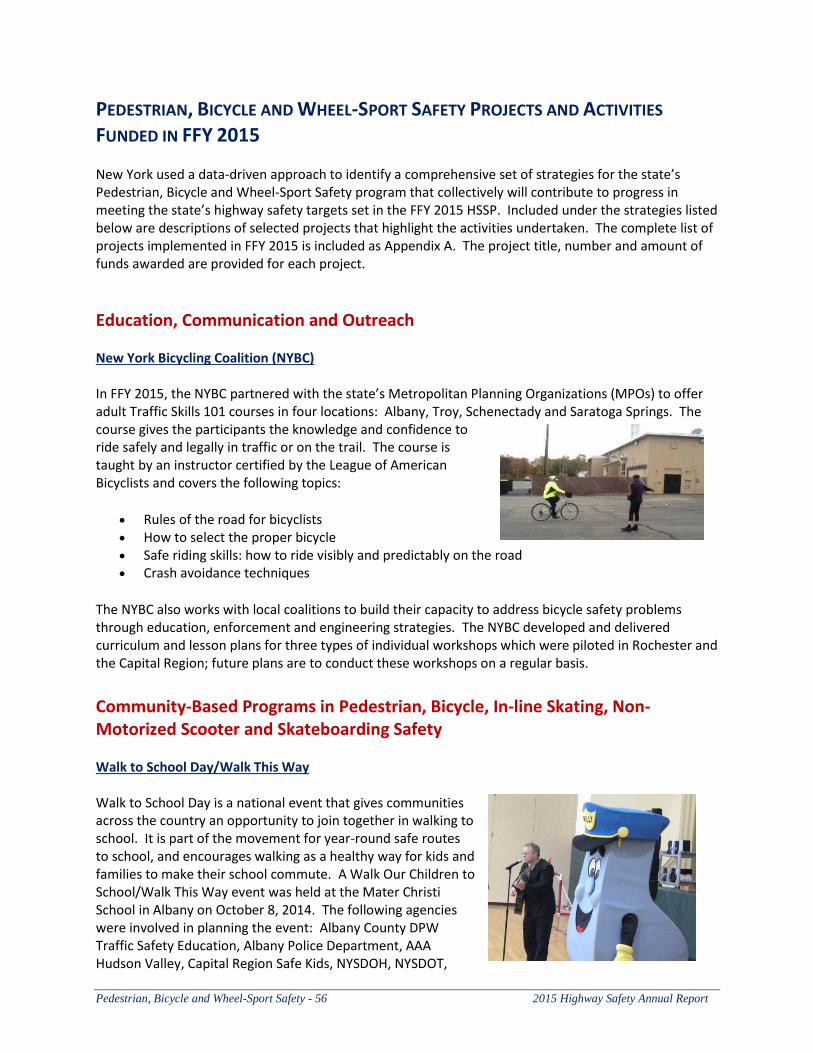
Pedestrian, Bicycle and Wheel-Sport Safety - 56 2015 Highway Safety Annual Report
PEDESTRIAN, BICYCLE AND WHEEL-SPORT SAFETY PROJECTS AND ACTIVITIES
FUNDED IN FFY 2015
New York used a data-driven approach to identify a comprehensive set of strategies for the state’s Pedestrian, Bicycle and Wheel-Sport Safety program that collectively will contribute to progress in meeting the state’s highway safety targets set in the FFY 2015 HSSP. Included under the strategies listed below are descriptions of selected projects that highlight the activities undertaken. The complete list of projects implemented in FFY 2015 is included as Appendix A. The project title, number and amount of funds awarded are provided for each project.
Education, Communication and Outreach New York Bicycling Coalition (NYBC) In FFY 2015, the NYBC partnered with the state’s Metropolitan Planning Organizations (MPOs) to offer adult Traffic Skills 101 courses in four locations: Albany, Troy, Schenectady and Saratoga Springs. The course gives the participants the knowledge and confidence to ride safely and legally in traffic or on the trail. The course is taught by an instructor certified by the League of American Bicyclists and covers the following topics:
Rules of the road for bicyclists How to select the proper bicycle Safe riding skills: how to ride visibly and predictably on the road Crash avoidance techniques
The NYBC also works with local coalitions to build their capacity to address bicycle safety problems through education, enforcement and engineering strategies. The NYBC developed and delivered curriculum and lesson plans for three types of individual workshops which were piloted in Rochester and the Capital Region; future plans are to conduct these workshops on a regular basis.
Community-Based Programs in Pedestrian, Bicycle, In-line Skating, Non-Motorized Scooter and Skateboarding Safety Walk to School Day/Walk This Way Walk to School Day is a national event that gives communities across the country an opportunity to join together in walking to school. It is part of the movement for year-round safe routes to school, and encourages walking as a healthy way for kids and families to make their school commute. A Walk Our Children to School/Walk This Way event was held at the Mater Christi School in Albany on October 8, 2014. The following agencies were involved in planning the event: Albany County DPW Traffic Safety Education, Albany Police Department, AAA Hudson Valley, Capital Region Safe Kids, NYSDOH, NYSDOT,
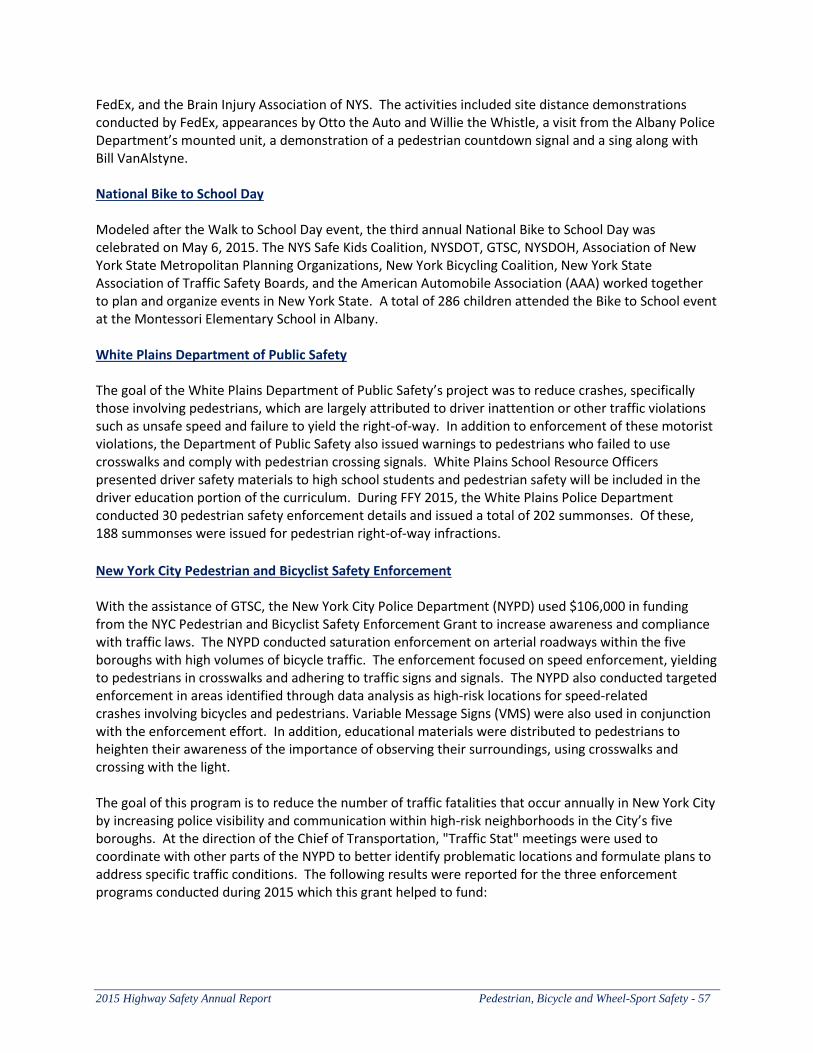
2015 Highway Safety Annual Report Pedestrian, Bicycle and Wheel-Sport Safety - 57
FedEx, and the Brain Injury Association of NYS. The activities included site distance demonstrations conducted by FedEx, appearances by Otto the Auto and Willie the Whistle, a visit from the Albany Police Department’s mounted unit, a demonstration of a pedestrian countdown signal and a sing along with Bill VanAlstyne. National Bike to School Day Modeled after the Walk to School Day event, the third annual National Bike to School Day was celebrated on May 6, 2015. The NYS Safe Kids Coalition, NYSDOT, GTSC, NYSDOH, Association of New York State Metropolitan Planning Organizations, New York Bicycling Coalition, New York State Association of Traffic Safety Boards, and the American Automobile Association (AAA) worked together to plan and organize events in New York State. A total of 286 children attended the Bike to School event at the Montessori Elementary School in Albany. White Plains Department of Public Safety The goal of the White Plains Department of Public Safety’s project was to reduce crashes, specifically those involving pedestrians, which are largely attributed to driver inattention or other traffic violations such as unsafe speed and failure to yield the right-of-way. In addition to enforcement of these motorist violations, the Department of Public Safety also issued warnings to pedestrians who failed to use crosswalks and comply with pedestrian crossing signals. White Plains School Resource Officers presented driver safety materials to high school students and pedestrian safety will be included in the driver education portion of the curriculum. During FFY 2015, the White Plains Police Department conducted 30 pedestrian safety enforcement details and issued a total of 202 summonses. Of these, 188 summonses were issued for pedestrian right-of-way infractions.
New York City Pedestrian and Bicyclist Safety Enforcement With the assistance of GTSC, the New York City Police Department (NYPD) used $106,000 in funding from the NYC Pedestrian and Bicyclist Safety Enforcement Grant to increase awareness and compliance with traffic laws. The NYPD conducted saturation enforcement on arterial roadways within the five boroughs with high volumes of bicycle traffic. The enforcement focused on speed enforcement, yielding to pedestrians in crosswalks and adhering to traffic signs and signals. The NYPD also conducted targeted enforcement in areas identified through data analysis as high-risk locations for speed-related crashes involving bicycles and pedestrians. Variable Message Signs (VMS) were also used in conjunction with the enforcement effort. In addition, educational materials were distributed to pedestrians to heighten their awareness of the importance of observing their surroundings, using crosswalks and crossing with the light. The goal of this program is to reduce the number of traffic fatalities that occur annually in New York City by increasing police visibility and communication within high-risk neighborhoods in the City’s five boroughs. At the direction of the Chief of Transportation, "Traffic Stat" meetings were used to coordinate with other parts of the NYPD to better identify problematic locations and formulate plans to address specific traffic conditions. The following results were reported for the three enforcement programs conducted during 2015 which this grant helped to fund:
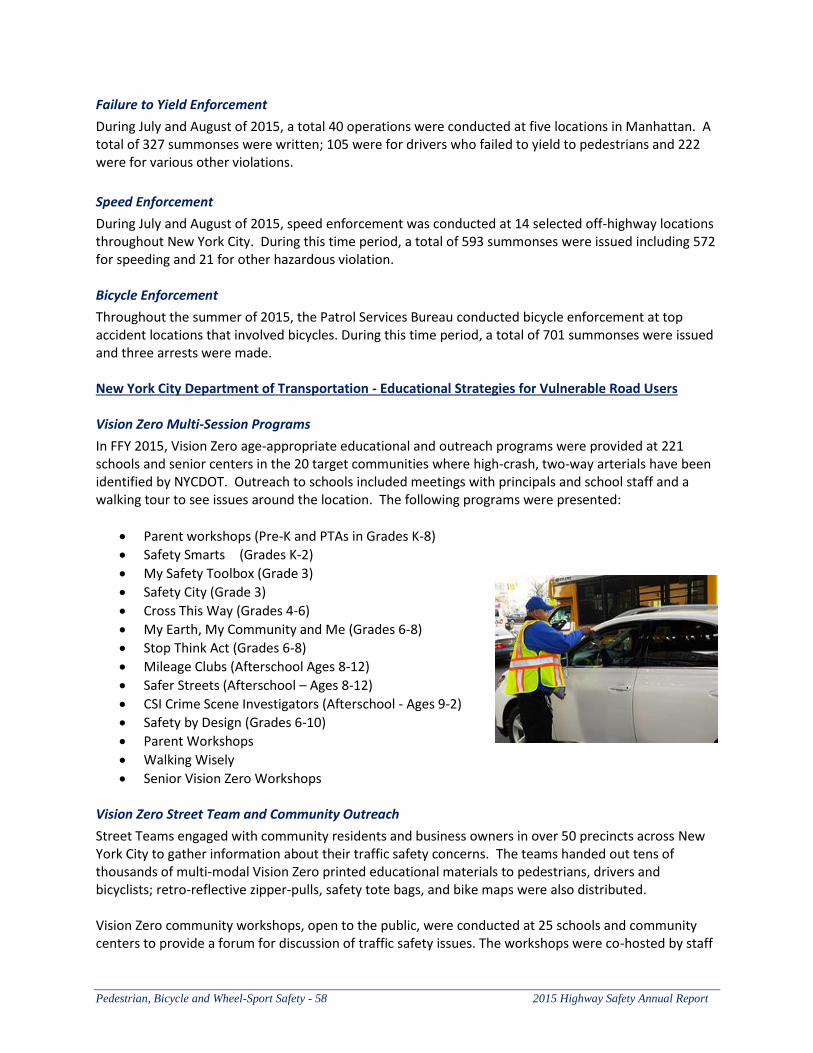
Pedestrian, Bicycle and Wheel-Sport Safety - 58 2015 Highway Safety Annual Report
Failure to Yield Enforcement
During July and August of 2015, a total 40 operations were conducted at five locations in Manhattan. A total of 327 summonses were written; 105 were for drivers who failed to yield to pedestrians and 222 were for various other violations.
Speed Enforcement
During July and August of 2015, speed enforcement was conducted at 14 selected off-highway locations throughout New York City. During this time period, a total of 593 summonses were issued including 572 for speeding and 21 for other hazardous violation. Bicycle Enforcement
Throughout the summer of 2015, the Patrol Services Bureau conducted bicycle enforcement at top accident locations that involved bicycles. During this time period, a total of 701 summonses were issued and three arrests were made. New York City Department of Transportation - Educational Strategies for Vulnerable Road Users Vision Zero Multi-Session Programs
In FFY 2015, Vision Zero age-appropriate educational and outreach programs were provided at 221 schools and senior centers in the 20 target communities where high-crash, two-way arterials have been identified by NYCDOT. Outreach to schools included meetings with principals and school staff and a walking tour to see issues around the location. The following programs were presented:
Parent workshops (Pre-K and PTAs in Grades K-8)
Safety Smarts (Grades K-2)
My Safety Toolbox (Grade 3)
Safety City (Grade 3)
Cross This Way (Grades 4-6)
My Earth, My Community and Me (Grades 6-8)
Stop Think Act (Grades 6-8)
Mileage Clubs (Afterschool Ages 8-12)
Safer Streets (Afterschool – Ages 8-12)
CSI Crime Scene Investigators (Afterschool - Ages 9-2)
Safety by Design (Grades 6-10)
Parent Workshops
Walking Wisely
Senior Vision Zero Workshops Vision Zero Street Team and Community Outreach
Street Teams engaged with community residents and business owners in over 50 precincts across New York City to gather information about their traffic safety concerns. The teams handed out tens of thousands of multi-modal Vision Zero printed educational materials to pedestrians, drivers and bicyclists; retro-reflective zipper-pulls, safety tote bags, and bike maps were also distributed. Vision Zero community workshops, open to the public, were conducted at 25 schools and community centers to provide a forum for discussion of traffic safety issues. The workshops were co-hosted by staff
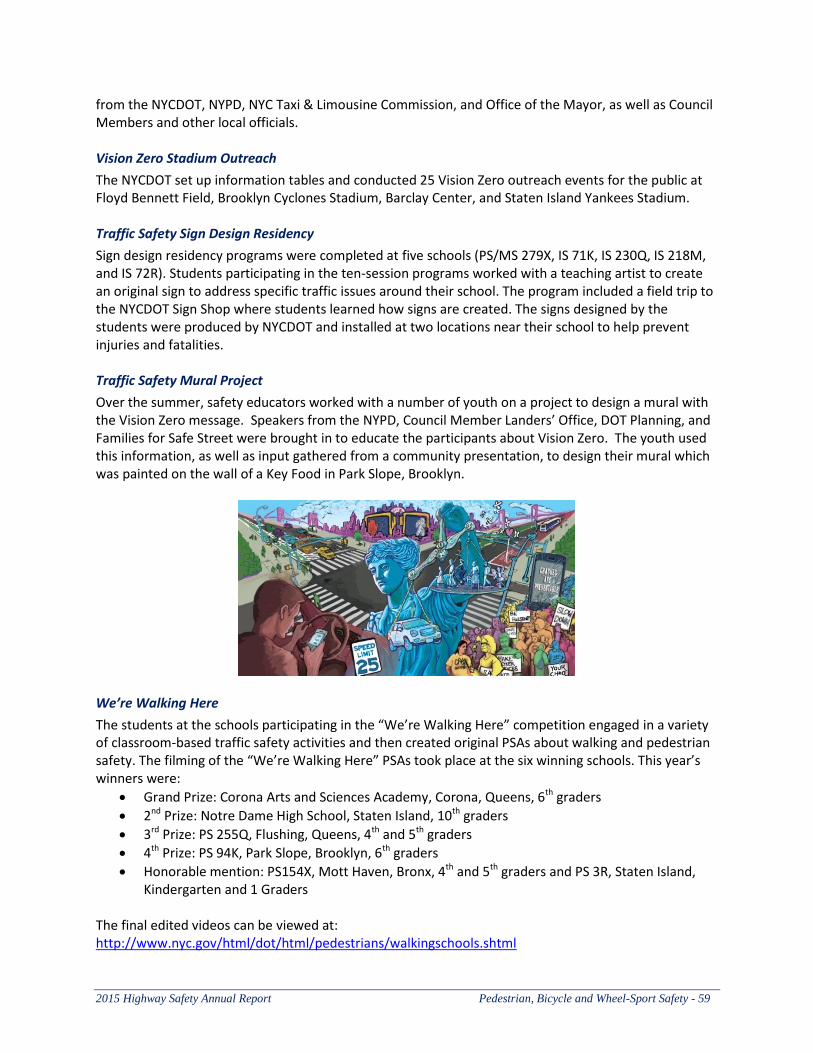
2015 Highway Safety Annual Report Pedestrian, Bicycle and Wheel-Sport Safety - 59
from the NYCDOT, NYPD, NYC Taxi & Limousine Commission, and Office of the Mayor, as well as Council Members and other local officials. Vision Zero Stadium Outreach
The NYCDOT set up information tables and conducted 25 Vision Zero outreach events for the public at Floyd Bennett Field, Brooklyn Cyclones Stadium, Barclay Center, and Staten Island Yankees Stadium. Traffic Safety Sign Design Residency
Sign design residency programs were completed at five schools (PS/MS 279X, IS 71K, IS 230Q, IS 218M, and IS 72R). Students participating in the ten-session programs worked with a teaching artist to create an original sign to address specific traffic issues around their school. The program included a field trip to the NYCDOT Sign Shop where students learned how signs are created. The signs designed by the students were produced by NYCDOT and installed at two locations near their school to help prevent injuries and fatalities. Traffic Safety Mural Project
Over the summer, safety educators worked with a number of youth on a project to design a mural with the Vision Zero message. Speakers from the NYPD, Council Member Landers’ Office, DOT Planning, and Families for Safe Street were brought in to educate the participants about Vision Zero. The youth used this information, as well as input gathered from a community presentation, to design their mural which was painted on the wall of a Key Food in Park Slope, Brooklyn.
We’re Walking Here
The students at the schools participating in the “We’re Walking Here” competition engaged in a variety of classroom-based traffic safety activities and then created original PSAs about walking and pedestrian safety. The filming of the “We’re Walking Here” PSAs took place at the six winning schools. This year’s winners were:
Grand Prize: Corona Arts and Sciences Academy, Corona, Queens, 6th graders
2nd Prize: Notre Dame High School, Staten Island, 10th graders
3rd Prize: PS 255Q, Flushing, Queens, 4th and 5th graders
4th Prize: PS 94K, Park Slope, Brooklyn, 6th graders
Honorable mention: PS154X, Mott Haven, Bronx, 4th and 5th graders and PS 3R, Staten Island, Kindergarten and 1 Graders
The final edited videos can be viewed at: http://www.nyc.gov/html/dot/html/pedestrians/walkingschools.shtml
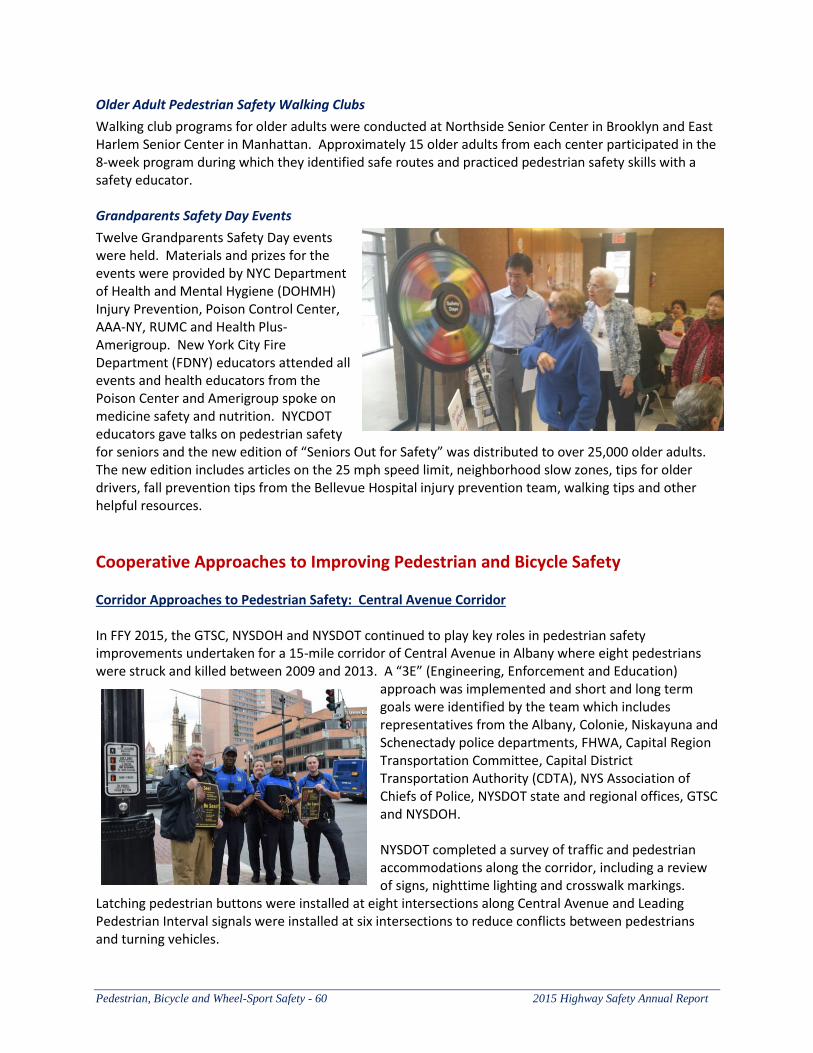
Pedestrian, Bicycle and Wheel-Sport Safety - 60 2015 Highway Safety Annual Report
Older Adult Pedestrian Safety Walking Clubs
Walking club programs for older adults were conducted at Northside Senior Center in Brooklyn and East Harlem Senior Center in Manhattan. Approximately 15 older adults from each center participated in the 8-week program during which they identified safe routes and practiced pedestrian safety skills with a safety educator. Grandparents Safety Day Events
Twelve Grandparents Safety Day events were held. Materials and prizes for the events were provided by NYC Department of Health and Mental Hygiene (DOHMH) Injury Prevention, Poison Control Center, AAA-NY, RUMC and Health Plus-Amerigroup. New York City Fire Department (FDNY) educators attended all events and health educators from the Poison Center and Amerigroup spoke on medicine safety and nutrition. NYCDOT educators gave talks on pedestrian safety for seniors and the new edition of “Seniors Out for Safety” was distributed to over 25,000 older adults. The new edition includes articles on the 25 mph speed limit, neighborhood slow zones, tips for older drivers, fall prevention tips from the Bellevue Hospital injury prevention team, walking tips and other helpful resources.
Cooperative Approaches to Improving Pedestrian and Bicycle Safety Corridor Approaches to Pedestrian Safety: Central Avenue Corridor In FFY 2015, the GTSC, NYSDOH and NYSDOT continued to play key roles in pedestrian safety improvements undertaken for a 15-mile corridor of Central Avenue in Albany where eight pedestrians were struck and killed between 2009 and 2013. A “3E” (Engineering, Enforcement and Education)
approach was implemented and short and long term goals were identified by the team which includes representatives from the Albany, Colonie, Niskayuna and Schenectady police departments, FHWA, Capital Region Transportation Committee, Capital District Transportation Authority (CDTA), NYS Association of Chiefs of Police, NYSDOT state and regional offices, GTSC and NYSDOH. NYSDOT completed a survey of traffic and pedestrian accommodations along the corridor, including a review of signs, nighttime lighting and crosswalk markings.
Latching pedestrian buttons were installed at eight intersections along Central Avenue and Leading Pedestrian Interval signals were installed at six intersections to reduce conflicts between pedestrians and turning vehicles.
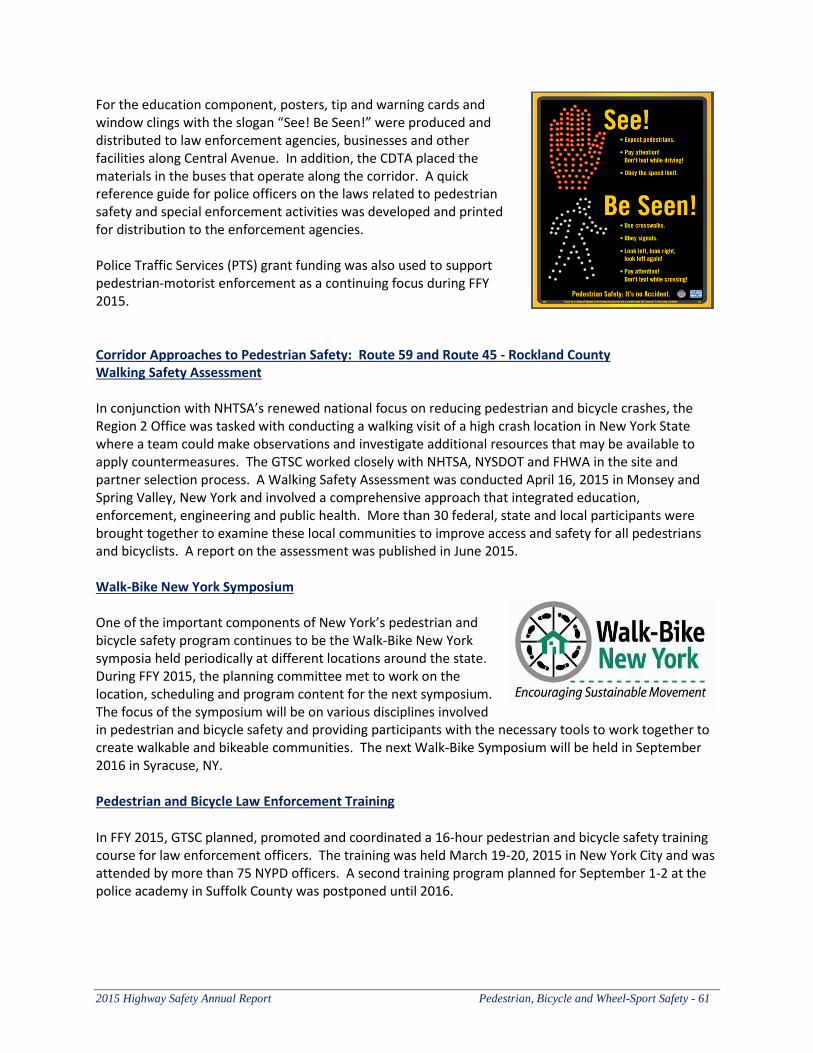
2015 Highway Safety Annual Report Pedestrian, Bicycle and Wheel-Sport Safety - 61
For the education component, posters, tip and warning cards and window clings with the slogan “See! Be Seen!” were produced and distributed to law enforcement agencies, businesses and other facilities along Central Avenue. In addition, the CDTA placed the materials in the buses that operate along the corridor. A quick reference guide for police officers on the laws related to pedestrian safety and special enforcement activities was developed and printed for distribution to the enforcement agencies.
Police Traffic Services (PTS) grant funding was also used to support pedestrian-motorist enforcement as a continuing focus during FFY 2015. Corridor Approaches to Pedestrian Safety: Route 59 and Route 45 - Rockland County Walking Safety Assessment In conjunction with NHTSA’s renewed national focus on reducing pedestrian and bicycle crashes, the Region 2 Office was tasked with conducting a walking visit of a high crash location in New York State where a team could make observations and investigate additional resources that may be available to apply countermeasures. The GTSC worked closely with NHTSA, NYSDOT and FHWA in the site and partner selection process. A Walking Safety Assessment was conducted April 16, 2015 in Monsey and Spring Valley, New York and involved a comprehensive approach that integrated education, enforcement, engineering and public health. More than 30 federal, state and local participants were brought together to examine these local communities to improve access and safety for all pedestrians and bicyclists. A report on the assessment was published in June 2015. Walk-Bike New York Symposium One of the important components of New York’s pedestrian and bicycle safety program continues to be the Walk-Bike New York symposia held periodically at different locations around the state. During FFY 2015, the planning committee met to work on the location, scheduling and program content for the next symposium. The focus of the symposium will be on various disciplines involved in pedestrian and bicycle safety and providing participants with the necessary tools to work together to create walkable and bikeable communities. The next Walk-Bike Symposium will be held in September 2016 in Syracuse, NY. Pedestrian and Bicycle Law Enforcement Training
In FFY 2015, GTSC planned, promoted and coordinated a 16-hour pedestrian and bicycle safety training course for law enforcement officers. The training was held March 19-20, 2015 in New York City and was attended by more than 75 NYPD officers. A second training program planned for September 1-2 at the police academy in Suffolk County was postponed until 2016.
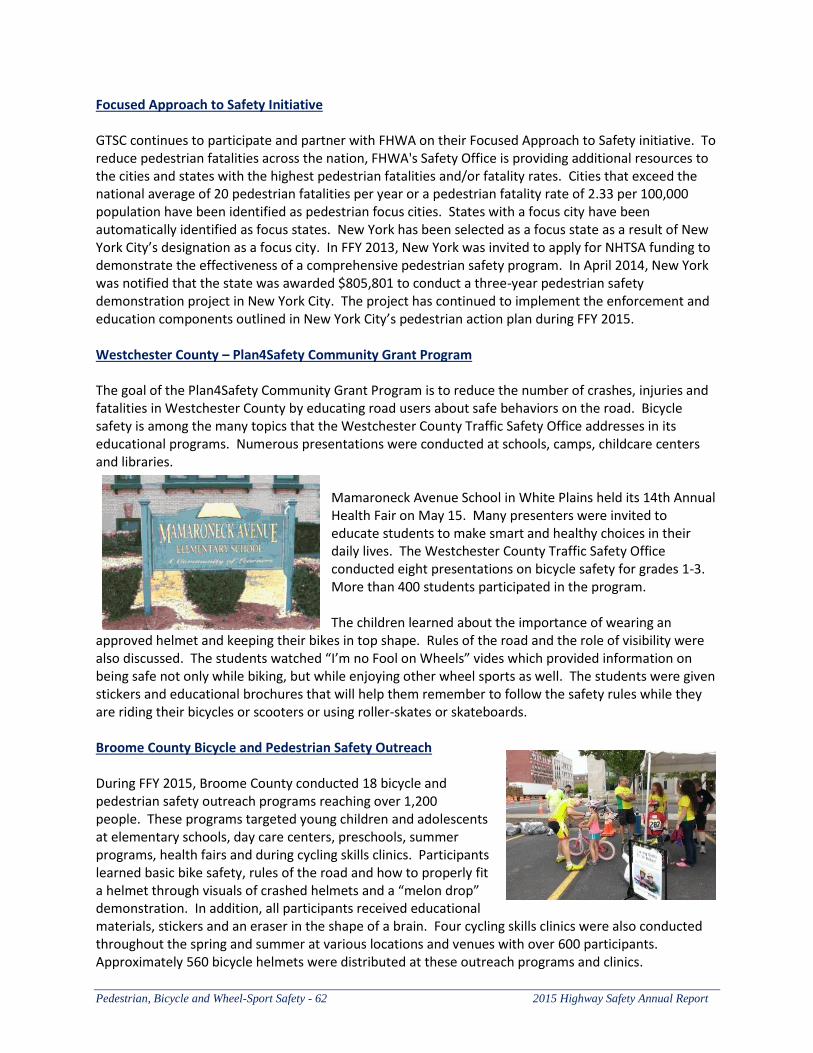
Pedestrian, Bicycle and Wheel-Sport Safety - 62 2015 Highway Safety Annual Report
Focused Approach to Safety Initiative GTSC continues to participate and partner with FHWA on their Focused Approach to Safety initiative. To reduce pedestrian fatalities across the nation, FHWA's Safety Office is providing additional resources to the cities and states with the highest pedestrian fatalities and/or fatality rates. Cities that exceed the national average of 20 pedestrian fatalities per year or a pedestrian fatality rate of 2.33 per 100,000 population have been identified as pedestrian focus cities. States with a focus city have been automatically identified as focus states. New York has been selected as a focus state as a result of New York City’s designation as a focus city. In FFY 2013, New York was invited to apply for NHTSA funding to demonstrate the effectiveness of a comprehensive pedestrian safety program. In April 2014, New York was notified that the state was awarded $805,801 to conduct a three-year pedestrian safety demonstration project in New York City. The project has continued to implement the enforcement and education components outlined in New York City’s pedestrian action plan during FFY 2015. Westchester County – Plan4Safety Community Grant Program The goal of the Plan4Safety Community Grant Program is to reduce the number of crashes, injuries and fatalities in Westchester County by educating road users about safe behaviors on the road. Bicycle safety is among the many topics that the Westchester County Traffic Safety Office addresses in its educational programs. Numerous presentations were conducted at schools, camps, childcare centers and libraries.
Mamaroneck Avenue School in White Plains held its 14th Annual Health Fair on May 15. Many presenters were invited to educate students to make smart and healthy choices in their daily lives. The Westchester County Traffic Safety Office conducted eight presentations on bicycle safety for grades 1-3. More than 400 students participated in the program. The children learned about the importance of wearing an
approved helmet and keeping their bikes in top shape. Rules of the road and the role of visibility were also discussed. The students watched “I’m no Fool on Wheels” vides which provided information on being safe not only while biking, but while enjoying other wheel sports as well. The students were given stickers and educational brochures that will help them remember to follow the safety rules while they are riding their bicycles or scooters or using roller-skates or skateboards. Broome County Bicycle and Pedestrian Safety Outreach During FFY 2015, Broome County conducted 18 bicycle and pedestrian safety outreach programs reaching over 1,200 people. These programs targeted young children and adolescents at elementary schools, day care centers, preschools, summer programs, health fairs and during cycling skills clinics. Participants learned basic bike safety, rules of the road and how to properly fit a helmet through visuals of crashed helmets and a “melon drop” demonstration. In addition, all participants received educational materials, stickers and an eraser in the shape of a brain. Four cycling skills clinics were also conducted throughout the spring and summer at various locations and venues with over 600 participants. Approximately 560 bicycle helmets were distributed at these outreach programs and clinics.
2015 Highway Safety Annual Report Pedestrian, Bicycle and Wheel-Sport Safety - 63
Town of Ramapo Police Department Pedestrian Decoy Program
In FFY 2015, the Ramapo Police Department continued the agency’s Pedestrian Decoy Program. The program was created in response to numerous motor vehicle crashes involving pedestrians or bicyclists, many of which resulted in serious injuries. During the year, special details were conducted where a police officer in plain clothes attempted to safely cross a roadway using a designated crosswalk. Motorists who did not yield to the pedestrian as required by law were stopped by a marked police vehicle. The Town of Ramapo Police Department also continued its reward program for youth who exhibit safe pedestrian and bicycling behaviors and efforts to increase awareness and enforcement of the state’s current pedestrian and bicycle safety laws.
Saugerties Police Department’s Pedestrian Safety Program
In response to data that showed an increase in pedestrian fatalities and serious injury crashes in the village, the Saugerties Police Department created a Pedestrian Safety Program which employed the three “E” approach of engineering, enforcement and education. Several intersections were equipped with new signage, crossing devices and road markings and efforts to educate the community through the local media and other channels were undertaken. The enforcement program included a warning period followed by the issuance of summonses for violations of the law. These efforts resulted in a reduction in the number of pedestrian crashes at intersections. Monroe County Pedestrian and Bicycle Safety Program The Monroe County Office of Traffic Safety offers bicycle and pedestrian safety programs for children and adults. In FFY 2015, the program included 49 school presentations that reached over 1,500 young students. The Office of Traffic Safety also conducted three bike rodeos reaching 181 young riders. The training at each rodeo focused on six bicycle handling skills: brake check, tight cornering, slow race, figure eight, slalom/rock dodge and hand signals. Bike Training and Helmet Fitting (New York City DOT) The New York City Department of Transportation provided 17,871 helmets for adults and children at the Safety Education Office, Safety Cities and Summer Streets, the Atlantic Antic, Brooklyn Public Library, Bike Bonanzas and at events conducted in partnership with local Council Members. Another component of the NYCDOT’s program is the Bike to School program. Bike to School bike fairs were held on June 11 at Bronx River High School and on June 14 in Flushing Meadow Park for the East-West School. The June 14 event included a Bike-a-Thon where 40 students participated in many activities including a ride around the park’s lake.
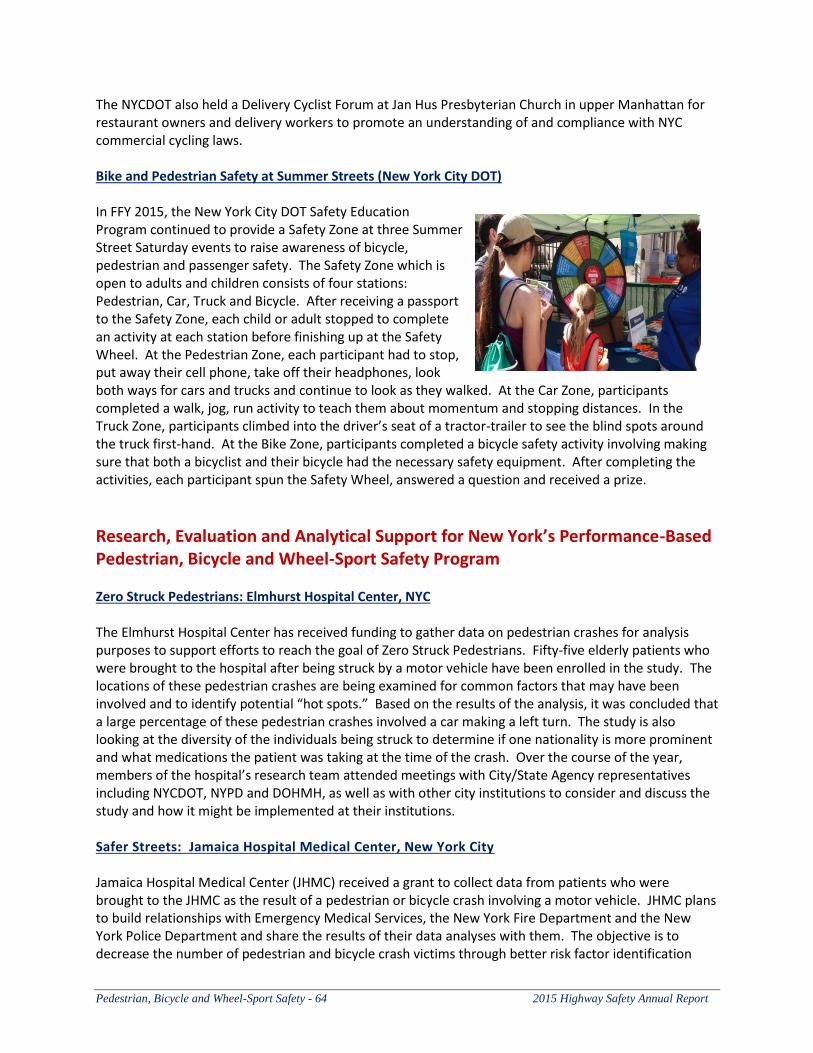
Pedestrian, Bicycle and Wheel-Sport Safety - 64 2015 Highway Safety Annual Report
The NYCDOT also held a Delivery Cyclist Forum at Jan Hus Presbyterian Church in upper Manhattan for restaurant owners and delivery workers to promote an understanding of and compliance with NYC commercial cycling laws. Bike and Pedestrian Safety at Summer Streets (New York City DOT) In FFY 2015, the New York City DOT Safety Education Program continued to provide a Safety Zone at three Summer Street Saturday events to raise awareness of bicycle, pedestrian and passenger safety. The Safety Zone which is open to adults and children consists of four stations: Pedestrian, Car, Truck and Bicycle. After receiving a passport to the Safety Zone, each child or adult stopped to complete an activity at each station before finishing up at the Safety Wheel. At the Pedestrian Zone, each participant had to stop, put away their cell phone, take off their headphones, look both ways for cars and trucks and continue to look as they walked. At the Car Zone, participants completed a walk, jog, run activity to teach them about momentum and stopping distances. In the Truck Zone, participants climbed into the driver’s seat of a tractor-trailer to see the blind spots around the truck first-hand. At the Bike Zone, participants completed a bicycle safety activity involving making sure that both a bicyclist and their bicycle had the necessary safety equipment. After completing the activities, each participant spun the Safety Wheel, answered a question and received a prize.
Research, Evaluation and Analytical Support for New York’s Performance-Based Pedestrian, Bicycle and Wheel-Sport Safety Program Zero Struck Pedestrians: Elmhurst Hospital Center, NYC The Elmhurst Hospital Center has received funding to gather data on pedestrian crashes for analysis purposes to support efforts to reach the goal of Zero Struck Pedestrians. Fifty-five elderly patients who were brought to the hospital after being struck by a motor vehicle have been enrolled in the study. The locations of these pedestrian crashes are being examined for common factors that may have been involved and to identify potential “hot spots.” Based on the results of the analysis, it was concluded that a large percentage of these pedestrian crashes involved a car making a left turn. The study is also looking at the diversity of the individuals being struck to determine if one nationality is more prominent and what medications the patient was taking at the time of the crash. Over the course of the year, members of the hospital’s research team attended meetings with City/State Agency representatives including NYCDOT, NYPD and DOHMH, as well as with other city institutions to consider and discuss the study and how it might be implemented at their institutions. Safer Streets: Jamaica Hospital Medical Center, New York City Jamaica Hospital Medical Center (JHMC) received a grant to collect data from patients who were brought to the JHMC as the result of a pedestrian or bicycle crash involving a motor vehicle. JHMC plans to build relationships with Emergency Medical Services, the New York Fire Department and the New York Police Department and share the results of their data analyses with them. The objective is to decrease the number of pedestrian and bicycle crash victims through better risk factor identification
2015 Highway Safety Annual Report Pedestrian, Bicycle and Wheel-Sport Safety - 65
(primary prevention), optimized resource utilization and intervention concentration (secondary prevention) and increased knowledge related to injury patterns and outcome data (tertiary prevention). The ultimate goal is to design educational programs and interventions to reduce the morbidity and mortality of pedestrians and bicyclists struck by motor vehicles. JHMC collected data from 605 patients in the first year of the study and 802 patients in year two; the combined total of 1,407 included 1,144 pedestrians and 263 bicyclists. The analyses showed that 75% (1,055) of the pedestrian and bicycle crashes occurred on weekdays. Additional results from the analyses include: Characteristics of Pedestrian Crashes
565 (49%) of the pedestrians involved in crashes were male; 579 (51%) were female
Median age: 43 (male 41; female 45)
Top four months when pedestrian crashes occurred: December (158); November (130); January (104); May (99)
Characteristics of Bicyclist Crashes
248 (94%) of the bicyclists involved in crashes were male; 15 (6%) were female
Median age: 30 (male 30; female 26)
Top four months when bicycle crashes occurred: August (39); July (37); September (36); June (31)

Pedestrian, Bicycle and Wheel-Sport Safety - 66 2015 Highway Safety Annual Report
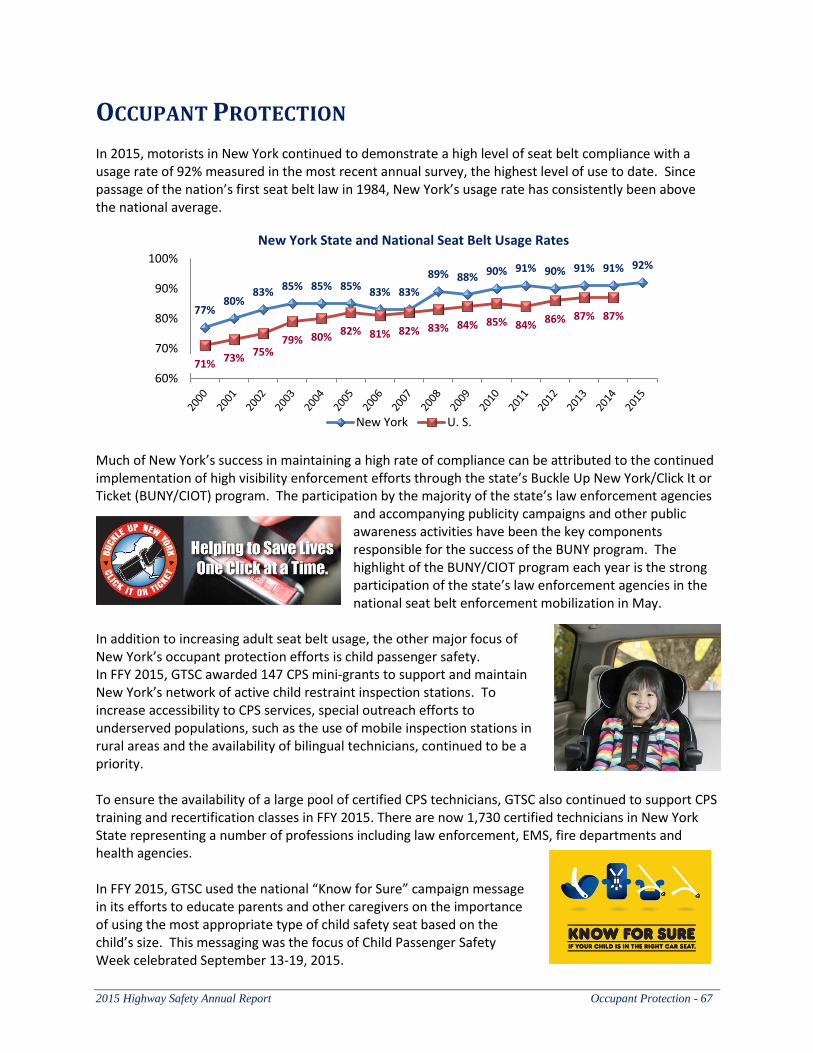
2015 Highway Safety Annual Report Occupant Protection - 67
OCCUPANT PROTECTION In 2015, motorists in New York continued to demonstrate a high level of seat belt compliance with a usage rate of 92% measured in the most recent annual survey, the highest level of use to date. Since passage of the nation’s first seat belt law in 1984, New York’s usage rate has consistently been above the national average.
Much of New York’s success in maintaining a high rate of compliance can be attributed to the continued implementation of high visibility enforcement efforts through the state’s Buckle Up New York/Click It or Ticket (BUNY/CIOT) program. The participation by the majority of the state’s law enforcement agencies
and accompanying publicity campaigns and other public awareness activities have been the key components responsible for the success of the BUNY program. The highlight of the BUNY/CIOT program each year is the strong participation of the state’s law enforcement agencies in the national seat belt enforcement mobilization in May.
In addition to increasing adult seat belt usage, the other major focus of New York’s occupant protection efforts is child passenger safety. In FFY 2015, GTSC awarded 147 CPS mini-grants to support and maintain New York’s network of active child restraint inspection stations. To increase accessibility to CPS services, special outreach efforts to underserved populations, such as the use of mobile inspection stations in rural areas and the availability of bilingual technicians, continued to be a priority. To ensure the availability of a large pool of certified CPS technicians, GTSC also continued to support CPS training and recertification classes in FFY 2015. There are now 1,730 certified technicians in New York State representing a number of professions including law enforcement, EMS, fire departments and health agencies. In FFY 2015, GTSC used the national “Know for Sure” campaign message in its efforts to educate parents and other caregivers on the importance of using the most appropriate type of child safety seat based on the child’s size. This messaging was the focus of Child Passenger Safety Week celebrated September 13-19, 2015.
77% 80%
83% 85% 85% 85% 83% 83%
89% 88% 90% 91% 90% 91% 91% 92%
71% 73% 75%
79% 80% 82% 81% 82% 83% 84% 85% 84%
86% 87% 87%
60%
70%
80%
90%
100%
New York State and National Seat Belt Usage Rates
New York U. S.
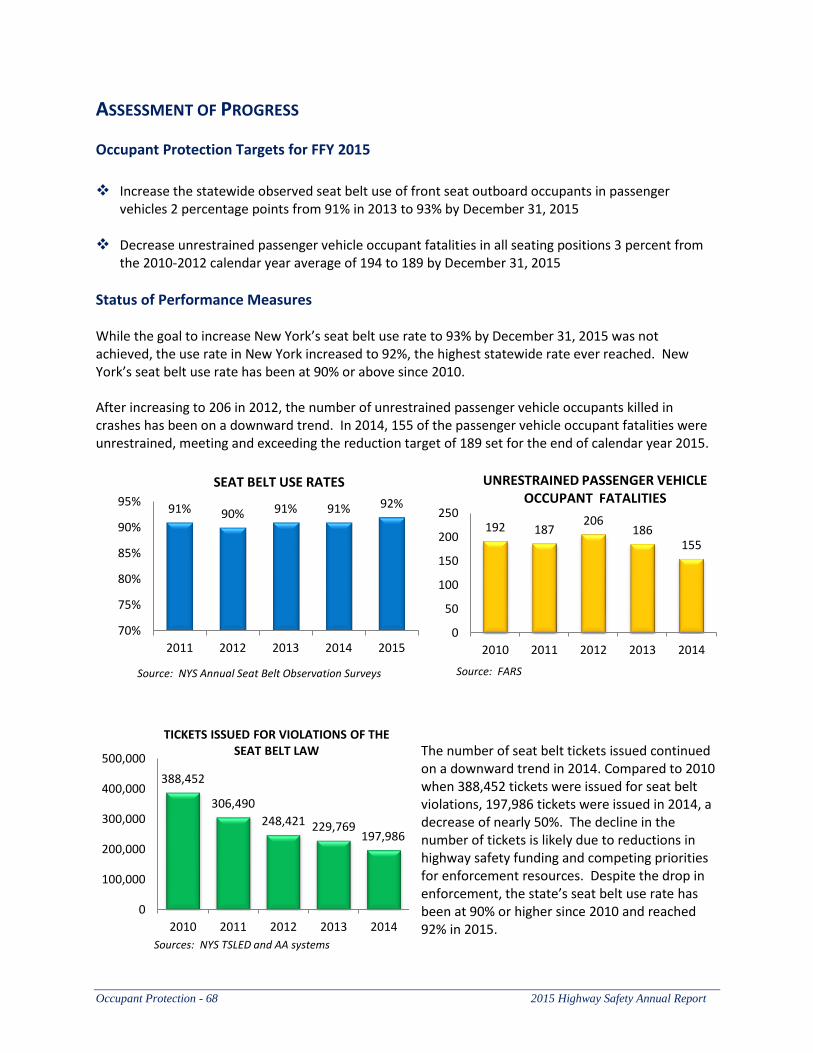
Occupant Protection - 68 2015 Highway Safety Annual Report
ASSESSMENT OF PROGRESS
Occupant Protection Targets for FFY 2015
Increase the statewide observed seat belt use of front seat outboard occupants in passenger
vehicles 2 percentage points from 91% in 2013 to 93% by December 31, 2015
Decrease unrestrained passenger vehicle occupant fatalities in all seating positions 3 percent from the 2010-2012 calendar year average of 194 to 189 by December 31, 2015
Status of Performance Measures While the goal to increase New York’s seat belt use rate to 93% by December 31, 2015 was not achieved, the use rate in New York increased to 92%, the highest statewide rate ever reached. New York’s seat belt use rate has been at 90% or above since 2010. After increasing to 206 in 2012, the number of unrestrained passenger vehicle occupants killed in crashes has been on a downward trend. In 2014, 155 of the passenger vehicle occupant fatalities were unrestrained, meeting and exceeding the reduction target of 189 set for the end of calendar year 2015.
The number of seat belt tickets issued continued on a downward trend in 2014. Compared to 2010 when 388,452 tickets were issued for seat belt violations, 197,986 tickets were issued in 2014, a decrease of nearly 50%. The decline in the number of tickets is likely due to reductions in highway safety funding and competing priorities for enforcement resources. Despite the drop in enforcement, the state’s seat belt use rate has been at 90% or higher since 2010 and reached 92% in 2015.
91% 90% 91% 91% 92%
70%
75%
80%
85%
90%
95%
2011 2012 2013 2014 2015
SEAT BELT USE RATES
Source: NYS Annual Seat Belt Observation Surveys
192 187 206
186 155
0
50
100
150
200
250
2010 2011 2012 2013 2014
UNRESTRAINED PASSENGER VEHICLE OCCUPANT FATALITIES
Source: FARS
388,452
306,490
248,421 229,769 197,986
0
100,000
200,000
300,000
400,000
500,000
2010 2011 2012 2013 2014
TICKETS ISSUED FOR VIOLATIONS OF THE SEAT BELT LAW
Sources: NYS TSLED and AA systems
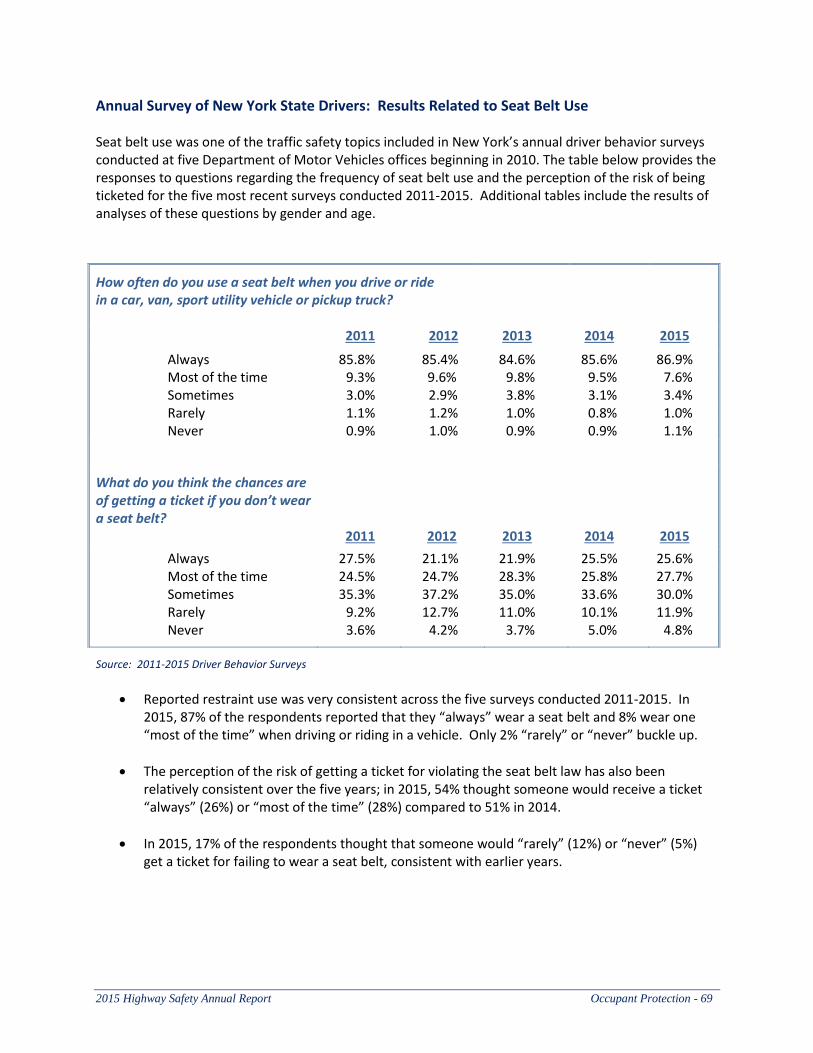
2015 Highway Safety Annual Report Occupant Protection - 69
Annual Survey of New York State Drivers: Results Related to Seat Belt Use Seat belt use was one of the traffic safety topics included in New York’s annual driver behavior surveys conducted at five Department of Motor Vehicles offices beginning in 2010. The table below provides the responses to questions regarding the frequency of seat belt use and the perception of the risk of being ticketed for the five most recent surveys conducted 2011-2015. Additional tables include the results of analyses of these questions by gender and age.
Source: 2011-2015 Driver Behavior Surveys
Reported restraint use was very consistent across the five surveys conducted 2011-2015. In 2015, 87% of the respondents reported that they “always” wear a seat belt and 8% wear one “most of the time” when driving or riding in a vehicle. Only 2% “rarely” or “never” buckle up.
The perception of the risk of getting a ticket for violating the seat belt law has also been relatively consistent over the five years; in 2015, 54% thought someone would receive a ticket “always” (26%) or “most of the time” (28%) compared to 51% in 2014.
In 2015, 17% of the respondents thought that someone would “rarely” (12%) or “never” (5%) get a ticket for failing to wear a seat belt, consistent with earlier years.
How often do you use a seat belt when you drive or ride in a car, van, sport utility vehicle or pickup truck?
2011 2012 2013 2014 2015
Always 85.8% 85.4% 84.6% 85.6% 86.9% Most of the time 9.3% 9.6% 9.8% 9.5% 7.6% Sometimes 3.0% 2.9% 3.8% 3.1% 3.4% Rarely 1.1% 1.2% 1.0% 0.8% 1.0% Never 0.9% 1.0% 0.9% 0.9% 1.1%
What do you think the chances are of getting a ticket if you don’t wear a seat belt?
2011 2012 2013 2014 2015
Always 27.5% 21.1% 21.9% 25.5% 25.6% Most of the time 24.5% 24.7% 28.3% 25.8% 27.7% Sometimes 35.3% 37.2% 35.0% 33.6% 30.0% Rarely 9.2% 12.7% 11.0% 10.1% 11.9% Never 3.6% 4.2% 3.7% 5.0% 4.8%
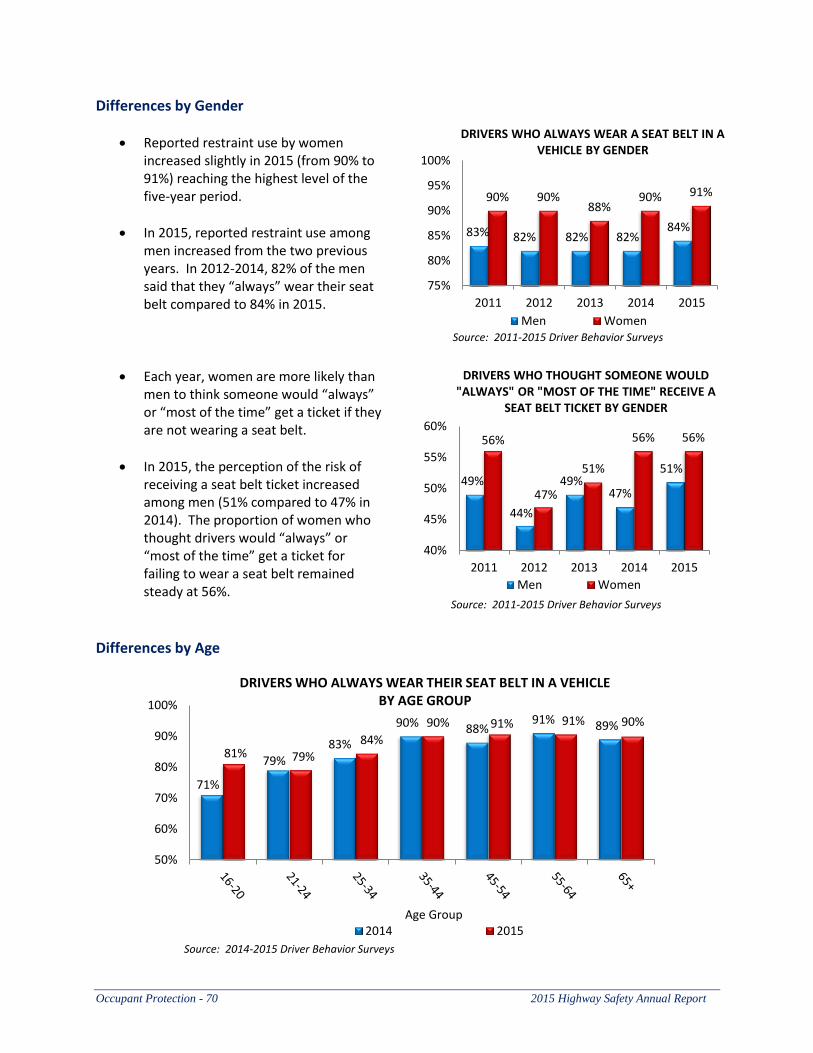
Occupant Protection - 70 2015 Highway Safety Annual Report
83% 82% 82% 82% 84%
90% 90% 88%
90% 91%
75%
80%
85%
90%
95%
100%
2011 2012 2013 2014 2015
DRIVERS WHO ALWAYS WEAR A SEAT BELT IN A VEHICLE BY GENDER
Men WomenSource: 2011-2015 Driver Behavior Surveys
49%
44%
49% 47%
51%
56%
47%
51%
56% 56%
40%
45%
50%
55%
60%
2011 2012 2013 2014 2015
DRIVERS WHO THOUGHT SOMEONE WOULD "ALWAYS" OR "MOST OF THE TIME" RECEIVE A
SEAT BELT TICKET BY GENDER
Men Women
Source: 2011-2015 Driver Behavior Surveys
Differences by Gender
Reported restraint use by women increased slightly in 2015 (from 90% to 91%) reaching the highest level of the five-year period.
In 2015, reported restraint use among men increased from the two previous years. In 2012-2014, 82% of the men said that they “always” wear their seat belt compared to 84% in 2015.
Each year, women are more likely than men to think someone would “always” or “most of the time” get a ticket if they are not wearing a seat belt.
In 2015, the perception of the risk of receiving a seat belt ticket increased among men (51% compared to 47% in 2014). The proportion of women who thought drivers would “always” or “most of the time” get a ticket for failing to wear a seat belt remained steady at 56%.
Differences by Age
71%
79% 83%
90% 88% 91% 89%
81% 79%
84%
90% 91% 91% 90%
50%
60%
70%
80%
90%
100%
DRIVERS WHO ALWAYS WEAR THEIR SEAT BELT IN A VEHICLE BY AGE GROUP
2014 2015Age Group
Source: 2014-2015 Driver Behavior Surveys
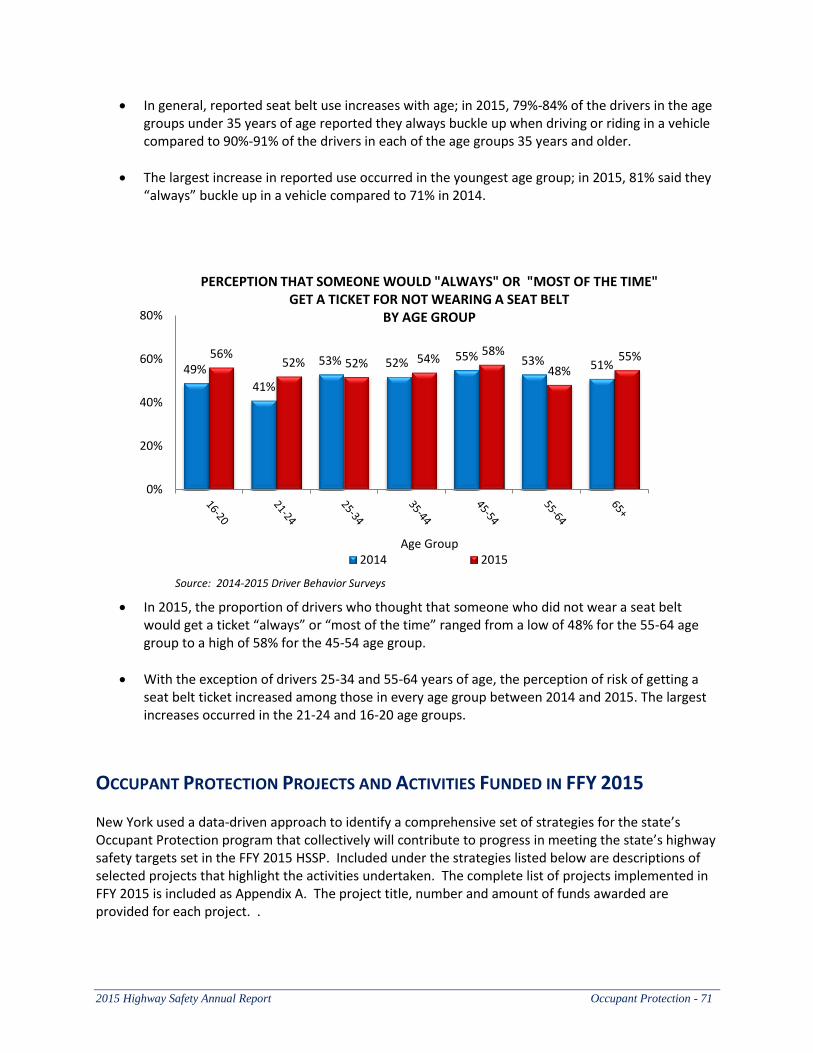
2015 Highway Safety Annual Report Occupant Protection - 71
In general, reported seat belt use increases with age; in 2015, 79%-84% of the drivers in the age groups under 35 years of age reported they always buckle up when driving or riding in a vehicle compared to 90%-91% of the drivers in each of the age groups 35 years and older.
The largest increase in reported use occurred in the youngest age group; in 2015, 81% said they “always” buckle up in a vehicle compared to 71% in 2014.
In 2015, the proportion of drivers who thought that someone who did not wear a seat belt would get a ticket “always” or “most of the time” ranged from a low of 48% for the 55-64 age group to a high of 58% for the 45-54 age group.
With the exception of drivers 25-34 and 55-64 years of age, the perception of risk of getting a seat belt ticket increased among those in every age group between 2014 and 2015. The largest increases occurred in the 21-24 and 16-20 age groups.
OCCUPANT PROTECTION PROJECTS AND ACTIVITIES FUNDED IN FFY 2015 New York used a data-driven approach to identify a comprehensive set of strategies for the state’s Occupant Protection program that collectively will contribute to progress in meeting the state’s highway safety targets set in the FFY 2015 HSSP. Included under the strategies listed below are descriptions of selected projects that highlight the activities undertaken. The complete list of projects implemented in FFY 2015 is included as Appendix A. The project title, number and amount of funds awarded are provided for each project. .
49%
41%
53% 52% 55% 53% 51% 56%
52% 52% 54% 58%
48% 55%
0%
20%
40%
60%
80%
2014 2015Age Group
PERCEPTION THAT SOMEONE WOULD "ALWAYS" OR "MOST OF THE TIME" GET A TICKET FOR NOT WEARING A SEAT BELT
BY AGE GROUP
Source: 2014-2015 Driver Behavior Surveys
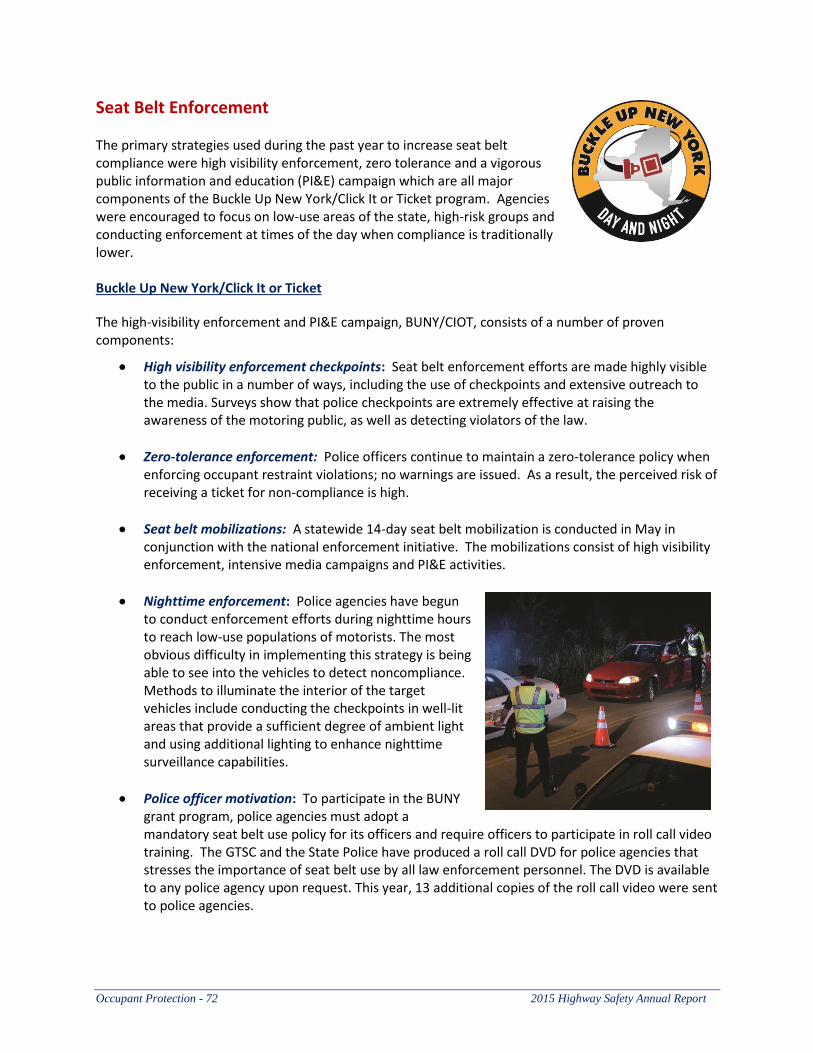
Occupant Protection - 72 2015 Highway Safety Annual Report
Seat Belt Enforcement The primary strategies used during the past year to increase seat belt compliance were high visibility enforcement, zero tolerance and a vigorous public information and education (PI&E) campaign which are all major components of the Buckle Up New York/Click It or Ticket program. Agencies were encouraged to focus on low-use areas of the state, high-risk groups and conducting enforcement at times of the day when compliance is traditionally lower. Buckle Up New York/Click It or Ticket
The high-visibility enforcement and PI&E campaign, BUNY/CIOT, consists of a number of proven components:
High visibility enforcement checkpoints: Seat belt enforcement efforts are made highly visible to the public in a number of ways, including the use of checkpoints and extensive outreach to the media. Surveys show that police checkpoints are extremely effective at raising the awareness of the motoring public, as well as detecting violators of the law.
Zero-tolerance enforcement: Police officers continue to maintain a zero-tolerance policy when enforcing occupant restraint violations; no warnings are issued. As a result, the perceived risk of receiving a ticket for non-compliance is high.
Seat belt mobilizations: A statewide 14-day seat belt mobilization is conducted in May in conjunction with the national enforcement initiative. The mobilizations consist of high visibility enforcement, intensive media campaigns and PI&E activities.
Nighttime enforcement: Police agencies have begun to conduct enforcement efforts during nighttime hours to reach low-use populations of motorists. The most obvious difficulty in implementing this strategy is being able to see into the vehicles to detect noncompliance. Methods to illuminate the interior of the target vehicles include conducting the checkpoints in well-lit areas that provide a sufficient degree of ambient light and using additional lighting to enhance nighttime surveillance capabilities.
Police officer motivation: To participate in the BUNY grant program, police agencies must adopt a mandatory seat belt use policy for its officers and require officers to participate in roll call video training. The GTSC and the State Police have produced a roll call DVD for police agencies that stresses the importance of seat belt use by all law enforcement personnel. The DVD is available to any police agency upon request. This year, 13 additional copies of the roll call video were sent to police agencies.
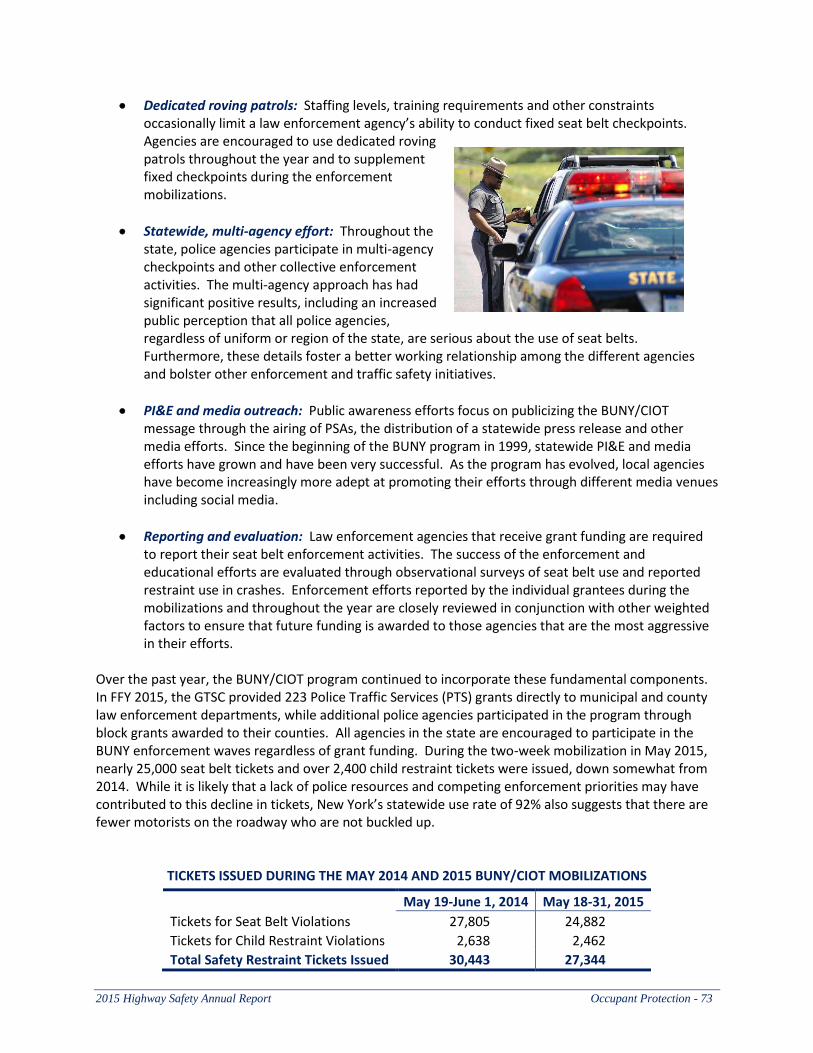
2015 Highway Safety Annual Report Occupant Protection - 73
Dedicated roving patrols: Staffing levels, training requirements and other constraints occasionally limit a law enforcement agency’s ability to conduct fixed seat belt checkpoints. Agencies are encouraged to use dedicated roving patrols throughout the year and to supplement fixed checkpoints during the enforcement mobilizations.
Statewide, multi-agency effort: Throughout the state, police agencies participate in multi-agency checkpoints and other collective enforcement activities. The multi-agency approach has had significant positive results, including an increased public perception that all police agencies, regardless of uniform or region of the state, are serious about the use of seat belts. Furthermore, these details foster a better working relationship among the different agencies and bolster other enforcement and traffic safety initiatives.
PI&E and media outreach: Public awareness efforts focus on publicizing the BUNY/CIOT message through the airing of PSAs, the distribution of a statewide press release and other media efforts. Since the beginning of the BUNY program in 1999, statewide PI&E and media efforts have grown and have been very successful. As the program has evolved, local agencies have become increasingly more adept at promoting their efforts through different media venues including social media.
Reporting and evaluation: Law enforcement agencies that receive grant funding are required to report their seat belt enforcement activities. The success of the enforcement and educational efforts are evaluated through observational surveys of seat belt use and reported restraint use in crashes. Enforcement efforts reported by the individual grantees during the mobilizations and throughout the year are closely reviewed in conjunction with other weighted factors to ensure that future funding is awarded to those agencies that are the most aggressive in their efforts.
Over the past year, the BUNY/CIOT program continued to incorporate these fundamental components. In FFY 2015, the GTSC provided 223 Police Traffic Services (PTS) grants directly to municipal and county law enforcement departments, while additional police agencies participated in the program through block grants awarded to their counties. All agencies in the state are encouraged to participate in the BUNY enforcement waves regardless of grant funding. During the two-week mobilization in May 2015, nearly 25,000 seat belt tickets and over 2,400 child restraint tickets were issued, down somewhat from 2014. While it is likely that a lack of police resources and competing enforcement priorities may have contributed to this decline in tickets, New York’s statewide use rate of 92% also suggests that there are fewer motorists on the roadway who are not buckled up.
TICKETS ISSUED DURING THE MAY 2014 AND 2015 BUNY/CIOT MOBILIZATIONS
May 19-June 1, 2014 May 18-31, 2015
Tickets for Seat Belt Violations 27,805 24,882
Tickets for Child Restraint Violations 2,638 2,462
Total Safety Restraint Tickets Issued 30,443 27,344
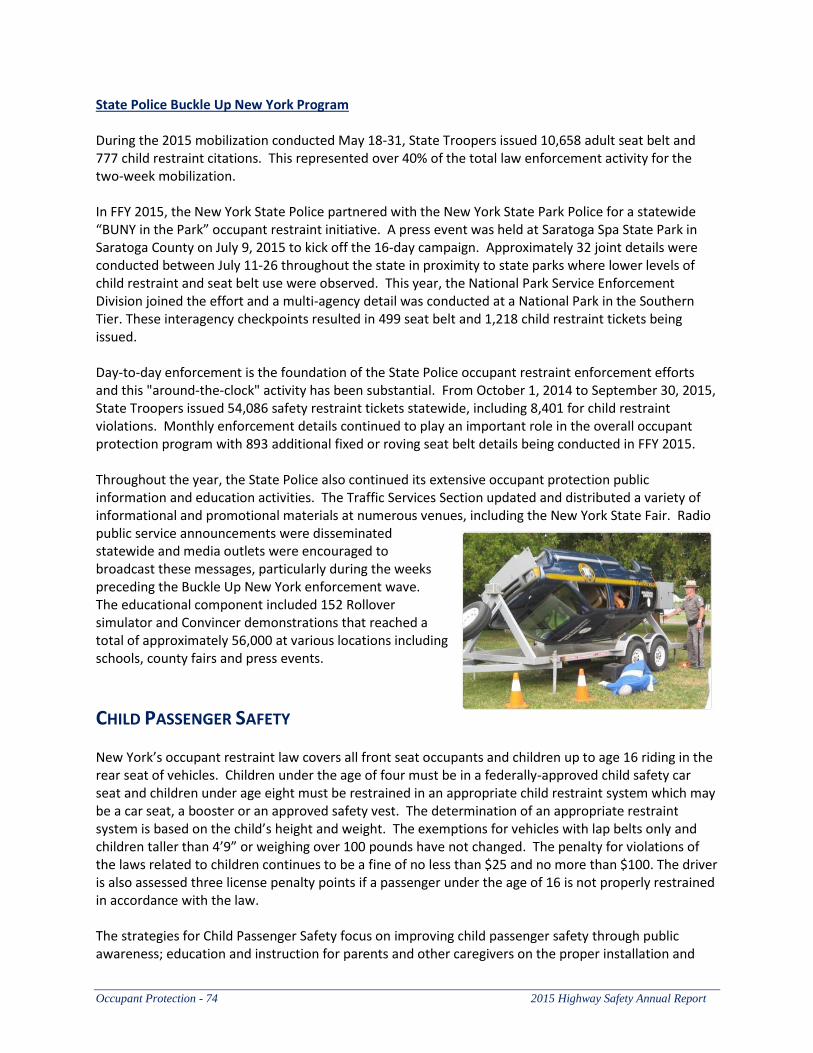
Occupant Protection - 74 2015 Highway Safety Annual Report
State Police Buckle Up New York Program During the 2015 mobilization conducted May 18-31, State Troopers issued 10,658 adult seat belt and 777 child restraint citations. This represented over 40% of the total law enforcement activity for the two-week mobilization. In FFY 2015, the New York State Police partnered with the New York State Park Police for a statewide “BUNY in the Park” occupant restraint initiative. A press event was held at Saratoga Spa State Park in Saratoga County on July 9, 2015 to kick off the 16-day campaign. Approximately 32 joint details were conducted between July 11-26 throughout the state in proximity to state parks where lower levels of child restraint and seat belt use were observed. This year, the National Park Service Enforcement Division joined the effort and a multi-agency detail was conducted at a National Park in the Southern Tier. These interagency checkpoints resulted in 499 seat belt and 1,218 child restraint tickets being issued. Day-to-day enforcement is the foundation of the State Police occupant restraint enforcement efforts and this "around-the-clock" activity has been substantial. From October 1, 2014 to September 30, 2015, State Troopers issued 54,086 safety restraint tickets statewide, including 8,401 for child restraint violations. Monthly enforcement details continued to play an important role in the overall occupant protection program with 893 additional fixed or roving seat belt details being conducted in FFY 2015. Throughout the year, the State Police also continued its extensive occupant protection public information and education activities. The Traffic Services Section updated and distributed a variety of informational and promotional materials at numerous venues, including the New York State Fair. Radio public service announcements were disseminated statewide and media outlets were encouraged to broadcast these messages, particularly during the weeks preceding the Buckle Up New York enforcement wave. The educational component included 152 Rollover simulator and Convincer demonstrations that reached a total of approximately 56,000 at various locations including schools, county fairs and press events.
CHILD PASSENGER SAFETY New York’s occupant restraint law covers all front seat occupants and children up to age 16 riding in the rear seat of vehicles. Children under the age of four must be in a federally-approved child safety car seat and children under age eight must be restrained in an appropriate child restraint system which may be a car seat, a booster or an approved safety vest. The determination of an appropriate restraint system is based on the child’s height and weight. The exemptions for vehicles with lap belts only and children taller than 4’9” or weighing over 100 pounds have not changed. The penalty for violations of the laws related to children continues to be a fine of no less than $25 and no more than $100. The driver is also assessed three license penalty points if a passenger under the age of 16 is not properly restrained in accordance with the law. The strategies for Child Passenger Safety focus on improving child passenger safety through public awareness; education and instruction for parents and other caregivers on the proper installation and
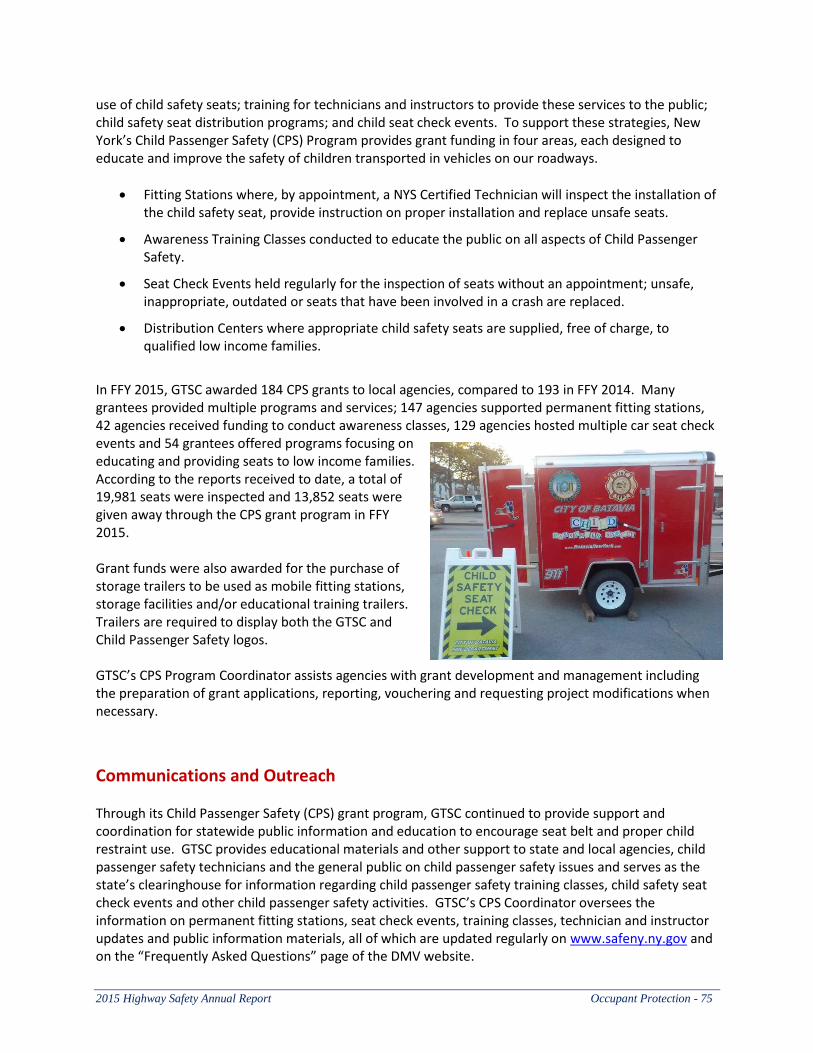
2015 Highway Safety Annual Report Occupant Protection - 75
use of child safety seats; training for technicians and instructors to provide these services to the public; child safety seat distribution programs; and child seat check events. To support these strategies, New York’s Child Passenger Safety (CPS) Program provides grant funding in four areas, each designed to educate and improve the safety of children transported in vehicles on our roadways.
Fitting Stations where, by appointment, a NYS Certified Technician will inspect the installation of the child safety seat, provide instruction on proper installation and replace unsafe seats.
Awareness Training Classes conducted to educate the public on all aspects of Child Passenger Safety.
Seat Check Events held regularly for the inspection of seats without an appointment; unsafe, inappropriate, outdated or seats that have been involved in a crash are replaced.
Distribution Centers where appropriate child safety seats are supplied, free of charge, to qualified low income families.
In FFY 2015, GTSC awarded 184 CPS grants to local agencies, compared to 193 in FFY 2014. Many grantees provided multiple programs and services; 147 agencies supported permanent fitting stations, 42 agencies received funding to conduct awareness classes, 129 agencies hosted multiple car seat check events and 54 grantees offered programs focusing on educating and providing seats to low income families. According to the reports received to date, a total of 19,981 seats were inspected and 13,852 seats were given away through the CPS grant program in FFY 2015. Grant funds were also awarded for the purchase of storage trailers to be used as mobile fitting stations, storage facilities and/or educational training trailers. Trailers are required to display both the GTSC and Child Passenger Safety logos. GTSC’s CPS Program Coordinator assists agencies with grant development and management including the preparation of grant applications, reporting, vouchering and requesting project modifications when necessary.
Communications and Outreach Through its Child Passenger Safety (CPS) grant program, GTSC continued to provide support and coordination for statewide public information and education to encourage seat belt and proper child restraint use. GTSC provides educational materials and other support to state and local agencies, child passenger safety technicians and the general public on child passenger safety issues and serves as the state’s clearinghouse for information regarding child passenger safety training classes, child safety seat check events and other child passenger safety activities. GTSC’s CPS Coordinator oversees the information on permanent fitting stations, seat check events, training classes, technician and instructor updates and public information materials, all of which are updated regularly on www.safeny.ny.gov and on the “Frequently Asked Questions” page of the DMV website.
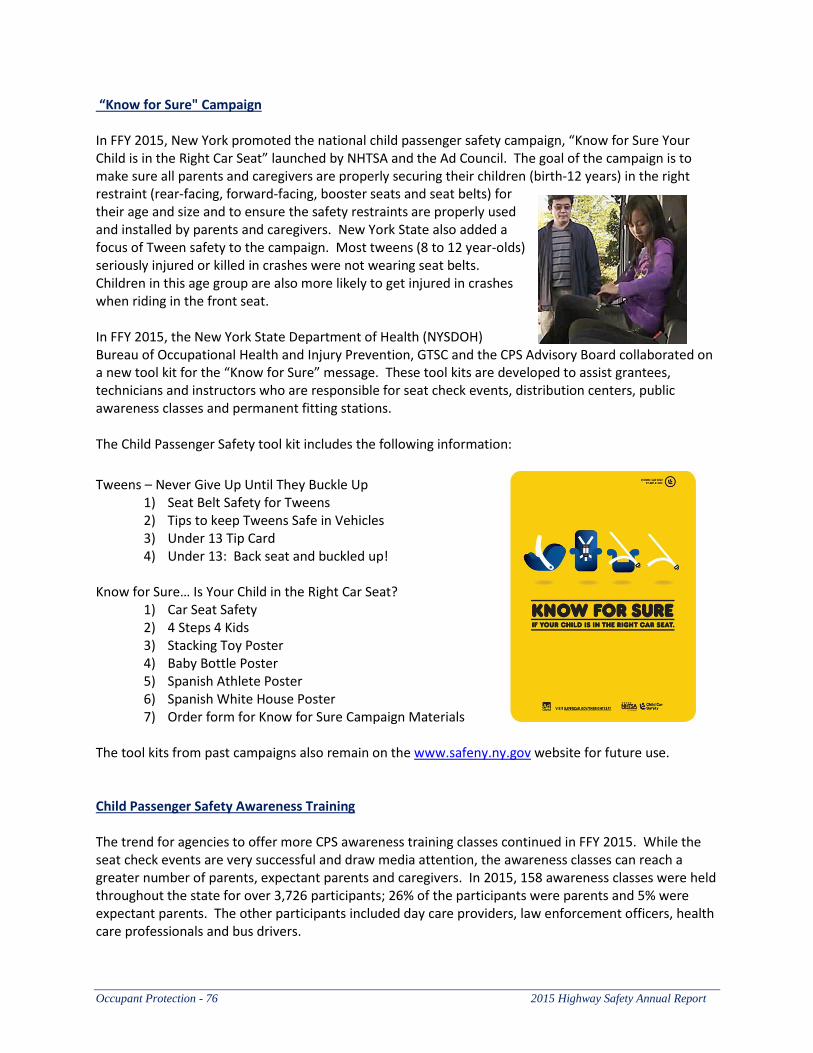
Occupant Protection - 76 2015 Highway Safety Annual Report
“Know for Sure" Campaign In FFY 2015, New York promoted the national child passenger safety campaign, “Know for Sure Your Child is in the Right Car Seat” launched by NHTSA and the Ad Council. The goal of the campaign is to make sure all parents and caregivers are properly securing their children (birth-12 years) in the right restraint (rear-facing, forward-facing, booster seats and seat belts) for their age and size and to ensure the safety restraints are properly used and installed by parents and caregivers. New York State also added a focus of Tween safety to the campaign. Most tweens (8 to 12 year-olds) seriously injured or killed in crashes were not wearing seat belts. Children in this age group are also more likely to get injured in crashes when riding in the front seat. In FFY 2015, the New York State Department of Health (NYSDOH) Bureau of Occupational Health and Injury Prevention, GTSC and the CPS Advisory Board collaborated on a new tool kit for the “Know for Sure” message. These tool kits are developed to assist grantees, technicians and instructors who are responsible for seat check events, distribution centers, public awareness classes and permanent fitting stations.
The Child Passenger Safety tool kit includes the following information:
Tweens – Never Give Up Until They Buckle Up
1) Seat Belt Safety for Tweens 2) Tips to keep Tweens Safe in Vehicles 3) Under 13 Tip Card 4) Under 13: Back seat and buckled up!
Know for Sure… Is Your Child in the Right Car Seat?
1) Car Seat Safety 2) 4 Steps 4 Kids 3) Stacking Toy Poster 4) Baby Bottle Poster 5) Spanish Athlete Poster 6) Spanish White House Poster 7) Order form for Know for Sure Campaign Materials
The tool kits from past campaigns also remain on the www.safeny.ny.gov website for future use. Child Passenger Safety Awareness Training The trend for agencies to offer more CPS awareness training classes continued in FFY 2015. While the seat check events are very successful and draw media attention, the awareness classes can reach a greater number of parents, expectant parents and caregivers. In 2015, 158 awareness classes were held throughout the state for over 3,726 participants; 26% of the participants were parents and 5% were expectant parents. The other participants included day care providers, law enforcement officers, health care professionals and bus drivers.
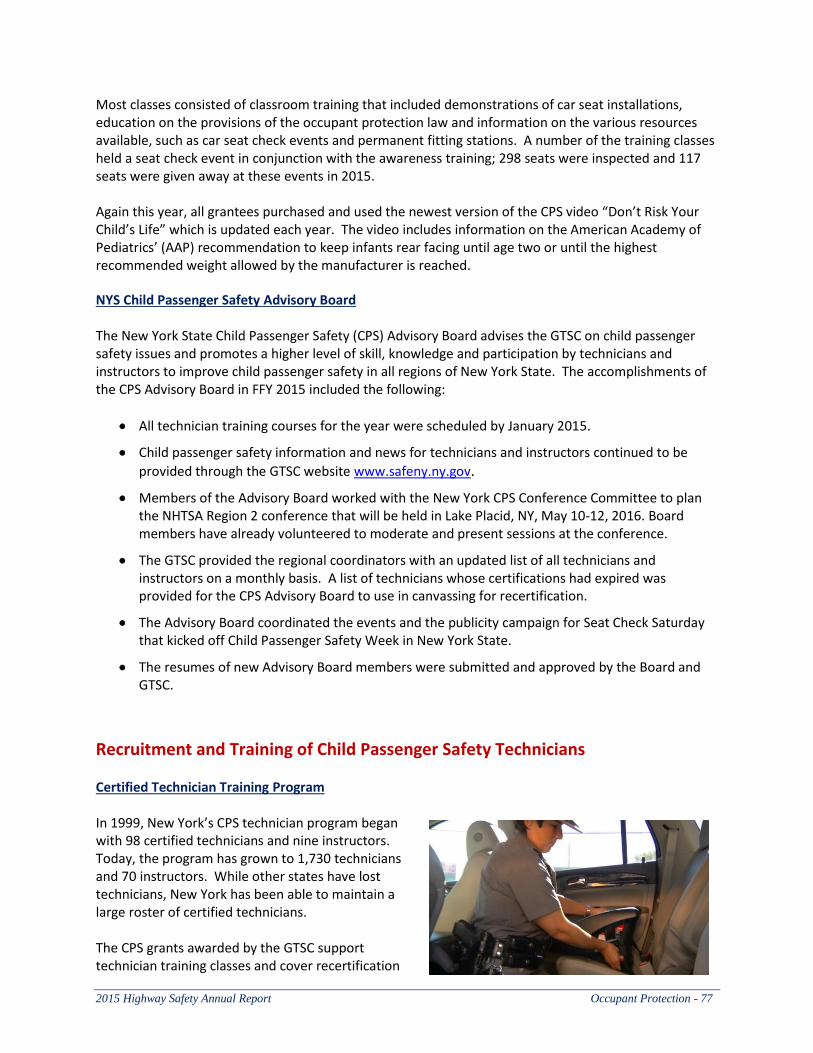
2015 Highway Safety Annual Report Occupant Protection - 77
Most classes consisted of classroom training that included demonstrations of car seat installations, education on the provisions of the occupant protection law and information on the various resources available, such as car seat check events and permanent fitting stations. A number of the training classes held a seat check event in conjunction with the awareness training; 298 seats were inspected and 117 seats were given away at these events in 2015. Again this year, all grantees purchased and used the newest version of the CPS video “Don’t Risk Your Child’s Life” which is updated each year. The video includes information on the American Academy of Pediatrics’ (AAP) recommendation to keep infants rear facing until age two or until the highest recommended weight allowed by the manufacturer is reached.
NYS Child Passenger Safety Advisory Board The New York State Child Passenger Safety (CPS) Advisory Board advises the GTSC on child passenger safety issues and promotes a higher level of skill, knowledge and participation by technicians and instructors to improve child passenger safety in all regions of New York State. The accomplishments of the CPS Advisory Board in FFY 2015 included the following:
All technician training courses for the year were scheduled by January 2015.
Child passenger safety information and news for technicians and instructors continued to be
provided through the GTSC website www.safeny.ny.gov.
Members of the Advisory Board worked with the New York CPS Conference Committee to plan the NHTSA Region 2 conference that will be held in Lake Placid, NY, May 10-12, 2016. Board members have already volunteered to moderate and present sessions at the conference.
The GTSC provided the regional coordinators with an updated list of all technicians and instructors on a monthly basis. A list of technicians whose certifications had expired was provided for the CPS Advisory Board to use in canvassing for recertification.
The Advisory Board coordinated the events and the publicity campaign for Seat Check Saturday that kicked off Child Passenger Safety Week in New York State.
The resumes of new Advisory Board members were submitted and approved by the Board and GTSC.
Recruitment and Training of Child Passenger Safety Technicians Certified Technician Training Program In 1999, New York’s CPS technician program began with 98 certified technicians and nine instructors. Today, the program has grown to 1,730 technicians and 70 instructors. While other states have lost technicians, New York has been able to maintain a large roster of certified technicians. The CPS grants awarded by the GTSC support technician training classes and cover recertification
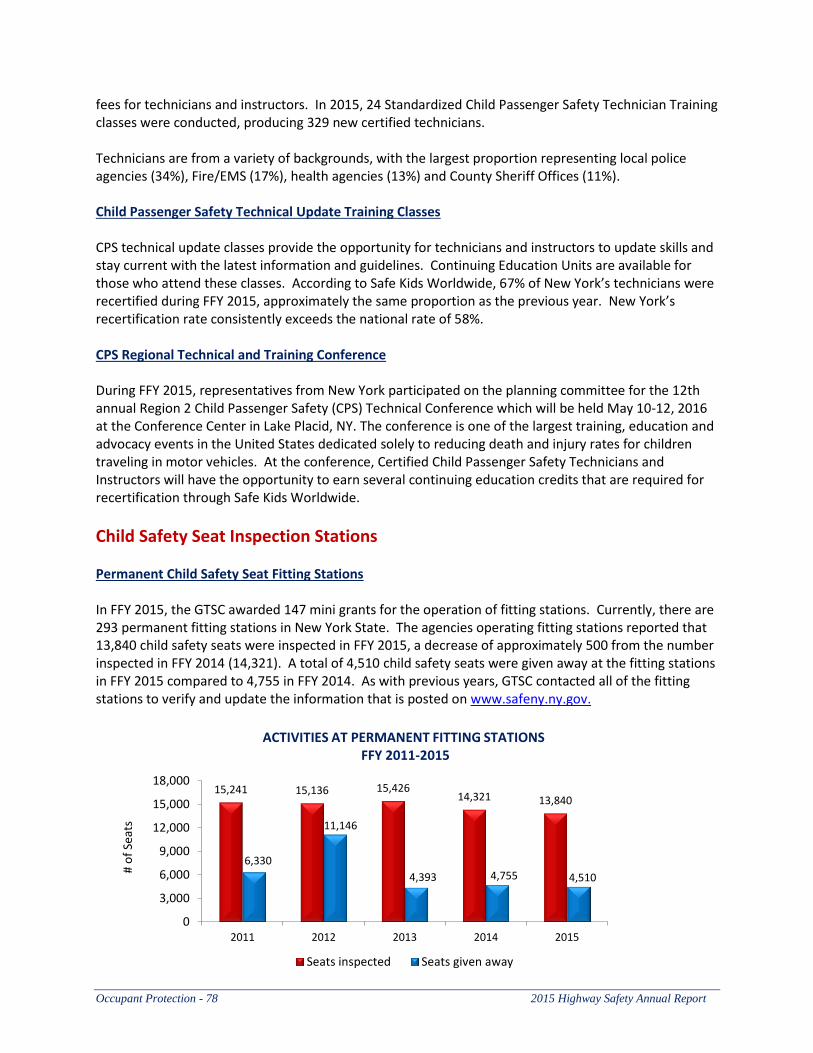
Occupant Protection - 78 2015 Highway Safety Annual Report
fees for technicians and instructors. In 2015, 24 Standardized Child Passenger Safety Technician Training classes were conducted, producing 329 new certified technicians. Technicians are from a variety of backgrounds, with the largest proportion representing local police agencies (34%), Fire/EMS (17%), health agencies (13%) and County Sheriff Offices (11%). Child Passenger Safety Technical Update Training Classes CPS technical update classes provide the opportunity for technicians and instructors to update skills and stay current with the latest information and guidelines. Continuing Education Units are available for those who attend these classes. According to Safe Kids Worldwide, 67% of New York’s technicians were recertified during FFY 2015, approximately the same proportion as the previous year. New York’s recertification rate consistently exceeds the national rate of 58%. CPS Regional Technical and Training Conference During FFY 2015, representatives from New York participated on the planning committee for the 12th annual Region 2 Child Passenger Safety (CPS) Technical Conference which will be held May 10-12, 2016 at the Conference Center in Lake Placid, NY. The conference is one of the largest training, education and advocacy events in the United States dedicated solely to reducing death and injury rates for children traveling in motor vehicles. At the conference, Certified Child Passenger Safety Technicians and Instructors will have the opportunity to earn several continuing education credits that are required for recertification through Safe Kids Worldwide.
Child Safety Seat Inspection Stations Permanent Child Safety Seat Fitting Stations In FFY 2015, the GTSC awarded 147 mini grants for the operation of fitting stations. Currently, there are 293 permanent fitting stations in New York State. The agencies operating fitting stations reported that 13,840 child safety seats were inspected in FFY 2015, a decrease of approximately 500 from the number inspected in FFY 2014 (14,321). A total of 4,510 child safety seats were given away at the fitting stations in FFY 2015 compared to 4,755 in FFY 2014. As with previous years, GTSC contacted all of the fitting stations to verify and update the information that is posted on www.safeny.ny.gov.
15,241 15,136 15,426 14,321 13,840
6,330
11,146
4,393 4,755 4,510
0
3,000
6,000
9,000
12,000
15,000
18,000
2011 2012 2013 2014 2015
# o
f Se
ats
ACTIVITIES AT PERMANENT FITTING STATIONS FFY 2011-2015
Seats inspected Seats given away
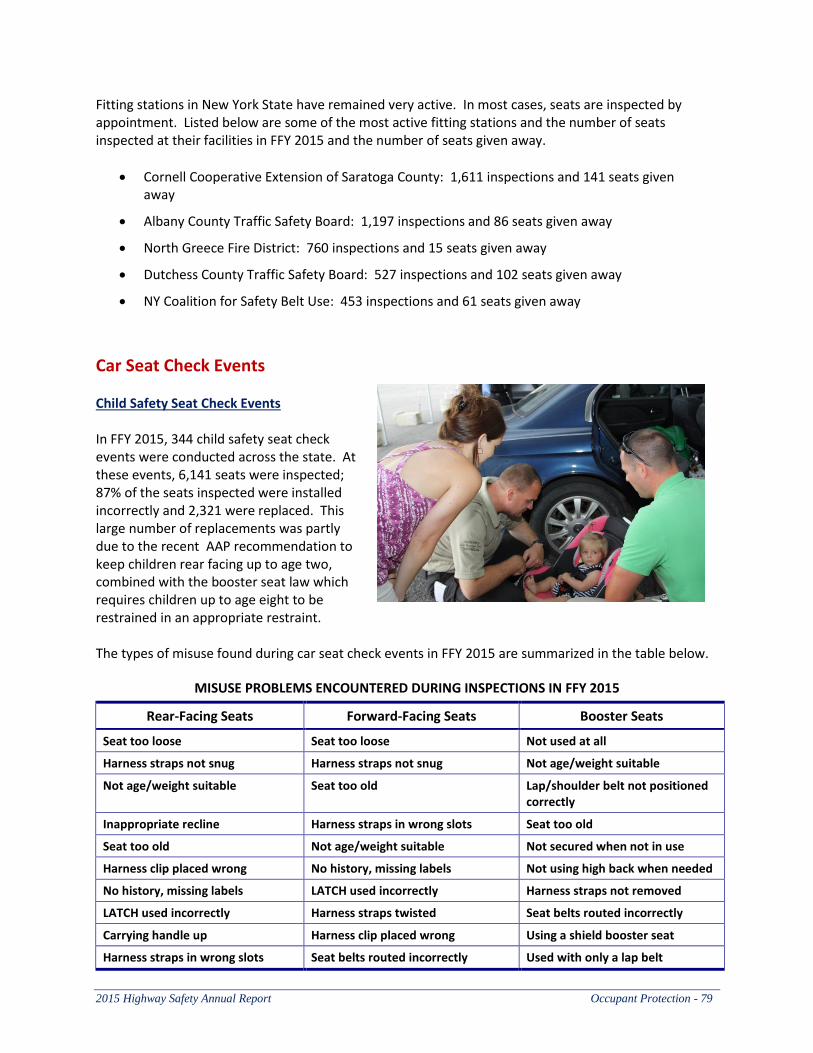
2015 Highway Safety Annual Report Occupant Protection - 79
Fitting stations in New York State have remained very active. In most cases, seats are inspected by appointment. Listed below are some of the most active fitting stations and the number of seats inspected at their facilities in FFY 2015 and the number of seats given away.
Cornell Cooperative Extension of Saratoga County: 1,611 inspections and 141 seats given away
Albany County Traffic Safety Board: 1,197 inspections and 86 seats given away
North Greece Fire District: 760 inspections and 15 seats given away
Dutchess County Traffic Safety Board: 527 inspections and 102 seats given away
NY Coalition for Safety Belt Use: 453 inspections and 61 seats given away
Car Seat Check Events Child Safety Seat Check Events In FFY 2015, 344 child safety seat check events were conducted across the state. At these events, 6,141 seats were inspected; 87% of the seats inspected were installed incorrectly and 2,321 were replaced. This large number of replacements was partly due to the recent AAP recommendation to keep children rear facing up to age two, combined with the booster seat law which requires children up to age eight to be restrained in an appropriate restraint. The types of misuse found during car seat check events in FFY 2015 are summarized in the table below.
MISUSE PROBLEMS ENCOUNTERED DURING INSPECTIONS IN FFY 2015
Rear-Facing Seats Forward-Facing Seats Booster Seats
Seat too loose Seat too loose Not used at all
Harness straps not snug Harness straps not snug Not age/weight suitable
Not age/weight suitable Seat too old Lap/shoulder belt not positioned correctly
Inappropriate recline Harness straps in wrong slots Seat too old
Seat too old Not age/weight suitable Not secured when not in use
Harness clip placed wrong No history, missing labels Not using high back when needed
No history, missing labels LATCH used incorrectly Harness straps not removed
LATCH used incorrectly Harness straps twisted Seat belts routed incorrectly
Carrying handle up Harness clip placed wrong Using a shield booster seat
Harness straps in wrong slots Seat belts routed incorrectly Used with only a lap belt
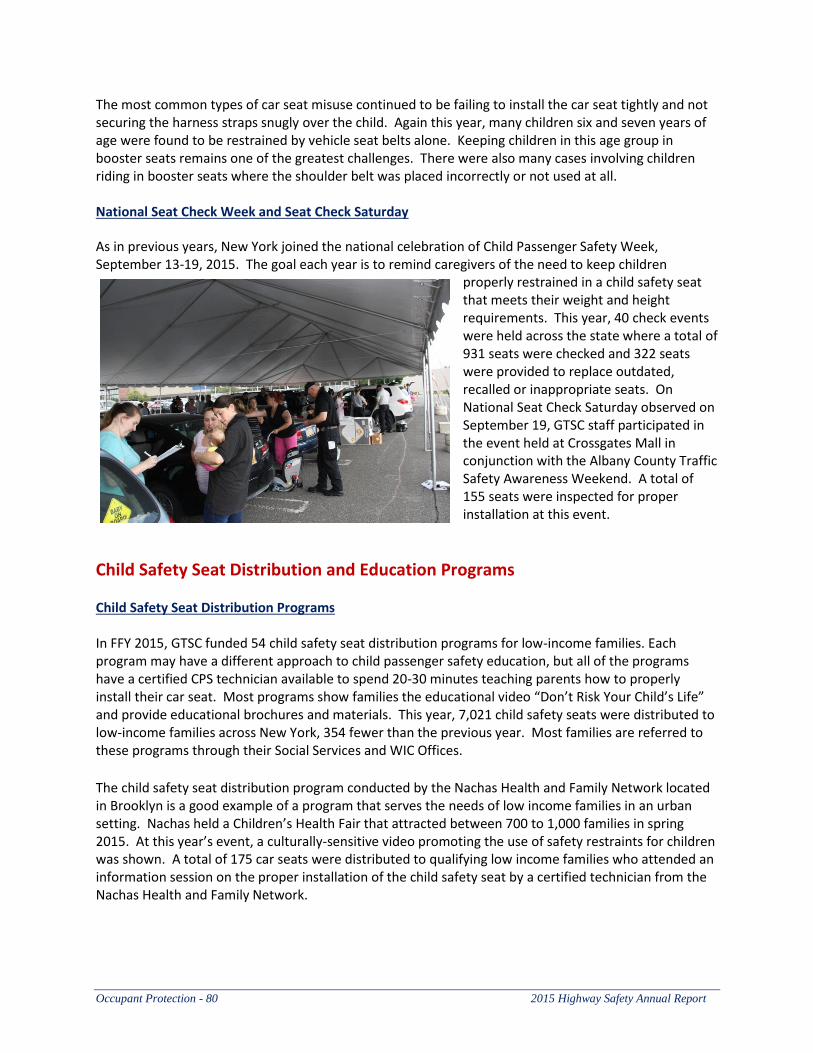
Occupant Protection - 80 2015 Highway Safety Annual Report
The most common types of car seat misuse continued to be failing to install the car seat tightly and not securing the harness straps snugly over the child. Again this year, many children six and seven years of age were found to be restrained by vehicle seat belts alone. Keeping children in this age group in booster seats remains one of the greatest challenges. There were also many cases involving children riding in booster seats where the shoulder belt was placed incorrectly or not used at all. National Seat Check Week and Seat Check Saturday
As in previous years, New York joined the national celebration of Child Passenger Safety Week, September 13-19, 2015. The goal each year is to remind caregivers of the need to keep children
properly restrained in a child safety seat that meets their weight and height requirements. This year, 40 check events were held across the state where a total of 931 seats were checked and 322 seats were provided to replace outdated, recalled or inappropriate seats. On National Seat Check Saturday observed on September 19, GTSC staff participated in the event held at Crossgates Mall in conjunction with the Albany County Traffic Safety Awareness Weekend. A total of 155 seats were inspected for proper installation at this event.
Child Safety Seat Distribution and Education Programs Child Safety Seat Distribution Programs In FFY 2015, GTSC funded 54 child safety seat distribution programs for low-income families. Each program may have a different approach to child passenger safety education, but all of the programs have a certified CPS technician available to spend 20-30 minutes teaching parents how to properly install their car seat. Most programs show families the educational video “Don’t Risk Your Child’s Life” and provide educational brochures and materials. This year, 7,021 child safety seats were distributed to low-income families across New York, 354 fewer than the previous year. Most families are referred to these programs through their Social Services and WIC Offices.
The child safety seat distribution program conducted by the Nachas Health and Family Network located in Brooklyn is a good example of a program that serves the needs of low income families in an urban setting. Nachas held a Children’s Health Fair that attracted between 700 to 1,000 families in spring 2015. At this year’s event, a culturally-sensitive video promoting the use of safety restraints for children was shown. A total of 175 car seats were distributed to qualifying low income families who attended an information session on the proper installation of the child safety seat by a certified technician from the Nachas Health and Family Network.
2015 Highway Safety Annual Report Occupant Protection - 81
Research, Evaluation and Analytical Support for New York’s Performance-Based Occupant Protection Program Statewide Observational Survey of Seat Belt Use At GTSC’s request and to meet federal requirements, the Institute for Traffic Safety Management and Research (ITSMR) conducts an annual observational survey of seat belt use in New York State. A new survey design developed in accordance with revised uniform criteria established by NHTSA was implemented for the first time in FFY 2013 and repeated in FFY 2014 and FFY 2015. The design incorporates a sampling frame that is fatality-based, rather than population-based, and includes the counties where 85% of the fatalities in passenger vehicles, vans, SUVs and light trucks occurred over the past five years. Twelve counties and 10 observation sites within each county were selected for inclusion in the survey. ITSMR staff recruited and hired survey assistants to conduct the seat belt observations in each of the counties, provided classroom and field training in the new survey protocol and data collection procedures, and supervised the survey assistants in the field. The 2015 survey was conducted in June following the national seat belt mobilization May 18-31. The results of the survey were analyzed and the required documentation was prepared for submission to NHTSA by GTSC. The statewide use rate for New York in 2015 was 92%. By maintaining a use rate of at least 90%, New York meets the criteria for a “high use” state and will be eligible again for federal 405b Occupant Protection grant funds in FFY 2017.

Occupant Protection - 82 2015 Highway Safety Annual Report
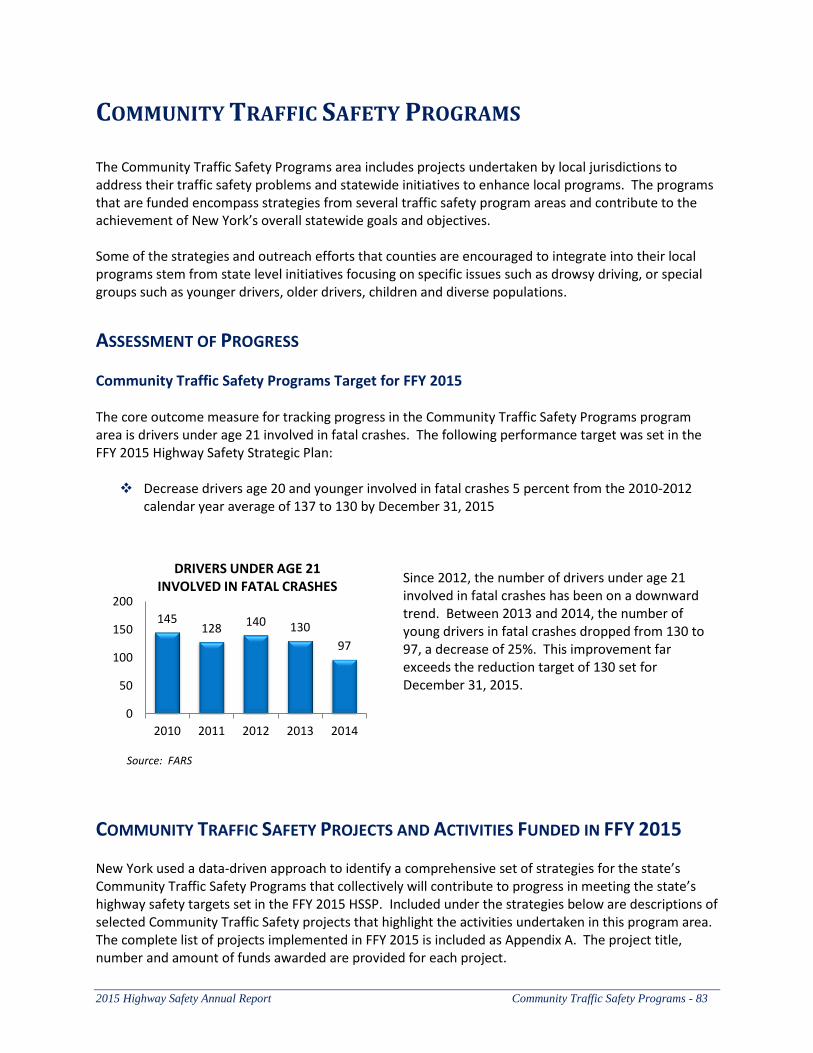
2015 Highway Safety Annual Report Community Traffic Safety Programs - 83
COMMUNITY TRAFFIC SAFETY PROGRAMS The Community Traffic Safety Programs area includes projects undertaken by local jurisdictions to address their traffic safety problems and statewide initiatives to enhance local programs. The programs that are funded encompass strategies from several traffic safety program areas and contribute to the achievement of New York’s overall statewide goals and objectives. Some of the strategies and outreach efforts that counties are encouraged to integrate into their local programs stem from state level initiatives focusing on specific issues such as drowsy driving, or special groups such as younger drivers, older drivers, children and diverse populations.
ASSESSMENT OF PROGRESS
Community Traffic Safety Programs Target for FFY 2015 The core outcome measure for tracking progress in the Community Traffic Safety Programs program area is drivers under age 21 involved in fatal crashes. The following performance target was set in the FFY 2015 Highway Safety Strategic Plan:
Decrease drivers age 20 and younger involved in fatal crashes 5 percent from the 2010-2012 calendar year average of 137 to 130 by December 31, 2015
Since 2012, the number of drivers under age 21 involved in fatal crashes has been on a downward trend. Between 2013 and 2014, the number of young drivers in fatal crashes dropped from 130 to 97, a decrease of 25%. This improvement far exceeds the reduction target of 130 set for December 31, 2015.
COMMUNITY TRAFFIC SAFETY PROJECTS AND ACTIVITIES FUNDED IN FFY 2015 New York used a data-driven approach to identify a comprehensive set of strategies for the state’s Community Traffic Safety Programs that collectively will contribute to progress in meeting the state’s highway safety targets set in the FFY 2015 HSSP. Included under the strategies below are descriptions of selected Community Traffic Safety projects that highlight the activities undertaken in this program area. The complete list of projects implemented in FFY 2015 is included as Appendix A. The project title, number and amount of funds awarded are provided for each project.
145 128
140 130
97
0
50
100
150
200
2010 2011 2012 2013 2014
DRIVERS UNDER AGE 21 INVOLVED IN FATAL CRASHES
Source: FARS
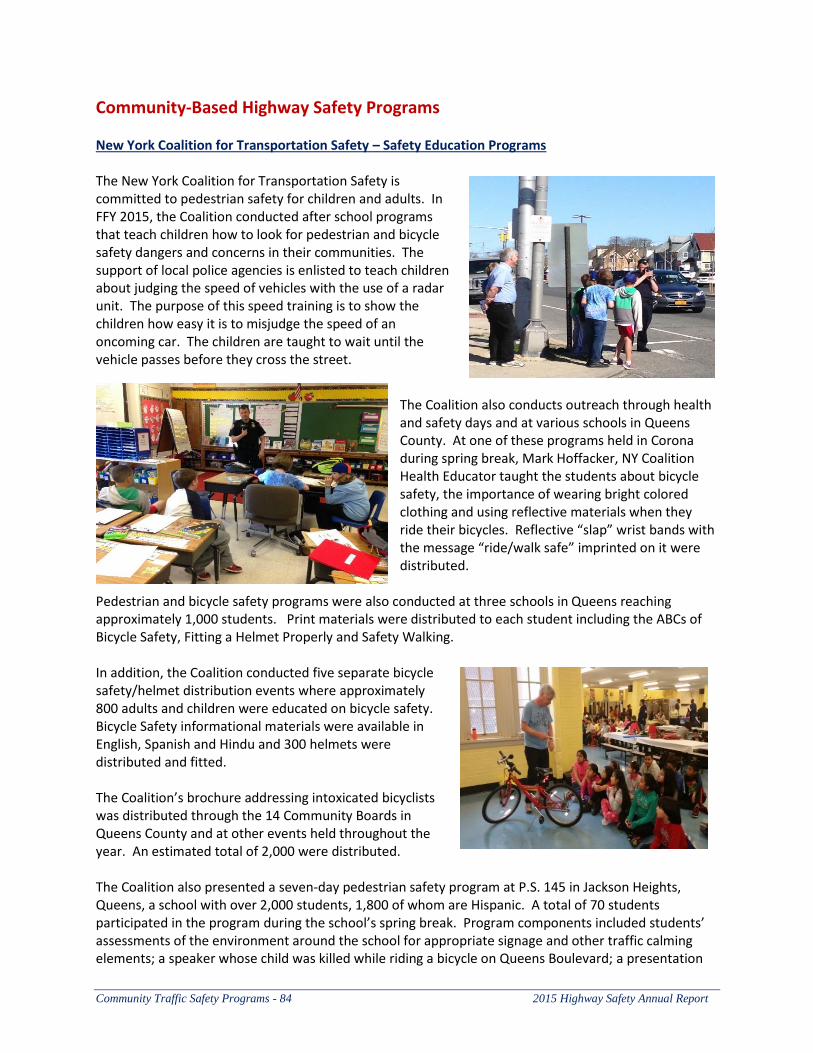
Community Traffic Safety Programs - 84 2015 Highway Safety Annual Report
Community-Based Highway Safety Programs New York Coalition for Transportation Safety – Safety Education Programs The New York Coalition for Transportation Safety is committed to pedestrian safety for children and adults. In FFY 2015, the Coalition conducted after school programs that teach children how to look for pedestrian and bicycle safety dangers and concerns in their communities. The support of local police agencies is enlisted to teach children about judging the speed of vehicles with the use of a radar unit. The purpose of this speed training is to show the children how easy it is to misjudge the speed of an oncoming car. The children are taught to wait until the vehicle passes before they cross the street.
The Coalition also conducts outreach through health and safety days and at various schools in Queens County. At one of these programs held in Corona during spring break, Mark Hoffacker, NY Coalition Health Educator taught the students about bicycle safety, the importance of wearing bright colored clothing and using reflective materials when they ride their bicycles. Reflective “slap” wrist bands with the message “ride/walk safe” imprinted on it were distributed.
Pedestrian and bicycle safety programs were also conducted at three schools in Queens reaching approximately 1,000 students. Print materials were distributed to each student including the ABCs of Bicycle Safety, Fitting a Helmet Properly and Safety Walking. In addition, the Coalition conducted five separate bicycle safety/helmet distribution events where approximately 800 adults and children were educated on bicycle safety. Bicycle Safety informational materials were available in English, Spanish and Hindu and 300 helmets were distributed and fitted. The Coalition’s brochure addressing intoxicated bicyclists was distributed through the 14 Community Boards in Queens County and at other events held throughout the year. An estimated total of 2,000 were distributed. The Coalition also presented a seven-day pedestrian safety program at P.S. 145 in Jackson Heights, Queens, a school with over 2,000 students, 1,800 of whom are Hispanic. A total of 70 students participated in the program during the school’s spring break. Program components included students’ assessments of the environment around the school for appropriate signage and other traffic calming elements; a speaker whose child was killed while riding a bicycle on Queens Boulevard; a presentation
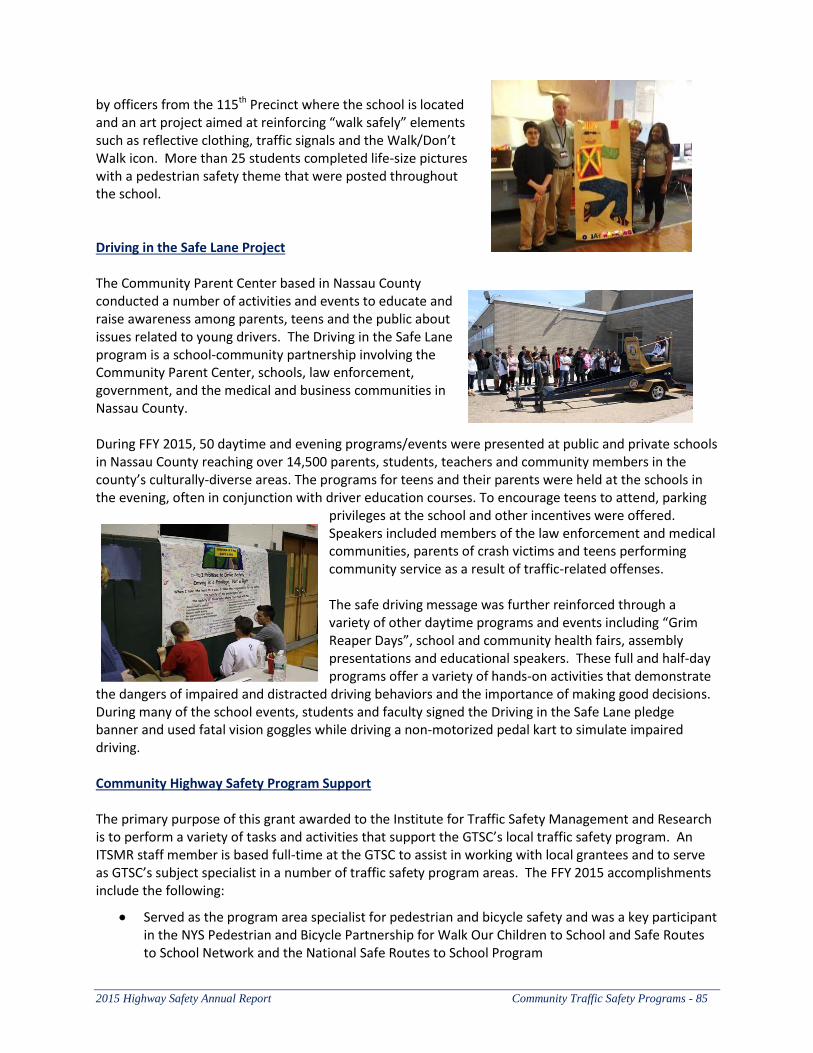
2015 Highway Safety Annual Report Community Traffic Safety Programs - 85
by officers from the 115th Precinct where the school is located and an art project aimed at reinforcing “walk safely” elements such as reflective clothing, traffic signals and the Walk/Don’t Walk icon. More than 25 students completed life-size pictures with a pedestrian safety theme that were posted throughout the school. Driving in the Safe Lane Project The Community Parent Center based in Nassau County conducted a number of activities and events to educate and raise awareness among parents, teens and the public about issues related to young drivers. The Driving in the Safe Lane program is a school-community partnership involving the Community Parent Center, schools, law enforcement, government, and the medical and business communities in Nassau County. During FFY 2015, 50 daytime and evening programs/events were presented at public and private schools in Nassau County reaching over 14,500 parents, students, teachers and community members in the county’s culturally-diverse areas. The programs for teens and their parents were held at the schools in the evening, often in conjunction with driver education courses. To encourage teens to attend, parking
privileges at the school and other incentives were offered. Speakers included members of the law enforcement and medical communities, parents of crash victims and teens performing community service as a result of traffic-related offenses. The safe driving message was further reinforced through a variety of other daytime programs and events including “Grim Reaper Days”, school and community health fairs, assembly presentations and educational speakers. These full and half-day programs offer a variety of hands-on activities that demonstrate
the dangers of impaired and distracted driving behaviors and the importance of making good decisions. During many of the school events, students and faculty signed the Driving in the Safe Lane pledge banner and used fatal vision goggles while driving a non-motorized pedal kart to simulate impaired driving. Community Highway Safety Program Support The primary purpose of this grant awarded to the Institute for Traffic Safety Management and Research is to perform a variety of tasks and activities that support the GTSC’s local traffic safety program. An ITSMR staff member is based full-time at the GTSC to assist in working with local grantees and to serve as GTSC’s subject specialist in a number of traffic safety program areas. The FFY 2015 accomplishments include the following:
Served as the program area specialist for pedestrian and bicycle safety and was a key participant in the NYS Pedestrian and Bicycle Partnership for Walk Our Children to School and Safe Routes to School Network and the National Safe Routes to School Program
Community Traffic Safety Programs - 86 2015 Highway Safety Annual Report
Worked with the Federal Highway Administration, the New York Metropolitan Transportation Council (NYMTC) and other partners to promote and coordinate training and other initiatives to address pedestrian safety in New York City
As GTSC’s program area specialist for drowsy driving, participated in New York’s Partnership Against Drowsy Driving helping to coordinate and implement programs and press events during the year
As GTSC’s subject specialist for older driver issues, worked with the Capital Region Older Driver Assistance Network, FHWA, NYS Department of Health and other GTSC grantees on initiatives to improve traffic safety among the state’s older population
Served as the liaison and provided outreach services to local programs in several Upstate counties and the five counties comprising New York City
Statewide Implementation of Traffic Safety Initiatives
New York’s Partnership Against Drowsy Driving (NYPDD) National Drowsy Driving Prevention Week: Drowsy Driving Prevention Week was November 2-7, 2014, coinciding with the beginning of daylight savings time on November 2. A statewide press release was issued by DMV on behalf of the Partnership. The press release was also posted to the DMV and GTSC websites and was included in DMV social media outreach. Variable Message Boards along the NYS Thruway displayed the “Stay Awake. Stay Alive” message for the entire week. Drowsy Driving Prevention was featured in the NYSDOH Monthly Injury Newsletter which was distributed to nearly 500 public health and traffic safety partners statewide. The NYS Motor Truck Association’s publication “Friday Final” also included an article about drowsy driving. National Sleep Awareness Week: In conjunction with National Sleep Awareness Week on March 2-8, 2015, the NYS Partnership Against Drowsy Driving coordinated a press event to alert drivers to the dangers of driving while fatigued. The press event was held March 5 at the Guilderland Rest Area on the NYS Thruway. A press release was issued by the DMV and the NYS Thruway Authority released a media advisory. Speakers at the press event included Rebecca Grey, (Director, NYSDOH, Division of Home and Community-Based Services), Todd Westhuis, P.E. (Director, NYSDOT Operations Division, Office of Traffic Safety and Mobility), Dr. Siobhan Kuhar (Albany Regional Sleep Disorder Center) and Robert Vancavage, (President of the NYS Automobile Dealers Association). In addition to the speakers, McDonald’s provided free coffee during the hour and anti-drowsy vehicle technology demonstrations were conducted. To raise public awareness, variable message signs with the “Stay Awake. Stay Alive” message were used on the NYS Thruway, in DOT regions 1 & 8 near the Rt.84/ NYS Thruway exchange and on the Northway I-87. NYS Department of Health (NYSDOH) The NYS Department of Health (NYSDOH) Bureau of Occupational Health and Injury Prevention assists partners in reducing traffic‐related injuries and fatalities through the Bureau’s participation in a number of initiatives.
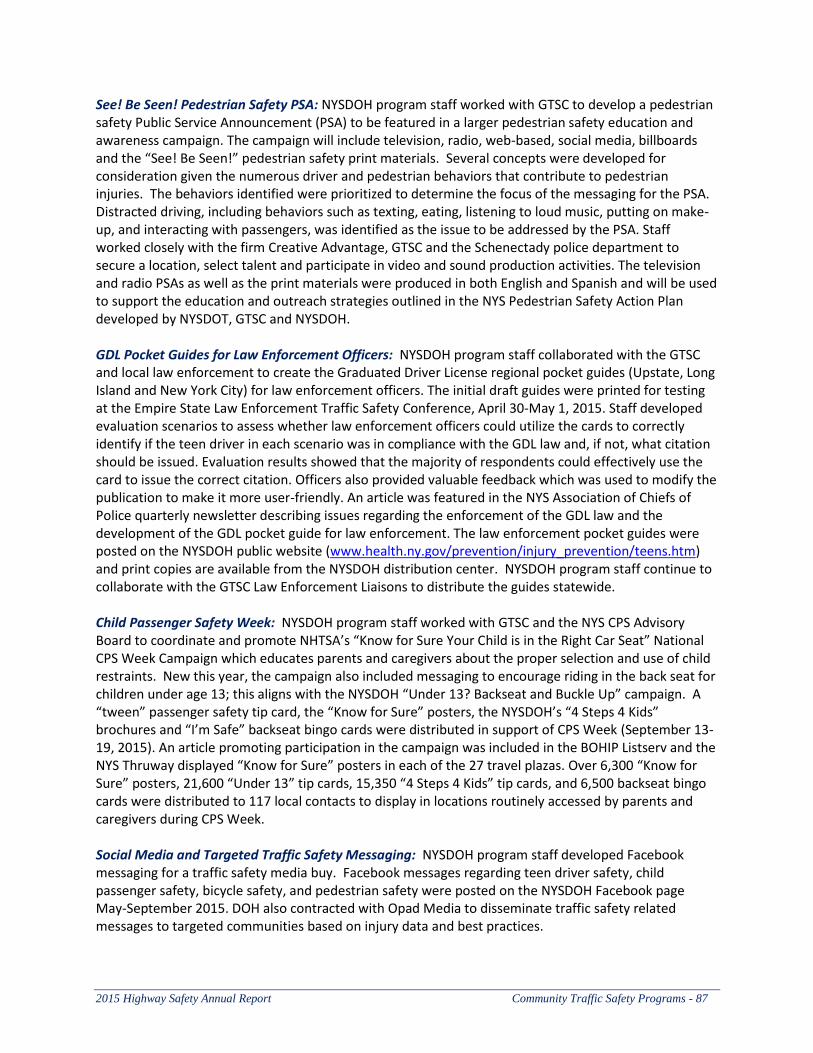
2015 Highway Safety Annual Report Community Traffic Safety Programs - 87
See! Be Seen! Pedestrian Safety PSA: NYSDOH program staff worked with GTSC to develop a pedestrian safety Public Service Announcement (PSA) to be featured in a larger pedestrian safety education and awareness campaign. The campaign will include television, radio, web-based, social media, billboards and the “See! Be Seen!” pedestrian safety print materials. Several concepts were developed for consideration given the numerous driver and pedestrian behaviors that contribute to pedestrian injuries. The behaviors identified were prioritized to determine the focus of the messaging for the PSA. Distracted driving, including behaviors such as texting, eating, listening to loud music, putting on make-up, and interacting with passengers, was identified as the issue to be addressed by the PSA. Staff worked closely with the firm Creative Advantage, GTSC and the Schenectady police department to secure a location, select talent and participate in video and sound production activities. The television and radio PSAs as well as the print materials were produced in both English and Spanish and will be used to support the education and outreach strategies outlined in the NYS Pedestrian Safety Action Plan developed by NYSDOT, GTSC and NYSDOH. GDL Pocket Guides for Law Enforcement Officers: NYSDOH program staff collaborated with the GTSC and local law enforcement to create the Graduated Driver License regional pocket guides (Upstate, Long Island and New York City) for law enforcement officers. The initial draft guides were printed for testing at the Empire State Law Enforcement Traffic Safety Conference, April 30-May 1, 2015. Staff developed evaluation scenarios to assess whether law enforcement officers could utilize the cards to correctly identify if the teen driver in each scenario was in compliance with the GDL law and, if not, what citation should be issued. Evaluation results showed that the majority of respondents could effectively use the card to issue the correct citation. Officers also provided valuable feedback which was used to modify the publication to make it more user-friendly. An article was featured in the NYS Association of Chiefs of Police quarterly newsletter describing issues regarding the enforcement of the GDL law and the development of the GDL pocket guide for law enforcement. The law enforcement pocket guides were posted on the NYSDOH public website (www.health.ny.gov/prevention/injury_prevention/teens.htm) and print copies are available from the NYSDOH distribution center. NYSDOH program staff continue to collaborate with the GTSC Law Enforcement Liaisons to distribute the guides statewide. Child Passenger Safety Week: NYSDOH program staff worked with GTSC and the NYS CPS Advisory Board to coordinate and promote NHTSA’s “Know for Sure Your Child is in the Right Car Seat” National CPS Week Campaign which educates parents and caregivers about the proper selection and use of child restraints. New this year, the campaign also included messaging to encourage riding in the back seat for children under age 13; this aligns with the NYSDOH “Under 13? Backseat and Buckle Up” campaign. A “tween” passenger safety tip card, the “Know for Sure” posters, the NYSDOH’s “4 Steps 4 Kids” brochures and “I’m Safe” backseat bingo cards were distributed in support of CPS Week (September 13-19, 2015). An article promoting participation in the campaign was included in the BOHIP Listserv and the NYS Thruway displayed “Know for Sure” posters in each of the 27 travel plazas. Over 6,300 “Know for Sure” posters, 21,600 “Under 13” tip cards, 15,350 “4 Steps 4 Kids” tip cards, and 6,500 backseat bingo cards were distributed to 117 local contacts to display in locations routinely accessed by parents and caregivers during CPS Week. Social Media and Targeted Traffic Safety Messaging: NYSDOH program staff developed Facebook messaging for a traffic safety media buy. Facebook messages regarding teen driver safety, child passenger safety, bicycle safety, and pedestrian safety were posted on the NYSDOH Facebook page May-September 2015. DOH also contracted with Opad Media to disseminate traffic safety related messages to targeted communities based on injury data and best practices.
Community Traffic Safety Programs - 88 2015 Highway Safety Annual Report
Statewide Communications and Outreach Distracted Driver Victim Advocate Program
FFY 2015 marked the fourth year of the National Safety Council’s Survivor Advocate grant to raise awareness about the dangers of distracted driving. Underwritten by the Governor’s Traffic Safety Committee, this funding provides education and outreach to traffic safety stakeholders and high risk populations. Once again, the program featured nationally-recognized distracted driving Survivor Advocate Jacy Good. Her compelling story was heard by approximately 14,000 students at educational facilities and Victim Impact Panels throughout New York State. Since the inception of the program, Jacy has spoken to groups in every region of the state and by the close of 2016 is expected to have made appearances in each county in the state. In FFY 2015, GTSC also included more speakers or Survivor Advocates in this program, expanding it into a true Speakers Bureau. In addition, the National Safety Council is exploring the feasibility of expanding this successful program to other states. Social Media Outreach In 2015, GTSC launched a Facebook page for messaging directly to New Yorkers regarding all road safety topics. The Governor’s Traffic Safety Committee of New York State Facebook page has approximately 4,500 “likes” and promoted posts on the page routinely reach 30,000 to 50,000 New Yorkers. Some of the most successful posts of the year were video PSAs, victim testimonials and posts relating to distracted driving. In 2016, GTSC plans to expand social media messaging to other platforms such as Twitter and Instagram. Commercial Motor Vehicle Safety New York State Truck Safety & Education Symposium and Safety Exhibition
The GTSC participated in the NYS Truck Safety & Education Symposium and Safety Exhibition held in Albany on March 24-25, 2015. The theme of this year’s symposium was “The Changing Face of Trucking.” Industry professionals work in an ever-changing environment and this educational opportunity provided information on anticipated changes in rules and regulations that will impact their trucking operations. Sessions were presented on how to avoid costly fines, how to prepare for litigation and tips for improving their driver recruiting and retention efforts. Two sessions were provided on national issues to improve the image of trucking and to curb the global criminal industry of human trafficking. The symposium ended with a very informal and educational law enforcement round table. Operation Safe Stop The purpose of Operation Safe Stop is to raise awareness of the risk to children posed by motorists who pass stopped school buses that are loading or unloading children at a stop. During this year’s Operation Safe Stop event held on April 16, 2015, 856 law enforcement officers issued 1,186 tickets for passing a stopped school bus. The 108 participating agencies also wrote 1,484 tickets for other traffic violations during the enforcement event. Despite the success of these enforcement efforts, each day children
2015 Highway Safety Annual Report Community Traffic Safety Programs - 89
continue to be put at risk of serious injury or death by motorists who pass stopped school buses. GTSC will continue to partner with the New York Association for Pupil Transportation (NYAPT) Operation Safe Stop Committee to promote this program and encourage police agencies and other traffic safety partners to participate in this annual enforcement initiative. New York State Annual Highway Safety Symposium Coordination At the request of GTSC, the NYS STOP-DWI Association and the NYS Association of Traffic Safety Boards, the Institute for Traffic Safety Management and Research (ITSMR) is responsible for coordinating the annual New York State Highway Safety Symposium sponsored by the three organizations. During the past year, the 2014 symposium was held October 19-22 in Lake Placid and the planning and the majority of the preparations for the 2015 symposium scheduled for October 18-21 in Binghamton were completed. A member of the ITSMR staff serves as the Event Coordinator. With direction and oversight from the symposium planning committee, the Coordinator is responsible for the following tasks:
Identifying facilities in different regions of the state suitable for hosting the symposium, negotiating contracts with the selected facilities and facilitating the execution of the contracts by the University at Albany’s fiscal officer
Developing a symposium budget and managing the symposium account, including the receipt of registration fees and the payment of symposium expenses
Other responsibilities include the symposium registration process; preparing the call for papers, save the date cards, the symposium program and all other written materials; identifying vendors and organizing the exhibit areas; and developing contracts for special services and speakers
Younger Driver Outreach and Education National Safety Council Teen Safe Driving Grant
The GTSC is participating in a National Safety Council (NSC) initiative to establish a culture of safe teen driving based on the proven principles of graduated licensing. New York was one of ten states selected by the National Safety Council to receive a grant to fund a Teen Safe Driving Coalition through the Allstate Foundation. The Coalition developed and implemented a statewide plan that involves teens, parents and community members in promoting safe driving in New York State. The primary focus has been on increasing awareness and promoting safe driving habits through the Teen Crashes GTG (Got to Go) program, which culminates in National Youth Traffic Safety Month in May. The Teen Crashes GTG program includes a tool kit that provides schools, community groups and other organizations with a set of activities and resources to implement teen driver safety programs over a one-week period between January and May. The Allstate Foundation provides $200 incentives to encourage groups to conduct these teen driver activities. The GTSC was a partner in the committee that developed the project and assisted in its promotion. The New York Teen Safe Driving Coalition also promoted local activities for National Teen Driver Safety Week in October.
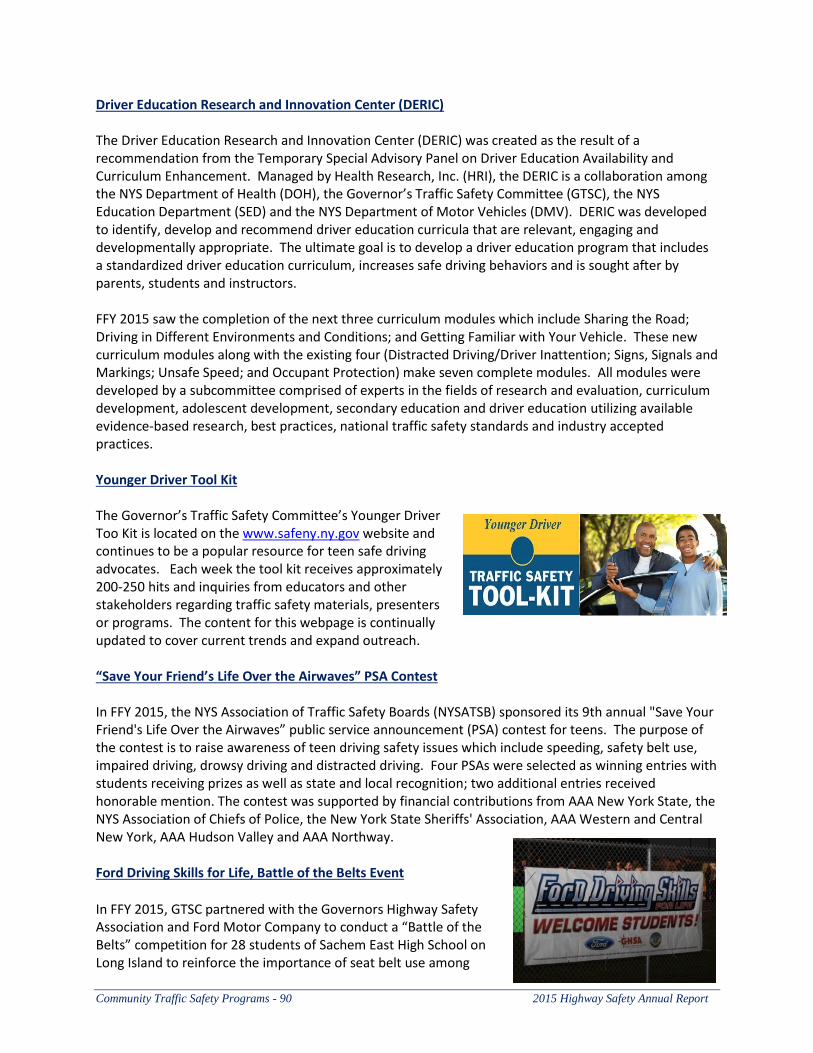
Community Traffic Safety Programs - 90 2015 Highway Safety Annual Report
Driver Education Research and Innovation Center (DERIC) The Driver Education Research and Innovation Center (DERIC) was created as the result of a recommendation from the Temporary Special Advisory Panel on Driver Education Availability and Curriculum Enhancement. Managed by Health Research, Inc. (HRI), the DERIC is a collaboration among the NYS Department of Health (DOH), the Governor’s Traffic Safety Committee (GTSC), the NYS Education Department (SED) and the NYS Department of Motor Vehicles (DMV). DERIC was developed to identify, develop and recommend driver education curricula that are relevant, engaging and developmentally appropriate. The ultimate goal is to develop a driver education program that includes a standardized driver education curriculum, increases safe driving behaviors and is sought after by parents, students and instructors. FFY 2015 saw the completion of the next three curriculum modules which include Sharing the Road; Driving in Different Environments and Conditions; and Getting Familiar with Your Vehicle. These new curriculum modules along with the existing four (Distracted Driving/Driver Inattention; Signs, Signals and Markings; Unsafe Speed; and Occupant Protection) make seven complete modules. All modules were developed by a subcommittee comprised of experts in the fields of research and evaluation, curriculum development, adolescent development, secondary education and driver education utilizing available evidence-based research, best practices, national traffic safety standards and industry accepted practices. Younger Driver Tool Kit The Governor’s Traffic Safety Committee’s Younger Driver Too Kit is located on the www.safeny.ny.gov website and continues to be a popular resource for teen safe driving advocates. Each week the tool kit receives approximately 200-250 hits and inquiries from educators and other stakeholders regarding traffic safety materials, presenters or programs. The content for this webpage is continually updated to cover current trends and expand outreach. “Save Your Friend’s Life Over the Airwaves” PSA Contest In FFY 2015, the NYS Association of Traffic Safety Boards (NYSATSB) sponsored its 9th annual "Save Your Friend's Life Over the Airwaves” public service announcement (PSA) contest for teens. The purpose of the contest is to raise awareness of teen driving safety issues which include speeding, safety belt use, impaired driving, drowsy driving and distracted driving. Four PSAs were selected as winning entries with students receiving prizes as well as state and local recognition; two additional entries received honorable mention. The contest was supported by financial contributions from AAA New York State, the NYS Association of Chiefs of Police, the New York State Sheriffs' Association, AAA Western and Central New York, AAA Hudson Valley and AAA Northway. Ford Driving Skills for Life, Battle of the Belts Event
In FFY 2015, GTSC partnered with the Governors Highway Safety Association and Ford Motor Company to conduct a “Battle of the Belts” competition for 28 students of Sachem East High School on Long Island to reinforce the importance of seat belt use among
2015 Highway Safety Annual Report Community Traffic Safety Programs - 91
teens in Suffolk County. The competition, which took place during halftime of the football game between Sachem East and Lindenhurst, coincided with National Teen Driver Safety Week, October 19-25. A grant from the Ford Driving Skills for Life Foundation helped fund the competition.
GTSC selected Suffolk County as the site of the event since more than one-third of the unrestrained front seat occupants killed or injured in Suffolk County in 2010-2012 were 16 to 24 years of age. According to a recent observational survey of seat belt use across the state, Suffolk County has one of the lowest seat belt usage rates (87.4%) in the state.
In addition to the competition, students, parents and friends were encouraged to sign a banner pledging their commitment to use seat belts every time they get behind the wheel. By the end of the evening, more than 250 individuals had signed the banner.
Older Driver Outreach and Education New York State Office for the Aging (NYSOFA)
FFY 2015 saw a change in the direction of the NYSOFA grant to address older driver safety. During the year, the partnership between GTSC and NYSOFA was successful in accomplishing the following objectives:
Launched the www.ny.gov/olderdriversafety website to educate older New York drivers about remaining safe on the roads
NYSOFA staff spoke personally with over 6,000 older New Yorkers and their caregivers at the New York State Fair about resources for older driver safety, directing them to visit the new older driver safety website or sharing the publication “Are You Concerned” with them.
Distributing the well-received Older Driver Safety episode of “Aging and You”, featuring guests Chuck Conroy, Highway Safety Program Manager with the New York State Department of Motor Vehicle; Donna Stressel, Program Director of Driving Rehabilitation Services at Sunnyview Rehabilitation Hospital; and Doctor Paul Davis, a distinguished Professor of Medicine at Albany College of Medicine and the Albany College of Pharmacy and Health Sciences.
Distributing older driver safety brochures and card racks to each of the 59 Area Agencies on Aging to share at their senior centers, meal sites and other points of contact with older drivers.
Redesigning the publication “Are You Concerned” and including additional information that will help direct older drivers to valuable resources to improve their safety.

Community Traffic Safety Programs - 92 2015 Highway Safety Annual Report
2015 Highway Safety Annual Report Traffic Records - 93
TRAFFIC RECORDS New York’s commitment to improving the state’s traffic records systems is evidenced by the progress that continues to be made in making these systems more responsive to the state’s traffic safety community. The data captured by these systems are critical to New York’s performance-based program planning processes used by the state’s traffic safety agencies and organizations to develop and implement traffic safety initiatives. New York was awarded $2.1 million in 405c traffic records funding for FFY 2015. The projects supported in this area focused on improving the timeliness, accuracy and availability of traffic safety-related data with regard to the state’s crash, citation/adjudication, driver, injury surveillance, vehicle, and roadway records systems. Initiatives were also undertaken during the past year to improve the data linkages among agencies that use traffic records systems for the purposes of problem identification, and the management and evaluation of safety programs. The many initiatives conducted in FFY 2015 were undertaken by agencies at the state and local levels, including the GTSC, the Department of Motor Vehicles (DMV), the Department of Transportation (DOT), the Department of Health (DOH), the State Police, the Metropolitan Planning Organizations (MPOs), and the Institute for Traffic Safety Management and Research (ITSMR). The strategies implemented in this program area and the progress made during FFY 2015 in attaining the performance goals and objectives are summarized below.
ASSESSMENT OF PROGRESS Traffic Records Targets for FFY 2015
To reduce the mean number of days from the date a crash occurs to the date the crash report
is entered into the AIS (Accident Information System) database from the baseline of 42.65 days (April 1, 2013-March 31, 2014) to 38.39 days (April 1, 2014-March 31, 2015)
To reduce the mean number of days from the date a citation is issued to the date the citation is entered into the TSLED database from the baseline of 23.64 days (April 1, 2013-March 31, 2014) to 21.28 days (April 1, 2014-March 31, 2015)
To reduce the mean number of days from the date of charge disposition to the date the charge disposition is entered into TSLED from the baseline of 32.74 days (April 1, 2013-March 31, 2014) to 31.10 days (April 1, 2014-March 31, 2015)
Status of Performance Measures The targets set above were based on the guidelines issued by NHTSA in FFY 2014 that revised the comparative duration periods (baseline and performance periods) for states to use in measuring progress. The table below presents the status of the performance measure targets set for FFY 2015.
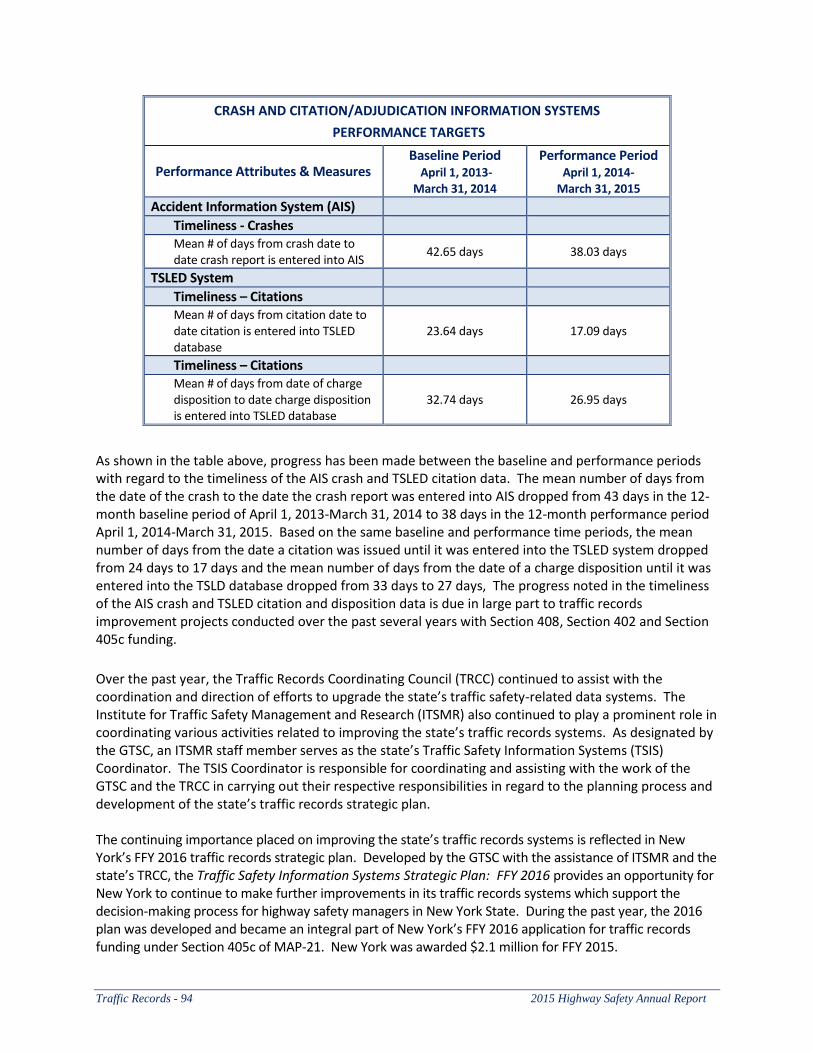
Traffic Records - 94 2015 Highway Safety Annual Report
CRASH AND CITATION/ADJUDICATION INFORMATION SYSTEMS
PERFORMANCE TARGETS
Performance Attributes & Measures Baseline Period
April 1, 2013- March 31, 2014
Performance Period April 1, 2014-
March 31, 2015
Accident Information System (AIS)
Timeliness - Crashes
Mean # of days from crash date to date crash report is entered into AIS
42.65 days 38.03 days
TSLED System
Timeliness – Citations Mean # of days from citation date to date citation is entered into TSLED database
23.64 days 17.09 days
Timeliness – Citations
Mean # of days from date of charge disposition to date charge disposition is entered into TSLED database
32.74 days 26.95 days
As shown in the table above, progress has been made between the baseline and performance periods with regard to the timeliness of the AIS crash and TSLED citation data. The mean number of days from the date of the crash to the date the crash report was entered into AIS dropped from 43 days in the 12-month baseline period of April 1, 2013-March 31, 2014 to 38 days in the 12-month performance period April 1, 2014-March 31, 2015. Based on the same baseline and performance time periods, the mean number of days from the date a citation was issued until it was entered into the TSLED system dropped from 24 days to 17 days and the mean number of days from the date of a charge disposition until it was entered into the TSLD database dropped from 33 days to 27 days, The progress noted in the timeliness of the AIS crash and TSLED citation and disposition data is due in large part to traffic records improvement projects conducted over the past several years with Section 408, Section 402 and Section 405c funding.
Over the past year, the Traffic Records Coordinating Council (TRCC) continued to assist with the coordination and direction of efforts to upgrade the state’s traffic safety-related data systems. The Institute for Traffic Safety Management and Research (ITSMR) also continued to play a prominent role in coordinating various activities related to improving the state’s traffic records systems. As designated by the GTSC, an ITSMR staff member serves as the state’s Traffic Safety Information Systems (TSIS) Coordinator. The TSIS Coordinator is responsible for coordinating and assisting with the work of the GTSC and the TRCC in carrying out their respective responsibilities in regard to the planning process and development of the state’s traffic records strategic plan. The continuing importance placed on improving the state’s traffic records systems is reflected in New York’s FFY 2016 traffic records strategic plan. Developed by the GTSC with the assistance of ITSMR and the state’s TRCC, the Traffic Safety Information Systems Strategic Plan: FFY 2016 provides an opportunity for New York to continue to make further improvements in its traffic records systems which support the decision-making process for highway safety managers in New York State. During the past year, the 2016 plan was developed and became an integral part of New York’s FFY 2016 application for traffic records funding under Section 405c of MAP-21. New York was awarded $2.1 million for FFY 2015.
2015 Highway Safety Annual Report Traffic Records - 95
During FFY 2015, ITSMR also continued to be responsible for the verification of the crash data in DMV’s Accident Information System (AIS) and for querying and extracting information from the AIS. ITSMR has similar responsibilities with regard to the TSLED and Administrative Adjudication ticket systems. ITSMR extracts and analyzes highway safety data from these systems to meet the needs of DMV and GTSC; their major state agency partners, including DOT, the State Police, and DOH; and other state and local highway safety organizations. ITSMR also assists DMV in enhancing its capability to query and retrieve information from the crash (AIS), ticket (TSLED and Administrative Adjudication) and driver license files. In addition, ITSMR continues to annotate and update the data dictionary and other database documentation materials for the AIS, as warranted. ITSMR is responsible for generating a series of statewide statistical summary reports from AIS and making them available on DMV’s website. These reports are used by police agencies and other highway safety agencies across the state. ITSMR also generates custom reports on crashes upon request. Additionally, ITSMR is responsible for responding to special requests for ticket data from the TSLED and Administrative Adjudication systems. This involves writing code to analyze the data and preparing summary tables and reports on the findings from the analyses. ITSMR assists with the coordination and direction of efforts to upgrade and link, as appropriate, the state's various traffic safety-related data systems. This involves working with the Department of Health to facilitate its annual creation of a CODES database and with the Department of Transportation to obtain more timely information on qualifying fatal and personal injury crashes involving large trucks and buses. ITSMR continued to be responsible for providing the data needed to support the development of the state’s major planning documents: the Highway Safety Strategic Plan (HSSP) and the Commercial Vehicle Safety Plan (CVSP) required for the receipt of federal highway safety funds by the GTSC and DOT. In FFY 2015, ITSMR also provided data and assisted in the preparation of the 405 grant applications and reports that were required for the receipt of several different categories of incentive funds available under MAP-21.
TRAFFIC RECORDS PROJECTS AND ACTIVITIES FUNDED IN FFY 2015
Statewide Coordination of Traffic Records Systems Improvements New York’s Traffic Records Coordinating Council (TRCC) plays a key role in coordinating improvements in the timeliness and accuracy of the state’s traffic records data systems and the availability and use of the data at all jurisdictional levels. The state’s numerous traffic safety partners make extensive use of traffic records data in the identification of traffic safety problems and potential solutions. The GTSC continues to partner with other agencies and coordinate efforts with other sources of funding to complete projects to improve traffic records systems, files and programs. During FFY 2015, these efforts resulted in the preparation of the FFY 2016 NYS Traffic Safety Information Systems Strategic Plan. The implementation of this strategic plan will continue to support improvements in the state’s various traffic records systems. Key improvements in the traffic records systems that occurred in FFY 2015 are summarized below.
Traffic Records - 96 2015 Highway Safety Annual Report
Initiatives to Improve the Crash and Citation/Adjudication Systems During FFY 2015, MAP-21 funds (Sections 405c and 402) provided continuing support to expand the electronic capture and transmission of police crash reports and traffic tickets from the field and disposition information from the courts. This support includes the purchase of equipment, such as printers, bar code readers and magnetic strip readers. As of September 2015, 473 police agencies are collecting and submitting crash and/or ticket data electronically to the DMV, up from 465 in October 2014. Nearly 90 percent of the TSLED citations and more than 60 percent of the reportable crashes submitted by the police are currently being sent to the DMV electronically. In addition, more than 1,260 of the state’s 1,400 courts are using the e-disposition process to report dispositions electronically to the DMV. The DMV continues to make improvements to its crash and ticket reporting systems through the development and implementation of both hardware and software applications. In FFY 2015, efforts continued on several projects, including 1) the development of a crash data base that can be accessed via the Internet by users for research and data analysis purposes and 2) upgrading the hardware and software associated with ALIS and updating the SIMS database to improve the accuracy and accessibility of crash location information on both linear road segments and intersections. In FFY 2015, two new projects were initiated to improve the state’s crash records systems. The first project, NYPD Direct Submission of Accident Reports Electronically to DMV, will procure consultants to assist in the development of the electronic transfer process with NYPD and the necessary changes to AIS to accept and process the data. This includes but is not limited to PDF form changes, coding changes, workflow changes and batch job changes. The second initiative, Incorporating the New York State Trauma Registry Data (NYSTR) in CODES, will link the NYSTR with the AIS and SPARCS for the first time providing more information on the true impact of motor vehicle related injuries in New York State. Both of these projects are being funded under Section 405c.
Improvement of Injury Surveillance Files During the past year, the Department of Health (DOH) continued its efforts to capture and report information from pre-hospital patient care reports (PCRs) electronically. As of November 2015, the DOH is receiving approximately 250,000 electronic submissions per month, or a total of about 3 million per year. This compares to an average of approximately 2.5 million PCR submissions annually before the new system, known as the NY State Bridge, was established. In addition, the DOH is still receiving several thousand records annually mostly from small rural services who are still using paper PCRs. The implementation of the NY State Bridge has enabled New York to capture all 82 required NEMSIS compliant data elements and transmit those data to the national data set. In addition to the required elements, the new database captures 126 other data elements. Through its CODES database, the DOH Injury Prevention Program continues to expand its capabilities to integrate crash data with hospital discharge, emergency department and emergency medical services data. Currently, 2012 is the most recent year for which New York has linked these various files.
Improvement of Driver License Data System The NYS Department of Motor Vehicles’ (DMV) automated Driver License file contains approximately 29 million records, 13 million of which are active. The file provides detailed information for all drivers who
2015 Highway Safety Annual Report Traffic Records - 97
are licensed in New York State and limited information for unlicensed or out-of-state drivers who have been convicted of a moving traffic violation or been involved in a motor vehicle crash in the state. New York is recognized as having one of the best license issuance processes in the United States, due in large part to its use of facial recognition (FR) technology to stop identity theft and driver license fraud by preventing and deterring the issuance of multiple licenses to a single individual. Upon request, ITSMR continues to assist the DMV’s Division of Field Investigation (DFI) in identifying the traffic safety concerns related to multiple licenses. The DMV’s relational address database associated with driver license records continues to improve driver license data integrity through the use of appropriate edits, cross referencing and address validation. It supports the DMV’s ability to standardize address information, reducing duplicate license records and facilitating real-time availability for relational access to client information with extended search and reporting capabilities. It also improves the notification process when licenses are suspended or revoked. Almost all of the state’s 1,400 courts have the capability to pull down information on drivers from the Driver License file for sentencing purposes through the Judicial Online Information System (JOIN).
Improvement of Vehicle Data Systems New York continues to realize the benefits from a Section 408-funded project conducted by the DMV during the two-year period, FFY 2012-2013, to improve the structure of its registration, insurance and vehicle files. The project standardized the names and addresses on the individual records in each file, established linkage capabilities between the files and enhanced existing search capabilities to allow users to search for records using multiple identifiers, as warranted. It improves the accuracy of the records in these various files through the reduction of duplicative data. Although funding was provided to NYSDOT under Section 408 in recent years to conduct its Carrier Certification Project, no progress was made in 2015 due to competing priorities within the NYSDOT. Designed to improve the accuracy of the data on for hire intrastate carriers that transport property, household goods and passengers on New York’s roadways, it is hoped that the project will get back on track during FFY 2016.
Improvement of Roadway Data Systems In FYY 2015, NYSDOT continued its project to develop and enhance its Roadway Inventory System (RIS). The RIS consolidates multiple flat files containing data on highway features and characteristics, provides more functionality and makes data entry and data analysis easier to perform. Funded under Section 408, the current process to access highway characteristics and traffic volume data is being modernized by moving functionality from SIMS into the ALIS application in order to take advantage of the more accurate and complete Roadway Inventory System (RIS) data which includes much of the local system. During 2015, NYSDOT also continued its efforts to expand the collection of traffic volume data on the local highway system enabling NYSDOT to enhance and refine its safety programs in a more equitable manner for all highways within the state. Efforts are also being continued to use new technology to improve and enhance querying/reporting capabilities, and developing linkage protocols for selected data systems, including the Safety Information Management System (SIMS), Roadway Inventory System (RIS), Bridge Data Management System (BDMS), and the Post-Implementation Evaluation System (PIES). Collectively, the results of these efforts give NYSDOT the ability to combine and analyze roadway-related
Traffic Records - 98 2015 Highway Safety Annual Report
data in support of engineering solutions that are designed to improve traffic flow, thereby reducing the effects of some dangerous driving behaviors, and to decrease crashes, fatalities and injuries.
Electronic Capture and Transmittal of Crash and Ticket Data In FFY 2015, the number of enforcement agencies, including the State Police, collecting and transmitting crash and/or ticket data to DMV electronically continued to go up, increasing from 465 in October 2014 to 473 in September 2015. The benefits stemming from the improvements made to the TraCS data movement process in 2012 have been significant, allowing higher volumes of data and more types of data to be processed. During FFY 2015, the DMV and GTSC continued to collaborate with the NYPD with regard to capturing and submitting their crash reports to DMV electronically. As of November 2015, a temporary FTP process has been set up for NYPD to send pdfs of their electronically-captured crash reports to DMV on a daily basis. DMV will be adding a new module to its image capture software that will enable pdf images to be imported automatically into the AIS system for processing. It is expected that the electronic transfer process will begin in January 2016.
Development and Use of Data Linkages In FFY 2015, New York continued its CODES (Crash Outcome Data Evaluation System) initiative, with ITSMR providing the 2013 crash data to the DOH to be linked with the DOH’s injury surveillance files. This linkage effort supports program initiatives that focus on specific population sub-groups and permits the examination of costs associated with crashes. Improvements in data linkage capabilities continue to be important in analyzing various types of motor vehicle crash information related to the driver, vehicle, type of crash, location of crash, injuries, type of medical care received and the associated costs. In FFY 2015, under a new project implemented with Section 405c funding, the DOH is integrating NYS trauma data into CODES. This project will provide the traffic safety community more information on the true impact of motor vehicle-related injuries in New York State. During FFY 2015, ITSMR continued work on its project Development of Crash Database for Public Use Via the Internet, a project that is being conducted with Section 405c funding. This project involves creating a data repository that will integrate AIS crash data, location data and eventually citation and adjudication data. It will also include other NYS-related data such as population, vehicle miles traveled, number of licensed drivers and number of vehicle registrations.
Research and Evaluation Research and evaluation continue to be vital components of the highway safety planning process. During FFY 2015, research continued to support the development, implementation and evaluation of new initiatives in conjunction with the state's 402 grant program. In addition, analytical support has been provided to traffic safety agencies and organizations at all jurisdictional levels, including the collection, analysis and reporting of data. Initiatives to provide training and technical assistance in the use of the state's traffic records systems were also supported. ITSMR provides research and evaluation support to DMV and the GTSC and its partners. ITSMR’s services include the following:
2015 Highway Safety Annual Report Traffic Records - 99
The design and conduct of research and evaluation studies for DMV and the GTSC, including studies mandated by the State Legislature
Responses to all data requests in accordance with policies and procedures established by DMV and the GTSC. The data provided in response to such requests meet a myriad of needs, from supporting internal planning efforts to providing data to the media on various highway safety issues. ITSMR also responds to ad hoc requests for highway safety data and provides information that combines data from various records systems, including ticket, crash and driver history data.
Provision of critical data services and analytical support that enable the GTSC to fulfill the requirements for receipt of federal highway safety funds under the 402 Highway Safety Program
Assistance in implementing a performance-based planning process, a requirement of the 402 Highway Safety Program since the mid-1990s
Data analyses and preparation of documentation demonstrating New York’s compliance with grant award criteria
Preparation of New York’s applications for federal Section 405 National Priority Safety Programs: Occupant Protection (405b), State Traffic Safety Information System Improvements (405c), Impaired Driving Countermeasures (405d) and Motorcyclist Safety (405f)

Traffic Records - 100 2015 Highway Safety Annual Report
2015 Highway Safety Annual Report Program Management - 101
PROGRAM MANAGEMENT
The Governor’s Traffic Safety Committee (GTSC) is responsible for the coordination and implementation of New York State’s comprehensive highway safety program, including the administration of the National Highway Traffic Safety Administration (NHTSA) 402 program. In FFY 2015, New York was also successful in qualifying for Section 405 National Priority Safety Program funds in Occupant Protection (405b), Traffic Records (405c), Impaired Driving (405d) and Motorcycle Safety (405f). Within this framework, the GTSC works with its partners and networks to conduct a data-driven process to identify highway safety problems in New York State and collectively develop evidence-based strategies and programs to address these areas of concern.
ASSESSMENT OF PROGRESS
Program Management Targets for FFY 2015
Strengthen the GTSC’s role in setting goals and priorities for the state's highway safety program
Identify highway safety problems and solutions to reduce fatalities and injuries on New York State's roadways
Continue to promote the implementation of the state’s Evidence-Based Enforcement (E-BE) Plan
Provide direction, guidance and assistance to support the efforts of public and private partners to improve highway safety
Develop and maintain policies and procedures that provide for the effective, efficient and economical operation of the highway safety program
Continue to expand technology as a means to disseminate traffic safety information, including online grant applications and using the internet to disseminate safety information through multi-media channels
Coordinate and provide training opportunities and programs for New York State’s traffic safety professionals
Support the use of performance measures as an evaluation tool in the state’s highway safety program
Improve the timeliness of grant approvals and the allocation and liquidation of funding
Status of Performance Measures GTSC was successful in meeting the targets related to the management of the state’s 402 and incentive grant programs presented in the FFY 2015 Highway Safety Strategic Plan (HSSP). The first group of targets related to identifying traffic safety problems and setting goals and priorities, promoting evidence-based enforcement, providing guidance in improving traffic safety, and developing and maintaining policies regarding the operation of the highway safety program. These targets were collectively met through the GTSC’s continued implementation of a performance-based planning approach for the statewide traffic safety program.
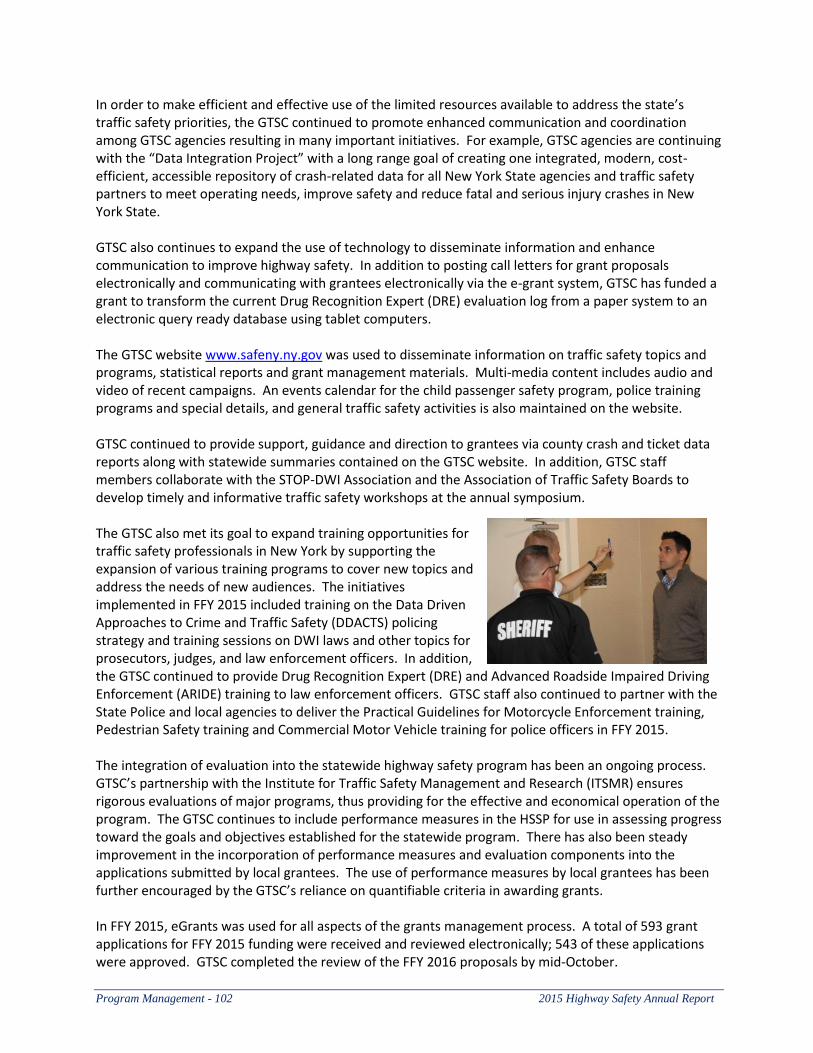
Program Management - 102 2015 Highway Safety Annual Report
In order to make efficient and effective use of the limited resources available to address the state’s traffic safety priorities, the GTSC continued to promote enhanced communication and coordination among GTSC agencies resulting in many important initiatives. For example, GTSC agencies are continuing with the “Data Integration Project” with a long range goal of creating one integrated, modern, cost- efficient, accessible repository of crash-related data for all New York State agencies and traffic safety partners to meet operating needs, improve safety and reduce fatal and serious injury crashes in New York State. GTSC also continues to expand the use of technology to disseminate information and enhance communication to improve highway safety. In addition to posting call letters for grant proposals electronically and communicating with grantees electronically via the e-grant system, GTSC has funded a grant to transform the current Drug Recognition Expert (DRE) evaluation log from a paper system to an electronic query ready database using tablet computers. The GTSC website www.safeny.ny.gov was used to disseminate information on traffic safety topics and programs, statistical reports and grant management materials. Multi-media content includes audio and video of recent campaigns. An events calendar for the child passenger safety program, police training programs and special details, and general traffic safety activities is also maintained on the website. GTSC continued to provide support, guidance and direction to grantees via county crash and ticket data reports along with statewide summaries contained on the GTSC website. In addition, GTSC staff members collaborate with the STOP-DWI Association and the Association of Traffic Safety Boards to develop timely and informative traffic safety workshops at the annual symposium. The GTSC also met its goal to expand training opportunities for traffic safety professionals in New York by supporting the expansion of various training programs to cover new topics and address the needs of new audiences. The initiatives implemented in FFY 2015 included training on the Data Driven Approaches to Crime and Traffic Safety (DDACTS) policing strategy and training sessions on DWI laws and other topics for prosecutors, judges, and law enforcement officers. In addition, the GTSC continued to provide Drug Recognition Expert (DRE) and Advanced Roadside Impaired Driving Enforcement (ARIDE) training to law enforcement officers. GTSC staff also continued to partner with the State Police and local agencies to deliver the Practical Guidelines for Motorcycle Enforcement training, Pedestrian Safety training and Commercial Motor Vehicle training for police officers in FFY 2015. The integration of evaluation into the statewide highway safety program has been an ongoing process. GTSC’s partnership with the Institute for Traffic Safety Management and Research (ITSMR) ensures rigorous evaluations of major programs, thus providing for the effective and economical operation of the program. The GTSC continues to include performance measures in the HSSP for use in assessing progress toward the goals and objectives established for the statewide program. There has also been steady improvement in the incorporation of performance measures and evaluation components into the applications submitted by local grantees. The use of performance measures by local grantees has been further encouraged by the GTSC’s reliance on quantifiable criteria in awarding grants. In FFY 2015, eGrants was used for all aspects of the grants management process. A total of 593 grant applications for FFY 2015 funding were received and reviewed electronically; 543 of these applications were approved. GTSC completed the review of the FFY 2016 proposals by mid-October.
2015 Highway Safety Annual Report Program Management - 103
PROGRAM MANAGEMENT PROJECTS AND ACTIVITIES FUNDED IN FFY 2015
New York’s Highway Safety Strategic Plan New York State Highway Safety Strategic Plan (HSSP) GTSC prepared and submitted New York State’s Highway Safety Strategic Plan (HSSP) for FFY 2016. In conjunction with the development of the HSSP, the GTSC members met at the Empire State Plaza Concourse in Albany in the fall of 2014. Each agency highlighted their priorities and activities related to traffic safety and discussed trends that should be of concern to the committee. In addition, GTSC staff met with the Association of Traffic Safety Boards to gather important data and input from the local level.
Training Opportunities Professional Development GTSC recognizes the value of professional development and supports participation by its staff and highway safety partners in relevant training and educational opportunities to increase their knowledge and awareness of traffic safety issues and to acquire new or improved skills. In FFY 2015, GTSC played an important role in the planning and delivery of several training and educational programs and supported the participation of staff and its highway safety partners in these and other professional development opportunities. Although restrictions on out-of-state travel prevented GTSC staff from participating in some conferences and training opportunities, GTSC was involved in planning several programs and events and provided support for partners to attend. GTSC’s training activities in the past year included the following:
Held the annual Governor’s Traffic Safety Committee agency meeting
Co-sponsored the annual New York State Highway Safety Symposium
Supported and participated in the delivery of training programs for certified child safety seat technicians, including sponsorship of child safety seat clinics
Supported Leandra’s Law training sessions statewide
Supported Motorcycle, Pedestrian and Commercial Motor Vehicle enforcement training sessions
Attended the New York Association for Pupil Transportation annual conference
Participated in the International Auto Show and World Traffic Safety Symposium presented by the Greater New York Automobile Dealers Association
Supported the New York Prosecutors Training Institute’s training programs related to various impaired driving issues
Coordinated the DRE, SFST and ARIDE training programs held throughout New York State
Attended and assisted at various New York State Sheriff’s Association Training Conference events
Attended and assisted at the New York State Association of Chiefs of Police Summer Training Conference
Supported the New York State Truck Safety and Educational Symposium and Safety Exhibition
Program Management - 104 2015 Highway Safety Annual Report
Participated in various Governors Highway Safety Association (GHSA) webinars relating to Program Management topics
Participated in planning the GHSA’s Annual Meeting
Participated in the New York State Association of Traffic Safety Boards and STOP-DWI Association meetings
Conducted local outreach and training in several counties
Participated in NHTSA program training
Attended the Empire State Law Enforcement Traffic Seminar (ESLETS)
Planning and Administration To meet New York State’s responsibilities for coordinating and managing the 402 highway safety program, GTSC continued to encourage and support the development of local funding proposals, conduct public information and education programs and increase access to data for problem identification and evaluation purposes. Fiscal management continued to be the focus of much of the GTSC’s planning and administrative activities. The GTSC staff manages the federal letter of credit, including the accounting, vouchering, contracting, claiming, evaluating and reporting tasks required by the federal highway safety program. In addition to the 402 program, GTSC manages and provides administrative support for STOP-DWI, as well as the Section 405 incentive grant programs. GTSC has continued to use a personal approach in administering the highway safety program. GTSC staff members are available and serve as resources in assisting local agencies in program development. A total of 151 formal grant program monitoring visits by GTSC Program Representatives were conducted in FFY 2015 and an additional 1,074 telephone monitoring contacts were completed. The Law Enforcement Liaisons (LELs) often accompany the Program Representatives on formal monitoring visits to police agencies. Program Representatives and LELs remain in contact with grantees through phone and email. In addition, the GTSC program staff and LELs participate in local traffic safety board meetings, advisory meetings, community recognition programs and safety events from bicycle rodeos to service award ceremonies. GTSC has continued to implement procedures to streamline the grant application, approval and monitoring processes, while accommodating all of the federal and state requirements. Other specific accomplishments associated with the management of the 402 program in FFY 2015 are listed below:
A Federal Cost Summary allocating $66,819,039.12 for various NHTSA highway safety programs was implemented.
New York State applied for and received the following incentive fund awards:
Section 405b Occupant Protection - $3,079,520.56
Section 405c Traffic Records - $2,110,196.86
Section 405d Impaired Driving - $7,571,626.04
Section 405f Motorcycle Programs - $238,583.07
A total of 593 applications for FFY 2015 funding were reviewed; 543 grant applications were approved.
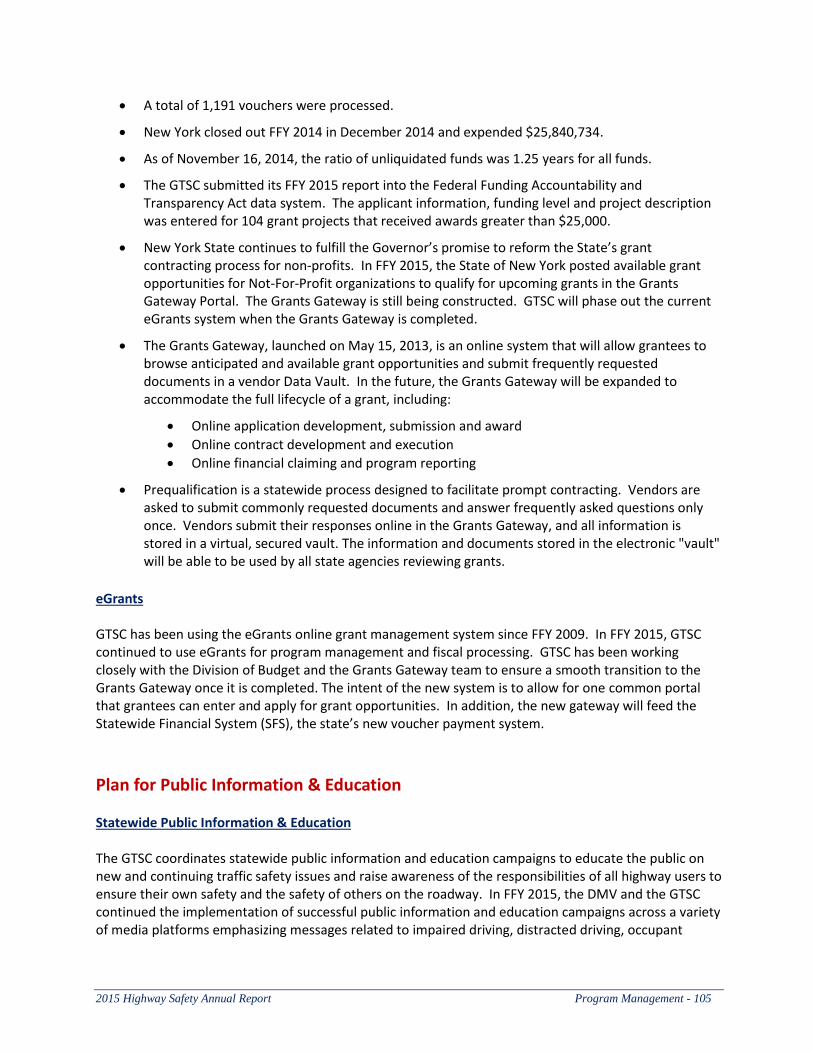
2015 Highway Safety Annual Report Program Management - 105
A total of 1,191 vouchers were processed.
New York closed out FFY 2014 in December 2014 and expended $25,840,734.
As of November 16, 2014, the ratio of unliquidated funds was 1.25 years for all funds.
The GTSC submitted its FFY 2015 report into the Federal Funding Accountability and Transparency Act data system. The applicant information, funding level and project description was entered for 104 grant projects that received awards greater than $25,000.
New York State continues to fulfill the Governor’s promise to reform the State’s grant contracting process for non-profits. In FFY 2015, the State of New York posted available grant opportunities for Not-For-Profit organizations to qualify for upcoming grants in the Grants Gateway Portal. The Grants Gateway is still being constructed. GTSC will phase out the current eGrants system when the Grants Gateway is completed.
The Grants Gateway, launched on May 15, 2013, is an online system that will allow grantees to browse anticipated and available grant opportunities and submit frequently requested documents in a vendor Data Vault. In the future, the Grants Gateway will be expanded to accommodate the full lifecycle of a grant, including:
Online application development, submission and award
Online contract development and execution
Online financial claiming and program reporting
Prequalification is a statewide process designed to facilitate prompt contracting. Vendors are asked to submit commonly requested documents and answer frequently asked questions only once. Vendors submit their responses online in the Grants Gateway, and all information is stored in a virtual, secured vault. The information and documents stored in the electronic "vault" will be able to be used by all state agencies reviewing grants.
eGrants GTSC has been using the eGrants online grant management system since FFY 2009. In FFY 2015, GTSC continued to use eGrants for program management and fiscal processing. GTSC has been working closely with the Division of Budget and the Grants Gateway team to ensure a smooth transition to the Grants Gateway once it is completed. The intent of the new system is to allow for one common portal that grantees can enter and apply for grant opportunities. In addition, the new gateway will feed the Statewide Financial System (SFS), the state’s new voucher payment system.
Plan for Public Information & Education Statewide Public Information & Education The GTSC coordinates statewide public information and education campaigns to educate the public on new and continuing traffic safety issues and raise awareness of the responsibilities of all highway users to ensure their own safety and the safety of others on the roadway. In FFY 2015, the DMV and the GTSC continued the implementation of successful public information and education campaigns across a variety of media platforms emphasizing messages related to impaired driving, distracted driving, occupant
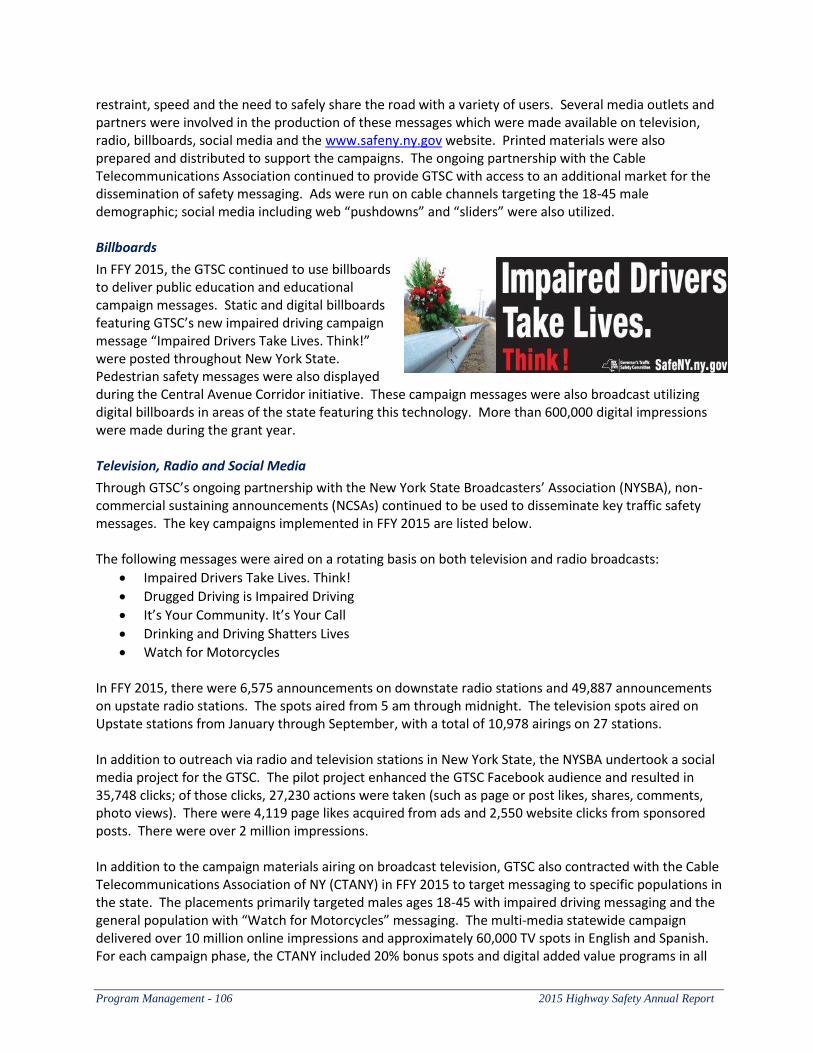
Program Management - 106 2015 Highway Safety Annual Report
restraint, speed and the need to safely share the road with a variety of users. Several media outlets and partners were involved in the production of these messages which were made available on television, radio, billboards, social media and the www.safeny.ny.gov website. Printed materials were also prepared and distributed to support the campaigns. The ongoing partnership with the Cable Telecommunications Association continued to provide GTSC with access to an additional market for the dissemination of safety messaging. Ads were run on cable channels targeting the 18-45 male demographic; social media including web “pushdowns” and “sliders” were also utilized. Billboards
In FFY 2015, the GTSC continued to use billboards to deliver public education and educational campaign messages. Static and digital billboards featuring GTSC’s new impaired driving campaign message “Impaired Drivers Take Lives. Think!” were posted throughout New York State. Pedestrian safety messages were also displayed during the Central Avenue Corridor initiative. These campaign messages were also broadcast utilizing digital billboards in areas of the state featuring this technology. More than 600,000 digital impressions were made during the grant year. Television, Radio and Social Media
Through GTSC’s ongoing partnership with the New York State Broadcasters’ Association (NYSBA), non-commercial sustaining announcements (NCSAs) continued to be used to disseminate key traffic safety messages. The key campaigns implemented in FFY 2015 are listed below. The following messages were aired on a rotating basis on both television and radio broadcasts:
Impaired Drivers Take Lives. Think!
Drugged Driving is Impaired Driving
It’s Your Community. It’s Your Call
Drinking and Driving Shatters Lives
Watch for Motorcycles In FFY 2015, there were 6,575 announcements on downstate radio stations and 49,887 announcements on upstate radio stations. The spots aired from 5 am through midnight. The television spots aired on Upstate stations from January through September, with a total of 10,978 airings on 27 stations. In addition to outreach via radio and television stations in New York State, the NYSBA undertook a social media project for the GTSC. The pilot project enhanced the GTSC Facebook audience and resulted in 35,748 clicks; of those clicks, 27,230 actions were taken (such as page or post likes, shares, comments, photo views). There were 4,119 page likes acquired from ads and 2,550 website clicks from sponsored posts. There were over 2 million impressions. In addition to the campaign materials airing on broadcast television, GTSC also contracted with the Cable Telecommunications Association of NY (CTANY) in FFY 2015 to target messaging to specific populations in the state. The placements primarily targeted males ages 18-45 with impaired driving messaging and the general population with “Watch for Motorcycles” messaging. The multi-media statewide campaign delivered over 10 million online impressions and approximately 60,000 TV spots in English and Spanish. For each campaign phase, the CTANY included 20% bonus spots and digital added value programs in all
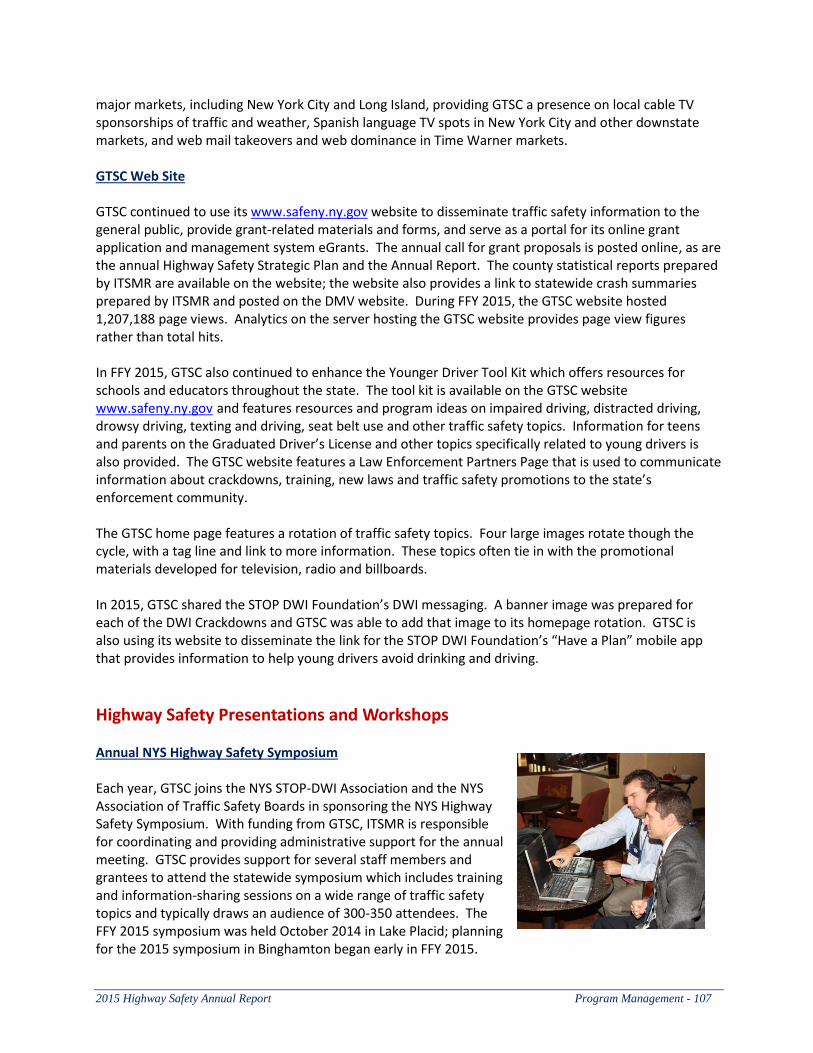
2015 Highway Safety Annual Report Program Management - 107
major markets, including New York City and Long Island, providing GTSC a presence on local cable TV sponsorships of traffic and weather, Spanish language TV spots in New York City and other downstate markets, and web mail takeovers and web dominance in Time Warner markets. GTSC Web Site GTSC continued to use its www.safeny.ny.gov website to disseminate traffic safety information to the general public, provide grant-related materials and forms, and serve as a portal for its online grant application and management system eGrants. The annual call for grant proposals is posted online, as are the annual Highway Safety Strategic Plan and the Annual Report. The county statistical reports prepared by ITSMR are available on the website; the website also provides a link to statewide crash summaries prepared by ITSMR and posted on the DMV website. During FFY 2015, the GTSC website hosted 1,207,188 page views. Analytics on the server hosting the GTSC website provides page view figures rather than total hits. In FFY 2015, GTSC also continued to enhance the Younger Driver Tool Kit which offers resources for schools and educators throughout the state. The tool kit is available on the GTSC website www.safeny.ny.gov and features resources and program ideas on impaired driving, distracted driving, drowsy driving, texting and driving, seat belt use and other traffic safety topics. Information for teens and parents on the Graduated Driver’s License and other topics specifically related to young drivers is also provided. The GTSC website features a Law Enforcement Partners Page that is used to communicate information about crackdowns, training, new laws and traffic safety promotions to the state’s enforcement community. The GTSC home page features a rotation of traffic safety topics. Four large images rotate though the cycle, with a tag line and link to more information. These topics often tie in with the promotional materials developed for television, radio and billboards. In 2015, GTSC shared the STOP DWI Foundation’s DWI messaging. A banner image was prepared for each of the DWI Crackdowns and GTSC was able to add that image to its homepage rotation. GTSC is also using its website to disseminate the link for the STOP DWI Foundation’s “Have a Plan” mobile app that provides information to help young drivers avoid drinking and driving.
Highway Safety Presentations and Workshops Annual NYS Highway Safety Symposium Each year, GTSC joins the NYS STOP-DWI Association and the NYS Association of Traffic Safety Boards in sponsoring the NYS Highway Safety Symposium. With funding from GTSC, ITSMR is responsible for coordinating and providing administrative support for the annual meeting. GTSC provides support for several staff members and grantees to attend the statewide symposium which includes training and information-sharing sessions on a wide range of traffic safety topics and typically draws an audience of 300-350 attendees. The FFY 2015 symposium was held October 2014 in Lake Placid; planning for the 2015 symposium in Binghamton began early in FFY 2015.
Program Management - 108 2015 Highway Safety Annual Report
Driver Behavior and Attitudinal Surveys The annual driver behavior and attitudinal survey was conducted by the Institute for Traffic Safety Management and Research in May and June 2015. Since 2010, questionnaires have been distributed to customers at five DMV offices in the state. The traffic safety topics covered in the survey are seat belt use, speeding, impaired driving and cell phone use and texting. ITSMR staff compiled and conducted analyses of the data including trend analyses and analyses of responses by gender and age. The results are presented in the FFY 2015 Annual Report under the relevant subject areas.