new trends of immigration into hungary and the integration ... · (okolski 1998) • the new...
TRANSCRIPT

New trends of immigration into Hungary
and the integration of immigrants
Irén GÖDRI
Driving forces behind demographic trends in Visegrad
countries: The role of migration and family formation
10–11 September 2015, Prague

Immigration after 1989 – conditions and trends
• political control over migration came to an end
• free border crossings
• migration balance turned positive
• Hungary turned into an immigration country (and
partly a transit country)
• new forms of mobility: short term – income oriented –
movements & different forms of ‘quasi-migration’
(Okolski 1998)
• the new movements were often periodic and repetitive
• current immigration to Hungary has been shaped by the
country’s accession to the EU (2004) and the new
Citizenship Act (2011)
2

Foreign citizens immigrating to Hungary and the
share of arrivals from four neighbouring countries
3
Source: Demographic Yearbooks, HCSO.
0
5 000
10 000
15 000
20 000
25 000
30 000
35 000
40 000
19
87
19
88
19
89
19
90
19
91
19
92
19
93
19
94
19
95
19
96
19
97
19
98
19
99
20
00
20
01
20
02
20
03
20
04
20
05
20
06
20
07
20
08
20
09
20
10
20
11
20
12
20
13
Year of entry
Total immigrants
From four neighbouring countries
People

Hungarian citizens born abroad and
immigrating to Hungary, 1995–2013
4
Source: Demographic Yearbooks, HCSO.
0
1 000
2 000
3 000
4 000
5 000
6 000
7 000
8 000
9 000
19
95
19
96
19
97
19
98
19
99
20
00
20
01
20
02
20
03
20
04
20
05
20
06
20
07
20
08
20
09
20
10
20
11
20
12
20
13
People
96–97% came from four
neighbouring countries
(due to new Citizenship Act)

Immigration to Hungary and the share of arrivals from
four neighbouring countries – with ’adjustment’
5
Source: Demographic Yearbooks, HCSO.
0
5 000
10 000
15 000
20 000
25 000
30 000
35 000
40 0001
98
7
19
88
19
89
19
90
19
91
19
92
19
93
19
94
19
95
19
96
19
97
19
98
19
99
20
00
20
01
20
02
20
03
20
04
20
05
20
06
20
07
20
08
20
09
20
10
20
11
20
12
20
13
Year of entry
Total immigrants – with 'adjustment'
Total immigrants
From four neighbouring countries – with 'adjustment'
From four neighbouring countries

Distribution of foreign citizens immigrating to
Hungary by country of citizenship
6
Source: Demographic Yearbooks, HCSO.
* For 2012–2013 the number of immigrants with ‘correction’.
0%
10%
20%
30%
40%
50%
60%
70%
80%
90%
100%
2000 2002 2004 2006 2008 2010 2011* 2012* 2013*
Other countries
Other As ian
China
Other European
EU15 (without
Germany)
Germany
Slovakia
Serbia
Ukra ine
Romania
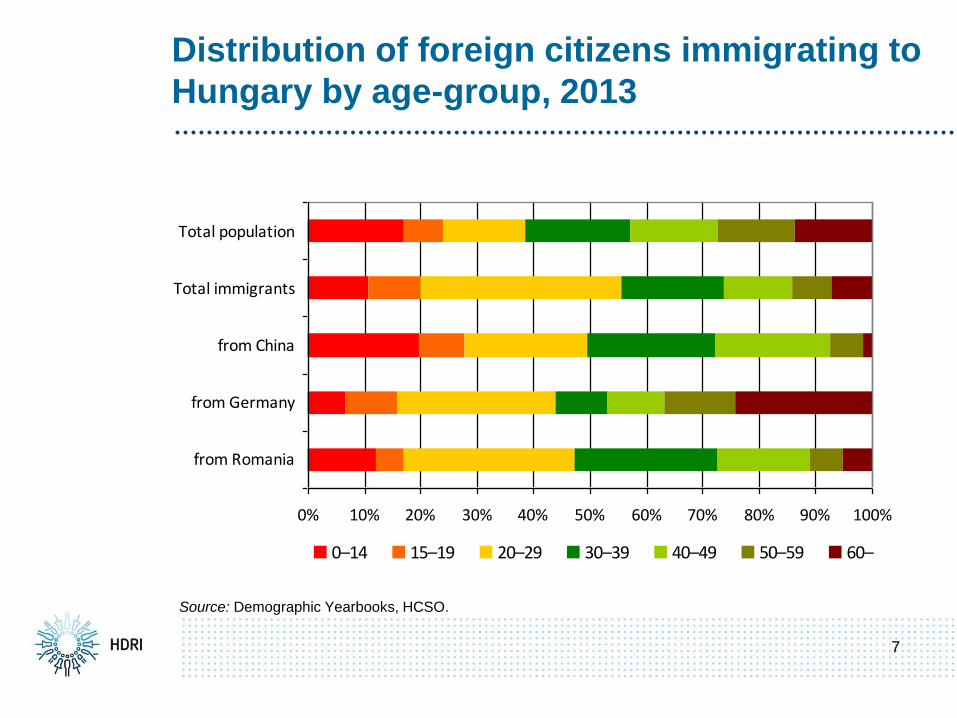
Distribution of foreign citizens immigrating to
Hungary by age-group, 2013
7
Source: Demographic Yearbooks, HCSO.
0% 10% 20% 30% 40% 50% 60% 70% 80% 90% 100%
from Romania
from Germany
from China
Total immigrants
Total population
0–14 15–19 20–29 30–39 40–49 50–59 60–

Number of foreign citizens immigrating and
crude immigration rate in European countries
8
Source: Eurostat database, author’s calculation.
0
5
10
15
20
25
30
35
40
LU CH NO BE AT SE EI UK DK DE SI ES IT NL FI FR CZ PL HU PT
2002 2012
Crude immigration rate
0
100
200
300
400
500
600
700
DE UK IT ES FR BE CH AT NL SE PL NO EI DK CZ FI HU LU SI PT
2002 2012
Thousand immigrants

Number of foreign citizens immigrating and crude
immigration rate in new EU member countries, 2013
9
Source: Eurostat database.
0
10
20
30
40
50
60
70
80
90
Poland Czech
Republic
Hungary Romania Bulgaria Slovenia Latvia Lithuania Slovakia Estonia
Thousand people
0
1
2
3
4
5
6
7
8
9
‰Foreign-national immigrants, 2013
Crude immigration rate, 2013

Asylum seekers by mode of entry and those granted
international protection in Hungary, 1990–2014
10 Source: 1990–1999 Office of Immigration and Nationality; from 2000 STADAT tables, HCSO.
+
158 thousand
registrations
in 2015 till
8 September
1990–2014: 235 thousand asylum applications
0
5 000
10 000
15 000
20 000
25 000
30 000
35 000
40 000
45 000
50 000
55 000
19
90
19
91
19
92
19
93
19
94
19
95
19
96
19
97
19
98
19
99
20
00
20
01
20
02
20
03
20
04
20
05
20
06
20
07
20
08
20
09
20
10
20
11
20
12
20
13
20
14
People
0
150
300
450
600
750
900
1 050
1 200
1 350
1 500
1 650
People
Asylum seekers – legal entry Asylum seekers – i l legal entry People with international protection (right axis)

Number and rate of asylum seekers in
top 10 European countries in first half of 2015
11
Source: Eurostat database, author’s calculation.
0
20
40
60
80
100
120
140
160
180
Germany Hungary Sweden France Italy Austria Switzerland Belgium Netherlands United
Kingdom
Thousand people
0
1
2
3
4
5
6
7
8
9‰
Number of asylum seekers
Rate of asylum seekers

Proportion of tertiary graduates in total and foreign
population aged 25+ years by sex in Hungary, 2011
12
Source: Population Census, 2011; author’s calculation.
0
5
10
15
20
25
30
35
40
25–29 30–39 40–49 50–59 60+
Foreign citizens Total population
% Men
0
5
10
15
20
25
30
35
40
25–29 30–39 40–49 50–59 60+
Foreign citizens Total population
% Women

Employment in total and foreign population
aged 15–64 years in Hungary, 2001 and 2011
13
Source: Population Census, 2001 and 2011; author’s calculation.
0
10
20
30
40
50
60
70
Foreign citizens Total population Foreign citizens Total population
2001 2011
%
0
2
4
6
8
10
12
14
%Employment rate
Unemployment rate (right axis)

Employment rates in total and foreign population
aged 20–64 years in EU-25 countries, 2013
14
Source: Eurostat (Labour Force Survey data, 2013).
35 45 55 65 75 85
Greece
Spain
Ita ly
Hungary
Poland
Malta
Slovakia
Ireland
Portugal
Cyprus
Slovenia
Belgium
Luxembourg
EU-28
Lithuania
France
Latvia
Czech Republ ic
Finland
Estonia
United Kingdom
Denmark
Austria
Netherlands
Germany
Sweden
Total population
Foreign citizens

Employment rate in total and foreign population
aged 20–64 by gender in Hungary, 2013
15
Source: Labour Force Survey, 2013.
0
10
20
30
40
50
60
70
80
90
Foreign citizens Total population Foreign citizens Total population
Men Women
%

Natural decrease counterbalanced by positive
migration balance between 2001 and 2011 (Census data)
16
– 387 000
Natural decrease
Net migration
(positive)
126 000 – 261 000
Total decrease
But: since the last years of the 2000s migration balance is
presumably negative which further accelerate population shrinkage.
