neurobiologyofdisease ...cdr.rfmh.org/publications/pdfs_nixon/yuan 2009 j neurosci.pdf ·...
TRANSCRIPT
Neurobiology of Disease
Neurofilaments Form a Highly Stable StationaryCytoskeleton after Reaching a Critical Level in Axons
Aidong Yuan,1,3* Takahiro Sasaki,1* Mala V. Rao,1,3 Asok Kumar,1,3 Vivek Kanumuri,1 David S. Dunlop,2
Ronald K. Liem,5 and Ralph A. Nixon1,3,4
1Center for Dementia Research and 2Department of Neurochemistry and Neurobiology, Nathan Kline Institute, Orangeburg, New York 10962, Departmentsof 3Psychiatry and 4Cell Biology, New York University School of Medicine, New York, New York 10016, and 5Department of Pathology, College of Physiciansand Surgeons, Columbia University, New York, New York 10032
The ultrastructural view of the axonal cytoskeleton as an extensively cross-linked network of neurofilaments (NFs) and other cytoskeletal
polymers contrasts with the dynamic view suggested by axonal transport studies on cytoskeletal elements. Here we reconcile these
perspectives by showing that neurons form a large NF network along axons which is unequivocally stationary, metabolically stable, and
maintained by NFs and nonfilamentous subunit assemblies undergoing slow transport by intermittent rapid movements and pauses. In
mouse primary cortical neurons transfected with EGFP-NFL, formation of this stationary NF network requires a critical level of NFs,
which explains its absence in NF-poor developing neurons studied previously. Most NFs at proximal axon regions were in a stationary
structure coexisting with a smaller pool of moving EGFP-NFL assemblies that were mainly nonfilamentous. Distally along the same axon,
EGFP-labeled NFL was much less abundant, and we detected only short filaments moving bidirectionally by slow transport (rapid
movements and pauses) as previously described. In living mice, �25% of radiolabeled newly synthesized NFs remained in optic axons
after slowly transported NFs had exited. Retained NF remained fixed over several months in a nonuniform distribution and exhibited
exceptionally slow turnover (t1/2 �2.5 months), implying that, at steady state, �90% of NFs in mature optic axons comprise the station-
ary cytoskeleton and �10% are undergoing slow transport. These findings reconcile in vitro and in vivo axonal transport observations,
showing that slowly transported NFs or subunit oligomers are precursors to a highly stable stationary cytoskeletal network that supports
mature axons.
IntroductionIn CNS neurons, NFs are assembled into long linear polymerscontaining four subunits, NFH, NFM, NFL, and �-internexin(Yuan et al., 2006). Because of their unique sidearms and abilityto align in parallel arrays, NFs are well suited to support theextreme polar shapes of neurons (Hirokawa, 1991) and expandaxons for optimal electrical impulse conduction (Hursh, 1939).
The kinetic behaviors of NFs and their incorporation into theaxonal cytoskeleton have long been controversial. In one view,NFs and oligomeric NF subunit assemblies undergoing slowtransport are a minor proportion of NFs in mature axons andconstitute the precursor pool for a large stationary network of NFintegrated with other cytoskeletal elements (Nixon and Logvi-nenko, 1986; Hirokawa, 1993; Nixon, 1998). While fixed in placealong axons, this network undergoes exceptionally slow turnoverand replacement by transported precursors. This model accordswell with the ultrastructure of the axonal cytoskeleton as a mesh-
work of NFs, microtubules, and actin filaments linked togetherby cross-bridging proteins (Hirokawa, 1991; Fuchs and Cleve-land, 1998; Perkins et al., 2008) and with observations that NFpersist in place in peripheral axons for many months after NFLsynthesis is turned off (Millecamps et al., 2007). According to asecond view, initially proposed by Lasek et al. (1992), NFs com-prise a single population of NFs that translocate by slow axonaltransport and are continually replaced at the proximal end bynewly synthesized NFs. More-recent studies of fluorescently la-beled NF in cultured sympathetic neurons showed that slowtransport rates reflect an average of intermittent rapid move-ments and pauses of short or longer durations (Wang et al., 2000;Trivedi et al., 2007). These two transport models have strikinglydifferent implications for explaining the architecture and stabilityof the axonal cytoskeleton and its roles as a skeletal support andstable scaffold for organelles and receptors.
To reconcile these two models, we monitored movements ofEGFP-tagged NFL assemblies in primary neurons in vitro and thelong-term fate of pulse-radiolabeled NFs in retinal ganglion cell(RGC) neurons in vivo. For in vitro transport analyses, we usedprimary cortical neurons (Ackerley et al., 2000), which by com-parison to sympathetic neurons (Yan et al., 2007), achieved amore advanced state of maturity, including greater NF abun-dance. Our findings show that the NF cytoskeleton in matureaxons is a large fixed network containing �90% of the total NF inaxons. This structure exhibits exceptionally slow turnover and is
Received April 23, 2009; revised July 3, 2009; accepted July 31, 2009.
This work was supported by Grant 5R01AG005604 (R.A.N.) from the National Institutes on Aging. We thank
Corrinne Peterhoff for assistance with figures and Nicole Piorkowski for manuscript preparation.
*A.Y. and T.S. contributed equally to this work.
Correspondence should be addressed to either Dr. Aidong Yuan or Dr. Ralph A. Nixon, Center for Dementia
Research, Nathan Kline Institute, New York University School of Medicine, 140 Old Orangeburg Road, Orangeburg,
NY 10962, E-mail: [email protected] or [email protected].
DOI:10.1523/JNEUROSCI.1942-09.2009
Copyright © 2009 Society for Neuroscience 0270-6474/09/2911316-14$15.00/0
11316 • The Journal of Neuroscience, September 9, 2009 • 29(36):11316 –11329
maintained by a small population of NFs and oligomeric subunitprecursors undergoing slow axonal transport by moving rapidlyand pausing for varying lengths of time.
Materials and MethodsConstruction of plasmids. The expression vectors for mouse NFL, NFM,and NFH were constructed by cloning into pcDNA3.1. The expressionplasmid of rat �-internexin (pRSV-�) was used as previously described(Ching and Liem, 1993). The EGFP-tagged NFL expression vector wasconstructed using mouse NFL cDNA (Gill et al., 1990) by cloning intoEcoRI of pEGFP-C1 (Clontech). The EGFP-tagged NFH and NFM ex-pression vectors were constructed using genomic clones in pcDNA3.1(Rao et al., 1998, 2003). pDsRed2-Mito (targeting sequence from subunitVIII of cytochrome c oxidase) living-color vector is from Clontech.
Cell cultures. SW13vim- cells were cultured in DMEM with 10% fetalbovine serum (FBS) and 100 U/ml penicillin and 0.1 mg/ml streptomy-cin. Transfection into SW13- cells was performed using Lipofectamine2000 (Invitrogen) according to the manufacturer’s instructions. Primarycortical neurons were prepared from the fetuses of wild-type mice(C57BL/6J strain) at embryonic day 17.5. Cerebral cortices were collectedinto ice-cold Hibernate E medium (HEM) (BrainBits) and minced byusing a scalpel, followed by incubation for 15 min at 37°C in HEMcontaining 10 U/ml papain (Worthington Biochemical) and DNase (50�g/ml). The reaction was stopped by adding an equal volume of HEMcontaining 10% FBS and DNase (50 �g/ml). The pieces of cortices werecollected by centrifugation at 1000 � g for 3 min at 25°C and thentriturated in DMEM/F-12 supplemented with 5% horse serum and 5%FBS and followed by passing through a nylon cell trainer (Thermo FisherScientific) to remove cell debris and aggregates. Thirty-five thousandneurons (final cell density, 300,000 cells/cm 2) were plated on the centerof a coverslip-bottom 35 mm dish (BD Biosciences) and cultured in aCO2 incubator. Two milliliters of neurobasal medium supplementedwith B27 and 0.5 mM Glutamax (Invitrogen) was added to the cultureafter incubation for 40 min.
Transfection of cultured neurons with EGFP-NFL and NFM. Primarycortical neurons at 4 d in vitro (DIV) were cotransfected with endotoxinfree EGFP-NFL and NFM using Lipofectamine 2000 (Invitrogen) ac-cording to the manufacturer’s procedure. DsRed2-Mito was also co-transfected to monitor the active transport of mitochondria. Beforetransfection, 1 ml of the conditioned medium was transferred into a newtube and then 1 ml of fresh medium was added. The transfection complexprepared with 5 �g of plasmid DNA and 5 �l of Lipofectamine 2000 in500 �l of Opti-MEM (Invitrogen) was added into the culture and incu-bated for 30 min at 37°C. The transfected neurons were then washedtwice with fresh neurobasal medium and maintained in medium consist-ing of 1 ml of the conditioned medium and 1 ml of fresh neurobasalmedium until time-lapse imaging.
Individual NF movements in vitro. To reduce fluorescence backgroundbefore imaging, culture medium was replaced with Hibernate E low-fluorescence medium (BrainBits) supplemented with B27 and 0.5 mM
Glutamax after 3 d of transfection. The culture dishes were placed in a37°C humidified chamber fitting into a Zeiss LSM510 confocal micro-scope. To create the blank area on the axon filled with EGFP fluorescence,we used the function of photobleaching equipped with a Zeiss LSM510confocal microscope. Time-lapse images of NF transport were acquiredwith 1 s exposure at 5 s intervals for 30 min using LSM510 software undera 40� objective lens. Motion was analyzed by tracking the position of theleading or trailing ends of the filaments. Both anterograde and retrogradeNF transport was analyzed using the software ImageJ, a Java image-processing program derived from NIH Image (ImageJ, W. Rasband,http://rsb.info.nih.gov/ij/, 1997–2007). Unhealthy-appearing cells andthose expressing very high (potentially toxic) levels of EGFP-NFL (asjudged by fluorescence) were not used for imaging NFs.
In vitro NF stationary assay. Neurons were cotransfected with EGFP-NFL and NFM at 4 DIV and examined at 7 DIV to allow adequate mat-uration and NF expression. A 5 �m nonbleached window was made inthe proximal area of axon at a standard distance from the cell body bycreating flanking 10 � 12.5 �m photobleached regions. After photo-
bleaching, images were captured every 5 s for 30 min to 5 h withoutaltering microscope settings except to adjust focus. The presence of astationary NF network is defined by the absence of movement of theunbleached 5 �m window and its minimal decline in fluorescence.
Immunofluorescence staining of transfected cells. Transfection and im-munofluorescence staining of SW13vim(-) cells were performed as de-scribed previously (Sasaki et al., 2006). For staining of primary corticalneurons, cells were fixed with 4% paraformaldehyde in PBS for 20 minand then permeabilized and blocked with 0.3% Triton X-100 and 5%normal goat serum in PBS (TNGS) for 15 min. After blocking, cells wereprobed with primary antibodies in TNGS overnight at 4°C. After washeswith 0.3% Triton X-100 in PBS, they were stained with fluorescentlyconjugated secondary antibodies in TNGS for 2 h at room tempera-ture. After being washed, specimens were mounted with 90% glycerolcontaining 1 mg/ml p-phenylenediamine in PBS. NFL was probed withanti-NFL rabbit polyclonal antibody AB9568 (500-fold dilution, Sigma-Aldrich). NFM was probed with mouse monoclonal antibody NN18(500-fold dilution, Sigma-Aldrich) or anti-NFM rabbit polyclonal anti-body (200-fold dilution) prepared using purified mouse NFM protein asan antigen. NFH was probed with anti-NFH rabbit polyclonal antibodyraised against the COOH-terminal 12 aa of mouse NFH (2000-fold dilu-tion) (Xu et al., 1993), and rat �-internexin was probed with anti�-internexin mouse monoclonal antibody MAB5224 (200-fold dilution,Sigma-Aldrich) or anti �-internexin rabbit polyclonal antibody AB5354(200-fold dilution, Sigma-Aldrich). Synapsin I and tubulin were probedwith rabbit polyclonal anti-synapsin I and anti-tubulin antibodies (2000-fold dilution, Sigma-Aldrich). Images were acquired with an LSM 510laser scanning confocal microscope (Carl Zeiss).
Electron microscopy. Neurons were washed (three times) withsupplement-free neurobasal medium and fixed with 4% paraformalde-hyde and 1% glutaraldehyde in 0.1 M sodium cacodylate buffer (ElectronMicroscopy Sciences), pH 7.2, for 3 h at room temperature. After fixa-tion, neurons were washed (three times) in cacodylate buffer, postfixedin 1% osmium tetroxide, progressively dehydrated in a graded series ofethanol (50 –100%), and embedded in Epon. Thin sections of 1 �m werecut from the polymer, followed by ultrathin sectioning (70 – 80 nm) us-ing a Recheirt Ultracut S microtome, and the sections were placed oncopper grids for structural analysis. Grids were briefly stained with uranylacetate and lead citrate before being examined with a Philips electronmicroscope (model CM 10). Images were captured on a digital camera(Hamamatsu; model C4742-95) using Advantage charge-coupled devicecamera system software (Advanced Microscopy Techniques).
Isotope injections. Adult mice (C57BL/6J, 12–16 weeks of age at thetime of injection) were anesthetized with 13–20 �l/g body weight ofAvertin (0.5 g of tribromoethanol and 0.25 g of 2-methyl-2-butanol in39.5 ml of distilled water) and received 0.30 �l of phosphate-bufferednormal saline, pH 7.4, which contained 25 �Ci of [ 3H]proline (specificactivity, 30 –50 Ci/mmol) purchased from Perkin-Elmer Life ScienceInc.. Isotope was injected into the vitreous of each eye with a glass mi-cropipette (70 –100 �m) apparatus as described previously (Nixon andLogvinenko, 1986; Yuan, 2007; Yuan et al., 2008).
Analyses of stationary NF in vivo. By injecting identical amounts of[ 3H]proline intravitreously into each mouse in a single large group, wequantitated from subgroups analyzed at different time points the totalamount of radiolabeled NF that enters optic axons and the proportion oflabeled NF retained in axons after the moving wave of labeled NF pro-teins has exited (Nixon and Logvinenko, 1986). All the experimentalprotocols were approved by New York University Medical School andNathan Kline Institute Institutional Animal Care and Use Committeesunder the guidelines of the Institutional Animal Care and Use Commit-tee of the National Institutes of Health.
SDS-PAGE and immunoblot analysis. Protein concentrations were de-termined with BCA assay (Sigma-Aldrich). Antibodies used were mono-clonal antibodies to NFL (NR4), NFM (NN18), NFH (N52),�-internexin (MAB5224, Chemicon), �-actin (AC-15) (Sigma),�-internexin (MAB5224, Chemicon), and EGFP (JL-8, Clontech). TheRT-97 monoclonal antibody clone was a kind gift from Dr. Brian Ander-ton (Institute of Psychiatry, King’s College London, London, UK). SDS-PAGE was performed according to the work of Laemmli (1970).
Yuan et al. • Stationary NF Network in Axons J. Neurosci., September 9, 2009 • 29(36):11316 –11329 • 11317
Separated proteins were transferred to Immobilon membranes (Milli-pore) as described previously (Yuan et al., 2000). Blots were probed withprimary antibodies, followed by an alkaline phosphatase-conjugated sec-ondary antibody (1000-fold dilution, DAKA). The reaction was devel-oped using a BCIP/NBT phosphatase system (KPL) as describedpreviously (Mills et al., 1996).
ResultsAxonal transport kinetics in established cultures ofcortical neuronsWe used primary cortical neurons cultured at high density (3 �10 5 cells/cm 2) in these studies to enable us to capture NF dy-namic behaviors of NFs at a more mature stage of neuronal de-velopment than that present in the sympathetic neurons used inearlier analyses of NF kinetics (Roy et al., 2000; Wang et al., 2000;Trivedi et al., 2007; Yan et al., 2007). Cortical neurons under ourculture conditions express NFH, acquire NF phosphoepitopesassociated with a relatively mature state of axons, and exhibittypical slow bulk transport of NFs along axons similar to that seen
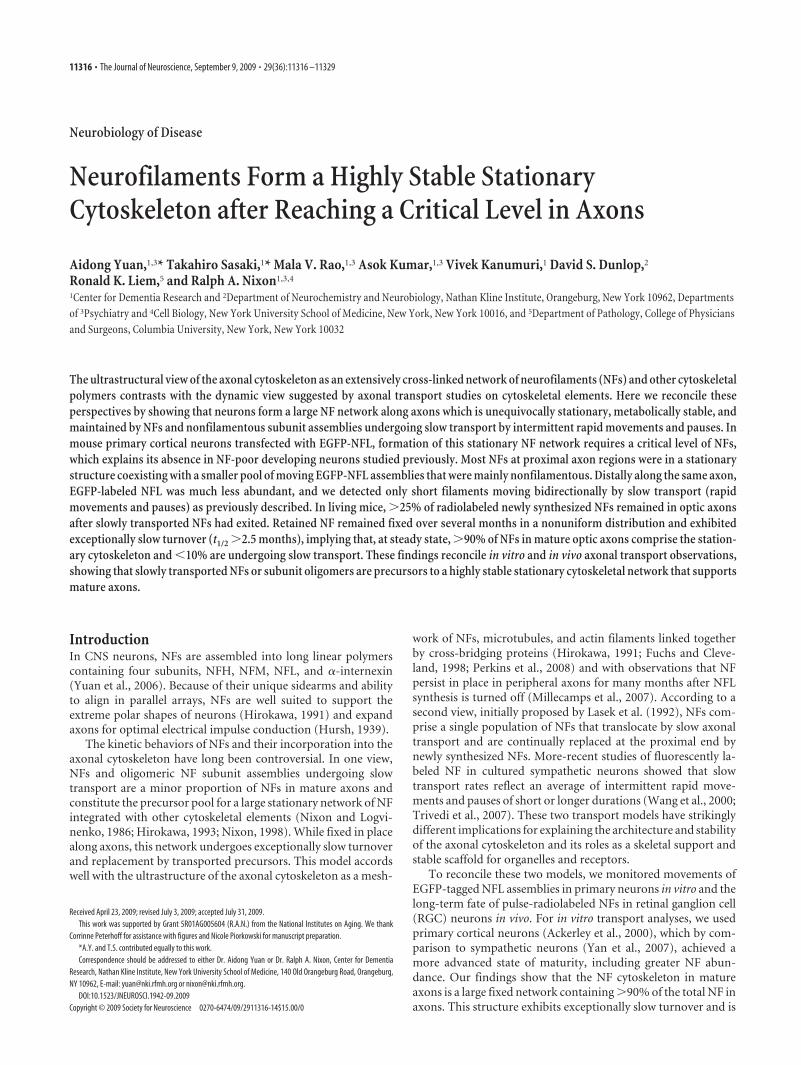
in vivo (Ackerley et al., 2000). Using immunofluorescence label-ing with a polyclonal antibody to �-synapsin I, we observed theformation of synaptic junctions beginning at 3 DIV after plating,which reached a plateau between 7 and 10 DIV, indicating aleveling off of axonal growth under these conditions (Fig. 1A).Consistent with previous findings, unphosphorylated and phos-phorylated forms of NFH gradually appeared in neurons alongwith a relatively constant presence of the other three NF subunits,NFL, NFM, and �-internexin (Fig. 1B) (Ackerley et al., 2000;Yuan et al., 2006).
The axon of a given cortical neuron was identified as a singlelong relatively straight process that changed minimally in mor-phology from 5 to 7.5 DIV (Fig. 1C,D). At proximal regions of theaxon, ultrastructural analyses revealed abundant longitudinallyaligned NFs, usually arrayed in bundles which were interspersedamong microtubules and vesicular organelles (Fig. 1E). At moredistal axonal regions, isolated NFs were present among moreabundant microtubules (Fig. 1F). By comparison to axons, den-
Figure 1. Characterization of high-density cultures of mouse primary cortical neurons. A, Primary cortical neurons plated at a density of 3 � 10 5 cells/cm 2 and stained with anti-synapsin Iantibody at 1, 3, 5, 7, and 10 DIV revealed increasing numbers of puncta positive for synapsin I, a marker of synapses, beginning by 3 DIV and reaching a plateau by 7–10 DIV. B, Western blot analysisof NF protein subunits at 3–10 DIV and �-actin as a loading control. Increasing RT-97 immunoreactivity appeared on both NFH and NFM beginning at 4 DIV. C, D, In a neuron transfected at 4 DIV withEGFP, axon morphology did not change between 5 (C) and 7.5 (D) DIV (white arrowheads), whereas dendrite arborization changed dramatically (yellow and red arrowheads). E, F, Depicted are threeaxons from primary cortical neurons: E represents a relatively proximal level of an axon, in which relatively abundant NFs are seen (arrows), and F represents a proximal level (P), showing abundantNFs and a distal level (D) showing isolated NFs and a high proportion of MTs. Scale bars: A, 20 �m; (in D) C, D, 50 �m; (in F ) E, F, 100 nm.
11318 • J. Neurosci., September 9, 2009 • 29(36):11316 –11329 Yuan et al. • Stationary NF Network in Axons
drites appeared as relatively short tapering processes thatchanged morphology dramatically during the period in culture(Fig. 1C,D). At the ultrastructural level, proximal dendrites ex-hibited abundant vesicular organelles and microtubules but rareNFs (supplemental Fig. 2, available at www.jneurosci.org as sup-plemental material).
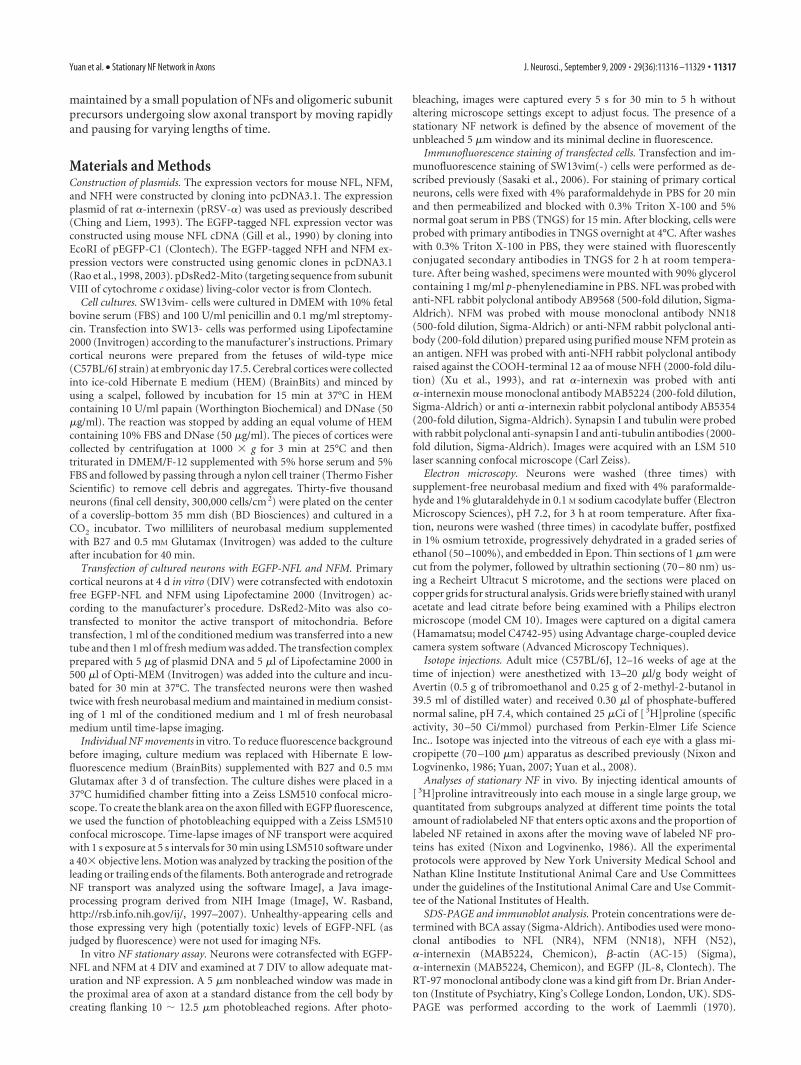
To visualize NF dynamics in cortical neurons, we constructedan expression vector in which EGFP is linked to the N terminal ofNFL. Transfection of EGFP-NFL in SW13vim(-) cells, which lackintermediate filament networks, resulted in expression of a pro-tein with an apparent molecular weight of 95 kDa that is recog-nized on Western blots by antibodies specific for either NFL (Fig.2A, lane 1) or EGFP (Fig. 2A, lane 2). Thus, EGFP-NFL directsthe expression of full-length EGFP-NFL fusion protein. InSW13vim(-) cells, double transfection of pEGFP-NFL with eitherone or all of the other three CNS NF subunits, NFM, NFH, and�-internexin, combined with immunofluorescence analysis us-ing the appropriate NF subunit antibodies, demonstrated thatEGFP-NFL can form filaments in these cells with any one or allthree of the other subunits (Fig. 2B–S).
We also constructed expression vectors in which EGFP wasfused to the N terminal of NFH or the C terminal of NFM. EGFP-NFH or NFM-EGFP expressed alone in cortical neurons distrib-uted diffusely in the cell body. This was caused by anoverexpression of transfected subunits relative to the endogenoussubunits: when NFL was cotransfected, a filamentous networkformed in place of the diffuse perikaryal distribution pattern ofNFH or NFM (Fig. 2T–W). Expression of EGFP-NFL in corticalneurons in the absence of other intermediate filament subunitscaused it to aggregate in the cell body (Fig. 2V), consistent withprevious evidence that proper assembly and export into axons invivo requires heterodimerization between specific pairs of NFsubunits and proper ratios of NF subunits (Xu et al., 1996; Yuanet al., 2003). When expressed in cortical neurons together witheither NFM or NFH, EGFP-NFL consistently formed filamen-tous structures in the cell bodies and neurites (Fig. 2U–X). Thelevel of expression of exogenous NFL was maintained within thenormal range of expression levels of endogenous NFL observed inthe cortical neuron cultures (Fig. 2Y–DD). For consistency in allof the following experiments, we cotransfected EGFP-NFL withNFM at 4 DIV and DsRed2-Mito was cotransfected to simulta-neously monitor the preservation of mitochondrial transport inthe same axons. Transport kinetics were examined at 7 DIV [3 dpost-transfection (3 DPT)] by monitoring the movements of in-dividual fluorescent NF through a 20 �m photobleached zonecreated at a specific proximal, intermediate, or distal region alonga given axon. Under these conditions, we observed, as reported inprevious studies (Roy et al., 2000; Wang et al., 2000), robustanterograde and retrograde transport of NF puncta or short fila-ments in distal regions of the axon in which NFs were low innumber, allowing movements of single filaments to be visualizedagainst a nonfluorescent background (Fig. 3A).
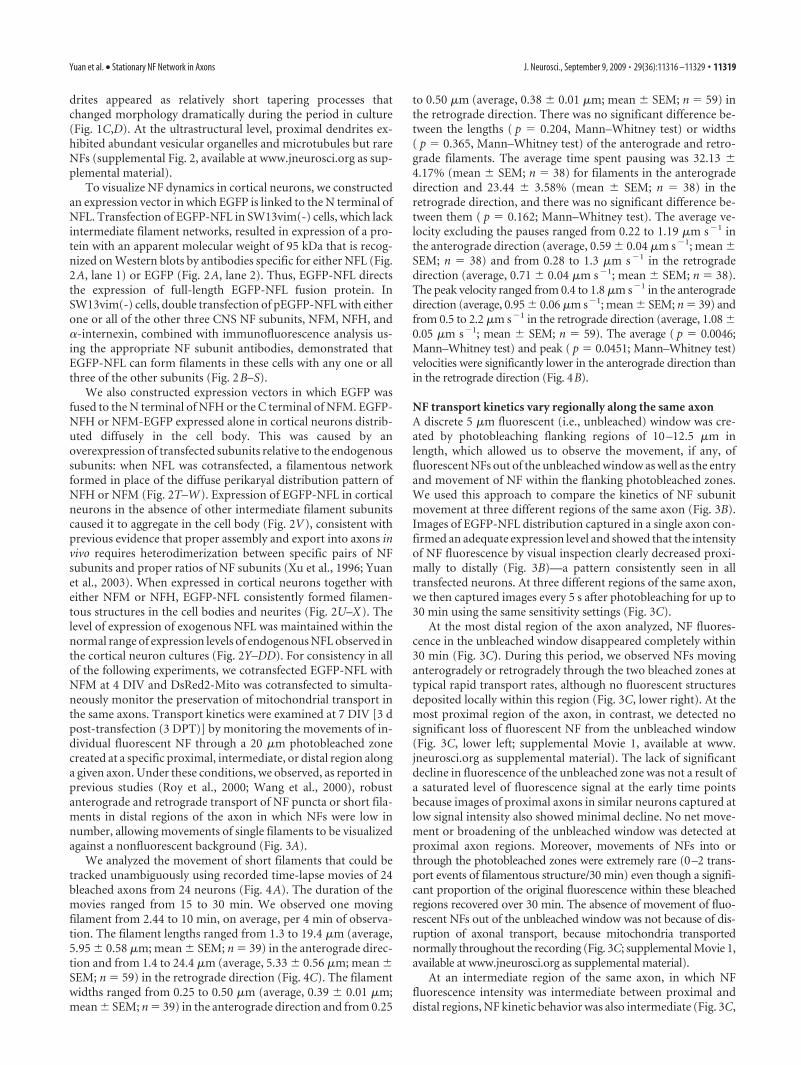
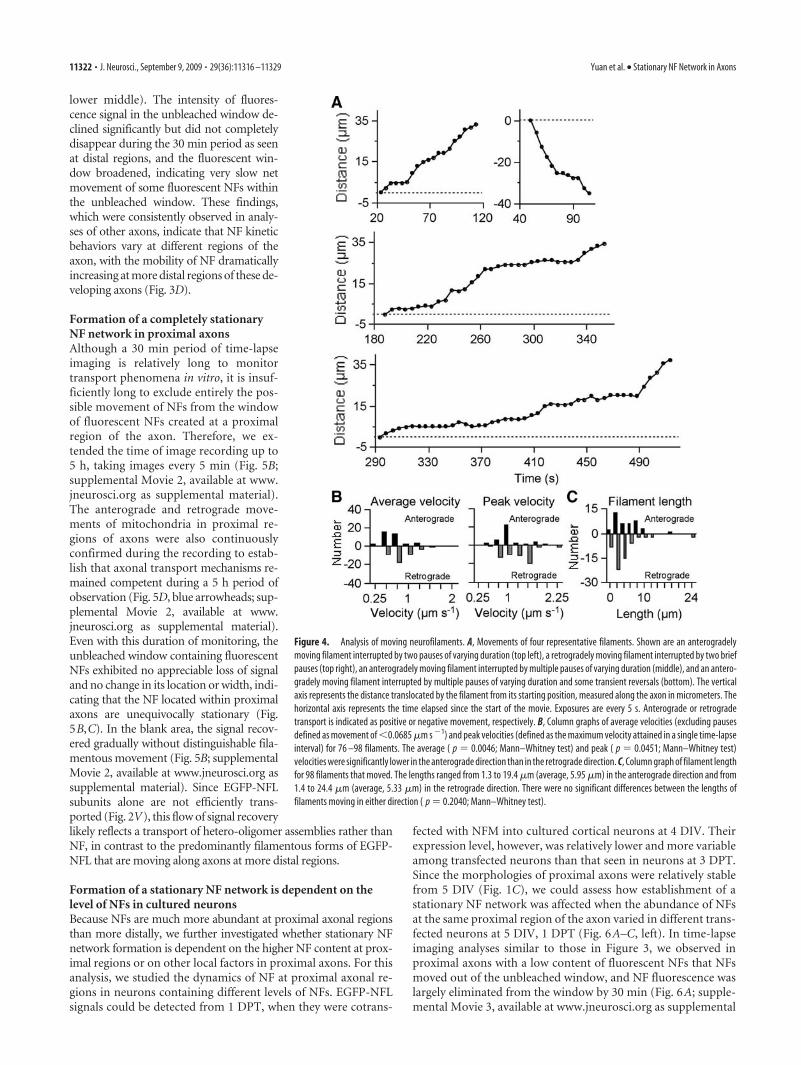
We analyzed the movement of short filaments that could betracked unambiguously using recorded time-lapse movies of 24bleached axons from 24 neurons (Fig. 4A). The duration of themovies ranged from 15 to 30 min. We observed one movingfilament from 2.44 to 10 min, on average, per 4 min of observa-tion. The filament lengths ranged from 1.3 to 19.4 �m (average,5.95 � 0.58 �m; mean � SEM; n � 39) in the anterograde direc-tion and from 1.4 to 24.4 �m (average, 5.33 � 0.56 �m; mean �SEM; n � 59) in the retrograde direction (Fig. 4C). The filamentwidths ranged from 0.25 to 0.50 �m (average, 0.39 � 0.01 �m;mean � SEM; n � 39) in the anterograde direction and from 0.25
to 0.50 �m (average, 0.38 � 0.01 �m; mean � SEM; n � 59) inthe retrograde direction. There was no significant difference be-tween the lengths ( p � 0.204, Mann–Whitney test) or widths( p � 0.365, Mann–Whitney test) of the anterograde and retro-grade filaments. The average time spent pausing was 32.13 �4.17% (mean � SEM; n � 38) for filaments in the anterogradedirection and 23.44 � 3.58% (mean � SEM; n � 38) in theretrograde direction, and there was no significant difference be-tween them ( p � 0.162; Mann–Whitney test). The average ve-locity excluding the pauses ranged from 0.22 to 1.19 �m s�1 inthe anterograde direction (average, 0.59 � 0.04 �m s�1; mean �SEM; n � 38) and from 0.28 to 1.3 �m s�1 in the retrogradedirection (average, 0.71 � 0.04 �m s�1; mean � SEM; n � 38).The peak velocity ranged from 0.4 to 1.8 �m s�1 in the anterogradedirection (average, 0.95 � 0.06 �m s�1; mean � SEM; n � 39) andfrom 0.5 to 2.2 �m s�1 in the retrograde direction (average, 1.08 �0.05 �m s�1; mean � SEM; n � 59). The average ( p � 0.0046;Mann–Whitney test) and peak ( p � 0.0451; Mann–Whitney test)velocities were significantly lower in the anterograde direction thanin the retrograde direction (Fig. 4B).
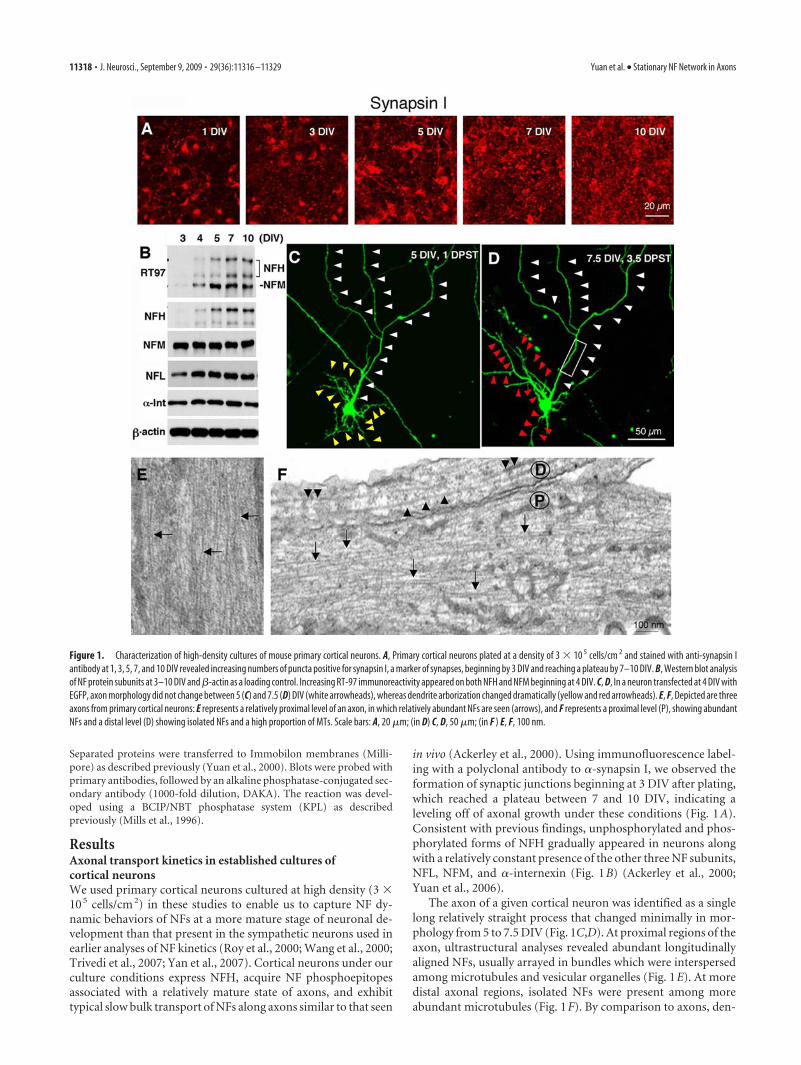
NF transport kinetics vary regionally along the same axonA discrete 5 �m fluorescent (i.e., unbleached) window was cre-ated by photobleaching flanking regions of 10 –12.5 �m inlength, which allowed us to observe the movement, if any, offluorescent NFs out of the unbleached window as well as the entryand movement of NF within the flanking photobleached zones.We used this approach to compare the kinetics of NF subunitmovement at three different regions of the same axon (Fig. 3B).Images of EGFP-NFL distribution captured in a single axon con-firmed an adequate expression level and showed that the intensityof NF fluorescence by visual inspection clearly decreased proxi-mally to distally (Fig. 3B)—a pattern consistently seen in alltransfected neurons. At three different regions of the same axon,we then captured images every 5 s after photobleaching for up to30 min using the same sensitivity settings (Fig. 3C).
At the most distal region of the axon analyzed, NF fluores-cence in the unbleached window disappeared completely within30 min (Fig. 3C). During this period, we observed NFs movinganterogradely or retrogradely through the two bleached zones attypical rapid transport rates, although no fluorescent structuresdeposited locally within this region (Fig. 3C, lower right). At themost proximal region of the axon, in contrast, we detected nosignificant loss of fluorescent NF from the unbleached window(Fig. 3C, lower left; supplemental Movie 1, available at www.jneurosci.org as supplemental material). The lack of significantdecline in fluorescence of the unbleached zone was not a result ofa saturated level of fluorescence signal at the early time pointsbecause images of proximal axons in similar neurons captured atlow signal intensity also showed minimal decline. No net move-ment or broadening of the unbleached window was detected atproximal axon regions. Moreover, movements of NFs into orthrough the photobleached zones were extremely rare (0–2 trans-port events of filamentous structure/30 min) even though a signifi-cant proportion of the original fluorescence within these bleachedregions recovered over 30 min. The absence of movement of fluo-rescent NFs out of the unbleached window was not because of dis-ruption of axonal transport, because mitochondria transportednormally throughout the recording (Fig. 3C; supplemental Movie 1,available at www.jneurosci.org as supplemental material).
At an intermediate region of the same axon, in which NFfluorescence intensity was intermediate between proximal anddistal regions, NF kinetic behavior was also intermediate (Fig. 3C,
Yuan et al. • Stationary NF Network in Axons J. Neurosci., September 9, 2009 • 29(36):11316 –11329 • 11319
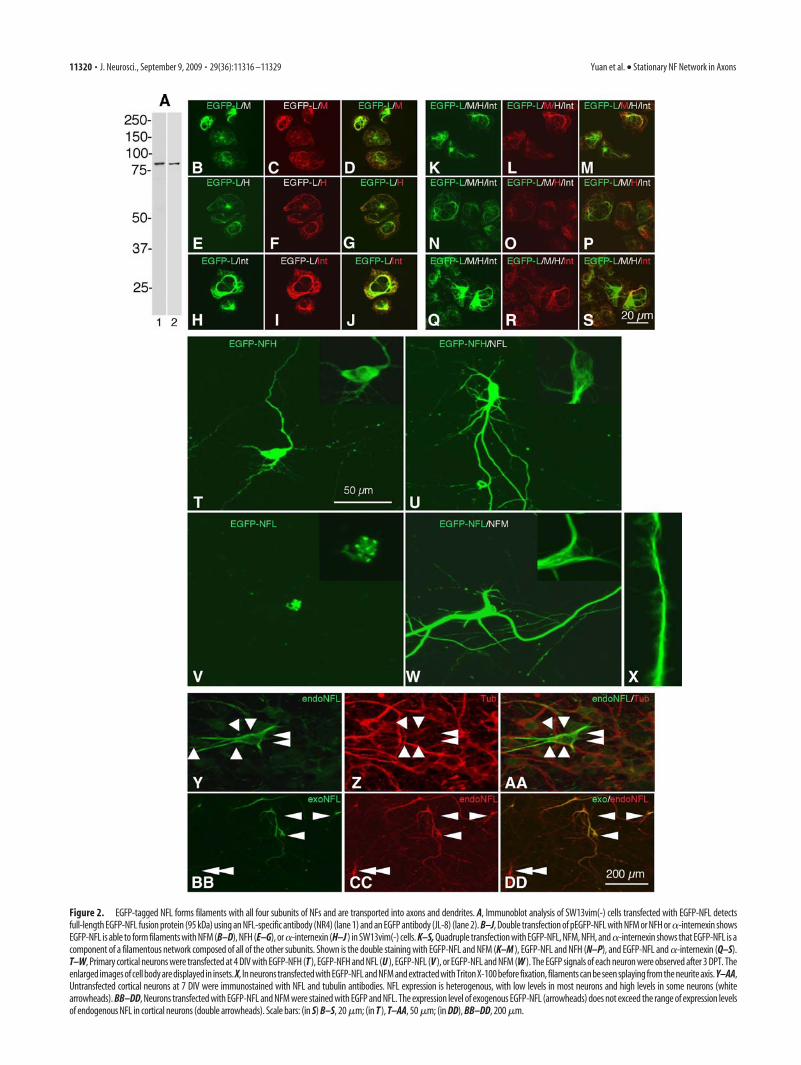
Figure 2. EGFP-tagged NFL forms filaments with all four subunits of NFs and are transported into axons and dendrites. A, Immunoblot analysis of SW13vim(-) cells transfected with EGFP-NFL detectsfull-length EGFP-NFL fusion protein (95 kDa) using an NFL-specific antibody (NR4) (lane 1) and an EGFP antibody (JL-8) (lane 2). B–J, Double transfection of pEGFP-NFL with NFM or NFH or �-internexin showsEGFP-NFL is able to form filaments with NFM (B–D), NFH (E–G), or�-internexin (H–J ) in SW13vim(-) cells. K–S, Quadruple transfection with EGFP-NFL, NFM, NFH, and�-internexin shows that EGFP-NFL is acomponent of a filamentous network composed of all of the other subunits. Shown is the double staining with EGFP-NFL and NFM (K–M ), EGFP-NFL and NFH (N–P), and EGFP-NFL and �-internexin (Q–S).T–W, Primary cortical neurons were transfected at 4 DIV with EGFP-NFH (T ), EGFP-NFH and NFL (U ), EGFP-NFL (V ), or EGFP-NFL and NFM (W ). The EGFP signals of each neuron were observed after 3 DPT. Theenlarged images of cell body are displayed in insets. X, In neurons transfected with EGFP-NFL and NFM and extracted with Triton X-100 before fixation, filaments can be seen splaying from the neurite axis. Y–AA,Untransfected cortical neurons at 7 DIV were immunostained with NFL and tubulin antibodies. NFL expression is heterogenous, with low levels in most neurons and high levels in some neurons (whitearrowheads). BB–DD, Neurons transfected with EGFP-NFL and NFM were stained with EGFP and NFL. The expression level of exogenous EGFP-NFL (arrowheads) does not exceed the range of expression levelsof endogenous NFL in cortical neurons (double arrowheads). Scale bars: (in S) B–S, 20 �m; (in T ), T–AA, 50 �m; (in DD), BB–DD, 200 �m.
11320 • J. Neurosci., September 9, 2009 • 29(36):11316 –11329 Yuan et al. • Stationary NF Network in Axons

Figure 3. Different NF dynamics within a single axon of a cultured cortical neuron. Cortical neurons transfected with EGFP-NFL and NFM were examined at 7 DIV, 3 DPT. A, The distal regions of different axonswere examined by time-lapse imaging with 5 s intervals after photobleaching. The first and second rows in each column show the images before and after photobleaching, respectively. The yellow arrowheadsmark the outer edges of photobleached regions. Left and center columns display 5 s intervals of serial images showing intermittent NF movements in the anterograde, and retrograde directions, respectively. Thewhite arrowheads mark the leading and/or trailing ends of the filaments. The right column displays 10 s intervals of serial images showing several short NFs moving anterogradely (white arrowheads) orretrogradely (red arrowheads) within the same axon. Scale bar, 6 �m. B, NF dynamics was also examined at different regions of the same axon. Shown is the distribution of EGFP-NFL in the neuron transfectedtogether with NFM. NFs are distributed at least 1.5 mm along the length of this axon (white arrowheads). Scale bar, 30 �m. B�, Magnified view of the cell body showing that NFs form a normal filamentousnetwork, indicating that the level of NF expression yielded normal patterns of NF organization. Scale bar, 15�m. C, Differential dynamics of NFs was examined at proximal (left) (supplemental Movie 1, availableat www.jneurosci.org as supplemental material), intermediate (center), and distal (right) regions of the same axon indicated by the white rectangles in B. A 5-�m-long window of fluorescent NF flanked by twophotobleached areas was created. Then, images were recorded every 5 s for 30 min. Each left column shows the NF images every 5 min. Yellow arrowheads indicate the edges of the photobleached area, and redarrowheads point to the 5 �m window of fluorescent NFs. Each right column displays the serial images of 5 s intervals with transported mitochondria (white arrowheads) at the corresponding photobleachedregions, proving axonal transport is active in the observed axon. Scale bar, 10 �m. D, Densitometric analysis of EGFP-NFL levels during the recovery from photobleaching in a 5-�m-long window containingfluorescent NF at proximal (squares), intermediate (diamonds), and distal (circles) regions of a circle (representative of 5 experiments).
Yuan et al. • Stationary NF Network in Axons J. Neurosci., September 9, 2009 • 29(36):11316 –11329 • 11321
lower middle). The intensity of fluores-cence signal in the unbleached window de-clined significantly but did not completelydisappear during the 30 min period as seenat distal regions, and the fluorescent win-dow broadened, indicating very slow netmovement of some fluorescent NFs withinthe unbleached window. These findings,which were consistently observed in analy-ses of other axons, indicate that NF kineticbehaviors vary at different regions of theaxon, with the mobility of NF dramaticallyincreasing at more distal regions of these de-veloping axons (Fig. 3D).
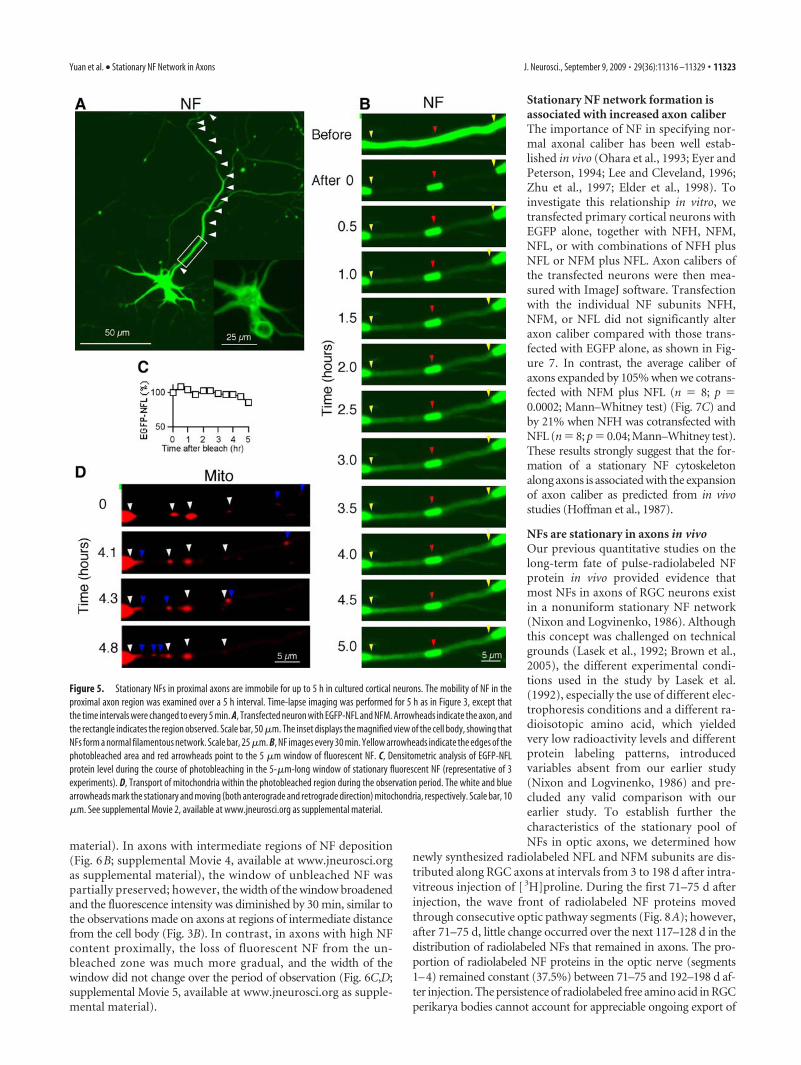
Formation of a completely stationaryNF network in proximal axonsAlthough a 30 min period of time-lapseimaging is relatively long to monitortransport phenomena in vitro, it is insuf-ficiently long to exclude entirely the pos-sible movement of NFs from the windowof fluorescent NFs created at a proximalregion of the axon. Therefore, we ex-tended the time of image recording up to5 h, taking images every 5 min (Fig. 5B;supplemental Movie 2, available at www.jneurosci.org as supplemental material).The anterograde and retrograde move-ments of mitochondria in proximal re-gions of axons were also continuouslyconfirmed during the recording to estab-lish that axonal transport mechanisms re-mained competent during a 5 h period ofobservation (Fig. 5D, blue arrowheads; sup-plemental Movie 2, available at www.jneurosci.org as supplemental material).Even with this duration of monitoring, theunbleached window containing fluorescentNFs exhibited no appreciable loss of signaland no change in its location or width, indi-cating that the NF located within proximalaxons are unequivocally stationary (Fig.5B,C). In the blank area, the signal recov-ered gradually without distinguishable fila-mentous movement (Fig. 5B; supplementalMovie 2, available at www.jneurosci.org assupplemental material). Since EGFP-NFLsubunits alone are not efficiently trans-ported (Fig. 2V), this flow of signal recoverylikely reflects a transport of hetero-oligomer assemblies rather thanNF, in contrast to the predominantly filamentous forms of EGFP-NFL that are moving along axons at more distal regions.
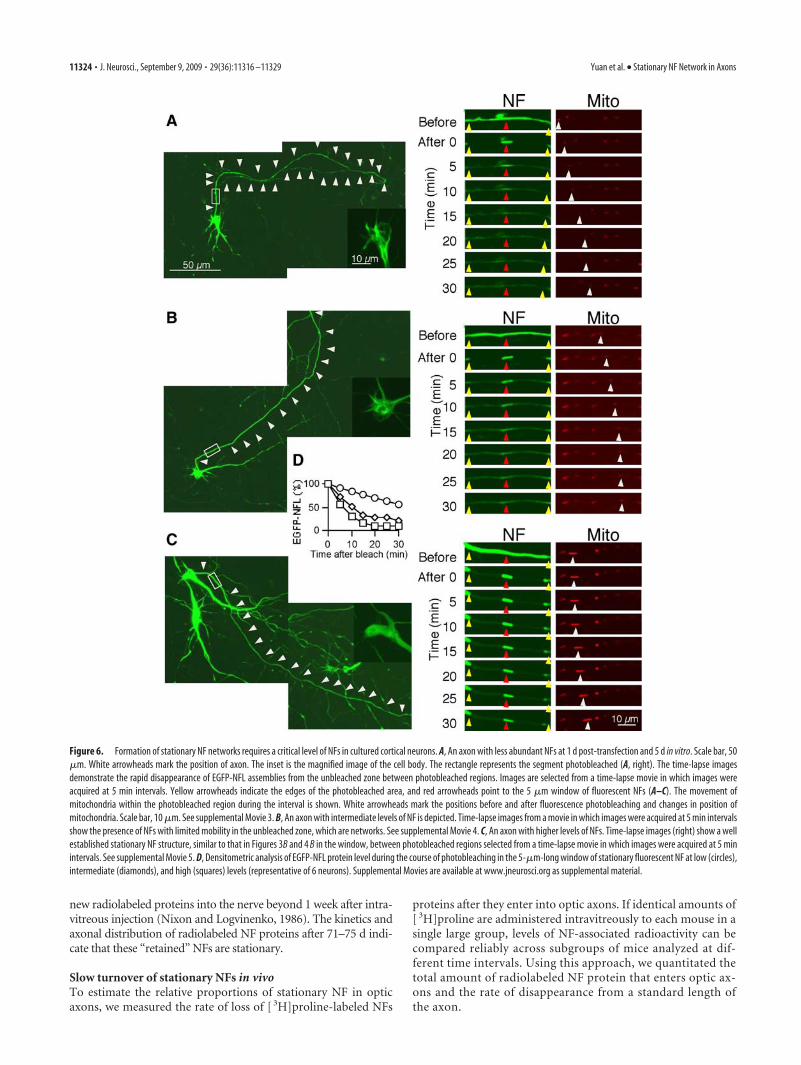
Formation of a stationary NF network is dependent on thelevel of NFs in cultured neuronsBecause NFs are much more abundant at proximal axonal regionsthan more distally, we further investigated whether stationary NFnetwork formation is dependent on the higher NF content at prox-imal regions or on other local factors in proximal axons. For thisanalysis, we studied the dynamics of NF at proximal axonal re-gions in neurons containing different levels of NFs. EGFP-NFLsignals could be detected from 1 DPT, when they were cotrans-
fected with NFM into cultured cortical neurons at 4 DIV. Theirexpression level, however, was relatively lower and more variableamong transfected neurons than that seen in neurons at 3 DPT.Since the morphologies of proximal axons were relatively stablefrom 5 DIV (Fig. 1C), we could assess how establishment of astationary NF network was affected when the abundance of NFsat the same proximal region of the axon varied in different trans-fected neurons at 5 DIV, 1 DPT (Fig. 6A–C, left). In time-lapseimaging analyses similar to those in Figure 3, we observed inproximal axons with a low content of fluorescent NFs that NFsmoved out of the unbleached window, and NF fluorescence waslargely eliminated from the window by 30 min (Fig. 6A; supple-mental Movie 3, available at www.jneurosci.org as supplemental
Figure 4. Analysis of moving neurofilaments. A, Movements of four representative filaments. Shown are an anterogradelymoving filament interrupted by two pauses of varying duration (top left), a retrogradely moving filament interrupted by two briefpauses (top right), an anterogradely moving filament interrupted by multiple pauses of varying duration (middle), and an antero-gradely moving filament interrupted by multiple pauses of varying duration and some transient reversals (bottom). The verticalaxis represents the distance translocated by the filament from its starting position, measured along the axon in micrometers. Thehorizontal axis represents the time elapsed since the start of the movie. Exposures are every 5 s. Anterograde or retrogradetransport is indicated as positive or negative movement, respectively. B, Column graphs of average velocities (excluding pausesdefined as movement of �0.0685 �m s �1) and peak velocities (defined as the maximum velocity attained in a single time-lapseinterval) for 76 –98 filaments. The average ( p � 0.0046; Mann–Whitney test) and peak ( p � 0.0451; Mann–Whitney test)velocities were significantly lower in the anterograde direction than in the retrograde direction. C, Column graph of filament lengthfor 98 filaments that moved. The lengths ranged from 1.3 to 19.4 �m (average, 5.95 �m) in the anterograde direction and from1.4 to 24.4 �m (average, 5.33 �m) in the retrograde direction. There were no significant differences between the lengths offilaments moving in either direction ( p � 0.2040; Mann–Whitney test).
11322 • J. Neurosci., September 9, 2009 • 29(36):11316 –11329 Yuan et al. • Stationary NF Network in Axons
material). In axons with intermediate regions of NF deposition(Fig. 6B; supplemental Movie 4, available at www.jneurosci.orgas supplemental material), the window of unbleached NF waspartially preserved; however, the width of the window broadenedand the fluorescence intensity was diminished by 30 min, similar tothe observations made on axons at regions of intermediate distancefrom the cell body (Fig. 3B). In contrast, in axons with high NFcontent proximally, the loss of fluorescent NF from the un-bleached zone was much more gradual, and the width of thewindow did not change over the period of observation (Fig. 6C,D;supplemental Movie 5, available at www.jneurosci.org as supple-mental material).
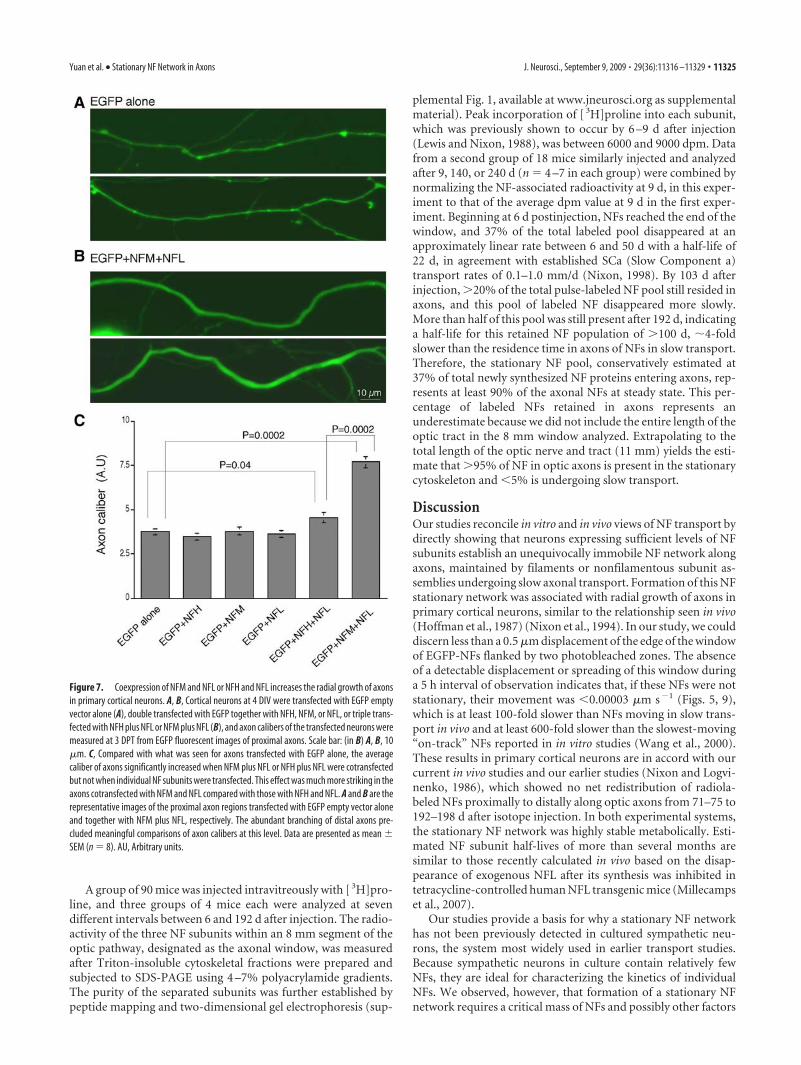
Stationary NF network formation isassociated with increased axon caliberThe importance of NF in specifying nor-mal axonal caliber has been well estab-lished in vivo (Ohara et al., 1993; Eyer andPeterson, 1994; Lee and Cleveland, 1996;Zhu et al., 1997; Elder et al., 1998). Toinvestigate this relationship in vitro, wetransfected primary cortical neurons withEGFP alone, together with NFH, NFM,NFL, or with combinations of NFH plusNFL or NFM plus NFL. Axon calibers ofthe transfected neurons were then mea-sured with ImageJ software. Transfectionwith the individual NF subunits NFH,NFM, or NFL did not significantly alteraxon caliber compared with those trans-fected with EGFP alone, as shown in Fig-ure 7. In contrast, the average caliber ofaxons expanded by 105% when we cotrans-fected with NFM plus NFL (n � 8; p �0.0002; Mann–Whitney test) (Fig. 7C) andby 21% when NFH was cotransfected withNFL (n � 8; p � 0.04; Mann–Whitney test).These results strongly suggest that the for-mation of a stationary NF cytoskeletonalong axons is associated with the expansionof axon caliber as predicted from in vivostudies (Hoffman et al., 1987).
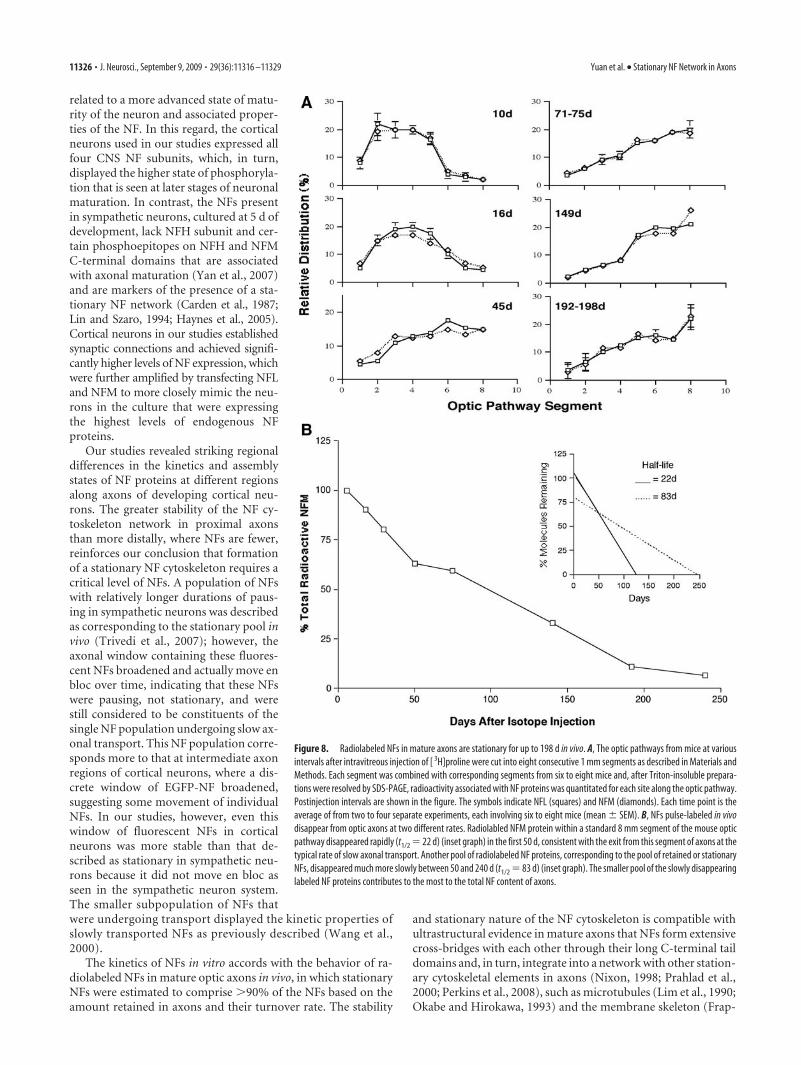
NFs are stationary in axons in vivoOur previous quantitative studies on thelong-term fate of pulse-radiolabeled NFprotein in vivo provided evidence thatmost NFs in axons of RGC neurons existin a nonuniform stationary NF network(Nixon and Logvinenko, 1986). Althoughthis concept was challenged on technicalgrounds (Lasek et al., 1992; Brown et al.,2005), the different experimental condi-tions used in the study by Lasek et al.(1992), especially the use of different elec-trophoresis conditions and a different ra-dioisotopic amino acid, which yieldedvery low radioactivity levels and differentprotein labeling patterns, introducedvariables absent from our earlier study(Nixon and Logvinenko, 1986) and pre-cluded any valid comparison with ourearlier study. To establish further thecharacteristics of the stationary pool ofNFs in optic axons, we determined how
newly synthesized radiolabeled NFL and NFM subunits are dis-tributed along RGC axons at intervals from 3 to 198 d after intra-vitreous injection of [ 3H]proline. During the first 71–75 d afterinjection, the wave front of radiolabeled NF proteins movedthrough consecutive optic pathway segments (Fig. 8A); however,after 71–75 d, little change occurred over the next 117–128 d in thedistribution of radiolabeled NFs that remained in axons. The pro-portion of radiolabeled NF proteins in the optic nerve (segments1–4) remained constant (37.5%) between 71–75 and 192–198 d af-ter injection. The persistence of radiolabeled free amino acid in RGCperikarya bodies cannot account for appreciable ongoing export of
Figure 5. Stationary NFs in proximal axons are immobile for up to 5 h in cultured cortical neurons. The mobility of NF in theproximal axon region was examined over a 5 h interval. Time-lapse imaging was performed for 5 h as in Figure 3, except thatthe time intervals were changed to every 5 min. A, Transfected neuron with EGFP-NFL and NFM. Arrowheads indicate the axon, andthe rectangle indicates the region observed. Scale bar, 50 �m. The inset displays the magnified view of the cell body, showing thatNFs form a normal filamentous network. Scale bar, 25 �m. B, NF images every 30 min. Yellow arrowheads indicate the edges of thephotobleached area and red arrowheads point to the 5 �m window of fluorescent NF. C, Densitometric analysis of EGFP-NFLprotein level during the course of photobleaching in the 5-�m-long window of stationary fluorescent NF (representative of 3experiments). D, Transport of mitochondria within the photobleached region during the observation period. The white and bluearrowheads mark the stationary and moving (both anterograde and retrograde direction) mitochondria, respectively. Scale bar, 10�m. See supplemental Movie 2, available at www.jneurosci.org as supplemental material.
Yuan et al. • Stationary NF Network in Axons J. Neurosci., September 9, 2009 • 29(36):11316 –11329 • 11323
new radiolabeled proteins into the nerve beyond 1 week after intra-vitreous injection (Nixon and Logvinenko, 1986). The kinetics andaxonal distribution of radiolabeled NF proteins after 71–75 d indi-cate that these “retained” NFs are stationary.
Slow turnover of stationary NFs in vivoTo estimate the relative proportions of stationary NF in opticaxons, we measured the rate of loss of [ 3H]proline-labeled NFs
proteins after they enter into optic axons. If identical amounts of[ 3H]proline are administered intravitreously to each mouse in asingle large group, levels of NF-associated radioactivity can becompared reliably across subgroups of mice analyzed at dif-ferent time intervals. Using this approach, we quantitated thetotal amount of radiolabeled NF protein that enters optic ax-ons and the rate of disappearance from a standard length ofthe axon.
Figure 6. Formation of stationary NF networks requires a critical level of NFs in cultured cortical neurons. A, An axon with less abundant NFs at 1 d post-transfection and 5 d in vitro. Scale bar, 50�m. White arrowheads mark the position of axon. The inset is the magnified image of the cell body. The rectangle represents the segment photobleached (A, right). The time-lapse imagesdemonstrate the rapid disappearance of EGFP-NFL assemblies from the unbleached zone between photobleached regions. Images are selected from a time-lapse movie in which images wereacquired at 5 min intervals. Yellow arrowheads indicate the edges of the photobleached area, and red arrowheads point to the 5 �m window of fluorescent NFs (A–C). The movement ofmitochondria within the photobleached region during the interval is shown. White arrowheads mark the positions before and after fluorescence photobleaching and changes in position ofmitochondria. Scale bar, 10 �m. See supplemental Movie 3. B, An axon with intermediate levels of NF is depicted. Time-lapse images from a movie in which images were acquired at 5 min intervalsshow the presence of NFs with limited mobility in the unbleached zone, which are networks. See supplemental Movie 4. C, An axon with higher levels of NFs. Time-lapse images (right) show a wellestablished stationary NF structure, similar to that in Figures 3B and 4 B in the window, between photobleached regions selected from a time-lapse movie in which images were acquired at 5 minintervals. See supplemental Movie 5. D, Densitometric analysis of EGFP-NFL protein level during the course of photobleaching in the 5-�m-long window of stationary fluorescent NF at low (circles),intermediate (diamonds), and high (squares) levels (representative of 6 neurons). Supplemental Movies are available at www.jneurosci.org as supplemental material.
11324 • J. Neurosci., September 9, 2009 • 29(36):11316 –11329 Yuan et al. • Stationary NF Network in Axons
A group of 90 mice was injected intravitreously with [ 3H]pro-line, and three groups of 4 mice each were analyzed at sevendifferent intervals between 6 and 192 d after injection. The radio-activity of the three NF subunits within an 8 mm segment of theoptic pathway, designated as the axonal window, was measuredafter Triton-insoluble cytoskeletal fractions were prepared andsubjected to SDS-PAGE using 4 –7% polyacrylamide gradients.The purity of the separated subunits was further established bypeptide mapping and two-dimensional gel electrophoresis (sup-
plemental Fig. 1, available at www.jneurosci.org as supplementalmaterial). Peak incorporation of [ 3H]proline into each subunit,which was previously shown to occur by 6 –9 d after injection(Lewis and Nixon, 1988), was between 6000 and 9000 dpm. Datafrom a second group of 18 mice similarly injected and analyzedafter 9, 140, or 240 d (n � 4 –7 in each group) were combined bynormalizing the NF-associated radioactivity at 9 d, in this exper-iment to that of the average dpm value at 9 d in the first exper-iment. Beginning at 6 d postinjection, NFs reached the end of thewindow, and 37% of the total labeled pool disappeared at anapproximately linear rate between 6 and 50 d with a half-life of22 d, in agreement with established SCa (Slow Component a)transport rates of 0.1–1.0 mm/d (Nixon, 1998). By 103 d afterinjection, �20% of the total pulse-labeled NF pool still resided inaxons, and this pool of labeled NF disappeared more slowly.More than half of this pool was still present after 192 d, indicatinga half-life for this retained NF population of �100 d, �4-foldslower than the residence time in axons of NFs in slow transport.Therefore, the stationary NF pool, conservatively estimated at37% of total newly synthesized NF proteins entering axons, rep-resents at least 90% of the axonal NFs at steady state. This per-centage of labeled NFs retained in axons represents anunderestimate because we did not include the entire length of theoptic tract in the 8 mm window analyzed. Extrapolating to thetotal length of the optic nerve and tract (11 mm) yields the esti-mate that �95% of NF in optic axons is present in the stationarycytoskeleton and �5% is undergoing slow transport.
DiscussionOur studies reconcile in vitro and in vivo views of NF transport bydirectly showing that neurons expressing sufficient levels of NFsubunits establish an unequivocally immobile NF network alongaxons, maintained by filaments or nonfilamentous subunit as-semblies undergoing slow axonal transport. Formation of this NFstationary network was associated with radial growth of axons inprimary cortical neurons, similar to the relationship seen in vivo(Hoffman et al., 1987) (Nixon et al., 1994). In our study, we coulddiscern less than a 0.5 �m displacement of the edge of the windowof EGFP-NFs flanked by two photobleached zones. The absenceof a detectable displacement or spreading of this window duringa 5 h interval of observation indicates that, if these NFs were notstationary, their movement was �0.00003 �m s�1 (Figs. 5, 9),which is at least 100-fold slower than NFs moving in slow trans-port in vivo and at least 600-fold slower than the slowest-moving“on-track” NFs reported in in vitro studies (Wang et al., 2000).These results in primary cortical neurons are in accord with ourcurrent in vivo studies and our earlier studies (Nixon and Logvi-nenko, 1986), which showed no net redistribution of radiola-beled NFs proximally to distally along optic axons from 71–75 to192–198 d after isotope injection. In both experimental systems,the stationary NF network was highly stable metabolically. Esti-mated NF subunit half-lives of more than several months aresimilar to those recently calculated in vivo based on the disap-pearance of exogenous NFL after its synthesis was inhibited intetracycline-controlled human NFL transgenic mice (Millecampset al., 2007).
Our studies provide a basis for why a stationary NF networkhas not been previously detected in cultured sympathetic neu-rons, the system most widely used in earlier transport studies.Because sympathetic neurons in culture contain relatively fewNFs, they are ideal for characterizing the kinetics of individualNFs. We observed, however, that formation of a stationary NFnetwork requires a critical mass of NFs and possibly other factors
Figure 7. Coexpression of NFM and NFL or NFH and NFL increases the radial growth of axonsin primary cortical neurons. A, B, Cortical neurons at 4 DIV were transfected with EGFP emptyvector alone (A), double transfected with EGFP together with NFH, NFM, or NFL, or triple trans-fected with NFH plus NFL or NFM plus NFL (B), and axon calibers of the transfected neurons weremeasured at 3 DPT from EGFP fluorescent images of proximal axons. Scale bar: (in B) A, B, 10�m. C, Compared with what was seen for axons transfected with EGFP alone, the averagecaliber of axons significantly increased when NFM plus NFL or NFH plus NFL were cotransfectedbut not when individual NF subunits were transfected. This effect was much more striking in theaxons cotransfected with NFM and NFL compared with those with NFH and NFL. A and B are therepresentative images of the proximal axon regions transfected with EGFP empty vector aloneand together with NFM plus NFL, respectively. The abundant branching of distal axons pre-cluded meaningful comparisons of axon calibers at this level. Data are presented as mean �SEM (n � 8). AU, Arbitrary units.
Yuan et al. • Stationary NF Network in Axons J. Neurosci., September 9, 2009 • 29(36):11316 –11329 • 11325
related to a more advanced state of matu-rity of the neuron and associated proper-ties of the NF. In this regard, the corticalneurons used in our studies expressed allfour CNS NF subunits, which, in turn,displayed the higher state of phosphoryla-tion that is seen at later stages of neuronalmaturation. In contrast, the NFs presentin sympathetic neurons, cultured at 5 d ofdevelopment, lack NFH subunit and cer-tain phosphoepitopes on NFH and NFMC-terminal domains that are associatedwith axonal maturation (Yan et al., 2007)and are markers of the presence of a sta-tionary NF network (Carden et al., 1987;Lin and Szaro, 1994; Haynes et al., 2005).Cortical neurons in our studies establishedsynaptic connections and achieved signifi-cantly higher levels of NF expression, whichwere further amplified by transfecting NFLand NFM to more closely mimic the neu-rons in the culture that were expressingthe highest levels of endogenous NFproteins.
Our studies revealed striking regionaldifferences in the kinetics and assemblystates of NF proteins at different regionsalong axons of developing cortical neu-rons. The greater stability of the NF cy-toskeleton network in proximal axonsthan more distally, where NFs are fewer,reinforces our conclusion that formationof a stationary NF cytoskeleton requires acritical level of NFs. A population of NFswith relatively longer durations of paus-ing in sympathetic neurons was describedas corresponding to the stationary pool invivo (Trivedi et al., 2007); however, theaxonal window containing these fluores-cent NFs broadened and actually move enbloc over time, indicating that these NFswere pausing, not stationary, and werestill considered to be constituents of thesingle NF population undergoing slow ax-onal transport. This NF population corre-sponds more to that at intermediate axonregions of cortical neurons, where a dis-crete window of EGFP-NF broadened,suggesting some movement of individualNFs. In our studies, however, even thiswindow of fluorescent NFs in corticalneurons was more stable than that de-scribed as stationary in sympathetic neu-rons because it did not move en bloc asseen in the sympathetic neuron system.The smaller subpopulation of NFs thatwere undergoing transport displayed the kinetic properties ofslowly transported NFs as previously described (Wang et al.,2000).
The kinetics of NFs in vitro accords with the behavior of ra-diolabeled NFs in mature optic axons in vivo, in which stationaryNFs were estimated to comprise �90% of the NFs based on theamount retained in axons and their turnover rate. The stability
and stationary nature of the NF cytoskeleton is compatible withultrastructural evidence in mature axons that NFs form extensivecross-bridges with each other through their long C-terminal taildomains and, in turn, integrate into a network with other station-ary cytoskeletal elements in axons (Nixon, 1998; Prahlad et al.,2000; Perkins et al., 2008), such as microtubules (Lim et al., 1990;Okabe and Hirokawa, 1993) and the membrane skeleton (Frap-
Figure 8. Radiolabeled NFs in mature axons are stationary for up to 198 d in vivo. A, The optic pathways from mice at variousintervals after intravitreous injection of [ 3H]proline were cut into eight consecutive 1 mm segments as described in Materials andMethods. Each segment was combined with corresponding segments from six to eight mice and, after Triton-insoluble prepara-tions were resolved by SDS-PAGE, radioactivity associated with NF proteins was quantitated for each site along the optic pathway.Postinjection intervals are shown in the figure. The symbols indicate NFL (squares) and NFM (diamonds). Each time point is theaverage of from two to four separate experiments, each involving six to eight mice (mean � SEM). B, NFs pulse-labeled in vivodisappear from optic axons at two different rates. Radiolabled NFM protein within a standard 8 mm segment of the mouse opticpathway disappeared rapidly (t1/2 � 22 d) (inset graph) in the first 50 d, consistent with the exit from this segment of axons at thetypical rate of slow axonal transport. Another pool of radiolabeled NF proteins, corresponding to the pool of retained or stationaryNFs, disappeared much more slowly between 50 and 240 d (t1/2 � 83 d) (inset graph). The smaller pool of the slowly disappearinglabeled NF proteins contributes to the most to the total NF content of axons.
11326 • J. Neurosci., September 9, 2009 • 29(36):11316 –11329 Yuan et al. • Stationary NF Network in Axons
pier et al., 1991; Svitkina et al., 1996; Yang et al., 1996, 1999). NFproteins have binding sites for microtubule-associated proteins,such as tau (Miyata et al., 1986) and MAP1 and 2 (Leterrier et al.,1982; Miyata et al., 1986; Frappier et al., 1991; Ma et al., 2000),which are believed to mediate reversible interactions betweenNFs and microtubules (Leterrier and Eyer, 1987). Moreover,spectrins bind NF proteins (Frappier et al., 1987, 1991), actin
(Frappier et al., 1992), and other cytoskel-etal compartments of a stationary axo-lemma. In some neurons, BPAG (bullouspemphigoid antigen) (Yang et al., 1996,1999) or plectin (Svitkina et al., 1996) linktogether NFs, microtubules, and actinfilaments, possibly tethering the corticalcytoskeleton to the stationary axo-lemma and membrane skeleton (Hiro-kawa, 1982).
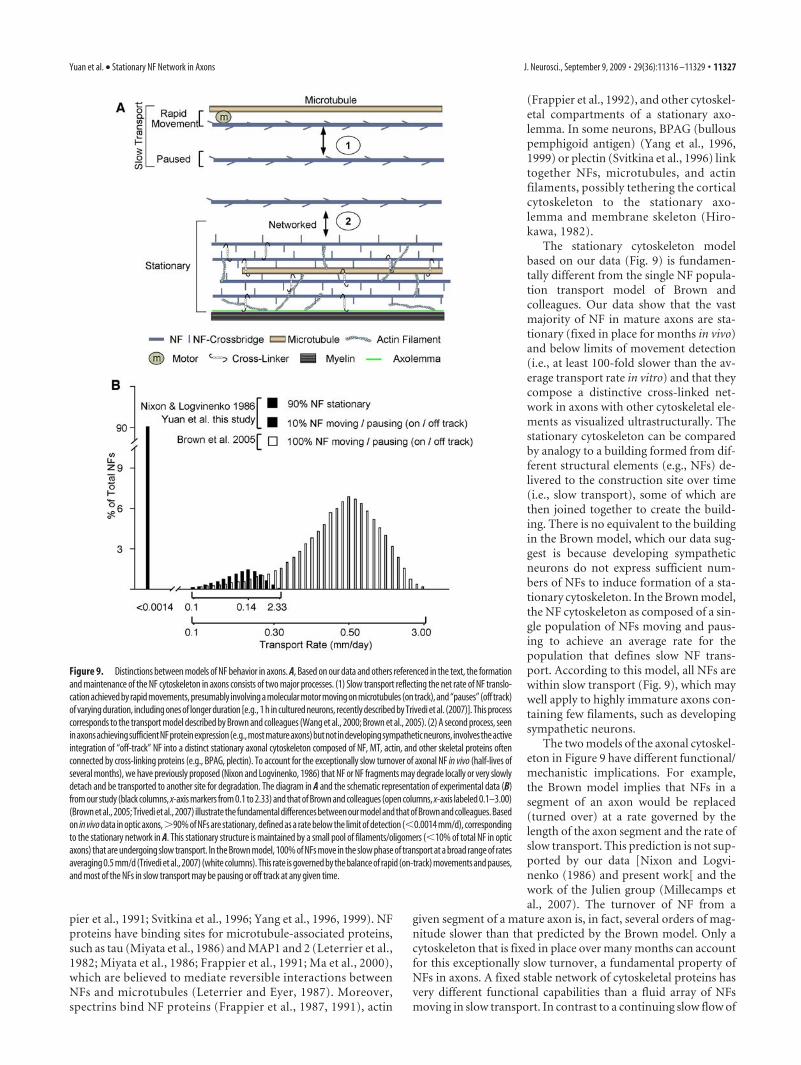
The stationary cytoskeleton modelbased on our data (Fig. 9) is fundamen-tally different from the single NF popula-tion transport model of Brown andcolleagues. Our data show that the vastmajority of NF in mature axons are sta-tionary (fixed in place for months in vivo)and below limits of movement detection(i.e., at least 100-fold slower than the av-erage transport rate in vitro) and that theycompose a distinctive cross-linked net-work in axons with other cytoskeletal ele-ments as visualized ultrastructurally. Thestationary cytoskeleton can be comparedby analogy to a building formed from dif-ferent structural elements (e.g., NFs) de-livered to the construction site over time(i.e., slow transport), some of which arethen joined together to create the build-ing. There is no equivalent to the buildingin the Brown model, which our data sug-gest is because developing sympatheticneurons do not express sufficient num-bers of NFs to induce formation of a sta-tionary cytoskeleton. In the Brown model,the NF cytoskeleton as composed of a sin-gle population of NFs moving and paus-ing to achieve an average rate for thepopulation that defines slow NF trans-port. According to this model, all NFs arewithin slow transport (Fig. 9), which maywell apply to highly immature axons con-taining few filaments, such as developingsympathetic neurons.
The two models of the axonal cytoskel-eton in Figure 9 have different functional/mechanistic implications. For example,the Brown model implies that NFs in asegment of an axon would be replaced(turned over) at a rate governed by thelength of the axon segment and the rate ofslow transport. This prediction is not sup-ported by our data [Nixon and Logvi-nenko (1986) and present work[ and thework of the Julien group (Millecamps etal., 2007). The turnover of NF from a
given segment of a mature axon is, in fact, several orders of mag-nitude slower than that predicted by the Brown model. Only acytoskeleton that is fixed in place over many months can accountfor this exceptionally slow turnover, a fundamental property ofNFs in axons. A fixed stable network of cytoskeletal proteins hasvery different functional capabilities than a fluid array of NFsmoving in slow transport. In contrast to a continuing slow flow of
Figure 9. Distinctions between models of NF behavior in axons. A, Based on our data and others referenced in the text, the formationand maintenance of the NF cytoskeleton in axons consists of two major processes. (1) Slow transport reflecting the net rate of NF translo-cation achieved by rapid movements, presumably involving a molecular motor moving on microtubules (on track), and “pauses” (off track)of varying duration, including ones of longer duration [e.g., 1 h in cultured neurons, recently described by Trivedi et al. (2007)]. This processcorresponds to the transport model described by Brown and colleagues (Wang et al., 2000; Brown et al., 2005). (2) A second process, seeninaxonsachievingsufficientNFproteinexpression(e.g.,mostmatureaxons)butnotindevelopingsympatheticneurons, involvestheactiveintegration of “off-track” NF into a distinct stationary axonal cytoskeleton composed of NF, MT, actin, and other skeletal proteins oftenconnected by cross-linking proteins (e.g., BPAG, plectin). To account for the exceptionally slow turnover of axonal NF in vivo (half-lives ofseveral months), we have previously proposed (Nixon and Logvinenko, 1986) that NF or NF fragments may degrade locally or very slowlydetach and be transported to another site for degradation. The diagram in A and the schematic representation of experimental data (B)from our study (black columns, x-axis markers from 0.1 to 2.33) and that of Brown and colleagues (open columns, x-axis labeled 0.1–3.00)(Brown et al., 2005; Trivedi et al., 2007) illustrate the fundamental differences between our model and that of Brown and colleagues. Basedon in vivo data in optic axons,�90% of NFs are stationary, defined as a rate below the limit of detection (�0.0014 mm/d), correspondingto the stationary network in A. This stationary structure is maintained by a small pool of filaments/oligomers (�10% of total NF in opticaxons) that are undergoing slow transport. In the Brown model, 100% of NFs move in the slow phase of transport at a broad range of ratesaveraging 0.5 mm/d (Trivedi et al., 2007) (white columns). This rate is governed by the balance of rapid (on-track) movements and pauses,and most of the NFs in slow transport may be pausing or off track at any given time.
Yuan et al. • Stationary NF Network in Axons J. Neurosci., September 9, 2009 • 29(36):11316 –11329 • 11327
individual fibrous elements, the formation of a fixed cytoskeletalstructure in axons more easily accounts for the ultrastructuralappearance of the axonal cytoskeleton as an extensively cross-linked structure, the considerable regional variation in NFabundance and architecture along axons, roles for the excep-tionally complex regulation of NFs by phosphorylation, andemerging evidence that NFs act as a stable scaffold for vesiclesand membrane-bound receptors (M. V. Rao, P. S. Mohan, A.Kumar, L. Montagna, J. Campbell, A. Yuan, E. M. Espreafico,J. P. Julien, and R. A. Nixon, unpublished observations).
An NF cytoskeleton that is stationary and relatively metabol-ically stable also has distinct advantages for neurons over an NFcytoskeleton that is continually replaced at the rate of slow axonaltransport. One advantage is the much smaller metabolic burdenrequired to maintain the axon. The axon often comprises 99% ofthe neuron’s total volume, so continually replacing its structurallattice, a huge proportion of the total cellular protein content,constitutes a great synthetic burden. By establishing a stationarynetwork of slowly turned-over proteins, neurons can maintainthe cytoskeleton with far less new protein synthesis. Based onquantitative autoradiographic analyses, neurons having the larg-est axons synthesize 100- to 300-fold less protein than would beexpected if their axonal constituents were being replaced in pro-portion to the volume of axoplasm (von Bernhardi and Alvarez,1989). Also, new data are emerging that the NF network acts as ascaffold for anchoring proteins and certain organelles within spe-cific domains of the neuron, which may significantly influencetheir function (Ehlers et al., 1998; Kim et al., 2002; Ratnam andTeichberg, 2005). Each of these scaffolding roles is better servedby an immobile and stable three-dimensional superstructure.
ReferencesAckerley S, Grierson AJ, Brownlees J, Thornhill P, Anderton BH, Leigh PN,
Shaw CE, Miller CC (2000) Glutamate slows axonal transport of neuro-filaments in transfected neurons. J Cell Biol 150:165–176.
Brown A, Wang L, Jung P (2005) Stochastic simulation of neurofilamenttransport in axons: the “stop-and-go” hypothesis. Mol Biol Cell16:4243– 4255.
Carden MJ, Trojanowski JQ, Schlaepfer WW, Lee VM (1987) Two-stageexpression of neurofilament polypeptides during rat neurogenesis withearly establishment of adult phosphorylation patterns. J Neurosci7:3489 –3504.
Ching GY, Liem RK (1993) Assembly of type IV neuronal intermediate fil-aments in nonneuronal cells in the absence of preexisting cytoplasmicintermediate filaments. J Cell Biol 122:1323–1335.
Ehlers MD, Fung ET, O’Brien RJ, Huganir RL (1998) Splice variant-specificinteraction of the NMDA receptor subunit NR1 with neuronal interme-diate filaments. J Neurosci 18:720 –730.
Elder GA, Friedrich VL Jr, Bosco P, Kang C, Gourov A, Tu PH, Lee VM,Lazzarini RA (1998) Absence of the mid-sized neurofilament subunitdecreases axonal calibers, levels of light neurofilament (NF-L), and neu-rofilament content. J Cell Biol 141:727–739.
Eyer J, Peterson A (1994) Neurofilament-deficient axons and perikaryal ag-gregates in viable transgenic mice expressing a neurofilament-beta-galactosidase fusion protein. Neuron 12:389 – 405.
Frappier T, Regnouf F, Pradel LA (1987) Binding of brain spectrin to the70-kDa neurofilament subunit protein. Eur J Biochem 169:651– 657.
Frappier T, Stetzkowski-Marden F, Pradel LA (1991) Interaction domainsof neurofilament light chain and brain spectrin. Biochem J 275:521–527.
Frappier T, Derancourt J, Pradel LA (1992) Actin and neurofilament bind-ing domain of brain spectrin beta subunit. Eur J Biochem 205:85–91.
Fuchs E, Cleveland DW (1998) A structural scaffolding of intermediate fil-aments in health and disease. Science 279:514 –519.
Gill SR, Wong PC, Monteiro MJ, Cleveland DW (1990) Assembly proper-ties of dominant and recessive mutations in the small mouse neurofila-ment (NF-L) subunit. J Cell Biol 111:2005–2019.
Haynes RL, Borenstein NS, Desilva TM, Folkerth RD, Liu LG, Volpe JJ, Kinney
HC (2005) Axonal development in the cerebral white matter of the humanfetus and infant. J Comp Neurol 484:156–167.
Hirokawa N (1982) Cross-linker system between neurofilaments, microtu-bules, and membranous organelles in frog axons revealed by the quick-freeze, deep-etching method. J Cell Biol 94:129 –142.
Hirokawa N (1991) Molecular architecture and dynamics of the neuronalcytoskeleton. In: The neuronal cytoskeleton (Burgoyne RD, ed), pp 5–74.New York: Wiley.
Hirokawa N (1993) Axonal transport and the cytoskeleton. Curr Opin Neu-robiol 3:724 –731.
Hoffman PN, Cleveland DW, Griffin JW, Landes PW, Cowan NJ, Price DL(1987) Neurofilament gene expression: a major determinant of axonalcaliber. Proc Natl Acad Sci U S A 84:3472–3476.
Hursh J (1939) Conduction velocity and diameter of nerve fibers. Am JPhysiol 127:131–139.
Kim OJ, Ariano MA, Lazzarini RA, Levine MS, Sibley DR (2002)Neurofilament-M interacts with the D1 dopamine receptor to regulatecell surface expression and desensitization. J Neurosci 22:5920 –5930.
Laemmli UK (1970) Cleavage of structural proteins during the assembly ofthe head of bacteriophage T4. Nature 227:680 – 685.
Lasek RJ, Paggi P, Katz MJ (1992) Slow axonal transport mechanisms moveneurofilaments relentlessly in mouse optic axons. J Cell Biol 117:607– 616.
Lee MK, Cleveland DW (1996) Neuronal intermediate filaments. Annu RevNeurosci 19:187–217.
Leterrier JF, Eyer J (1987) Properties of highly viscous gels formed by neu-rofilaments in vitro. A possible consequence of a specific inter-filamentcross-bridging. Biochem J 245:93–101.
Leterrier JF, Liem RK, Shelanski ML (1982) Interactions between neurofila-ments and microtubule-associated proteins: a possible mechanism forintraorganellar bridging. J Cell Biol 95:982–986.
Lewis SE, Nixon RA (1988) Multiple phosphorylated variants of the highmolecular mass subunit of neurofilaments in axons of retinal cell neu-rons: characterization and evidence for their differential association withstationary and moving neurofilaments. J Cell Biol 107:2689 –2701.
Lim SS, Edson KJ, Letourneau PC, Borisy GG (1990) A test of microtubuletranslocation during neurite elongation. J Cell Biol 111:123–130.
Lin W, Szaro BG (1994) Maturation of neurites in mixed cultures of spinalcord neurons and muscle cells from Xenopus laevis embryos followed withantibodies to neurofilament proteins. J Neurobiol 25:1235–1248.
Ma D, Himes BT, Shea TB, Fischer I (2000) Axonal transport ofmicrotubule-associated protein 1B (MAP1B) in the sciatic nerve of adultrat: distinct transport rates of different isoforms. J Neurosci 20:2112–2120.
Millecamps S, Gowing G, Corti O, Mallet J, Julien JP (2007) ConditionalNF-L transgene expression in mice for in vivo analysis of turnover andtransport rate of neurofilaments. J Neurosci 27:4947– 4956.
Mills RG, Minamide LS, Yuan A, Bamburg JR, Bray JJ (1996) Slow axonaltransport of soluble actin with actin depolymerizing factor, cofilin, andprofilin suggests actin moves in an unassembled form. J Neurochem67:1225–1234.
Miyata Y, Hoshi M, Nishida E, Minami Y, Sakai H (1986) Binding ofmicrotubule-associated protein 2 and tau to the intermediate filamentreassembled from neurofilament 70-kDa subunit protein. Its regulationby calmodulin. J Biol Chem 261:13026 –13030.
Nixon RA (1998) The slow axonal transport of cytoskeletal proteins. CurrOpin Cell Biol 10:87–92.
Nixon RA, Logvinenko KB (1986) Multiple fates of newly synthesized neu-rofilament proteins: evidence for a stationary neurofilament network dis-tributed nonuniformly along axons of retinal ganglion cell neurons. J CellBiol 102:647– 659.
Nixon RA, Paskevich PA, Sihag RK, Thayer CY (1994) Phosphorylation oncarboxyl terminus domains of neurofilament proteins in retinal ganglioncell neurons in vivo: influences on regional neurofilament accumulation,interneurofilament spacing, and axon caliber. J Cell Biol 126:1031–1046.
Ohara O, Gahara Y, Miyake T, Teraoka H, Kitamura T (1993) Neurofila-ment deficiency in quail caused by nonsense mutation in neurofilament-Lgene. J Cell Biol 121:387–395.
Okabe S, Hirokawa N (1993) Do photobleached fluorescent microtubulesmove?: re-evaluation of fluorescence laser photobleaching both in vitroand in growing Xenopus axon. J Cell Biol 120:1177–1186.
Perkins GA, Sosinsky GE, Ghassemzadeh S, Perez A, Jones Y, Ellisman MH(2008) Electron tomographic analysis of cytoskeletal cross-bridges in the
11328 • J. Neurosci., September 9, 2009 • 29(36):11316 –11329 Yuan et al. • Stationary NF Network in Axons
paranodal region of the node of Ranvier in peripheral nerves. J Struct Biol161:469 – 480.
Prahlad V, Helfand BT, Langford GM, Vale RD, Goldman RD (2000) Fasttransport of neurofilament protein along microtubules in squid axo-plasm. J Cell Sci 113:3939 –3946.
Rao MV, Houseweart MK, Williamson TL, Crawford TO, Folmer J, ClevelandDW (1998) Neurofilament-dependent radial growth of motor axons andaxonal organization of neurofilaments does not require the neurofilamentheavy subunit (NF-H) or its phosphorylation. J Cell Biol 143:171–181.
Rao MV, Campbell J, Yuan A, Kumar A, Gotow T, Uchiyama Y, Nixon RA(2003) The neurofilament middle molecular mass subunit carboxyl-terminal tail domains is essential for the radial growth and cytoskeletalarchitecture of axons but not for regulating neurofilament transport rate.J Cell Biol 163:1021–1031.
Ratnam J, Teichberg VI (2005) Neurofilament-light increases the cell sur-face expression of the N-methyl-D-aspartate receptor and prevents itsubiquitination. J Neurochem 92:878 – 885.
Roy S, Coffee P, Smith G, Liem RK, Brady ST, Black MM (2000) Neurofila-ments are transported rapidly but intermittently in axons: implicationsfor slow axonal transport. J Neurosci 20:6849 – 6861.
Sasaki T, Gotow T, Shiozaki M, Sakaue F, Saito T, Julien JP, Uchiyama Y,Hisanaga S (2006) Aggregate formation and phosphorylation ofneurofilament-L Pro22 Charcot-Marie-Tooth disease mutants. HumMol Genet 15:943–952.
Svitkina TM, Verkhovsky AB, Borisy GG (1996) Plectin sidearms mediateinteraction of intermediate filaments with microtubules and other com-ponents of the cytoskeleton. J Cell Biol 135:991–1007.
Trivedi N, Jung P, Brown A (2007) Neurofilaments switch between distinctmobile and stationary states during their transport along axons. J Neuro-sci 27:507–516.
von Bernhardi R, Alvarez J (1989) Is the supply of axoplasmic proteins aburden for the cell body? Morphometry of sensory neurons and aminoacid incorporation into their cell bodies. Brain Res 478:301–308.
Wang L, Ho CL, Sun D, Liem RK, Brown A (2000) Rapid movement of
axonal neurofilaments interrupted by prolonged pauses. Nat Cell Biol2:137–141.
Xu Z, Cork LC, Griffin JW, Cleveland DW (1993) Increased expression ofneurofilament subunit NF-L produces morphological alterations that re-semble the pathology of human motor neuron disease. Cell 73:23–33.
Xu Z, Marszalek JR, Lee MK, Wong PC, Folmer J, Crawford TO, Hsieh ST,Griffin JW, Cleveland DW (1996) Subunit composition of neurofila-ments specifies axonal diameter. J Cell Biol 133:1061–1069.
Yan Y, Jensen K, Brown A (2007) The polypeptide composition of moving andstationary neurofilaments in cultured sympathetic neurons. Cell Motil Cy-toskeleton 64:299–309.
Yang Y, Dowling J, Yu QC, Kouklis P, Cleveland DW, Fuchs E (1996) Anessential cytoskeletal linker protein connecting actin microfilaments tointermediate filaments. Cell 86:655– 665.
Yang Y, Bauer C, Strasser G, Wollman R, Julien JP, Fuchs E (1999) Integra-tors of the cytoskeleton that stabilize microtubules. Cell 98:229 –238.
Yuan A (2007) Neurofilament protein partnership, export, transport, phos-phorylation and neurodegeneration. In: New research on neurofilamentproteins (Arlen RK, ed), pp 53–79. New York: Nova Science.
Yuan A, Mills RG, Chia CP, Bray JJ (2000) Tubulin and neurofilament pro-teins are transported differently in axons of chicken motoneurons. CellMol Neurobiol 20:623– 632.
Yuan A, Rao MV, Kumar A, Julien JP, Nixon RA (2003) Neurofilamenttransport in vivo minimally requires hetero-oligomer formation. J Neu-rosci 23:9452–9458.
Yuan A, Rao MV, Sasaki T, Chen Y, Kumar A, Veeranna, Liem RK, Eyer J,Peterson AC, Julien JP, Nixon RA (2006) �-Internexin is structurallyand functionally associated with the neurofilament triplet proteins in themature CNS. J Neurosci 26:10006 –10019.
Yuan A, Kumar A, Peterhoff C, Duff K, Nixon RA (2008) Axonal transportrates in vivo are unaffected by tau deletion or overexpression in mice.J Neurosci 28:1682–1687.
Zhu Q, Couillard-Despres S, Julien JP (1997) Delayed maturation of regen-erating myelinated axons in mice lacking neurofilaments. Exp Neurol148:299 –316.
Yuan et al. • Stationary NF Network in Axons J. Neurosci., September 9, 2009 • 29(36):11316 –11329 • 11329