networks, social learning, and technology adoption: …sticerd.lse.ac.uk/dps/bpde2004/miguel.pdf ·...
TRANSCRIPT
Networks, Social Learning, and Technology Adoption: The Case of Deworming Drugs in Kenya
Edward Miguel1
University of California, Berkeley and NBER
Michael KremerHarvard University, The Brookings Institution,
The Center for Global Development, and NBER
October 2003 Abstract: We examine social learning using data from a program that promoted use of deworming medicine in Kenyan schools. These drugs kill worms in the body; although people are soon reinfected, treatment interferes with the cycle of transmission, generating positive externalities. Individuals randomly exposed to more information about deworming drugs through their social network were significantly less likely to take the drugs and more likely to believe the drugs are “not effective.” This finding is consistent with the hypothesis that those exposed to the program had overly optimistic prior beliefs about net private drug benefits. The combination of strong social effects and extensive social networks among teenagers implies that a “child-to-child” public health approach focused on teenagers will speed social learning. There are large differences between social effect estimates relying on experimental variation (negative estimates) and nonexperimental methods (positive estimates).
1 We thank ICS Africa and the Kenya Ministry of Health for their cooperation in all stages of the project. We would especially like to acknowledge the contributions of Alicia Bannon, Elizabeth Beasley, Laban Benaya, Simon Brooker, Pascaline Dupas, Alfred Luoba, Sylvie Moulin, Robert Namunyu, Carol Nekesa, Peter Wafula Nasokho, Polycarp Waswa and the entire PSDP staff, without whom the project would not have been possible. Melissa Gonzalez-Brenes, Pamela Jakiela, Jean Nahrae Lee, Avery Oullette, Heidi L. Williams, and especially Tina Green have provided excellent research assistance. We thank Alain de Janvry, Andrew Foster, Jon Gruber, Caroline Hoxby, Guido Imbens, Jeff Kling, Botond Koszegi, Kaivan Munshi, Mark Rosenzweig, and Chris Udry for helpful comments. We are grateful for financial support from the World Bank, the National Institutes of Health Fogarty International Center (R01 TW05612-02), and University of California, Berkeley Center for Health Research. All errors are our own. Correspondence: Edward Miguel, Department of Economics, University of California, 549 Evans Hall #3880, Berkeley, CA 94720-3880, USA, phone: 1 (510) 642-7162, fax: 1 (510) 642-6615, [email protected]. Michael Kremer, Department of Economics, Harvard University, Littauer Center, Cambridge, MA 02138, USA, phone: 1 (617) 495-9145, fax 1 (617) 495-7730, [email protected].
1. Introduction
Economic growth and development requires the adoption of new technologies. A large body of empirical
literature beginning with Griliches (1957) examines the social determinants of technology adoption. A
number of recent papers, including Conley and Udry (2000), Foster and Rosenzweig (1995), and Munshi
(2002), examine how individuals in developing countries take into account the experiences of their social
contacts when deciding whether to adopt new technologies, generating a process of social learning.2 Such
social learning could provide a rationale for public policies, such as agricultural extension, that subsidize
early technology adoption. In this paper, we examine social learning in the context of a program that
encouraged the adoption of deworming drugs in Kenyan schools.
Several issues arise in interpreting the existing literature. First, establishing the existence of social
effects in nonexperimental studies is complicated by the possibility of omitted variable bias. People with
similar characteristics, tastes, and beliefs may associate in the same social networks (Manski 1993), and
correlations among outcomes within networks may reflect these commonalities (or common shocks)
rather than social learning. Although the nonexperimental literature attempts to address the issue through
panel data sets containing rich information on individual and local characteristics (most notably Conley
and Udry 2000), ruling out omitted variable bias is often difficult. This paper, as well as Duflo and Saez
(2003), address this issue by randomizing exposure to a new technology.
Second, showing that technology adoption is influenced by contact with earlier adopters is not
sufficient to distinguish learning and imitation. For instance, people may be more likely to adopt
contraceptives if they know other adopters, and although this relation may be causal, it could be as much
due to the breakdown of social norms against contraceptives as to learning (Munshi and Myaux 2002).
We are able to address this issue by collecting information directly on individuals’ knowledge and beliefs
about a new technology, and by examining a technology that did not spread, one that yielded private
benefits that people apparently did not value highly.
2 Influential theoretical work includes Banerjee (1992), Bikhchandani et al. (1992), and Ellison and Fudenberg (1995). There is also a long-standing literature on learning in sociology (Rogers 1995).
1
Finally, in many contexts researchers are forced to impose a particular definition of which peer
group people learn from. For example, some researchers have compared people who are geographically
close to each other (Burke et al. 2003, Foster and Rosenzweig 1995) or work in the same department
within an organization (Duflo and Saez 2003). However, understanding the networks through which
information flows is important both theoretically and for public policy. For instance, in the public health
context we examine, some advocate “child-to-child” information campaigns, asserting that
communication among children changes their behavior more effectively than adult-to-child
communication (Hubley 1993, WHO 2000). To understand the channels of information flow, we
collected survey data on social networks, in which respondents could designate their own reference
groups.3 Moreover, information flows through a variety of channels, ranging from kinship networks to
community groups, and missing these channels could lead to the underestimation of actual flows.
The technology we study treats intestinal helminth (worm) infections. These are among the
world’s most common diseases, infecting one in four people worldwide. Although the social benefits of
deworming drugs are large in terms of child health and education, the private benefits are much smaller
due to pervasive treatment externalities (Miguel and Kremer 2003). These drugs kill worms in the body,
thus helping the individual who takes them and generating positive externalities by breaking the
transmission cycle. However, people are typically reinfected within months of treatment. Due to financial
and logistical constraints, the nonprofit organization administering the deworming program phased it in.
The “early treatment” and “late treatment” schools were randomly selected, generating exogenous
variation in the extent to which individuals’ social contacts were exposed to the program.
We find that children whose parents have (randomly) more social links to early treatment schools,
controlling for the total number of their social links, are themselves significantly less likely to take
deworming drugs: for each additional social link to an early treatment school, a parent’s child is 3.1
percentage points less likely to take the drugs—evidence that people’s self-defined reference groups have
3 Conley and Udry (2000) use a related survey approach.
2
a major impact on behavior. There are large differences between social effect estimates relying on
experimental variation (negative estimates) and nonexperimental methods (positive estimates), suggesting
that omitted variable bias is positive and large.
A model of learning with overoptimistic prior beliefs about the new technology is consistent with
this main finding and with other patterns in the data. Social effects are especially large in families with
more schooling. These educated families start with particularly favorable beliefs about the technology,
but then revise them downward with more information—suggesting that the widely-noted tendency for
the educated to be early adopters of technology could potentially reflect more optimistic initial beliefs
rather than faster learning. The evidence also indicates that the social effects in adoption are due to
information transmission rather than simple imitation, since people are less likely to adopt the greater
their exposure to schools where the program was previously introduced. Moreover, we find direct
evidence that beliefs about the efficacy of the drugs are revised downward in response to contact with
individuals who are familiar with the drugs.
Social effects are particularly strong in this context among teenagers—echoing a finding from
social psychology that teenagers are highly susceptible to peer influence (Steinberg and Cauffman 1996,
Gruber 2001). Teenagers also have more extensive social networks than younger children. Taken
together, these findings suggest a potential role for child-to-child school health campaigns focused on
teenagers. Finally, we find that even relatively “weak” social ties—for instance, between individuals who
speak with each other only infrequently—have a large impact on behavior.
The remainder of the paper is organized as follows. Section 2 discusses worm infections and the
cultural understanding of health in the study area, and section 3 describes the Primary School Deworming
Project. Section 4 lays out a social learning model, section 5 discusses the estimation of social effects and
presents the main empirical results, and section 6 describes patterns in the structure of social networks.
The final section summarizes and discusses implications for the design of public health projects.
2. Intestinal Worm (Helminth) Infections
3
More than 1.3 billion people worldwide are infected with hookworm, 1.3 billion with roundworm, 900
million with whipworm, and 200 million with schistosomiasis (Bundy 1994). Most have light, often
asymptomatic infections, but more severe infections can lead to iron deficiency anemia, protein energy
malnutrition, stunting (a measure of chronic undernutrition), wasting (acute undernutrition), listlessness,
and abdominal pain. Heavy schistosomiasis infections can have more severe consequences.4
Helminths do not reproduce within the human host, so high worm burdens are the result of
frequent reinfection. The geohelminths (hookworm, roundworm, and whipworm) are transmitted through
ingestion of, or contact with, infected fecal matter, which can occur, for example, if children do not use a
latrine and instead defecate in the fields near their home or school, areas where they also play.
Schistosomiasis is acquired through contact with infected freshwater; for example, in our Kenyan study
area many people bathe and fish in nearby Lake Victoria. Medical treatment for helminth infections
creates externality benefits by reducing worm deposition in the community and thus limiting reinfection
among other community members (Anderson and May 1991).
Cultural understandings of health, and particularly worms, in our study area merit a brief
discussion; our account draws heavily on the work of Geissler (1998a, 1998b, 2000), who studies
deworming take-up in a Kenyan district that borders our study area, with a nearly identical worm
infection profile to ours. Medical anthropologists have long pointed out that people can simultaneously
hold traditional and biomedical views of health, in a manner similar to religious syncretism, and Geissler
argues that this is the case for views about worms in western Kenya. In the traditional view, worms are an
integral part of the human body and necessary for digestion, and many infection symptoms—including
abdominal pain and malnutrition—are attributed to malevolent occult forces (“witchcraft”) or breaking
taboos (Government of Kenya 1986). Educated people are more likely to engage in the biomedical
discourse and thus more likely to treat illnesses medically rather than using traditional remedies.
4 Refer to Adams et al. (1994), Corbett et al. (1992), Hotez and Pritchard (1995), and Pollitt (1990).
4
Geissler finds that most people do not place much value on deworming treatment because worms
are not seen as a pressing health problem—especially compared to malaria and HIV/AIDS.5 As a result,
there was essentially no deworming outside the school health program he studies, deworming drugs are
rarely found in local shops, and most children relied on herbal remedies to alleviate the abdominal
discomfort caused by worms.
Older children have considerable autonomy in making health care decisions: teens have extensive
knowledge of both pharmaceuticals and traditional remedies, and often self-treat (Prince 2001). Nearly
three quarters of child illness events are not discussed at all with adult caregivers (Geissler 2000), which
may explain the particularly strong influence of teen social contacts in our data, as discussed below.
3. The Primary School Deworming Project (PSDP) in Busia, Kenya
The Primary School Deworming Project (PSDP) was a school health program carried out by a Dutch
nongovernmental organization (NGO), ICS Africa, in cooperation with the Kenyan Ministry of Health.
The project took place in Busia district, a poor and densely-settled farming region in western Kenya. The
75 project schools include nearly all rural primary schools in this area, with more than 30,000 enrolled
pupils between the ages of 6 and 18, more than 90 percent of them suffering from intestinal worm
infections. In January 1998, the schools were randomly divided into three groups (Groups 1, 2, and 3) of
25 schools each. The schools were divided by administrative zone and by involvement in other NGO
assistance programs, listed alphabetically, and every third school was assigned to a given project group.6
Due to administrative and financial constraints, the health intervention—which included both
deworming medicine and health education on worm prevention behaviors—was phased in over several
years. Group 1 schools received treatment in 1998–2001, and Group 2 schools in 1999-2001. Group 3
began participating in 2001. This design implies that in 1998, Group 1 schools were treatment schools,
5 Geissler studies an ethnically Luo area (Luos speak a Nilotic language). The majority of our sample are ethnically Luhya (a Bantu-speaking group) though Luos are four percent of our sample. However, traditional Luo views toward worms are closely related to views found among Bantu-speaking groups in other parts of Africa, including Mozambique (Green et al. 1994, Green 1997) and South Africa (Zondi and Kvalsig 1987). 6 Appendix table A1 presents a more detailed project timeline.
5
while Group 2 and Group 3 schools were the comparison schools; and in 1999 and 2000, Group 1 and 2
schools were the treatment schools, and Group 3 schools were comparison schools. Starting in 1999,
signed individual parental consent was required for deworming. In 1998 only “community consent”
(meetings at which parents were informed of—and could opt out of—the program) had been required. At
each school, the project began with a community meeting of parents, teachers, and the school committee,
which included a discussion of worm infections, the nature of medical deworming treatment, and worm
prevention measures. All school communities agreed to participate in the project.
The project provided periodic treatment with deworming drugs in all schools where disease
prevalence was sufficiently high. The geohelminths and schistosomiasis are treated using the low-cost
single-dose oral therapies of albendazole and praziquantel, respectively. The World Health Organization
has endorsed mass school-based deworming in areas with prevalence higher than 50 percent, since this
eliminates the need for costly individual screening (Warren et al. 1993, WHO 1987), and drugs delivered
through a large-scale program may cost as little as US$0.49 per person per year in Africa (PCD 1999).
Side effects are minor and transient, rarely lasting more than one day, but may be salient relative
to the benefits of treatment. Side effects include stomach ache, diarrhea, dizziness, fever, and even
vomiting in some cases (WHO 1992). Side effects are more severe for children with heavier
schistosomiasis infections, and in our data parents of such children are more likely to claim that the drugs
had side effects (although this effect is not statistically significant).7 Whereas side effects occur
immediately after treatment, and worms are expelled from the body at that time, health benefits take time
to materialize, for example, as anemia gradually declines.
The observed take-up rate of deworming medicine is roughly 70 percent. One factor limiting
take-up is school absenteeism. On a typical day in schools in this area, about 30 percent of pupils listed on
7 Due to concern about the possibility the drugs could cause birth defects, standard practice in mass deworming programs at the time was to not treat girls of reproductive age, although with a lengthening track record of safe use, the WHO has recently called for deworming drugs to be administered to older girls as well as other children.
6
the school register the previous year are absent (Miguel and Kremer 2003).8 Aside from the typically
minor drug side effects, costs of participation (for parents) include walking to school to provide written
parental consent, any costs of visiting the headmaster for the many parents who are behind on school fee
payments, and remembering the date of deworming treatment at the school.
In previous work we find that mass treatment with deworming drugs generated substantial gains
in health and school participation in these schools. Deworming reduced absenteeism in treatment schools
by one quarter, and externalities from the treatment generated gains for neighboring schools as well. The
reductions in serious worm infections for the untreated within treatment schools were between 70 to 80
percent as large as those for the treated. Reductions for pupils in neighboring schools were on the order of
30 percent as large as those for the treated. While the overall program impact is large, the gaps between
the treated and untreated are not, due to these externalities (Miguel and Kremer 2003). Thus private
benefits of treatment appear only moderate.
Several pieces of evidence suggest the typical household did not value deworming highly. The
NGO has a general policy of introducing community cost-recovery in all its rural development programs
in order to promote “sustainability” and to confer project “ownership” on the beneficiaries. In this case,
the NGO initially waived the policy, and then phased it in. The 50 Group 1 and Group 2 schools were
stratified by treatment group and geographic location, and in early 2001, 25 of them were randomly
selected to pay user fees for medical treatment, while the other 25 continued to receive free medical
treatment. All Group 3 schools received free treatment in 2001. The average cost of deworming per child
was slightly more than US$0.30—still a heavily subsidized price, about one fifth the cost of drug
purchase and delivery through the program.9 This small cost led to a dramatic reduction in treatment
8 According to the 2001 take-up data (collected by enumerators), nearly 80 percent of nontreatment was due to pupil absence from school on the treatment day, with most of the remainder due to lack of parental consent. There were few cases of child refusal to take the drugs (less than 1 percent). 9 Annual Kenyan per capita income is US$340 (World Bank 1999), but incomes are thought to be lower in Busia.
7
rates: children in 75 percent of households in the free treatment schools took deworming drugs in 2001
(table 1, panel A), while the rate was only 19 percent in cost-sharing schools.10
Moreover, in addition to medical deworming treatment, the project included intensive health
education on worm prevention behaviors – washing hands, wearing shoes, and avoiding infected fresh
water – provided by both teachers and adult NGO workers using culturally appropriate materials designed
in Tanzania. This health education component failed to substantially change worm prevention behaviors
(Kremer and Miguel 2003).
4. A Simple Model of Learning about a Health Technology
Once people gain experience with a new medical technology, they may learn about its effectiveness and
spread this information on to others. Below we consider a theoretical model of the spread of a technology
through social learning and then empirically examine the spread of deworming drug adoption and
knowledge. We then examine how far we can go toward explaining take-up patterns in a rational
framework with Bayesian learning (section 5).
Consider an individual i in school j deciding whether to adopt a new technology (or health
practice), where an indicator variable for take-up is represented by Tij∈ {0, 1}. We represent the
individual’s expected overall net private benefit of adoption by )]0()1([ =−== ijij TUTUEφ , where U
is individual utility, the net private benefit conditional on the treatment choices of other individuals.
At the moment the new technology is introduced, the individual has a prior belief about the
expected net private benefits, denoted φ0, which may be greater or less than the actual expected benefit, φ.
Prior beliefs about the impact of deworming may have been variable across individuals in our case, since
they had little prior experience with mass deworming treatment. φ0 could be less than φ due to traditional
beliefs about worms that emphasize their health benefits rather than their costs (Geissler 1998a). On the
other hand, people could also have had overly optimistic estimates about private benefits. Although the
10 The data are described below. These results are discussed in greater detail in Kremer and Miguel (2003).
8
scripts prepared for use during the community meetings to publicize the program did explain that people
could become reinfected after taking the medicine, the NGO field officers who gave the talks saw their
jobs as promoting deworming medicine and prevention behaviors, and their enthusiasm may have
reflected the social rather than private benefits of deworming. If people estimate the private benefit of
treatment by simply comparing the health status of infected and uninfected people, they could
overestimate the effect of treatment, since treatment provides only short-run protection. Moreover, if
people estimate their expected private benefits by comparing individuals in treatment and comparison
schools, to the extent that there are positive within-school treatment externalities, they will incorrectly
assign some of the externality value to private benefits – making prior beliefs about the net private
benefits of treatment too optimistic.
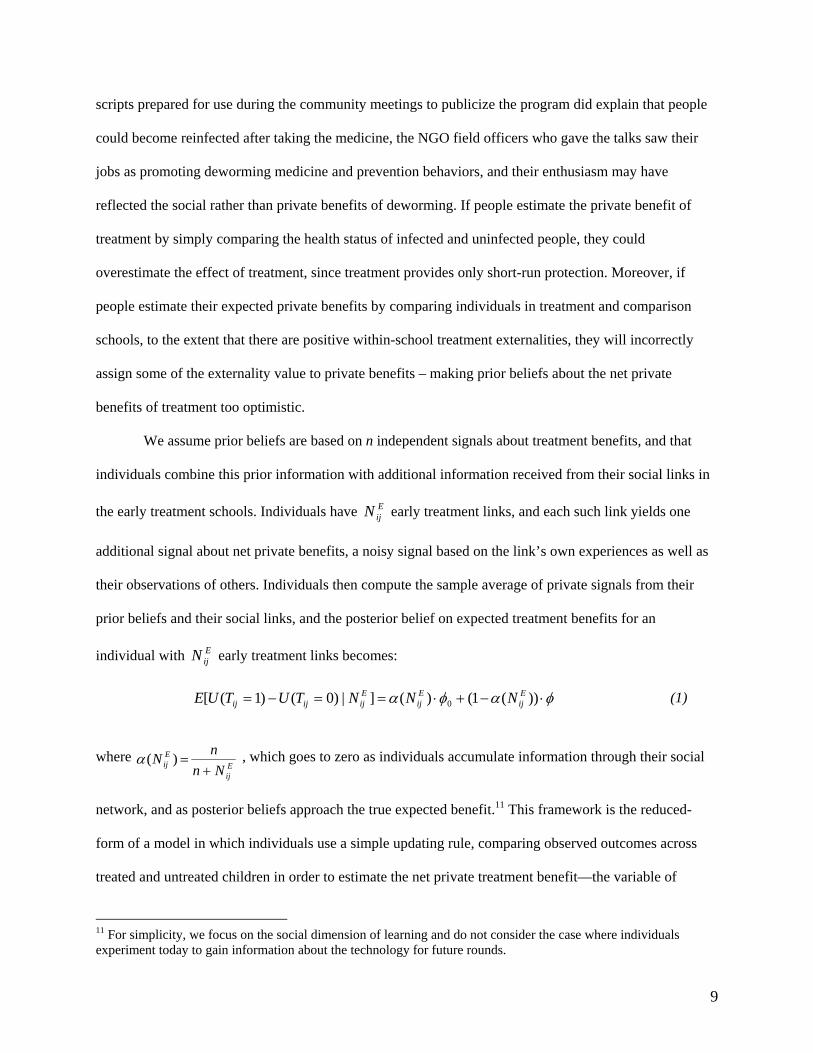
We assume prior beliefs are based on n independent signals about treatment benefits, and that
individuals combine this prior information with additional information received from their social links in
the early treatment schools. Individuals have early treatment links, and each such link yields one
additional signal about net private benefits, a noisy signal based on the link’s own experiences as well as
their observations of others. Individuals then compute the sample average of private signals from their
prior beliefs and their social links, and the posterior belief on expected treatment benefits for an
individual with early treatment links becomes:
EijN
EijN
φαφα ⋅−+⋅==−= ))(1()(]|)0()1([ 0Eij
Eij
Eijijij NNNTUTUE (1)
where Eij
Eij Nn
nN+
=)(α , which goes to zero as individuals accumulate information through their social
network, and as posterior beliefs approach the true expected benefit.11 This framework is the reduced-
form of a model in which individuals use a simple updating rule, comparing observed outcomes across
treated and untreated children in order to estimate the net private treatment benefit—the variable of
11 For simplicity, we focus on the social dimension of learning and do not consider the case where individuals experiment today to gain information about the technology for future rounds.
9
immediate interest to them. Implications are likely to be similar to a model in which people learn about
the full underlying epidemiological model.12
The solution is intuitive: when the prior belief is greater than the actual expected benefit (φ0 > φ),
individuals with more early treatment social links have lower posterior beliefs about expected benefits on
average, and thus the likelihood of adoption declines in the number of early links. From equation 1, the
decline in the expected benefit of treatment with respect to early links will be convex, as in figure 1, as
the posterior asymptotically approaches the true expected benefit. Similarly, when the prior belief is less
than the true expected benefit, the posterior asymptotically approaches the true benefit from below.
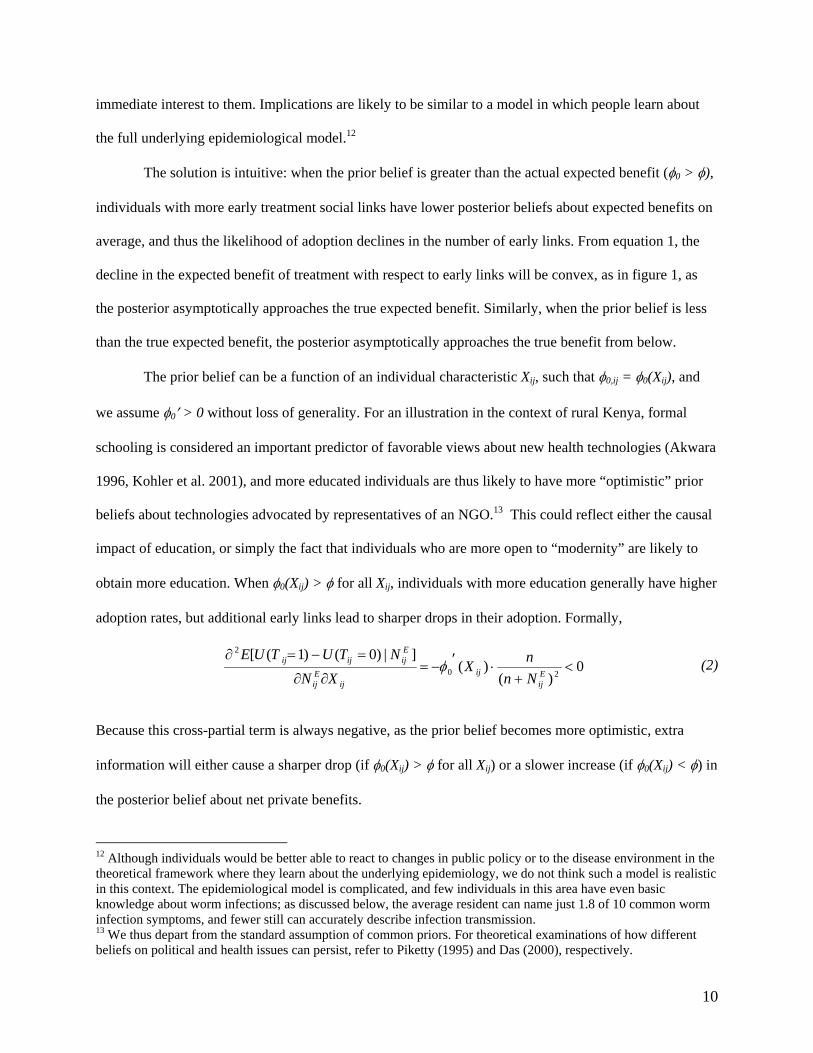
The prior belief can be a function of an individual characteristic Xij, such that φ0,ij = φ0(Xij), and
we assume φ0′ > 0 without loss of generality. For an illustration in the context of rural Kenya, formal
schooling is considered an important predictor of favorable views about new health technologies (Akwara
1996, Kohler et al. 2001), and more educated individuals are thus likely to have more “optimistic” prior
beliefs about technologies advocated by representatives of an NGO.13 This could reflect either the causal
impact of education, or simply the fact that individuals who are more open to “modernity” are likely to
obtain more education. When φ0(Xij) > φ for all Xij, individuals with more education generally have higher
adoption rates, but additional early links lead to sharper drops in their adoption. Formally,
0)(
)(]|)0()1([
20
2
<+
⋅′−=∂∂
=−=∂Eij
ijij
Eij
Eijijij
NnnX
XNNTUTUE
φ (2)
Because this cross-partial term is always negative, as the prior belief becomes more optimistic, extra
information will either cause a sharper drop (if φ0(Xij) > φ for all Xij) or a slower increase (if φ0(Xij) < φ) in
the posterior belief about net private benefits.
12 Although individuals would be better able to react to changes in public policy or to the disease environment in the theoretical framework where they learn about the underlying epidemiology, we do not think such a model is realistic in this context. The epidemiological model is complicated, and few individuals in this area have even basic knowledge about worm infections; as discussed below, the average resident can name just 1.8 of 10 common worm infection symptoms, and fewer still can accurately describe infection transmission. 13 We thus depart from the standard assumption of common priors. For theoretical examinations of how different beliefs on political and health issues can persist, refer to Piketty (1995) and Das (2000), respectively.
10
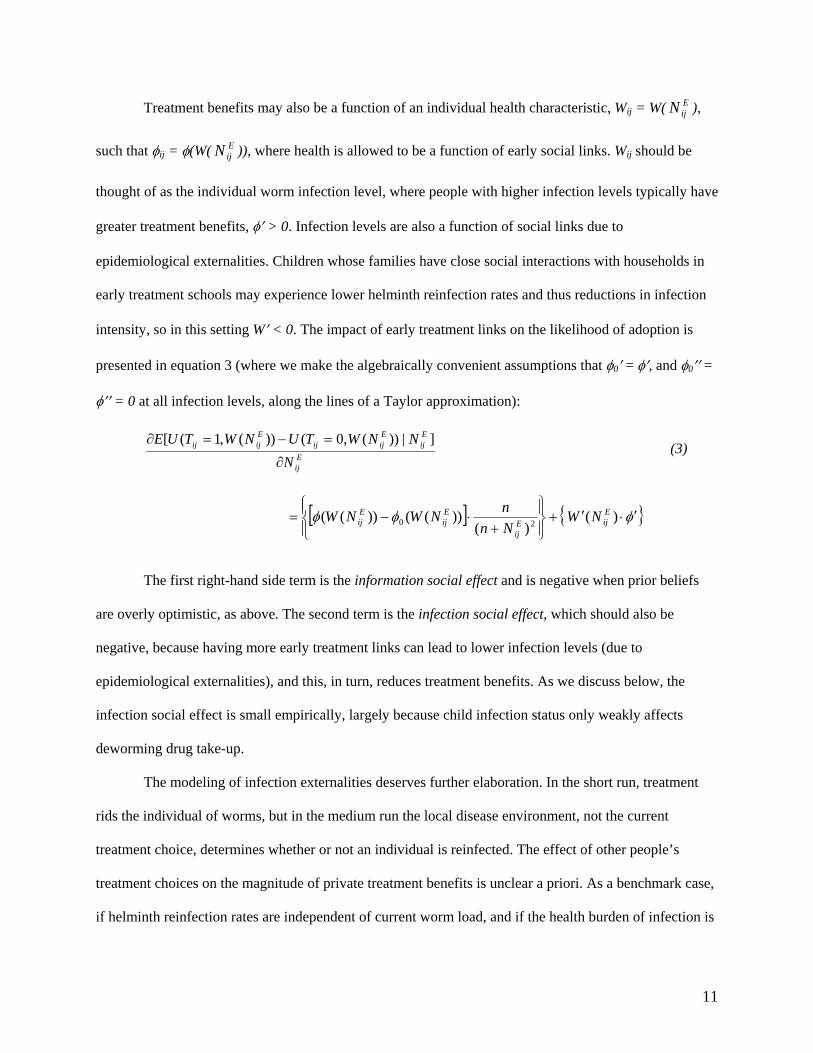
Treatment benefits may also be a function of an individual health characteristic, Wij = W( ),
such that φ
EijN
ij = φ(W( )), where health is allowed to be a function of early social links. WEijN ij should be
thought of as the individual worm infection level, where people with higher infection levels typically have
greater treatment benefits, φ′ > 0. Infection levels are also a function of social links due to
epidemiological externalities. Children whose families have close social interactions with households in
early treatment schools may experience lower helminth reinfection rates and thus reductions in infection
intensity, so in this setting W′ < 0. The impact of early treatment links on the likelihood of adoption is
presented in equation 3 (where we make the algebraically convenient assumptions that φ0′ = φ′, and φ0′′ =
φ′′ = 0 at all infection levels, along the lines of a Taylor approximation):
Eij
Eij
Eijij
Eijij
NNNWTUNWTUE
∂
=−=∂ ]|))(,0())(,1([ (3)
[ ] { }φφφ ′⋅′+⎪⎭
⎪⎬⎫
⎪⎩
⎪⎨⎧
+⋅−= )(
)())(())(( 20
EijE
ij
Eij
Eij NW
NnnNWNW
The first right-hand side term is the information social effect and is negative when prior beliefs
are overly optimistic, as above. The second term is the infection social effect, which should also be
negative, because having more early treatment links can lead to lower infection levels (due to
epidemiological externalities), and this, in turn, reduces treatment benefits. As we discuss below, the
infection social effect is small empirically, largely because child infection status only weakly affects
deworming drug take-up.
The modeling of infection externalities deserves further elaboration. In the short run, treatment
rids the individual of worms, but in the medium run the local disease environment, not the current
treatment choice, determines whether or not an individual is reinfected. The effect of other people’s
treatment choices on the magnitude of private treatment benefits is unclear a priori. As a benchmark case,
if helminth reinfection rates are independent of current worm load, and if the health burden of infection is
11
linear in worm load, the private health benefits of treatment are independent of others' treatment
decisions. If instead the health costs of infection are convex (concave) in worm load, deworming
treatment benefits will be greater (smaller) in an environment that is expected to have high exposure to
worms in the future. Thus the net private benefits of treatment will be lower (higher) if others are treated.
In a previous study (Miguel and Kremer 2003), we estimated average deworming treatment spillovers and
find that they are roughly linear in local take-up rates, but, due to data limitations, have little power to
detect higher order nonlinear terms. For simplicity, we thus assume the benchmark linear case holds.
5. Empirical Results
5.1 Data and Measurement
The empirical work employs two new micro-datasets that allow us to examine the impact of both parent
and child social links: the PSDP Parent Questionnaire and the PSDP Pupil Questionnaire, administered by
experienced enumerators under the supervision of NGO field managers in 2001.14 Parent Questionnaires
were collected during household visits among a representative subsample of parents with children
currently enrolled in Group 2 and Group 3 schools. A subsample of children (typically aged 10 to 17
years) present in school on the survey day were given the Pupil Questionnaire. Survey refusal rates were
low for both surveys, as is typical for this region.
Parent Questionnaire respondents were asked for information on their closest social links: the five
friends they speak with most frequently, the five relatives they speak with most frequently, additional
social contacts whose children attend local primary schools, and individuals with whom they speak
specifically about child health issues. These individuals are collectively referred to as the respondent’s set
of “social links.” The survey also collected information on the deworming treatment status of social links’
children and the effects of treatment on their health; how frequently the respondent speaks with each
social link; which primary schools links’ children attend; the global positioning system (GPS) location of
the respondent’s home; and the respondent’s knowledge of worm infections and their attitudes toward
14 Both datasets, and complete documentation, are available from the authors upon request.
12
deworming drugs. The Parent Questionnaire was administered in two rounds in 2001, with households
randomly allocated between the rounds. The Round 2 survey collected more detailed information on the
impact of deworming on links’ children.
The second survey, the 2001 Pupil Questionnaire, collected analogous information on social
networks and attitudes toward deworming, but this time from the schoolchildren. Not all children were
administered the 2001 Pupil Questionnaire. Some were excluded because of limited financial resources
for the research (which forced us to interview a representative subsample of children present in school on
the survey day rather than all children), and others because of absence from school on that day.
Four different samples are used in the analysis. Sample 1, the main parent sample, contains 1,678
parents surveyed in Rounds 1 or 2 with complete child treatment and parent social network data.15 We
use Sample 2, the 886 parents surveyed in Round 2, to analyze the impact of the links’ own deworming
experiences on the respondent’s choices. Sample 3 contains information for the 3,164 children with
complete 2001 Pupil Questionnaire data on social links and drug take-up, and who were eligible for
treatment in 2001. Sample 4 contains the 1,239 pupils with complete Pupil Survey and Parent Survey
information. Forty-six percent of the 1,678 parents in Sample 1 and 61 percent of children in Sample 3 are
dropped when we are restricted to this subsample with both complete parent and child data (note that
there are multiple children in some households).
On average, parent respondents have 10.2 social links with children in primary school, of whom
4.4 attend the respondent’s child’s own school, 2.8 attend other project schools (Groups 1, 2, or 3), and
1.9 attend nearby “early treatment schools” (Groups 1 and 2—table 1, panel B). There is considerable
variation in the number of early treatment links: the standard deviation is 2.0, and approximately one third
of respondents have no social links to Group 1 or 2 schools, one third have one or two links, and one third
have three or more. Child networks show similar patterns (table 1, panel D).
15 Eleven percent of surveyed households were dropped due to child ineligibility for deworming (i.e., the child was an older girl excluded from treatment), and a reasonably modest 13 percent due to either missing parent network information, child treatment information, household characteristics, or difficulty matching observations across the 2001 surveys and earlier PSDP datasets.
13
5.2 Estimating Social Effects
We test whether households with more social links to early treatment schools were more likely to take
deworming drugs in 2001, conditional on their total number of social links to all project schools. The
experimental design created exogenous random variation in the proportion of individuals whose children
attend “early treatment” schools (Groups 1 and 2) versus “late treatment” schools (Group 3), and this is
the variation we exploit.
To validate the identification strategy, we confirm that the randomization succeeded in creating
balanced early treatment and late treatment groups: the number of social links to early treatment schools,
as well as the Group 2 indicator variable and the cost-sharing indicator, are not significantly associated
with most observable characteristics (table 2), including parent years of education, community group
membership (e.g., women's or farming groups), the total number of children in the household, the
distance from home to the primary school, or with household ethnic group or religious affiliation (results
not shown). The number of early links is, however, positively and significantly associated with iron roof
ownership in one specification (table 2, regression 4). The number of child social links to early treatment
schools is not significantly related to any of these characteristics using Sample 4, the sample of children
with both parent and child data (results not shown).
The analysis with parent social network data is conducted at the household level using probit
estimation, and the outcome measure takes on a value of one if any child in the household was treated
with deworming drugs in 2001, and zero otherwise (although results are similar if the analysis is
conducted using the child as the unit of observation—results not shown).16 Tij is the main dependent
variable, the 2001 treatment indicator described above, where i is a household in school j. The
idiosyncratic deworming benefit term, εij, captures unobserved variation in parent beliefs about
deworming benefits or the costs of obtaining treatment (for instance, whether the pupil was sick on the
16 Treatment choices across children in the same family are highly correlated, as expected, and hence the focus is on the household as the unit of observation when we focus on parent networks.
14
treatment day, which increases the cost of attending school). The individual treatment decision becomes
Tij = 1( ), where is the number of parent social links to early treatment schools
(not including the respondent’s own school), and “early treatment schools” in 2001 are the Group 1 and 2
schools. We also examine the proportion of social links to early treatment schools as a robustness check.
An analogous analysis is conducted for child social networks, and in some specifications we include both
parent and child links as explanatory variables.
0>+′+ ijijEij XN εβλ E
ijN
Among the explanatory variables, Xij, we include total links to all program schools other than the
respondent’s own school, as well as the number of links to nonprogram schools (represented by the vector
). Given the experimental design of the original deworming program, the number of social links to
early treatment schools is randomly assigned conditional on total links to other program schools. The
cost-sharing indicator variable, C
ijN
j, takes on a value of one for schools participating in the cost-sharing
project. Zij is a vector of additional household socioeconomic characteristics (parents’ education and asset
ownership), demographic characteristics (respondent fertility), and other controls (respondent
membership in community groups and a Group 2 indicator) that may affect real or perceived deworming
benefits and costs. Idiosyncratic disturbance terms are allowed to be correlated within each school, as a
result of common influences such as headmaster efforts in promoting the program. Equation 4 presents
the main probit specification:
)1Pr( =ijT }{ 21 ijijjijEij ZCNN εθγλλ +′++′+Φ= (4)
We also include interaction terms between household characteristics and the number of links in some
specifications to explore the possibility of heterogeneous treatment effects, for example, for individuals
with more education.
We do not attempt to estimate learning through self-experimentation with deworming drugs. In
the absence of other factors affecting take-up patterns across treatment rounds, it might be possible to
identify this effect, but changing parent consent requirements, and changes in child infection status and
15
the local disease environment after treatment, all likely affected take-up differentially through time. We
discuss additional econometric issues in section 5.4.
5.3 Parent Social Learning Results
Each additional parent social link to an early treatment school is associated with 3.1 percentage points
lower likelihood that the respondent’s children received medical treatment in 2001, and this effect is
significantly different from zero at over 95 percent confidence (table 3, regression 1 presents marginal
probit estimates evaluated at mean values). This suggests that the respondent’s small, self-defined social
network has a major impact on health choices: having two additional early treatment links (roughly a one
standard deviation increase) reduces take-up by 6 percentage points. Moreover, this result cannot simply
be due to imitation, since social effects are negative.
Figure 2 graphically presents the nonparametric social effect estimates (using Fan local
regression) and indicates that the relation between the number of early treatment links and take-up,
conditional on the explanatory variables in regression 1, is negative and somewhat convex, consistent
with our learning model. A quadratic term in parent social links to early treatment schools is also
statistically significantly different from zero at 95 percent confidence in some specifications (appendix
table A2). However, this quadratic term is not significant for child social links, or for interactions with
household characteristics (results not shown). We thus principally focus on the linear measure of early
treatment links in what follows.
None of the demographic or socioeconomic controls is significantly associated with 2001 take-up
except for distance from home to school, which is negatively related to take-up. This finding makes sense
since geographically distant households face higher costs for parents to walk to school to provide written
consent, and for children to attend school.
Social effects are more negative for Group 3 schools (point estimate –0.041, table 3, regression 2)
than for Group 2 schools (point estimate –0.023, the sum of the direct effect of early treatment links and
its interaction with the Group 2 indicator), although the difference is not statistically significant. This
16
result is consistent with the theoretical model: Group 2 parents have observed the impact of deworming
treatment in their own household and community and should therefore be less influenced than Group 3
parents by early links (i.e., in Equation 1, n is larger for Group 2 parents than Group 3 parents).17
Nonetheless, the persistent influence of early links on Group 2 households after two years of treatment is
noteworthy; one potential non-Bayesian explanation is that initial pieces of information about a new
technology carry disproportionate weight in subsequent decisionmaking (Rabin and Schrag 1999).18 The
effect of early links is nearly identical for cost-sharing and noncost-sharing schools (not shown).
The results are robust to including the proportion of links with children in early treatment schools,
rather than the number of such links (regression 3), and to controlling for the total number of parent social
links nonparametrically using a set of indicator variables (results not shown).19
Several pieces of evidence suggest that learning takes place not only among individuals with
strong social ties but also among those with relatively weak ties, along the lines of Granovetter (1973).
When the framework is extended to include different types of parent social links—“close” friends (with
whom the respondent speaks at least twice a week) versus “distant” friends—each additional close link to
an early treatment school is associated with 0.030 lower probability of deworming treatment in 2001and
the estimated effect of distant links is similar; however, the effect of distant links is not statistically
17 See Conley and Udry (2003) for a similar result on experience in the adoption of an agricultural technology. 18 A finding that casts some doubt on the “first impressions matter” explanation, however, is the fact that links to Group 1 schools (phased in during 1998) have nearly identical impacts as links to Group 2 schools (phased in during 1999). The persistent effects of early treatment links on take-up might be reconciled with Bayesian learning if individuals believed there was a school-year specific component to drug treatment effects, thus leading them to place extra weight on outcomes in other schools. 19 The results are also robust to a specification without socioeconomic controls (appendix table A2, regression 1), and to the inclusion of additional ethnic and religious controls, and indicators for whether the respondent is a member of the dominant local ethnic and religious group (regression 2); none of the six ethnic group indicator variables is significantly related to take-up. The results are similar when the local density of early treatment school pupils (located within 3 km of the respondent’s school), and the density of all local primary school pupils, are included as controls (regression 4). However, the point estimate on early links falls by about one third and becomes statistically insignificant, possibly because the local density measures are in part also picking up the effect of interactions with individuals not included in the social links roster. Still, an F-test indicates that the early treatment social links and local density of early treatment pupils terms are jointly significant at 99 percent confidence.
17
significant (table 4, regression 1, estimate –0.033, standard error 0.033).20 We are similarly unable to
reject the hypotheses that the social effect on take-up is the same for links to relatives versus friends, or
for members of the respondent’s own ethnic group versus other ethnic groups, conditional on being
named a social link by the respondent (results not shown). One explanation for the ethnic result may be
that more than 90 percent of individuals in this area belong to closely related ethnic Luhya groups and
thus have strong linguistic and cultural ties even across most group boundaries.21
Social effects are more strongly negative for respondents with more education (table 4, regression
2), which is consistent with the prediction that individuals with the most optimistic priors experience the
largest drops in take-up when they receive more information. Other studies—most notably Foster and
Rosenzweig (1995)—find that educated individuals learn rapidly about new technologies. In other cases,
this has led more educated individuals to be early adopters, unlike our case, where they are the first to
learn not to adopt.22
In the theoretical framework presented in section 4, additional social links have a larger impact on
more educated individuals because of their overly optimistic prior beliefs about the drugs, rather than
greater receptiveness to new information. Although we cannot decisively distinguish these explanations
empirically, the relation between respondents’ education and their stated belief that deworming drugs are
“very effective” does provide some further suggestive evidence supporting the overoptimism model.
Among Group 3 parents interviewed in Round 1, before deworming treatment was phased into their
schools, there is a particularly strong link between education and positive views: individuals who had
20 Using another definition of link strength yields similar results. While most links were provided in response to questions about the individuals with whom the respondent speaks most frequently, others were provided in response to prompts about contacts in particular local schools. There is not a statistically significant difference in the effects of “unprompted” and “prompted” links (in fact, prompted links are somewhat more influential—not shown). 21 The largest Luhya subtribes in this area include the Samia (64 percent of children), Nyala (27 percent), Khayo (1 percent), and Marachi (1 percent). These are considered separate ethnic groups in the above empirical analysis, although whether subtribes constitute separate “ethnic groups” is debatable. The two substantial non-Luhya groups in the sample are the Luo (4 percent) and the Teso (1 percent). On average, 67 percent of named social links outside of the respondent’s own school belong to the same ethnic group, a figure similar to the average proportion of the largest ethnic in a primary school (68 percent). 22 The overall impact of an additional year of schooling on deworming take-up remains positive, though not statistically significant, in table 4, regression 2 when all the education interaction terms (including respondent education interacted with total social links) are taken into consideration (results not shown).
18
completed primary school were 17 percentage points more likely to believe the drugs are “very effective.”
However, this falls by about half to 9 percentage points for more educated Group 3 parents interviewed in
Round 2 (recall parents were randomly allocated between survey rounds), several months after
deworming had been introduced into their schools, and is similar for educated Group 2 parents in 2001 (at
10 percentage points), two years after their schools had begun receiving treatment. By that time, views
toward the drugs had partially converged across educational levels, as predicted by the model in section 4.
The impact of early treatment social links on take-up is particularly negative for parents with a
teenage child (table 4, regression 3)—the first piece of suggestive evidence that child networks may also
be influential. Additional evidence comes from the fact that each additional parent early treatment link is
associated with a moderate drop of only –0.010 (standard error 0.013—results not shown) in the provision
of signed parental consent, the most direct means for parents to affect their children’s take-up. We
elaborate on the issue of parent versus child social effects in section 5.7.
5.4 Further Econometric Identification Issues
Even though the randomizations were largely successful in creating comparable groups, social links to
early treatment schools might also affect adoption through infection social effects (section 4). However,
we argue that infection effects cannot explain even a small fraction of the overall social effect of –3.1%
(table 3, regression 1), since any plausible estimate of the effect of social contacts to early treatment
schools on infection status, times the effect of infection on take-up, is much smaller.
First, having additional social links to early treatment schools is associated with lower rates of
moderate-heavy helminth infection, as expected (table 2, regression 6), but the effect is relatively small
and not statistically significant (coefficient estimate –1.2%, relative to a mean moderate-heavy infection
rate of 27%).23 In terms of the second step—from infection status to take-up—prior infection status is not
23 Note that the relatively weak relation between early treatment social links and child infection status does not contradict the strong infection externality findings in Miguel and Kremer (2003). Worm infections are not transmitted directly person to person, but rather through contaminated soil and water, and a child’s named social links constitute only a small fraction of all people who defecate in fields near the child’s home, school, market, and church, or who bathe at the same points on Lake Victoria.
19
significantly associated with drug treatment for either Group 1 in 1998 or Group 2 in 1999 (Miguel and
Kremer 2003), or for Groups 2 and 3 in 2001 (results not shown) and the point estimates suggest that
moderate-to-heavy worm infection is somewhat negatively related to treatment rates.24 Of course, the
cross-sectional correlation between infection and treatment cannot be interpreted as causal due to omitted
variable bias; children from unobservably low socioeconomic status households may have both high
infection rates and low take-up, for example. However, the treated and untreated look remarkably similar
along many observable baseline socioeconomic and health characteristics (Miguel and Kremer 2003), and
the relationship is similar using school-level average infection rates rather than individual data (not
shown), weakening the case for strong selection into treatment.
Further evidence on the effect of changes in infection status on drug take-up is provided by the
1999 cross-school infection externality estimates, identified using exogenous variation in the local density
of early treatment schools. Although we find large average reductions in moderate-heavy worm infection
rates as a result of cross-school externalities (0.23, appendix table A3), proximity to early treatment
schools leads to an average reduction in drug take-up of only 0.02—which has the expected sign but is
near zero (results not shown). Using this estimate, moderate-heavy infection is associated with a 0.02/0.23
= 0.09 reduction in the likelihood of treatment, and this implies a drop in take-up of only (0.09)*1.2% =
0.11%, rather than the 3.1% reduction we estimate. Even if eliminating a moderate-heavy infection
reduced the likelihood of drug take-up by a massive 0.5 on average (rather than the 0.09 we estimate),
health externalities could account only for a (0.5)*(1.2%) = 0.6% reduction in take-up—less than one
fifth of the overall effect.
Further evidence against the view that infection externalities drive the negative effect of social
links is provided by the fact that infection effects are driven entirely by early treatment links with whom
the respondent has a “close” social relationship, speaking at least twice per week (table 2, regression 7,
24 The 2001 worm infection results are for a subsample of only 575 children who were randomly sampled for stool collection, and were present in school on the day of the parasitological survey. Due to the relatively small sample size, we do not focus on the parasitological data in the main empirical analysis.
20
coefficient estimate –0.018), while additional early links with whom the respondent speaks less frequently
do not affect infection status (estimate 0.004). Thus “distant” social links appear to have a sizeable
negative impact on adoption decisions (table 4, regression 1) but no effect on infection status—further
bolstering the claim that information rather than infection externalities drive the overall social effect.
Pupil transfers among local primary schools during the study are another potential concern.
However, any resulting bias would likely work against our findings. For example, parents with more
health-conscious social contacts—whose children may have been more likely to transfer to early
treatment schools to receive deworming—may themselves also be more health-conscious and eager to
have their own children receive treatment, biasing the estimated social effect upward – in which case our
negative social effect estimate would be an upper bound on the true effect. In any case, the rate of pupil
transfers between treatment and comparison schools was low and nearly symmetric in both directions,
suggesting that the transfer bias is likely to be small (Miguel and Kremer 2003).
A related identification issue concerns whether social networks measured in 2001—three years
after the program started—were themselves affected by the program. Any extent to which health-
conscious individuals became socially “closer” to individuals with children in early treatment schools
would again lead to an upward bias, working against our findings. However, respondents were
statistically no more likely to name early treatment links than links to other schools.25
5.5 Nonexperimental Social Effect Estimates
Nonexperimental social effect estimates are markedly different from the experimental estimates,
suggesting that omitted variable bias in this context is large and positive. In a specification similar to
many existing nonexperimental studies, we examine the take-up rate of children in a predefined local
social unit—here the primary school—as the key explanatory variable. We find that the local school
treatment rate (excluding the respondent) is strongly correlated positively with take-up, with coefficient
25 The average number of links to early treatment schools is 1.92, while (Total number of links to project schools) * (Total number of Group 1 and 2 pupils / Total number of Groups 1, 2, and 3 pupils) =1.91.
21
estimate 0.84 (standard error 0.11—table 5, regression 1). Take-up among children who are members of
the respondent’s own ethnic group in their school is more influential than take-up in other ethnic groups
(p-value=0.09, regression not shown), a finding similar to Munshi and Myaux (2002)—although in our
case we argue that this pattern is due to omitted variable bias, rather than to actual social learning as they
claim. Similarly, there is a positive, though statistically insignificant (estimate 0.015, standard error
0.011, regression 2) relation between the number of treated links named in the survey (among those
attending the respondent’s school) and take-up, in a specification similar to several recent studies (see
Bandiera and Rasul 2002, Kohler et al. 2001).
Social links’ experiences with deworming may also affect the information individuals receive. In
particular, we test whether take-up is higher when links had “good” experiences with the technology, as in
Conley and Udry (2000).26 This nonexperimental analysis suffers from reporting bias if individuals who
themselves hold more positive views toward treatment are more likely to report their links had good
effects, even if the links’ experiences were not particularly good. There is suggestive evidence that having
more links whose children had “good effects” is associated with higher take-up, while those with more
links who had “side effects” are less likely to be treated (table 5, regression 3)—the p-value on the
hypothesis that the two estimates are equal is 0.22—but this is ultimately inconclusive.27
5.6 Parent Attitudes and Knowledge
26 One drawback of our dataset is that we only have information on links’ deworming choices provided by the respondent herself (unlike Conley and Udry 2000, we did not collect the full names of social links for privacy reasons, and are thus unable to match the social links to the main database). 27 The deworming experiences and choices of people in social links’ communities may affect respondent take-up (Munshi 2000). For each early treatment school, we computed the average difference in school attendance between treated and untreated pupils in 1999, and used this to classify schools into “large treated minus untreated difference” schools (those above the median difference) and “small treated minus untreated difference” schools. The treated minus untreated difference measures the average observed private benefit to deworming in that school. However, we find no evidence that the experiences of children in links’ schools affect take-up decisions: links to early treatment schools with low take-up do have a somewhat more negative effect on respondent treatment rates than links to schools with high take-up, but the difference between these estimates is not significant (regression not shown). Similarly, there is no statistically significant difference between the effect of links to early treatment schools where the difference in school participation between treated and untreated pupils was large (and thus the observed private treatment benefit large) versus those where this difference was small (results not shown).
22
Respondents with more early links are significantly more likely to claim that deworming drugs are “not
effective” (table 6, row 1). This is consistent with the hypothesis that some people thought deworming
would provide large net private benefits but learned otherwise from their contacts at early treatment
schools. We do not find a significant impact of additional early links on beliefs that deworming drugs are
“very effective” (although the point estimate is negative, row 2) or that the drugs have “side effects” (row
3). This last result is evidence against the possibility that take-up was negatively affected by rumors about
drug side effects.
Although early treatment links do affect the belief that deworming drugs are “not effective”, they
do not affect beliefs that “worms and schistosomiasis are very bad for child health” (table 6, row 4).
However, parents may report whatever they think the enumerator wants to hear regarding the health
consequences of worms: 92 percent of respondents claimed that helminth infections are “very bad” for
child health. The number of early treatment links has no effect on parents’ self-reported claim to “know
about the ICS deworming program” (row 5), to “know about the effects of worms and schistosomiasis”
(row 6), to know the deworming treatment status of their own child (not shown), nor does it affect their
objective knowledge of common worm infection symptoms (rows 7 to 10). Most respondents lack even
basic knowledge about worm infections, and they were only able to name 1.8 symptoms on average.
Thus, not only did a substantial expenditure in worm prevention health education through the original
deworming program not affect recipients’ behavior directly (Kremer and Miguel 2003), but these
messages also failed to spread to other community members.
In contrast, the actual number of treated social links, and the number of social links with whom
the respondent speaks about deworming, are both positively and significantly related to most deworming
attitudes and knowledge outcomes (table 6)—once again highlighting important differences between
experimental and nonexperimental methods. Individuals with unobservably more interest in child health
appear to more frequently discuss worms with their social links, who are themselves more likely to have
their own children receive treatment. In short, the positive observed correlation in outcomes within social
networks in this context appears to be due to omitted variables rather than social effects.
23
5.7 Child Social Learning Results
We next turn to child social networks. As expected, the proportion of pupil links to early treatment
schools is highly correlated with the proportion of parent links (correlation coefficient 0.5). Child early
treatment links are also negatively and marginally significantly related to drug take-up in the full sample
of 3,164 children (point estimate –0.018, standard error 0.010—table 7, regression 1). This relation is
similar for children in both Group 2 and Group 3 schools (regression 2). This result is robust to the
inclusion of the proportion of links in early treatment schools rather than the number (regression 3).
Although there are no statistically significant effects of early links on any measure of child deworming
attitudes, beliefs, or knowledge, additional early treatment links have a marginal positive impact on the
belief that deworming drugs have side effects (estimate 0.006, standard error 0.005) and on the number of
infection symptoms the child was able to name (estimate 0.010, standard error 0.007—not shown).28
Social effect estimates differ sharply by child age: for teenagers (at least 13 years of age), each
additional early treatment social link is associated with a drop in take-up of –0.028 percentage points
(standard error 0.012—table 8, regression 1) – nearly as large as the point estimate on parent links (e.g.,
table 3, regression 1) – while the effect for younger children is small and statistically insignificant (point
estimate –0.006, standard error 0.014—regression 3). There is no significant difference in the impact of
additional links by respondent gender, or for links to children’s relatives versus friends (not shown).
Estimated child social links (–0.022) are more than twice as influential as parent links (–0.009) in
reducing take-up for teenagers (table 8, regression 2), although we cannot reject the hypothesis that they
are equal. Unfortunately, including both child and parent links as explanatory variables greatly reduces
the sample, limiting statistical precision. Still, this again suggests that teenagers play a central role in their
own health care choices, a point made forcefully by Geissler (2000) in his study of a nearby district and
by advocates of “child-to-child” public health approaches (Hubley 1993). The 2001 surveys provide
further suggestive evidence that health information is likely to flow primarily through child networks
28 The attitudes and knowledge results are similar for teenagers and preteens (results not shown).
24
rather than parent networks in this setting: children claimed to know the deworming treatment status of 62
percent of their social links, twice as high as the proportion known by parents (32 percent).29 Nine percent
of parents did not know the treatment status of their own children.
6. Implications of Social Network Structure for Program Design
The design of interventions should depend not only on the relative influence of different types of social
links, but also on the structure of social networks. For the technology we examine, because prior beliefs
are often too optimistic and the technology creates positive externalities, faster social learning is not
socially beneficial. In many other cases, however, faster learning is likely to be beneficial and it may be
desirable to design programs to speed learning by introducing new technologies first among people with
more extensive social networks.
Among children, teenagers have significantly broader social networks—in terms of named social
contacts outside the child’s own school— than younger children, with an average of 0.69 additional
external links (standard error 0.18 – mean external child links is 3.8, table 1 panel D). This estimate is
derived from a regression conditional on other child characteristics (regression not shown). Thus targeting
public health or other messages to teenagers is likely to lead to more rapid local information diffusion
than focusing on younger children for at least two reasons: first, social effects are particularly strong
among teenagers (table 8), and second, due to their more extensive social contacts in other schools,
teenagers are more likely to spread this new information to other areas.
Parents who belong to community groups—typically in western Kenya, women’s, farming and
credit groups—have significantly more social links external to their child’s school than other parents,
with 0.70 (standard error 0.19) additional links on average (mean external parent links is 5.8, from table 1
panel B). This finding provides a justification for using community groups as focal points for the
introduction of new technologies. To the extent that the existence of community groups promotes cross-
29 Teens and preteens had similar levels of knowledge about their links’ treatment status (not shown).
25
school social contact30, this finding also suggests that subsidizing the creation of additional groups could
speed the diffusion of new technologies—an additional rationale for promoting “social capital.”
More educated parents have more external social contacts, 0.13 links per additional year of
education (standard error 0.02). To the extent this relation is causal, it suggests that subsidizing education
may lead to faster diffusion of technology, even if the educated are no more receptive to new information
than others. Measures of household asset ownership, as well as parent ethnic and religious characteristics,
are generally not statistically significantly associated with additional external links in this setting (results
not shown), though one exception is household latrine ownership, which is marginally statistically
significant (0.40 additional external links, standard error 0.22). Child gender, ethnic, and religious
characteristics are not significantly associated with the number of named external contacts (not shown).31
7. Conclusions
We find evidence for social learning in the adoption of a new health technology—deworming drugs—in
rural Kenya: individuals with exogenously more social links in program schools were significantly less
likely to believe deworming drugs are effective, and less likely to take them. Our finding of negative
social effects implies actual learning took place, rather than imitation. We also find striking differences
between experimental and nonexperimental estimates, suggesting that the results of many
30 In other words, measured group membership is not simply a proxy for individual “sociability,” which could generate a spurious (non-causal) correlation between group membership and external social links. 31 While it is impossible to estimate the full effect of targeting information campaigns to different groups without knowing the full social network—including the links of respondents’ social links, and their links, and so on—intuition can be built by abstracting from social contacts across age groups and comparing the speed of diffusion in a hypothetical social world made up entirely of teenagers with diffusion in hypothetical worlds composed solely of preteens, or adults. Differences in the speed of learning can be estimated by multiplying the social effect and the number of external links. Exposing one additional teenager to the deworming program changes the behavior of (0.028 change in take-up)*(4.0 links) = 0.11 other individuals in their immediate social circle (among named contacts outside of their school), more than five times as large as the effect of exposing a preteen, which is only (0.006)*(3.3) = 0.02. Focusing on the estimates of parent social effects conditional on child effects, and vice versa (table 8, regression 2), each additional teen exposed to the program changes the behavior of (0.022)*(4.0) = 0.09 individuals, while the impact for an additional parent is only (0.009)*(5.8) = 0.05—approximately half as influential. These are just “first round” effects, but there will be “multiplier” effects as information spreads through networks. This project’s combination of experimental social effect estimates and detailed survey information on network structure will allow us to simulate the effects of different program designs—for instance, targeting messages to teens versus preteens—in future research, hopefully providing useful information for policymakers.
26
nonexperimental studies should be interpreted with caution due to the possibility of considerable omitted
variable bias. The social networks of teenagers appear particularly influential in affecting take-up.
Teenagers, as well as educated parents and parents who belong to community groups, have especially
many social contacts outside their own primary school—making them natural targets for public programs
to speed social learning.
The theoretical learning framework we develop is consistent with our main empirical results in a
setting where there are relatively small net private benefits of technology adoption, here due to pervasive
deworming treatment externalities. The private benefits of adoption may be reduced further by the fact
that the individuals (parents) who provide consent – and pay for treatment in cost-sharing schools – are
not the same people who directly benefit from it (their children). This dichotomy could reduce take-up to
the extent that there is imperfect altruism and inefficient bargaining in the parent-child relationship.
Moreover, since deworming entails immediate costs (the effort needed to obtain treatment and possible
drug side effects) while benefits emerge only gradually as individual nutritional status improves in the
months after treatment, people with time-inconsistent preferences—such as many children (Green, Fry
and Myerson 1994)—may place particularly low value on treatment.
Our empirical finding of negative social learning, together with the results of a related project
(Kremer and Miguel 2003), suggest that socially desirable health technologies may not spread on their
own. Indeed, indefinite subsidies may be needed to sustain high drug take-up for diseases characterized
by positive treatment externalities, like deworming—a finding especially important for Africa, where half
the disease burden is associated with infectious and parasitic diseases (WHO 1999). Beyond health,
many technologies require a process of learning by doing before they become profitable (as documented
by Foster and Rosenzweig 1995 for agriculture), and the positive externalities inherent in the social
learning process may also work against take-up of these other technologies, slowing their spread.
27
8. References
Adams, E.J., Stephenson, L.S., Latham, M.C., and Kinoti, S.N. (1994). “Physical Activity and Growth of Kenyan School Children with Hookworm, Trichuris trichiura and Ascaris lumbricoides Infections Are Improved after Treatment with Albendazole,” Journal of Nutrition, 124 (8), 1199-1206. Akwara, Priscilla A. (1996). “Socio-economic Perspectives in Child Health in Kenya: A Strategy for Population Action,” African Anthropology, 3(1), 3-43. Anderson, R.M., and R.M. May. (1991). Infectious Diseases of Humans. Oxford: New York. Bandiera, Oriana, and Imran Rasul. (2002). “Social Networks and Technology Adoption in Northern Mozambique”, unpublished manuscript, University of Chicago. Banerjee, Abhijit. (1992). “A Simple Model of Herd Behavior,” Quarterly Journal of Economics, 107(3), 797-817. Bikhchandani, Sushil, David Hirshleifer and Ivo Welch. (1992). “A Theory of Fads, Fashion, Custom, and Cultural Change as Informational Cascades”, Journal of Political Economy, 100, 992-1026. Bundy, D.A.P. (1994). “The Global Burden of Intestinal Nematode Disease.” Transactions of the Royal Society of Tropical Medicine and Hygiene, 88, 259-261. Burke, M., G. Fournier and K. Prasad. (2003). “Physician Social Networks and Geographical Variation in Care”, unpublished working paper. Conley, Timothy, and Christopher Udry. (2000). “Learning About a New Technology: Pineapple in Ghana”, Economic Growth Center Discussion Paper 817, Yale University. Corbett, E.L., Butterworth, A.E., Fulford, A.J.C., Ouma, J.H., Sturock, R.F. (1992). “Nutritional Status of Children with Schistosomiasis Mansoni in Two Different areas of Machakos District, Kenya.” Transactions of the Royal Society of Tropical Medicine and Hygiene, 86, 266-273. Das, Jishnu. 2000. "Do Patients Learn About Doctor Quality: Theory and an Application to India”, unpublished working paper, Harvard University. Duflo, Esther, and Emmanuel Saez. (2003). “The Role of Information and Social Interactions in Retirement Plan Decisions: Evidence from a Randomized Experiment”, forthcoming Quarterly Journal of Economics. Foster, Andrew, and Mark Rosenzweig. (1995). “Learning by Doing and Learning from Others: Human Capital and Technical Change in Agriculture”, Journal of Political Economy, 103, 1176-1209. Geissler, Wenzel. (1998a). “‘Worms are Our Life’, Part I: Understandings of Worms and the Body among the Luo of Western Kenya,” Anthropology and Medicine, 5(1), 63-79. Geissler, Wenzel. (1998b). “‘Worms are Our Life’, Part II: Luo Children’s Thoughts about Worms and Illness,” Anthropology and Medicine, 5(1), 133-144. Geissler, Wenzel. (2000). “Children and Medicines. Self-treatment of Common Illnesses among Luo School Children in Western Kenya,” Social Science and Medicine, 50(18), 1771-1783. Granovetter, Mark. (1973). “The Strength of Weak Ties.” American Journal of Sociology, 78.
Green, E.C. (1997). “Purity, Pollution and the Invisible Snake in Southern Africa”, Medical Anthropology, 17, 83-100.
Green, E.C, Jurg, A., and Djedje, A. (1994). “The Snake in the Stomach: Child Diarrhoea in Central Mozambique,” Medical Anthropology Quarterly, 8, 4-24. Green, L., A. Fry, and K. Myerson. (1994). “Discounting of delayed rewards: A life-span comparison”, Psychological Science, 5(1), 33-36. Griliches, Zvi. (1957). “Hybrid Corn: An Exploration in the Economics of Technological Change”, Econometrica, 25(4), 501-522. Gruber, Jonathan. (2001). “Introduction”, Risky Behavior among Youths: An Economic Analysis, Jonathan Gruber (ed.). National Bureau of Economic Research and Univ. of Chicago Press: Chicago. Hotez, P.J., and Pritchard, D.I. (1995). “Hookworm Infection.” Scientific American, June, 68-74.
Hubley, J (1993). Communicating Health - an action guide to health education and health promotion, MacMillan: London.
28
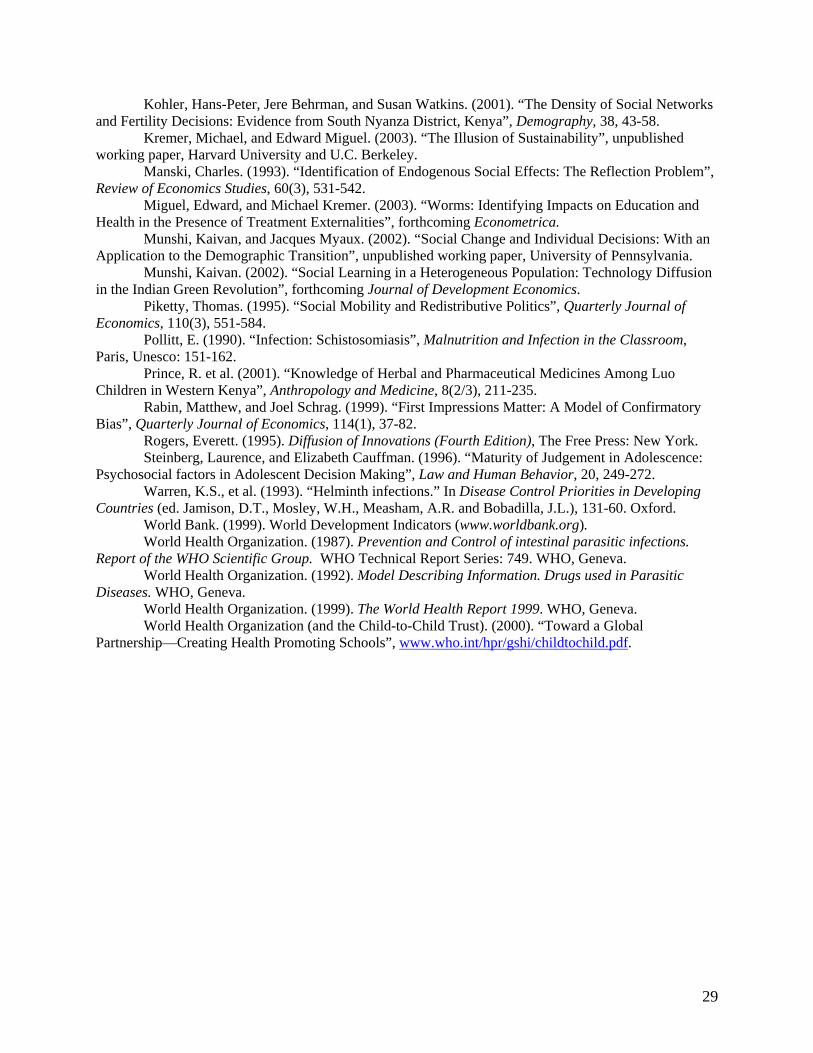
Kohler, Hans-Peter, Jere Behrman, and Susan Watkins. (2001). “The Density of Social Networks and Fertility Decisions: Evidence from South Nyanza District, Kenya”, Demography, 38, 43-58. Kremer, Michael, and Edward Miguel. (2003). “The Illusion of Sustainability”, unpublished working paper, Harvard University and U.C. Berkeley. Manski, Charles. (1993). “Identification of Endogenous Social Effects: The Reflection Problem”, Review of Economics Studies, 60(3), 531-542. Miguel, Edward, and Michael Kremer. (2003). “Worms: Identifying Impacts on Education and Health in the Presence of Treatment Externalities”, forthcoming Econometrica. Munshi, Kaivan, and Jacques Myaux. (2002). “Social Change and Individual Decisions: With an Application to the Demographic Transition”, unpublished working paper, University of Pennsylvania. Munshi, Kaivan. (2002). “Social Learning in a Heterogeneous Population: Technology Diffusion in the Indian Green Revolution”, forthcoming Journal of Development Economics. Piketty, Thomas. (1995). “Social Mobility and Redistributive Politics”, Quarterly Journal of Economics, 110(3), 551-584. Pollitt, E. (1990). “Infection: Schistosomiasis”, Malnutrition and Infection in the Classroom, Paris, Unesco: 151-162. Prince, R. et al. (2001). “Knowledge of Herbal and Pharmaceutical Medicines Among Luo Children in Western Kenya”, Anthropology and Medicine, 8(2/3), 211-235. Rabin, Matthew, and Joel Schrag. (1999). “First Impressions Matter: A Model of Confirmatory Bias”, Quarterly Journal of Economics, 114(1), 37-82. Rogers, Everett. (1995). Diffusion of Innovations (Fourth Edition), The Free Press: New York. Steinberg, Laurence, and Elizabeth Cauffman. (1996). “Maturity of Judgement in Adolescence: Psychosocial factors in Adolescent Decision Making”, Law and Human Behavior, 20, 249-272. Warren, K.S., et al. (1993). “Helminth infections.” In Disease Control Priorities in Developing Countries (ed. Jamison, D.T., Mosley, W.H., Measham, A.R. and Bobadilla, J.L.), 131-60. Oxford. World Bank. (1999). World Development Indicators (www.worldbank.org). World Health Organization. (1987). Prevention and Control of intestinal parasitic infections. Report of the WHO Scientific Group. WHO Technical Report Series: 749. WHO, Geneva. World Health Organization. (1992). Model Describing Information. Drugs used in Parasitic Diseases. WHO, Geneva. World Health Organization. (1999). The World Health Report 1999. WHO, Geneva. World Health Organization (and the Child-to-Child Trust). (2000). “Toward a Global Partnership—Creating Health Promoting Schools”, www.who.int/hpr/gshi/childtochild.pdf.
29
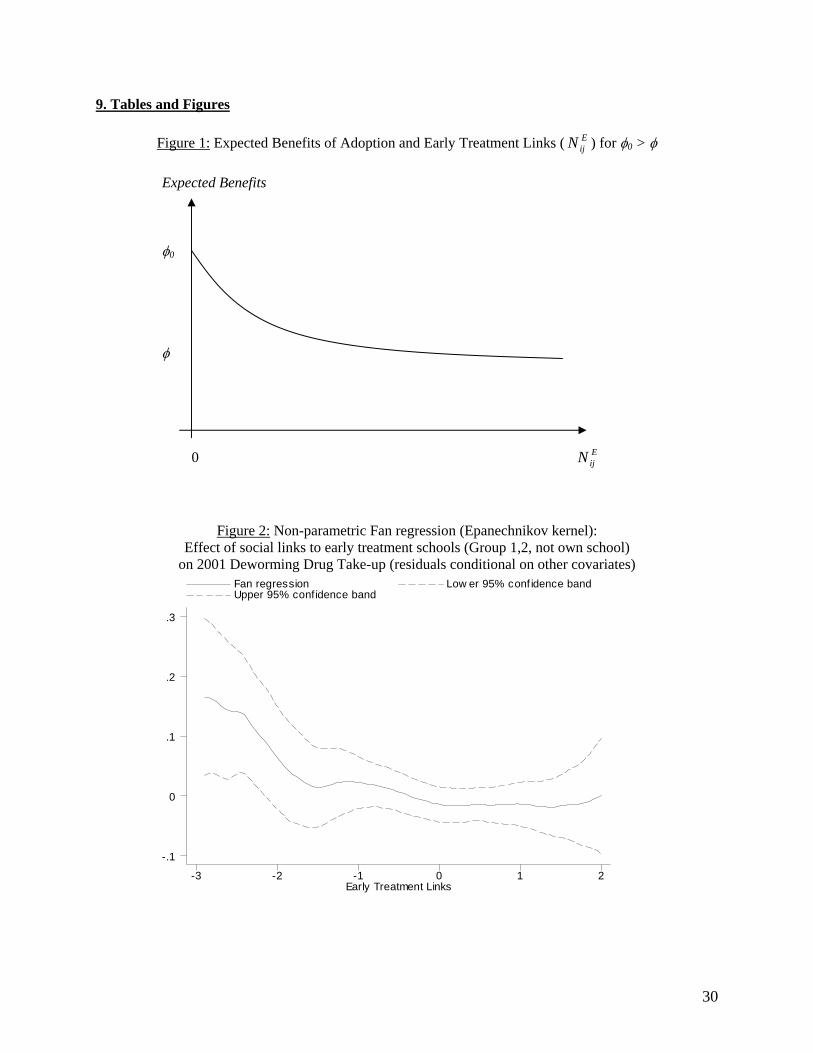
9. Tables and Figures
Figure 1: Expected Benefits of Adoption and Early Treatment Links ( ) for φEijN 0 > φ
Expected Benefits φ0 φ 0 E
ijN
Figure 2: Non-parametric Fan regression (Epanechnikov kernel): Effect of social links to early treatment schools (Group 1,2, not own school)
on 2001 Deworming Drug Take-up (residuals conditional on other covariates)
Early Treatment Links
Fan regression Low er 95% conf idence band Upper 95% confidence band
-3 -2 -1 0 1 2
-.1
0
.1
.2
.3
30
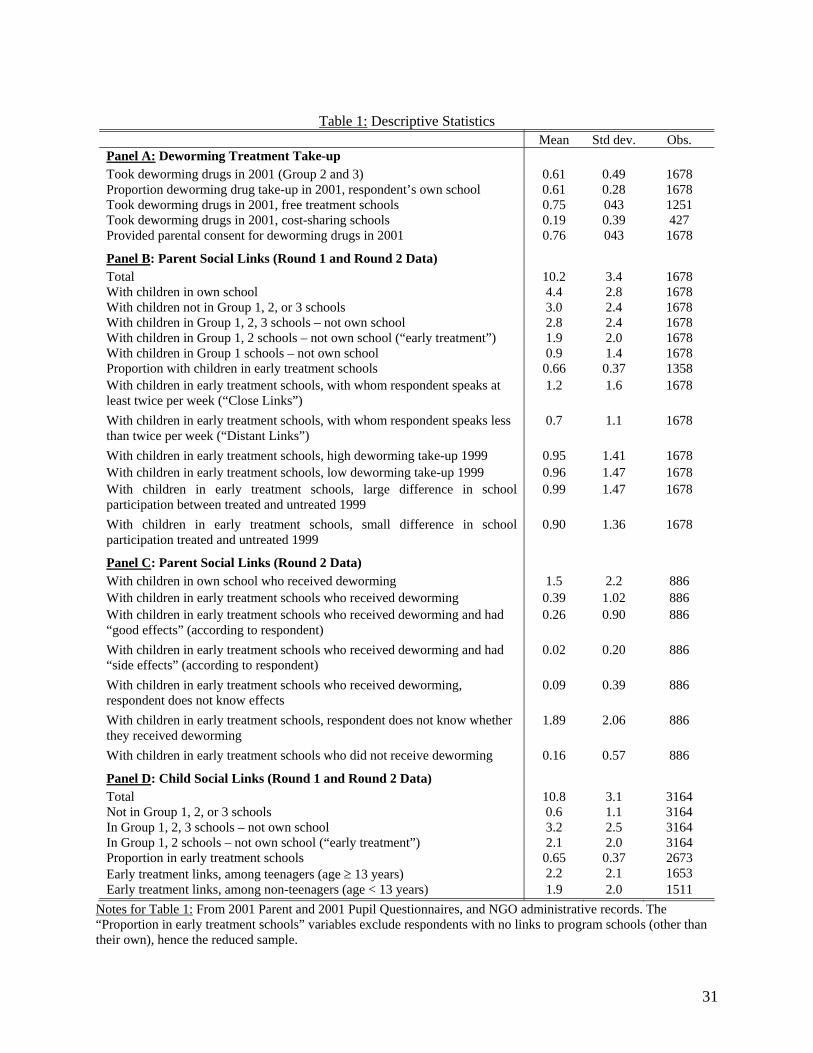
Table 1: Descriptive Statistics
Mean Std dev. Obs. Panel A: Deworming Treatment Take-up
Took deworming drugs in 2001 (Group 2 and 3) 0.61 0.49 1678 Proportion deworming drug take-up in 2001, respondent’s own school 0.61 0.28 1678 Took deworming drugs in 2001, free treatment schools 0.75 043 1251 Took deworming drugs in 2001, cost-sharing schools 0.19 0.39 427 Provided parental consent for deworming drugs in 2001 0.76 043 1678
Panel B: Parent Social Links (Round 1 and Round 2 Data)
Total 10.2 3.4 1678 With children in own school 4.4 2.8 1678 With children not in Group 1, 2, or 3 schools 3.0 2.4 1678 With children in Group 1, 2, 3 schools – not own school 2.8 2.4 1678 With children in Group 1, 2 schools – not own school (“early treatment”) 1.9 2.0 1678 With children in Group 1 schools – not own school 0.9 1.4 1678 Proportion with children in early treatment schools 0.66 0.37 1358
With children in early treatment schools, with whom respondent speaks at least twice per week (“Close Links”)
1.2 1.6 1678
With children in early treatment schools, with whom respondent speaks less than twice per week (“Distant Links”)
0.7 1.1 1678
With children in early treatment schools, high deworming take-up 1999 0.95 1.41 1678
With children in early treatment schools, low deworming take-up 1999 0.96 1.47 1678
With children in early treatment schools, large difference in school participation between treated and untreated 1999
0.99 1.47 1678
With children in early treatment schools, small difference in school participation treated and untreated 1999
0.90 1.36 1678
Panel C: Parent Social Links (Round 2 Data)
With children in own school who received deworming 1.5 2.2 886
With children in early treatment schools who received deworming 0.39 1.02 886
With children in early treatment schools who received deworming and had “good effects” (according to respondent)
0.26 0.90 886
With children in early treatment schools who received deworming and had “side effects” (according to respondent)
0.02 0.20 886
With children in early treatment schools who received deworming, respondent does not know effects
0.09 0.39 886
With children in early treatment schools, respondent does not know whether they received deworming
1.89 2.06 886
With children in early treatment schools who did not receive deworming 0.16 0.57 886
Panel D: Child Social Links (Round 1 and Round 2 Data)
Total 10.8 3.1 3164 Not in Group 1, 2, or 3 schools 0.6 1.1 3164 In Group 1, 2, 3 schools – not own school 3.2 2.5 3164 In Group 1, 2 schools – not own school (“early treatment”) 2.1 2.0 3164 Proportion in early treatment schools 0.65 0.37 2673 Early treatment links, among teenagers (age ≥ 13 years) 2.2 2.1 1653 Early treatment links, among non-teenagers (age < 13 years) 1.9 2.0 1511
Notes for Table 1: From 2001 Parent and 2001 Pupil Questionnaires, and NGO administrative records. The “Proportion in early treatment schools” variables exclude respondents with no links to program schools (other than their own), hence the reduced sample.
31
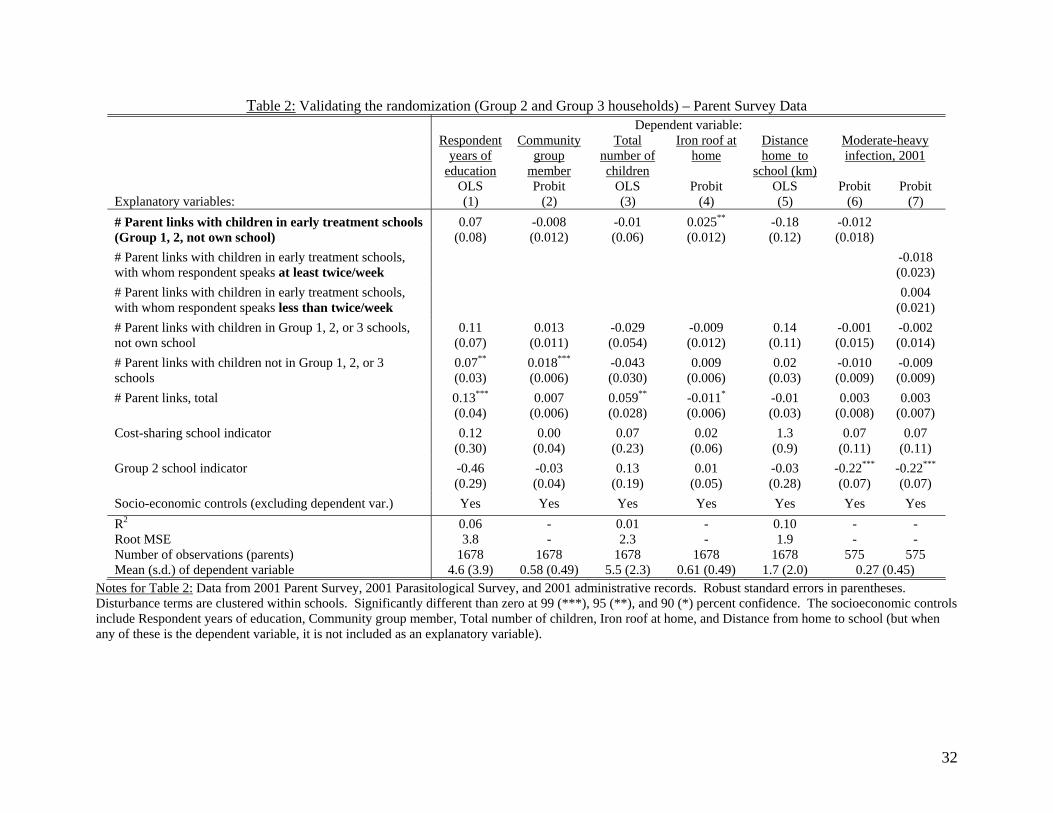
Table 2: Validating the randomization (Group 2 and Group 3 households) – Parent Survey Data
Dependent variable: Respondent
years of education
Community group
member
Total number of children
Iron roof at home
Distance home to
school (km)
Moderate-heavy infection, 2001
OLS Probit OLS Probit OLS Probit ProbitExplanatory variables: (1) (2) (3) (4) (5) (6) (7)
# Parent links with children in early treatment schools (Group 1, 2, not own school)
0.07 (0.08)
-0.008 (0.012)
-0.01 (0.06)
0.025**
(0.012) -0.18 (0.12)
-0.012 (0.018)
# Parent links with children in early treatment schools, with whom respondent speaks at least twice/week
-0.018(0.023)
# Parent links with children in early treatment schools, with whom respondent speaks less than twice/week
0.004(0.021)
# Parent links with children in Group 1, 2, or 3 schools, not own school
0.11 (0.07)
0.013 (0.011)
-0.029 (0.054)
-0.009 (0.012)
0.14 (0.11)
-0.001 (0.015)
-0.002 (0.014)
# Parent links with children not in Group 1, 2, or 3 schools
0.07**
(0.03) 0.018***
(0.006) -0.043 (0.030)
0.009(0.006)
0.02 (0.03)
-0.010 (0.009)
-0.009 (0.009)
# Parent links, total
0.13***
(0.04) 0.007
(0.006) 0.059**
(0.028) -0.011*
(0.006) -0.01 (0.03)
0.003 (0.008)
0.003 (0.007)
Cost-sharing school indicator
0.12 (0.30)
0.00 (0.04)
0.07 (0.23)
0.02 (0.06)
1.3 (0.9)
0.07 (0.11)
0.07 (0.11)
Group 2 school indicator
-0.46(0.29)
-0.03 (0.04)
0.13 (0.19)
0.01 (0.05)
-0.03 (0.28)
-0.22***
(0.07) -0.22***
(0.07)
Socio-economic controls (excluding dependent var.) Yes Yes Yes Yes Yes Yes Yes
R2 0.06 - 0.01 - 0.10 - -Root MSE 3.8 - 2.3 - 1.9 - -Number of observations (parents) 1678 1678 1678 1678 1678 575 575 Mean (s.d.) of dependent variable 4.6 (3.9) 0.58 (0.49) 5.5 (2.3) 0.61 (0.49) 1.7 (2.0) 0.27 (0.45)
Notes for Table 2: Data from 2001 Parent Survey, 2001 Parasitological Survey, and 2001 administrative records. Robust standard errors in parentheses. Disturbance terms are clustered within schools. Significantly different than zero at 99 (***), 95 (**), and 90 (*) percent confidence. The socioeconomic controls include Respondent years of education, Community group member, Total number of children, Iron roof at home, and Distance from home to school (but when any of these is the dependent variable, it is not included as an explanatory variable).
32
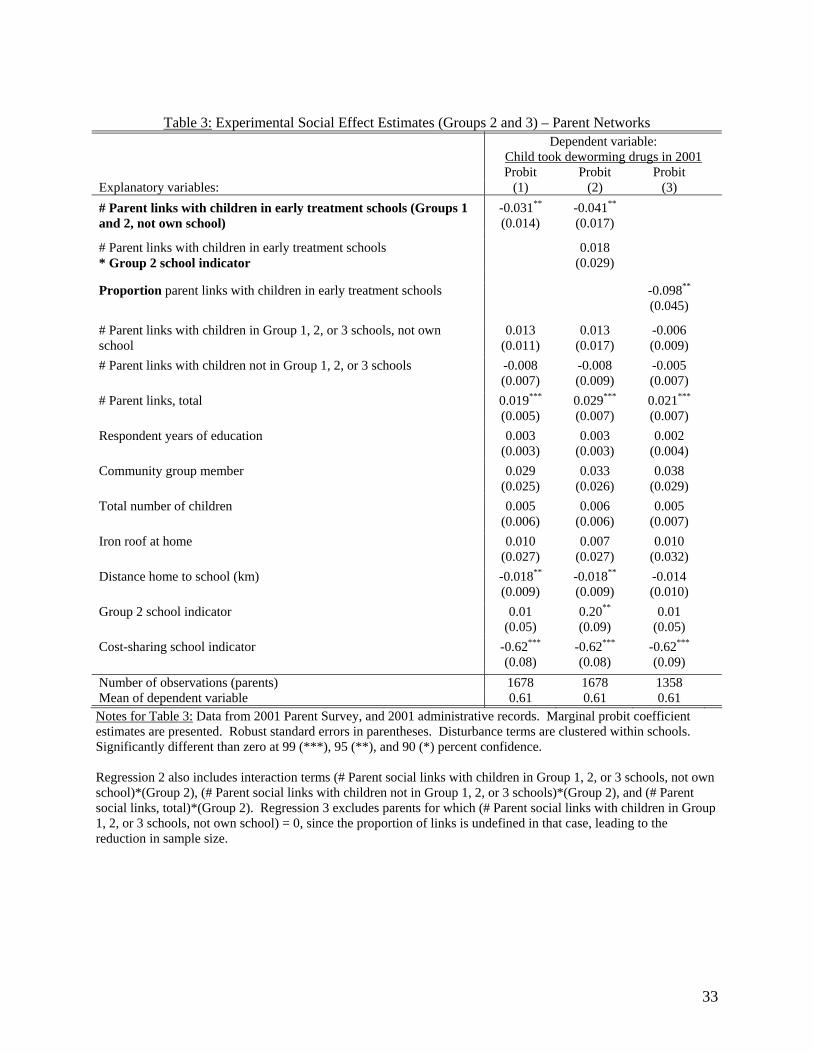
Table 3: Experimental Social Effect Estimates (Groups 2 and 3) – Parent Networks
Dependent variable: Child took deworming drugs in 2001
Probit Probit Probit Explanatory variables: (1) (2) (3)
# Parent links with children in early treatment schools (Groups 1 and 2, not own school)
-0.031**
(0.014) -0.041**
(0.017)
# Parent links with children in early treatment schools * Group 2 school indicator
0.018 (0.029)
Proportion parent links with children in early treatment schools -0.098**
(0.045)
# Parent links with children in Group 1, 2, or 3 schools, not own school
0.013 (0.011)
0.013 (0.017)
-0.006 (0.009)
# Parent links with children not in Group 1, 2, or 3 schools -0.008 (0.007)
-0.008 (0.009)
-0.005 (0.007)
# Parent links, total
0.019***
(0.005) 0.029***
(0.007) 0.021***
(0.007)
Respondent years of education
0.003 (0.003)
0.003 (0.003)
0.002 (0.004)
Community group member
0.029 (0.025)
0.033 (0.026)
0.038 (0.029)
Total number of children
0.005 (0.006)
0.006 (0.006)
0.005 (0.007)
Iron roof at home
0.010 (0.027)
0.007 (0.027)
0.010 (0.032)
Distance home to school (km)
-0.018**
(0.009) -0.018**
(0.009) -0.014 (0.010)
Group 2 school indicator
0.01 (0.05)
0.20**
(0.09) 0.01
(0.05)
Cost-sharing school indicator
-0.62***
(0.08) -0.62***
(0.08) -0.62***
(0.09)
Number of observations (parents) 1678 1678 1358 Mean of dependent variable 0.61 0.61 0.61
Notes for Table 3: Data from 2001 Parent Survey, and 2001 administrative records. Marginal probit coefficient estimates are presented. Robust standard errors in parentheses. Disturbance terms are clustered within schools. Significantly different than zero at 99 (***), 95 (**), and 90 (*) percent confidence. Regression 2 also includes interaction terms (# Parent social links with children in Group 1, 2, or 3 schools, not own school)*(Group 2), (# Parent social links with children not in Group 1, 2, or 3 schools)*(Group 2), and (# Parent social links, total)*(Group 2). Regression 3 excludes parents for which (# Parent social links with children in Group 1, 2, or 3 schools, not own school) = 0, since the proportion of links is undefined in that case, leading to the reduction in sample size.
33
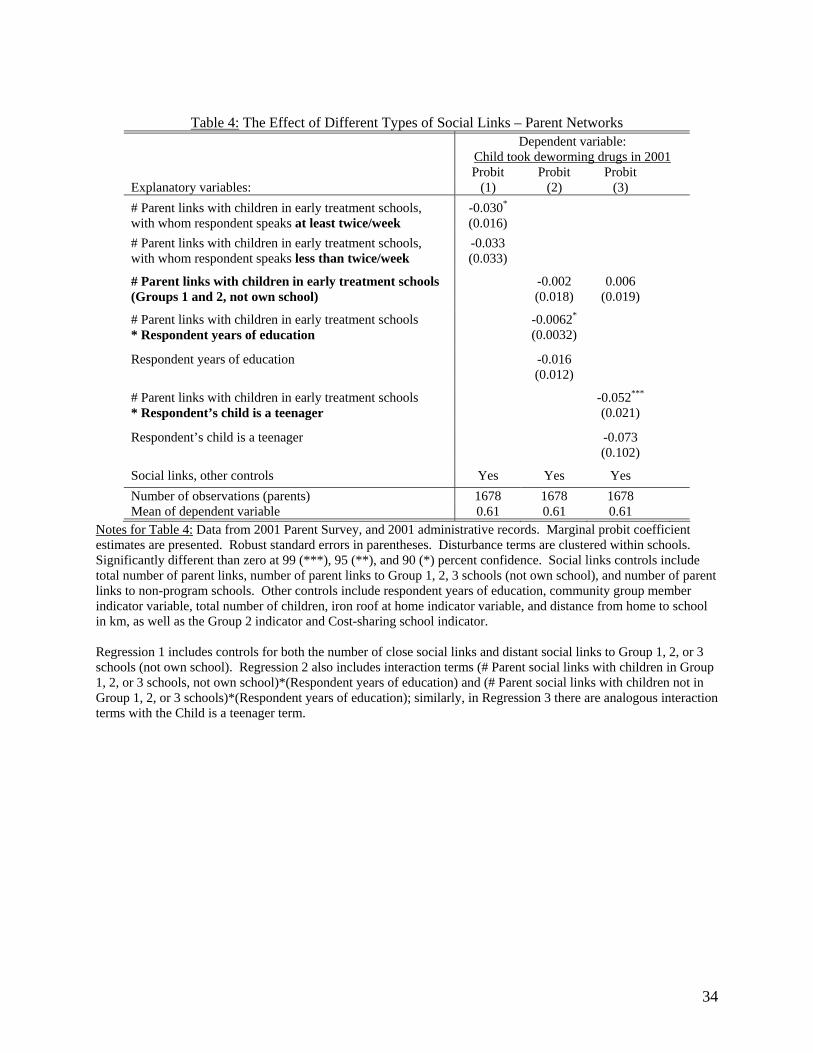
Table 4: The Effect of Different Types of Social Links – Parent Networks
Dependent variable: Child took deworming drugs in 2001
Probit Probit Probit Explanatory variables: (1) (2) (3)
# Parent links with children in early treatment schools, with whom respondent speaks at least twice/week
-0.030*
(0.016)
# Parent links with children in early treatment schools, with whom respondent speaks less than twice/week
-0.033 (0.033)
# Parent links with children in early treatment schools (Groups 1 and 2, not own school)
-0.002 (0.018)
0.006 (0.019)
# Parent links with children in early treatment schools * Respondent years of education
-0.0062*
(0.0032)
Respondent years of education -0.016 (0.012)
# Parent links with children in early treatment schools * Respondent’s child is a teenager
-0.052***
(0.021)
Respondent’s child is a teenager -0.073 (0.102)
Social links, other controls Yes Yes Yes
Number of observations (parents) 1678 1678 1678 Mean of dependent variable 0.61 0.61 0.61
Notes for Table 4: Data from 2001 Parent Survey, and 2001 administrative records. Marginal probit coefficient estimates are presented. Robust standard errors in parentheses. Disturbance terms are clustered within schools. Significantly different than zero at 99 (***), 95 (**), and 90 (*) percent confidence. Social links controls include total number of parent links, number of parent links to Group 1, 2, 3 schools (not own school), and number of parent links to non-program schools. Other controls include respondent years of education, community group member indicator variable, total number of children, iron roof at home indicator variable, and distance from home to school in km, as well as the Group 2 indicator and Cost-sharing school indicator. Regression 1 includes controls for both the number of close social links and distant social links to Group 1, 2, or 3 schools (not own school). Regression 2 also includes interaction terms (# Parent social links with children in Group 1, 2, or 3 schools, not own school)*(Respondent years of education) and (# Parent social links with children not in Group 1, 2, or 3 schools)*(Respondent years of education); similarly, in Regression 3 there are analogous interaction terms with the Child is a teenager term.
34
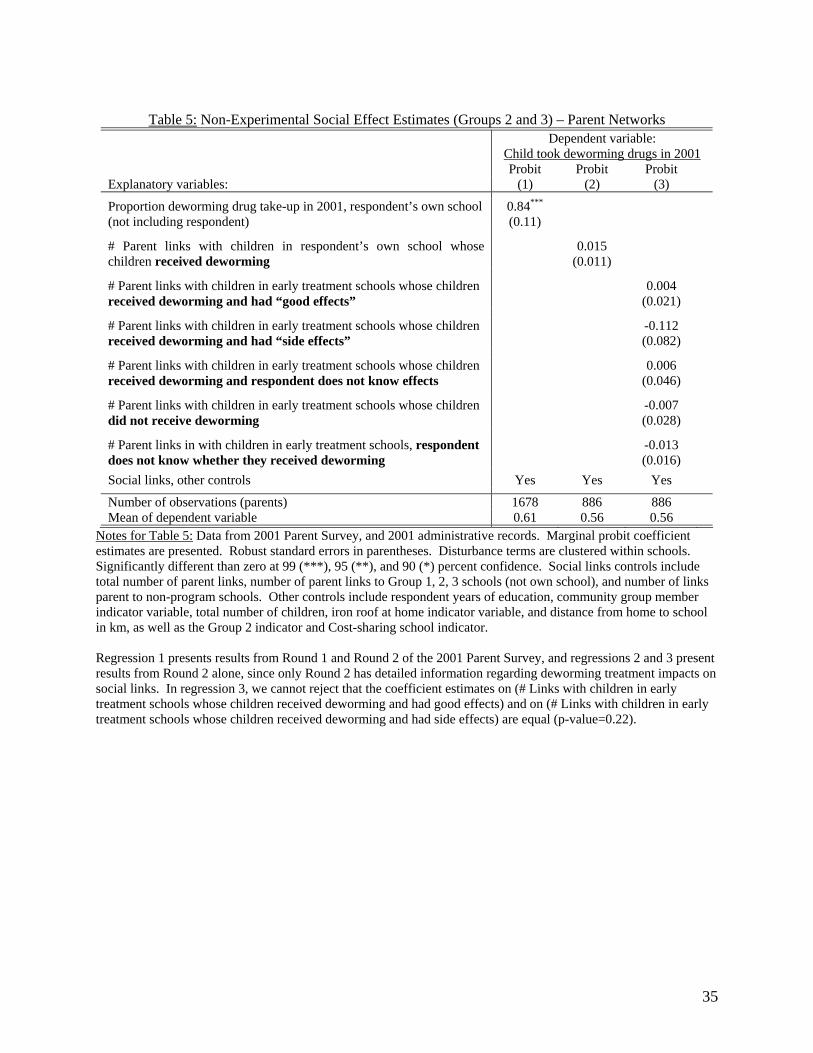
Table 5: Non-Experimental Social Effect Estimates (Groups 2 and 3) – Parent Networks
Dependent variable: Child took deworming drugs in 2001
Probit Probit Probit Explanatory variables: (1) (2) (3)
Proportion deworming drug take-up in 2001, respondent’s own school (not including respondent)
0.84***
(0.11)
# Parent links with children in respondent’s own school whose children received deworming
0.015 (0.011)
# Parent links with children in early treatment schools whose children received deworming and had “good effects”
0.004 (0.021)
# Parent links with children in early treatment schools whose children received deworming and had “side effects”
-0.112 (0.082)
# Parent links with children in early treatment schools whose children received deworming and respondent does not know effects
0.006 (0.046)
# Parent links with children in early treatment schools whose children did not receive deworming
-0.007 (0.028)
# Parent links in with children in early treatment schools, respondent does not know whether they received deworming
-0.013 (0.016)
Social links, other controls Yes Yes Yes
Number of observations (parents) 1678 886 886 Mean of dependent variable 0.61 0.56 0.56
Notes for Table 5: Data from 2001 Parent Survey, and 2001 administrative records. Marginal probit coefficient estimates are presented. Robust standard errors in parentheses. Disturbance terms are clustered within schools. Significantly different than zero at 99 (***), 95 (**), and 90 (*) percent confidence. Social links controls include total number of parent links, number of parent links to Group 1, 2, 3 schools (not own school), and number of links parent to non-program schools. Other controls include respondent years of education, community group member indicator variable, total number of children, iron roof at home indicator variable, and distance from home to school in km, as well as the Group 2 indicator and Cost-sharing school indicator. Regression 1 presents results from Round 1 and Round 2 of the 2001 Parent Survey, and regressions 2 and 3 present results from Round 2 alone, since only Round 2 has detailed information regarding deworming treatment impacts on social links. In regression 3, we cannot reject that the coefficient estimates on (# Links with children in early treatment schools whose children received deworming and had good effects) and on (# Links with children in early treatment schools whose children received deworming and had side effects) are equal (p-value=0.22).
35
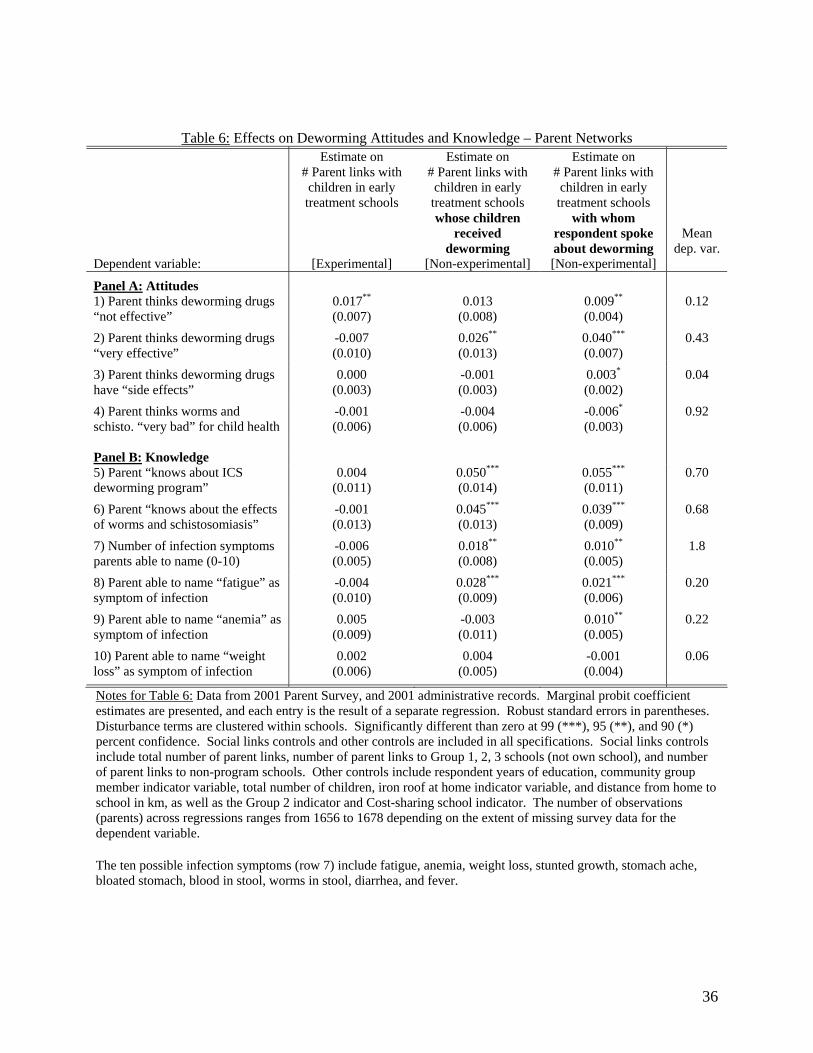
Table 6: Effects on Deworming Attitudes and Knowledge – Parent Networks
Dependent variable:
Estimate on # Parent links with children in early treatment schools
[Experimental]
Estimate on # Parent links with children in early treatment schools whose children
received deworming
[Non-experimental]
Estimate on # Parent links with children in early treatment schools
with whom respondent spoke about deworming [Non-experimental]
Mean dep. var.
Panel A: Attitudes 1) Parent thinks deworming drugs “not effective”
0.017**
(0.007) 0.013
(0.008) 0.009**
(0.004) 0.12
2) Parent thinks deworming drugs “very effective”
-0.007 (0.010)
0.026**
(0.013) 0.040***
(0.007) 0.43
3) Parent thinks deworming drugs have “side effects”
0.000 (0.003)
-0.001 (0.003)
0.003*
(0.002) 0.04
4) Parent thinks worms and schisto. “very bad” for child health
-0.001 (0.006)
-0.004 (0.006)
-0.006*
(0.003) 0.92
Panel B: Knowledge 5) Parent “knows about ICS deworming program”
0.004 (0.011)
0.050***
(0.014) 0.055***
(0.011) 0.70
6) Parent “knows about the effects of worms and schistosomiasis”
-0.001 (0.013)
0.045***
(0.013) 0.039***
(0.009) 0.68
7) Number of infection symptoms parents able to name (0-10)
-0.006 (0.005)
0.018**
(0.008) 0.010**
(0.005) 1.8
8) Parent able to name “fatigue” as symptom of infection
-0.004 (0.010)
0.028***
(0.009) 0.021***
(0.006) 0.20
9) Parent able to name “anemia” as symptom of infection
0.005 (0.009)
-0.003 (0.011)
0.010**
(0.005) 0.22
10) Parent able to name “weight loss” as symptom of infection
0.002 (0.006)
0.004 (0.005)
-0.001 (0.004)
0.06
Notes for Table 6: Data from 2001 Parent Survey, and 2001 administrative records. Marginal probit coefficient estimates are presented, and each entry is the result of a separate regression. Robust standard errors in parentheses. Disturbance terms are clustered within schools. Significantly different than zero at 99 (***), 95 (**), and 90 (*) percent confidence. Social links controls and other controls are included in all specifications. Social links controls include total number of parent links, number of parent links to Group 1, 2, 3 schools (not own school), and number of parent links to non-program schools. Other controls include respondent years of education, community group member indicator variable, total number of children, iron roof at home indicator variable, and distance from home to school in km, as well as the Group 2 indicator and Cost-sharing school indicator. The number of observations (parents) across regressions ranges from 1656 to 1678 depending on the extent of missing survey data for the dependent variable. The ten possible infection symptoms (row 7) include fatigue, anemia, weight loss, stunted growth, stomach ache, bloated stomach, blood in stool, worms in stool, diarrhea, and fever.
36
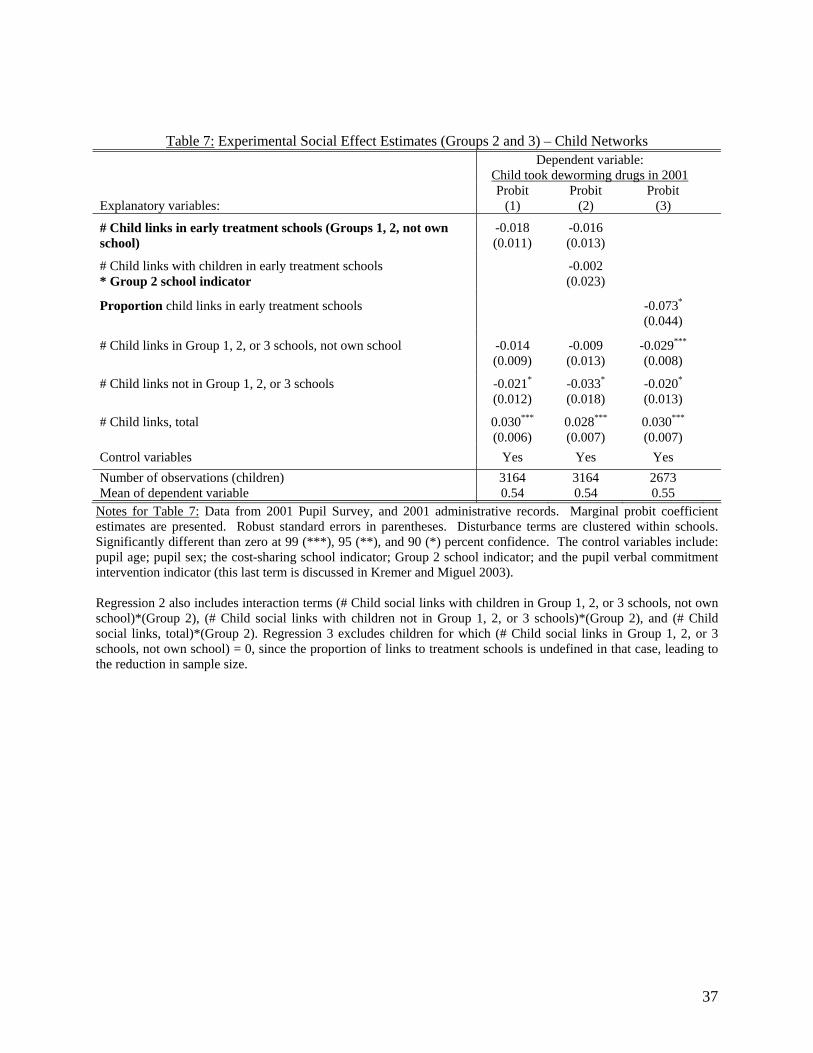
Table 7: Experimental Social Effect Estimates (Groups 2 and 3) – Child Networks
Dependent variable: Child took deworming drugs in 2001
Probit Probit Probit Explanatory variables: (1) (2) (3)
# Child links in early treatment schools (Groups 1, 2, not own school)
-0.018 (0.011)
-0.016 (0.013)
# Child links with children in early treatment schools * Group 2 school indicator
-0.002 (0.023)
Proportion child links in early treatment schools -0.073*
(0.044)
# Child links in Group 1, 2, or 3 schools, not own school -0.014(0.009)
-0.009 (0.013)
-0.029***
(0.008)
# Child links not in Group 1, 2, or 3 schools -0.021*
(0.012) -0.033*
(0.018) -0.020*
(0.013)
# Child links, total
0.030***
(0.006) 0.028***
(0.007) 0.030***
(0.007)
Control variables Yes Yes Yes
Number of observations (children) 3164 3164 2673 Mean of dependent variable 0.54 0.54 0.55
Notes for Table 7: Data from 2001 Pupil Survey, and 2001 administrative records. Marginal probit coefficient estimates are presented. Robust standard errors in parentheses. Disturbance terms are clustered within schools. Significantly different than zero at 99 (***), 95 (**), and 90 (*) percent confidence. The control variables include: pupil age; pupil sex; the cost-sharing school indicator; Group 2 school indicator; and the pupil verbal commitment intervention indicator (this last term is discussed in Kremer and Miguel 2003). Regression 2 also includes interaction terms (# Child social links with children in Group 1, 2, or 3 schools, not own school)*(Group 2), (# Child social links with children not in Group 1, 2, or 3 schools)*(Group 2), and (# Child social links, total)*(Group 2). Regression 3 excludes children for which (# Child social links in Group 1, 2, or 3 schools, not own school) = 0, since the proportion of links to treatment schools is undefined in that case, leading to the reduction in sample size.
37
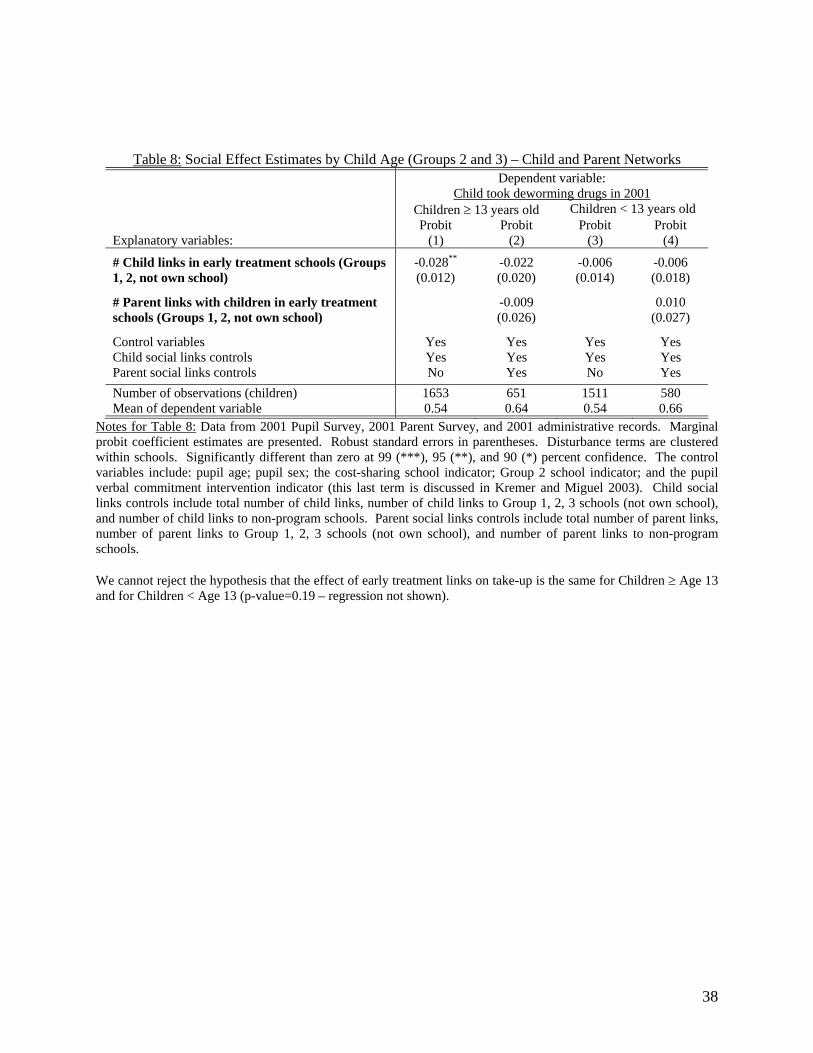
Table 8: Social Effect Estimates by Child Age (Groups 2 and 3) – Child and Parent Networks
Dependent variable: Child took deworming drugs in 2001
Children ≥ 13 years old Children < 13 years old Probit Probit Probit Probit Explanatory variables: (1) (2) (3) (4)
# Child links in early treatment schools (Groups 1, 2, not own school)
-0.028**
(0.012) -0.022 (0.020)
-0.006 (0.014)
-0.006 (0.018)
# Parent links with children in early treatment schools (Groups 1, 2, not own school)
-0.009 (0.026)
0.010 (0.027)
Control variables Yes Yes Yes Yes Child social links controls Yes Yes Yes Yes Parent social links controls No Yes No Yes
Number of observations (children) 1653 651 1511 580 Mean of dependent variable 0.54 0.64 0.54 0.66
Notes for Table 8: Data from 2001 Pupil Survey, 2001 Parent Survey, and 2001 administrative records. Marginal probit coefficient estimates are presented. Robust standard errors in parentheses. Disturbance terms are clustered within schools. Significantly different than zero at 99 (***), 95 (**), and 90 (*) percent confidence. The control variables include: pupil age; pupil sex; the cost-sharing school indicator; Group 2 school indicator; and the pupil verbal commitment intervention indicator (this last term is discussed in Kremer and Miguel 2003). Child social links controls include total number of child links, number of child links to Group 1, 2, 3 schools (not own school), and number of child links to non-program schools. Parent social links controls include total number of parent links, number of parent links to Group 1, 2, 3 schools (not own school), and number of parent links to non-program schools. We cannot reject the hypothesis that the effect of early treatment links on take-up is the same for Children ≥ Age 13 and for Children < Age 13 (p-value=0.19 – regression not shown).
38
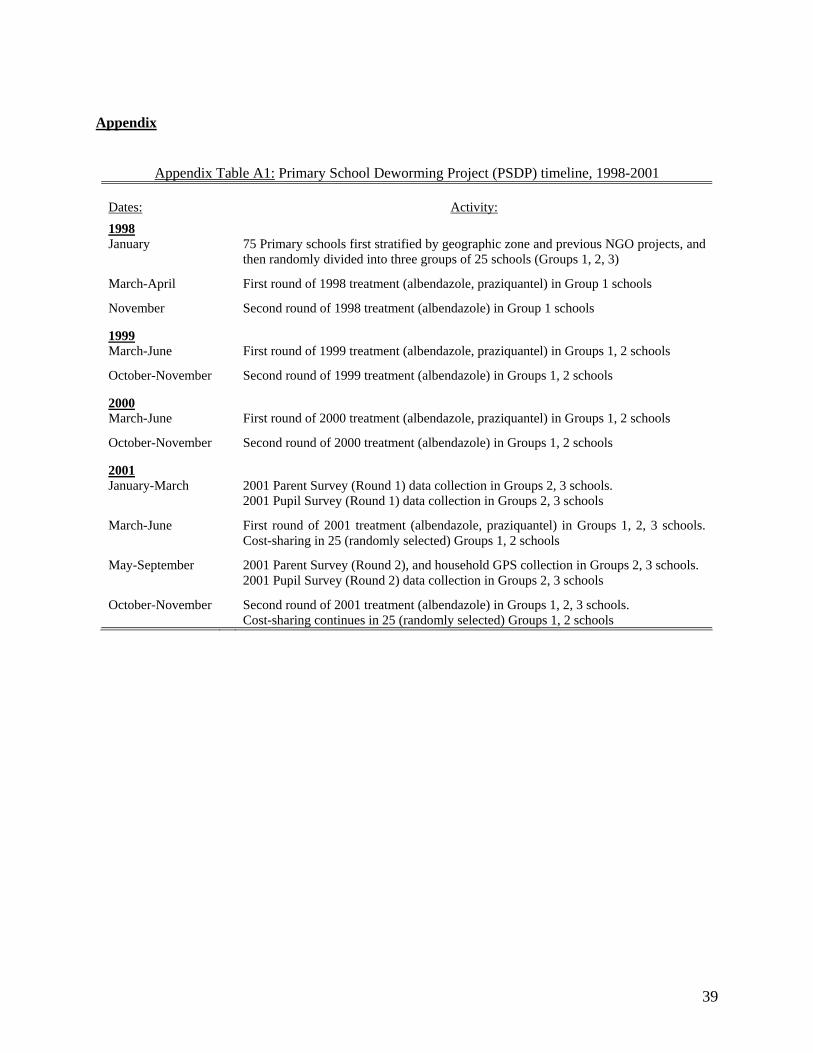
Appendix
Appendix Table A1: Primary School Deworming Project (PSDP) timeline, 1998-2001
Dates:
Activity:
1998 January 75 Primary schools first stratified by geographic zone and previous NGO projects, and
then randomly divided into three groups of 25 schools (Groups 1, 2, 3)
March-April First round of 1998 treatment (albendazole, praziquantel) in Group 1 schools
November Second round of 1998 treatment (albendazole) in Group 1 schools 1999 March-June First round of 1999 treatment (albendazole, praziquantel) in Groups 1, 2 schools
October-November Second round of 1999 treatment (albendazole) in Groups 1, 2 schools 2000 March-June First round of 2000 treatment (albendazole, praziquantel) in Groups 1, 2 schools
October-November Second round of 2000 treatment (albendazole) in Groups 1, 2 schools 2001 January-March
2001 Parent Survey (Round 1) data collection in Groups 2, 3 schools. 2001 Pupil Survey (Round 1) data collection in Groups 2, 3 schools
March-June
First round of 2001 treatment (albendazole, praziquantel) in Groups 1, 2, 3 schools. Cost-sharing in 25 (randomly selected) Groups 1, 2 schools
May-September
2001 Parent Survey (Round 2), and household GPS collection in Groups 2, 3 schools. 2001 Pupil Survey (Round 2) data collection in Groups 2, 3 schools
October-November
Second round of 2001 treatment (albendazole) in Groups 1, 2, 3 schools. Cost-sharing continues in 25 (randomly selected) Groups 1, 2 schools
39
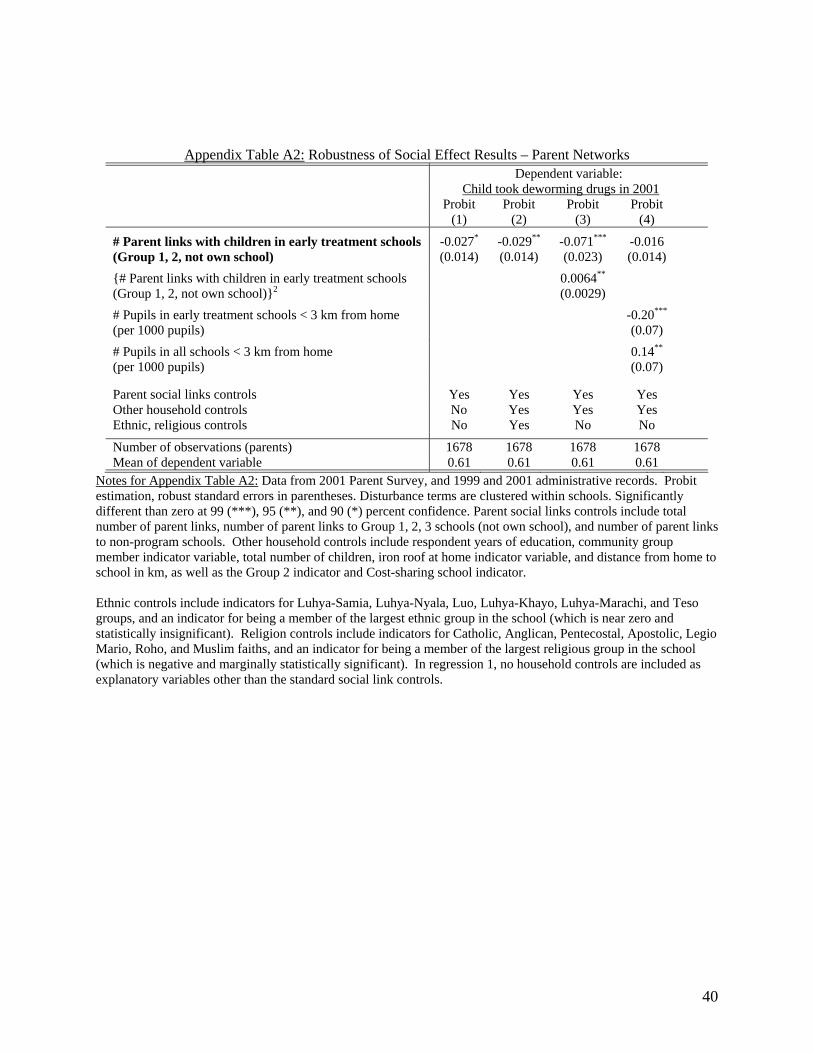
Appendix Table A2: Robustness of Social Effect Results – Parent Networks
Dependent variable: Child took deworming drugs in 2001 Probit Probit Probit Probit (1) (2) (3) (4)
# Parent links with children in early treatment schools (Group 1, 2, not own school)
-0.027*
(0.014) -0.029**
(0.014) -0.071***
(0.023) -0.016 (0.014)
{# Parent links with children in early treatment schools (Group 1, 2, not own school)}2
0.0064**
(0.0029)
# Pupils in early treatment schools < 3 km from home (per 1000 pupils)
-0.20***
(0.07)
# Pupils in all schools < 3 km from home (per 1000 pupils)
0.14**
(0.07)
Parent social links controls Yes Yes Yes Yes Other household controls No Yes Yes Yes Ethnic, religious controls No Yes No No
Number of observations (parents) 1678 1678 1678 1678 Mean of dependent variable 0.61 0.61 0.61 0.61
Notes for Appendix Table A2: Data from 2001 Parent Survey, and 1999 and 2001 administrative records. Probit estimation, robust standard errors in parentheses. Disturbance terms are clustered within schools. Significantly different than zero at 99 (***), 95 (**), and 90 (*) percent confidence. Parent social links controls include total number of parent links, number of parent links to Group 1, 2, 3 schools (not own school), and number of parent links to non-program schools. Other household controls include respondent years of education, community group member indicator variable, total number of children, iron roof at home indicator variable, and distance from home to school in km, as well as the Group 2 indicator and Cost-sharing school indicator. Ethnic controls include indicators for Luhya-Samia, Luhya-Nyala, Luo, Luhya-Khayo, Luhya-Marachi, and Teso groups, and an indicator for being a member of the largest ethnic group in the school (which is near zero and statistically insignificant). Religion controls include indicators for Catholic, Anglican, Pentecostal, Apostolic, Legio Mario, Roho, and Muslim faiths, and an indicator for being a member of the largest religious group in the school (which is negative and marginally statistically significant). In regression 1, no household controls are included as explanatory variables other than the standard social link controls.
40
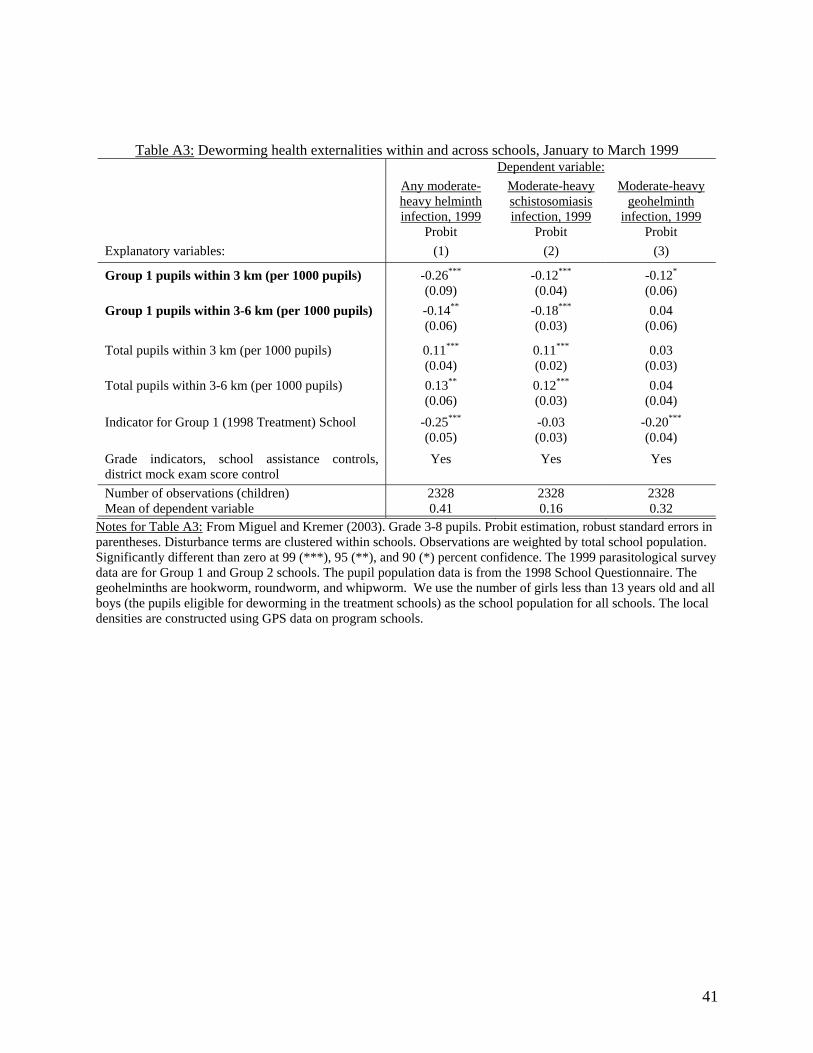
Table A3: Deworming health externalities within and across schools, January to March 1999 Dependent variable: Any moderate-
heavy helminth infection, 1999
Moderate-heavy schistosomiasis infection, 1999
Moderate-heavy geohelminth
infection, 1999 Probit Probit Probit Explanatory variables: (1) (2) (3)
Group 1 pupils within 3 km (per 1000 pupils) -0.26***
(0.09) -0.12***
(0.04) -0.12*
(0.06)
Group 1 pupils within 3-6 km (per 1000 pupils) -0.14**
(0.06) -0.18***
(0.03) 0.04
(0.06)
Total pupils within 3 km (per 1000 pupils) 0.11***
(0.04) 0.11***
(0.02) 0.03
(0.03)
Total pupils within 3-6 km (per 1000 pupils) 0.13**
(0.06) 0.12***
(0.03) 0.04
(0.04)
Indicator for Group 1 (1998 Treatment) School
-0.25***
(0.05) -0.03 (0.03)
-0.20***
(0.04)
Grade indicators, school assistance controls, district mock exam score control
Yes Yes Yes
Number of observations (children) 2328 2328 2328 Mean of dependent variable 0.41 0.16 0.32
Notes for Table A3: From Miguel and Kremer (2003). Grade 3-8 pupils. Probit estimation, robust standard errors in parentheses. Disturbance terms are clustered within schools. Observations are weighted by total school population. Significantly different than zero at 99 (***), 95 (**), and 90 (*) percent confidence. The 1999 parasitological survey data are for Group 1 and Group 2 schools. The pupil population data is from the 1998 School Questionnaire. The geohelminths are hookworm, roundworm, and whipworm. We use the number of girls less than 13 years old and all boys (the pupils eligible for deworming in the treatment schools) as the school population for all schools. The local densities are constructed using GPS data on program schools.
41