networks of wildlife translocations in developing countries: an emerging conservation issue?
TRANSCRIPT
243
© The Ecological Society of America www.frontiersinecology.org
The commodification of wildlife is by no means a mod-ern phenomenon; humans have been using and trad-
ing animal species since ancient times (Hughes 2003).What has changed, however, is the scale at which this tradeoccurs. Growing international trade and transport networkshave broken down – intentionally or otherwise – the geo-graphic barriers that have historically served as one deter-minant of the distribution of biodiversity (Brown and Sax2004; Hulme 2009). Although unintentional transloca-
tions are the subject of a broad literature (see Hulme et al.2008), less attention has been paid to the equally importantproblem of intentional wildlife translocations, on which wefocus here. We define “translocation” loosely as the human-assisted movement of an animal from one location toanother, for any reason, including for conservation andcommercial purposes. The vast majority of translocationsreferred to in this paper were for commercial purposes andwere associated with the wildlife trade.
The scale of intentional translocations across the globeis enormous and extremely difficult to quantify. The mod-ern pet trade sector accounts for a major portion of theglobal wildlife trade, the annual estimated magnitude ofwhich includes about 40 000 live primates, 4 million livebirds, 640 000 live reptiles, and 350 million live tropicalfish (Karesh et al. 2005), with an annual value of approx-imately US$20 billion (Karesh et al. 2007). These speciesand the industries that they sustain generate a substantialamount of revenue, making wildlife translocations com-mercially important (Gordon et al. 2004).
The wildlife trade may be associated with various nega-tive impacts, including the spread of disease to humans aswell as to local wildlife populations (Daszak et al. 2000;Brown 2010), deleterious genetic effects (Ricciardi andSimberloff 2009), overharvesting of wild populations(Sutherland et al. 2009; Nijman et al. 2011), and theintroduction of non-native species (Nentwig 2007;Carrete and Tella 2008). The introduction of non-nativespecies through the wildlife and pet trade may be theresult of accidental escape or intentional release; here weuse the term “introduction” to include both. Followingintroduction, a fraction of non-native species may estab-lish and spread more aggressively than others, and these
REVIEWS REVIEWS REVIEWS
Networks of wildlife translocations indeveloping countries: an emergingconservation issue? Jeremy R Goss* and Graeme S Cumming
The recent expansion of the global wildlife trade, both within and between countries, has many potentially neg-ative ecological impacts. Emerging economies, in particular, have a largely overlooked potential for rapid inter-nal growth in this trade. An analysis of ~17 000 wildlife transportation permits – issued in South Africa primarilyfor commercial purposes by the Western Cape Province’s local government – provides insights into this trend.During the past decade, a total of 912 amphibian, bird, mammal, and reptile species were transported to andfrom locations in the province; 60% of translocated vertebrate species were non-native. Network analysis of thedata indicated that the numbers of participants within local trade networks are increasing rapidly. Static anddynamic structural differences emerged between the networks for selected vertebrate Classes. Changes in densityand degree were pronounced for mammal and reptile networks but were more constant for birds over theobserved time period. All translocation networks exhibited “small-world”, scale-free properties, which wouldfacilitate the rapid propagation of negative influences through the system.
Front Ecol Environ 2013; 11(5): 243–250, doi:10.1890/120213 (published online 8 May 2013)
In a nutshell:• Trade in wildlife species can jeopardize both economies and
ecological systems• The number and total volume of species transported to and
from locations in the Western Cape Province of South Africahas increased during the past 10 years, as has the non-nativespecies component of this trade
• Socioeconomic networks underpin the global wildlife trade,and in the case of the Western Cape key differences can beseen in the size and connectivity of bird, mammal, and reptilenetworks, with important management-related implications
• The structure of wildlife trade networks to, from, and withinthe Western Cape is self-organizing in a way that will increas-ingly facilitate the spread of non-native species and of humanor animal diseases
• If typical of emerging economies, the increasing popularityand economic value associated with the wildlife trade in theWestern Cape represents a worrying trend for conservationglobally
Percy FitzPatrick Institute of African Ornithology, Departmentof Science and Technology/National Research Foundation(DST/NRF) Centre of Excellence, University of Cape Town,Rondebosch, South Africa *([email protected])
Wildlife translocation networks JR Goss and GS Cumming
244
www.frontiersinecology.org © The Ecological Society of America
“invasive” species are known to have serious ecological(Mack et al. 2000; Crowl et al. 2008) and economic(Pimentel et al. 2005) impacts. Worldwide, the dominantpathways for non-native species introductions have beenthe pet trade (for reptiles and amphibians); the pet tradeand release for aesthetic and game purposes (for birds);and release for food and game purposes (for mammals;Kraus 2003). Trade and translocation of wildlife aroundthe world is largely unregulated (Schlaepfer et al. 2005),and the relative ease with which non-native species maybe legally moved has facilitated numerous species inva-sions (McLachlan et al. 2007). There is evidence that thenumber of introductions via some of these pathways con-tinues to rise (Kraus 2003), suggesting that non-nativeterrestrial vertebrate introductions and their associatedimpacts will likely continue to be of concern in the future.
Wildlife translocations present an interesting case inwhich humans are not only having a direct impact onpatterns of biodiversity, but that same biodiversity is facil-itating links between people and generating networks ofhuman interaction. The resulting socioeconomic systemscan be described through the use of “network analysis”, atechnique for examining systems that share the commonorganizational principles of a network, where a series ofdiscrete objects are somehow related. Real-life networksare ubiquitous, with applications ranging from physics tosociology; more recently, networks have been describedin several ecological subdisciplines (Bascompte 2007).Network analysis is able to introduce heterogeneity intopreviously homogenous theories of societies, diseases, andpopulations (Bascompte 2009) and thus plays a valuablerole in developing a more unified approach to analyzingsocioecological systems (Cumming et al. 2010).
Here, we present an analysis of a decade’s worth ofwildlife translocation permits issued by the wildlife man-agement authority of the Western Cape, one of nineprovinces in South Africa. Our goals were twofold. First,we wanted to assess the nature and quantity of wildlifetranslocations to, from, and within the province. Studieshave shown a positive correlation between increasingnational wealth and the number of invasive non-nativespecies present in a country (Perrings 2010). Emergingeconomies may therefore offer increased opportunities forthe establishment and spread of non-native species.Second, characterizing the human contact networks thatfacilitate the translocation of wildlife allows an evaluationof the trade industry’s dynamics and has practical applica-tions for designing pertinent regulations. Our approachprovides insights into how translocation networks functionand evolve and serves as a starting point for comparisonwith translocation networks in other parts of the world.
n The translocation zoo
Wildlife trade and translocations in the Western Cape aregoverned by legislation requiring a permit to import into,export from, or transport through the province any non-
domesticated animal, including those born in captivity(Lloyd 2000). The dataset for our analysis comprises thesepermits issued from the beginning of 2001 to mid-November2011. The vertebrate Classes that had adequate recordedmovements to warrant analysis were amphibians, birds,mammals, and reptiles. Because we were interested in perma-nent translocations of live wildlife from one location toanother, movements that resulted in a return to the point oforigin (eg veterinary visits, film shoots) were excluded. Thesubset of permits that were cancelled, replaced, or acciden-tally repeated after issuance was also excluded. Finally, anypermits in which the organism could not be positively identi-fied to species level, as well as those concerning movementsof domesticated species and hybrids, were also removed,given that the focus of this analysis was on naturally occur-ring species. In describing a species’ range status, each wasclassified as either native or non-native to South Africa.
A single permit may be issued for the translocation ofany number of species. From the total of 17 456 permitswe included 16 415 permits in the trend analysis, with1.45 ± 1.55 species (mean ± standard deviation [SD]) and10.93 ± 50.26 individuals (mean ± SD) translocated perpermit. It must be noted that these permits record onlylegal movements of wildlife in the province. Non-permit-ted translocations can be a result of either organized crim-inal trade or non-compliance with permit regulations.Warchol et al. (2003) reported a thriving illegal wildlifetrade in South Africa, and so the values presented hereunderestimate total translocations. We performed all sta-tistical analyses using base functions in R statistical soft-ware (R Development Core Team 2011).
From 2001 to 2011, 160 051 wild animals were trans-ported to, from, and within the Western Cape, represent-ing 912 species from 4 taxonomic Classes (Table 1).Mammals dominated the volume of translocations (54.1%of the total), followed by reptiles (27.3%), birds (18%),and amphibians (0.6%). Birds comprised the majority ofdifferent species that were translocated (54.6% of thetotal), followed by reptiles (26.8%), mammals (17.3%),and amphibians (1.3%). There were therefore relativelylarge volumes of a small number of mammal species andrelatively small volumes of a large number of bird speciesbeing translocated. The proportional contributions of eachClass to the total number of species translocated were notdissimilar to the findings of Soorae et al. (2008) for the
Table 1. The total volume and number of selected ver-tebrate species translocated to, from, and within theWestern Cape from 2001 to 2011, classified accordingto Class and whether native to South Africa
Total number of species Total volumeNon-native Native Non-native Native
Amphibians 4 8 51 896Birds 298 200 21 345 7503Mammals 82 76 4053 82 583Reptiles 165 79 18 089 25 531Total 549 363 43 538 116 513
JR Goss and GS Cumming Wildlife translocation networks
245
© The Ecological Society of America www.frontiersinecology.org
wildlife pet trade in the United ArabEmirates. Analyses of the wildlife trade insouthern China (inclusive of trade for petsand food) also showed birds to make up thebulk of species traded (50.3%), followedby reptiles (37.3%), amphibians (10.6%),and mammals (1.8%) (Lau et al. 1997).Although the exact nature of the tradeundoubtedly varies by region, the broad sim-ilarity of the results suggests that the trendsobserved in the Western Cape may be repre-sentative of commonalities in the propor-tional composition of major vertebrateClasses in the global wildlife trade.
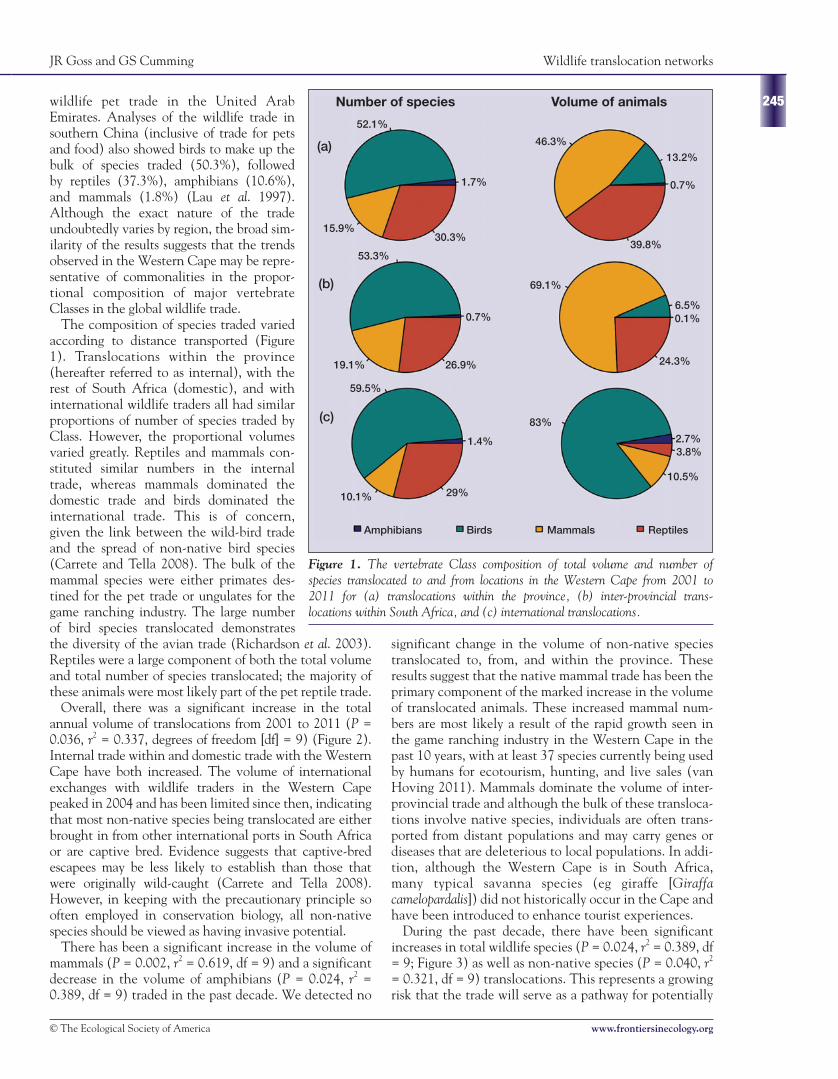
The composition of species traded variedaccording to distance transported (Figure1). Translocations within the province(hereafter referred to as internal), with therest of South Africa (domestic), and withinternational wildlife traders all had similarproportions of number of species traded byClass. However, the proportional volumesvaried greatly. Reptiles and mammals con-stituted similar numbers in the internaltrade, whereas mammals dominated thedomestic trade and birds dominated theinternational trade. This is of concern,given the link between the wild-bird tradeand the spread of non-native bird species(Carrete and Tella 2008). The bulk of themammal species were either primates des-tined for the pet trade or ungulates for thegame ranching industry. The large numberof bird species translocated demonstratesthe diversity of the avian trade (Richardson et al. 2003).Reptiles were a large component of both the total volumeand total number of species translocated; the majority ofthese animals were most likely part of the pet reptile trade.
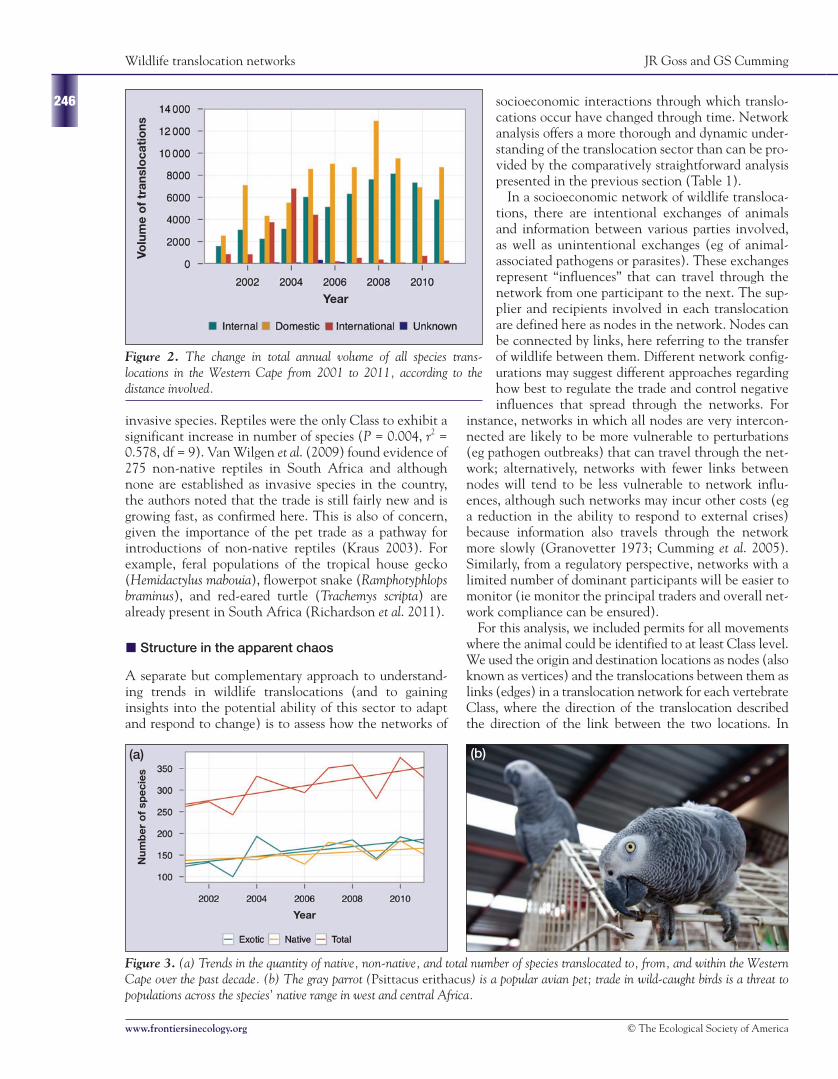
Overall, there was a significant increase in the totalannual volume of translocations from 2001 to 2011 (P =0.036, r2 = 0.337, degrees of freedom [df] = 9) (Figure 2).Internal trade within and domestic trade with the WesternCape have both increased. The volume of internationalexchanges with wildlife traders in the Western Capepeaked in 2004 and has been limited since then, indicatingthat most non-native species being translocated are eitherbrought in from other international ports in South Africaor are captive bred. Evidence suggests that captive-bredescapees may be less likely to establish than those thatwere originally wild-caught (Carrete and Tella 2008).However, in keeping with the precautionary principle sooften employed in conservation biology, all non-nativespecies should be viewed as having invasive potential.
There has been a significant increase in the volume ofmammals (P = 0.002, r2 = 0.619, df = 9) and a significantdecrease in the volume of amphibians (P = 0.024, r2 =0.389, df = 9) traded in the past decade. We detected no
significant change in the volume of non-native speciestranslocated to, from, and within the province. Theseresults suggest that the native mammal trade has been theprimary component of the marked increase in the volumeof translocated animals. These increased mammal num-bers are most likely a result of the rapid growth seen inthe game ranching industry in the Western Cape in thepast 10 years, with at least 37 species currently being usedby humans for ecotourism, hunting, and live sales (vanHoving 2011). Mammals dominate the volume of inter-provincial trade and although the bulk of these transloca-tions involve native species, individuals are often trans-ported from distant populations and may carry genes ordiseases that are deleterious to local populations. In addi-tion, although the Western Cape is in South Africa,many typical savanna species (eg giraffe [Giraffacamelopardalis]) did not historically occur in the Cape andhave been introduced to enhance tourist experiences.
During the past decade, there have been significantincreases in total wildlife species (P = 0.024, r2 = 0.389, df= 9; Figure 3) as well as non-native species (P = 0.040, r2
= 0.321, df = 9) translocations. This represents a growingrisk that the trade will serve as a pathway for potentially
Figure 1. The vertebrate Class composition of total volume and number ofspecies translocated to and from locations in the Western Cape from 2001 to2011 for (a) translocations within the province, (b) inter-provincial trans-locations within South Africa, and (c) international translocations.
Number of species Volume of animals
52.1%
1.7%
30.3%15.9%
46.3%
13.2%
0.7%
39.8%
(a)
(b)
(c)
53.3%
0.7%
26.9%19.1%
69.1%
6.5%0.1%
24.3%
59.5%
10.1%
1.4%
29%
83%
2.7%3.8%
10.5%
Amphibians Birds Mammals Reptiles
Wildlife translocation networks JR Goss and GS Cumming
246
www.frontiersinecology.org © The Ecological Society of America
invasive species. Reptiles were the only Class to exhibit asignificant increase in number of species (P = 0.004, r2 =0.578, df = 9). Van Wilgen et al. (2009) found evidence of275 non-native reptiles in South Africa and althoughnone are established as invasive species in the country,the authors noted that the trade is still fairly new and isgrowing fast, as confirmed here. This is also of concern,given the importance of the pet trade as a pathway forintroductions of non-native reptiles (Kraus 2003). Forexample, feral populations of the tropical house gecko(Hemidactylus mabouia), flowerpot snake (Ramphotyphlopsbraminus), and red-eared turtle (Trachemys scripta) arealready present in South Africa (Richardson et al. 2011).
n Structure in the apparent chaos
A separate but complementary approach to understand-ing trends in wildlife translocations (and to gaininginsights into the potential ability of this sector to adaptand respond to change) is to assess how the networks of
socioeconomic interactions through which translo-cations occur have changed through time. Networkanalysis offers a more thorough and dynamic under-standing of the translocation sector than can be pro-vided by the comparatively straightforward analysispresented in the previous section (Table 1).
In a socioeconomic network of wildlife transloca-tions, there are intentional exchanges of animalsand information between various parties involved,as well as unintentional exchanges (eg of animal-associated pathogens or parasites). These exchangesrepresent “influences” that can travel through thenetwork from one participant to the next. The sup-plier and recipients involved in each translocationare defined here as nodes in the network. Nodes canbe connected by links, here referring to the transferof wildlife between them. Different network config-urations may suggest different approaches regardinghow best to regulate the trade and control negativeinfluences that spread through the networks. For
instance, networks in which all nodes are very intercon-nected are likely to be more vulnerable to perturbations(eg pathogen outbreaks) that can travel through the net-work; alternatively, networks with fewer links betweennodes will tend to be less vulnerable to network influ-ences, although such networks may incur other costs (ega reduction in the ability to respond to external crises)because information also travels through the networkmore slowly (Granovetter 1973; Cumming et al. 2005).Similarly, from a regulatory perspective, networks with alimited number of dominant participants will be easier tomonitor (ie monitor the principal traders and overall net-work compliance can be ensured).
For this analysis, we included permits for all movementswhere the animal could be identified to at least Class level.We used the origin and destination locations as nodes (alsoknown as vertices) and the translocations between them aslinks (edges) in a translocation network for each vertebrateClass, where the direction of the translocation describedthe direction of the link between the two locations. In
Figure 2. The change in total annual volume of all species trans-locations in the Western Cape from 2001 to 2011, according to thedistance involved.
Figure 3. (a) Trends in the quantity of native, non-native, and total number of species translocated to, from, and within the WesternCape over the past decade. (b) The gray parrot (Psittacus erithacus) is a popular avian pet; trade in wild-caught birds is a threat topopulations across the species’ native range in west and central Africa.
(a) (b)
Volu
me
of
tran
slo
cati
ons
Year
Num
ber
of
spec
ies
Year
JR Goss and GS Cumming Wildlife translocation networks
practice, each node in the network represents a humanparticipant (either an organization or an individual), andthe translocation of animals between them a socioeco-nomic interaction. There were not enough translocationsto generate a meaningful network for amphibians.Furthermore, we excluded permits for which the origin ordestination of the translocation was unknown as well aspermits for which direction of movement was unknown,because these represented undirected links.
For the network analysis, we used the “igraph” package inR statistical software (Csardi and Nepusz 2006). We usednetwork metrics (see Table 2 for terminology) to describetranslocation networks in two different ways. We first sub-divided the networks into annual components to explorehow the structure of each network was evolving. We alsocompared the structures of the entire networks for eachClass, including all nodes and links, from 2001 to 2011.
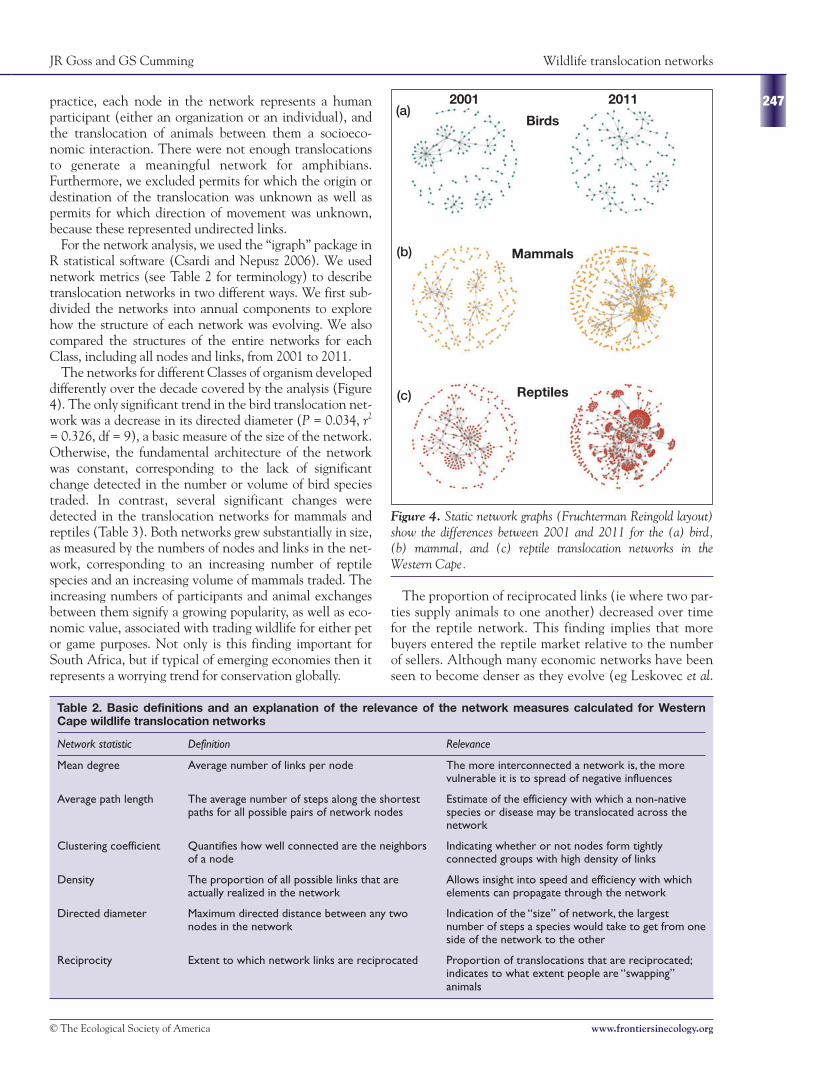
The networks for different Classes of organism developeddifferently over the decade covered by the analysis (Figure4). The only significant trend in the bird translocation net-work was a decrease in its directed diameter (P = 0.034, r2
= 0.326, df = 9), a basic measure of the size of the network.Otherwise, the fundamental architecture of the networkwas constant, corresponding to the lack of significantchange detected in the number or volume of bird speciestraded. In contrast, several significant changes weredetected in the translocation networks for mammals andreptiles (Table 3). Both networks grew substantially in size,as measured by the numbers of nodes and links in the net-work, corresponding to an increasing number of reptilespecies and an increasing volume of mammals traded. Theincreasing numbers of participants and animal exchangesbetween them signify a growing popularity, as well as eco-nomic value, associated with trading wildlife for either petor game purposes. Not only is this finding important forSouth Africa, but if typical of emerging economies then itrepresents a worrying trend for conservation globally.
247
© The Ecological Society of America www.frontiersinecology.org
The proportion of reciprocated links (ie where two par-ties supply animals to one another) decreased over timefor the reptile network. This finding implies that morebuyers entered the reptile market relative to the numberof sellers. Although many economic networks have beenseen to become denser as they evolve (eg Leskovec et al.
Table 2. Basic definitions and an explanation of the relevance of the network measures calculated for WesternCape wildlife translocation networks
Network statistic Definition Relevance
Mean degree Average number of links per node The more interconnected a network is, the morevulnerable it is to spread of negative influences
Average path length The average number of steps along the shortest Estimate of the efficiency with which a non-native paths for all possible pairs of network nodes species or disease may be translocated across the
network
Clustering coefficient Quantifies how well connected are the neighbors Indicating whether or not nodes form tightlyof a node connected groups with high density of links
Density The proportion of all possible links that are Allows insight into speed and efficiency with whichactually realized in the network elements can propagate through the network
Directed diameter Maximum directed distance between any two Indication of the “size” of network, the largest nodes in the network number of steps a species would take to get from one
side of the network to the other
Reciprocity Extent to which network links are reciprocated Proportion of translocations that are reciprocated; indicates to what extent people are “swapping”animals
2001 2011(a)
(b)
(c)
Figure 4. Static network graphs (Fruchterman Reingold layout)show the differences between 2001 and 2011 for the (a) bird,(b) mammal, and (c) reptile translocation networks in theWestern Cape.
Birds
Mammals
Reptiles
Wildlife translocation networks JR Goss and GS Cumming
2005), we found the opposite for the mammal and reptilenetworks. The trend in our data may just be characteristicof the particular developmental stage of the network, but itdoes imply caution in generalizing patterns across differentnetworks. Mean degree showed a significant increase in themammal translocation network, indicating an increasinglyconnected network that can facilitate faster and moreextensive movements of influences throughout the system.Movement speed can be particularly important given thelag times commonly experienced between the arrival of anon-native species and its establishment and recognition asinvasive (Crooks and Soulé 1999); our results imply adeclining ability to recognize threats before they becomeproblematic. A network path is an unbroken series of linksbetween a number of nodes. Average path length increasedin the reptile network, in line with standard assumptionsand in contrast to what is predicted through the “shrinkingdiameters” effect that has been observed in some social andinformation networks over time (Leskovec et al. 2005). Theshrinking diameters effect explains the process whereby thediameter of a network may decrease over time, despite theaddition of new nodes. An increasing average path lengthindicates that a greater number of translocation “steps” isneeded to link any two points in the network, and thus rep-resents a “slowing” of the rate at which non-native speciesand other influences, such as pathogens and parasites, canspread throughout a network.
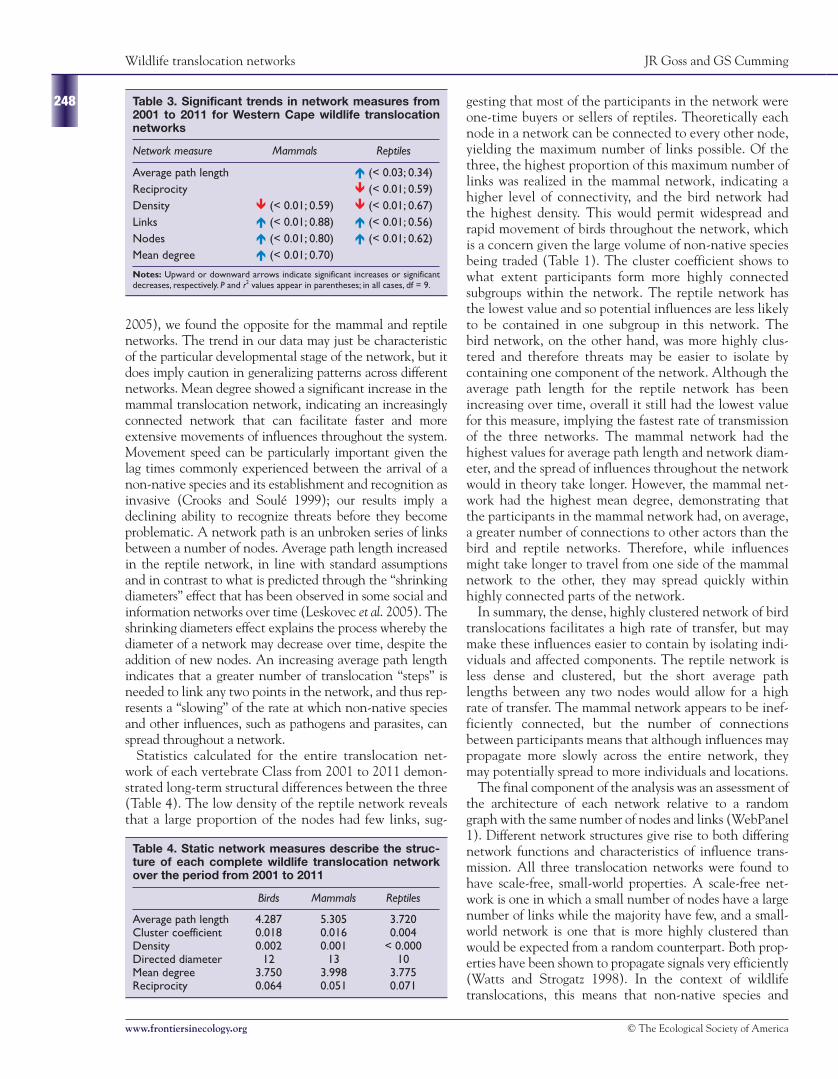
Statistics calculated for the entire translocation net-work of each vertebrate Class from 2001 to 2011 demon-strated long-term structural differences between the three(Table 4). The low density of the reptile network revealsthat a large proportion of the nodes had few links, sug-
gesting that most of the participants in the network wereone-time buyers or sellers of reptiles. Theoretically eachnode in a network can be connected to every other node,yielding the maximum number of links possible. Of thethree, the highest proportion of this maximum number oflinks was realized in the mammal network, indicating ahigher level of connectivity, and the bird network hadthe highest density. This would permit widespread andrapid movement of birds throughout the network, whichis a concern given the large volume of non-native speciesbeing traded (Table 1). The cluster coefficient shows towhat extent participants form more highly connectedsubgroups within the network. The reptile network hasthe lowest value and so potential influences are less likelyto be contained in one subgroup in this network. Thebird network, on the other hand, was more highly clus-tered and therefore threats may be easier to isolate bycontaining one component of the network. Although theaverage path length for the reptile network has beenincreasing over time, overall it still had the lowest valuefor this measure, implying the fastest rate of transmissionof the three networks. The mammal network had thehighest values for average path length and network diam-eter, and the spread of influences throughout the networkwould in theory take longer. However, the mammal net-work had the highest mean degree, demonstrating thatthe participants in the mammal network had, on average,a greater number of connections to other actors than thebird and reptile networks. Therefore, while influencesmight take longer to travel from one side of the mammalnetwork to the other, they may spread quickly withinhighly connected parts of the network.
In summary, the dense, highly clustered network of birdtranslocations facilitates a high rate of transfer, but maymake these influences easier to contain by isolating indi-viduals and affected components. The reptile network isless dense and clustered, but the short average pathlengths between any two nodes would allow for a highrate of transfer. The mammal network appears to be inef-ficiently connected, but the number of connectionsbetween participants means that although influences maypropagate more slowly across the entire network, theymay potentially spread to more individuals and locations.
The final component of the analysis was an assessment ofthe architecture of each network relative to a randomgraph with the same number of nodes and links (WebPanel1). Different network structures give rise to both differingnetwork functions and characteristics of influence trans-mission. All three translocation networks were found tohave scale-free, small-world properties. A scale-free net-work is one in which a small number of nodes have a largenumber of links while the majority have few, and a small-world network is one that is more highly clustered thanwould be expected from a random counterpart. Both prop-erties have been shown to propagate signals very efficiently(Watts and Strogatz 1998). In the context of wildlifetranslocations, this means that non-native species and
248
www.frontiersinecology.org © The Ecological Society of America
Table 4. Static network measures describe the struc-ture of each complete wildlife translocation networkover the period from 2001 to 2011
Birds Mammals Reptiles
Average path length 4.287 5.305 3.720Cluster coefficient 0.018 0.016 0.004Density 0.002 0.001 < 0.000Directed diameter 12 13 10Mean degree 3.750 3.998 3.775Reciprocity 0.064 0.051 0.071
Table 3. Significant trends in network measures from2001 to 2011 for Western Cape wildlife translocationnetworks
Network measure Mammals Reptiles
Average path length È (< 0.03; 0.34)Reciprocity Í (< 0.01; 0.59)Density Í (< 0.01; 0.59) Í (< 0.01; 0.67)Links È (< 0.01; 0.88) È (< 0.01; 0.56)Nodes È (< 0.01; 0.80) È (< 0.01; 0.62)Mean degree È (< 0.01; 0.70)
Notes: Upward or downward arrows indicate significant increases or significantdecreases, respectively. P and r2 values appear in parentheses; in all cases, df = 9.
JR Goss and GS Cumming Wildlife translocation networks
249
© The Ecological Society of America www.frontiersinecology.org
other potentially negative influences could spread veryquickly and easily through these networks.
n The carrot or the stick?
Our analysis has several practical implications. Althoughprograms are in place to address the issue of invasive flora inSouth Africa, the lack of a unified policy and controls tomanage fauna – particularly non-native terrestrial verte-brates – appears to indicate less concern regarding thethreats posed by animals. This may be partly a result of thecommercial value of many of these species, and the lobbiesthat exist within the pet and wild game trades. However,based on the current magnitude of the threat, as well as theincreasing numbers of non-native species, the recommen-dations of van Wilgen et al. (2008) for the implementationof standard, countrywide policies to monitor and controlthe translocation of non-native vertebrate species seemvitally important. Control and restrictions on the interna-tional wildlife trade may provide effective interventions insome cases (IUCN 2000). However, our data show that alarge number of non-native species traded within a countryare derived from captive-bred stocks, and there is thereforea need to manage such trade internally as well as externally.However, stringent laws may drive trade underground, mak-ing it harder to monitor (Rivalan et al. 2007). Given thesocioeconomic importance of these species, managementpolicies should be developed transparently and with theactive involvement of stakeholders.
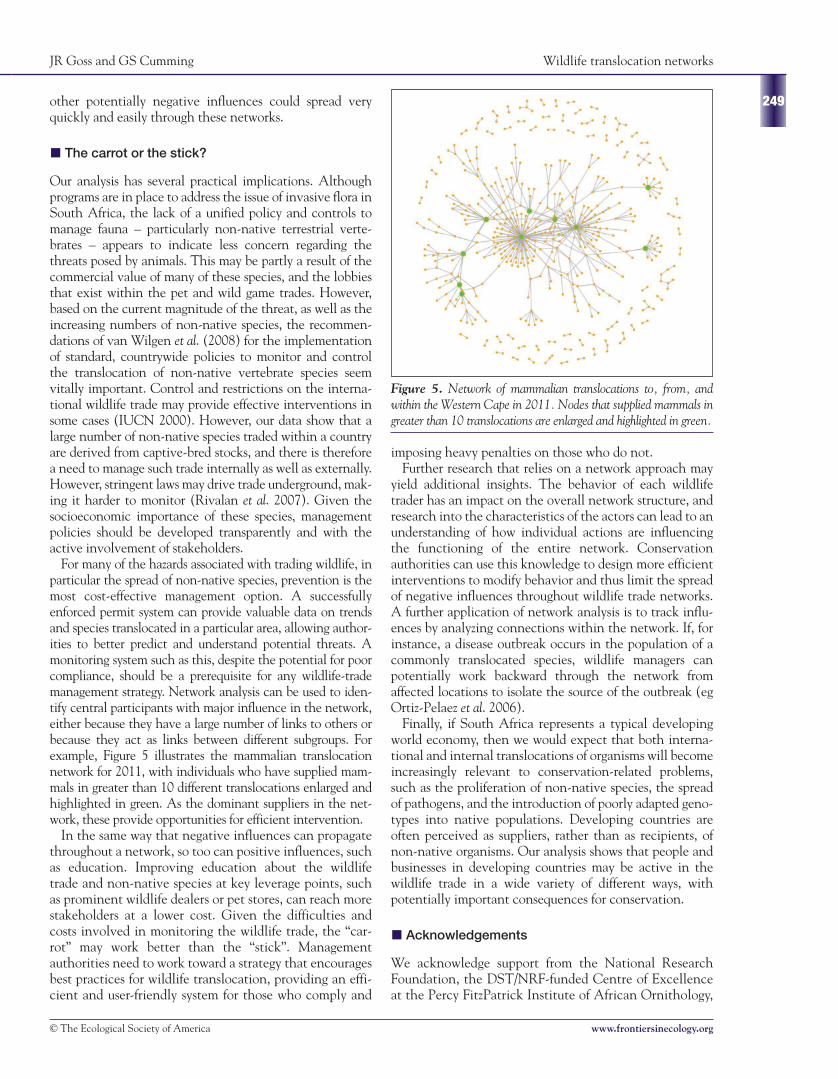
For many of the hazards associated with trading wildlife, inparticular the spread of non-native species, prevention is themost cost-effective management option. A successfullyenforced permit system can provide valuable data on trendsand species translocated in a particular area, allowing author-ities to better predict and understand potential threats. Amonitoring system such as this, despite the potential for poorcompliance, should be a prerequisite for any wildlife-trademanagement strategy. Network analysis can be used to iden-tify central participants with major influence in the network,either because they have a large number of links to others orbecause they act as links between different subgroups. Forexample, Figure 5 illustrates the mammalian translocationnetwork for 2011, with individuals who have supplied mam-mals in greater than 10 different translocations enlarged andhighlighted in green. As the dominant suppliers in the net-work, these provide opportunities for efficient intervention.
In the same way that negative influences can propagatethroughout a network, so too can positive influences, suchas education. Improving education about the wildlifetrade and non-native species at key leverage points, suchas prominent wildlife dealers or pet stores, can reach morestakeholders at a lower cost. Given the difficulties andcosts involved in monitoring the wildlife trade, the “car-rot” may work better than the “stick”. Managementauthorities need to work toward a strategy that encouragesbest practices for wildlife translocation, providing an effi-cient and user-friendly system for those who comply and
imposing heavy penalties on those who do not.Further research that relies on a network approach may
yield additional insights. The behavior of each wildlifetrader has an impact on the overall network structure, andresearch into the characteristics of the actors can lead to anunderstanding of how individual actions are influencingthe functioning of the entire network. Conservationauthorities can use this knowledge to design more efficientinterventions to modify behavior and thus limit the spreadof negative influences throughout wildlife trade networks.A further application of network analysis is to track influ-ences by analyzing connections within the network. If, forinstance, a disease outbreak occurs in the population of acommonly translocated species, wildlife managers canpotentially work backward through the network fromaffected locations to isolate the source of the outbreak (egOrtiz-Pelaez et al. 2006).
Finally, if South Africa represents a typical developingworld economy, then we would expect that both interna-tional and internal translocations of organisms will becomeincreasingly relevant to conservation-related problems,such as the proliferation of non-native species, the spreadof pathogens, and the introduction of poorly adapted geno-types into native populations. Developing countries areoften perceived as suppliers, rather than as recipients, ofnon-native organisms. Our analysis shows that people andbusinesses in developing countries may be active in thewildlife trade in a wide variety of different ways, withpotentially important consequences for conservation.
n Acknowledgements
We acknowledge support from the National ResearchFoundation, the DST/NRF-funded Centre of Excellenceat the Percy FitzPatrick Institute of African Ornithology,
Figure 5. Network of mammalian translocations to, from, andwithin the Western Cape in 2011. Nodes that supplied mammals ingreater than 10 translocations are enlarged and highlighted in green.
Wildlife translocation networks JR Goss and GS Cumming
the James S McDonnell Foundation, and the Universityof Cape Town in carrying out this research. We alsothank the staff at Cape Nature Conservation for assis-tance in providing archived data, and particularly DKleinhans for her helpfulness and generosity.
n ReferencesBascompte J. 2007. Networks in ecology. Basic Appl Ecol 8: 485–90.Bascompte J. 2009. Disentangling the web of life. Science 325:
416–19.Brown C. 2010. Emerging diseases: the global express. Vet Pathol
47: 9–14.Brown JH and Sax DF. 2004. An essay on some topics concerning
invasive species. Austral Ecol 29: 530–36.Carrete M and Tella JL. 2008. Wild-bird trade and exotic inva-
sions: a new link for conservation concern? Front Ecol Environ6: 207–11.
Crooks JA and Soulé ME. 1999. Lag times in population explosions ofinvasive species: causes and implications. In: Sandlund OD, ScheiPJ, and Viken A (Eds). Invasive species and biodiversity manage-ment. Dordrecht, Netherlands: Kluwer Academic Publishers.
Crowl TA, Crist TO, Parmenter RR, et al. 2008. The spread ofinvasive species and infectious disease as drivers of ecosystemchange. Front Ecol Environ 6: 238–46.
Csardi G and Nepusz T. 2006. The igraph software package forcomplex network research. www.necsi.edu/events/iccs6/papers/c1602a3c126ba822d0bc4293371c.pdf. Viewed 26 Mar 2013.
Cumming GS, Bodin O, Ernstson H, et al. 2010. Network analysisin conservation biogeography: challenges and opportunities.Divers Distrib 16: 414–25.
Cumming GS, Barnes G, Perz S, et al. 2005. An exploratory frame-work for the empirical measurement of resilience. Ecosystems 8:975–98.
Daszak P, Cunningham AA, and Hyatt AD. 2000. Emerging infec-tious diseases of wildlife – threats to biodiversity and humanhealth. Science 287: 443–49.
Gordon IJ, Hester AJ, and Festa-Bianchet M. 2004. The manage-ment of wild large herbivores to meet economic, conservationand environmental objectives. J Appl Ecol 41: 1021–31.
Granovetter M. 1973. The strength of weak ties. Am J Sociol 78:1360–80.
Hughes JD. 2003. Europe as a consumer of exotic biodiversity:Greek and Roman times. Landscape Res 28: 21–31.
Hulme PE. 2009. Trade, transport and trouble: managing invasivespecies pathways in an era of globalization. J Appl Ecol 46: 10–18.
Hulme PE, Bacher S, Kenis M, et al. 2008. Grasping at the routes ofbiological invasions: a framework for integrating pathways intopolicy. J Appl Ecol 45: 403–14.
IUCN (International Union for Conservation of Nature). 2000. Theeffectiveness of trade measures contained in the Convention onInternational Trade in Endangered Species of Wild Fauna andFlora (CITES). In: Trade measures in multilateral environmentalagreements. Report to the Economics, Trade and EnvironmentalUnit. Nairobi, Kenya: United Nations Environment Programme.
Karesh WB, Cook RA, Bennett EL, et al. 2005. Wildlife trade andglobal disease emergence. Emerg Infect Dis 11: 1000–02.
Karesh WB, Cook RA, Gilbert M, et al. 2007. Implications ofwildlife trade on the movement of avian influenza and otherinfectious diseases. J Wildlife Dis 43: S55–S59.
Kraus F. 2003. Invasion pathways for terrestrial vertebrates. In: RuizGM and Carlton JT (Eds). Invasive species: vectors and man-agement strategies. Washington, DC: Island Press.
Lau MWN, Ades N, Goodyer N, et al. 1997. Wildlife trade insouthern China including Hong Kong and Macao. In:Mackinnon J and Sung W (Eds). Conserving China’s biodiver-sity. Beijing, China: China Council for InternationalCooperation on Environment and Development.
Leskovec J, Kleinberg JM, and Faloutsos C. 2005. Graphs overtime: densification laws, shrinking diameters and possibleexplanations. Proceedings of the 11th ACM SIGKDDInternational Conference on Knowledge Discovery and DataMining; 21–24 Aug 2005; Chicago, IL. New York, NY: ACM.
Lloyd PH. 2000. State of biodiversity: Western Cape Province,South Africa mammals. www.oceandocs.org/handle/1834/736.Viewed 4 Jan 2013.
Mack RN, Simberloff D, Lonsdale WM, et al. 2000. Biotic inva-sions: causes, epidemiology, global consequences, and control.Ecol Appl 10: 689–710.
McLachlan JS, Hellmann JJ, and Schwartz MW. 2007. A frame-work for debate of assisted migration in an era of climatechange. Conserv Biol 21: 297–302.
Nentwig W. 2007. Pathways in animal invasions. In: Nentwig W(Ed). Ecological Studies, volume 193. Berlin, Germany:Springer-Verlag.
Nijman V, Nekaris KAI, Donati G, et al. 2011. Primate conserva-tion: measuring and mitigating trade in primates. EndangeredSpecies Res 13: 159–61.
Ortiz-Pelaez A, Pfeiffer DU, Soares-Magalhaes RJ, et al. 2006. Useof social network analysis to characterize the pattern of animalmovements in the initial phases of the 2001 foot and mouthdisease (FMD) epidemic in the UK. Prev Vet Med 76: 40–45.
Perrings C. 2010. Exotic effects of capital accumulation. P NatlAcad Sci USA 107: 12063–64.
Pimentel D, Zuniga R, and Morrison D. 2005. Update on the envi-ronmental and economic costs associated with alien-invasivespecies in the United States. Ecol Econ 52: 273–88.
R Development Core Team. 2011. R: a language and environmentfor statistical computing. Vienna, Austria: R Foundation forStatistical Computing. www.R-project.org. Viewed 8 Oct 2011.
Ricciardi A and Simberloff D. 2009. Assisted colonization is not aviable conservation strategy. Trends Ecol Evol 24: 248–53.
Richardson DM, Cambray JA, Chapman RA, et al. 2003. Vectorsand pathways of biological invasions in South Africa – past,present and future. In: Ruiz GM and Carlton JT (Eds). Invasivespecies: vectors and management strategies. Washington, DC:Island Press.
Richardson DM, Wilson JR, Weyl O, et al. 2011. South Africa:invasions. In: Simberloff D and Rejmánek M (Eds).Encyclopedia of biological invasions. Berkeley, CA and LosAngeles, CA: University of California Press.
Rivalan P, Delmas V, Angulo E, et al. 2007. Can bans stimulatewildlife trade? Nature 447: 529–30.
Schlaepfer MA, Hoover C, and Dodd Jr CK. 2005. Challenges inevaluating the impact of the trade in amphibians and reptileson wild populations. BioScience 55: 256–64.
Soorae PS, Al Hameri A, Al Hamsi A, et al. 2008. A survey of thetrade in wildlife as pets in the United Arab Emirates. TRAF-FIC Bulletin 22: 41–46.
Sutherland WJ, Adams WM, Aronson RB, et al. 2009. An assess-ment of the 100 questions of greatest importance to the conser-vation of global biodiversity. Conserv Biol 23: 557–67.
van Hoving SCP. 2011. An evaluation of different extensivewildlife production systems in the Western Cape Province ofSouth Africa (MSc thesis). Stellenbosch, South Africa:University of Stellenbosch.
van Wilgen NJ, Richardson DM, and Baard EHW. 2008. Alien rep-tiles and amphibians in South Africa: towards a pragmaticstrategy. S Afr J Sci 104: 13–20.
van Wilgen NJ, Wilson JRU, Elith J, et al. 2009. Alien invadersand reptile traders: what drives the live animal trade in SouthAfrica? Anim Conserv 13(S1): 24–32.
Warchol GL, Zupan LL, and Clack W. 2003. Transnational crimi-nality: an analysis of the illegal wildlife market in southernAfrica. International Crim Justice Rev 13: 1–27.
Watts DJ and Strogatz SH. 1998. Collective dynamics of “small-world” networks. Nature 393: 409–10.
250
www.frontiersinecology.org © The Ecological Society of America