network, fleet and schedule strategic planning alex heiter...
TRANSCRIPT

Network, Fleet and Schedule Strategic Planning Alex Heiter & Bruce Tecklenburg
Network, Fleet and Schedule
Strategic Planning
30 March 2015
Istanbul Technical University
Air Transportation Management
M.Sc. Program

2
Introductions
This week’s instructors:
Alex Heiter
Director – Airline Network &
Fleet Planning
Boeing Commercial Airplanes
Bruce Tecklenburg
Senior Manager – Airline
Network & Fleet Planning
Boeing Commercial Airplanes
Dr. Peter Belobaba
Principle Research Scientist –
International Center for Air
Transportation
Massachusetts Institute of
Technology
Michael Wittman
Aviation Consultant
InterVistas

3
Introductions
ITU Student Introductions:
Your Name
Your position in Turkish Airlines
What do you hope to learn from this course?
4
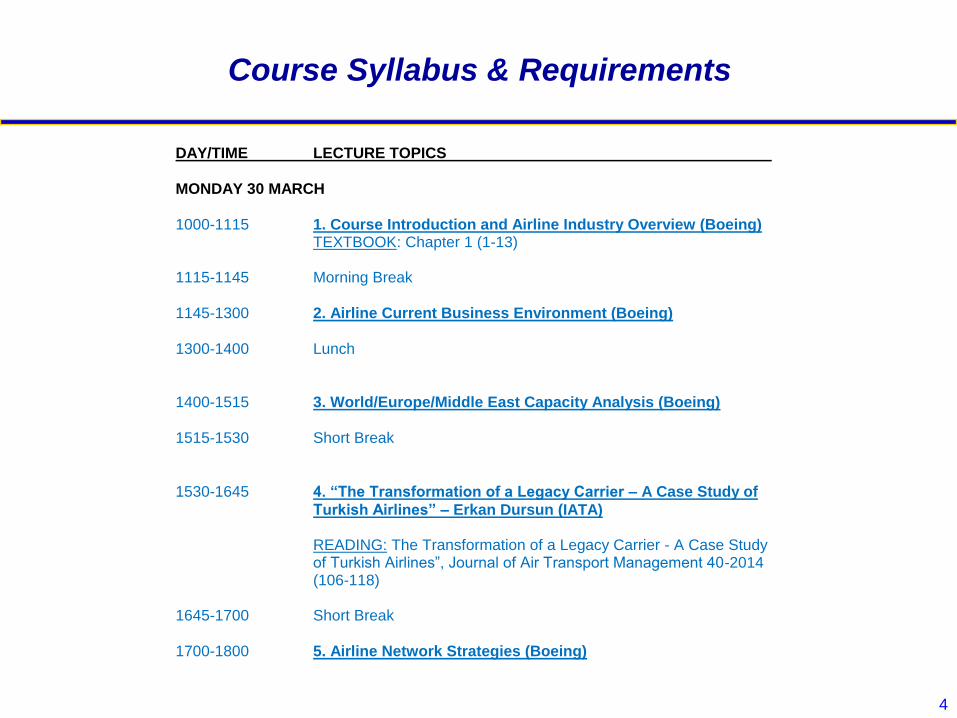
Course Syllabus & Requirements
DAY/TIME LECTURE TOPICS
MONDAY 30 MARCH
1000-1115 1. Course Introduction and Airline Industry Overview (Boeing) TEXTBOOK: Chapter 1 (1-13) 1115-1145 Morning Break
1145-1300 2. Airline Current Business Environment (Boeing)
1300-1400 Lunch
1400-1515 3. World/Europe/Middle East Capacity Analysis (Boeing)
1515-1530 Short Break
1530-1645 4. “The Transformation of a Legacy Carrier – A Case Study of
Turkish Airlines” – Erkan Dursun (IATA) READING: The Transformation of a Legacy Carrier - A Case Study of Turkish Airlines”, Journal of Air Transport Management 40-2014 (106-118)
1645-1700 Short Break
1700-1800 5. Airline Network Strategies (Boeing)

5
Course Syllabus & Requirements
TUESDAY 31 MARCH
1000-1115 6. Overview of Airline Planning Process (Boeing) TEXTBOOK: Chapter 3 (47-51) 1115-1145 Morning Break
1145-1300 7. Introduction to Fleet Planning (Boeing) TEXTBOOK: Chapter 6 (153-156) 1300-1400 Lunch
1400-1515 8. Evaluation of Alternative Aircraft Types (Boeing)
TEXTBOOK: Chapter 6 (156-162) 1515-1530 Short Break
1530-1645 9. Fleet Evaluation and Financial Analysis (Boeing) 1645-1700 Short Break 1700-1800 ASSIGNMENT 1 – FLEET PLANNING (Boeing/Wittman)

6
Course Syllabus & Requirements
WEDNESDAY 1 APRIL
1000 ASSIGNMENT 1 DUE
1000-1115 10. Fundamentals of Airline Markets and Demand (Belobaba) TEXTBOOK: Chapter 3 (51-67) 1115-1145 Morning Break
1145-1300 11.Estimation of Demand and Market Share (Belobaba) TEXTBOOK: Chapter 3 (67-71) 1300-1400 Lunch 1400-1500 ASSIGNMENT 1 REVIEW and DISCUSSION (Boeing/Wittman) 1500-1515 Short Break
1515-1630 12.Airline Operating Costs (Belobaba) TEXTBOOK: Chapter 5 (113-122, 132-146) 1630-1645 Short Break
1645-1800 13.Airline Network Structures (Belobaba) TEXTBOOK: Chapter 6 (162-168)

7
Course Syllabus & Requirements
THURSDAY 2 APRIL
1000-1115 14. Route Planning and Profit Evaluation (Belobaba) TEXTBOOK: Chapter 6 (168-173) ARTICLE: Baldanza, B., Measuring Airline Profitability 1115-1145 Morning Break
1145-1300 15. Modeling Passenger Choice of Flight Options (Belobaba)
1300-1400 Lunch
1400-1515 16.Overview of Boeing Planning Tools (Boeing)
1515-1530 Short Break
1530-1645 17. Airline Schedule Development (Belobaba) TEXTBOOK: Chapter 6 (173-181) 1645-1700 Short Break 1700-1800 ASSIGNMENT 2 – ROUTE PROFIT EVALUATION (Wittman) Begin team work on assignment.

8
Course Syllabus & Requirements
FRIDAY 3 APRIL
1000 ASSIGNMENT 2 DUE
1000-1115 18. Demand, Load and Spill Analysis (Belobaba)
1115-1145 Morning Break
1145-1300 19. Fleet Assignment (Belobaba) TEXTBOOK: Chapter 7 (185-192) ARTICLE: Coldstart: Fleet Assignment at Delta Air Lines 1300-1400 Lunch 1400-1500 ASSIGNMENT 2 REVIEW and DISCUSSION (Wittman) 1500-1515 Short Break
1515-1630 20. From Planning to Operations (Belobaba) TEXTBOOK: Chapter 9 (253-269) 1630-1645 Short Break 1645-1800 ASSIGNMENT 3 – FLEET ASSIGNMENT/SCHEDULING (Wittman) Begin team work on assignment.

9
Course Syllabus & Requirements
SATURDAY 4 APRIL
1000 ASSIGNMENT 3 DUE
1000-1115 21. Route Forecasting Process (Boeing) 1115-1130 Morning Break
1145-1300 22. Evolution of Airline Revenue Management (Belobaba) TEXTBOOK: Chapter 4 (88-101) 1300-1400 Lunch 1400-1500 ASSIGNMENT 3 REVIEW and DISCUSSION (Wittman) 1500-1515 Short Break
1515-1630 23.Network Revenue Management: O&D Control (Belobaba) TEXTBOOK: Chapter 4 (101-108) 1630-1645 Short Break
1645-1800 24.New Developments in RM Forecasting and Optimization
(Belobaba) TEXTBOOK: Chapter 4 (108-110)
COURSE GRADING
3 Team Assignments (during class week) 45% Final Exam 55%

Introduction: Airline Industry Overview Bruce Tecklenburg
Network, Fleet and Schedule
Strategic Planning
Module 1: 30 March 2015
Istanbul Technical University
Air Transportation Management
M.Sc. Program

11
Lecture Outline
Airline Terminology and Measures
Historical Trends in Industry Growth
Global Deregulation and Liberalization
Impacts on Airline Competition
Evolution of LCC Business Models
Overview of World Airlines
Largest Global Airlines

12
Airline Terminology and Measures
Airline Demand
RPK = Revenue Passenger Kilometer
One paying passenger transported 1 kilometer
Yield = Revenue per RPK
Average fare paid by passengers, per kilometer flown
Airline Supply
ASK = Available Seat Kilometer
One aircraft seat flown 1 kilometer
Unit Cost = Operating Expense per ASK (“CASK”)
Average operating cost per unit of output
Load Factor = RPK / ASK
Unit Revenue = Revenue/ASK (“RASK”)

13
Example: Airline Measures
A 200-seat aircraft flies 1000 kilometers, with 140 passengers:
RPK = 140 passengers X 1000 kilometers = 140,000
ASK = 200 seats X 1000 kilometers = 200,000
Assume total revenue = $16,000; total operating expense = $15,000:
Yield = $16,000 / 140,000 RPK = $0.114 per RPK
Unit Cost = $15,000 / 200,000 ASK = $0.075 per ASK
Unit Revenue = $16,000 / 200,000 ASK = $0.080 per ASK
Load Factor = RPK / ASK
LF = 140,000 / 200,000 = 70.0%
For single flight, also defined as passengers / seats

14
Additional Measures for Air Cargo
Freight Tonne Kilometer (FTK)
Measure of freight traffic carried
= freight tonnes carried X kilometers flown
Available Tonne Kilometer (ATK)
Measure of freight capacity available
= freight tonne capacity X kilometers flown
Cargo Load Factor = FTK / ATK
% of freight capacity utilized

15
Airline Traffic (RPK) Growth 1984-2013
0
1000000
2000000
3000000
4000000
5000000
600000019
84
1986
1988
1990
1992
1994
1996
1998
2000
2002
2004
2006
2008
2010
2012
RPKs
(mill
ion)
Non-US
US Airlines
16
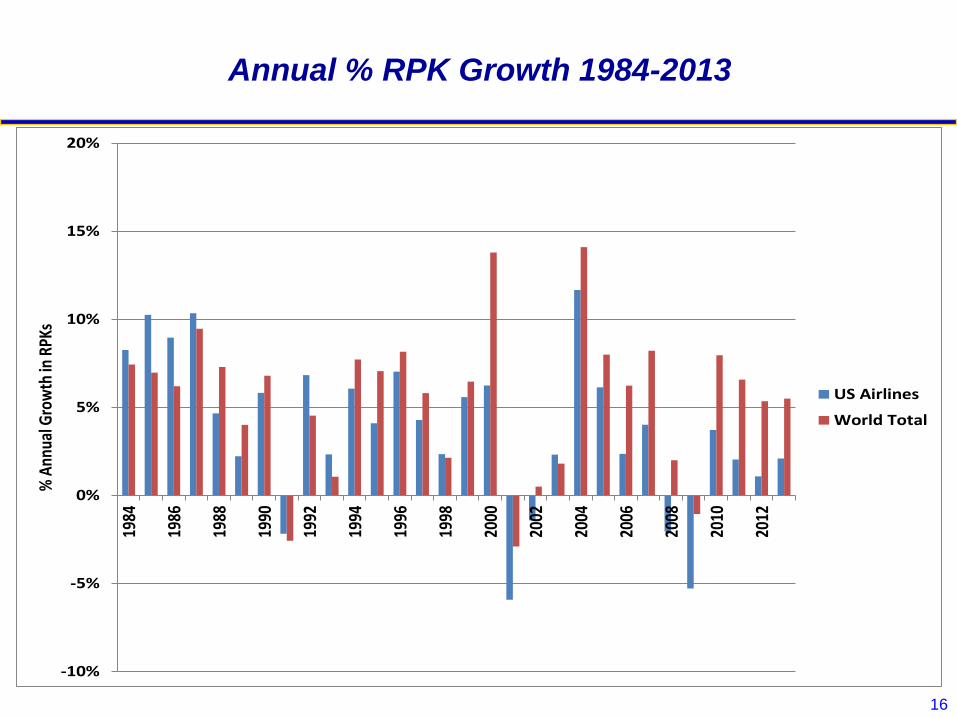
Annual % RPK Growth 1984-2013
-10%
-5%
0%
5%
10%
15%
20%19
84
1986
1988
1990
1992
1994
1996
1998
2000
2002
2004
2006
2008
2010
2012
% A
nnua
l Gro
wth
in R
PKs
US Airlines
World Total

17
Average Load Factors 1984-2013
50%
55%
60%
65%
70%
75%
80%
85%
90%19
84
1986
1988
1990
1992
1994
1996
1998
2000
2002
2004
2006
2008
2010
2012
Aver
age
Syst
em L
oad
Fact
or
US Airlines
World Total

18
US and World Industry Net Profit
1984-2013
($30,000)
($25,000)
($20,000)
($15,000)
($10,000)
($5,000)
$0
$5,000
$10,000
$15,000
$20,000
$25,000
USD
(mill
ion)
US Airlines
World Total

19
Yield vs. Distance Relationship
Yield vs. Distance -- Top 50 O+D Markets
0
10
20
30
40
50
60
70
0 500 1000 1500 2000 2500 3000
O-D Market Distance (miles)
Yie
ld (
ce
nts
/RP
M)
20
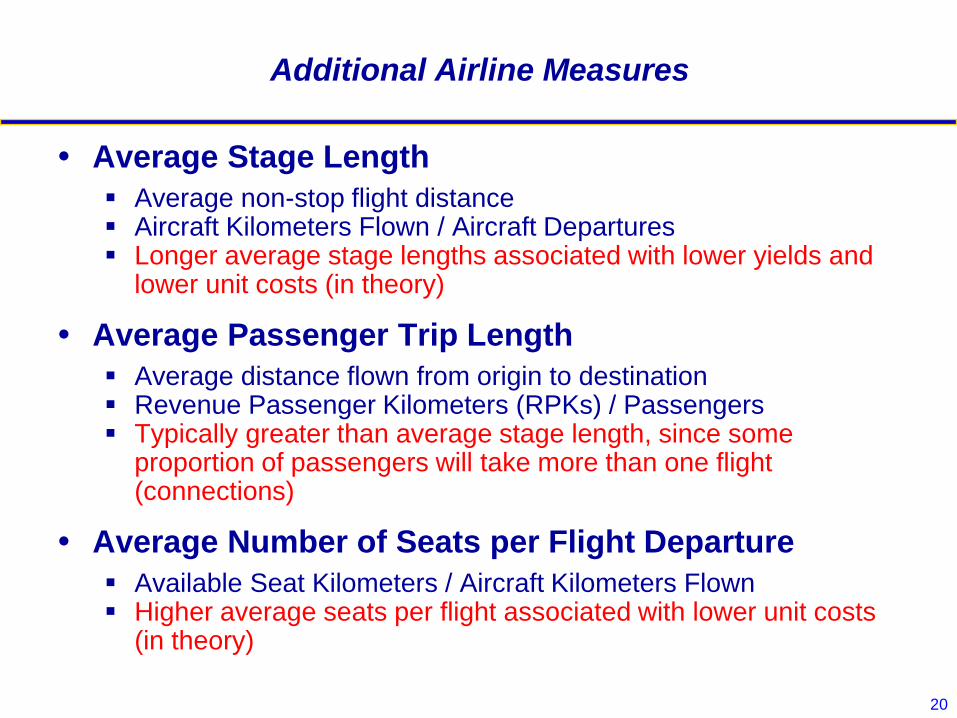
Additional Airline Measures
Average Stage Length
Average non-stop flight distance Aircraft Kilometers Flown / Aircraft Departures Longer average stage lengths associated with lower yields and
lower unit costs (in theory)
Average Passenger Trip Length
Average distance flown from origin to destination Revenue Passenger Kilometers (RPKs) / Passengers Typically greater than average stage length, since some
proportion of passengers will take more than one flight (connections)
Average Number of Seats per Flight Departure
Available Seat Kilometers / Aircraft Kilometers Flown Higher average seats per flight associated with lower unit costs
(in theory)

21
Competition Under Deregulation
The removal of economic regulations added several
new dimensions to airline competitive strategies:
Cost cutting and productivity improvement
Economies of scale in operations to reduce unit costs
Price competition and revenue management to increase
revenues
New marketing and distribution programs
Increased network coverage and market dominance
Airline managers now actually have to make
management decisions and trade-offs:
In contrast to regulated times when government control ensured
price increases to cover increased operating costs.

22
The LCC “Business Model”
LCCs are assumed to use common strategies
designed to reduce unit costs:
Single aircraft type or family of aircraft
Point-to-point vs. hub network structure
No connecting tickets (only point-to-point) local passengers
No labor unions, low wage rates
Single cabin service, no “premium” classes on board
No seat assignment (in advance and/or at the airport)
Reduced “frills” and seating space on board
No frequent flyer loyalty programs
No distribution through Global Distribution Systems (GDS)
With LCC evolution, very few large LCCs actually fit
this assumed LCC “business model” today…

24
Top 25 LCCs by Passengers Enplaned
Source: Airline Business Top 50 LCCs 2013
0.0
20.0
40.0
60.0
80.0
100.0
120.0
140.0
Pa
ss
en
ge
rs E
np
lan
ed
(m
illi
on
)

26
Selected LCCs Operating Profit Margins
Source: Airline Business Top 50 LCCs 2013
-20.0
-15.0
-10.0
-5.0
0.0
5.0
10.0
15.0
20.0
25.0
% O
pe
rati
ng
Pro
fit
Ma
rgin
* Missing data
* * * * *
27
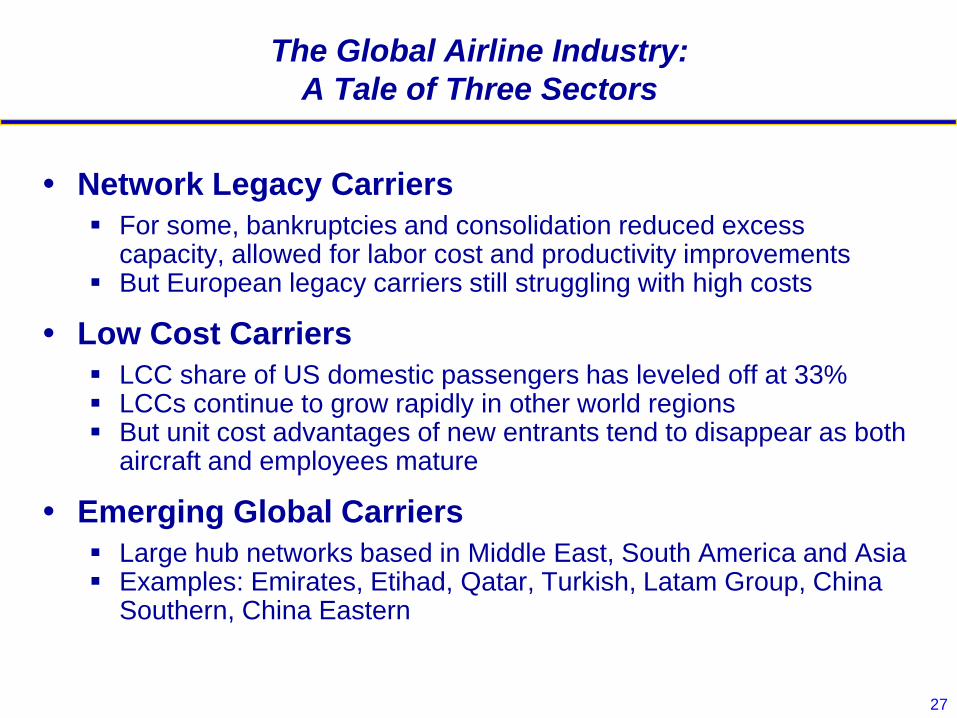
The Global Airline Industry:
A Tale of Three Sectors
Network Legacy Carriers
For some, bankruptcies and consolidation reduced excess capacity, allowed for labor cost and productivity improvements
But European legacy carriers still struggling with high costs
Low Cost Carriers
LCC share of US domestic passengers has leveled off at 33% LCCs continue to grow rapidly in other world regions But unit cost advantages of new entrants tend to disappear as both
aircraft and employees mature
Emerging Global Carriers
Large hub networks based in Middle East, South America and Asia Examples: Emirates, Etihad, Qatar, Turkish, Latam Group, China
Southern, China Eastern

28
Top 25 World Airlines – Ranked by
Passenger Traffic (RPK)
Source: Airline Business Top 200 Airlines Traffic 2013
0
50,000
100,000
150,000
200,000
250,000
300,000
350,000
RPK
(mill
ion)

30
Top 25 World Airline Groups –
Total Operating Revenues
Source: Airline Business Top 150 Airlines Financial 2013
0
5,000
10,000
15,000
20,000
25,000
30,000
35,000
40,000
45,000
USD
Mill
ions

32
Emerging Global Carriers
• Dubai, UAE
• 232 Aircraft
• 3rd largest airline by
weekly ASK capacity
• Abu Dhabi, UAE
• 109 Aircraft
• Owns large stakes in
other airlines (e.g. Alitalia)
• Doha, Qatar
• 149 Aircraft
• Joined oneworld
alliance in 2014
• Istanbul, Turkey
• 234 Aircraft
• Star Alliance member

35
What do these growth projections imply
for global airline rankings?
Rank Airline Country RPK
(2012)
1 Delta Air Lines United States 310,466
2 United Airlines United States 288,680
3 American Airlines United States 203,299
4 Emirates Airline United Arab Emirates 188,618
5 Southwest Airlines United States 165,753
6 Lufthansa Germany 149,780
7 Air France France 135,824
8 British Airways United Kingdom 126,436
9 China Eastern Airlines China 109,113
10
China Southern
Airlines China 107,000
11 US Airways United States 100,460
12 Ryanair Ireland 100,000
13 Air China China 95,940
14 Cathay Pacific Hong Kong 94,191
15 Singapore Airlines Singapore 93,766
16 Air Canada Canada 89,534
17 KLM Netherlands 86,281
18 Qantas Australia 75,935
19 Turkish Airlines Turkey 74,638
20 Qatar Airways Qatar 73,608
30 Etihad Airways United Arab Emirates 48,000
Rank Airline
Assumed Annual Growth
Rate RPK (2020)
1 Emirates Airline 9.6% 392,781
2 Delta Air Lines 0.6% 325,989
3 United Airlines 0.6% 303,114
4 Southwest Airlines 5.0% 244,893
5 American Airlines 0.6% 213,464
6 China Eastern Airlines 8.0% 201,961
7 China Southern Airlines 8.0% 198,050
8 Turkish Airlines 11.5% 178,637
9 Air China 8.0% 177,578
10 Cathay Pacific 8.0% 174,341
11 Ryanair 7.0% 171,819
12 Qatar Airways 10.9% 168,981
13 Lufthansa 0.6% 157,269
14 Air France 0.6% 142,615
15 Singapore Airlines 5.0% 138,535
16 British Airways 0.6% 132,758
17 Etihad Airways 11.8% 117,240
18 US Airways 0.6% 105,483
19 Air Canada 0.6% 94,011
20
KLM Royal Dutch
Airlines 0.6% 90,595
21 Qantas 2.0% 88,970
Source: Airline Business 2012 Rankings
• Growth rates for non-emerging carriers were extrapolated from recent growth patterns