neoplasie mieloproliferative croniche - ematologialasapienza.it · neoplasie mieloproliferative...
TRANSCRIPT
Neoplasie Mieloproliferative
Croniche
Alessandro M. VannucchiCRIMM- Center of Research and Innovation of MPN
Azienda Ospedaliera Universitaria Careggi
University of Florence, Italy

Alessandro M. Vannucchi – Disclosures
-Novartis: Advisory Board, Speaker, Research support
-Shire: Speaker
Topics
• Ruxolitinib nella PV: RESPONSE-2 e dintorni
• Gravidanza nella PV
• Efficacia/sicurezza di ruxolitinib - "long-term" e
"expanded access " – nella MF
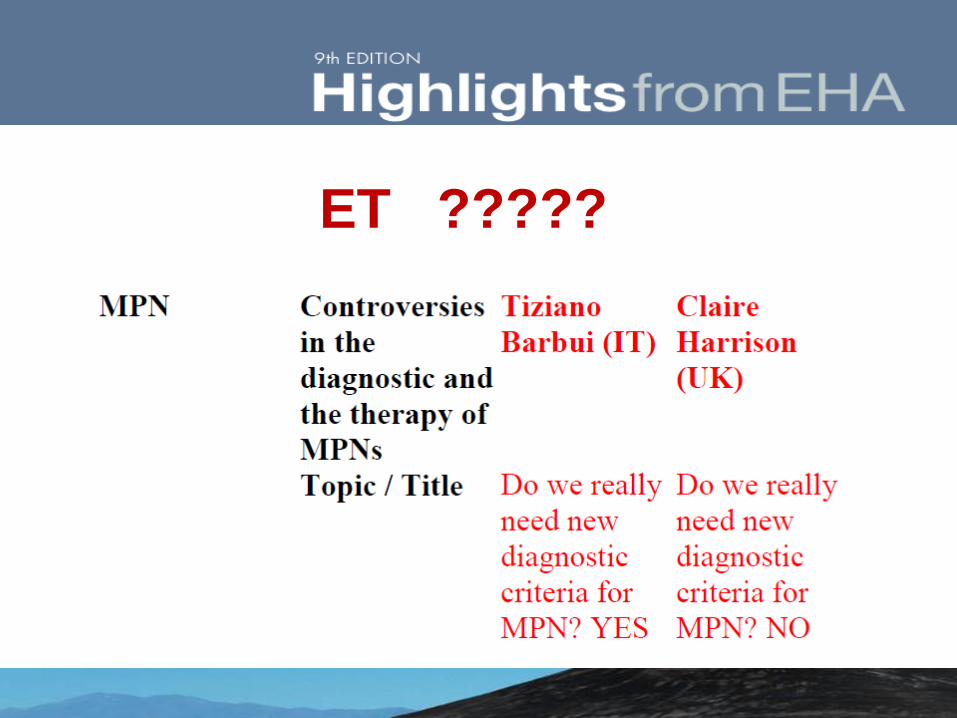
ET ?????
Topics
• Ruxolitinib nella PV: RESPONSE-2 e dintorni
• Ruxolitinib Proves Superior to Best Available Therapy in Patients With
Polycythemia Vera Resistant to or Intolerant of Hydroxyurea Without
Splenomegaly: Results From RESPONSE-2. F. Passamonti et al.
• Ruxolitinib Reduces JAK2V617F Allele Burden in Patients With Polycythemia
Vera Enrolled in the RESPONSE Study- AM Vannucchi et al.
DRAFT – Oral Presentation EHA 2016
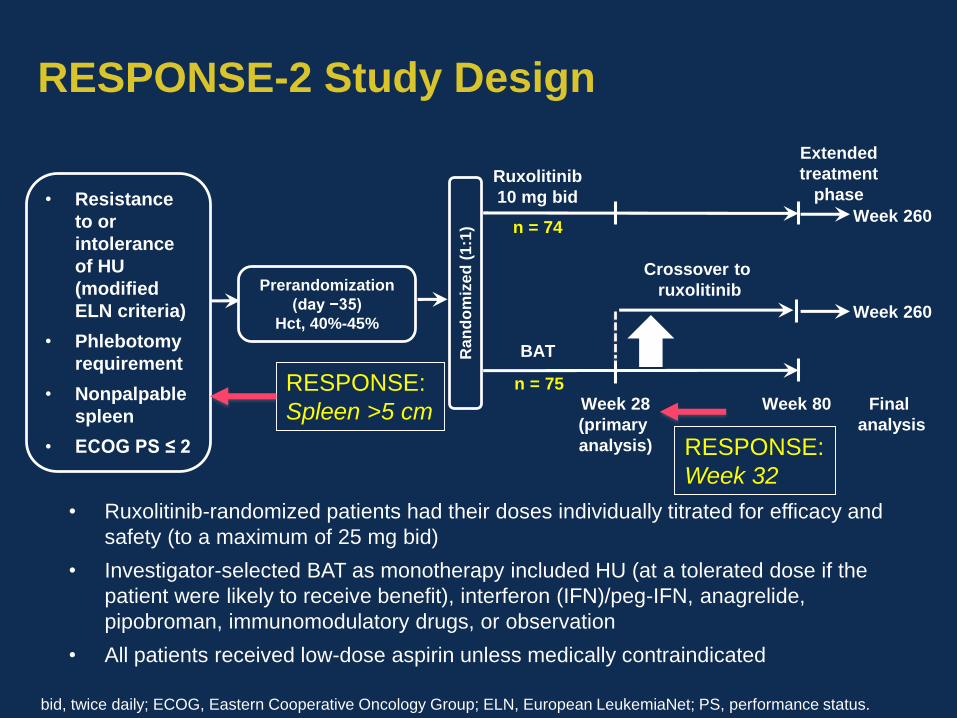
RESPONSE-2 Study Design
• Ruxolitinib-randomized patients had their doses individually titrated for efficacy and
safety (to a maximum of 25 mg bid)
• Investigator-selected BAT as monotherapy included HU (at a tolerated dose if the
patient were likely to receive benefit), interferon (IFN)/peg-IFN, anagrelide,
pipobroman, immunomodulatory drugs, or observation
• All patients received low-dose aspirin unless medically contraindicated
BAT
Week 28
(primary
analysis)
Week 80
n = 74
n = 75
Crossover to
ruxolitinib
• Resistance
to or
intolerance
of HU
(modified
ELN criteria)
• Phlebotomy
requirement
• Nonpalpable
spleen
• ECOG PS ≤ 2
Prerandomization
(day −35)
Hct, 40%-45%
Ran
do
miz
ed
(1:1
)
Extended
treatment
phaseRuxolitinib
10 mg bid
Week 260
Week 260
Final
analysis
bid, twice daily; ECOG, Eastern Cooperative Oncology Group; ELN, European LeukemiaNet; PS, performance status.
RESPONSE:
Spleen >5 cm
RESPONSE:
Week 32
DRAFT – Oral Presentation EHA 2016
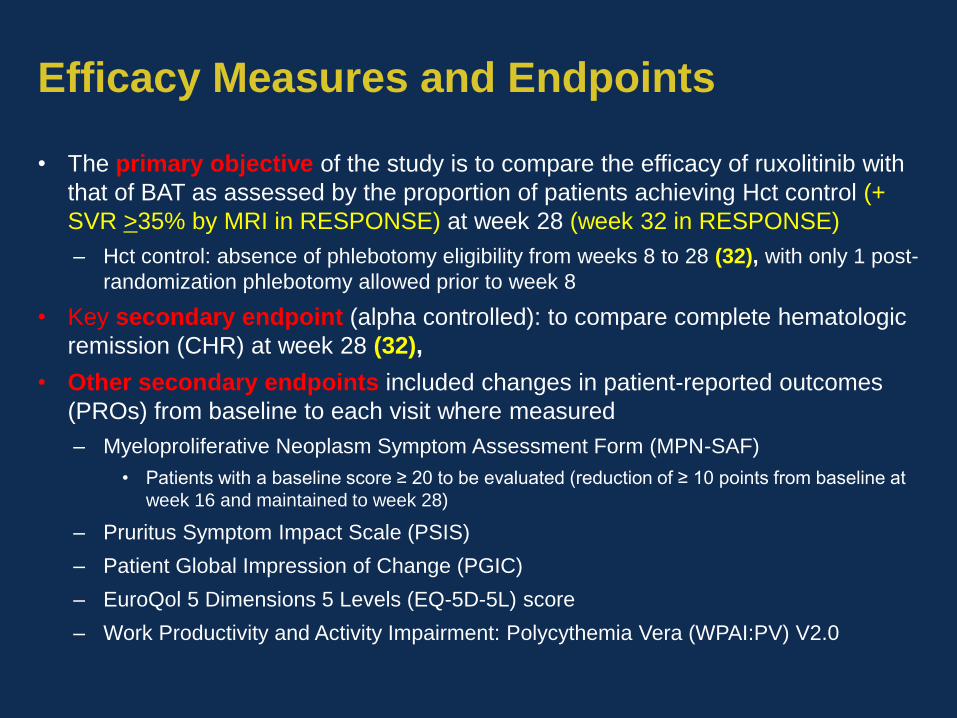
Efficacy Measures and Endpoints
• The primary objective of the study is to compare the efficacy of ruxolitinib with
that of BAT as assessed by the proportion of patients achieving Hct control (+
SVR >35% by MRI in RESPONSE) at week 28 (week 32 in RESPONSE)
– Hct control: absence of phlebotomy eligibility from weeks 8 to 28 (32), with only 1 post-
randomization phlebotomy allowed prior to week 8
• Key secondary endpoint (alpha controlled): to compare complete hematologic
remission (CHR) at week 28 (32),
• Other secondary endpoints included changes in patient-reported outcomes
(PROs) from baseline to each visit where measured
– Myeloproliferative Neoplasm Symptom Assessment Form (MPN-SAF)
• Patients with a baseline score ≥ 20 to be evaluated (reduction of ≥ 10 points from baseline at
week 16 and maintained to week 28)
– Pruritus Symptom Impact Scale (PSIS)
– Patient Global Impression of Change (PGIC)
– EuroQol 5 Dimensions 5 Levels (EQ-5D-5L) score
– Work Productivity and Activity Impairment: Polycythemia Vera (WPAI:PV) V2.0
DRAFT – Oral Presentation EHA 2016
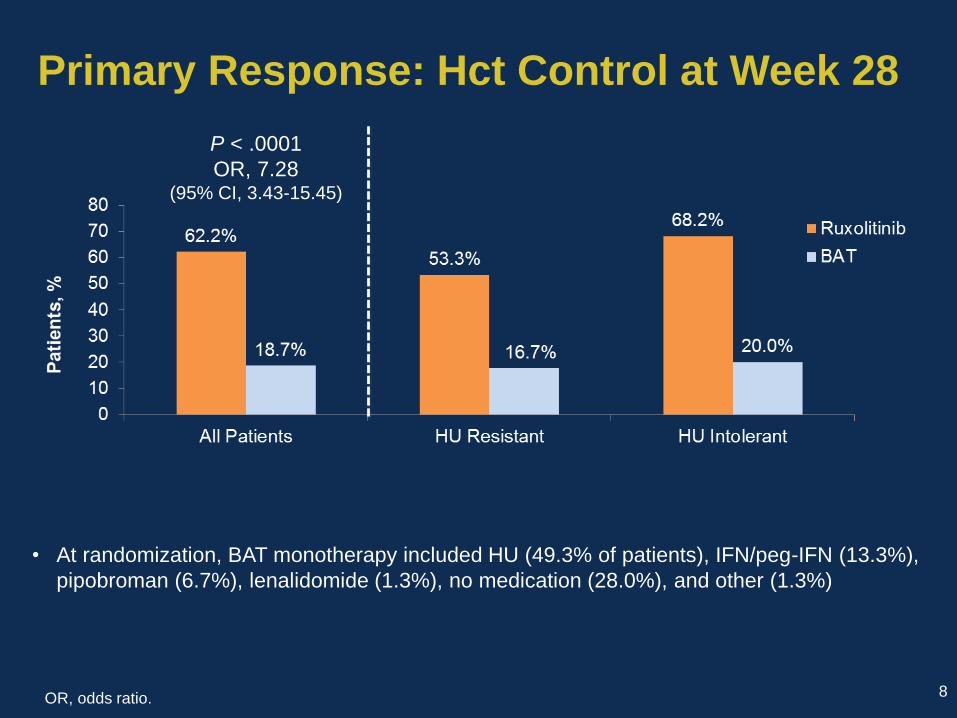
Primary Response: Hct Control at Week 28
• At randomization, BAT monotherapy included HU (49.3% of patients), IFN/peg-IFN (13.3%),
pipobroman (6.7%), lenalidomide (1.3%), no medication (28.0%), and other (1.3%)
OR, odds ratio. 8
P < .0001
OR, 7.28(95% CI, 3.43-15.45)
DRAFT – Oral Presentation EHA 2016
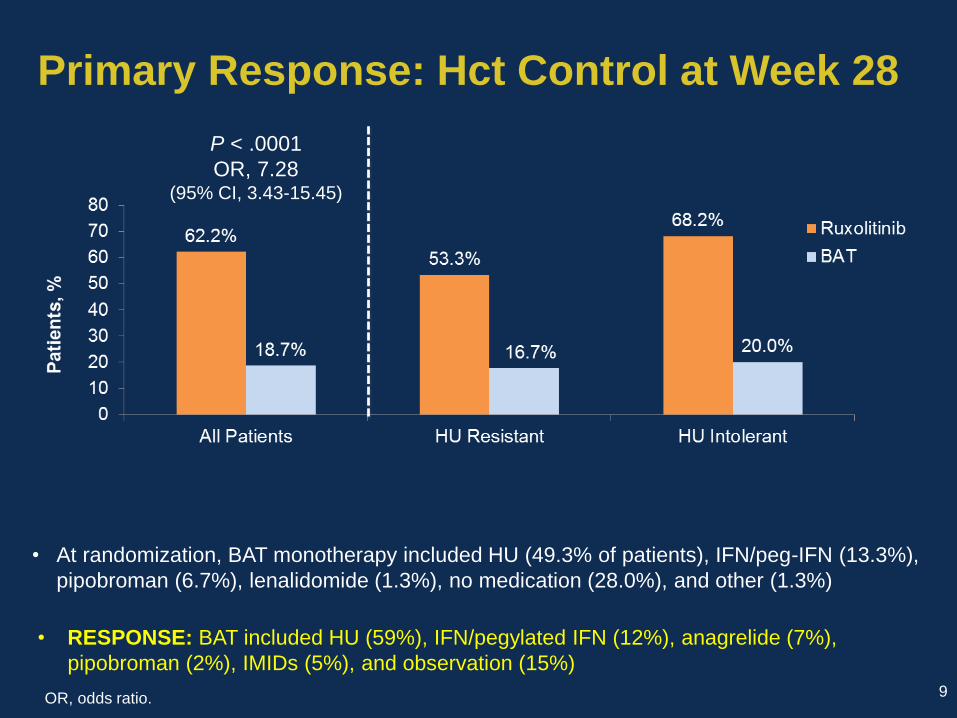
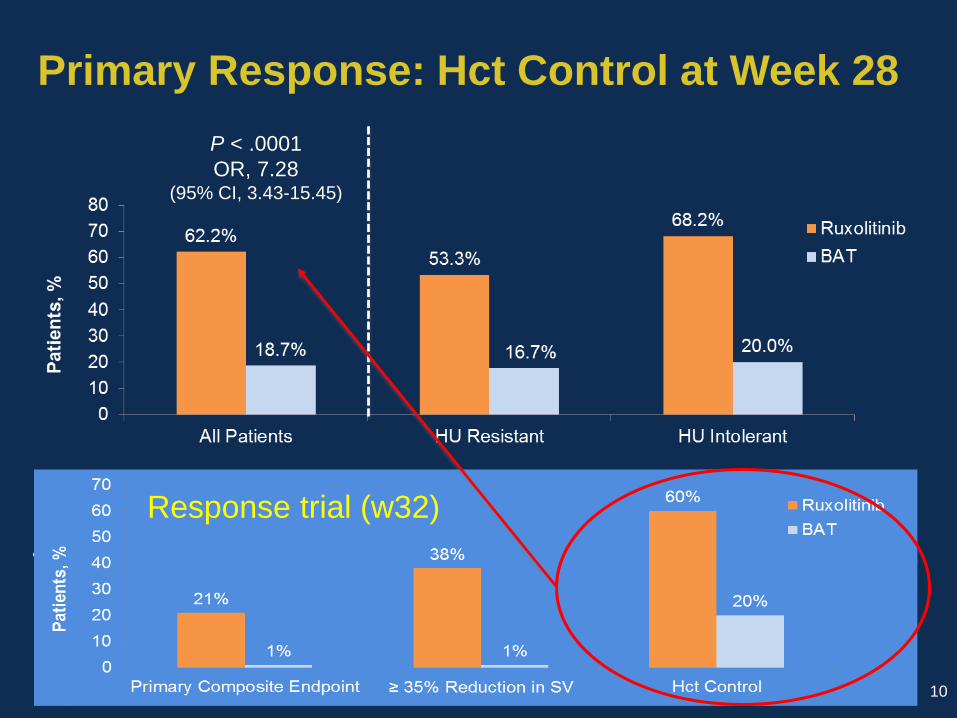
Primary Response: Hct Control at Week 28
• At randomization, BAT monotherapy included HU (49.3% of patients), IFN/peg-IFN (13.3%),
pipobroman (6.7%), lenalidomide (1.3%), no medication (28.0%), and other (1.3%)
OR, odds ratio. 9
P < .0001
OR, 7.28(95% CI, 3.43-15.45)
• RESPONSE: BAT included HU (59%), IFN/pegylated IFN (12%), anagrelide (7%),
pipobroman (2%), IMIDs (5%), and observation (15%)
DRAFT – Oral Presentation EHA 2016
Primary Response: Hct Control at Week 28
• At randomization, BAT monotherapy included HU (49.3% of patients), IFN/peg-IFN (13.3%),
pipobroman (6.7%), lenalidomide (1.3%), no medication (28.0%), and other (1.3%)
OR, odds ratio. 10
P < .0001
OR, 7.28(95% CI, 3.43-15.45)
• RESPONSE: BAT included HU (59%), IFN/pegylated IFN (12%), anagrelide (7%),
pipobroman (2%), IMIDs (5%), and observation (15%)
Response trial (w32)
DRAFT – Oral Presentation EHA 2016
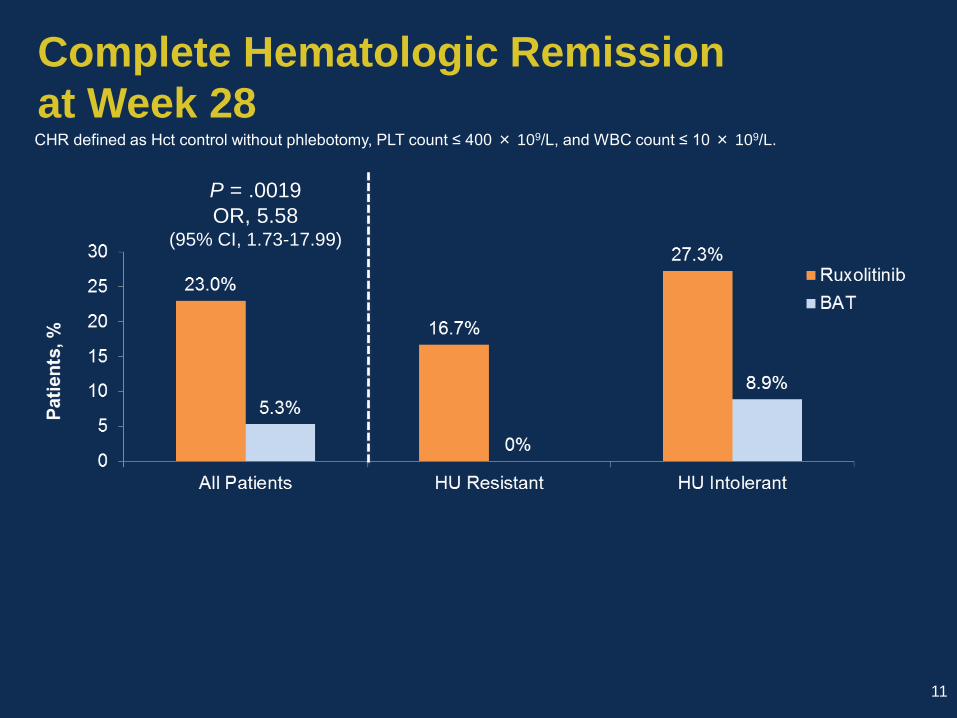
Complete Hematologic Remission
at Week 28
11
P = .0019
OR, 5.58(95% CI, 1.73-17.99)
CHR defined as Hct control without phlebotomy, PLT count ≤ 400 × 109/L, and WBC count ≤ 10 × 109/L.
DRAFT – Oral Presentation EHA 2016
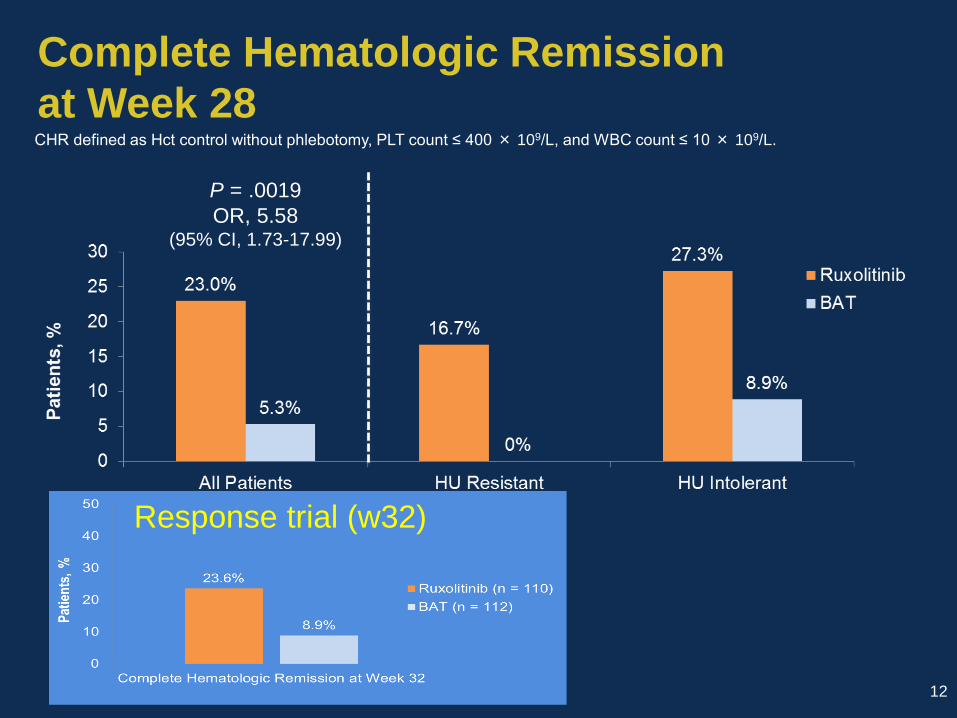
Complete Hematologic Remission
at Week 28
12
P = .0019
OR, 5.58(95% CI, 1.73-17.99)
CHR defined as Hct control without phlebotomy, PLT count ≤ 400 × 109/L, and WBC count ≤ 10 × 109/L.
Response trial (w32)
DRAFT – Oral Presentation EHA 2016
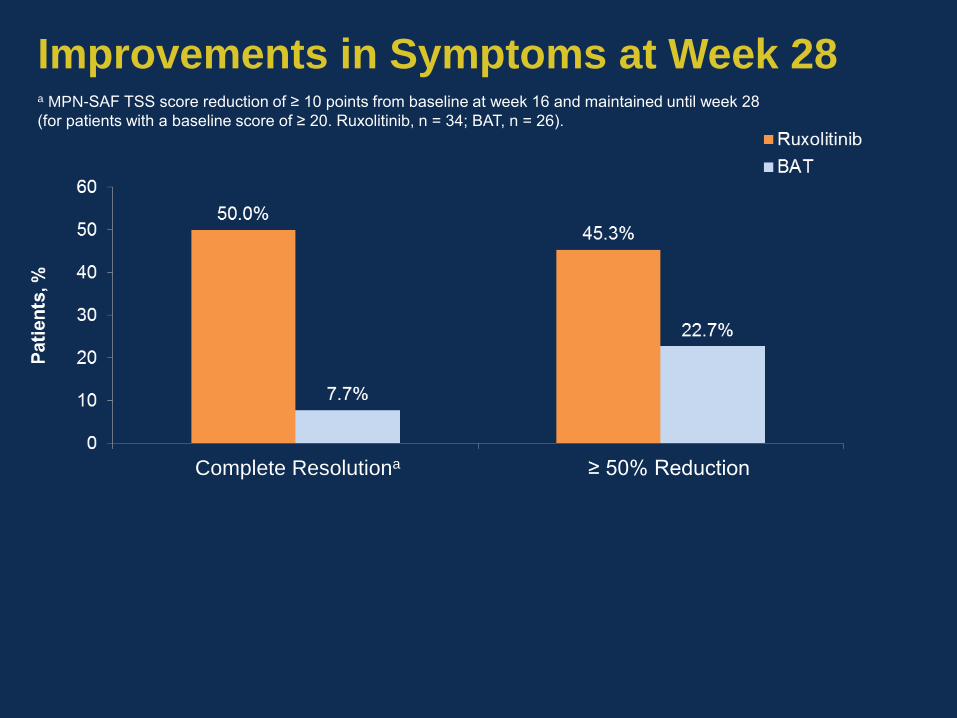
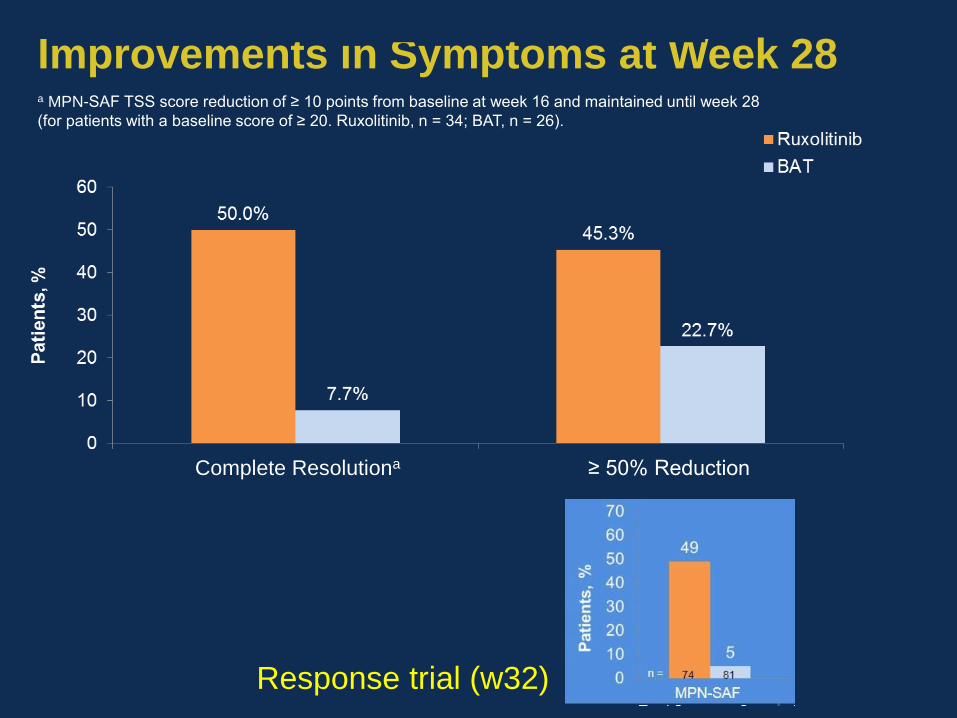
Improvements in Symptoms at Week 28
≥ 50% ReductionComplete Resolutiona
a MPN-SAF TSS score reduction of ≥ 10 points from baseline at week 16 and maintained until week 28
(for patients with a baseline score of ≥ 20. Ruxolitinib, n = 34; BAT, n = 26).
DRAFT – Oral Presentation EHA 2016
Improvements in Symptoms at Week 28
≥ 50% ReductionComplete Resolutiona
a MPN-SAF TSS score reduction of ≥ 10 points from baseline at week 16 and maintained until week 28
(for patients with a baseline score of ≥ 20. Ruxolitinib, n = 34; BAT, n = 26).
Response trial (w32)
DRAFT – Oral Presentation EHA 2016
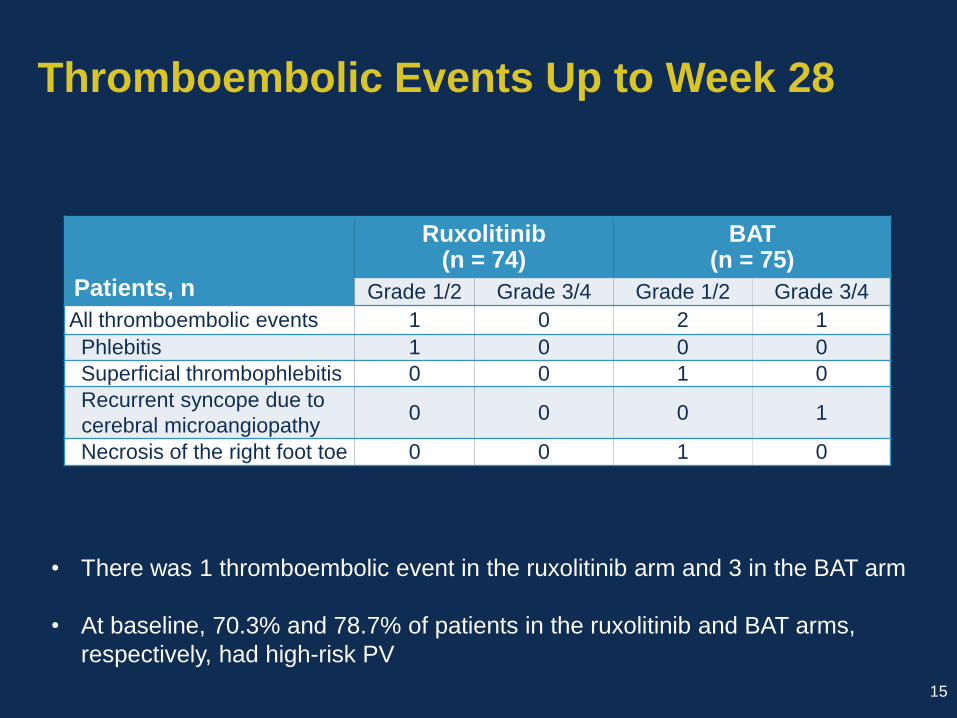
Thromboembolic Events Up to Week 28
Patients, n
Ruxolitinib(n = 74)
BAT(n = 75)
Grade 1/2 Grade 3/4 Grade 1/2 Grade 3/4
All thromboembolic events 1 0 2 1
Phlebitis 1 0 0 0
Superficial thrombophlebitis 0 0 1 0
Recurrent syncope due to
cerebral microangiopathy0 0 0 1
Necrosis of the right foot toe 0 0 1 0
15
• There was 1 thromboembolic event in the ruxolitinib arm and 3 in the BAT arm
• At baseline, 70.3% and 78.7% of patients in the ruxolitinib and BAT arms,
respectively, had high-risk PV
DRAFT – Oral Presentation EHA 2016
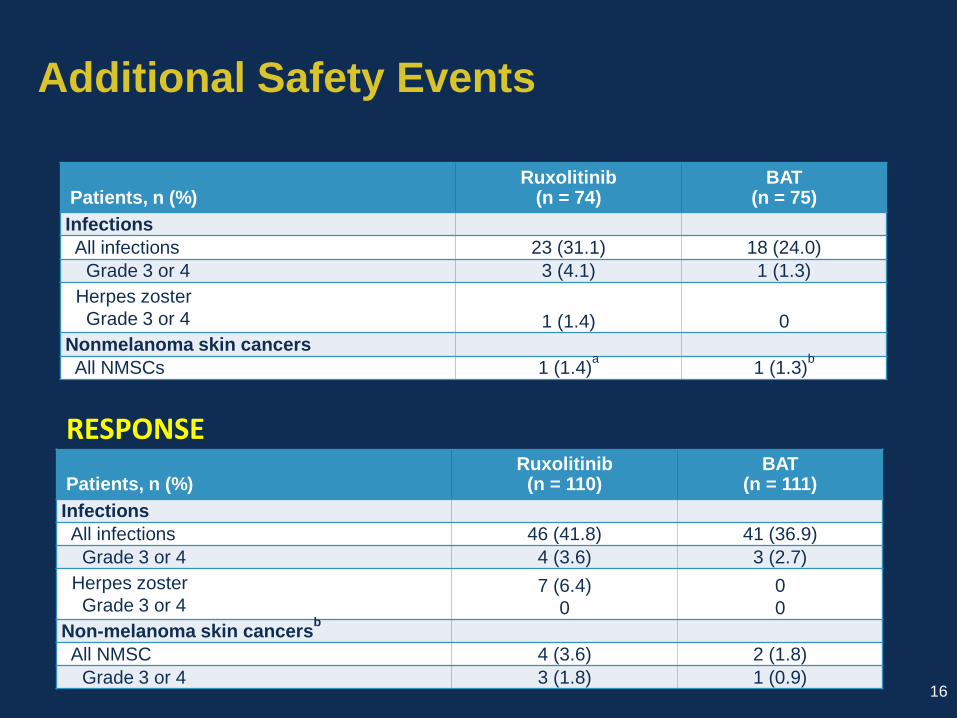
Additional Safety Events
Patients, n (%) Ruxolitinib
(n = 74)BAT
(n = 75)
Infections
All infections 23 (31.1) 18 (24.0)
Grade 3 or 4 3 (4.1) 1 (1.3)
Herpes zoster
Grade 3 or 4 1 (1.4) 0
Nonmelanoma skin cancers
All NMSCs 1 (1.4)a
1 (1.3)b
16
Patients, n (%) Ruxolitinib
(n = 110)BAT
(n = 111)
Infections
All infections 46 (41.8) 41 (36.9)
Grade 3 or 4 4 (3.6) 3 (2.7)
Herpes zoster
Grade 3 or 47 (6.4)
0
0
0
Non-melanoma skin cancersb
All NMSC 4 (3.6) 2 (1.8)
Grade 3 or 4 3 (1.8) 1 (0.9)
RESPONSE
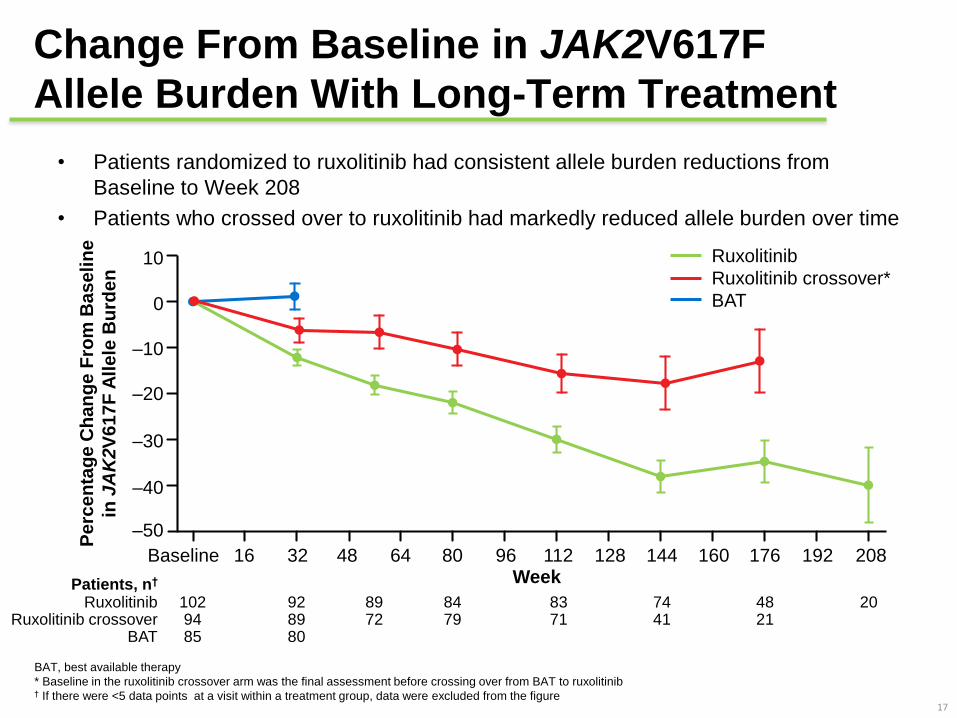
Change From Baseline in JAK2V617F
Allele Burden With Long-Term Treatment
• Patients randomized to ruxolitinib had consistent allele burden reductions from
Baseline to Week 208
• Patients who crossed over to ruxolitinib had markedly reduced allele burden over time
17
BAT, best available therapy
* Baseline in the ruxolitinib crossover arm was the final assessment before crossing over from BAT to ruxolitinib† If there were <5 data points at a visit within a treatment group, data were excluded from the figure
Patients, n†
RuxolitinibRuxolitinib crossover
BAT
102 9485
928980
8972
8479
8371
7441
4821
20
Ruxolitinib
Ruxolitinib crossover*
BAT
Pe
rce
nta
ge
Ch
an
ge
Fro
m B
as
eli
ne
in J
AK
2V
61
7F
All
ele
Bu
rde
n
WeekBaseline 16 32 48 64 80 96 112 128 144 160 176 192 208
–50
–40
–30
–20
–10
0
10
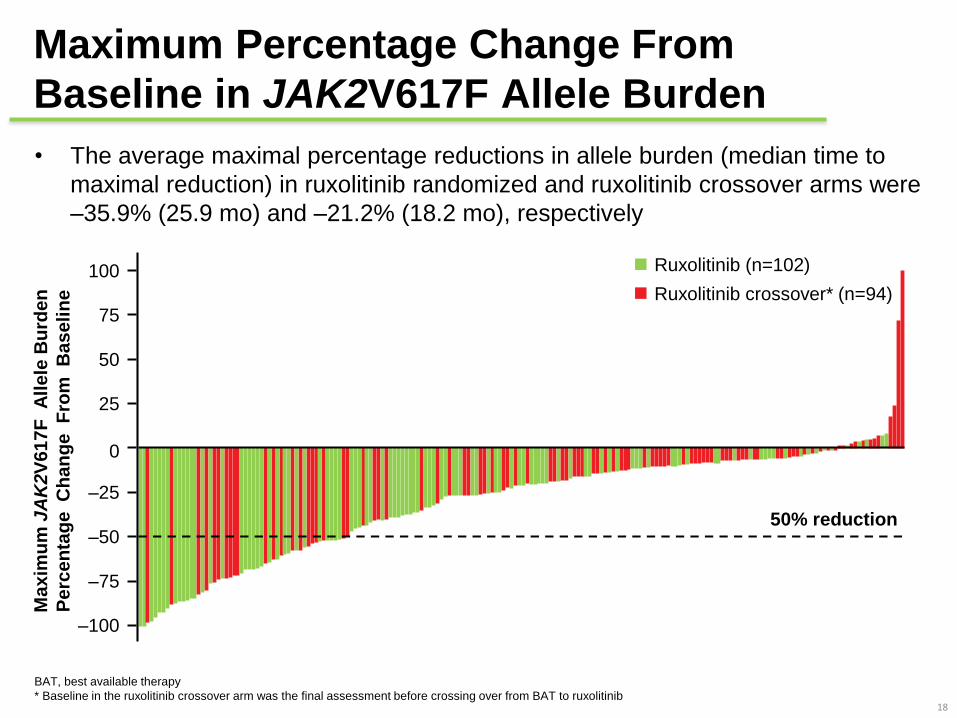
• The average maximal percentage reductions in allele burden (median time to
maximal reduction) in ruxolitinib randomized and ruxolitinib crossover arms were
–35.9% (25.9 mo) and –21.2% (18.2 mo), respectively
Maximum Percentage Change From
Baseline in JAK2V617F Allele Burden
18
BAT, best available therapy
* Baseline in the ruxolitinib crossover arm was the final assessment before crossing over from BAT to ruxolitinib
Ruxolitinib (n=102)
Ruxolitinib crossover* (n=94)
100
75
50
25
0
–25
–50
–75
–100
Ma
xim
um
JA
K2V
617F
All
ele
Bu
rde
n
Pe
rce
nta
ge
C
ha
ng
e F
rom
B
as
eli
ne
50% reduction
JAK2V617F Allele Burden
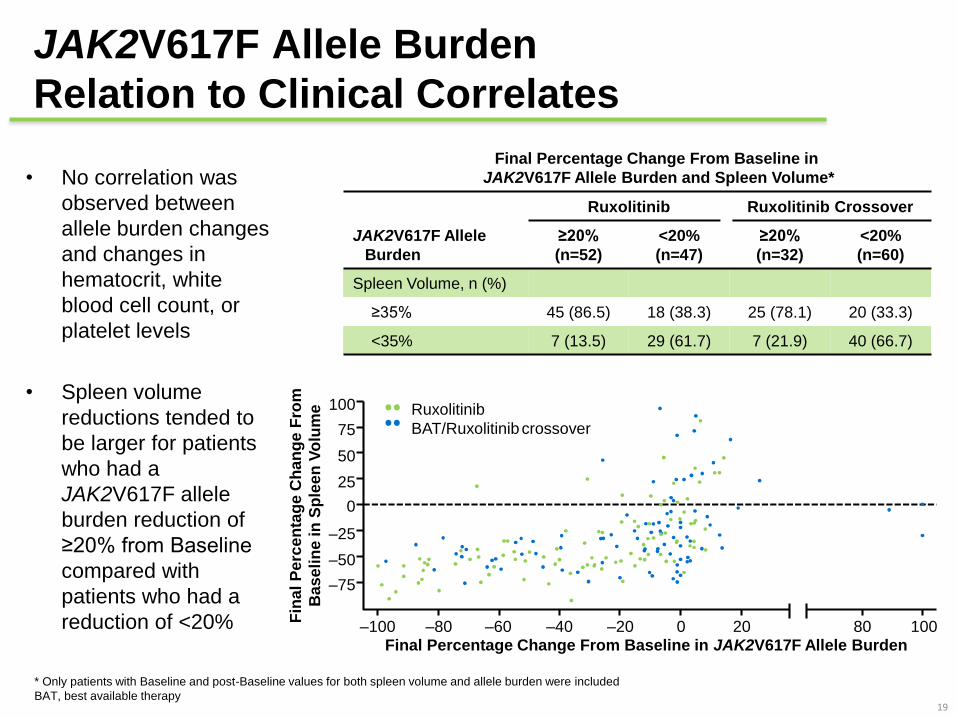
Relation to Clinical Correlates
• No correlation was
observed between
allele burden changes
and changes in
hematocrit, white
blood cell count, or
platelet levels
• Spleen volume
reductions tended to
be larger for patients
who had a
JAK2V617F allele
burden reduction of
≥20% from Baseline
compared with
patients who had a
reduction of <20%
19
Ruxolitinib Ruxolitinib Crossover
JAK2V617F Allele
Burden
≥20%
(n=52)
<20%
(n=47)
≥20%
(n=32)
<20%
(n=60)
Spleen Volume, n (%)
≥35% 45 (86.5) 18 (38.3) 25 (78.1) 20 (33.3)
<35% 7 (13.5) 29 (61.7) 7 (21.9) 40 (66.7)
Final Percentage Change From Baseline in
JAK2V617F Allele Burden and Spleen Volume*
* Only patients with Baseline and post-Baseline values for both spleen volume and allele burden were included
BAT, best available therapy
Ruxolitinib
BAT/Ruxolitinibcrossover
Fin
al
Pe
rce
nta
ge
Ch
an
ge F
rom
Ba
se
lin
e in
Sp
lee
n V
olu
me
–100Final Percentage Change From Baseline in JAK2V617F Allele Burden
–80 –60 –40 –20 0 20 80 100
–75
0
–50
–25
25
50
75
100
Topics
• Gravidanza nella PV
• Outcome of 121 pregnancies in 49 patients with polycythemia vera (PV).
M. Griesshammer et al.
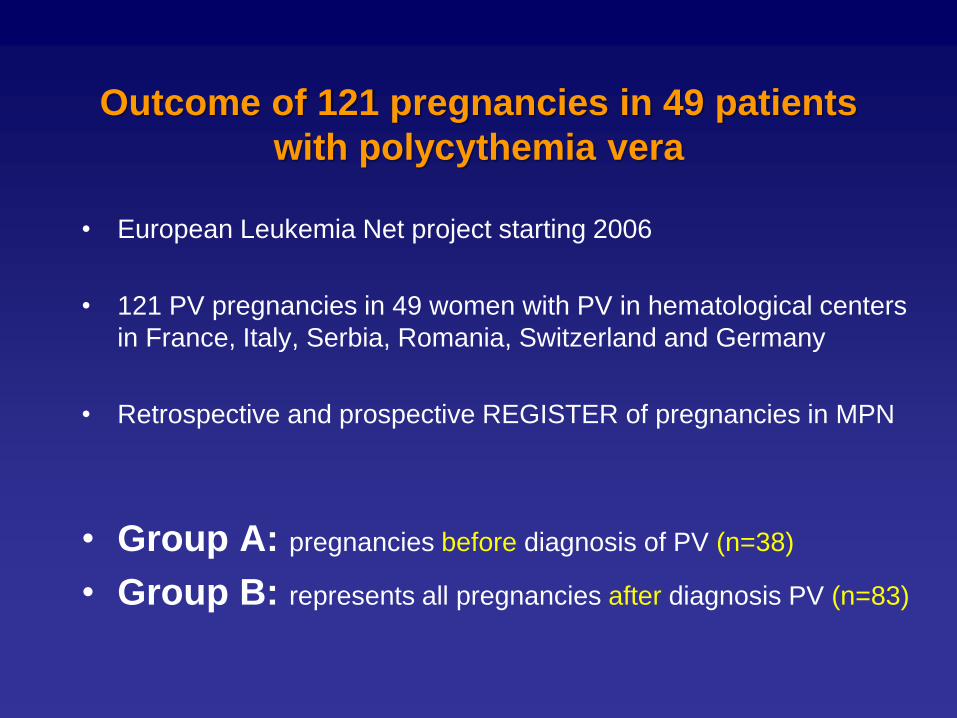
Outcome of 121 pregnancies in 49 patients
with polycythemia vera
• European Leukemia Net project starting 2006
• 121 PV pregnancies in 49 women with PV in hematological centers
in France, Italy, Serbia, Romania, Switzerland and Germany
• Retrospective and prospective REGISTER of pregnancies in MPN
• Group A: pregnancies before diagnosis of PV (n=38)
• Group B: represents all pregnancies after diagnosis PV (n=83)
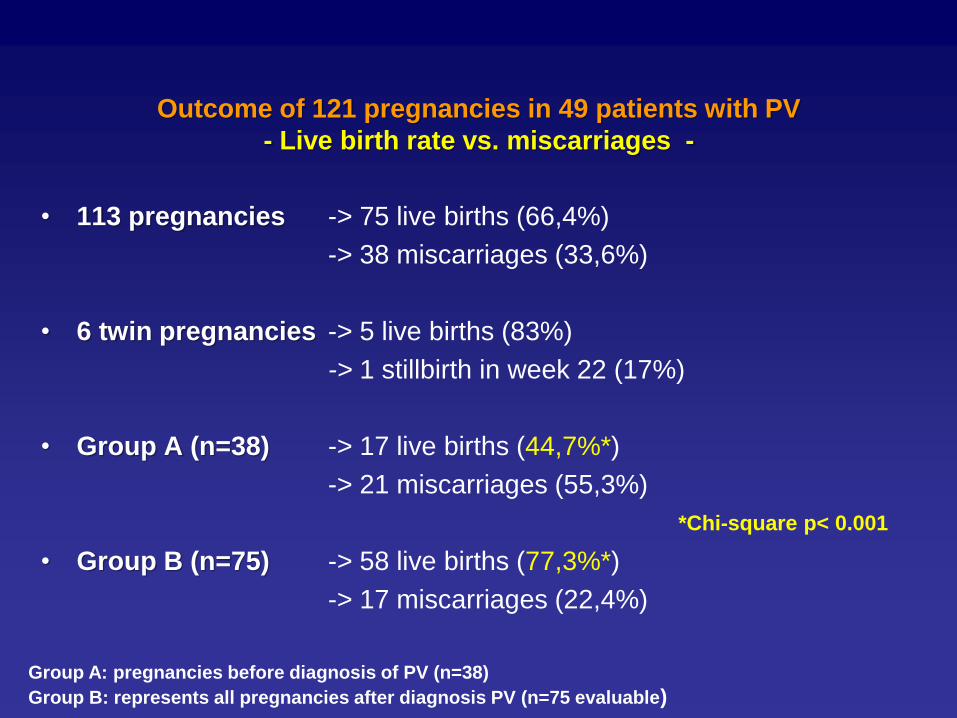
Outcome of 121 pregnancies in 49 patients with PV
- Live birth rate vs. miscarriages -
• 113 pregnancies -> 75 live births (66,4%)
-> 38 miscarriages (33,6%)
• 6 twin pregnancies -> 5 live births (83%)
-> 1 stillbirth in week 22 (17%)
• Group A (n=38) -> 17 live births (44,7%*)
-> 21 miscarriages (55,3%)
• Group B (n=75) -> 58 live births (77,3%*)
-> 17 miscarriages (22,4%)
Group A: pregnancies before diagnosis of PV (n=38)
Group B: represents all pregnancies after diagnosis PV (n=75 evaluable)
*Chi-square p< 0.001
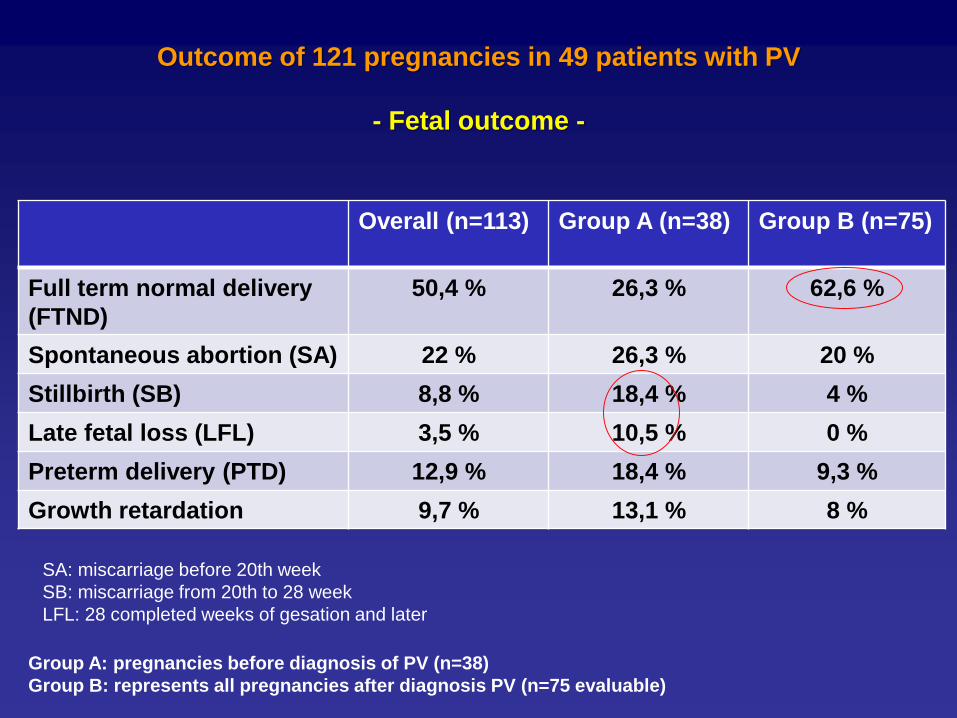
Outcome of 121 pregnancies in 49 patients with PV
- Fetal outcome -
Overall (n=113) Group A (n=38) Group B (n=75)
Full term normal delivery
(FTND)
50,4 % 26,3 % 62,6 %
Spontaneous abortion (SA) 22 % 26,3 % 20 %
Stillbirth (SB) 8,8 % 18,4 % 4 %
Late fetal loss (LFL) 3,5 % 10,5 % 0 %
Preterm delivery (PTD) 12,9 % 18,4 % 9,3 %
Growth retardation 9,7 % 13,1 % 8 %
Group A: pregnancies before diagnosis of PV (n=38)
Group B: represents all pregnancies after diagnosis PV (n=75 evaluable)
SA: miscarriage before 20th week
SB: miscarriage from 20th to 28 week
LFL: 28 completed weeks of gesation and later
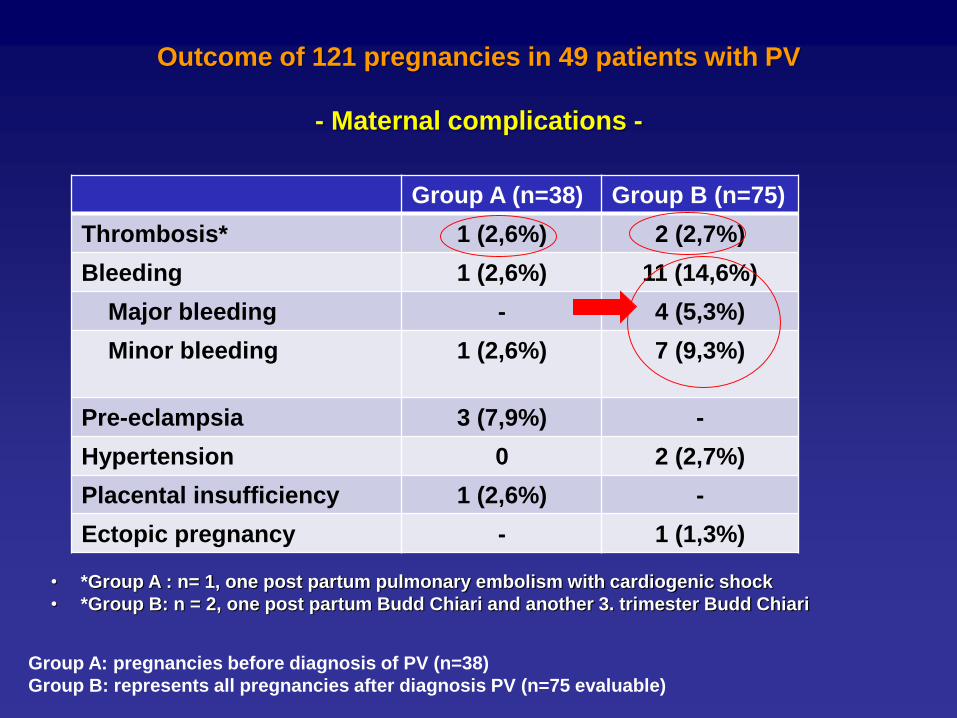
Outcome of 121 pregnancies in 49 patients with PV
- Maternal complications -
Group A (n=38) Group B (n=75)
Thrombosis* 1 (2,6%) 2 (2,7%)
Bleeding 1 (2,6%) 11 (14,6%)
Major bleeding - 4 (5,3%)
Minor bleeding 1 (2,6%) 7 (9,3%)
Pre-eclampsia 3 (7,9%) -
Hypertension 0 2 (2,7%)
Placental insufficiency 1 (2,6%) -
Ectopic pregnancy - 1 (1,3%)
Group A: pregnancies before diagnosis of PV (n=38)
Group B: represents all pregnancies after diagnosis PV (n=75 evaluable)
• *Group A : n= 1, one post partum pulmonary embolism with cardiogenic shock
• *Group B: n = 2, one post partum Budd Chiari and another 3. trimester Budd Chiari
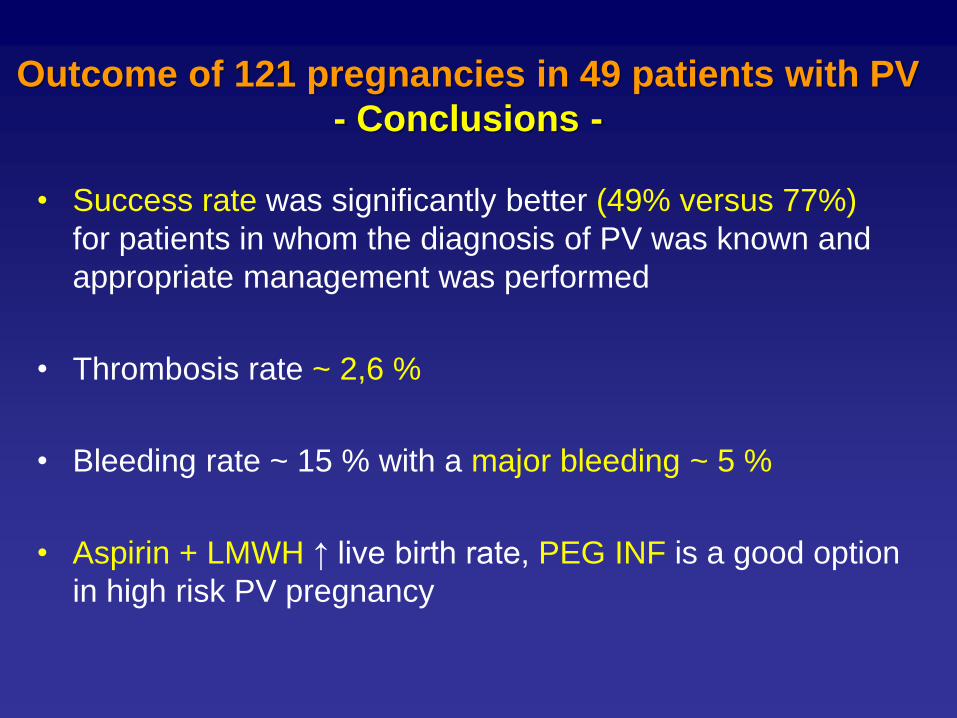
Outcome of 121 pregnancies in 49 patients with PV
- Conclusions -
• Success rate was significantly better (49% versus 77%)
for patients in whom the diagnosis of PV was known and
appropriate management was performed
• Thrombosis rate ~ 2,6 %
• Bleeding rate ~ 15 % with a major bleeding ~ 5 %
• Aspirin + LMWH ↑ live birth rate, PEG INF is a good option
in high risk PV pregnancy
Topics• Efficacia/sicurezza di ruxolitinib - "long-term"
e "expanded access " – nella MF
• Long-Term Outcomes of Ruxolitinib Therapy in Patients With Myelofibrosis:
5-Year Final Efficacy and Safety Analysis From COMFORT-I. Verstovsek et
al.
• SAFETY AND EFFICACY OF RUXOLITINIB IN PATIENTS WITH DIPSS
INTERMEDIATE-1–RISK MYELOFIBROSIS (MF) FROM JUMP: AN
OPEN-LABEL, MULTICENTER, SINGLE-ARM, EXPANDED-ACCESS
STUDY. Passamonti F et al. (poster)
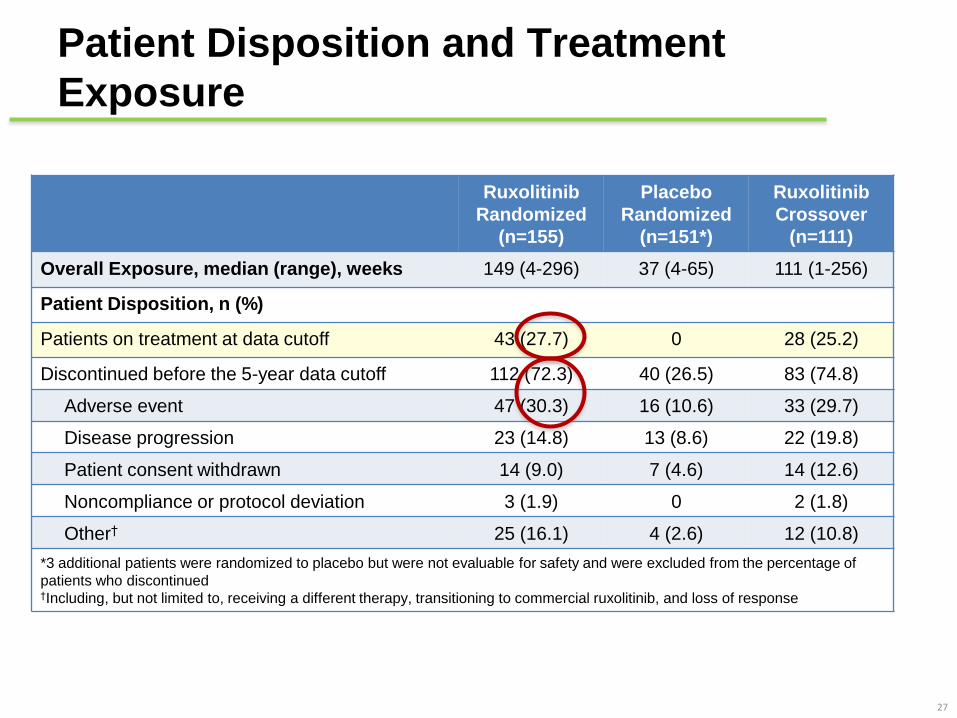
Patient Disposition and Treatment
Exposure
27
Ruxolitinib
Randomized
(n=155)
Placebo
Randomized
(n=151*)
Ruxolitinib
Crossover
(n=111)
Overall Exposure, median (range), weeks 149 (4-296) 37 (4-65) 111 (1-256)
Patient Disposition, n (%)
Patients on treatment at data cutoff 43 (27.7) 0 28 (25.2)
Discontinued before the 5-year data cutoff 112 (72.3) 40 (26.5) 83 (74.8)
Adverse event 47 (30.3) 16 (10.6) 33 (29.7)
Disease progression 23 (14.8) 13 (8.6) 22 (19.8)
Patient consent withdrawn 14 (9.0) 7 (4.6) 14 (12.6)
Noncompliance or protocol deviation 3 (1.9) 0 2 (1.8)
Other† 25 (16.1) 4 (2.6) 12 (10.8)
*3 additional patients were randomized to placebo but were not evaluable for safety and were excluded from the percentage of
patients who discontinued†Including, but not limited to, receiving a different therapy, transitioning to commercial ruxolitinib, and loss of response
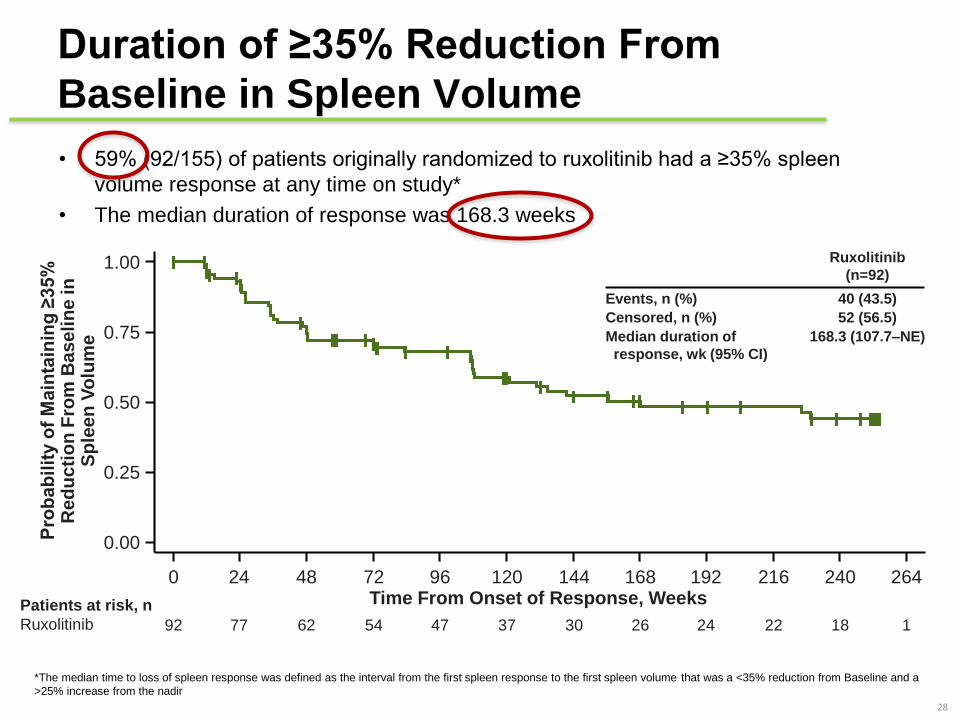
Duration of ≥35% Reduction From
Baseline in Spleen Volume
• 59% (92/155) of patients originally randomized to ruxolitinib had a ≥35% spleen
volume response at any time on study*
• The median duration of response was 168.3 weeks
28
*The median time to loss of spleen response was defined as the interval from the first spleen response to the first spleen volume that was a <35% reduction from Baseline and a
>25% increase from the nadir
Pro
bab
ilit
y o
f M
ain
tain
ing
≥35%
R
ed
uc
tio
n F
rom
Ba
se
lin
e in
S
ple
en
Vo
lum
e
0.00
0.25
0.50
0.75
1.00
0 24 72 96 192168144 240 26448 120 216Time From Onset of Response, WeeksPatients at risk, n
Ruxolitinib 92 77 62 54 47 37 30 26 24 22 18 1
Ruxolitinib
(n=92)
Events, n (%)
Censored, n (%)
Median duration of
response, wk (95% CI)
40 (43.5)
52 (56.5)
168.3 (107.7–NE)
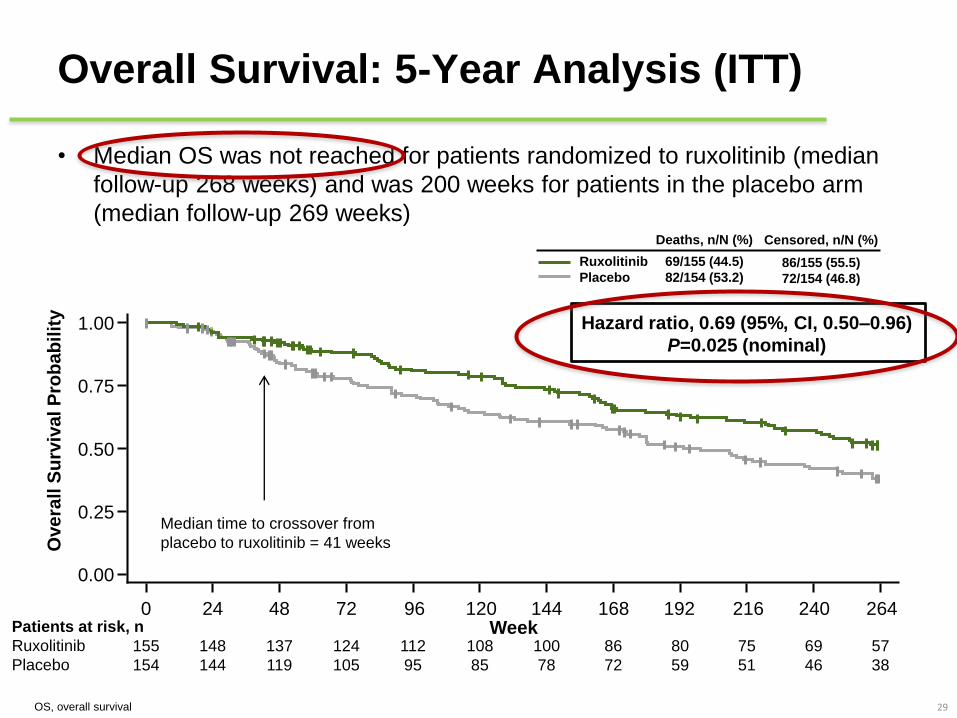
Overall Survival: 5-Year Analysis (ITT)
• Median OS was not reached for patients randomized to ruxolitinib (median
follow-up 268 weeks) and was 200 weeks for patients in the placebo arm
(median follow-up 269 weeks)
29OS, overall survival
Median time to crossover from
placebo to ruxolitinib = 41 weeks
Patients at risk, n
Ruxolitinib
Placebo
155
154
148
144
137
119
124
105
112
95
108
85
100
78
86
72
80
59
75
51
69
46
57
38
Week0 24 72 96 192168144 240 26448 120 216
0.00
0.25
0.50
0.75
1.00
Ove
rall
Su
rviv
al P
rob
ab
ilit
y
Deaths, n/N (%) Censored, n/N (%)
Ruxolitinib
Placebo
69/155 (44.5)
82/154 (53.2)
Hazard ratio, 0.69 (95%, CI, 0.50–0.96)
P=0.025 (nominal)
86/155 (55.5)
72/154 (46.8)
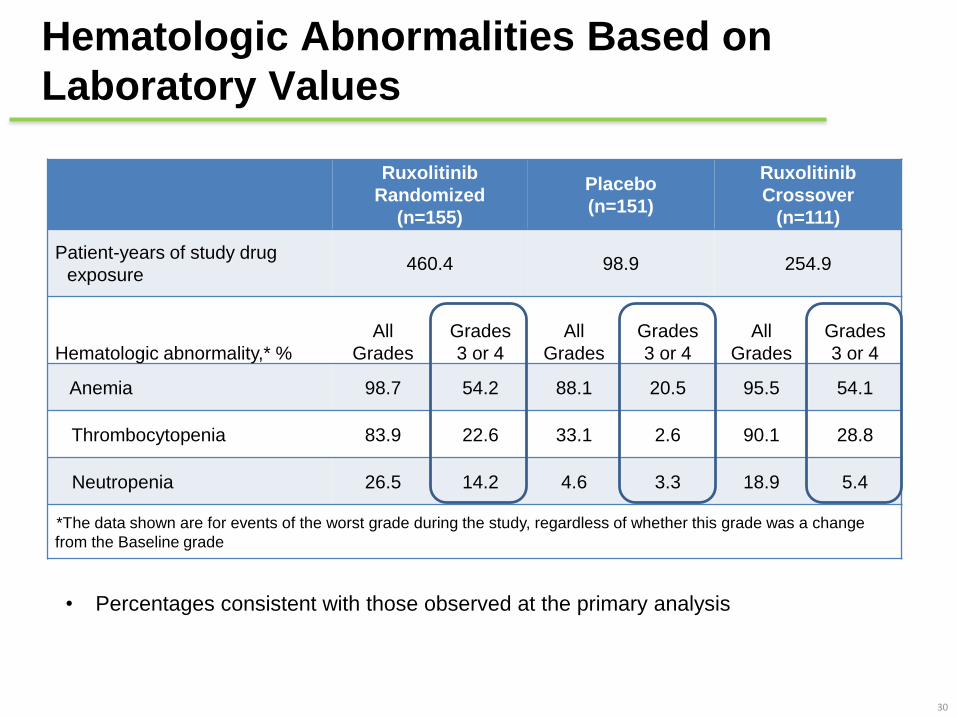
Hematologic Abnormalities Based on
Laboratory Values
30
Ruxolitinib
Randomized
(n=155)
Placebo
(n=151)
Ruxolitinib
Crossover
(n=111)
Patient-years of study drug
exposure460.4 98.9 254.9
Hematologic abnormality,* %
All
Grades
Grades
3 or 4
All
Grades
Grades
3 or 4
All
Grades
Grades
3 or 4
Anemia 98.7 54.2 88.1 20.5 95.5 54.1
Thrombocytopenia 83.9 22.6 33.1 2.6 90.1 28.8
Neutropenia 26.5 14.2 4.6 3.3 18.9 5.4
*The data shown are for events of the worst grade during the study, regardless of whether this grade was a change
from the Baseline grade
• Percentages consistent with those observed at the primary analysis
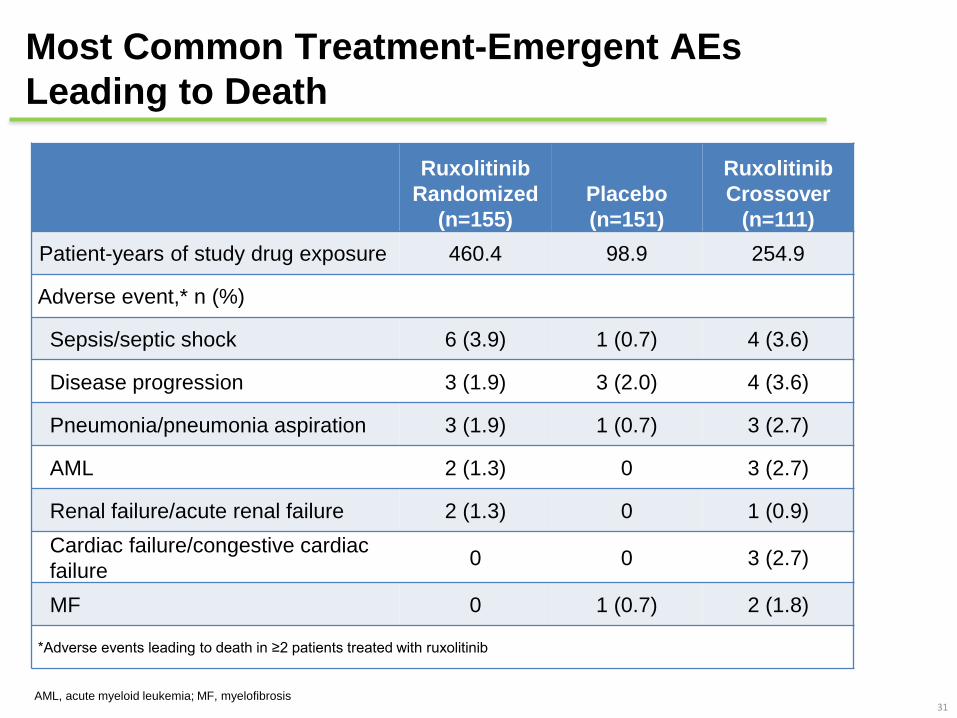
Most Common Treatment-Emergent AEs
Leading to Death
31
Ruxolitinib
Randomized
(n=155)
Placebo
(n=151)
Ruxolitinib
Crossover
(n=111)
Patient-years of study drug exposure 460.4 98.9 254.9
Adverse event,* n (%)
Sepsis/septic shock 6 (3.9) 1 (0.7) 4 (3.6)
Disease progression 3 (1.9) 3 (2.0) 4 (3.6)
Pneumonia/pneumonia aspiration 3 (1.9) 1 (0.7) 3 (2.7)
AML 2 (1.3) 0 3 (2.7)
Renal failure/acute renal failure 2 (1.3) 0 1 (0.9)
Cardiac failure/congestive cardiac
failure0 0 3 (2.7)
MF 0 1 (0.7) 2 (1.8)
*Adverse events leading to death in ≥2 patients treated with ruxolitinib
AML, acute myeloid leukemia; MF, myelofibrosis
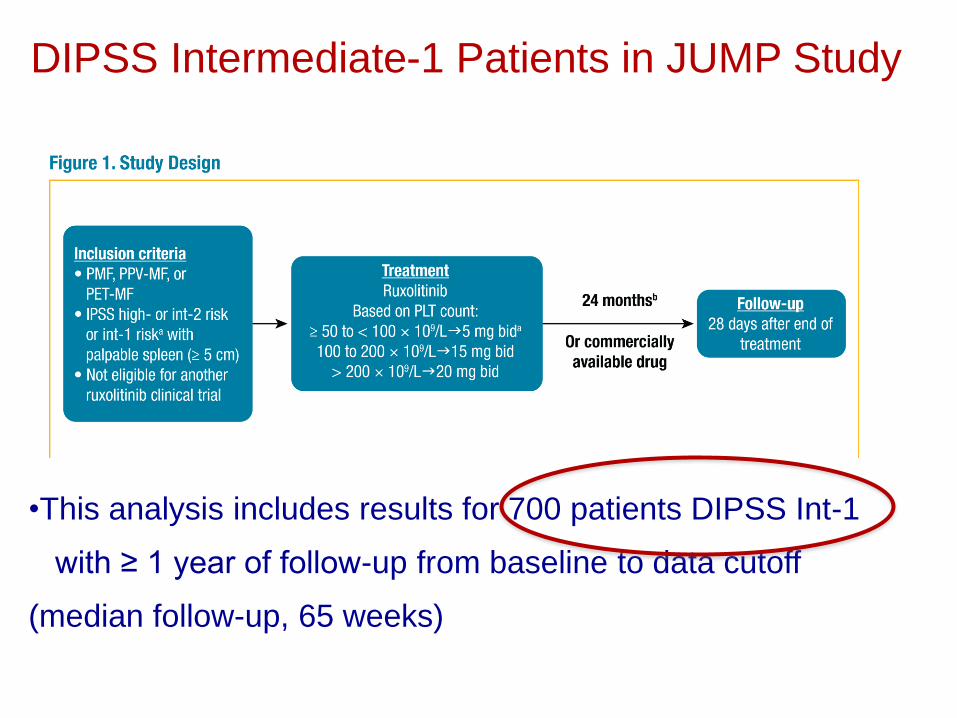
DIPSS Intermediate-1 Patients in JUMP Study
•This analysis includes results for 700 patients DIPSS Int-1
with ≥ 1 year of follow-up from baseline to data cutoff
(median follow-up, 65 weeks)
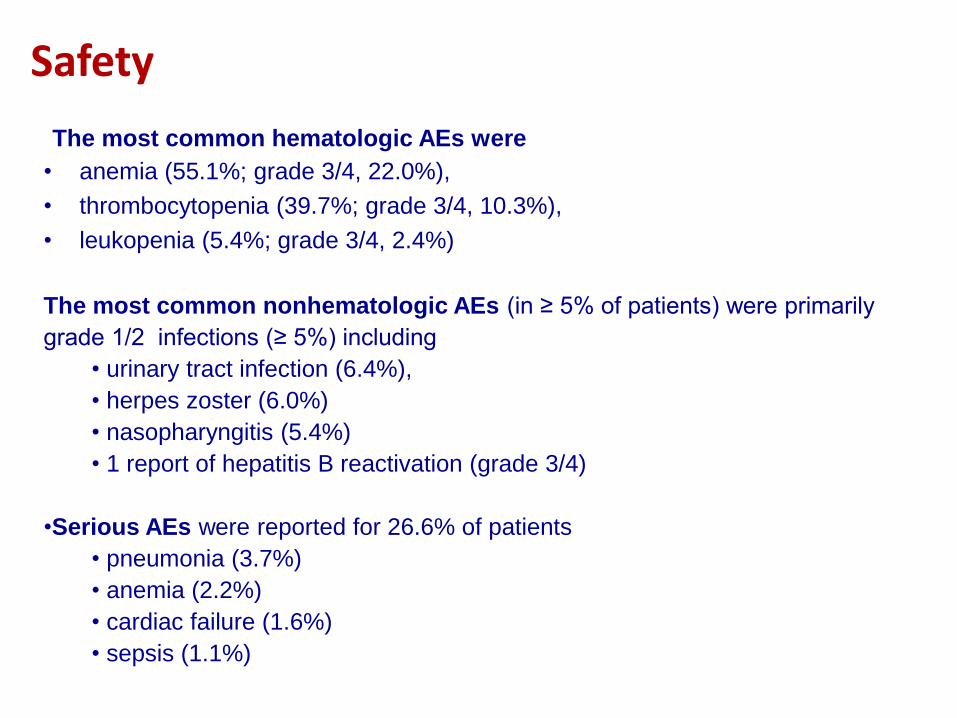
Safety
The most common hematologic AEs were
• anemia (55.1%; grade 3/4, 22.0%),
• thrombocytopenia (39.7%; grade 3/4, 10.3%),
• leukopenia (5.4%; grade 3/4, 2.4%)
The most common nonhematologic AEs (in ≥ 5% of patients) were primarily
grade 1/2 infections (≥ 5%) including
• urinary tract infection (6.4%),
• herpes zoster (6.0%)
• nasopharyngitis (5.4%)
• 1 report of hepatitis B reactivation (grade 3/4)
•Serious AEs were reported for 26.6% of patients
• pneumonia (3.7%)
• anemia (2.2%)
• cardiac failure (1.6%)
• sepsis (1.1%)
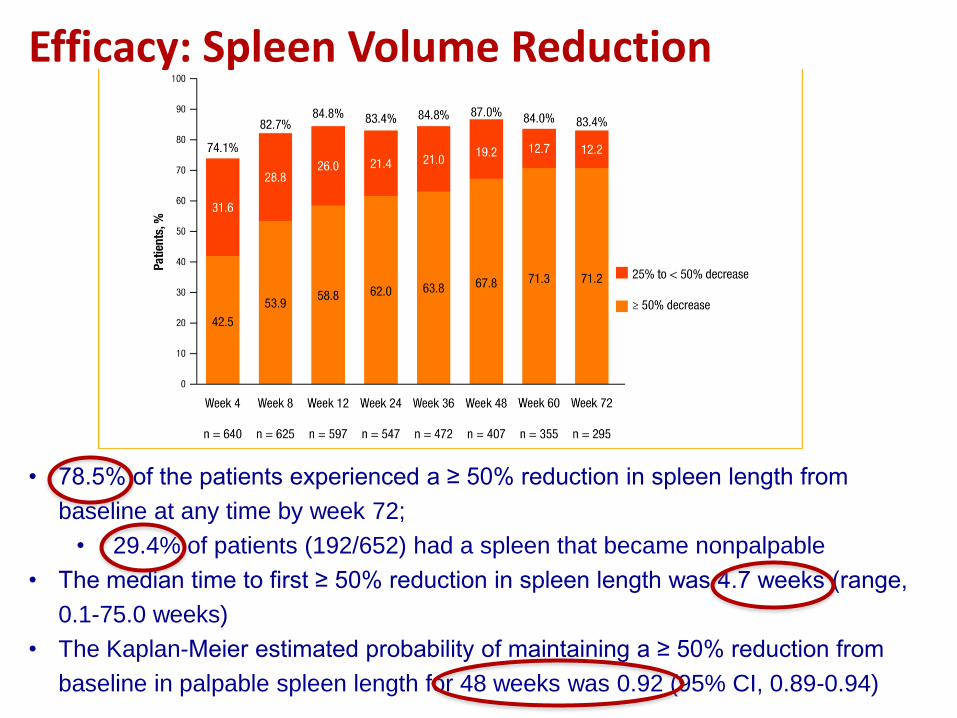
• 78.5% of the patients experienced a ≥ 50% reduction in spleen length from
baseline at any time by week 72;
• 29.4% of patients (192/652) had a spleen that became nonpalpable
• The median time to first ≥ 50% reduction in spleen length was 4.7 weeks (range,
0.1-75.0 weeks)
• The Kaplan-Meier estimated probability of maintaining a ≥ 50% reduction from
baseline in palpable spleen length for 48 weeks was 0.92 (95% CI, 0.89-0.94)
Efficacy: Spleen Volume Reduction
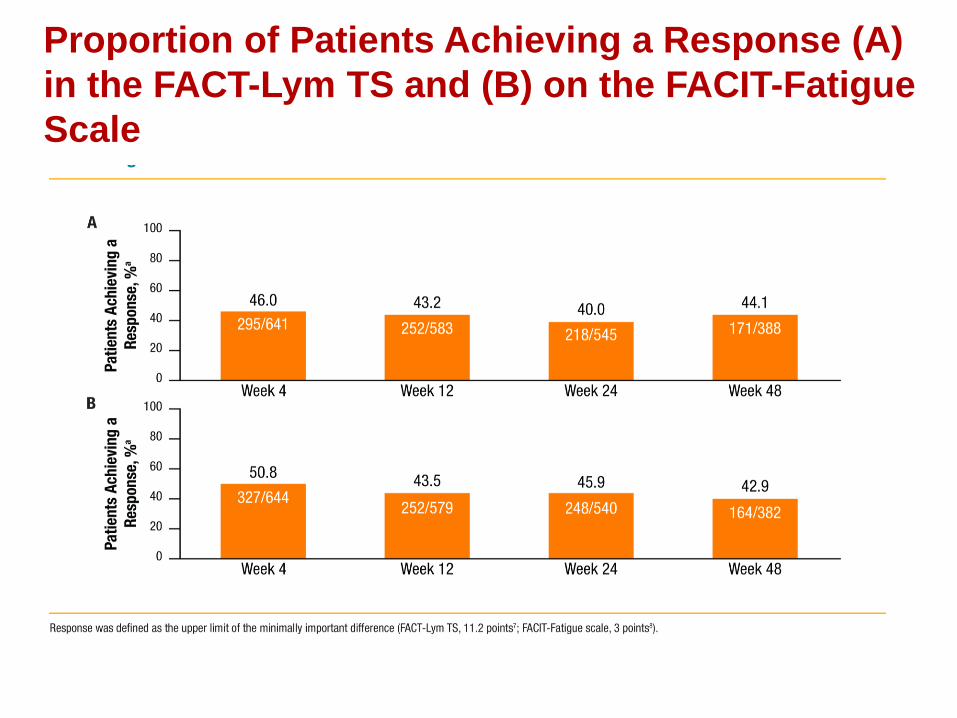
Proportion of Patients Achieving a Response (A)
in the FACT-Lym TS and (B) on the FACIT-Fatigue
Scale
Neoplasie Mieloproliferative
Croniche