neonatal mortality in the developing · pdf filedemographic research: volume 14, article 18...
TRANSCRIPT
Demographic Research a free, expedited, online journal of peer-reviewed research and commentary in the population sciences published by the Max Planck Institute for Demographic Research Konrad-Zuse Str. 1, D-18057 Rostock · GERMANY www.demographic-research.org
DEMOGRAPHIC RESEARCH VOLUME 14, ARTICLE 18, PAGES 429-452 PUBLISHED 23 MAY 2006 http://www.demographic-research.org/Volumes/Vol14/18/ DOI: 10.4054/DemRes.2006.14.18 Research Article
Neonatal mortality in the developing world
Kenneth Hill
Yoonjoung Choi © 2006 Max-Planck-Gesellschaft.
Table of Contents
1 Introduction 430 2 Data 430 3 Methods 432 3.1 Examination of data quality 432 3.2 Adjusting for the effects of age at death heaping 433 3.3 Models based on historical data 435 3.4 Neonatal mortality trends 436 4 Results 437 4.1 Data quality 437 4.2 Comparison of age patterns of neonatal mortality with historical
data 437
4.3 Level of neonatal mortality 441 4.4 Trends in neonatal mortality 442 5 Discussion 443 6 Acknowledgements 445 References 446 Appendix 447
Demographic Research: Volume 14, Article 18
research article
http://www.demographic-research.org 429
Neonatal mortality in the developing world
Kenneth Hill 1
Yoonjoung Choi 2
Abstract
This paper examines age patterns and trends of early and late neonatal mortality in developing countries, using birth history data from the Demographic and Health Surveys (DHS). Data quality was assessed both by examination of internal consistency and by comparison with historic age patterns of neonatal mortality from England and Wales. The median neonatal mortality rate (NMR) across 108 nationally-representative surveys was 33 per 1000 live births. NMR averaged an annual decline of 1.9 % in the 1980s and 1990s. Declines have been faster for late than for early neonatal mortality and slower in Sub-Saharan Africa than in other regions. Age patterns of neonatal mortality were comparable with those of historical data, indicating no significant underreporting of early neonatal deaths in DHS birth histories.
1 Department of Population and Family Health Sciences, Bloomberg School of Public Health, Johns Hopkins University 2 Department of International Health, Bloomberg School of Public Health, Johns Hopkins University
Address for correspondence: Yoonjoung Choi, Department of International Health, Bloomberg School of Public Health, Johns Hopkins University, 615 North Wolfe Street, Baltimore, MD 21205, U.S.A. Email: [email protected].
Hill & Choi: Neonatal mortality in the developing world
430 http://www.demographic-research.org
1. Introduction
Over one third of the global 10.8 million deaths of children under age 5 in the year 2000 occurred in the neonatal period (Black 2003). Declines in neonatal mortality over the last three decades have been slower than declines in postneonatal or early child (1 to 5 years) mortality. In order to achieve the Millennium Development Goal target of a two-thirds reduction in under-five mortality from 1990 to 2015 (United Nations 2001), major reductions are going to be required in neonatal mortality (Lawn 2005). However, few developing countries have vital registration systems that are complete enough to provide accurate estimates of neonatal mortality, or of its early and late components. Causes of death in the neonatal period in the developing world are poorly measured also, though major components are believed to be birth asphyxia, severe infections, complications of prematurity and tetanus (Lawn 2005). The standardized birth histories collected by the Demographic and Health Surveys (DHS), however, conducted in over 58 developing countries over the last two decades, provide information on neonatal deaths by day of age at death. These data could fill the gap in our knowledge of levels, trends and age patterns of neonatal death. However, these data have not been systematically analyzed, primarily because of concerns about data quality, specifically the possible omission from birth histories of children who die in the neonatal period and a tendency to systematically misreport age at death, “heaping” deaths onto age seven days at the expense of neighboring days.
The purpose of this paper is to examine levels, trends and age patterns of neonatal mortality in developing countries. Of particular interest for both substantive and data quality assessment reasons are relations between early neonatal and neonatal mortality and between neonatal and infant mortality, by overall level of infant mortality. Specific aims are: (1) examining DHS data quality by computing indicators of internal consistency and by comparing patterns of early childhood mortality with historical series; and (2) exposing the magnitude of the problem of neonatal mortality by estimating indicators, adjusted for errors in age at death reporting, of early and late neonatal mortality and postneonatal mortality and calculating recent trends in these indicators.
2. Data
Data come from the full birth histories collected from eligible women aged 15 to 49 years in sampled households by Demographic and Health Surveys (DHS). For each live birth, the month and year of the birth are reported. If the child has died, the mother is asked for the age of the child at death: in days for deaths in the first 28 days of life, in
Demographic Research: Volume 14, Article 18
http://www.demographic-research.org 431
months for deaths between 1 and 23 months, and in years for deaths at ages 2 and over. Here we report on patterns of neonatal mortality from 108 DHS’s conducted in 58 countries, including 26 countries with only a single survey and 32 countries with multiple surveys. In addition to national surveys, the 1992-93 and 1997-98 National Family Health Surveys of India used samples large enough to support a state-level analysis for most states, so we include a state level analysis for India.
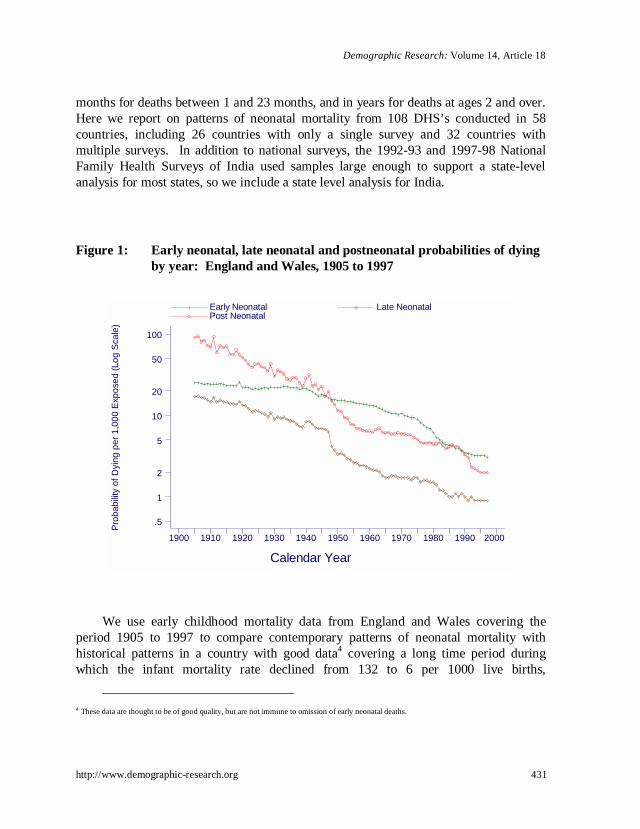
Figure 1: Early neonatal, late neonatal and postneonatal probabilities of dying by year: England and Wales, 1905 to 1997
Pro
babi
lity
of D
ying
per
1,0
00 E
xpos
ed (
Log
Sca
le)
Calendar Year
Early Neonatal Late Neonatal Post Neonatal
1900 1910 1920 1930 1940 1950 1960 1970 1980 1990 2000
.5
1
2
5
10
20
50
100
We use early childhood mortality data from England and Wales covering the
period 1905 to 1997 to compare contemporary patterns of neonatal mortality with historical patterns in a country with good data4 covering a long time period during which the infant mortality rate declined from 132 to 6 per 1000 live births,
4 These data are thought to be of good quality, but are not immune to omission of early neonatal deaths.
Hill & Choi: Neonatal mortality in the developing world
432 http://www.demographic-research.org
encompassing the levels of almost all the contemporary DHS’s. Trends of early neonatal (ENMR), late neonatal (LNMR) and postneonatal (PNMR) mortality in England and Wales are illustrated (Figure1). On a logarithmic scale, the sequences for LNMR and PNMR approximately follow parallel straight lines, indicating approximately equal rates of decline. The ENMR, however, shows a very different pattern, with very slow decline to about 1950, somewhat faster decline to about 1975, and then sharply faster decline since 1975.
3. Methods
In this paper, an early neonatal death is any death before seven completed days of life, a neonatal death is any death before 28 completed days and an infant death is any death before first birthday. The measures we calculate here are probabilities of dying: thus the ENMR is the probability of dying by age seven days, the LNMR is the conditional probability of dying between seven and 28 days, and the neonatal mortality rate (NMR) is the probability of dying by age 28 days. The measures are calculated for the birth cohort born between two months and five years before a given survey, and are thus averages over an approximately 5 year period. For some surveys with relatively small samples in low mortality settings, the numbers of deaths reported over a 5 year period are small. In general, we have restricted analysis to countries with at least 30 neonatal deaths in the reference period. We have categorized countries by WHO regions (subdivided in the case of Africa, and combined in the case of South-East Asia and the Western Pacific; see Table A1 for the countries included) to explore differences in patterns by area.
3.1 Examination of data quality
As noted in the Introduction, we anticipate two types of data error that may have a major impact on measures of early neonatal and overall neonatal mortality: omission of live births that die in the first few days of life; and “heaping” on age at death 7 days (which in the case of a death at less than 7 days removes a death from the early neonatal category and adds it to the late neonatal category). Substantial omission might be evident from implausibly low ratios of early to late neonatal mortality risks, whereas “heaping” will be evident from an examination of the distribution of neonatal deaths by day of death. To quantify the magnitude of the preference for using certain digits to report age at death we have calculated a simple “heaping index,” the number of deaths at seven days divided by one-fifth of the deaths at ages 5 to 9 days. Table 1 shows that
Demographic Research: Volume 14, Article 18
http://www.demographic-research.org 433
the “heaping index,” which should fall somewhere close to 1.0 in the absence of error if the number of deaths by day is a linear function, exceeds 1.5 in 79 out of 106 surveys. Similar calculations cannot be made for the next age of interest, 28 days, because the unit used in DHS surveys to report age at death changes at this point from days to months.
Table 1: Numbers of surveys by index of heaping on seven days by WHO region
Heaping Index Region
< 0.5 0.5 - 1.5 1.5 – 2.5 2.5 – 3.5 > 3.5 Total
Africa, East & South 0 1 1 17 7 26
Africa, Central & West 0 9 14 2 1 26
Latin America 3 6 13 3 0 25 a
N. Africa & Middle East 0 0 2 6 1 9
Europe 2 1 2 0 1 6 a
South-East Asia & Western 0 5 5 4 0 14
Total 5 22 37 32 10 106
a One survey from the Americas (Dominican Republic 1999) and one from Central Asia (Kazakhstan 1995) were excluded from this table because the number of (sample-weighted) neonatal deaths was less than 30
3.2 Adjusting for the effects of age at death heaping
The substantial heaping of deaths at seven days in many DHS’s and evident from the “heaping index” shifts early neonatal deaths into the late neonatal category, biasing the ENMR downwards and the LNMR upwards. Table A2 presents reported number of deaths by day and month for selected surveys.
Our approach to redistributing deaths from 7 days to surrounding ages at death was to assume that the number of deaths by day declines exponentially between exact ages 5 days and 10 days, and to fit such a function to cumulated deaths up to exactly five days (D(5)) and 10 days (D(10)). There is no straightforward way to fit the exponential distribution function to cumulated deaths. However, simulations using models with a range of rates of decline in numbers of deaths by day indicated that the ratio of D(7), deaths up to seven days, to D(10) can be estimated (for hazards within a plausible range) from the ratio of D(5) to D(10) from the following regression equation:
Hill & Choi: Neonatal mortality in the developing world
434 http://www.demographic-research.org
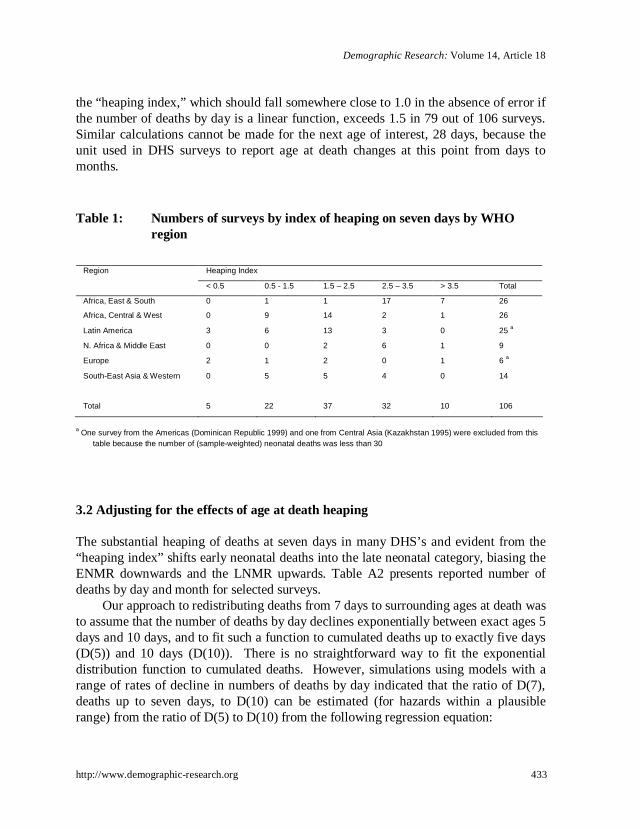
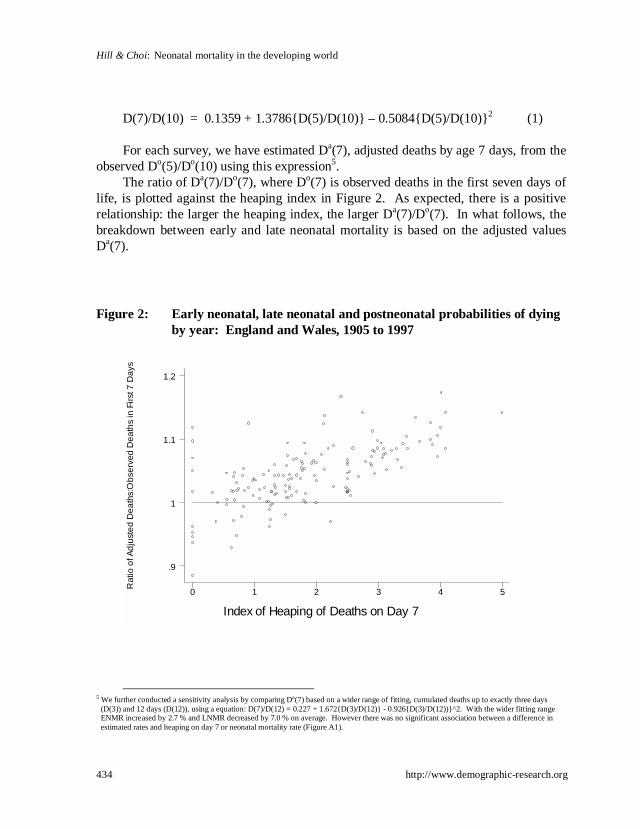
D(7)/D(10) = 0.1359 + 1.3786{D(5)/D(10)} – 0.5084{D(5)/D(10)}2 (1) For each survey, we have estimated Da(7), adjusted deaths by age 7 days, from the
observed Do(5)/Do(10) using this expression5. The ratio of Da(7)/Do(7), where Do(7) is observed deaths in the first seven days of
life, is plotted against the heaping index in Figure 2. As expected, there is a positive relationship: the larger the heaping index, the larger Da(7)/Do(7). In what follows, the breakdown between early and late neonatal mortality is based on the adjusted values Da(7).
Figure 2: Early neonatal, late neonatal and postneonatal probabilities of dying by year: England and Wales, 1905 to 1997
Rat
io o
f Ad
just
ed
De
ath
s:O
bse
rved
De
ath
s in
Fir
st 7
Da
ys
Index of Heaping of Deaths on Day 7
0 1 2 3 4 5
.9
1
1.1
1.2
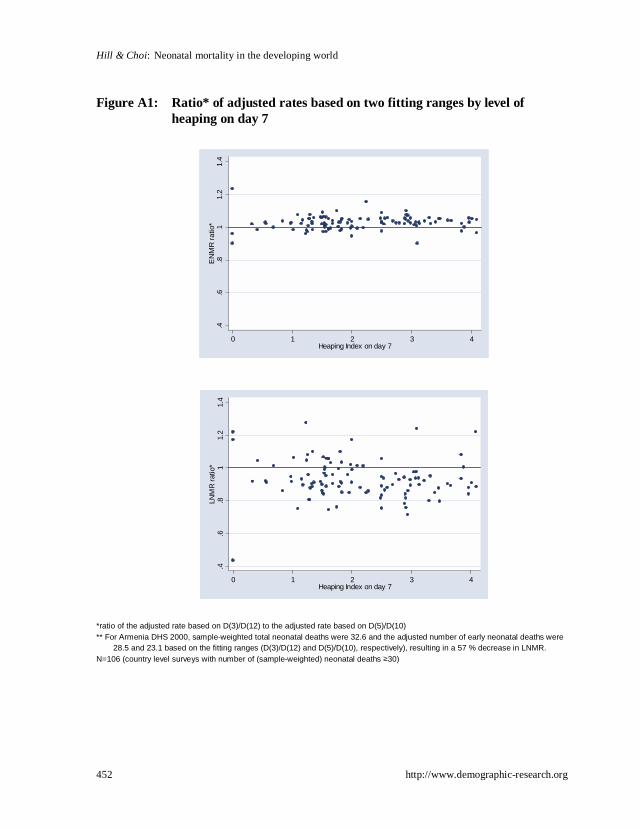
5 We further conducted a sensitivity analysis by comparing Da(7) based on a wider range of fitting, cumulated deaths up to exactly three days
(D(3)) and 12 days (D(12)), using a equation: D(7)/D(12) = 0.227 + 1.672{D(3)/D(12)} - 0.926{D(3)/D(12))}^2. With the wider fitting range ENMR increased by 2.7 % and LNMR decreased by 7.0 % on average. However there was no significant association between a difference in estimated rates and heaping on day 7 or neonatal mortality rate (Figure A1).
Demographic Research: Volume 14, Article 18
http://www.demographic-research.org 435
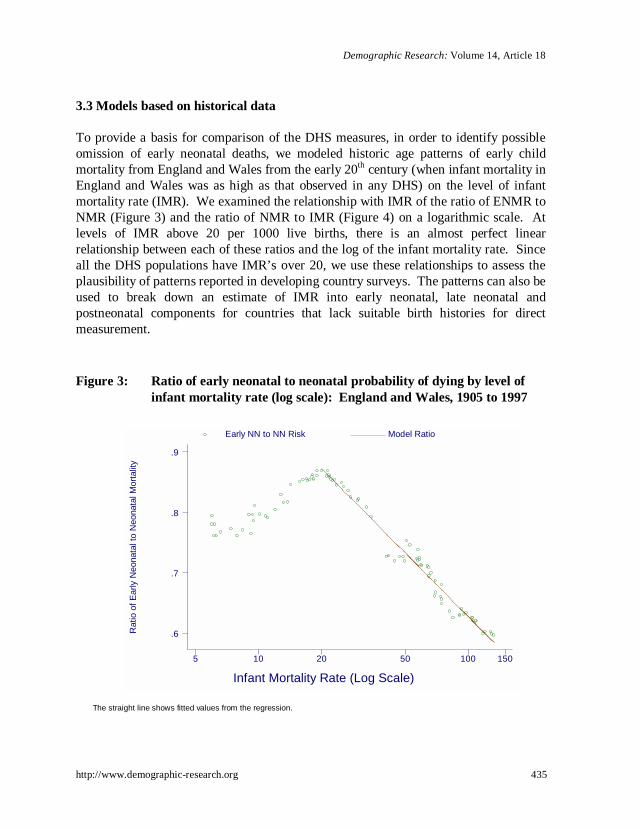
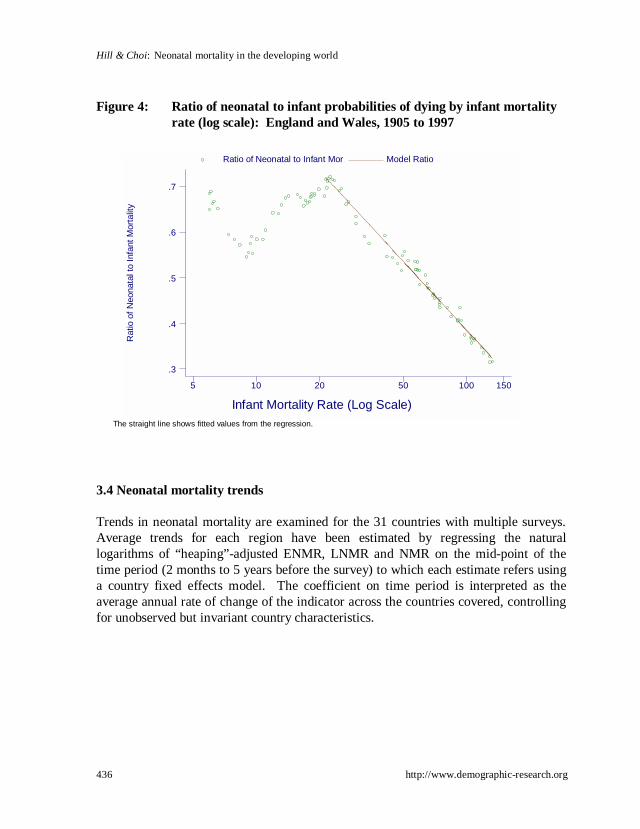
3.3 Models based on historical data
To provide a basis for comparison of the DHS measures, in order to identify possible omission of early neonatal deaths, we modeled historic age patterns of early child mortality from England and Wales from the early 20th century (when infant mortality in England and Wales was as high as that observed in any DHS) on the level of infant mortality rate (IMR). We examined the relationship with IMR of the ratio of ENMR to NMR (Figure 3) and the ratio of NMR to IMR (Figure 4) on a logarithmic scale. At levels of IMR above 20 per 1000 live births, there is an almost perfect linear relationship between each of these ratios and the log of the infant mortality rate. Since all the DHS populations have IMR’s over 20, we use these relationships to assess the plausibility of patterns reported in developing country surveys. The patterns can also be used to break down an estimate of IMR into early neonatal, late neonatal and postneonatal components for countries that lack suitable birth histories for direct measurement.
Figure 3: Ratio of early neonatal to neonatal probability of dying by level of infant mortality rate (log scale): England and Wales, 1905 to 1997
Rat
io o
f E
arly
Neo
nata
l to
Neo
nata
l Mor
talit
y
Infant Mortality Rate (Log Scale)
Early NN to NN Risk Model Ratio
5 10 20 50 100 150
.6
.7
.8
.9
The straight line shows fitted values from the regression.
Hill & Choi: Neonatal mortality in the developing world
436 http://www.demographic-research.org
Figure 4: Ratio of neonatal to infant probabilities of dying by infant mortality rate (log scale): England and Wales, 1905 to 1997
Rat
io o
f Neo
nata
l to
Infa
nt M
orta
lity
Infant Mortality Rate (Log Scale)
Ratio of Neonatal to Infant Mor Model Ratio
5 10 20 50 100 150
.3
.4
.5
.6
.7
The straight line shows fitted values from the regression.
3.4 Neonatal mortality trends
Trends in neonatal mortality are examined for the 31 countries with multiple surveys. Average trends for each region have been estimated by regressing the natural logarithms of “heaping”-adjusted ENMR, LNMR and NMR on the mid-point of the time period (2 months to 5 years before the survey) to which each estimate refers using a country fixed effects model. The coefficient on time period is interpreted as the average annual rate of change of the indicator across the countries covered, controlling for unobserved but invariant country characteristics.
Demographic Research: Volume 14, Article 18
http://www.demographic-research.org 437
4. Results
4.1 Data quality
Table 1 showed the heaping indices summarized by WHO regions. In the absence of error, this index would be close to 1.0. For example, assuming an exponential rate of decline of numbers of deaths by day of 0.2, such that the number of deaths on day 9 would be less than half the number on day 5, the ratio would be 0.96. For a typical DHS with a sample of 10,000 households, a crude birth rate of 30 per 1,000 and a mortality rate between day 5 and day 10 of 20 per 1,000 survivors to age 5, the 95% confidence intervals around the ratio would be approximately ± 0.3, making values outside the range 0.66 to 1.26 unlikely to be the result of chance. In 40 % of the surveys, however, the index exceeds 2.5, implying that one-half or more of all deaths between five and nine days are reported at seven days. Reporting quality varies by region, being worst in South-East Africa (92 % ≥ 2.5) and the Middle East (78 % ≥ 2.5). Digital preference is quite modest in the Indian surveys, with the heaping index never exceeding 2.5, and there is no strong evidence of a difference between two broad regions, North and East versus South and West, of the country6.
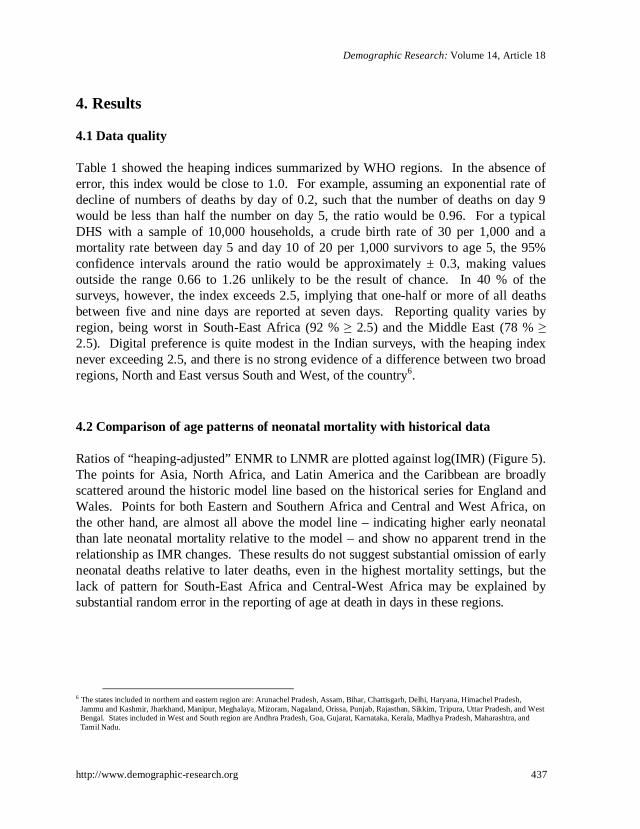
4.2 Comparison of age patterns of neonatal mortality with historical data
Ratios of “heaping-adjusted” ENMR to LNMR are plotted against log(IMR) (Figure 5). The points for Asia, North Africa, and Latin America and the Caribbean are broadly scattered around the historic model line based on the historical series for England and Wales. Points for both Eastern and Southern Africa and Central and West Africa, on the other hand, are almost all above the model line – indicating higher early neonatal than late neonatal mortality relative to the model – and show no apparent trend in the relationship as IMR changes. These results do not suggest substantial omission of early neonatal deaths relative to later deaths, even in the highest mortality settings, but the lack of pattern for South-East Africa and Central-West Africa may be explained by substantial random error in the reporting of age at death in days in these regions.
6 The states included in northern and eastern region are: Arunachel Pradesh, Assam, Bihar, Chattisgarh, Delhi, Haryana, Himachel Pradesh,
Jammu and Kashmir, Jharkhand, Manipur, Meghalaya, Mizoram, Nagaland, Orissa, Punjab, Rajasthan, Sikkim, Tripura, Uttar Pradesh, and West Bengal. States included in West and South region are Andhra Pradesh, Goa, Gujarat, Karnataka, Kerala, Madhya Pradesh, Maharashtra, and Tamil Nadu.
Hill & Choi: Neonatal mortality in the developing world
438 http://www.demographic-research.org
Figure 5: Ratio of adjusted early neonatal to late neonatal mortality by level of infant mortality rate: DHS Country Surveys (N=106)
.5.6
.7.8
.9R
atio
of
Ear
ly t
o La
te N
eona
tal M
orta
lity
.015 .03 .05 .1 .15Infant Mortality Rate
South & East Africa Central & West AfricaLatin America & Caribbean Asia & North AfricaEngland and Wales Model
The straight line is the England and Wales model relationship.
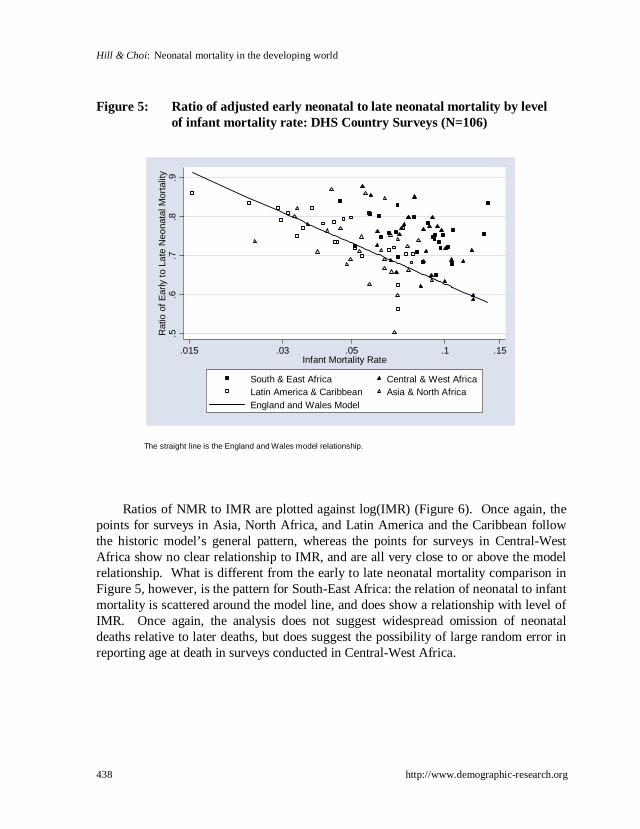
Ratios of NMR to IMR are plotted against log(IMR) (Figure 6). Once again, the
points for surveys in Asia, North Africa, and Latin America and the Caribbean follow the historic model’s general pattern, whereas the points for surveys in Central-West Africa show no clear relationship to IMR, and are all very close to or above the model relationship. What is different from the early to late neonatal mortality comparison in Figure 5, however, is the pattern for South-East Africa: the relation of neonatal to infant mortality is scattered around the model line, and does show a relationship with level of IMR. Once again, the analysis does not suggest widespread omission of neonatal deaths relative to later deaths, but does suggest the possibility of large random error in reporting age at death in surveys conducted in Central-West Africa.
Demographic Research: Volume 14, Article 18
http://www.demographic-research.org 439
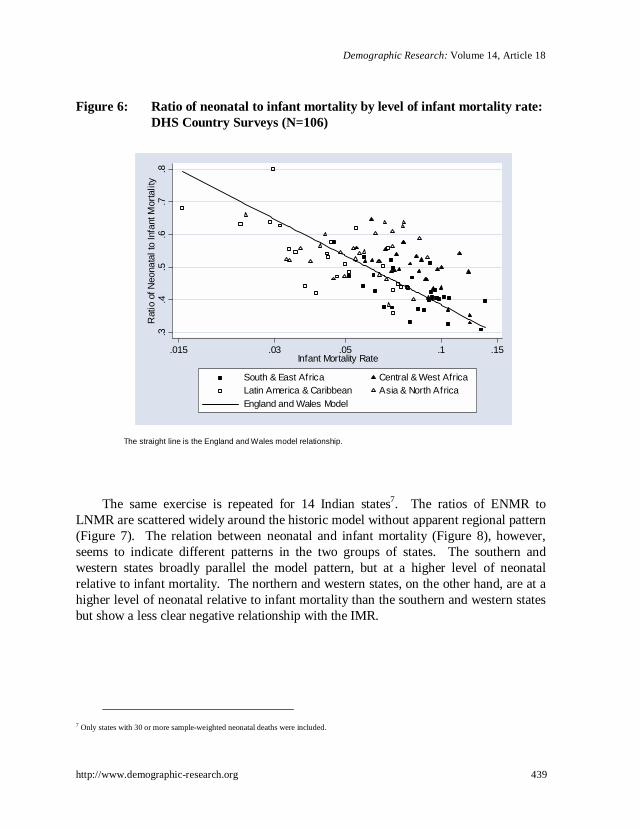
Figure 6: Ratio of neonatal to infant mortality by level of infant mortality rate: DHS Country Surveys (N=106)
.3
.4.5
.6.7
.8R
atio
of N
eona
tal t
o In
fant
Mor
talit
y
.015 .03 .05 .1 .15Infant Mortality Rate
South & East Africa Central & West AfricaLatin America & Caribbean Asia & North AfricaEngland and Wales Model
The straight line is the England and Wales model relationship.
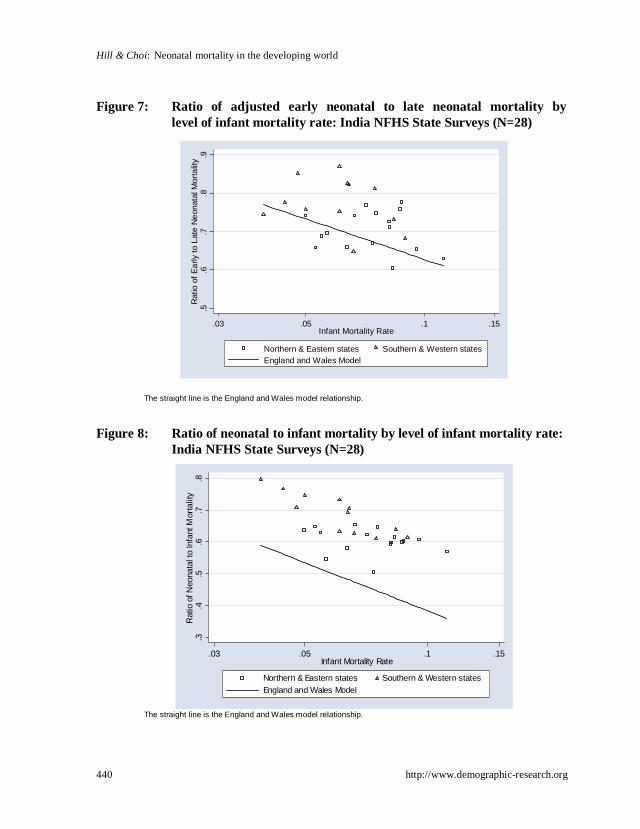
The same exercise is repeated for 14 Indian states7. The ratios of ENMR to
LNMR are scattered widely around the historic model without apparent regional pattern (Figure 7). The relation between neonatal and infant mortality (Figure 8), however, seems to indicate different patterns in the two groups of states. The southern and western states broadly parallel the model pattern, but at a higher level of neonatal relative to infant mortality. The northern and western states, on the other hand, are at a higher level of neonatal relative to infant mortality than the southern and western states but show a less clear negative relationship with the IMR.
7 Only states with 30 or more sample-weighted neonatal deaths were included.
Hill & Choi: Neonatal mortality in the developing world
440 http://www.demographic-research.org
Figure 7: Ratio of adjusted early neonatal to late neonatal mortality by level of infant mortality rate: India NFHS State Surveys (N=28)
.5.6
.7.8
.9R
atio
of E
arly
to L
ate
Neo
nata
l Mor
talit
y
.03 .05 .1 .15Infant Mortality Rate
Northern & Eastern states Southern & Western statesEngland and Wales Model
The straight line is the England and Wales model relationship.
Figure 8: Ratio of neonatal to infant mortality by level of infant mortality rate: India NFHS State Surveys (N=28)
.3.4
.5.6
.7.8
Rat
io o
f Neo
nata
l to
Infa
nt M
orta
lity
.03 .05 .1 .15Infant Mortality Rate
Northern & Eastern states Southern & Western statesEngland and Wales Model
The straight line is the England and Wales model relationship.
Demographic Research: Volume 14, Article 18
http://www.demographic-research.org 441
4.3 Level of neonatal mortality
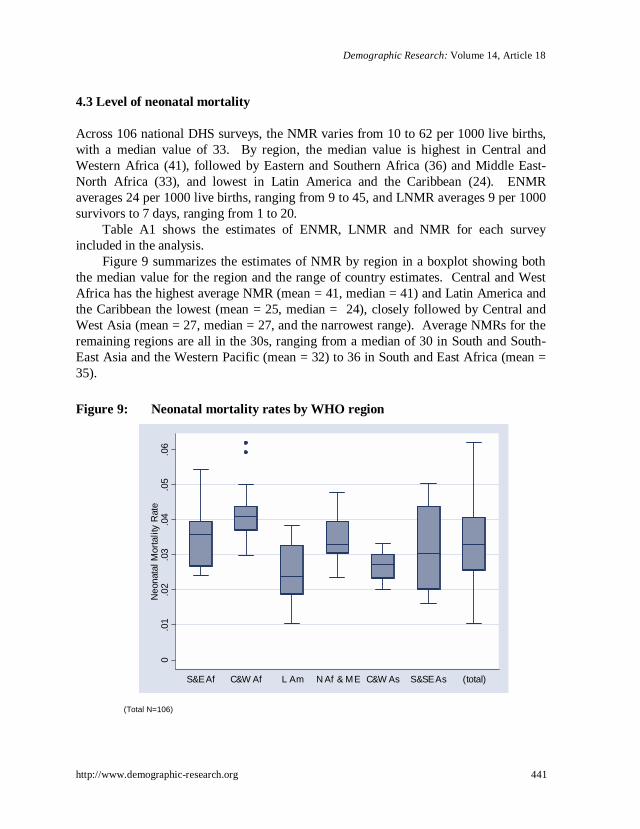
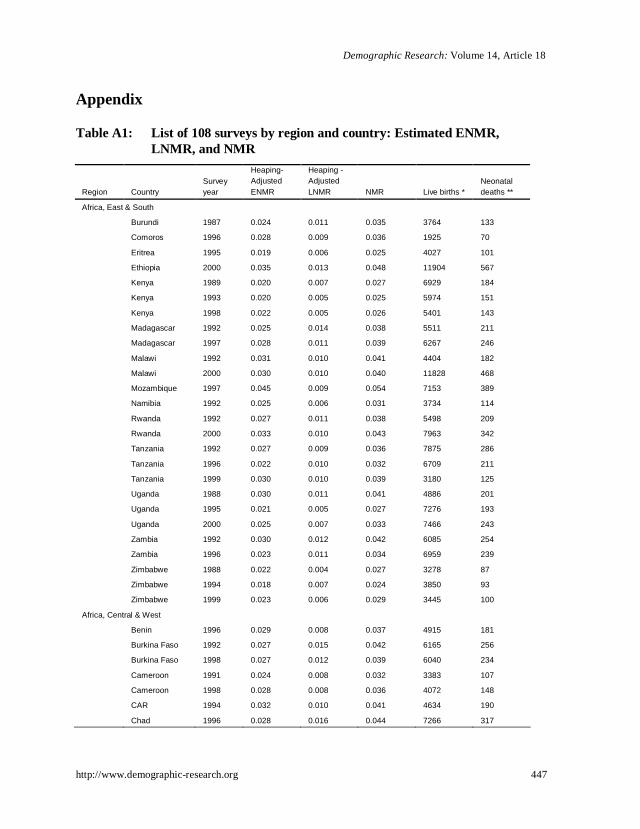
Across 106 national DHS surveys, the NMR varies from 10 to 62 per 1000 live births, with a median value of 33. By region, the median value is highest in Central and Western Africa (41), followed by Eastern and Southern Africa (36) and Middle East-North Africa (33), and lowest in Latin America and the Caribbean (24). ENMR averages 24 per 1000 live births, ranging from 9 to 45, and LNMR averages 9 per 1000 survivors to 7 days, ranging from 1 to 20.
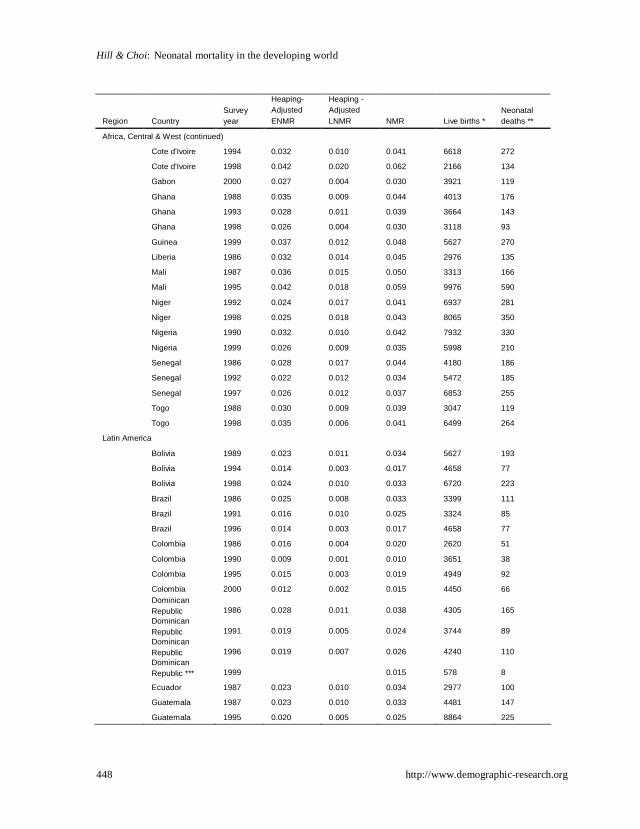
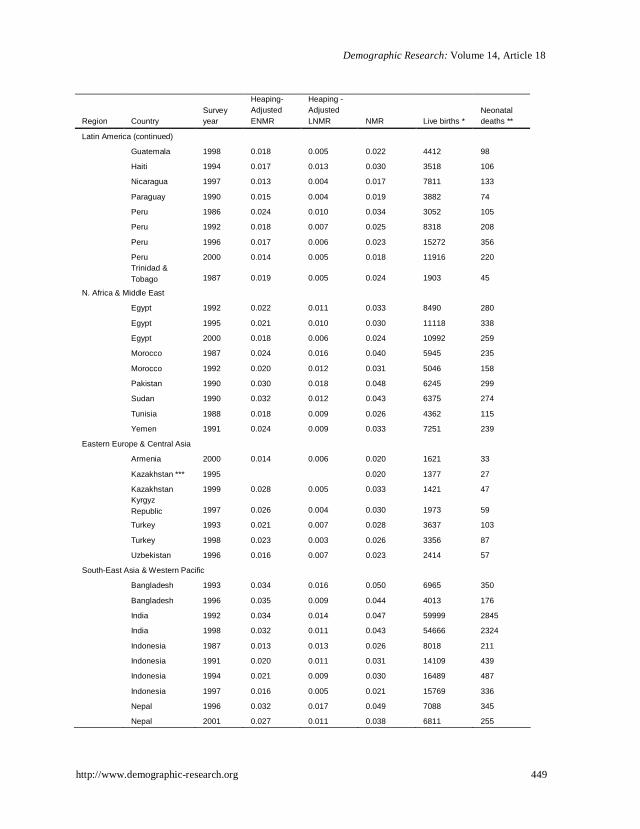
Table A1 shows the estimates of ENMR, LNMR and NMR for each survey included in the analysis.
Figure 9 summarizes the estimates of NMR by region in a boxplot showing both the median value for the region and the range of country estimates. Central and West Africa has the highest average NMR (mean = 41, median = 41) and Latin America and the Caribbean the lowest (mean = 25, median = 24), closely followed by Central and West Asia (mean = 27, median = 27, and the narrowest range). Average NMRs for the remaining regions are all in the 30s, ranging from a median of 30 in South and South-East Asia and the Western Pacific (mean = 32) to 36 in South and East Africa (mean = 35).
Figure 9: Neonatal mortality rates by WHO region
0.0
1.0
2.0
3.0
4.0
5.0
6N
eona
tal M
orta
lity
Rat
e
S&E Af C&W Af L Am N Af & M E C&W As S&SE As (total)
(Total N=106)
Hill & Choi: Neonatal mortality in the developing world
442 http://www.demographic-research.org
4.4 Trends in neonatal mortality
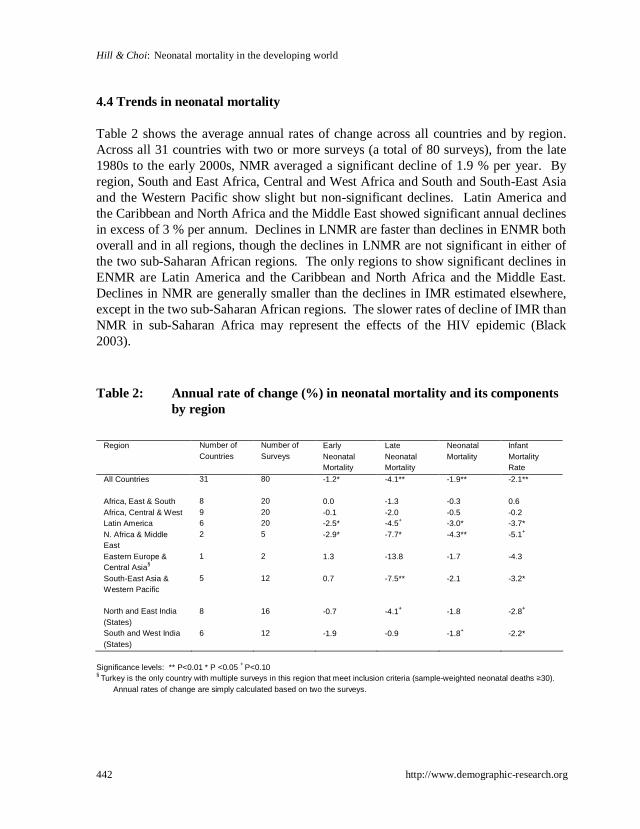
Table 2 shows the average annual rates of change across all countries and by region. Across all 31 countries with two or more surveys (a total of 80 surveys), from the late 1980s to the early 2000s, NMR averaged a significant decline of 1.9 % per year. By region, South and East Africa, Central and West Africa and South and South-East Asia and the Western Pacific show slight but non-significant declines. Latin America and the Caribbean and North Africa and the Middle East showed significant annual declines in excess of 3 % per annum. Declines in LNMR are faster than declines in ENMR both overall and in all regions, though the declines in LNMR are not significant in either of the two sub-Saharan African regions. The only regions to show significant declines in ENMR are Latin America and the Caribbean and North Africa and the Middle East. Declines in NMR are generally smaller than the declines in IMR estimated elsewhere, except in the two sub-Saharan African regions. The slower rates of decline of IMR than NMR in sub-Saharan Africa may represent the effects of the HIV epidemic (Black 2003).
Table 2: Annual rate of change (%) in neonatal mortality and its components by region
Region Number of
Countries Number of Surveys
Early Neonatal Mortality
Late Neonatal Mortality
Neonatal Mortality
Infant Mortality Rate
All Countries 31 80 -1.2* -4.1** -1.9** -2.1** Africa, East & South 8 20 0.0 -1.3 -0.3 0.6 Africa, Central & West 9 20 -0.1 -2.0 -0.5 -0.2 Latin America 6 20 -2.5* -4.5+ -3.0* -3.7* N. Africa & Middle East
2 5 -2.9* -7.7* -4.3** -5.1+
Eastern Europe & Central Asia§
1 2 1.3 -13.8 -1.7 -4.3
South-East Asia & Western Pacific
5 12 0.7 -7.5** -2.1 -3.2*
North and East India (States)
8 16 -0.7 -4.1+ -1.8 -2.8+
South and West India (States)
6 12 -1.9 -0.9 -1.8+ -2.2*
Significance levels: ** P<0.01 * P <0.05 + P<0.10 § Turkey is the only country with multiple surveys in this region that meet inclusion criteria (sample-weighted neonatal deaths ≥30).
Annual rates of change are simply calculated based on two the surveys.
Demographic Research: Volume 14, Article 18
http://www.demographic-research.org 443
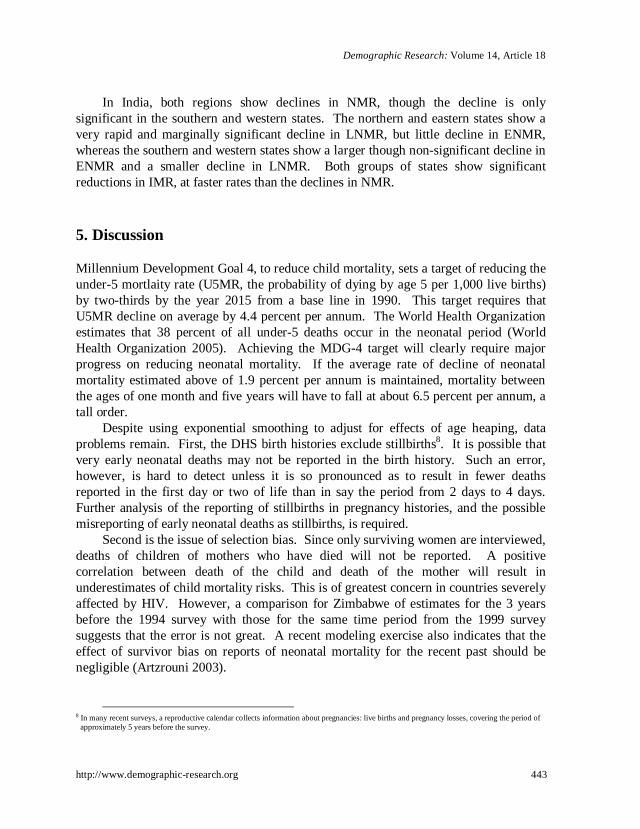
In India, both regions show declines in NMR, though the decline is only significant in the southern and western states. The northern and eastern states show a very rapid and marginally significant decline in LNMR, but little decline in ENMR, whereas the southern and western states show a larger though non-significant decline in ENMR and a smaller decline in LNMR. Both groups of states show significant reductions in IMR, at faster rates than the declines in NMR.
5. Discussion
Millennium Development Goal 4, to reduce child mortality, sets a target of reducing the under-5 mortlaity rate (U5MR, the probability of dying by age 5 per 1,000 live births) by two-thirds by the year 2015 from a base line in 1990. This target requires that U5MR decline on average by 4.4 percent per annum. The World Health Organization estimates that 38 percent of all under-5 deaths occur in the neonatal period (World Health Organization 2005). Achieving the MDG-4 target will clearly require major progress on reducing neonatal mortality. If the average rate of decline of neonatal mortality estimated above of 1.9 percent per annum is maintained, mortality between the ages of one month and five years will have to fall at about 6.5 percent per annum, a tall order.
Despite using exponential smoothing to adjust for effects of age heaping, data problems remain. First, the DHS birth histories exclude stillbirths8. It is possible that very early neonatal deaths may not be reported in the birth history. Such an error, however, is hard to detect unless it is so pronounced as to result in fewer deaths reported in the first day or two of life than in say the period from 2 days to 4 days. Further analysis of the reporting of stillbirths in pregnancy histories, and the possible misreporting of early neonatal deaths as stillbirths, is required.
Second is the issue of selection bias. Since only surviving women are interviewed, deaths of children of mothers who have died will not be reported. A positive correlation between death of the child and death of the mother will result in underestimates of child mortality risks. This is of greatest concern in countries severely affected by HIV. However, a comparison for Zimbabwe of estimates for the 3 years before the 1994 survey with those for the same time period from the 1999 survey suggests that the error is not great. A recent modeling exercise also indicates that the effect of survivor bias on reports of neonatal mortality for the recent past should be negligible (Artzrouni 2003).
8 In many recent surveys, a reproductive calendar collects information about pregnancies: live births and pregnancy losses, covering the period of
approximately 5 years before the survey.
Hill & Choi: Neonatal mortality in the developing world
444 http://www.demographic-research.org
Thirdly, retrospective reporting can suffer from recall lapse. In an analysis of data quality in DHS birth histories, omission of early neonatal deaths in the more distant periods was noted (Curtis 1995). Although in this study we only used information about births in 5 years prior to the survey, we have compared the estimates of neonatal mortality from a later survey with estimates from an earlier survey for the same time period, using a subset of countries with multiple surveys. We did not find any systematic pattern of difference between the estimates by recall period.
Lastly, there is a problem of systematic misreporting of dates of birth, shifting births backwards to avoid additional questions about health and use of health services for recent births (Arnold 1990). This error may affect our analysis, though it is not clear whether there is a net effect on mortality estimates.
As an additional data quality check, we compared the level and age pattern of neonatal mortality with measures from high-quality surveillance data. Results from the 1999 Bangladesh DHS were compared with measures from the Matlab Health and Demographic Surveillance System (HDSS). Although the Matlab area is not nationally representative, patterns of early childhood mortality may be similar to those of Bangladesh at large. The NMR for the 5 years before the 1999 DHS is 42.6 per 1000 live births, and the proportion of neonatal mortality that occurs in the early neonatal mortality period is 78.4 %. Comparable measures were estimated from the HDSS; the neonatal mortality rate for 2000 is 38.1 per 1000 and the proportion early neonatal is 77.6 % (ICDDR-B 2002; El Arifeen 2003).
Bang et al. (2002) use data from a study of 13 sites in Maharashtra, India, conducted by the Child Deaths Study and Action Group (CDSAG), to argue that official statistics, including the Sample Registration System and the NFHS, underestimate both neonatal and infant mortality. Our cohort estimate of IMR for the period 1993 to 1998 for Maharashtra is 39, compared to CDSAG’s estimate for 1999-2000 of between 61 and 69 (Bang 2002). However, the ratios of neonatal to infant mortality are similar: 0.75 from CDSAG and 0.80 from the NFHS. Thus CDSAG implies a similar pattern of mortality in the first year of life as the NFHS, but arrives at a very different estimate of IMR. It is difficult to interpret this difference, however, since the 13 study sites were selected purposively rather than at random and did not include any non-slum urban populations; state-level estimates were calculated from weighted strata-specific estimates. Since the sites are not necessarily representative of strata, however, it is not clear what population the final result represents. There are also some questions about data collection procedures used in the studies (informants were paid for reports of death, which could lead to over-reporting). Although we cannot be sure that the NFHS did not under-report infant and child mortality in Maharashtra, we can be reasonably sure that it did not differentially under-report neonatal relative to post-neonatal mortality.
Demographic Research: Volume 14, Article 18
http://www.demographic-research.org 445
This analysis examines data quality of DHS birth histories in two ways: by quantifying the excess reporting of ages at death on seven days; and by comparing recorded age patterns of early childhood mortality with historical patterns from England and Wales. Heaping on seven days is widespread, particularly in Africa and the Middle East. Adjusted early neonatal and late neonatal mortality risks are computed by exponential smoothing of the cumulative death distribution.
Comparisons of these adjusted risks with those observed in England and Wales do not suggest widespread omission from the birth histories of early neonatal deaths relative to late neonatal or postneonatal deaths. On the contrary, the ratios of early to late neonatal deaths and of neonatal to infant deaths are generally higher in the birth histories than in the historical record. Patterns for Africa, the Middle East, and northeastern India do suggest, however, substantial random error in reporting age at death. Patterns for Latin America, South-East Asia and the Pacific conform more closely to the historical record.
Early childhood mortality has been declining in the developing world over the last decade at slightly less than 2% per annum. This is less than half the annual rate of decline required (for all under-5 mortality) to achieve the 2015 target for Millennium Development Goal 4. Broadly mirroring historical patterns of change, declines have been faster for late neonatal mortality than for early neonatal mortality, and for postneonatal mortality than for neonatal mortality. Declines have not been distributed equally among regions. Countries of Latin America and the Caribbean, of North Africa and the Middle East, of South and South-East Asia, and of the Pacific, have seen the fastest declines. Declines in sub-Saharan Africa have been slower, particularly in the early neonatal period.
6. Acknowledgements
This research was supported by a grant from the World Health Organization and conducted for the Child Health Epidemiology Reference Group. We received helpful comments on an earlier draft of this paper from Dr. Joy Lawn and two anonymous reviewers.
Hill & Choi: Neonatal mortality in the developing world
446 http://www.demographic-research.org
References
Artzrouni M, Zaba B. HIV-induced bias in the estimation of child mortality using birth history reports. Presented at the Technical Meeting on HIV and Child Mortality. London: March 2003.
Bang A, Reddy MH, Deshmukh MD. Child mortality in Maharashtra. Economic and Political Weekly 2002; 37(49):4947-4965.
Black RE, Morris SS, Bryce J. 2003. Where and why are 10 million children dying every year? The Lancet 361(9376):2226-2234.
Curtis S. Assessment of the quality of data used for direct estimation of infant and child mortality in DHS-II surveys. Occasional Papers 3. 1995. Calverton, MD, Macro International Inc. Arnold F, Blanc A. Fertility levels and trends. DHS Comparative Studies 2. 1990. Columbia, MD, Institute for Resource Development.
El Arifeen S. 2003. Personal Communication
ICDDR B. Health and demographic surveillance system - Matlab: Registration of health and demographic events 2000. 2002. Dhaka, Bangladesh, ICDDR,B.
Lawn JE, Cousens S, Zupan J; Lancet Neonatal Survival Steering Team. 4 million neonatal deaths: when? Where? Why? Lancet. 2005 Mar 2;365(9462):891-900.
United Nations. 2001. General Assembly, 56th session. Road map towards the implementation of the United Nations millennium declaration: report of the Secretary-General (UN document no. A/56/326). New York: United Nations.
World Health Organization. 2005. World Health Report 2005- Make Every Mother and Child Count. Geneva: World Health Organization.
Demographic Research: Volume 14, Article 18
http://www.demographic-research.org 447
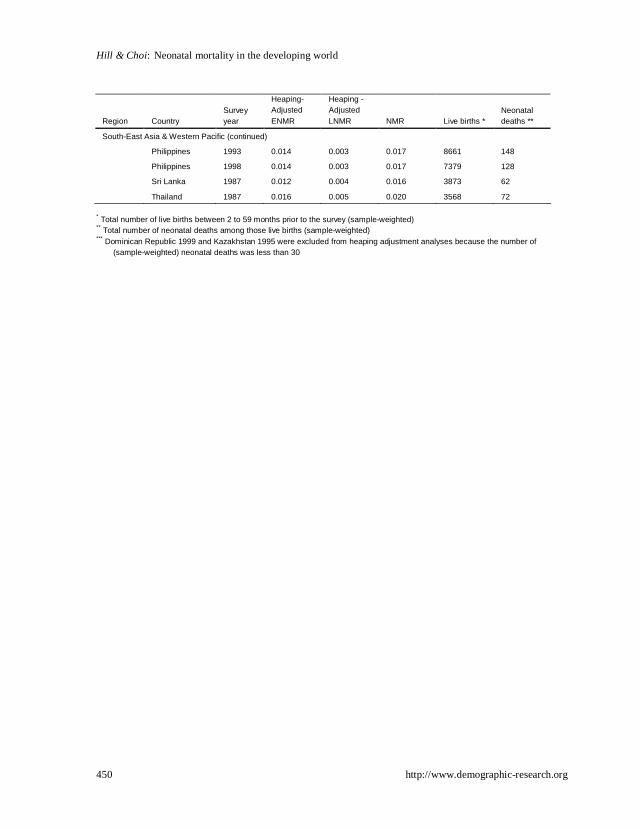
Appendix
Table A1: List of 108 surveys by region and country: Estimated ENMR, LNMR, and NMR
Region Country Survey year
Heaping-Adjusted ENMR
Heaping -Adjusted LNMR NMR Live births *
Neonatal deaths **
Africa, East & South
Burundi 1987 0.024 0.011 0.035 3764 133
Comoros 1996 0.028 0.009 0.036 1925 70
Eritrea 1995 0.019 0.006 0.025 4027 101
Ethiopia 2000 0.035 0.013 0.048 11904 567
Kenya 1989 0.020 0.007 0.027 6929 184
Kenya 1993 0.020 0.005 0.025 5974 151
Kenya 1998 0.022 0.005 0.026 5401 143
Madagascar 1992 0.025 0.014 0.038 5511 211
Madagascar 1997 0.028 0.011 0.039 6267 246
Malawi 1992 0.031 0.010 0.041 4404 182
Malawi 2000 0.030 0.010 0.040 11828 468
Mozambique 1997 0.045 0.009 0.054 7153 389
Namibia 1992 0.025 0.006 0.031 3734 114
Rwanda 1992 0.027 0.011 0.038 5498 209
Rwanda 2000 0.033 0.010 0.043 7963 342
Tanzania 1992 0.027 0.009 0.036 7875 286
Tanzania 1996 0.022 0.010 0.032 6709 211
Tanzania 1999 0.030 0.010 0.039 3180 125
Uganda 1988 0.030 0.011 0.041 4886 201
Uganda 1995 0.021 0.005 0.027 7276 193
Uganda 2000 0.025 0.007 0.033 7466 243
Zambia 1992 0.030 0.012 0.042 6085 254
Zambia 1996 0.023 0.011 0.034 6959 239
Zimbabwe 1988 0.022 0.004 0.027 3278 87
Zimbabwe 1994 0.018 0.007 0.024 3850 93
Zimbabwe 1999 0.023 0.006 0.029 3445 100
Africa, Central & West
Benin 1996 0.029 0.008 0.037 4915 181
Burkina Faso 1992 0.027 0.015 0.042 6165 256
Burkina Faso 1998 0.027 0.012 0.039 6040 234
Cameroon 1991 0.024 0.008 0.032 3383 107
Cameroon 1998 0.028 0.008 0.036 4072 148
CAR 1994 0.032 0.010 0.041 4634 190
Chad 1996 0.028 0.016 0.044 7266 317
Hill & Choi: Neonatal mortality in the developing world
448 http://www.demographic-research.org
Region Country Survey year
Heaping-Adjusted ENMR
Heaping -Adjusted LNMR NMR Live births *
Neonatal deaths **
Africa, Central & West (continued)
Cote d'Ivoire 1994 0.032 0.010 0.041 6618 272
Cote d'Ivoire 1998 0.042 0.020 0.062 2166 134
Gabon 2000 0.027 0.004 0.030 3921 119
Ghana 1988 0.035 0.009 0.044 4013 176
Ghana 1993 0.028 0.011 0.039 3664 143
Ghana 1998 0.026 0.004 0.030 3118 93
Guinea 1999 0.037 0.012 0.048 5627 270
Liberia 1986 0.032 0.014 0.045 2976 135
Mali 1987 0.036 0.015 0.050 3313 166
Mali 1995 0.042 0.018 0.059 9976 590
Niger 1992 0.024 0.017 0.041 6937 281
Niger 1998 0.025 0.018 0.043 8065 350
Nigeria 1990 0.032 0.010 0.042 7932 330
Nigeria 1999 0.026 0.009 0.035 5998 210
Senegal 1986 0.028 0.017 0.044 4180 186
Senegal 1992 0.022 0.012 0.034 5472 185
Senegal 1997 0.026 0.012 0.037 6853 255
Togo 1988 0.030 0.009 0.039 3047 119
Togo 1998 0.035 0.006 0.041 6499 264
Latin America
Bolivia 1989 0.023 0.011 0.034 5627 193
Bolivia 1994 0.014 0.003 0.017 4658 77
Bolivia 1998 0.024 0.010 0.033 6720 223
Brazil 1986 0.025 0.008 0.033 3399 111
Brazil 1991 0.016 0.010 0.025 3324 85
Brazil 1996 0.014 0.003 0.017 4658 77
Colombia 1986 0.016 0.004 0.020 2620 51
Colombia 1990 0.009 0.001 0.010 3651 38
Colombia 1995 0.015 0.003 0.019 4949 92
Colombia 2000 0.012 0.002 0.015 4450 66
Dominican Republic 1986 0.028 0.011 0.038 4305 165
Dominican Republic 1991 0.019 0.005 0.024 3744 89
Dominican Republic 1996 0.019 0.007 0.026 4240 110
Dominican Republic *** 1999 0.015 578 8
Ecuador 1987 0.023 0.010 0.034 2977 100
Guatemala 1987 0.023 0.010 0.033 4481 147
Guatemala 1995 0.020 0.005 0.025 8864 225
Demographic Research: Volume 14, Article 18
http://www.demographic-research.org 449
Region Country Survey year
Heaping-Adjusted ENMR
Heaping -Adjusted LNMR NMR Live births *
Neonatal deaths **
Latin America (continued)
Guatemala 1998 0.018 0.005 0.022 4412 98
Haiti 1994 0.017 0.013 0.030 3518 106
Nicaragua 1997 0.013 0.004 0.017 7811 133
Paraguay 1990 0.015 0.004 0.019 3882 74
Peru 1986 0.024 0.010 0.034 3052 105
Peru 1992 0.018 0.007 0.025 8318 208
Peru 1996 0.017 0.006 0.023 15272 356
Peru 2000 0.014 0.005 0.018 11916 220
Trinidad & Tobago 1987 0.019 0.005 0.024 1903 45
N. Africa & Middle East
Egypt 1992 0.022 0.011 0.033 8490 280
Egypt 1995 0.021 0.010 0.030 11118 338
Egypt 2000 0.018 0.006 0.024 10992 259
Morocco 1987 0.024 0.016 0.040 5945 235
Morocco 1992 0.020 0.012 0.031 5046 158
Pakistan 1990 0.030 0.018 0.048 6245 299
Sudan 1990 0.032 0.012 0.043 6375 274
Tunisia 1988 0.018 0.009 0.026 4362 115
Yemen 1991 0.024 0.009 0.033 7251 239
Eastern Europe & Central Asia
Armenia 2000 0.014 0.006 0.020 1621 33
Kazakhstan *** 1995 0.020 1377 27
Kazakhstan 1999 0.028 0.005 0.033 1421 47
Kyrgyz Republic 1997 0.026 0.004 0.030 1973 59
Turkey 1993 0.021 0.007 0.028 3637 103
Turkey 1998 0.023 0.003 0.026 3356 87
Uzbekistan 1996 0.016 0.007 0.023 2414 57
South-East Asia & Western Pacific
Bangladesh 1993 0.034 0.016 0.050 6965 350
Bangladesh 1996 0.035 0.009 0.044 4013 176
India 1992 0.034 0.014 0.047 59999 2845
India 1998 0.032 0.011 0.043 54666 2324
Indonesia 1987 0.013 0.013 0.026 8018 211
Indonesia 1991 0.020 0.011 0.031 14109 439
Indonesia 1994 0.021 0.009 0.030 16489 487
Indonesia 1997 0.016 0.005 0.021 15769 336
Nepal 1996 0.032 0.017 0.049 7088 345
Nepal 2001 0.027 0.011 0.038 6811 255
Hill & Choi: Neonatal mortality in the developing world
450 http://www.demographic-research.org
Region Country Survey year
Heaping-Adjusted ENMR
Heaping -Adjusted LNMR NMR Live births *
Neonatal deaths **
South-East Asia & Western Pacific (continued)
Philippines 1993 0.014 0.003 0.017 8661 148
Philippines 1998 0.014 0.003 0.017 7379 128
Sri Lanka 1987 0.012 0.004 0.016 3873 62
Thailand 1987 0.016 0.005 0.020 3568 72 * Total number of live births between 2 to 59 months prior to the survey (sample-weighted) ** Total number of neonatal deaths among those live births (sample-weighted)
*** Dominican Republic 1999 and Kazakhstan 1995 were excluded from heaping adjustment analyses because the number of (sample-weighted) neonatal deaths was less than 30
Demographic Research: Volume 14, Article 18
http://www.demographic-research.org 451
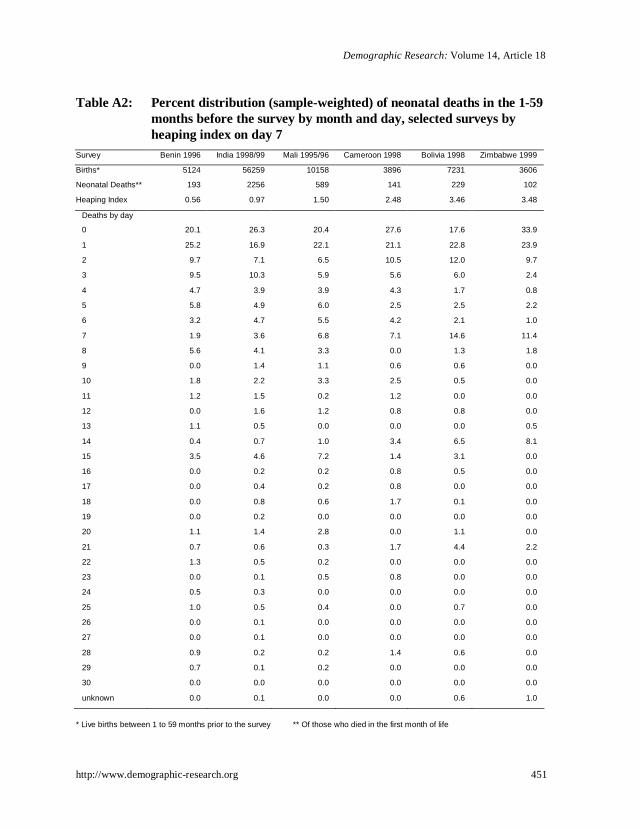
Table A2: Percent distribution (sample-weighted) of neonatal deaths in the 1-59 months before the survey by month and day, selected surveys by heaping index on day 7
Survey Benin 1996 India 1998/99 Mali 1995/96 Cameroon 1998 Bolivia 1998 Zimbabwe 1999
Births* 5124 56259 10158 3896 7231 3606
Neonatal Deaths** 193 2256 589 141 229 102
Heaping Index 0.56 0.97 1.50 2.48 3.46 3.48
Deaths by day
0 20.1 26.3 20.4 27.6 17.6 33.9
1 25.2 16.9 22.1 21.1 22.8 23.9
2 9.7 7.1 6.5 10.5 12.0 9.7
3 9.5 10.3 5.9 5.6 6.0 2.4
4 4.7 3.9 3.9 4.3 1.7 0.8
5 5.8 4.9 6.0 2.5 2.5 2.2
6 3.2 4.7 5.5 4.2 2.1 1.0
7 1.9 3.6 6.8 7.1 14.6 11.4
8 5.6 4.1 3.3 0.0 1.3 1.8
9 0.0 1.4 1.1 0.6 0.6 0.0
10 1.8 2.2 3.3 2.5 0.5 0.0
11 1.2 1.5 0.2 1.2 0.0 0.0
12 0.0 1.6 1.2 0.8 0.8 0.0
13 1.1 0.5 0.0 0.0 0.0 0.5
14 0.4 0.7 1.0 3.4 6.5 8.1
15 3.5 4.6 7.2 1.4 3.1 0.0
16 0.0 0.2 0.2 0.8 0.5 0.0
17 0.0 0.4 0.2 0.8 0.0 0.0
18 0.0 0.8 0.6 1.7 0.1 0.0
19 0.0 0.2 0.0 0.0 0.0 0.0
20 1.1 1.4 2.8 0.0 1.1 0.0
21 0.7 0.6 0.3 1.7 4.4 2.2
22 1.3 0.5 0.2 0.0 0.0 0.0
23 0.0 0.1 0.5 0.8 0.0 0.0
24 0.5 0.3 0.0 0.0 0.0 0.0
25 1.0 0.5 0.4 0.0 0.7 0.0
26 0.0 0.1 0.0 0.0 0.0 0.0
27 0.0 0.1 0.0 0.0 0.0 0.0
28 0.9 0.2 0.2 1.4 0.6 0.0
29 0.7 0.1 0.2 0.0 0.0 0.0
30 0.0 0.0 0.0 0.0 0.0 0.0
unknown 0.0 0.1 0.0 0.0 0.6 1.0
* Live births between 1 to 59 months prior to the survey ** Of those who died in the first month of life
Hill & Choi: Neonatal mortality in the developing world
452 http://www.demographic-research.org
Figure A1: Ratio* of adjusted rates based on two fitting ranges by level of heaping on day 7
.4.6
.81
1.2
1.4
EN
MR
rat
io*
0 1 2 3 4Heaping Index on day 7
.4.6
.81
1.2
1.4
LNM
R r
atio
*
0 1 2 3 4Heaping Index on day 7
*ratio of the adjusted rate based on D(3)/D(12) to the adjusted rate based on D(5)/D(10) ** For Armenia DHS 2000, sample-weighted total neonatal deaths were 32.6 and the adjusted number of early neonatal deaths were
28.5 and 23.1 based on the fitting ranges (D(3)/D(12) and D(5)/D(10), respectively), resulting in a 57 % decrease in LNMR. N=106 (country level surveys with number of (sample-weighted) neonatal deaths ≥30)