ncr real estate report h2 2017 presentation
TRANSCRIPT

NCRRESIDENTIAL & OFFICEJULY TO DECEMBER 2017

2
RESIDENTIAL RECAP H1 2017
Launches were at a new low in
H1 2017 with only 4,800 units
Sales registered a drop of 26% YoY
Unsold inventory of 180,370 units
remained a concern

Impact of RERA & GST
compliance
Low sales velocity
High unsold inventory
3
1,72,571
1,10,751 1,00,259 99,407
79,577
63,458
26,734
11,726
2010 2011 2012 2013 2014 2015 2016 2017
Launches
Launches at an all-time low
since 2010
56% drop YoY
No. o
f units

4
34,577
45,000
29,458
34,000
17,462
9,273
4,800 6,926
H1 2014 H2 2014 H1 2015 H2 2015 H1 2016 H2 2016 H1 2017 H2 2017
25% drop YoY
Half-yearly launches
RERA and GST compliance
magnified in the first half of 2017
No. o
f units

5
H2 2016 H2 2017
<2.5 mn 2% 68%
2.5-5 mn 14% 10%
5-7.5 mn 35% 16%
7.5-10 mn 33% 0%
10-20 mn 4% 4%
>20 11% 2%
Ticket sizes that saw
maximum change in H2 2017
Share of launches in less than
INR 5 mn bracket increased
to 78% from 16% YoY

6
1,17,559
93,986
79,178 74,966
48,630 48,800
40,005 37,653
2010 2011 2012 2013 2014 2015 2016 2017
Sales
Sales at an all time low
since 2010, a staggering
68% fall
No. o
f units

7
64,097
40,433
44,979
29,690
20,630 23,800
20,465
H2 2010 H2 2011 H2 2012 H2 2013 H2 2014 H2 2015 H2 2016 H2 2017
Half-yearly salesN
o. o
f units
Sales volume in H2 2017 up
from demonetisation-hit H2
2016, albeit way below 2010

Affordable housing
options and deep
discounts have
helped trickle sales
in Gurugram
GURUGRAMFARIDABAD
GREATER
NOIDA
NOIDA
GHAZIABAD
DELHI
7,853 units
171% YoY
23 units
-54% YoY
23 units
-54% YoY2,885 units
-26% YoY
6,218 units
-8% YoY
3,363 units
11% YoY
133 units
-55% YoY

Quarterly break-up of sales
Micro-marketQ4 2016 sales
(units)
Q4 2017 sales
(units)
YoY
change
Delhi 15 8 -45%
Faridabad 157 47 -70%
Ghaziabad 1,953 1,010 -48%
Greater Noida 2,653 2,176 -18%
Gurugram 958 2,749 187%
Noida 1,030 1,174 14%
NCR 6,765 7,163 6%

Considering all discounts in the
form of stamp duty waivers,
rental schemes, foreign trips,
customised payment plans, the
effective discount has been in
the range of
10-15%
Price change
10
2,780
3,370
3,970
4,330 4,444 4,578 4,250
4,165
-
500
1,000
1,500
2,000
2,500
3,000
3,500
4,000
4,500
5,000
Q4 2010 Q4 2011 Q4 2012 Q4 2013 Q4 2014 Q4 2015 Q4 2016 Q4 2017
-2%YoY

70
80
90
100
110
120
130
140
Residential prices decline by
2% compared to an inflation
growth of 5.5% in 2017
Price divergence widens
11
CPI
NCR

12
NCR is nearly touching the
Knight Frank Affordability
Benchmark* of
4.5
(*house price to income ratio)
2017
52010
6

Unwinding of inventory levels,
QTS running in close ranges
due to slow sales velocity
Unsold inventory declines
13% YoY
Analysis of unsold inventory and QTS
13
1,6
7,0
00
1,9
1,3
70
1,9
5,8
28
2,0
6,0
28
2,0
0,3
98
1,9
2,7
58
1,8
0,3
70
1,6
6,8
31
9.0
12.0
15.0
17.0 17.3 17.418
17.2
0.0
2.0
4.0
6.0
8.0
10.0
12.0
14.0
16.0
18.0
20.0
- 5
0,0
00
1,0
0,0
00
1,5
0,0
00
2,0
0,0
00
2,5
0,0
00
H1 2014 H2 2014 H1 2015 H2 2015 H1 2016 H2 2016 H1 2017 H2 2017
QT
S
Un
so
ld In
ven
tory
Unsold inventory QTS

FARIDABAD
GREATER
NOIDA
GHAZIABAD
DELHI
QTS – 18 I Age - 14
Unsold inventory – 1,399 units
QTS – 17 I Age - 16
Unsold inventory –
44,793 units
QTS - 19 I Age - 19
Unsold inventory – 27,344 units
QTS - 17 I Age - 20
Unsold inventory – 62,952
units
QTS – 19 I Age - 19
Unsold inventory –
24,825 unitstsNOIDA
QTS - 47 I Age – 17
Unsold inventory –
5,518 units
GURUGRAM
Aging unsold inventory
remains a concern,
highest in India
Overall NCR levels
Unsold units: 166,831
QTS: 17
Age: 18
Age and QTS in quarters

KEY FINDINGS
15
01 03
02 04
Launches down by 93% from
peak in 2010
NCR sees a price correction
for the second time since
2016
Down 2% YoY in 2017
Unsold inventory down
by 13% YoY
Slow sales velocity has had little impact on QTS despite steep fall in new launches
Sales in 2017 dropped
by 6% YoY
• H2 2017 better by 21% from demonetisation-hit H2 2016 on account of base effect
• 17% lower than average H2 sales between 2013-15
• H2 2017 sees a drop of 25% YoY
• 2017 saw 56% fewer launches YoY

16
Transactions held steady
Vacancy level surged to 18% in
H1 2017; DLF CyberCity and Golf
Course Road were at single digit
vacancy
OFFICERECAP H1 2017

17
7.0
8.1
11.5
4.64.1
0.0
2.0
4.0
6.0
8.0
10.0
12.0
2013 2014 2015 2016 2017
New completions
New completions hit a
five-year low
Mn
. S
q. ft.

Project delays hit the office market
as well
Though H2 2017 show an uptick in
new completions, not being in key
locations is a deterrent for
occupiers
18
4.0 4.1
5.5
6.0
2.8
1.8 1.8
2.3
H1 2014 H2 2014 H1 2015 H2 2015 H1 2016 H2 2016 H1 2017 H2 2017
Half-yearly new completions
New completions have been
patchy since 2016
Mn
. S
q. ft.

19
6.60
7.60
7.397.29
6.50
2013 2014 2015 2016 2017
11%YoY
Transactions
Traditionally a robust office
market, NCR records a
sharp fall in 2017
Mn
. S
q. ft.
20
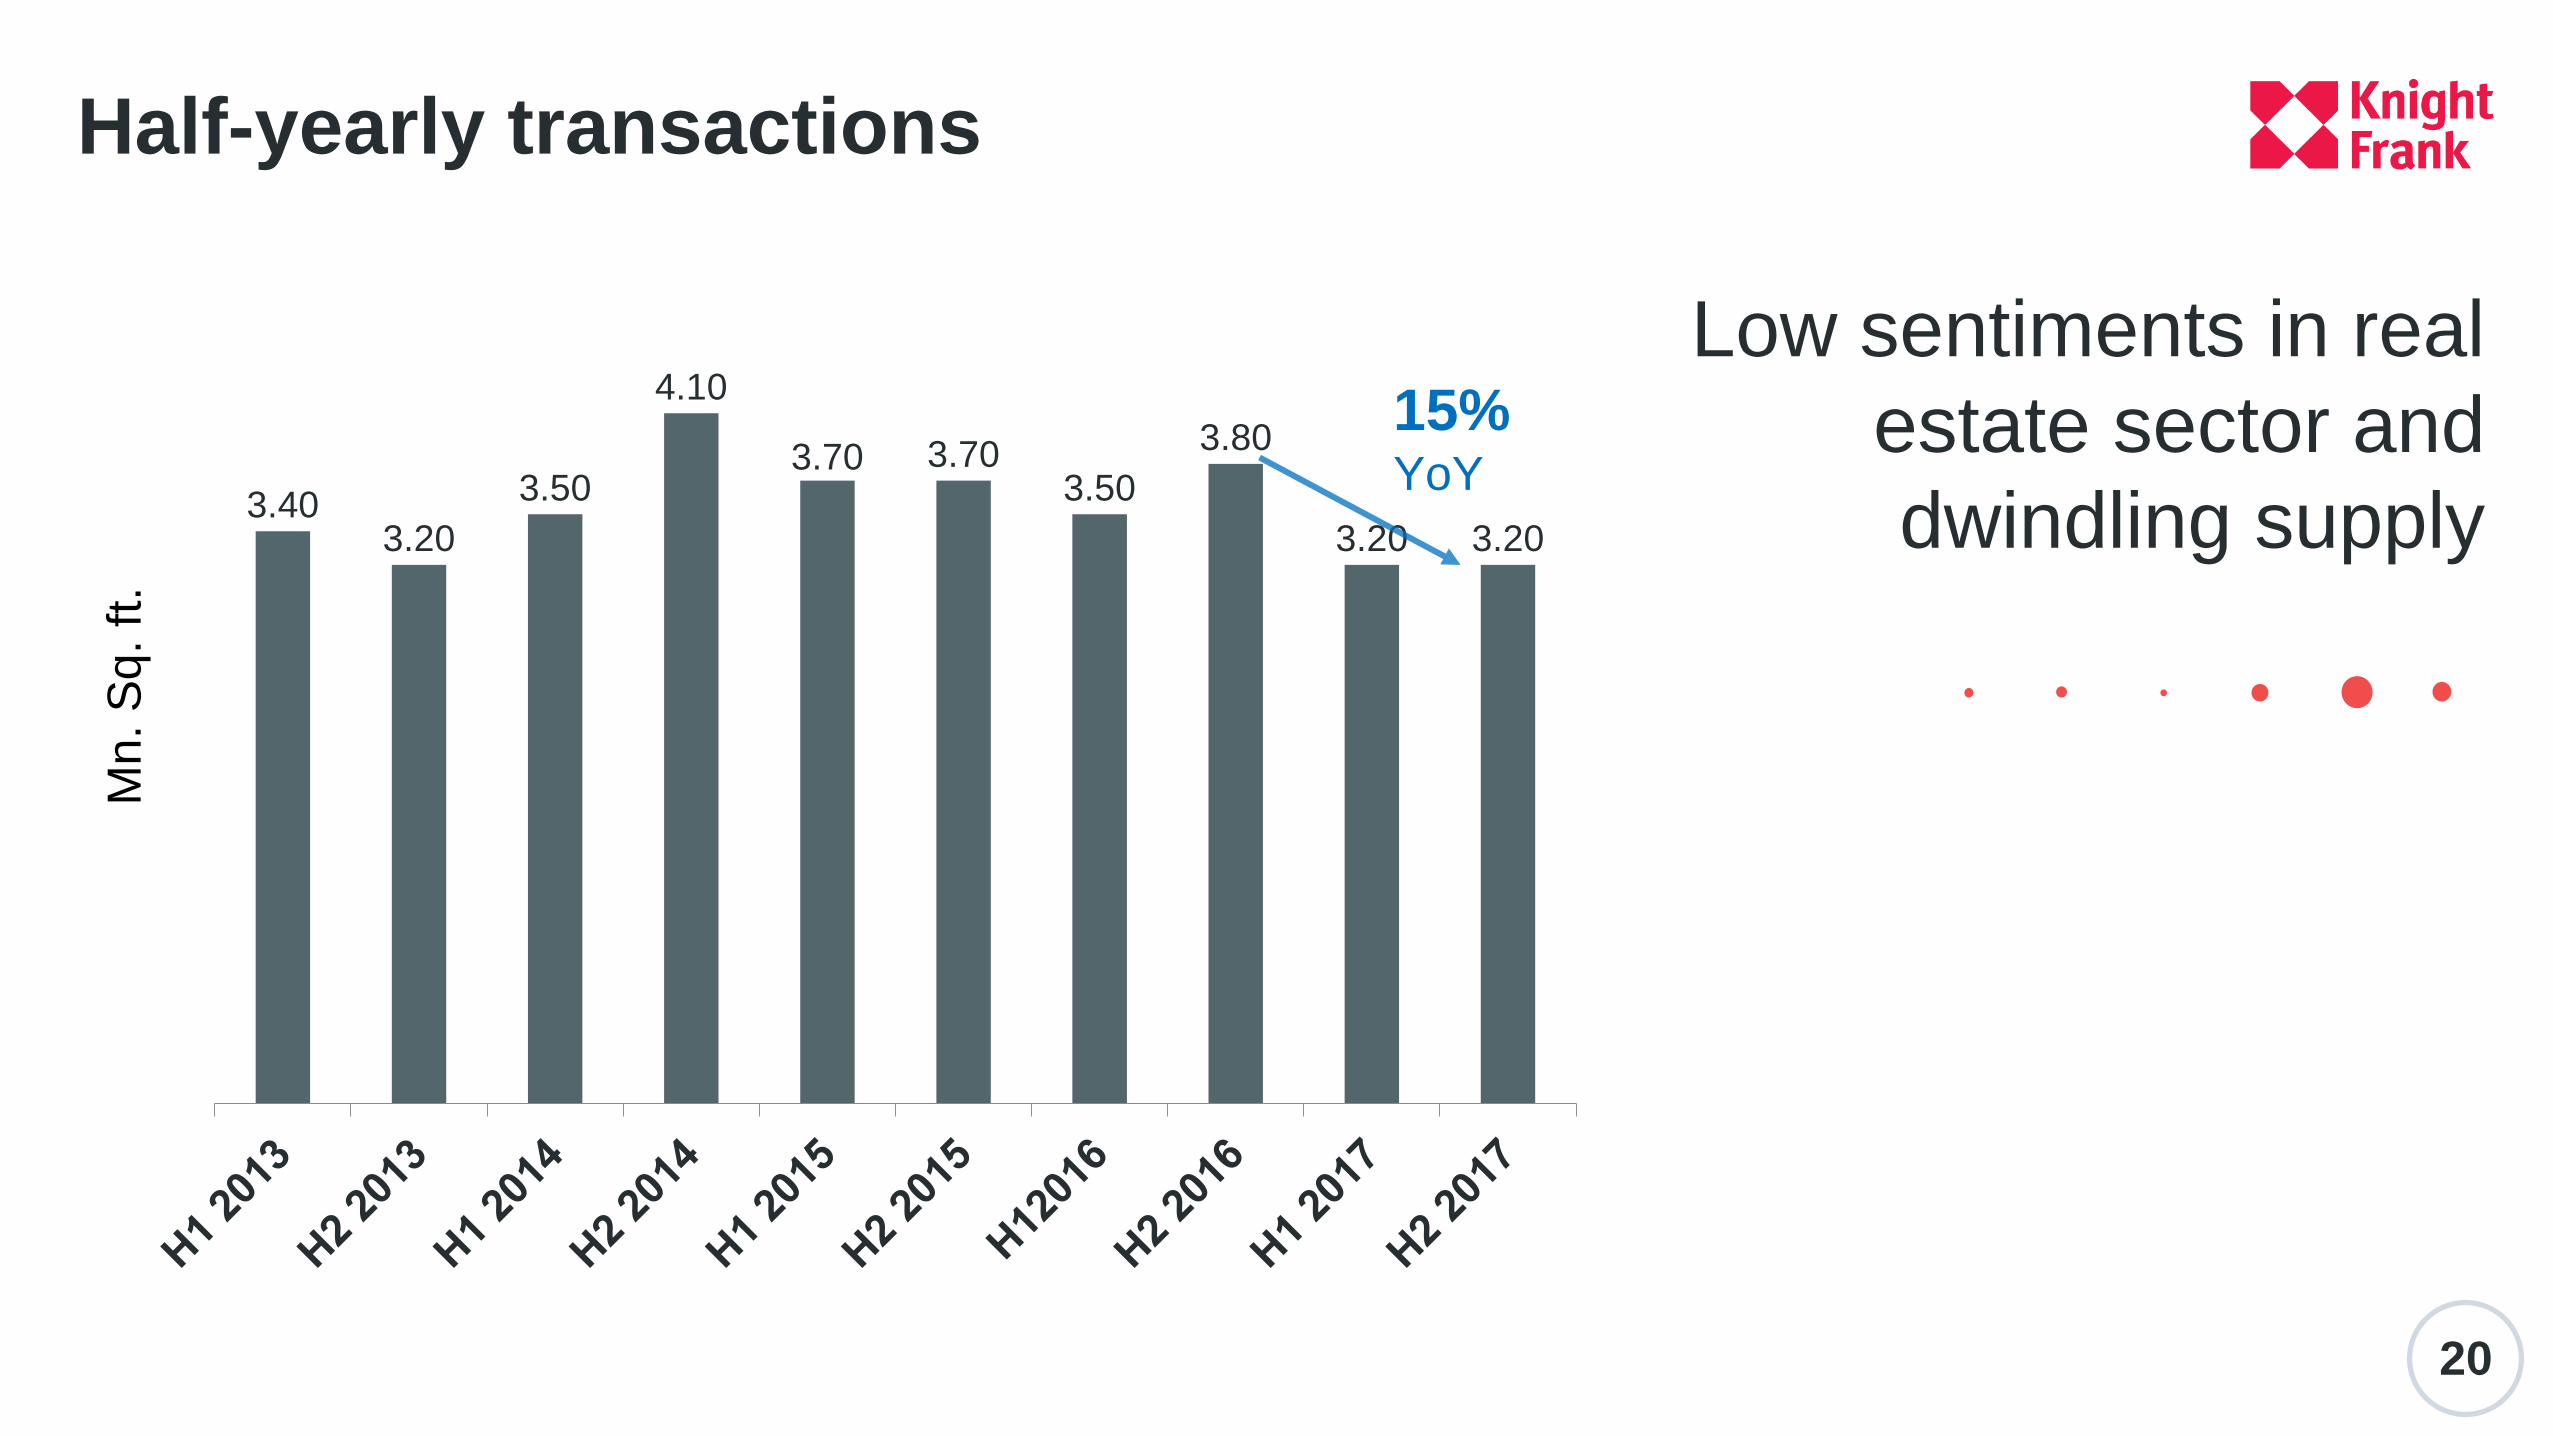
Half-yearly transactions
Low sentiments in real
estate sector and
dwindling supply3.403.20
3.50
4.10
3.70 3.703.50
3.80
3.20 3.20
Mn
. S
q. ft.
15%YoY

21
21.0%
20.0%
21.0%
18.0%
16.0%
15.0%
16.0%
17.0%
18.0%
19.0%
20.0%
21.0%
22.0%
2013 2014 2015 2016 2017
Vacancy
Vacancy levels have
come down as a result
of limited supply

12 month change
Limited supply
exerts pressure on
rentals in select
office areas CBD DELHI
INR 214-350/sq ft/month
2%
NOIDA
INR 44-70/sq ft/month
5%
SBD DELHI
INR 93-163/sq ft/month
6%
FARIDABAD
INR 45-55/sq ft/month
0%
INR 110-165/sq ft/month
5%
GURGAON ZONE C
INR 25-35/sq ft/month
0%
INR 71-134/sq ft/month
5%
GURGAON ZONE A
GURGAON ZONE B

23
Industry H2 2017 H2 2016
BANKING, FINANCIAL
SERVICES &
INSURANCE8% 6%
IT/ITES 28% 15%
MANUFACTURING 28% 23%
OTHER SERVICES 36% 56%
Other services sector takes up 56%
from the overall transaction pie, a
highest since 2015
Share of technology
sector at only 15% in
2017 – the lowest ever
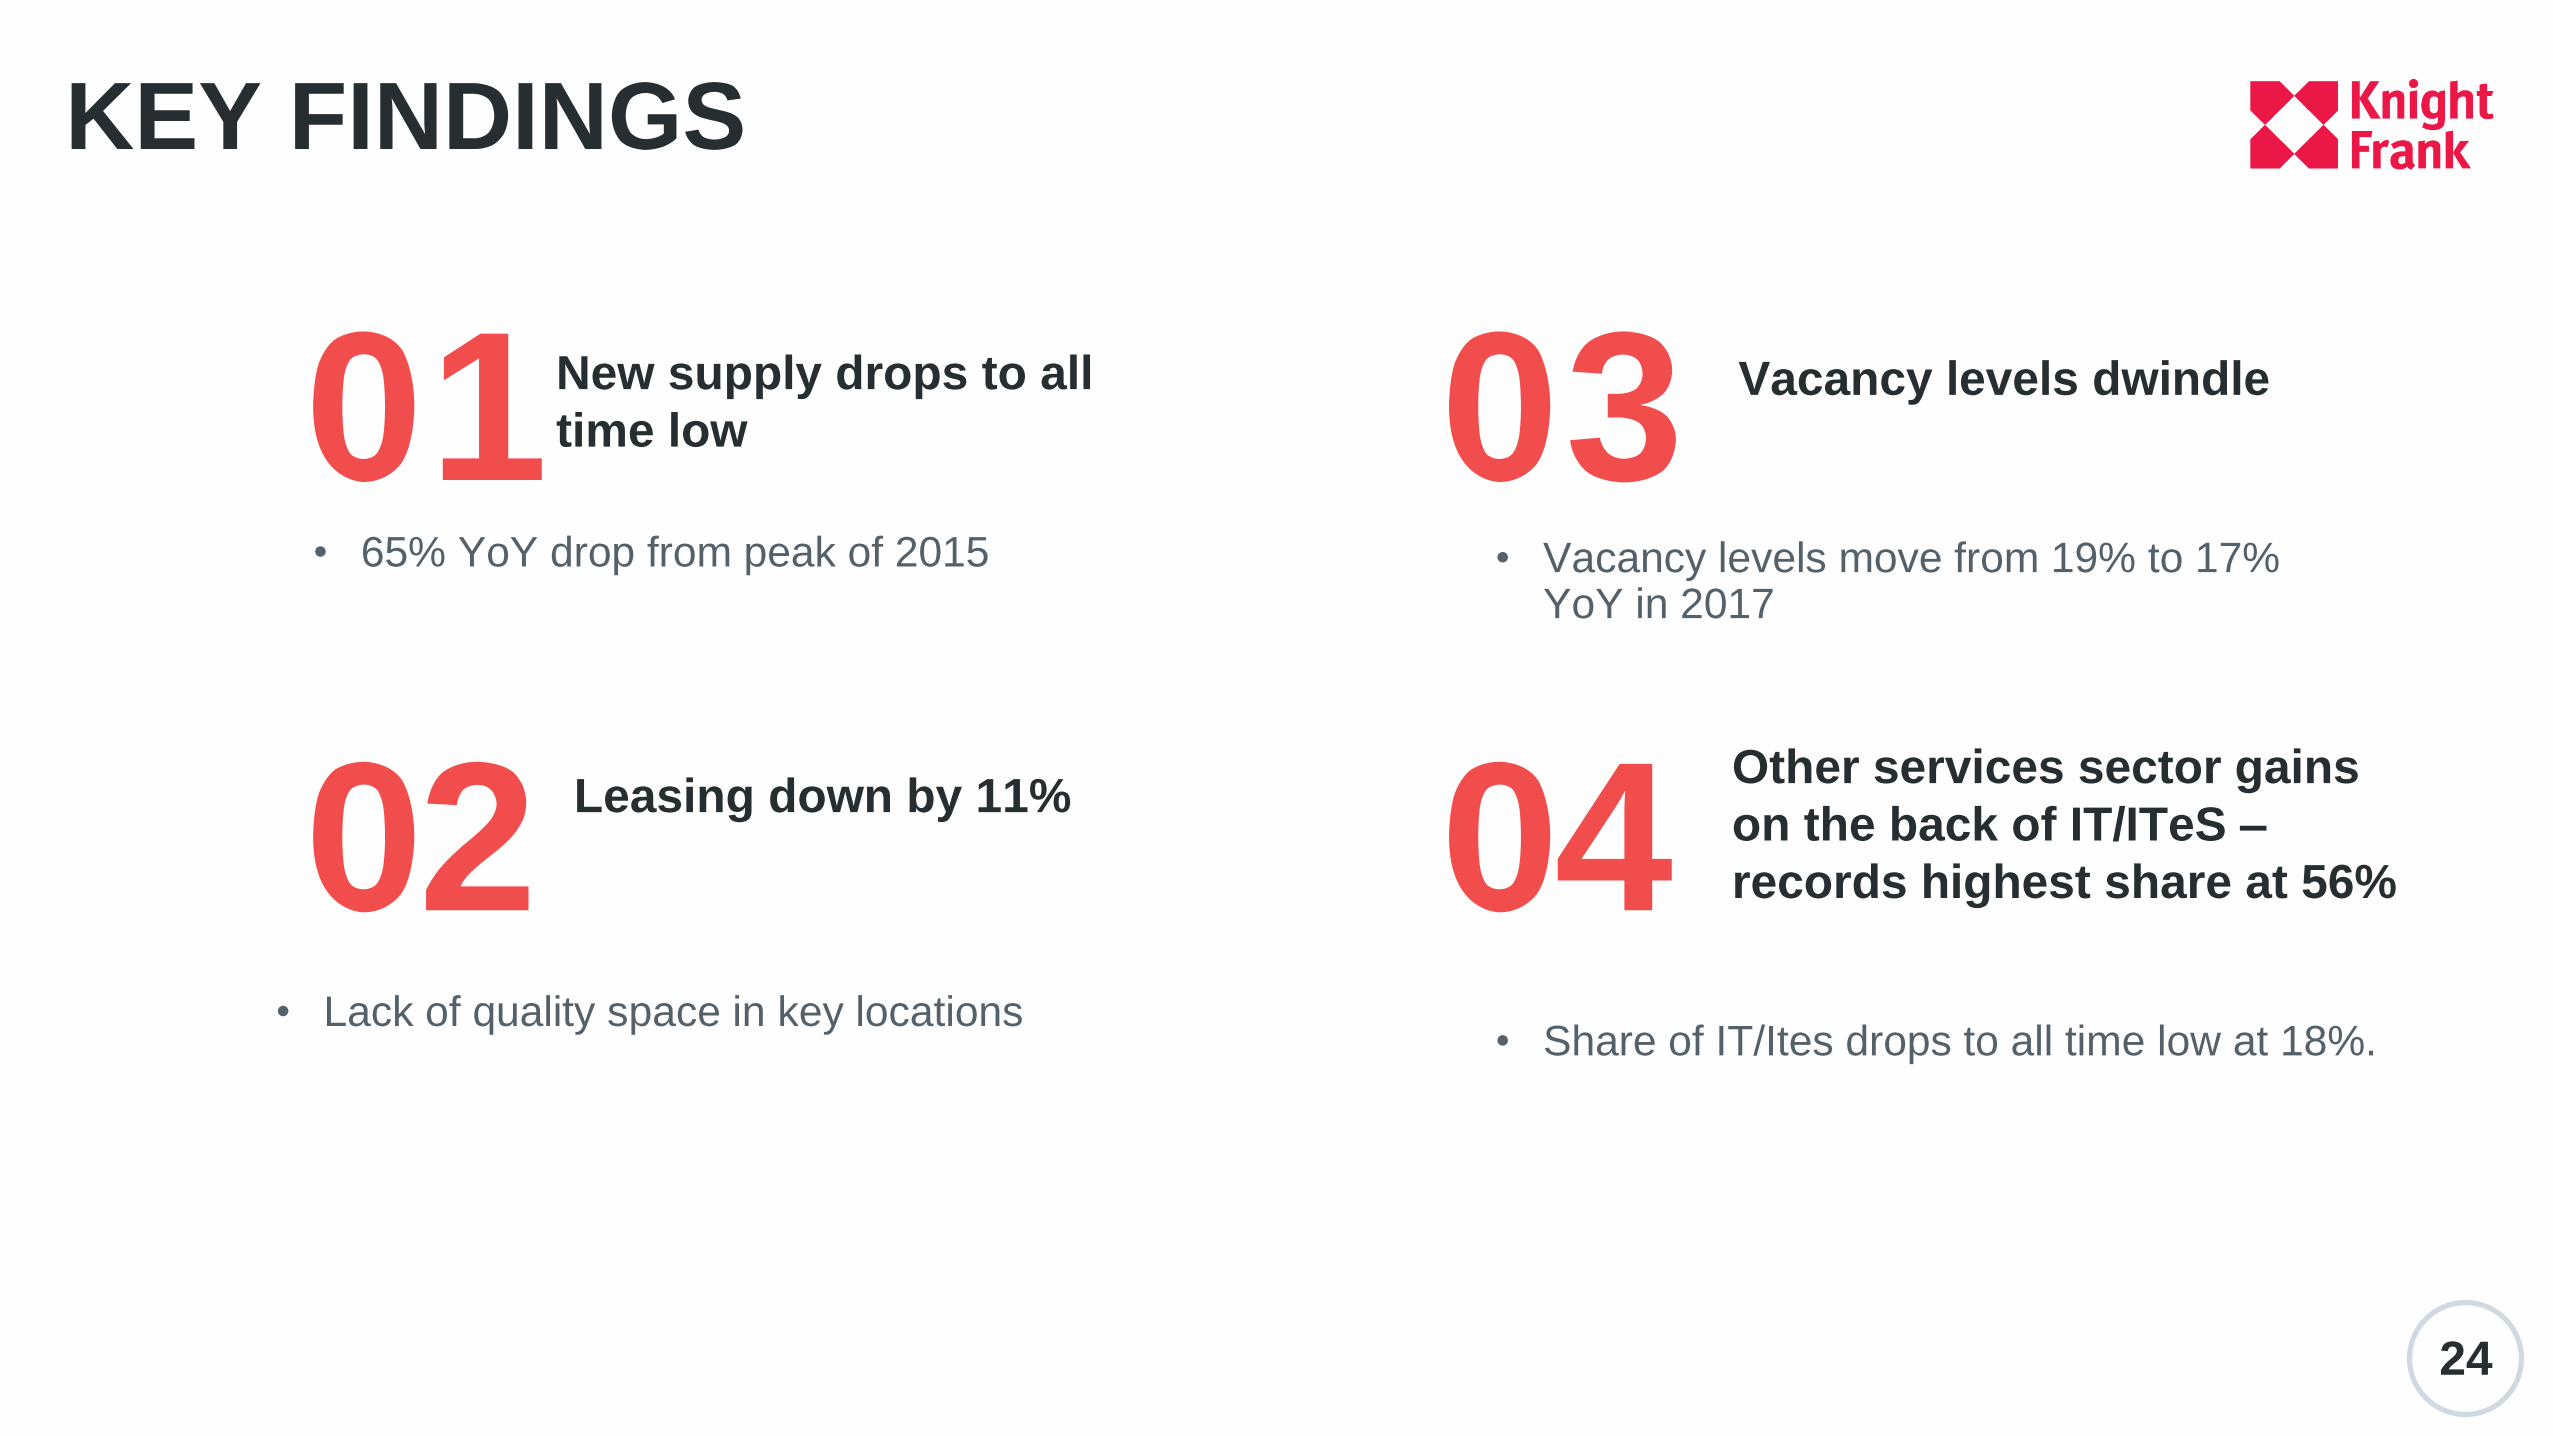
KEY FINDINGS
01 03
02 04
24
New supply drops to all
time low
• 65% YoY drop from peak of 2015
Vacancy levels dwindle
• Vacancy levels move from 19% to 17% YoY in 2017
Other services sector gains
on the back of IT/ITeS –
records highest share at 56%
• Share of IT/Ites drops to all time low at 18%.
Leasing down by 11%
• Lack of quality space in key locations

NCRRESIDENTIAL & OFFICE
In residential segment, NCR sees a price
correction for the second time since 2016
In office market, share of technology sector at
only 15% in 2017 – the lowest ever