ncr corporation - annualreports.comannualreports.com/.../n/nyse_ncr_2008.pdf · ncr corporation...
TRANSCRIPT
NC
R C
orp
ora
tion
Pro
xy Statemen
t for th
e 20
09
An
nu
al Meetin
g o
f Stockh
old
ers and
20
08
An
nu
al Rep
ort
Experience a new world of interaction
NCR Corporation
1700 S. Patterson Blvd.Dayton, OH 45479www.ncr.com
SP10048 Proxy Statement for the 2009 Annual Meeting of Stockholders and 2008 Annual ReportCert no. SCS-COC-00648
0794_covC4.indd 10794_covC4.indd 1 3/4/09 1:55:09 PM3/4/09 1:55:09 PM
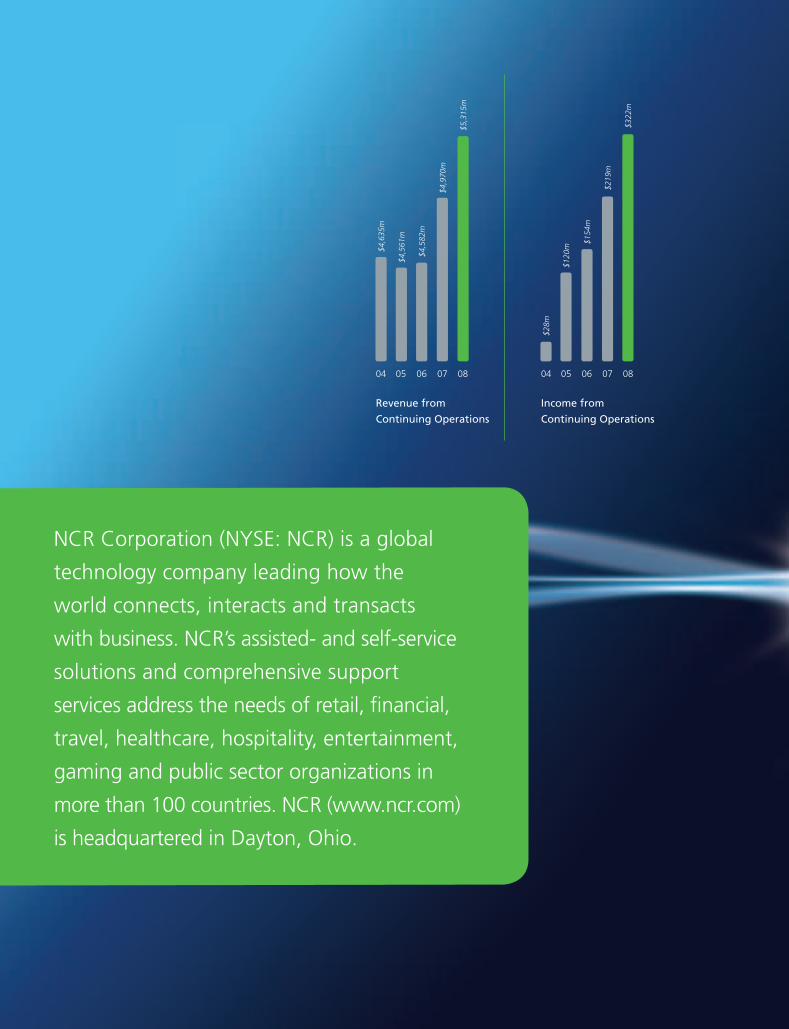
NCR Corporation (NYSE: NCR) is a global
technology company leading how the
world connects, interacts and transacts
with business. NCR’s assisted- and self-service
solutions and comprehensive support
services address the needs of retail, fi nancial,
travel, healthcare, hospitality, entertainment,
gaming and public sector organizations in
more than 100 countries. NCR (www.ncr.com)
is headquartered in Dayton, Ohio.
04 05 06 07 08
Income from
Continuing Operations
$28m
$120
m
$154
m
$219
m
$322
m
04 05 06 07 08
Revenue from
Continuing Operations
$4,6
35m
$4,5
61m
$4,5
82m
$4,9
70m
$5,3
15m Corporate Information
ANNUAL MEETING OF STOCKHOLDERS
Stockholders are invited to attend NCR’s Annual Meeting of Stockholders at 9:00 a.m. on April 22, 2009, to be held at:
The Millenium Hilton55 Church StreetNew York, New York 10007
STOCKHOLDER ACCOUNT INQUIRIES
Inquiries concerning stockholder accounts or NCR’s Direct Stock Purchase/Sell Program should be directed to:
NCR Corporationc/o BNY Mellon Shareowner ServicesP.O. Box 358015 Pittsburgh, PA 15252-8015
or
500 Ross Street, Floor 6Pittsburgh, PA 15262Ph. 800-NCR-2303 (800-627-2303)Ph. 201-680-6578 (Outside the U.S.)website address: www.bnymellon.com/shareowner/isd
NCR ANNUAL REPORT ON FORM 10-K
The Company’s annual report fi led with the U.S. Securities and Exchange Commission (SEC) on Form 10-K for current and prior years can be accessed via the “Investor” page of NCR’s website at www.ncr.com.
COMPANY INFORMATION
Information requests for NCR’s SEC fi lings, annual report on Form 10-K, quarterly reports and other fi nancial information can be obtained without charge by writing or calling:
NCR Investor Relations1700 S. Patterson Blvd. Dayton, OH 45479Ph. [email protected]://investor.ncr.com
Stockholders can help NCR reduce printing and mailing costs by viewing NCR’s annual reports and proxy statements online as instructed on the Notice of Internet Availability of Proxy Materials (the “Notice”) that we will send to you. If you would like a paper copy you may request one at no cost to you as instructed in the Notice.
CEO AND CFO CERTIFICATIONS
In 2008, the Company’s CEO provided the New York Stock Exchange (NYSE) with the annual CEO certifi cation regarding NCR’s compliance with the NYSE’s corporate governance listing standards. In addition, the Company’s CEO and CFO fi led with the SEC all required certifi cations regarding the quality of NCR’s public disclosures in its fi scal 2008 periodic reports.
NCR’s EXECUTIVE OFFICERS
William R. NutiChairman of the Board, Chief Executive Offi cer (CEO), and President
Anthony J. MassettiSenior Vice President and Chief Financial Offi cer (CFO)
Daniel T. BoganSenior Vice President and General Manager, NCR Consumables
John BrunoExecutive Vice President, Industry Solutions Group
Peter A. DorsmanSenior Vice President, Global Operations, and Chief Operations Offi cer
Peter LeavSenior Vice President, Worldwide Sales
Andrea L. LedfordSenior Vice President, Human Resources
Peter M. LiebSenior Vice President, General Counsel and Secretary
Christine W. WallaceSenior Vice President, NCR Services
NCR’s BOARD OF DIRECTORS
William R. Nuti Chairman of the Board, NCR Corporation
Quincy L. Allen President, Global Business and Strategic Marketing Group, Xerox Corporation
Edward P. BoykinFormer President and Chief Operating Offi cer, Computer Sciences Corporation
Richard L. ClemmerPresident and Chief Executive Offi cer, NXP B.V.
Gary J. DaichendtFormer President and Chief Operating Offi cer, Nortel Networks Corporation
Robert P. DeRodesChief Technology Offi cer, First Data Corporation
Mark P. FrissoraChairman and CEO, The Hertz Corporation
Linda Fayne LevinsonChair of the Board, Connexus Corporation
C.K. PrahaladProfessor of Business Administration, The University of MichiganDesign: Mizrahi, Inc. (www.mizrahionline.com)
Printing: RR Donnelley (www.rrdonnelley.com)
0794_covC4.indd 20794_covC4.indd 2 3/4/09 1:55:32 PM3/4/09 1:55:32 PM

NCR’s rich 125-year history has had a number of standout years, and 2008 will go down as one of our company’s most successful. A few of the primary achievements include:
Outstanding fi nancial performance, highlighted by revenue growth of 7 percent to $5.3 billion. Non-pension operating income, or NPOI, grew 15 percent versus the prior year, and we generated $277 million in free cash fl ow, up from $39 million in 2007.
The launch of over 50 new products in 2008, including the industry’s newest and most innovative ATM family, NCR SelfServ; our next generation self-checkout solution, 5.0; and other groundbreaking solutions in point of sale and self service.
A return to the #1 market share of shipments of ATMs in North America while maintaining our lead in key global markets and our overall global share leadership position.
Signifi cant gains in the execution of our self-service strategy, including expansion into new industries such as entertainment, which promise to open future avenues of growth for NCR.
Excellent progress toward our goal of establishing the industry’s lowest cost structure, with signifi cant improvement in both gross and operating margins.
And the repurchase of almost 22 million shares of our common stock for approximately $494 million dollars.
These achievements made for a very satisfying year, and I would like to thank our employees, customers, partners and shareholders for their support in making it happen. Unfortunately, 2008 was also a year that ended on a dark note for the global economy and for many of our customers, particularly in the retail industry. This challenging environment is expected to prevail throughout 2009 and possibly into 2010.
As we navigate through this turbulence, I am confi dent we are operating from a position of competitive strength. In fact, NCR is stronger operationally and competitively than it has been in many years. We are winning in the marketplace and delivering improving fi nancial results because we continue to execute three critical long-term business goals:
Generate profi table revenue growth,
Build the lowest and most effi cient cost structure in our industry, and
Optimize our capital structure.
The company’s rich tradition of innovation is helping to fuel profi table revenue growth opportunities as we extend leadership in traditional industries, including fi nancial and retail; deliver consumables in support of those solutions, like our 2ST, two-sided thermal printers and paper; break into new solution areas, like branch automation; and set the stage for future growth in new industries.
In fi nancial services, NCR is driving new initiatives spanning self-service automation, online banking, mobile banking, and teller-assisted cash recycling, which have allowed us to expand our available market to exceed $9 billion. And we have launched the industry’s newest and most innovative ATM family, NCR SelfServ, to customer accolades and industry recognition, helping us to reclaim the #1 market share position in North America while maintaining our lead globally.
Our initiatives have directly helped the banking industry, which is under immense pressure to cut costs and create enhanced loyalty and intimacy with customers. Banks across the globe have initiated a renewed and aggressive focus on growing core deposits, and self service plays a central role in customer acquisition and retention. Our banking customers are very aware of the economic value proposition of our solutions, including tremendous cost savings, increased productivity, attractive ROI, and positive customer satisfaction levels.
Dear NCR Shareholder,
“ “
The Company’s rich tradition of innovation
is helping to fuel profi table revenue growth
opportunities as we extend leadership in
traditional solutions.
2008 ANNUAL REPORT

Retail is among the most challenged sectors globally due to the consumer recession. Even so, NCR is delivering solutions like our next generation self-checkout products that increase store productivity, lower costs and improve consumer satisfaction. We are also in the midst of an upgrade cycle on the point-of-sale side of the business where we are winning new business with our RealPOS 70 XRT. These two areas of strength will help provide support in this otherwise diffi cult period.
Research recently commissioned by NCR showed that 72 percent of American consumers are more likely to shop with a retailer that provides the fl exibility to interact and transact across multiple channels: in-store, the Internet, mobile apps, and self-serve kiosks. Retailers that provide that fl exibility stand a better chance of getting foot traffi c, clicks, and kiosk visits that result in sales. In fact, many large retailers are now seeing upwards of 50 percent of their store transactions executed at a self-checkout station rather than traditional point-of-sale, and we believe that ten years from now very few traditional point-of-sale checkouts will still exist.
What is happening in retail will extend to many other industries as well, and NCR aims to lead that migration. One of the most exciting areas we have entered is entertainment, where digital technologies are disrupting the traditional models for rental and sale of packaged media. We are also active in other verticals like healthcare and the public sector, software and technology services, and travel and lodging – where we are already #1 in airport check-in kiosks.
Behind our solutions offerings sits NCR’s largest revenue business: Services. Our Service business provides a stable annuity and continues to be a key ingredient of our strategy: we view this aspect of our business as a tremendous asset, particularly in the current economic environment. For every solution we sell, we want to have a services agreement wrapped around that sale. Our “attach rates” continue to improve, and we remain the largest service provider in the ATM industry today. We also have a growing and vibrant managed services business and outsourcing opportunity in front of us, and so we look forward to driving better margins in Services while building on our leadership position.
In Services and throughout the company, we are becoming more productive and cost effi cient. We are on a path to building the industry’s lowest cost structure, with signifi cant annual expense savings achieved to date and $200 million to $250 million expected between the year just concluded and the end of 2010. These savings will come from such initiatives as value engineering, more effi cient product lifecycle management, and the design of products for serviceability.
NCR is also hard at work optimizing its capital structure. We have over $700 million in cash at the end of 2008, and improved our working capital position. Increased inventory turnover and better accounts receivable performance are leading the way, and the resulting improvement in cash fl ow has supported increased repurchases, targeted fi ll-in acquisitions, and most important, reinvestment in research and development.
Through all of these actions, it is clear that NCR has momentum. While our 2009 results will be defi ned in some measure by the challenging economic environment, we have a solid working capital position, a track record of managing the company for strong business results, the right strategy, and a dedicated workforce who believes in our vision: Our goal is to be the leader in how the world connects, interacts, and transacts with business.
We believe we have ample opportunity to drive performance benefi ts during the downturn as well as a compelling value proposition to deliver to our customers at what is a diffi cult time for them. We are focused on managing through this period in a nimble and aggressive manner. I have a high degree of confi dence in our strategy and our people, and we expect to emerge in a more powerful position in the years ahead.
William R. NutiChairman and Chief Executive Offi cer
2008 Revenue Mix by Geography
Europe / Middle East / Africa $2,066m
United States $1,787m
Asia / Pacifi c (excluding Japan) $628m
Americas (excluding United States) $482m
Japan $352m
UNITED STATESSECURITIES AND EXCHANGE COMMISSION
Washington, D.C. 20549
FORM 10-K
È ANNUAL REPORT PURSUANT TO SECTION 13 OR 15 (d) OF THESECURITIES EXCHANGE ACT OF 1934
For the fiscal year ended December 31, 2008
Commission File Number 001-00395
NCR CORPORATION(Exact name of registrant as specified in its charter)
Maryland 31-0387920(State or other jurisdiction of
incorporation or organization)(I.R.S. Employer
Identification No.)
1700 South Patterson Blvd.Dayton, Ohio 45479
(Address of principal executive offices) (Zip Code)
Registrant’s telephone number, including area code: (937) 445-5000
Securities registered pursuant to Section 12(b) of the Act:Title of each class Name of each exchange on which registered
Common Stock, par value $.01 per share New York Stock Exchange
Securities registered pursuant to Section 12(g) of the Act: None
Indicate by check mark if the registrant is a well-known seasoned issuer, as defined in Rule 405 of theSecurities Act. YES È NO ‘
Indicate by check mark if the registrant is not required to file reports pursuant to Section 13 or Section 15(d) of the Act. YES ‘ NO È
Indicate by check mark whether the registrant (1) has filed all reports required to be filed by Section 13 or15 (d) of the Securities Exchange Act of 1934 during the preceding 12 months (or for such shorter period that theregistrant was required to file such reports), and (2) has been subject to such filing requirements for the past 90days. YES È NO ‘
Indicate by check mark if disclosure of delinquent filers pursuant to Item 405 of Regulation S-K is notcontained herein, and will not be contained, to the best of the registrant’s knowledge, in definitive proxy orinformation statements incorporated by reference in Part III of this Form 10-K or any amendment to this Form10-K. È
Indicate by check mark whether the registrant is a large accelerated filer, an accelerated filer, anon-accelerated filer, or a smaller reporting company. See the definitions of “large accelerated filer,”“accelerated filer,” and “smaller reporting company” in Rule 12b-2 of the Exchange Act. (Check one):
Large accelerated filer È Accelerated filer ‘ Non-accelerated filer ‘ Smaller reporting company ‘
Indicate by check mark whether the registrant is a shell company (as defined in Rule 12b-2 of theAct). YES ‘ NO È
The aggregate market value of voting stock held by non-affiliates of the registrant as of June 30, 2008, wasapproximately $4.2 billion. As of February 13, 2009, there were approximately 158.2 million shares of commonstock issued and outstanding.
DOCUMENTS INCORPORATED BY REFERENCE
Part III: Portions of the Registrant’s Notice of Annual Meeting of Stockholders and Proxy Statement to be filedpursuant to Regulation 14A within 120 days after Registrant’s fiscal year end of December 31, 2008 areincorporated by reference.
TABLE OF CONTENTS
Item Description Page
PART I
1. Business . . . . . . . . . . . . . . . . . . . . . . . . . . . . . . . . . . . . . . . . . . . . . . . . . . . . . . . . . . . . . . . . . . . . . . . . . 11A. Risk Factors . . . . . . . . . . . . . . . . . . . . . . . . . . . . . . . . . . . . . . . . . . . . . . . . . . . . . . . . . . . . . . . . . . . . . . 71B. Unresolved Staff Comments . . . . . . . . . . . . . . . . . . . . . . . . . . . . . . . . . . . . . . . . . . . . . . . . . . . . . . . . . 132. Properties . . . . . . . . . . . . . . . . . . . . . . . . . . . . . . . . . . . . . . . . . . . . . . . . . . . . . . . . . . . . . . . . . . . . . . . . 133. Legal Proceedings . . . . . . . . . . . . . . . . . . . . . . . . . . . . . . . . . . . . . . . . . . . . . . . . . . . . . . . . . . . . . . . . . 134. Submission of Matters to a Vote of Security Holders . . . . . . . . . . . . . . . . . . . . . . . . . . . . . . . . . . . . . . 13
PART II
5. Market for the Registrant’s Common Equity, Related Stockholder Matters and Issuer Purchases ofEquity Securities . . . . . . . . . . . . . . . . . . . . . . . . . . . . . . . . . . . . . . . . . . . . . . . . . . . . . . . . . . . . . . . . 14
6. Selected Financial Data . . . . . . . . . . . . . . . . . . . . . . . . . . . . . . . . . . . . . . . . . . . . . . . . . . . . . . . . . . . . . 167. Management’s Discussion and Analysis of Financial Condition and Results of Operations . . . . . . . . 177A. Quantitative and Qualitative Disclosures about Market Risk . . . . . . . . . . . . . . . . . . . . . . . . . . . . . . . . 378. Financial Statements and Supplementary Data . . . . . . . . . . . . . . . . . . . . . . . . . . . . . . . . . . . . . . . . . . . 399. Changes in and Disagreements with Accountants on Accounting and Financial Disclosure . . . . . . . . 879A. Controls and Procedures . . . . . . . . . . . . . . . . . . . . . . . . . . . . . . . . . . . . . . . . . . . . . . . . . . . . . . . . . . . . . 879B. Other Information . . . . . . . . . . . . . . . . . . . . . . . . . . . . . . . . . . . . . . . . . . . . . . . . . . . . . . . . . . . . . . . . . . 88
PART III
10. Directors, Executive Officers and Corporate Governance . . . . . . . . . . . . . . . . . . . . . . . . . . . . . . . . . . . 8911. Executive Compensation . . . . . . . . . . . . . . . . . . . . . . . . . . . . . . . . . . . . . . . . . . . . . . . . . . . . . . . . . . . . 9112. Security Ownership of Certain Beneficial Owners and Management and Related Stockholder
Matters . . . . . . . . . . . . . . . . . . . . . . . . . . . . . . . . . . . . . . . . . . . . . . . . . . . . . . . . . . . . . . . . . . . . . . . . 9113. Certain Relationships and Related Transactions, and Director Independence . . . . . . . . . . . . . . . . . . . 9114. Principal Accountant Fees and Services . . . . . . . . . . . . . . . . . . . . . . . . . . . . . . . . . . . . . . . . . . . . . . . . 91
PART IV
15. Exhibits, Financial Statement Schedules . . . . . . . . . . . . . . . . . . . . . . . . . . . . . . . . . . . . . . . . . . . . . . . . 92
This Report contains trademarks, service marks, and registered marks of NCR Corporation and itssubsidiaries, and other companies, as indicated.
PART I
Item 1. BUSINESS
General
NCR Corporation and its subsidiaries (NCR or the Company, also referred to as “we”, “us” or “our”)provide technology and services that help businesses connect, interact and transact with their customers.
Businesses
NCR Corporation is a leading global technology company that provides innovative products and services tohelp businesses build stronger relationships with their customers. Through our presence at customer interactionpoints, such as automated teller machines (ATMs), retail point-of-sale (POS) workstations, self-service kiosks,and self-check-in/out systems, our solutions enable companies to address consumer demand for convenience,value and individual service. NCR also provides a complete portfolio of services to help customers design,deploy, support and manage technology solutions for our products as well as select third-party products.
Industries Served
NCR provides specific solutions for customers in a range of industries such as financial services, retail andhospitality, travel and gaming, healthcare and public sector, entertainment, and software and technology services.NCR’s solutions are built on a foundation of long-established industry knowledge and consulting expertise,value-added software and hardware technology, global customer support services, and a complete line ofbusiness consumables and specialty media products.
Company History
NCR was originally incorporated in 1884 and was a publicly traded company on the New York StockExchange prior to its merger with a wholly-owned subsidiary of AT&T Corp. (AT&T) on September 19, 1991.Subsequently, on December 31, 1996, AT&T distributed all of its interest in NCR to its stockholders (the“Distribution”). NCR common stock is listed on the New York Stock Exchange and trades under the symbol“NCR”.
On September 30, 2007, NCR completed the spin-off of its Teradata Data Warehousing business throughthe distribution of a tax-free stock dividend to its stockholders. NCR distributed one share of common stock ofTeradata Corporation (Teradata) for each share of NCR common stock to NCR stockholders of record as of theclose of business on September 14, 2007. For more information regarding the spin-off of Teradata, refer toManagement’s Discussion & Analysis (MD&A) in Item 7 and Note 12 of the Notes to Consolidated FinancialStatements, “Discontinued Operations,” in Item 8 of Part II of this Form 10-K report (Report).
Operating Segments
Effective January 1, 2008, NCR reorganized its businesses and management thereof to a geographic model,changing from the previous model of global business units organized by product and service offering. For theyear-ended December 31, 2008 and the prior periods reported in this Report, NCR categorizes its operations intothree reportable segments: Americas, Europe, Middle East and Africa (EMEA) and Asia Pacific and Japan (APJ).Each of these segments derives revenue by selling products and services to the financial services, retail andhospitality, travel and gaming, healthcare and public sector, entertainment, and software and technology servicesindustries. These products and services are described below.
The information required by Item 1 with respect to financial information regarding our reportable segmentscan be found in Item 7 of Part II of this Report under “Revenue and Gross Margin by Segment” as well as inItem 8 of Part II of this Report as part of Note 13 of the Notes to Consolidated Financial Statements, “SegmentInformation and Concentrations,” and is incorporated herein by reference.
1
Fo
rm10-K
Products and Services
We sell products and services that help businesses connect, interact and transact with their customers. Ourproduct and service offerings fall into the following categories:
ATMs and Financial Terminals
We provide financial institutions, retailers and independent deployers with financial-oriented self servicetechnologies, such as ATMs, cash dispensers, and software solutions, including the APTRA™ application suiteand consulting services related to ATM security, software and bank branch optimization. ATM and FinancialTerminal solutions are designed to quickly and reliably process consumer transactions and incorporate advancedfeatures such as automated check cashing/deposit, automated cash deposit, web-enablement and bill payment.These solutions enable businesses to reduce costs and generate new revenue streams while enhancing customerloyalty.
Self-Service Kiosks
NCR provides Self-Service Kiosks to the retail and hospitality, travel and gaming, healthcare and publicsector and entertainment industries. NCR’s versatile kiosk solutions can support numerous retail self-servicefunctions, including self-checkout, wayfinding, bill payment and gift registries. We provide kiosk solutions toairlines that enable self check-in and to hotels/casinos that allow guests to check-in/out without assistance. Thesesolutions create pleasant and convenient experiences for consumers and enable our customers to reduce costs.The kiosks for the hospitality industry provide consumers the ability to order and pay at restaurants whileenabling our customers to streamline order processing and reduce operating costs. NCR’s healthcare kiosksolutions offer wireless self-check-in for patients, integrate with existing information systems and physicianpractice management systems to make the check-in and check-out processes more convenient for patients andreduce costs and errors for our customers. NCR SelfServ Entertainment solutions allow our customers to provideconsumers the choices to rent, purchase or trade movies and games.
Point of Sale
We provide retail-oriented technologies such as Point of Sale (POS) terminals, bar-code scanners, softwareand services to companies worldwide. Combining our retail industry expertise, software and hardwaretechnologies, implementation and store performance consulting services, our solutions are designed to enablecost reductions and improve retailer operational efficiency while increasing the satisfaction of the retailer’scustomers.
Check and Document Imaging
NCR’s Check and Document Imaging offerings provide end-to-end solutions for both traditional paper-based and image-based check and item processing. These solutions utilize advanced image recognition andworkflow technologies to automate item processing, helping financial institutions increase efficiency and reduceoperating costs. Consisting of hardware, software, consulting and support services, our comprehensive Check andDocument Imaging solutions enable check and item-based transactions to be digitally captured, processed andretained within a flexible, scalable environment.
Services
Services are an essential and integrated component of NCR’s complete solution offerings. NCR providesmaintenance and support services for all NCR product offerings described above as well as for select third-partycompanies. In addition to maintenance and support services, NCR also provides other services including siteassessment and preparation, staging, installation and implementation, systems management and completemanaged services. NCR offerings include the service of third-party computer hardware from selectmanufacturers, such as Cisco Systems, who value and leverage NCR’s global service capability. However,
2
NCR’s strategy is to focus primarily on maintenance and support of NCR-branded products in order to capturehigher margin services and significantly reduce redundant costs associated with supporting/servicing multiplethird-party products.
In addition to the software solutions described previously, NCR is developing a suite of software andservices such as Software as a Service, hosted services, online, mobile, transactional services and applicationssuch as bill pay and digital signage. NCR is also focused on expanding the resale of third party networkingproducts and related service offerings to a broader base of customers in the telecommunications and technologysectors.
Consumables
NCR develops, produces and markets a complete line of printer consumables for various print technologies.These products include paper rolls for receipts in ATMs and POS solutions, inkjet and laser printer supplies,thermal transfer and ink ribbons, labels, laser documents, business forms, and specialty media items such asphoto and presentation papers, and two-sided thermal paper (2ST®). Consumables are designed to optimizeoperations and improve transaction accuracy, while reducing overall costs.
Target Markets and Distribution Channels
NCR’s ATMs and Financial Terminal solutions primarily serve the financial services industry withparticular focus on retail banking, which includes traditional providers of consumer banking and financialservices. These solutions also serve the retail markets through convenience banking products for retailersdesigned to complement their core businesses. Customers are located throughout the world in both establishedand emerging markets. NCR has historically sold most of its ATMs and Financial Terminals products andservices through a direct sales channel, although a portion of revenues is derived through distributors andvalue-added resellers.
NCR provides Self-Service Kiosk and POS solutions to retail and hospitality, travel and gaming, healthcareand public sector and entertainment industries. Retail and hospitality customers include department stores,specialty retailers, mass merchandisers, catalog stores, supermarkets, hypermarkets, grocery, drug, wholesalers,convenience stores, fast food/quick service/table service and other restaurants. The travel and gaming customersinclude airlines, airports, car rental, hotel/lodging and casinos. NCR’s healthcare customers include hospitals,clinics and other healthcare providers. The public sector customers include federal, state and local governmentsand government agencies. Self-Service Kiosk and POS solutions are sold through a direct sales force and throughalliances with value-added resellers, distributors and dealers. In the software and technology services industry,NCR sells networking solutions to telecommunications and technology customers. NCR has focused itsinvestments and resources on self-service technologies with expanded offerings to include DVD kiosks for theentertainment industry, self-ticketing for the travel industry and patient management check-in/out in thehealthcare sector.
NCR’s Payment & Imaging solutions primarily serve the financial services industry worldwide, with theprimary focus on banks. NCR has historically distributed most of its Payment & Imaging products and servicesthrough a direct sales channel, although certain revenues are derived through sales by value-added resellers anddistributors.
Our Consumables products are sold to the financial services and retail and hospitality industries as well ascustomers involved in transportation and manufacturing. While the Company has a direct sales force inapproximately 26 countries for consumables, these products are also sold through various channel partnersincluding office product retailers, contract stationers, value-added resellers, original equipment manufacturers aswell as through telemarketing and the internet.
Approximately 91% of our product sales are sold by our direct sales force, with the remainder sold throughindirect channels, including value-added resellers, distributors, and dealers.
3
Fo
rm10-K
NCR provides service and support for NCR’s products and solutions through service contracts with ourcustomers. NCR has also established managed service contracts with key customers and continues to pursueadditional managed service relationships. Longer term managed service arrangements serve to improve theefficiency and performance of the customer’s business, and increase the strategic and financial importance of itsrelationship with NCR. We also provide services on competing technologies—for example, IBM retailtechnologies and Diebold ATMs. The primary sales channel for our services is NCR’s direct sales teams, whichexist in all of NCR’s geographic operating segments. Our services professionals provide these services directly toend customers.
Competition
In the financial services industry, we compete with Diebold, Inc. and Wincor Nixdorf GmbH & Co.(Wincor), among others, across all of our geographic segments. The primary factors of competition can vary, buttypically include: value and quality of the solutions or products; total cost of ownership; industry knowledge ofthe vendor; the vendor’s ability to provide and support a total end-to-end solution; the vendor’s ability tointegrate new and existing systems; the fit of the vendor’s strategic vision with the customer’s strategic direction;and the quality of the vendor’s support and consulting services.
NCR faces strong competition in the retail and hospitality industry in all geographic segments. TheCompany believes that key competitive factors can vary by geographic area but typically include: value andquality of the solutions or products; total cost of ownership; industry knowledge of the vendor; and knowledge,experience and quality of the vendor’s consulting, deployment and support services. NCR’s competitors vary bymarket segment, product, service offering and geographic area, and include IBM, Wincor, Fujitsu, Hewlett-Packard Company, Dell Inc., Honeywell and Datalogic, among others.
NCR faces competition in the travel and gaming and entertainment industries. Competition in the travelindustry comes from IBM, SITA and IER. In the gaming industry, NCR’s key competitors are IBM, Wincor andCummins. In the entertainment industry, competition comes from makers of DVD rental kiosks, includingCoinstar, Inc. (through their redbox DVD kiosk business) and DVDPlay. Competition in the entertainmentindustry is primarily focused in the United States.
NCR faces competition for services from other technology and service providers, as well as from service-only firms, in all geographies where it operates around the world. The primary services competitors are thecompanies identified in NCR’s other solutions. Global technology providers are becoming more focused onservices as a core business strategy. NCR also competes with a range of smaller regional and local servicecompanies that differ by geography.
Competition for printer consumables is significant and varies by geographic area and product group. Theprimary areas of competitive differentiation typically include: quality; logistics and supply chain management;and total cost of ownership. While price is always a factor, we focus on the customer’s total cost of ownership forour consumables products. Total cost of ownership takes into account not only the per-unit cost, but also service,usage, reporting and support costs. NCR’s competitors include RiteMade Paper and Schades.
NCR faces competition in the financial services industry for payment and imaging solutions in all ourgeographic segments. The primary areas of competition can vary, but typically include: quality of the solutions orproducts; total cost of ownership; industry knowledge; the vendor’s ability to provide and support a totalend-to-end solution; the vendor’s ability to integrate new and existing systems; the fit of the vendor’s strategicvision with the customer’s strategic direction; and the quality of the vendor’s support and consulting services.NCR’s competitors vary by product, service offering and geographic area, and include Metavante Corporationand Unisys Corporation, among others.
Research and Development
We remain focused on designing and developing products, services and solutions that anticipate ourcustomers’ changing technological needs. The expenses for research and development related to NCR’s
4
continuing operations were $148 million in 2008, $137 million in 2007, and $119 million in 2006. We anticipatethat we will continue to have significant research and development expenditures in the future to provide acontinuing flow of innovative, high-quality products and services to maintain and enhance our competitiveposition. Information regarding the accounting and costs included in research and development activities isincluded in Note 1 of the Notes to Consolidated Financial Statements, “Description of Business and SignificantAccounting Policies,” in Item 8 of Part II of this Report and is incorporated herein by reference.
Patents and Trademarks
Our general policy is to seek patent protection for those innovations and improvements that are likely to beincorporated into our products and services, where such protection will improve our competitive position. NCRowns approximately 1,350 patents (which is down slightly from the number of patents in our portfolio at the endof 2007 and 2006) in the United States and a significant number in foreign countries. The foreign patents aregenerally counterparts of NCR’s U.S. patents. Many of the patents owned by NCR are licensed to others andNCR is licensed to use certain patents owned by others. While NCR’s portfolio of patents and patent applicationsin aggregate is of significant value to NCR, the Company does not believe that any particular individual patent isitself of material importance to NCR’s business as a whole.
NCR has registered certain trademarks and service marks in the United States and in a number of foreigncountries. NCR considers the mark “NCR” and many of its other trademarks and service marks to be valuableassets.
Seasonality
Our sales are historically seasonal, with lower revenue in the first quarter and higher revenue in the fourthquarter of each year. Such seasonality also causes our working capital cash flow requirements to vary fromquarter to quarter depending on the variability in the volume, timing and mix of product sales. In addition,revenue in the third month of each quarter is typically higher than in the first and second months. Informationregarding seasonality and its potential impact on our business is included in Item 1A of this Report under thecaption, “Operating Results Fluctuations,” and is incorporated herein by reference.
Manufacturing and Raw Materials
In most cases, there are a number of vendors providing the services and producing the parts and componentsthat we utilize. However, there are some services and components that are purchased from single sources due toprice, quality, technology or other reasons. For example, we depend on computer chips and microprocessors fromIntel Corporation and operating systems from Microsoft Corporation. Certain parts and components used in themanufacturing of our ATMs and the delivery of many of our retail solutions are also supplied by single sources.In addition, there are a number of key suppliers for our businesses who provide us with critical products for oursolutions.
In 2007, NCR transitioned the manufacturing of its ATMs, payment solutions, and self-checkout solutionsin the Americas to Flextronics International Ltd. (formerly, Solectron Corporation), a provider of electronicsmanufacturing and integrated supply-chain services. Flextronics also procures a variety of components used inthe manufacturing process on our behalf. Flextronics manufactures NCR products in Columbia, South Carolina;Guadalajara, Mexico; and Jaguarian, Brazil. Given the Company’s decision to outsource its manufacturingactivities for these products to Flextronics, a disruption in production at Flextronics could impact the timing ofcustomer shipments. Refer to Item 1A of this Report under the caption, “Reliance on Third Parties” for furtherinformation regarding the potential impact of this relationship on our business operations. Additional informationregarding sources and availability of raw materials is also included in Item 1A of this Report under the caption“Reliance on Third Parties,” and is incorporated herein by reference.
Employees
On December 31, 2008, NCR had approximately 22,400 employees and contractors.
5
Fo
rm10-K
Information
NCR makes available through its website, free of charge, its Annual Report on Form 10-K, QuarterlyReports on Form 10-Q, definitive proxy statements on Form 14A and Current Reports on Form 8-K, and allamendments to such reports, as soon as reasonably practicable after these reports are electronically filed orfurnished to the U.S. Securities and Exchange Commission (SEC) pursuant to Section 13(a) or 15(d) of theSecurities Exchange Act of 1934. NCR will furnish, without charge to a security holder upon written request, theNotice of Meeting and Proxy Statement for the 2009 Annual Meeting of Stockholders (the 2009 ProxyStatement), portions of which are incorporated herein by reference. NCR will furnish the Code of Conduct at nocost and any other exhibit at cost. Document requests are available by calling or writing to:
NCR—Investor Relations1700 S. Patterson BoulevardDayton, OH 45479Phone: 937-445-5905E-Mail: [email protected]: http://investor.ncr.com
Environmental Matters
Compliance with Federal, State, and local environmental regulations relating to the protection of theenvironment could have a material adverse impact on our capital expenditures, earnings or competitive position.While NCR does not currently expect to incur material capital expenditures related to compliance with such lawsand regulations, and while NCR believes the amounts provided in its Consolidated Financial Statements areadequate in light of the probable and estimable liabilities, there can be no assurances that there will not be amaterial adverse impact on capital expenditures, earnings or competitive position. A detailed discussion of thecurrent estimated impacts of compliance issues relating to environmental regulations, particularly the Fox Rivermatter, is reported in Item 8 of Part II of this Report as part of Note 11 of the Notes to Consolidated FinancialStatements, “Commitments and Contingencies,” and is incorporated herein by reference.
6
Item 1A. RISK FACTORS
This report and other documents that we file with the SEC, as well as other oral or written statements wemay make from time to time, contain information based on management’s beliefs and include forward-lookingstatements (within the meaning of the Private Securities Litigation Reform Act of 1995) that involve a number ofknown and unknown risks, uncertainties and assumptions. These forward-looking statements are not guaranteesof future performance, and there are a number of factors including, but not limited to, those listed below, thatcould cause actual outcomes and results to differ materially from the results contemplated by such forward-looking statements. We do not undertake any obligation to publicly update or revise any forward-lookingstatements, whether as a result of new information, future events or otherwise.
Economic Pressures Our business may be negatively affected by current global economic and creditconditions. The current economic climate could impact the ability of our customers to make capital expenditures,thereby affecting their ability to purchase our products or services. Additionally, customers in the financialservices sector, which has been severely impacted by the credit crisis, have consolidated in response to the crisisand may continue to do so, which could further impact our business by reducing our customer base. Furthermore,our retail customers are operating in a challenging environment and are faced with weak consumer spending. Asa result, these customers could face increased financial pressures that could impact their capital expenditures orability to pay accounts receivables owed to NCR.
Our customers sometimes finance their purchases of our products and services through third party financingcompanies. Overall economic conditions may have a material effect on our customers’ ability to obtain suchfinancing, which could result in an adverse effect on our operating results.
Our $500 million five-year unsecured revolving credit facility (the facility), which expires in 2012, isprovided by a syndication of several banks that share the committed financing under the facility. Economic andcredit market conditions have presented banks and financial institutions with significant challenges, which haslead a number of such entities to seek capital from the U.S. federal government. Although we monitor the abilityof the banks within the syndication to fulfill their counterparty responsibilities, future market conditions couldaffect the ability of one or more of these banks to provide the financing that has been committed under thefacility. The inability to access our facility would have a material, adverse effect on our business, results ofoperations, and liquidity.
Our $300 million senior unsecured notes due in June of 2009 and the facility both contain affirmative,negative, and financial covenants. We were in compliance with the terms of our covenants as of December 31,2008. A breach of these covenants could result in an event of default that could result in any amounts owed tobecome due and payable. Further, the lenders could terminate any commitments they have to provide us withfurther funds. If an event of default were to occur, we cannot make guarantees that we would have sufficientfunds available to pay the amounts due. We also cannot guarantee that we will be able to remain in compliancewith the covenants to which we are subject in the future or be assured that we would be able to obtain waiversfrom our lenders or amend the covenants.
The extent of the impact of current economic conditions will depend on a number of factors, including thelength and breadth of the U.S. and global recession, conditions in the global credit markets, and the effects ofplanned government actions to stimulate economic conditions.
Competition If we do not compete effectively within the technology industry, we will not be successful. Weoperate in the intensely competitive information technology industry. This industry is characterized by rapidlychanging technology, evolving industry standards, frequent new product introductions, price and cost reductions,and increasingly greater commoditization of products, making differentiation difficult. Our competitors includeother large companies in the technology industry, such as: IBM, Inc., Hewlett-Packard Company, Diebold, Inc.,Wincor, Fujitsu, and Unisys Corporation, some of which have more widespread distribution and penetration oftheir platforms and service offerings. In addition, we compete with companies in specific markets, such as entry-level ATMs, payment and imaging, and business consumables and media products. Our future competitiveperformance and market position depend on a number of factors, including our ability to: react to competitive
7
Fo
rm10-K
product and pricing pressures (particularly in the ATM marketplace); penetrate and meet the changingcompetitive requirements and deliverables in developing and emerging markets, such as India and China in theATM market; exploit opportunities in new vertical markets, such as travel and gaming, healthcare and publicsector, entertainment, and software and technology services; rapidly and continually design, develop and market,or otherwise maintain and introduce solutions and related products and services for our customers that arecompetitive in the marketplace; react on a timely basis to shifts in market demands; compete in reverse auctionsfor new and continuing business; reduce costs without creating operating inefficiencies; maintain competitiveoperating margins; improve product and service delivery quality; and effectively market and sell all of ourdiverse solutions. Our business and operating performance could be impacted by external competitive pressures,such as increasing price erosion and the addition of new competitors. Our customers sometimes finance ourproduct sales through third-party financing companies. In the case of customer default, these financingcompanies may be forced to resell this equipment at discounted prices, thus impacting our ability to sellincremental units. The impact of these product and pricing pressures could include lower customer satisfaction,decreased demand for our solutions, loss of market share and reduction of operating profits.
Operating Results Fluctuations Our revenue and operating results could fluctuate for a number ofreasons, including:
Seasonality Our sales are historically seasonal, with lower revenue in the first quarter and higher revenue inthe fourth quarter of each year. Such seasonality also causes our working capital cash flow requirements to varyfrom quarter to quarter depending on the variability in the volume, timing and mix of product sales. In addition,revenue in the third month of each quarter is typically higher than in the first and second months. These factors,among other things, make forecasting more difficult and may adversely affect our ability to manage workingcapital and to predict financial results accurately.
Foreign Currency Our revenue and operating income are subject to variability due to the effects of foreigncurrency fluctuations against the U.S. Dollar. We have exposure to approximately 50 functional currencies. Dueto our global operations, weaknesses in some of these currencies are sometimes offset by strengths in others. Theeffects of currency fluctuations are partially mitigated by our hedging strategy; however, certain significantcurrency fluctuations could adversely affect our results of operations, including sales and gross margins.
Cost/Expense Reductions We are actively working to reduce our costs and expenses to improve operatingprofitability without jeopardizing the quality of our products or the effectiveness of our operations. Our successin achieving targeted cost and expense reductions depends on a number of factors, including our ability toachieve infrastructure rationalizations, drive lower component costs, improve supply chain efficiencies, andamong other things, optimize the efficiency of our customer services resources. If we do not successfully executeon our cost reduction initiatives or if we experience delays in completing the implementation of these initiatives,our results of operations or financial condition could be adversely affected.
Contractual Obligations of Consulting Services We maintain a professional services consulting workforceto fulfill contracts that we enter into with our customers that may extend to multiple periods. Our profitability islargely a function of performing to customer contractual arrangements within the estimated costs to performthese obligations. If we exceed these estimated costs, our profitability related to these contracts may benegatively impacted. In addition, if we are unable to maintain appropriate utilization rates for our consultants, wemay not be able to sustain profitability on these contracts.
Diversification While we believe the spin-off of Teradata on September 30, 2007 was the proper strategicmove for both companies, following the spin-off, the Company is less diversified than before. Consequently, wemust rely primarily on our self-service and assisted-service products (along with the associated services) to drivegrowth and profitability. If these products or service offerings suffer a significant decrease in demand or increasein costs, our results of operations or financial condition could be adversely affected.
Acquisitions and Divestitures As part of our strategy, we intend to selectively acquire and divesttechnologies, products and businesses. As these acquisitions and divestitures take place and we begin to includeor exclude, as the case may be, the financial results related to these transactions, it could cause our operating
8
results to fluctuate materially, depending on the size and nature of any future transactions. In addition, ouroperating results may be adversely affected if we are unable to properly integrate future acquisitions or ifinvestments do not perform or meet expectations from the time of the transaction.
Pension Funds Consistent with local competitive practice and regulations, we sponsor pension plans inmany of the countries where we do business. A number of these pension plans are supported by pension fundinvestments that are subject to financial market risk. The liabilities, assets and costs of these plans are reported inour financial statements in accordance with Statement of Financial Accounting Standards No. 87 (SFAS 87),Employer’s Accounting for Pensions, Statement of Financial Accounting Standards No. 132 (revised 2003)(SFAS 132R), Employers’ Disclosures about Pensions and Other Postretirement Benefits, and Statement ofFinancial Accounting Standards No. 158 (SFAS 158), Employer’s Accounting for Defined Benefit Pension andOther Postretirement Plans. In conforming to these standards, we are required to make a number of actuarialassumptions for each plan, including the expected long-term return on plan assets and the discount rate.
Consistent with the requirements of SFAS 87, we estimate our discount rate and long-term expected rate ofreturn on asset assumptions on a country-by-country basis after consultation with independent actuarialconsultants. We examine interest rate levels and trends within each country, particularly yields on high-qualitylong-term corporate bonds, relative to our expected future benefit payments to determine our discount rateassumptions. Our long-term expected rate of return on asset assumptions are developed by considering the assetallocation and implementation strategies employed by each pension fund relative to capital market expectations.
In 2008, financial markets experienced significant volatility, with declining government bond yields andwidening credit spreads on fixed income investments and poor performance in equity markets. As a result, weexperienced significant declines in the value of plan assets, which will materially affect our future operatingresults. Further, as a result of the 2008 plan performance we now have a significant, underfunded pensionobligation, which may require material increases in cash contributions in future years. Our financial position andliquidity could be materially impacted by these contributions. See “Effects of Pension, Postemployment andPostretirement Benefit Plans” and “Financial Condition, Liquidity And Capital Resources” sections of theMD&A included in Item 7 of Part II of this Report and Note 9, “Employee Benefit Plans” in the Notes to theConsolidated Financial included in Item 8 of Part II of this Report for further information regarding the fundedstatus of our plans and future cash contributions.
Our future financial results could be materially impacted by further volatility in the performance of financialmarkets, changes in regulations regarding funding requirements, and changes in the actuarial assumptions,including those described in our “Critical Accounting Policies and Estimates” section of the MD&A included inItem 7 of Part II of this Report.
Stock-based Compensation Similar to other companies, we use stock awards as a form of compensation forcertain employees. The Company adopted Statement of Financial Accounting Standards No. 123R (revised 2004)(SFAS 123R), Share-Based Payment, beginning January 1, 2006. SFAS 123R requires all stock-based paymentsto employees, including grants of employee stock options, to be recognized in the financial statements based ontheir fair values. The amount recognized for stock compensation expense could vary depending on a number ofassumptions or changes. For example, assumptions such as the risk-free rate, expected holding period andexpected volatility that drive our valuation model could change. Other examples that could have an impactinclude changes in the mix and type of awards, changes in our compensation plans or tax rate, changes in ourforfeiture rate, differences in actual results compared to management’s estimates for performance-based awardsor an unusually high amount of expirations of stock options.
Income Taxes We are subject to income taxes in the United States and a number of foreign jurisdictions.We account for income taxes in accordance with Statement of Financial Accounting Standards No. 109 (SFAS109), Accounting for Income Taxes, which recognizes deferred tax assets and liabilities based on the differencesbetween the financial statement carrying amounts and the tax basis of assets and liabilities. We regularly reviewour deferred tax assets for recoverability and establish a valuation allowance if it is more likely than not thatsome portion or all of a deferred tax asset will not be realized. As a result of the significant declines in the valueof pension plan assets and increases in the actuarially valued pension benefit obligations, our deferred tax assets
9
Fo
rm10-K
increased significantly in 2008. If we are unable to generate sufficient future taxable income, if there is a materialchange in the actual effective tax rates, if the time period within which the underlying temporary differencesbecome taxable or deductible, or if the tax laws change unfavorably, then we could be required to increase ourvaluation allowance against our deferred tax assets, which could result in a material increase in our effective taxrate. Additionally, we are subject to ongoing tax audits in various jurisdictions both in the U.S. andinternationally, whose outcomes could result in the assessment of additional taxes. Our effective tax rate in thefuture could be adversely affected by changes in the mix of earnings in countries with differing statutory taxrates, the changes in the valuation of deferred tax assets and liabilities, changes in tax laws and regulations, andmanagement’s assessment in regards to repatriation of earnings.
Real Estate Our strategy over the past several years with respect to owned and leased real estate has been toreduce our holdings of excess real estate. In line with this strategy, the exit of facilities may affect net income,and current and future real estate market conditions could impede our ability to reduce the size of our real estateportfolio or affect the amount of consideration received in any transactions.
Multinational Operations Our multinational operations expose us to business and legal risk in the variouscountries where we do business. For the years ended December 31, 2008 and 2007, the percentage of revenuesfrom outside of the United States was 67% and 65%, respectively. We believe that our geographic diversity mayhelp to mitigate some risks associated with geographic concentrations of operations (e.g., adverse changes inforeign currency exchange rates, deteriorating economic environments or business disruptions due to economicor political uncertainties). However, our ability to manufacture and sell our solutions domestically in the UnitedStates and internationally is subject to risks, which include among others: the impact of the global economic andcredit crises on the stability of national economies, including those of countries where we have operations;political conditions in each country that could adversely affect demand for our solutions in these markets; theimpact of a continued downturn in the global economy on demand for our products in these countries; currencyexchange rate fluctuations that could result in lower demand for our products as well as generate currencytranslation losses; changes to and compliance with a variety of local laws and regulations that may increase ourcost of doing business in these markets or otherwise prevent us from effectively competing in these markets;changing competitive requirements and deliverables in developing and emerging markets; and the impact of civilunrest relating to war and terrorist activity on the economy or markets in general, or on our ability, or that of oursuppliers, to meet commitments.
Introduction of New Solutions If we do not swiftly and successfully develop and introduce new solutionsin the competitive, rapidly changing environment in which we do business, our business results will be impacted.The development process for our solutions requires high levels of innovation from both our product developmentteam and our suppliers of the components embedded in our solutions. In addition, the development process canbe lengthy and costly, and requires us to commit a significant amount of resources to bring our business solutionsto market. If we are unable to anticipate our customers’ needs and technological trends accurately, or areotherwise unable to complete development efficiently, we would be unable to introduce new solutions into themarket on a timely basis, if at all, and our business and operating results could be impacted. Likewise, wesometimes make assurances to customers regarding the operability and specifications of new technologies, andour results could be impacted if we are unable to deliver such technologies as planned. Also, if we cannotsuccessfully market and sell both existing and newly developed solutions, our business and operating resultscould be impacted. Our hardware and software-based solutions may contain known, as well as undetected errors,which may be found after the product introductions and shipments. While we attempt to remedy errors that webelieve would be considered critical by our customers prior to shipment, we may not be able to detect or remedyall such errors, and this could result in lost revenues, delays in customer acceptance and incremental costs, eachof which would impact our business and operating results.
Reliance on Third Parties If third-party suppliers upon which we rely are not available, our ability tobring our products to market in a timely fashion could be affected. In most cases, there are a number of vendorsproviding the services and producing the parts and components that we utilize. However, there are some servicesand components that are purchased from single sources due to price, quality, technology or other reasons. Forexample, we depend on transaction processing services from Accenture, computer chips and microprocessors
10
from Intel Corporation, contract manufacturing from Flextronics International Ltd. (formerly, SolectronCorporation) and operating systems from Microsoft Corporation. Certain parts and components used in themanufacturing of our ATMs and the delivery of many of our retail solutions are also supplied by single sources.In addition, there are a number of key suppliers for our businesses who provide us with critical products for oursolutions. If we were unable to purchase the necessary services, including contract manufacturing, parts,components or products from a particular vendor, and we had to find an alternative supplier, our new andexisting product shipments and solution deliveries could be delayed, impacting our business and operatingresults.
We have, from time to time, formed alliances with third parties that have complementary products,software, services and skills. Many different relationships are formed by these alliances, such as outsourcingarrangements to manufacture hardware and subcontract agreements with third parties to perform services andprovide products and software to our customers in connection with our solutions. For example, we rely on thirdparties for cash replenishment services for our ATM products. Also, some of these third parties have access toconfidential NCR and customer data, the integrity and security of which we need to ensure. These alliancesintroduce risks that we cannot control, such as nonperformance by third parties and difficulties with or delays inintegrating elements provided by third parties into our solutions. Lack of information technology infrastructure,shortages in business capitalization, and manual processes and data integrity issues of smaller suppliers can alsocreate product time delays, inventory and invoicing problems, staging delays, as well as other operating issues.The failure of third parties to provide high-quality products or services that conform to required specifications orcontractual arrangements could impair the delivery of our solutions on a timely basis, create exposure fornon-compliance with our contractual commitments to our customers and impact our business and operatingresults.
Intellectual Property Our continuing ability to be a leading technology and services solutions providercould be negatively affected if we do not develop and protect intellectual property that drives innovation. To thatend, it is critical that we continue to develop leading technologies to protect and enhance our proprietary rights inour intellectual property through patent, copyright, trademark and trade secret laws. These efforts includeprotection of the products and application, diagnostic and other software we develop. To the extent we are notsuccessful, our business could be adversely impacted. Also, many of our offerings rely on technologiesdeveloped by others, and if we are unable to continue to obtain licenses for such technologies, our businesswould be impacted. Over the last several years, there has been an increase in the issuance of software andbusiness method patents, and more companies are aggressively enforcing their intellectual property rights. Thistrend could impact NCR because, from time to time, we receive notices from third parties regarding patent andother intellectual property claims. Whether such claims are with or without merit, they may require significantresources to defend. If an infringement claim is successful, or in the event we are unable to license the infringedtechnology or to substitute similar non-infringing technology, our business could be adversely affected.
Work Environment Our restructuring and re-engineering initiatives could negatively impact productivityand business results. As part of our ongoing efforts to optimize our cost structure, from time to time, we shift andrealign our employee resources, which could temporarily result in reduced productivity levels. In addition toreducing costs and expenses, we have initiatives to grow revenue, such as improving sales training, addressingsales territory requirements, maintaining and monitoring customer satisfaction with our solutions, and focusingon our strong value propositions. We typically have many initiatives underway. If we are not successful inmanaging our various restructuring and re-engineering initiatives, our business and operating results could benegatively impacted.
If we do not attract and retain quality employees, we may not be able to meet our business objectives. Ouremployees are vital to our success. Our ability to attract and retain highly skilled technical, sales, consulting andother key personnel is critical, as these key employees are difficult to replace. If we are unable to attract or retainhighly qualified employees by offering competitive compensation, secure work environments and leadershipopportunities now and in the future, our business and operating results could be negatively impacted.
If we do not maintain effective internal controls, accounting policies, practices, and information systemsnecessary to ensure reliable reporting of our results, our ability to comply with our legal obligations could be
11
Fo
rm10-K
negatively affected. Our internal controls, accounting policies and practices, and internal information systemsenable us to capture and process transactions in a timely and accurate manner in compliance with accountingprinciples generally accepted in the United States of America, laws and regulations, taxation requirements andfederal securities laws and regulations. Our internal controls and policies are being closely monitored bymanagement as we continue to implement a worldwide Enterprise Resource Planning (ERP) system and continuefurther transitions of our transaction support functions to Accenture. While we believe these controls, policies,practices and systems are adequate to ensure data integrity, unanticipated and unauthorized actions of employeesor contractors (both domestic and international), temporary lapses in internal controls due to shortfalls intransition planning and oversight, or resource constraints, could lead to improprieties and undetected errors thatcould impact our financial condition, results of operations, or compliance with legal obligations. Moreover, whilemanagement has concluded that the Company’s internal control over financial reporting was effective as ofDecember 31, 2008 (as set forth in “Management’s Report on Internal Control over Financial Reporting”included in Item 9A of this Report), due to their inherent limitations, such controls may not prevent or detectmisstatements in our reported financial statements. Such limitations include, among other things, the potential forhuman error or circumvention of controls. Further, the Company’s internal control over financial reporting issubject to the risk that controls may become inadequate because of a failure to remediate control deficiencies,changes in conditions or a deterioration of the degree of compliance with established policies and procedures.
Our ability to effectively manage our business could be negatively impacted if we do not invest in andmaintain reliable information systems. It is periodically necessary to replace, upgrade or modify our internalinformation systems. If we are unable to replace, upgrade or modify such systems in a timely and cost-effectivemanner, especially in light of demands on our information technology resources, our ability to capture andprocess financial transactions and therefore, our financial condition, results of operations, or ability to complywith legal and regulatory reporting obligations, may be impacted.
Acquisitions and Alliances If we do not successfully integrate acquisitions or effectively manage allianceactivities; we may not drive future growth. As part of our overall solutions strategy, we intend to makeinvestments in companies, products, services and technologies, either through acquisitions, investments, jointventures or strategic alliances. Acquisitions and alliance activities inherently involve risks. The risks we mayencounter include those associated with assimilating and integrating different business operations, corporatecultures, personnel, infrastructures and technologies or products acquired or licensed, and the potential forunknown liabilities within the acquired or combined business. Further, we make acquisitions and investments inorder to acquire or obtain access to new technology or products that expand our offerings to new industryverticals, such as the entertainment industry. There is risk that the new technology or products may not performas anticipated or that the new industry verticals may not meet estimated growth projections or expectations, inwhich case we may not be able to fully realize the benefit of our investments. An acquisition or alliance may alsodisrupt our ongoing business or we may not be able to successfully incorporate acquired products, services ortechnologies into our solutions and maintain quality. Further, we may not achieve the projected synergies oncewe have integrated the business into our operations, which may lead to additional costs not anticipated at the timeof acquisition.
Environmental Our historical and ongoing manufacturing activities subject us to environmentalexposures. Our facilities and operations are subject to a wide range of environmental protection laws, and wehave investigatory and remedial activities underway at a number of facilities that we currently own or operate, orformerly owned or operated, to comply, or to determine compliance, with such laws. In addition, our products aresubject to environmental laws in certain jurisdictions. Given the uncertainties inherent in such activities, therecan be no assurances that the costs required to comply with applicable environmental laws will not impact futureoperating results. We have also been identified as a potentially responsible party in connection with certainenvironmental matters, including the Fox River matter, as further described in Note 11 of the Notes toConsolidated Financial Statements, “Commitments and Contingencies,” included in Item 8 of Part II of thisReport; in “Environmental Matters” within Item 1 of Part I of this Report; and in “Environmental and LegalContingencies” within the “Critical Accounting Policies and Estimates” section of the MD&A included in Item 7of Part II of this Report, and we incorporate such disclosures by reference and make them a part of this riskfactor. As described in more detail in such disclosures, we maintain an accrual for our potential liability relating
12
to the Fox River matter that represents certain critical estimates and judgments made by us regarding ourpotential liability; however, both the ultimate costs associated with the Fox River matter and our share of thosecosts are subject to a wide range of potential outcomes outside of our control, which could impact our futureoperating results and the amount of accrued liability.
Contingencies We face uncertainties with regard to regulations, lawsuits and other related matters. In thenormal course of business, we are subject to proceedings, lawsuits, claims and other matters, including those thatrelate to the environment, health and safety, employee benefits, export compliance, intellectual property, dataprivacy and other regulatory compliance and general matters. Because such matters are subject to manyuncertainties, their outcomes are not predictable and we must make certain estimates in our financial statements.While we believe that amounts provided in our Consolidated Financial Statements are currently adequate in light ofthe probable and estimable liabilities, there can be no assurances that the amounts required to satisfy allegedliabilities from such matters will not impact future operating results. Additionally, we are subject to diverse andcomplex laws and regulations, including those relating to corporate governance, public disclosure and reporting,which are rapidly changing and subject to many possible changes in the future. Although we do not believe thatrecent regulatory and legal initiatives will result in significant changes to our internal practices or our operations,changes in accounting standards, taxation requirements, and federal securities laws and regulations, among others,may substantially increase costs to our organization or could have an impact on our future operating results.
Item 1B. UNRESOLVED STAFF COMMENTS
None.
Item 2. PROPERTIES
As of January 1, 2009, NCR operated 211 facilities consisting of approximately 6.8 million square feetthroughout the world. On a square footage basis, 43% of these facilities are owned and 57% are leased. Withinthe total facility portfolio, NCR operates 23 research and development and manufacturing facilities totaling2.1 million square feet, 53% of which is owned. The remaining 4.7 million square feet of space includes office,repair, warehouse and other miscellaneous sites, and is 38% owned. NCR maintains facilities in 59 countries.NCR believes its plants and facilities are suitable and adequate, and have sufficient production capacity to meetits current needs.
NCR is headquartered in Dayton, Ohio.
Item 3. LEGAL PROCEEDINGS
Information regarding legal proceedings is included in Item 8 of Part II of this Report as part of Note 11 ofthe Notes to Consolidated Financial Statements, “Commitments and Contingencies,” and is incorporated hereinby reference.
Item 4. SUBMISSION OF MATTERS TO A VOTE OF SECURITY HOLDERS
None.
13
Fo
rm10-K
PART II
Item 5. MARKET FOR THE REGISTRANT’S COMMON EQUITY, RELATED STOCKHOLDERMATTERS AND ISSUER PURCHASES OF EQUITY SECURITIES
NCR common stock is listed on the New York Stock Exchange and trades under the symbol “NCR.” Therewere approximately 321,648 holders of NCR common stock as of February 9, 2009. The following table presentsthe high and low per share prices for NCR common stock for each quarter of 2008 and 2007.
2008 2007
High Low High Low
1st Quarter . . . . . . . . . . . . . . . . . $25.08 $19.25 1st Quarter . . . . . . . . . . . . . . . $49.31 $42.342nd Quarter . . . . . . . . . . . . . . . . $27.69 $22.85 2nd Quarter . . . . . . . . . . . . . . $54.44 $46.943rd Quarter . . . . . . . . . . . . . . . . . $28.09 $20.50 3rd Quarter . . . . . . . . . . . . . . . $57.50 $44.144th Quarter . . . . . . . . . . . . . . . . . $22.14 $12.23 4th Quarter (a) . . . . . . . . . . . . . $29.39 $22.56
(a) On September 30, 2007, NCR completed the spin-off of its Teradata Data Warehousing business to anindependent, publicly-traded company through a tax free distribution to the Company’s stockholders.Market prices presented in the tables above are unadjusted and include the value of the Teradata DataWarehousing business until the date of the spin-off.
Although historically NCR has not paid cash dividends and does not anticipate the payment of cashdividends on NCR common stock in the immediate future, the declaration of dividends would be subject to thediscretion of NCR’s Board of Directors.
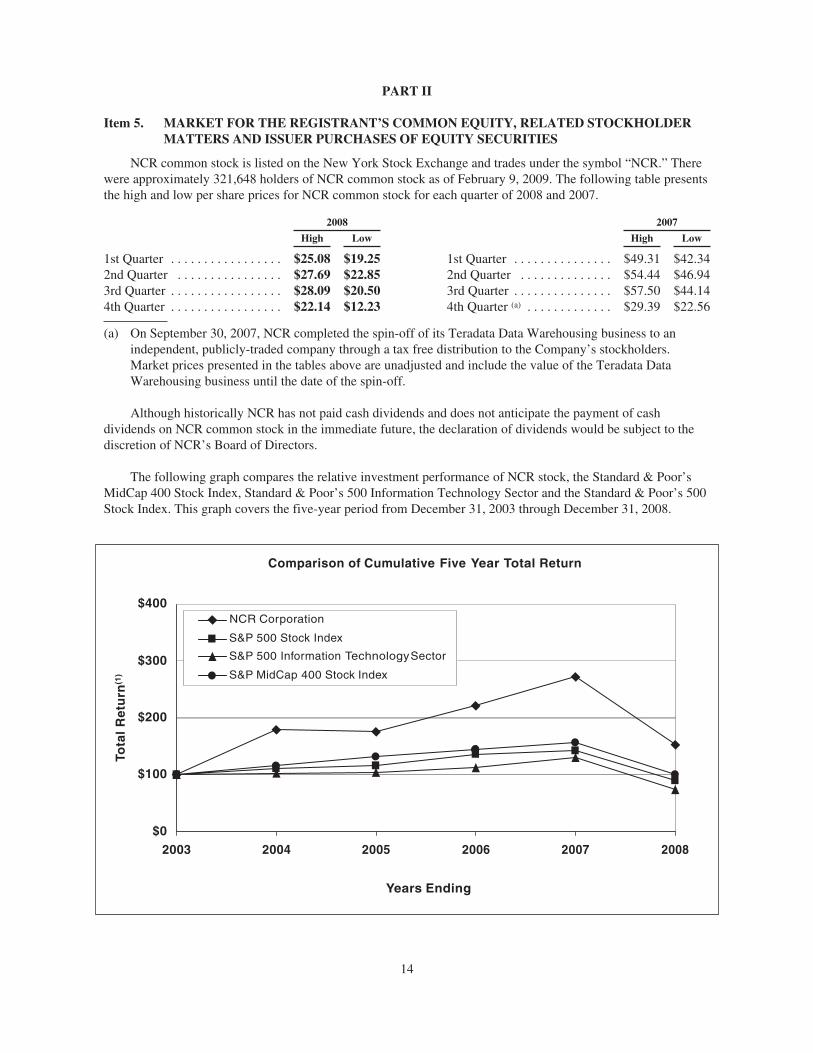
The following graph compares the relative investment performance of NCR stock, the Standard & Poor’sMidCap 400 Stock Index, Standard & Poor’s 500 Information Technology Sector and the Standard & Poor’s 500Stock Index. This graph covers the five-year period from December 31, 2003 through December 31, 2008.
Comparison of Cumulative Five Year Total Return
Years
Tota
l R
etu
rn(1
)
Ending
$400
$300
$200
$100
2003 2004 2005 2006 2007 2008$0
S&P 500 Stock Index
NCR Corporation
S&P MidCap Stock Index400
500S&P TechnologySectorInformation
14
Company / Index 2003 2004 2005 2006 2007 2008
NCR Corporation (2) . . . . . . . . . . . . . . . . . . . . . . . . . . . . . . . . . . . . . . $100 $178 $175 $220 $272 $153S&P 500 Stock Index . . . . . . . . . . . . . . . . . . . . . . . . . . . . . . . . . . . . . $100 $111 $116 $135 $142 $ 90S&P 500 Information Technology Sector . . . . . . . . . . . . . . . . . . . . . . $100 $103 $104 $112 $131 $ 74S&P MidCap 400 Stock Index . . . . . . . . . . . . . . . . . . . . . . . . . . . . . . $100 $116 $131 $145 $156 $100
(1) In each case, assumes a $100 investment on December 31, 2003, and reinvestment of all dividends, if any.(2) For the year ended December 31, 2007, includes a dividend of $26.45 per share based on the opening stock
price of Teradata Corporation on October 1, 2007.
Purchase of Company Common Stock The 1999 Board of Directors’ authorization permits the Companyto repurchase shares of outstanding common stock. On October 31, 2007, the NCR Board of Directors authorizedan additional $250 million for stock repurchases under this program. The 2000 Board of Directors sharerepurchase program authorized the Company to purchase NCR common stock to the extent of cash received fromthe exercise of stock options and the purchase of shares under the NCR Employee Stock Purchase Plan (ESPP).
For the year ended December 31, 2008, the Company executed trades for 21.6 million shares of its commonstock under the 1999 and 2000 Board of Directors share repurchase programs, of which 3.7 million shares werecompleted during the fourth quarter of 2008 at an average price per share of $18.99. As of December 31, 2008,the Company had a total remaining authorization of $26.3 million to repurchase outstanding shares of NCRcommon stock.
In addition to those share purchases, the Company occasionally purchases vested restricted stock orexercised stock option shares from Section 16 officers, at the current market price to cover their withholdingtaxes. For 2008, the total of these purchases was 59,691 shares at an average price of $19.74 per share.
The following table provides information relating to the Company’s repurchase of common stock for theyear ended December 31, 2008:
Time Period
Total Number ofShares
Purchased
AveragePrice Paidper Share
Total Number of SharesPurchased as Part of
Publicly Announced 2000Board Authorized
Dilution Offset Program
Total Number of SharesPurchased as Part ofPublicly Announced
1999 Board AuthorizedProgram
Maximum DollarValue of Sharesthat May Yet be
Purchased Underthe 1999 Program
First quarter total . . . . . 8,674,189 $22.29 221,980 8,452,209 $315,922,251
Second quarter total . . . 5,158,500 $24.60 219,378 4,939,122 $194,717,287
Third quarter total . . . . . 4,120,223 $25.27 205,244 3,914,979 $ 95,378,772
October 1 throughOctober 31, 2008 . . . . . 3,665,100 $18.99 34,255 3,630,845 $ 26,332,207
November 1 throughNovember 30, 2008 . . . — $ — — — $ 26,332,207
December 1 throughDecember 31, 2008 . . . — $ — — — $ 26,332,207
Fourth quarter total . . . . 3,665,100 $18.99 34,255 3,630,845 $ 26,332,207
Full Year . . . . . . . . . . . . . 21,618,012 $22.85 680,857 20,937,155 $ 26,332,207
15
Fo
rm10-K
Item 6. SELECTED FINANCIAL DATA
In millions, except per share and employee and contractor amountsFor the years ended December 31 2008 2007 2006 2005 2004
Continuing Operations (a)
Revenue . . . . . . . . . . . . . . . . . . . . . . . . . . . . . . . . . . . . $ 5,315 $ 4,970 $ 4,582 $ 4,561 $ 4,635Income from operations . . . . . . . . . . . . . . . . . . . . . . . $ 322 $ 219 $ 154 $ 120 $ 28Other expense (income), net . . . . . . . . . . . . . . . . . . . . $ 33 $ (13) $ (5) $ 14 $ (18)Income tax expense (benefit) . . . . . . . . . . . . . . . . . . . $ 58 $ 61 $ 8 $ (210) $ (89)Income from continuing operations (c) . . . . . . . . . . . . $ 231 $ 171 $ 151 $ 316 $ 135
(Loss) income from discontinued operations, net of tax . . . $ (3) $ 103 $ 231 $ 213 $ 155Basic earnings (loss) per common share
From continuing operations (a,c) . . . . . . . . . . . . . . . . . $ 1.40 $ 0.95 $ 0.84 $ 1.71 $ 0.72From discontinued operations . . . . . . . . . . . . . . . . . . . $ (0.02) $ 0.57 $ 1.28 $ 1.15 $ 0.83
Total basic earnings per common share . . . . . . . . . . . $ 1.38 $ 1.52 $ 2.12 $ 2.86 $ 1.55Diluted earnings (loss) per common share
From continuing operations (a,c) . . . . . . . . . . . . . . . . . $ 1.38 $ 0.94 $ 0.83 $ 1.67 $ 0.70From discontinued operations . . . . . . . . . . . . . . . . . . . $ (0.02) $ 0.56 $ 1.26 $ 1.13 $ 0.81
Total diluted earnings per common share . . . . . . . . . . $ 1.36 $ 1.50 $ 2.09 $ 2.80 $ 1.51Cash dividends per share . . . . . . . . . . . . . . . . . . . . . . . . . . . $ — $ — $ — $ — $ —
As of December 31Total assets . . . . . . . . . . . . . . . . . . . . . . . . . . . . . . . . . . . . . $ 4,255 $ 4,780(b) $ 5,227 $ 5,287 $ 5,554Total debt . . . . . . . . . . . . . . . . . . . . . . . . . . . . . . . . . . . . . . $ 308 $ 308(b) $ 307 $ 307 $ 309Stockholders' equity . . . . . . . . . . . . . . . . . . . . . . . . . . . . . . $ 440 $ 1,757(b) $ 1,881 $ 2,035 $ 2,086Number of employees and contractors . . . . . . . . . . . . . . . . 22,400 23,200(b) 28,900 28,200 28,500
(a) Continuing operations exclude the results of the Teradata Data Warehousing business which was spun-offthrough a tax free distribution to the Company’s stockholders on September 30, 2007.
(b) Reflects NCR’s assets, debt, stockholders’ equity and number of employees and contractors from continuingoperations following the spin-off of Teradata on September 30, 2007.
(c) The following income (expense) amounts are included in income from continuing operations for the yearsended December 31:
In millions 2008 2007 2006 2005 2004
Reserve for legal matters . . . . . . . . . . . . . . . . . . . . . . . . . . . . . . . . . . . . . . . . . $ (8) $— $— $— $—Organizational realignment initiative . . . . . . . . . . . . . . . . . . . . . . . . . . . . . . . (45) — — — —Manufacturing realignment initiative . . . . . . . . . . . . . . . . . . . . . . . . . . . . . . . — (38) — — —Japan realignment initiative . . . . . . . . . . . . . . . . . . . . . . . . . . . . . . . . . . . . . . — (18) — — —Costs related to Teradata spin-off . . . . . . . . . . . . . . . . . . . . . . . . . . . . . . . . . . — (12) — — —Costs associated with the Fox River environmental matter . . . . . . . . . . . . . . (18) (9) — — —Tax adjustments . . . . . . . . . . . . . . . . . . . . . . . . . . . . . . . . . . . . . . . . . . . . . . . . — (10) — 9 —Pension expense associated with early retirement programs . . . . . . . . . . . . . — — (7) (14) —Reductions of prior year accruals . . . . . . . . . . . . . . . . . . . . . . . . . . . . . . . . . . — — — 4 —Net gains from sales of real estate . . . . . . . . . . . . . . . . . . . . . . . . . . . . . . . . . . 13 — — 11 11Contribution to NCR charitable foundation . . . . . . . . . . . . . . . . . . . . . . . . . . — — — (5) —Write-down of equity investment . . . . . . . . . . . . . . . . . . . . . . . . . . . . . . . . . . — — — (10) —Settlements of prior year tax audits . . . . . . . . . . . . . . . . . . . . . . . . . . . . . . . . . — — — 181 71Costs relating to the exit of real estate facilities . . . . . . . . . . . . . . . . . . . . . . . — — — — (3)Acquisition break-up fee . . . . . . . . . . . . . . . . . . . . . . . . . . . . . . . . . . . . . . . . . — — — — 2Recovery of fully-reserved non-trade receivable . . . . . . . . . . . . . . . . . . . . . . — — — — 3Release of reserve related to the exit of certain Middle East and Africa
countries . . . . . . . . . . . . . . . . . . . . . . . . . . . . . . . . . . . . . . . . . . . . . . . . . . . — — — — 8
TOTAL . . . . . . . . . . . . . . . . . . . . . . . . . . . . . . . . . . . . . . . . . . . . . . . . . . . . . . $ (58) $ (87) $ (7) $176 $ 92
16
Item 7. MANAGEMENT’S DISCUSSION AND ANALYSIS OF FINANCIAL CONDITION ANDRESULTS OF OPERATIONS (MD&A)
BUSINESS OVERVIEW
NCR Corporation is a leading global technology company that provides innovative products and services tohelp businesses connect, interact and transact with their customers. Through our presence at customer interactionpoints, such as automated teller machines (ATMs), retail point-of-sale (POS) workstations, self-service kiosksand self-check-in/out systems, our solutions enable companies to address consumer demand for convenience,value and individual service. We also provide support services for NCR’s solutions as well as select third-partyproducts.
We deliver our products and solutions to many industries on a global basis, including: financial services;retail and hospitality; travel and gaming; healthcare and public sector; entertainment; and software andtechnology services. Starting January 1, 2008, NCR began management of its businesses on a geographic basismade up of three business segments: the Americas; Europe, Middle East, and Africa (EMEA); and Asia Pacificand Japan (APJ).
Our solutions are based on a foundation of long-established industry knowledge and consulting expertise,value-added software, hardware technology, global customer support services, and a complete line of businessconsumables and specialty media products.
NCR’s reputation has been built upon 125 years of providing quality products, services and solutions to ourcustomers. At the heart of our customer and other business relationships is a commitment to acting responsibly,ethically and with the highest level of integrity. This commitment is reflected in NCR’s Code of Conduct,available on the corporate governance page of our website.
Spin-off of Teradata Data Warehousing Business On September 30, 2007, NCR completed the spin-offof its Teradata Data Warehousing business through the distribution of a tax-free dividend to its stockholders.NCR distributed one share of common stock of Teradata Corporation (Teradata) for each share of NCR commonstock to NCR stockholders of record as of the close of business on September 14, 2007. Upon the distribution ofTeradata, NCR stockholders received 100% (approximately 181 million shares) of the common stock ofTeradata, which is now an independent public company trading under the symbol “TDC” on the New York StockExchange.
In accordance with Statement of Financial Accounting Standards No. 144 (SFAS 144), Accounting for theImpairment or Disposal of Long-Lived Assets, the results of operations, assets, liabilities and cash flows ofTeradata have been presented as a discontinued operation for all periods presented in this Report. See Note 12,“Discontinued Operations,” in the Notes to Consolidated Financial Statements in Item 8 of Part II of this Reportfor a further discussion of the spin-off of Teradata. Unless otherwise noted, this MD&A excludes informationrelated to the Teradata Data Warehousing business.
2008 FINANCIAL OVERVIEW
As more fully discussed in later sections of this MD&A, the following were significant themes and eventsfor 2008:
• Revenue growth was driven by increases in sales across all of our geographic segments;
• Cash provided by operations increased to $415 million from $151 million, primarily due to improvedaccounts receivable collections and lower inventory levels; and
• We continued to make progress in improving our cost structure through additional realignmentinitiatives in 2008.
17
Fo
rm10-K
In 2008, we continued our focus on our strategic initiatives to increase operating income and providemaximum value to our stakeholders. The initiatives and the results against them were as follows:
1) Drive profitable growth—We invested in sales and other demand creation resources in areas with thegreatest potential for profitable growth such as self-service technologies, including self-check-in/outand other self-service solutions. We continued to broaden the scope of our self-service solutions for ourexisting customers and to introduce these solutions into newer industry-vertical markets, such as traveland gaming, healthcare and public sector and entertainment. Additionally, we have continued to makeacquisitions and investments that we believe will increase our market coverage and enhance ourexisting solution offerings.
2) Build a competitive cost structure—We focused on increasing the efficiency and effectiveness of ourcore functions and the productivity of our employees. In 2008, we commenced a global organizationalrealignment initiative to reduce redundancies and process inefficiencies in order to become morecustomer-focused and market-driven. This process is addressing legacy process inefficiencies andunbalanced resource allocation by focusing on organizational design, process re-engineering andbusiness process outsourcing. The Company has been successful in executing the realignment programto date and continues to identify additional opportunities focusing on organizational design, processre-engineering and business process outsourcing and therefore, expects additional realignmentactivities through 2010. Refer to “Restructuring and Re-engineering” in this MD&A for moreinformation regarding our realignment initiatives.
3) Optimize capital structure—During 2008, we continued the share repurchases that had been resumedin the fourth quarter of 2007, resulting in the repurchase of 21.6 million shares of our common stock.We generated significant cash from operations due to improvements in accounts receivable collectionsand inventory management.
STRATEGY OVERVIEW
Our strategic initiatives for 2009 include:
1) Gain profitable share We expect to continue to optimize our investments in demand creation to increaseNCR’s market share in areas with the greatest potential for profitable revenue growth, which includeopportunities in self-service technologies with our core financial services and retail customers. We intend toexpand and strengthen our geographic presence and sales coverage in addition to penetrating adjacent singleand multi-channel self-service solution segments.
2) Expand into emerging growth industry segments The Company expects to continue to focus on broadeningthe scope of our self-service solutions from our existing customers to expand these solution offerings tocustomers in newer industry-vertical markets including: travel and gaming, healthcare and public sector,entertainment, and software and technology. We expect to grow our business in these industries throughintegrated service offerings in addition to targeted acquisitions and strategic partnerships.
3) Build the lowest cost structure in our industry The Company is continuing to focus on increasing theefficiency and effectiveness of our core functions and the productivity of our employees. While wecontinued to make progress in this regard during 2008, we intend to ensure that our execution in 2009 willallow us to capture efficiencies and intended cost savings.
4) Enhance our global service capability The Company continues to execute various initiatives to enhance itsglobal service capability. We will continue to focus on improving our service positioning, increasing ourservice attach rates for our products and continue to improve profitability in our services business. Ourservice capability provides us a growing competitive advantage in winning customers and it provides NCRwith an ever-more attractive and stable revenue source.
5) Focus on working capital and balance sheet In 2008, NCR made significant improvements managingworking capital, especially in the areas of accounts receivable and inventory. We will continue to focus onthese areas to further improve our operating cash flow and working capital position. The Company willcontinue to make investments in areas that generate maximum growth, such as self-service research anddevelopment and demand creation.
18
FUTURE TRENDS
Deteriorating macroeconomic conditions impacted NCR starting in the fourth quarter of 2008, especially inthe retail industry. We expect that our performance in 2009 will continue to be challenged by these conditions.We are projecting that the capital spending environment in 2009 will be lower than what was experienced in2008, and as a result, we are forecasting 2009 revenue to be lower than 2008. We expect our 2009 operatingincome to decrease as a result of lower revenue and higher pension expense. During this tough economicenvironment, we will manage our costs effectively and balance our investments in areas that generate highreturns.
We see the following as the most significant risks to the execution of our initiatives:
• Global economic and credit environment and its effect on the capital spending environment.
• Competition, price erosion and loss of market share.
• Introduction of products in new self-service markets.
RESULTS FROM CONTINUING OPERATIONS
The following table shows our results for the years ended December 31:
In millions 2008 2007 2006
Revenue . . . . . . . . . . . . . . . . . . . . . . . . . . . . . . . . . . . . . . . . . . . . . . . . . . . . . . . . . . . $5,315 $4,970 $4,582Gross margin . . . . . . . . . . . . . . . . . . . . . . . . . . . . . . . . . . . . . . . . . . . . . . . . . . . . . . . $1,183 $1,040 $ 927Gross margin as a percentage of revenue . . . . . . . . . . . . . . . . . . . . . . . . . . . . . . . . . . 22.3% 20.9% 20.2%Operating expenses
Selling, general, and administrative expenses . . . . . . . . . . . . . . . . . . . . . . . . . . $ 713 $ 684 $ 654Research and development expense . . . . . . . . . . . . . . . . . . . . . . . . . . . . . . . . . . 148 137 119
Income from operations . . . . . . . . . . . . . . . . . . . . . . . . . . . . . . . . . . . . . . . . . . . . . . . $ 322 $ 219 $ 154
The following table shows our revenues and gross margins from products and services, respectively, for theyears ended December 31:
In millions 2008 2007 2006
Product revenue . . . . . . . . . . . . . . . . . . . . . . . . . . . . . . . . . . . . . . . . . . . . . . . . . . . . . $2,861 $2,693 $2,428Cost of products . . . . . . . . . . . . . . . . . . . . . . . . . . . . . . . . . . . . . . . . . . . . . . . . . . . . . 2,113 2,035 1,803
Product gross margin . . . . . . . . . . . . . . . . . . . . . . . . . . . . . . . . . . . . . . . . . . . . . . . . . $ 748 $ 658 $ 625
Product gross margin as a percentage of revenue . . . . . . . . . . . . . . . . . . . . . . . . . . . 26.1% 24.4% 25.7%
Services revenue . . . . . . . . . . . . . . . . . . . . . . . . . . . . . . . . . . . . . . . . . . . . . . . . . . . . . $2,454 $2,277 $2,154Cost of services . . . . . . . . . . . . . . . . . . . . . . . . . . . . . . . . . . . . . . . . . . . . . . . . . . . . . 2,019 1,895 1,852
Services gross margin . . . . . . . . . . . . . . . . . . . . . . . . . . . . . . . . . . . . . . . . . . . . . . . . . $ 435 $ 382 $ 302
Services gross margin as a percentage of revenue . . . . . . . . . . . . . . . . . . . . . . . . . . . 17.7% 16.8% 14.0%
2008 compared to 2007 results discussion
Revenue
Revenue increased 7% in 2008 from 2007 due to growth in sales volume for both our products and services.The effects of foreign currency fluctuations provided a favorable impact to revenue of 2% in 2008. In 2008, ourproduct revenue increased 6% and services revenue increased 8% as compared to 2007. The increase in revenuesin both products and services was primarily attributable to sales growth across all of our geographic segments,although we experienced lower revenue in the fourth quarter of 2008 as compared to the fourth quarter of 2007.This was attributed to the overall market and economic conditions and its effect on capital spending, especially
19
Fo
rm10-K
on customers in the retail and hospitality industry. During 2008, we experienced significant sales growth tocustomers in the financial services industry across most of our major geographic regions as customers continuedto focus on customer interaction and deposit growth.
Gross Margin
Gross margin as a percentage of revenue increased to 22.3% in 2008 from 20.9% in 2007.
Product gross margin was 26.1% in 2008 compared to 24.4% in 2007. The increase in product gross marginis primarily attributed to the reduction in realignment costs incurred in 2008 as compared to 2007. In 2008, NCRincurred organizational realignment costs totaling $5 million, while we incurred approximately $48 million ofmanufacturing realignment costs in 2007. After considering the impact of these costs, 2008 product gross marginwas comparable to 2007.
Services gross margin was 17.7% in 2008 compared to 16.8% in 2007. Organizational realignment costsnegatively impacted gross margin by $31 million or approximately 1% in 2008, while 2007 gross margin wasnegatively impacted by Japan realignment costs of $19 million or approximately 1%. After considering theimpact of these costs, service gross margin improved by 1% in 2008 as compared to 2007. The increase in grossmargin was due to productivity improvements, focus on maintenance of NCR-branded products as well asreductions in the overall service delivery cost.
2007 compared to 2006 results discussion
Revenue
Revenue increased 8% in 2007 from 2006. The effects of foreign currency fluctuations provided a favorableimpact to revenue of 3% in 2007. In 2007, product revenue increased 11% and services revenue increased 6% ascompared to 2006. NCR experienced revenue growth across all of our geographical segments in 2007 comparedto 2006. During 2007, revenues from customers in the financial services industry increased by a double-digitpercentage, with strong growth in both EMEA and APJ.
Gross Margin
Gross margin as a percentage of revenue for 2007 increased to 20.9% from 20.2% in 2006.
Product gross margin was 24.4% for 2007 as compared to 25.7% in 2006. Product gross margin decreasedprimarily due to $48 million of costs, or 2% in 2007 related to the Company’s manufacturing realignment. Afterconsidering the impact of these costs, product gross margin improved in 2007 due to a favorable geographic andproduct mix.
Services gross margin increased to 16.8% for 2007 from 14.0% in 2006 due to higher revenues frommaintenance of NCR-branded products, lower service delivery costs, productivity improvements and a reductionin the number of service contracts related to lower-margin, third-party products. These improvements were offsetin part by $19 million of costs related to the Company’s realignment initiative in Japan in 2007.
Restructuring and Re-engineering
Organizational Realignment On January 1, 2008, NCR began management of its business on a geographicbasis, changing from a previous model of global business units organized by product and service offering. As aresult, in the second quarter of 2008, NCR commenced a global realignment initiative to reduce redundancies andprocess inefficiencies to become more customer-focused and market-driven. This initiative is addressing legacyprocess inefficiencies and unbalanced resource allocation by focusing on organizational design, processre-engineering and business process outsourcing. The initiative has resulted in reductions in employment andproductivity improvements, while freeing up funds to invest in growth programs such as sales, engineering, andmarket development.
20
As a result of this initiative, the Company recorded a total of $57 million in employee severance and othertermination costs in 2008. Of these costs, $5 million was recorded as cost of products, $31 million was recordedas cost of services, $16 million was recorded as selling, general and administrative expense and the remaining $5million was recorded as research and development expense. Of the $57 million total expense recognized in 2008,$40 million was recorded as a discrete cost in accordance with Statement of Financial Accounting StandardsNo. 112 (SFAS 112), Employers’ Accounting for Postemployment Benefits, when the severance liabilities weredetermined to be probable and reasonably estimable. The remaining $17 million was recorded in accordance withStatement of Financial Accounting Standards No. 146 (SFAS 146), Accounting for Costs Associated with Exit orDisposal Activities.
The realignment activities and the associated costs recognized during 2008 for approximately 900 employeeterminations relate to each of our reportable segments of Americas, EMEA and APJ.
The Company made $30 million in severance payments during 2008. As of December 31, 2008, there is aremaining accrued liability balance of $26 million, including immaterial effects from foreign currencytranslation. This liability is recorded in the Consolidated Balance Sheet in other current liabilities as theCompany expects that payment of the remaining obligation will occur in 2009.
The actions taken to date are expected to generate annualized savings of approximately $40 million. Werealized approximately half of that amount during 2008 and expect to achieve the full, annualized savingsbeginning in 2009. The Company continues to identify additional opportunities focusing on organizationaldesign, process re-engineering and business process outsourcing and therefore, expects additional realignmentactivities through 2010 as a result of this initiative. The costs and related savings from these additional activitiesare not reasonably estimable at this time as we are in the process of defining the scope of the activities andquantifying the impacts thereof.
The costs of these realignment initiatives are not expected to have a significant impact on the Company’sfinancial position, revenues, liquidity or sources and uses of capital resources. The realignment costs areexpected to be funded by the Company’s cash on hand and cash flows from operations, and although this willresult in short-term cash outflows, the Company expects future cost savings and no adverse impact to revenue asa result of these changes.
Manufacturing Realignment In the first quarter of 2007, the Company initiated a manufacturingrealignment initiative primarily related to its ATM products, which included outsourcing certain manufacturingactivities in the Americas region and shifting other manufacturing activities from high cost to low costgeographies in the EMEA region as well as the APJ region. This realignment resulted in approximately 1,100employee terminations and, as expected, improved productivity and freed capital in order to invest the relatedcost savings in revenue-generating programs such as sales, engineering and market development. As a result ofthis realignment, in 2007, the Company recorded realignment costs of $40 million, in cost of products, related toemployee severance and other termination benefits ($32 million recorded as a discrete cost in accordance withSFAS 112, with the remainder recorded in accordance with SFAS 146). In addition, the Company incurred costsof $8 million associated with training, travel and professional services during the year ended December 31, 2007,which were directly related to this realignment initiative and were expensed as incurred. As of December 31,2007, $11 million of the reserve remained for this initiative, of which, approximately $10 million was utilizedthrough the year ended December 31, 2008. The remaining reserve balance of approximately $1 million as ofDecember 31, 2008 is expected to be paid in 2009.
Japan Realignment In the third quarter of 2007, NCR commenced a realignment program in Japan, whichwas primarily focused on its customer services. The realignment program, which resulted in approximately 130employee terminations, included actions to improve operating efficiency and strengthen the Company’scompetitive position in Japan. As a result of this realignment program, in 2007, the Company recorded $28million as a discrete cost for employee severance in accordance with SFAS 112 ($19 million in cost of servicesand $9 million in selling, general and administrative expense). As a result of the payments made, as ofDecember 31, 2007, $7 million of the reserve for this initiative remained, including immaterial effects from
21
Fo
rm10-K

foreign currency translation, which was fully utilized during the year ended December 31, 2008. Beginning in thefourth quarter of 2007, the Company started realizing cost savings related to this initiative and achieved targetedcost savings of $10 to $12 million on an annualized basis.
Fiscal 2007 and prior years’ realignment programs Through 2007, we continued with our re-engineeringplan announced in 2002 to drive operational efficiency throughout our Company. We targeted processimprovements to drive simplification, standardization, globalization and consistency across the organization. Wecontinued to eliminate unnecessary costs and expenses from our core businesses and corporate infrastructure. Asa result of these efforts, in 2006, we achieved our target of delivering $350 million of annualized cost savings,using 2002 as a starting point. In 2006, to further improve profitability in the Americas segment, NCR offered anearly retirement program to qualified customer service engineers in the United States. As a result of participantelection, the Company recorded a non-cash increase in pension expense during the first quarter of 2006 of $9million.
Real estate consolidation and restructuring One of the elements of our re-engineering initiatives is our realestate consolidation and restructuring plan. During 2008, we sold 8 properties, representing approximately 2%reduction in total properties from 2007. During 2007, we sold 7 properties, representing approximately a 3%reduction in total properties from 2006. In 2007, we also distributed 21 properties to Teradata in connection withits spin-off. During 2006, we reduced our number of properties by 51, representing approximately a 17%reduction in total properties from 2005. We will continue to evaluate our real estate portfolio of owned andleased properties in order to lower our overall facility costs.
Effects of Pension, Postemployment and Postretirement Benefit Plans
NCR’s income from continuing operations for the years ended December 31 were impacted by certainemployee benefit plans as shown below:
In millions 2008 2007 2006
Pension expense . . . . . . . . . . . . . . . . . . . . . . . . . . . . . . . . . . . . . . . . . . . . . . . . $ 25 $ 38 $122Postemployment expense . . . . . . . . . . . . . . . . . . . . . . . . . . . . . . . . . . . . . . . . . 91 114 63Postretirement benefit . . . . . . . . . . . . . . . . . . . . . . . . . . . . . . . . . . . . . . . . . . . . (2) (1) —
Total expense . . . . . . . . . . . . . . . . . . . . . . . . . . . . . . . . . . . . . . . . . . . . . . . $114 $151 $185
In 2008, pension expense decreased to $25 million compared to $38 million in 2007 primarily due to areduction in actuarial loss amortization, driven by actuarial gains resulting from higher discount rates and thebenefit of strong actual returns on plan assets in prior years. In 2008, approximately 56% of the pension expensewas included in selling, general and administrative and research and development expenses, with the remaining44% included in cost of products and services. The decrease in pension expense in 2007 was due primarily to theCompany’s decision to freeze its U.S. pension plan effective January 1, 2007. The re-measurement of certaininternational plans necessitated by the spin-off of Teradata also reduced pension expense during 2007, primarilydue to increases in discount rates. We currently expect pension expense of approximately $170 million in 2009.The expected increase in pension expense in 2009 is due to higher actuarial loss amortization and lower expectedreturn on plan assets resulting from the negative return on plan assets that we experienced in 2008.
Postemployment expense (severance and disability medical) decreased to $91 million in 2008 compared to$114 million in 2007. This decrease was primarily due to reduced realignment activity in 2008 as compared to2007. In 2008, postemployment plan expense included $40 million of costs related to organizational realignmentactivities as compared to $60 million of costs related to manufacturing and Japan realignment activities in 2007.In 2008, approximately 84% of total postemployment expense was included in cost of products and services,with the balance included in selling, general and administrative and research and development expenses.Postemployment expense increased to $114 million in 2007 compared to $63 million in 2006. This was primarilydriven by the manufacturing realignment and Japan realignment initiatives as discussed in this MD&A and Note3, “Restructuring and Real Estate Transactions,” of the Notes to Consolidated Financial Statements included inItem 8 of Part II of this Report.
22

Postretirement plans provided a $2 million benefit in 2008 compared to a $1 million benefit in 2007. Thiswas primarily due to favorable claims experience. There was a $1 million benefit in 2007 compared to nopostretirement plan expense in 2006. This decrease was primarily due to favorable claims experience andadjustments to the design of our plans, such as changes in co-pays, contributions and deductibles.
Selling, General and Administrative Expenses
Selling, general, and administrative expenses increased $29 million to $713 million in 2008 from $684million in 2007. Selling, general, and administrative expenses as a percentage of revenue improved to 13.4% in2008 from 13.8% in 2007. In 2008, selling, general and administrative expenses included $16 million oforganizational realignment costs and $12 million of costs related to legal matters offset by $23 million in gainsfrom the sale of two properties in Canada. In 2007, selling, general, and administrative expenses included $23million of expenses related to the Japan realignment and the spin-off of Teradata. After considering these items,the increase in selling, general, and administrative expenses was due primarily to the impact of foreign currencytranslation and continued investments in sales and demand creation.
Selling, general, and administrative expenses increased $30 million to $684 million in 2007 from $654million in 2006. As a percentage of revenue, these expenses were 13.8% in 2007 compared to 14.3% in 2006.Selling, general and administrative expenses increased by $22 million primarily due to investments in sales anddemand creation offset by expense reductions of $6 million across our business. In 2007, expenses also increasedby $13 million due to incremental stock-based compensation expense related to the modification of stock-basedcompensation awards in connection with the spin-off of Teradata.
Research and Development Expenses
Research and development expenses increased by $11 million to $148 million in 2008, from $137 million in2007. In 2008, research and development expenses included $5 million of organizational realignment costs. Theremaining increase in expense in 2008 is due to new product introductions, including the NCR SelfServ family ofATMs, FastLane self check-out, XpressPort, and RealPOS 70XRT.
In 2007, research and development expenses increased by $18 million to $137 million from $119 million in2006 due to continued emphasis on new product introductions, specifically in the financial services and retail andhospitality industries.
Interest and Other Income Items
Interest expense was $22 million in 2008 and $24 million in 2007 and 2006. In 2003, the Company enteredinto an interest rate swap agreement that converted $50 million of debt to a variable rate. Changes in interestrates could raise the variable rate of the swap above the fixed rate of the debt, which would lead to higher interestexpense and cash outflows.
Other expense, net was $11 million in 2008 compared to other income, net of $37 million in 2007 and $29million in 2006. Other income includes items such as minority interest, gains or losses on equity investments,costs and recoveries related to environmental matters that relate to businesses previously disposed of, and interestincome. Interest income was $23 million in 2008, $55 million in 2007, and $35 million in 2006. The decrease ininterest income in 2008 compared to 2007 is due to a combination of declining interest rates and lower investedcash balances throughout the year. The increase in 2007 compared to 2006 was primarily due to higher interestrates and cash balances during 2007. Other expense, net included $28 million and $14 million in 2008 and 2007,respectively, for increases to the reserve related to the Fox River environmental matter.
Income Taxes
The effective tax rate was 20% in 2008, 26% in 2007, and 5% in 2006. During 2008, we favorably settledexaminations with the Internal Revenue Service (IRS) for the tax years of 2000 through 2006 that resulted in a$19 million tax benefit. In addition, the effective tax rate was benefited in 2008 by $26 million from the
23
Fo
rm10-K
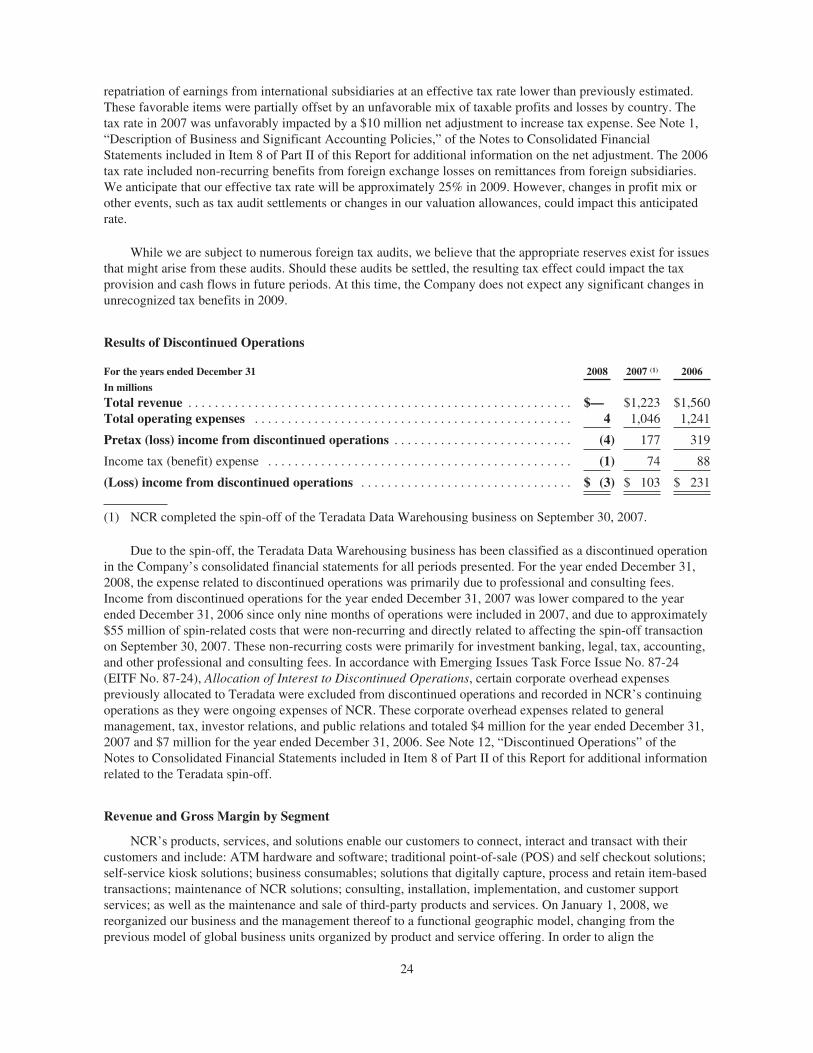
repatriation of earnings from international subsidiaries at an effective tax rate lower than previously estimated.These favorable items were partially offset by an unfavorable mix of taxable profits and losses by country. Thetax rate in 2007 was unfavorably impacted by a $10 million net adjustment to increase tax expense. See Note 1,“Description of Business and Significant Accounting Policies,” of the Notes to Consolidated FinancialStatements included in Item 8 of Part II of this Report for additional information on the net adjustment. The 2006tax rate included non-recurring benefits from foreign exchange losses on remittances from foreign subsidiaries.We anticipate that our effective tax rate will be approximately 25% in 2009. However, changes in profit mix orother events, such as tax audit settlements or changes in our valuation allowances, could impact this anticipatedrate.
While we are subject to numerous foreign tax audits, we believe that the appropriate reserves exist for issuesthat might arise from these audits. Should these audits be settled, the resulting tax effect could impact the taxprovision and cash flows in future periods. At this time, the Company does not expect any significant changes inunrecognized tax benefits in 2009.
Results of Discontinued Operations
For the years ended December 31 2008 2007 (1) 2006
In millions
Total revenue . . . . . . . . . . . . . . . . . . . . . . . . . . . . . . . . . . . . . . . . . . . . . . . . . . . . . . . . . . $— $1,223 $1,560Total operating expenses . . . . . . . . . . . . . . . . . . . . . . . . . . . . . . . . . . . . . . . . . . . . . . . . 4 1,046 1,241
Pretax (loss) income from discontinued operations . . . . . . . . . . . . . . . . . . . . . . . . . . . (4) 177 319
Income tax (benefit) expense . . . . . . . . . . . . . . . . . . . . . . . . . . . . . . . . . . . . . . . . . . . . . . (1) 74 88
(Loss) income from discontinued operations . . . . . . . . . . . . . . . . . . . . . . . . . . . . . . . . $ (3) $ 103 $ 231
(1) NCR completed the spin-off of the Teradata Data Warehousing business on September 30, 2007.
Due to the spin-off, the Teradata Data Warehousing business has been classified as a discontinued operationin the Company’s consolidated financial statements for all periods presented. For the year ended December 31,2008, the expense related to discontinued operations was primarily due to professional and consulting fees.Income from discontinued operations for the year ended December 31, 2007 was lower compared to the yearended December 31, 2006 since only nine months of operations were included in 2007, and due to approximately$55 million of spin-related costs that were non-recurring and directly related to affecting the spin-off transactionon September 30, 2007. These non-recurring costs were primarily for investment banking, legal, tax, accounting,and other professional and consulting fees. In accordance with Emerging Issues Task Force Issue No. 87-24(EITF No. 87-24), Allocation of Interest to Discontinued Operations, certain corporate overhead expensespreviously allocated to Teradata were excluded from discontinued operations and recorded in NCR’s continuingoperations as they were ongoing expenses of NCR. These corporate overhead expenses related to generalmanagement, tax, investor relations, and public relations and totaled $4 million for the year ended December 31,2007 and $7 million for the year ended December 31, 2006. See Note 12, “Discontinued Operations” of theNotes to Consolidated Financial Statements included in Item 8 of Part II of this Report for additional informationrelated to the Teradata spin-off.
Revenue and Gross Margin by Segment
NCR’s products, services, and solutions enable our customers to connect, interact and transact with theircustomers and include: ATM hardware and software; traditional point-of-sale (POS) and self checkout solutions;self-service kiosk solutions; business consumables; solutions that digitally capture, process and retain item-basedtransactions; maintenance of NCR solutions; consulting, installation, implementation, and customer supportservices; as well as the maintenance and sale of third-party products and services. On January 1, 2008, wereorganized our business and the management thereof to a functional geographic model, changing from theprevious model of global business units organized by product and service offering. In order to align the
24
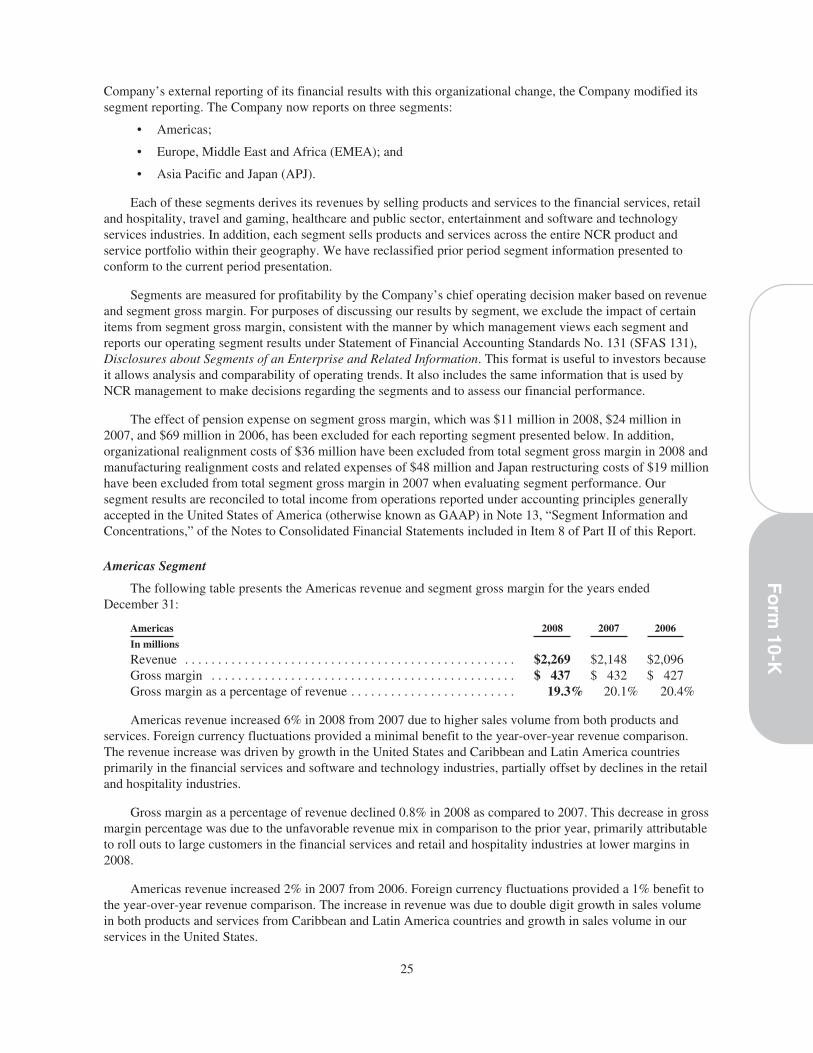
Company’s external reporting of its financial results with this organizational change, the Company modified itssegment reporting. The Company now reports on three segments:
• Americas;
• Europe, Middle East and Africa (EMEA); and
• Asia Pacific and Japan (APJ).
Each of these segments derives its revenues by selling products and services to the financial services, retailand hospitality, travel and gaming, healthcare and public sector, entertainment and software and technologyservices industries. In addition, each segment sells products and services across the entire NCR product andservice portfolio within their geography. We have reclassified prior period segment information presented toconform to the current period presentation.
Segments are measured for profitability by the Company’s chief operating decision maker based on revenueand segment gross margin. For purposes of discussing our results by segment, we exclude the impact of certainitems from segment gross margin, consistent with the manner by which management views each segment andreports our operating segment results under Statement of Financial Accounting Standards No. 131 (SFAS 131),Disclosures about Segments of an Enterprise and Related Information. This format is useful to investors becauseit allows analysis and comparability of operating trends. It also includes the same information that is used byNCR management to make decisions regarding the segments and to assess our financial performance.
The effect of pension expense on segment gross margin, which was $11 million in 2008, $24 million in2007, and $69 million in 2006, has been excluded for each reporting segment presented below. In addition,organizational realignment costs of $36 million have been excluded from total segment gross margin in 2008 andmanufacturing realignment costs and related expenses of $48 million and Japan restructuring costs of $19 millionhave been excluded from total segment gross margin in 2007 when evaluating segment performance. Oursegment results are reconciled to total income from operations reported under accounting principles generallyaccepted in the United States of America (otherwise known as GAAP) in Note 13, “Segment Information andConcentrations,” of the Notes to Consolidated Financial Statements included in Item 8 of Part II of this Report.
Americas Segment
The following table presents the Americas revenue and segment gross margin for the years endedDecember 31:
Americas 2008 2007 2006
In millions
Revenue . . . . . . . . . . . . . . . . . . . . . . . . . . . . . . . . . . . . . . . . . . . . . . . . . . $2,269 $2,148 $2,096Gross margin . . . . . . . . . . . . . . . . . . . . . . . . . . . . . . . . . . . . . . . . . . . . . . $ 437 $ 432 $ 427Gross margin as a percentage of revenue . . . . . . . . . . . . . . . . . . . . . . . . . 19.3% 20.1% 20.4%
Americas revenue increased 6% in 2008 from 2007 due to higher sales volume from both products andservices. Foreign currency fluctuations provided a minimal benefit to the year-over-year revenue comparison.The revenue increase was driven by growth in the United States and Caribbean and Latin America countriesprimarily in the financial services and software and technology industries, partially offset by declines in the retailand hospitality industries.
Gross margin as a percentage of revenue declined 0.8% in 2008 as compared to 2007. This decrease in grossmargin percentage was due to the unfavorable revenue mix in comparison to the prior year, primarily attributableto roll outs to large customers in the financial services and retail and hospitality industries at lower margins in2008.
Americas revenue increased 2% in 2007 from 2006. Foreign currency fluctuations provided a 1% benefit tothe year-over-year revenue comparison. The increase in revenue was due to double digit growth in sales volumein both products and services from Caribbean and Latin America countries and growth in sales volume in ourservices in the United States.
25
Fo
rm10-K
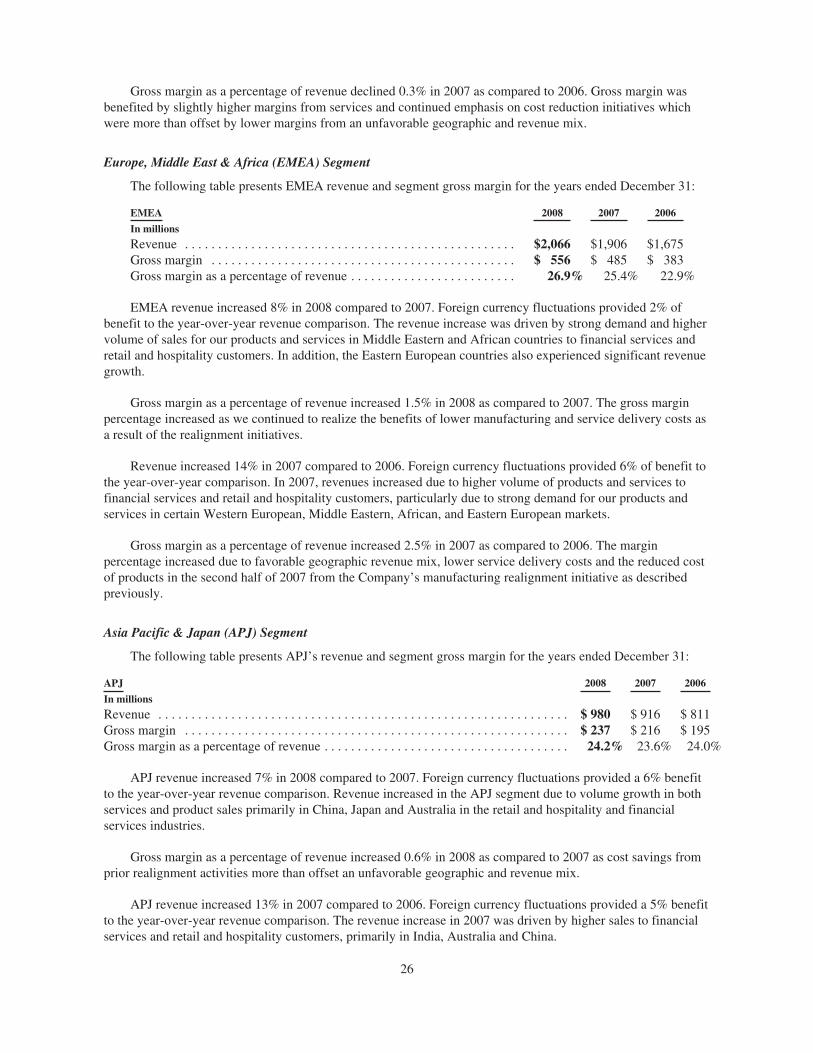
Gross margin as a percentage of revenue declined 0.3% in 2007 as compared to 2006. Gross margin wasbenefited by slightly higher margins from services and continued emphasis on cost reduction initiatives whichwere more than offset by lower margins from an unfavorable geographic and revenue mix.
Europe, Middle East & Africa (EMEA) Segment
The following table presents EMEA revenue and segment gross margin for the years ended December 31:
EMEA 2008 2007 2006
In millions
Revenue . . . . . . . . . . . . . . . . . . . . . . . . . . . . . . . . . . . . . . . . . . . . . . . . . . $2,066 $1,906 $1,675Gross margin . . . . . . . . . . . . . . . . . . . . . . . . . . . . . . . . . . . . . . . . . . . . . . $ 556 $ 485 $ 383Gross margin as a percentage of revenue . . . . . . . . . . . . . . . . . . . . . . . . . 26.9% 25.4% 22.9%
EMEA revenue increased 8% in 2008 compared to 2007. Foreign currency fluctuations provided 2% ofbenefit to the year-over-year revenue comparison. The revenue increase was driven by strong demand and highervolume of sales for our products and services in Middle Eastern and African countries to financial services andretail and hospitality customers. In addition, the Eastern European countries also experienced significant revenuegrowth.
Gross margin as a percentage of revenue increased 1.5% in 2008 as compared to 2007. The gross marginpercentage increased as we continued to realize the benefits of lower manufacturing and service delivery costs asa result of the realignment initiatives.
Revenue increased 14% in 2007 compared to 2006. Foreign currency fluctuations provided 6% of benefit tothe year-over-year comparison. In 2007, revenues increased due to higher volume of products and services tofinancial services and retail and hospitality customers, particularly due to strong demand for our products andservices in certain Western European, Middle Eastern, African, and Eastern European markets.
Gross margin as a percentage of revenue increased 2.5% in 2007 as compared to 2006. The marginpercentage increased due to favorable geographic revenue mix, lower service delivery costs and the reduced costof products in the second half of 2007 from the Company’s manufacturing realignment initiative as describedpreviously.
Asia Pacific & Japan (APJ) Segment
The following table presents APJ’s revenue and segment gross margin for the years ended December 31:
APJ 2008 2007 2006
In millions
Revenue . . . . . . . . . . . . . . . . . . . . . . . . . . . . . . . . . . . . . . . . . . . . . . . . . . . . . . . . . . . . . . $ 980 $ 916 $ 811Gross margin . . . . . . . . . . . . . . . . . . . . . . . . . . . . . . . . . . . . . . . . . . . . . . . . . . . . . . . . . . $ 237 $ 216 $ 195Gross margin as a percentage of revenue . . . . . . . . . . . . . . . . . . . . . . . . . . . . . . . . . . . . . 24.2% 23.6% 24.0%
APJ revenue increased 7% in 2008 compared to 2007. Foreign currency fluctuations provided a 6% benefitto the year-over-year revenue comparison. Revenue increased in the APJ segment due to volume growth in bothservices and product sales primarily in China, Japan and Australia in the retail and hospitality and financialservices industries.
Gross margin as a percentage of revenue increased 0.6% in 2008 as compared to 2007 as cost savings fromprior realignment activities more than offset an unfavorable geographic and revenue mix.
APJ revenue increased 13% in 2007 compared to 2006. Foreign currency fluctuations provided a 5% benefitto the year-over-year revenue comparison. The revenue increase in 2007 was driven by higher sales to financialservices and retail and hospitality customers, primarily in India, Australia and China.
26
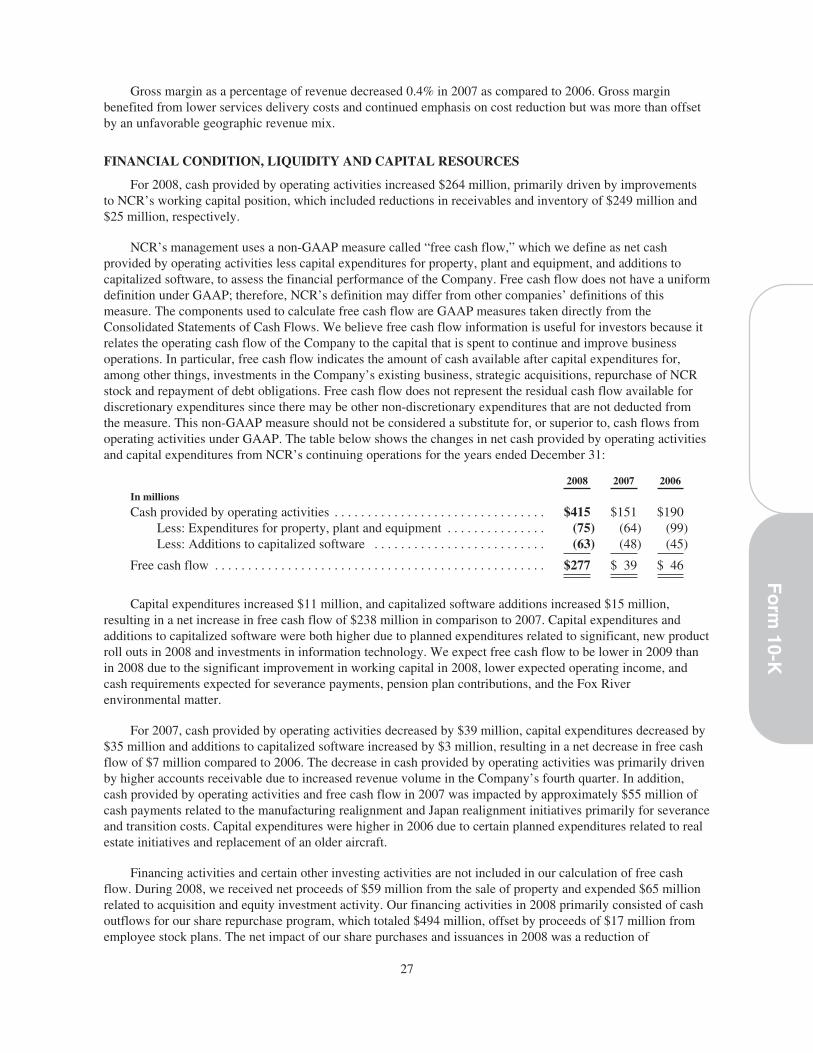
Gross margin as a percentage of revenue decreased 0.4% in 2007 as compared to 2006. Gross marginbenefited from lower services delivery costs and continued emphasis on cost reduction but was more than offsetby an unfavorable geographic revenue mix.
FINANCIAL CONDITION, LIQUIDITY AND CAPITAL RESOURCES
For 2008, cash provided by operating activities increased $264 million, primarily driven by improvementsto NCR’s working capital position, which included reductions in receivables and inventory of $249 million and$25 million, respectively.
NCR’s management uses a non-GAAP measure called “free cash flow,” which we define as net cashprovided by operating activities less capital expenditures for property, plant and equipment, and additions tocapitalized software, to assess the financial performance of the Company. Free cash flow does not have a uniformdefinition under GAAP; therefore, NCR’s definition may differ from other companies’ definitions of thismeasure. The components used to calculate free cash flow are GAAP measures taken directly from theConsolidated Statements of Cash Flows. We believe free cash flow information is useful for investors because itrelates the operating cash flow of the Company to the capital that is spent to continue and improve businessoperations. In particular, free cash flow indicates the amount of cash available after capital expenditures for,among other things, investments in the Company’s existing business, strategic acquisitions, repurchase of NCRstock and repayment of debt obligations. Free cash flow does not represent the residual cash flow available fordiscretionary expenditures since there may be other non-discretionary expenditures that are not deducted fromthe measure. This non-GAAP measure should not be considered a substitute for, or superior to, cash flows fromoperating activities under GAAP. The table below shows the changes in net cash provided by operating activitiesand capital expenditures from NCR’s continuing operations for the years ended December 31:
2008 2007 2006
In millions
Cash provided by operating activities . . . . . . . . . . . . . . . . . . . . . . . . . . . . . . . . $415 $151 $190Less: Expenditures for property, plant and equipment . . . . . . . . . . . . . . . (75) (64) (99)Less: Additions to capitalized software . . . . . . . . . . . . . . . . . . . . . . . . . . (63) (48) (45)
Free cash flow . . . . . . . . . . . . . . . . . . . . . . . . . . . . . . . . . . . . . . . . . . . . . . . . . . $277 $ 39 $ 46
Capital expenditures increased $11 million, and capitalized software additions increased $15 million,resulting in a net increase in free cash flow of $238 million in comparison to 2007. Capital expenditures andadditions to capitalized software were both higher due to planned expenditures related to significant, new productroll outs in 2008 and investments in information technology. We expect free cash flow to be lower in 2009 thanin 2008 due to the significant improvement in working capital in 2008, lower expected operating income, andcash requirements expected for severance payments, pension plan contributions, and the Fox Riverenvironmental matter.
For 2007, cash provided by operating activities decreased by $39 million, capital expenditures decreased by$35 million and additions to capitalized software increased by $3 million, resulting in a net decrease in free cashflow of $7 million compared to 2006. The decrease in cash provided by operating activities was primarily drivenby higher accounts receivable due to increased revenue volume in the Company’s fourth quarter. In addition,cash provided by operating activities and free cash flow in 2007 was impacted by approximately $55 million ofcash payments related to the manufacturing realignment and Japan realignment initiatives primarily for severanceand transition costs. Capital expenditures were higher in 2006 due to certain planned expenditures related to realestate initiatives and replacement of an older aircraft.
Financing activities and certain other investing activities are not included in our calculation of free cashflow. During 2008, we received net proceeds of $59 million from the sale of property and expended $65 millionrelated to acquisition and equity investment activity. Our financing activities in 2008 primarily consisted of cashoutflows for our share repurchase program, which totaled $494 million, offset by proceeds of $17 million fromemployee stock plans. The net impact of our share purchases and issuances in 2008 was a reduction of
27
Fo
rm10-K
approximately 20.6 million shares outstanding as compared to 2007. In 2007, repurchases of shares totaled $83million, while inflows from stock plans were $48 million. The increase in both the cash outflow and number ofshares for repurchases in 2008 as compared to 2007 was due to the fact that NCR did not repurchase sharesduring the first nine months of 2007 due to the then pending spin-off of Teradata. The decline in inflows fromstock plans was primarily due to lower option exercise levels caused by market conditions and the decline in ourstock price during 2008.
The share repurchases are part of a program authorized by NCR’s Board of Directors. Going forward, theamount of share repurchases may vary from past years depending on several factors, including the level ofemployee equity compensation awards, the level of stock option exercises, the level of activity related to theemployee stock purchase plan, and additional authorizations by NCR’s Board of Directors, if any, to repurchaseshares.
In 2007, other investing activities included net proceeds of $31 million from the sale of property and $12million of cash used primarily for acquisition-related activity. Our financing activities in 2007 included a $200million cash contribution to Teradata in connection with the spin-off. In addition, financing activities primarilyconsisted of cash outflows from our share repurchase activities and cash inflows from the issuance of sharesthrough our employee stock plans. During 2007, cash outflows from share repurchases were $83 million ascompared to $280 million in 2006. As discussed above, NCR did not purchase shares from the open market untilafter the spin-off of Teradata was completed on September 30, 2007. Cash inflows from stock plans were $48million in 2007 compared to $89 million in 2006; the decrease was driven by a decline in the number of optionsexercised by employees in 2007. The net impact of our share purchases and issuances in 2007 was a reduction ofapproximately one million shares outstanding as compared to 2006.
Net cash used by discontinued operations was $19 million in 2008 compared to cash provided bydiscontinued operations of $154 million and $210 million in 2007 and 2006, respectively. NCR completed thespin-off of Teradata on September 30, 2007 and as a result, activity in 2008 related solely to payments foractivities and costs associated with the transaction, including the payment of amounts accrued for as ofDecember 31, 2007. Cash flow from discontinued operations was lower in 2007 as compared to 2006 due to thefact that 2007 reflected only nine months of operating activity due to the timing of the spin-off versus a full yearof activity in 2006. Further, in 2007 cash provided by discontinued operations was impacted by approximately$38 million of spin-related payments primarily related to legal, accounting, professional and consulting fees, toaffect the spin-off.
Our cash and cash equivalents totaled $711 million as of December 31, 2008. We believe our cash flowsfrom operations, the credit facilities we currently have in place and other short- and long-term debt financing,will be sufficient to satisfy our future working capital, research and development activities, capital expenditures,pension contributions and other financing requirements for at least the next twelve months. Our ability togenerate positive cash flows from operations is dependent on general economic conditions, competitivepressures, and other business and risk factors described in Item 1A of Part I of this Report. If we are unable togenerate sufficient cash flows from operations, or otherwise comply with the terms of our credit facility andsenior notes, we may be required to refinance all or a portion of our existing debt or seek additional financingalternatives. Furthermore, as described below and in Note 6, “Debt Obligations,” in the Notes to ConsolidatedFinancial Statements in Item 8 of Part II of this Report, our $300 million senior unsecured notes will become duein the second quarter of 2009. Also, as described below and in Note 9, “Employee Benefit Plans,” in the Notes toConsolidated Financial Statements in Item 8 of Part II of this Report, we expect to make pension,postemployment, and retirement plan contributions of approximately $203 million in 2009. While the Companyis currently evaluating short- and long-term debt financing to meet its capital and operating requirements in 2009and subsequent years, we believe that we currently have sufficient cash flows from operations and existingfinancing to meet our operating requirements, the repayment obligations of the senior unsecured notes, and ourpension, postemployment, and retirement plan contributions.
28
Contractual Obligations In the normal course of business, we enter into various contractual obligationsthat impact, or could impact, the liquidity of our operations. The following table and discussion outlines ourmaterial obligations as of December 31, 2008, with projected cash payments in the years shown:
In millionsTotal
Amounts 20092010-2011
2012-2013
2014 andthereafter
AllOther
Debt obligations . . . . . . . . . . . . . . . . . . . . . . . . . . . . . . . . . . . . $ 308 $301 $ 1 $— $ 6 $—Interest on debt obligations . . . . . . . . . . . . . . . . . . . . . . . . . . . . 16 11 1 1 3 —Lease obligations . . . . . . . . . . . . . . . . . . . . . . . . . . . . . . . . . . . 222 49 71 57 45 —Uncertain tax positions . . . . . . . . . . . . . . . . . . . . . . . . . . . . . . . 178 — — — — 178Purchase obligations . . . . . . . . . . . . . . . . . . . . . . . . . . . . . . . . . 512 423 48 41 — —
Total obligations . . . . . . . . . . . . . . . . . . . . . . . . . . . . . . . . . . . $1,236 $784 $121 $ 99 $ 54 $178
As of December 31, 2008, we have short- and long-term debt totaling $308 million, the majority of whichrepresents our senior unsecured notes due in June of 2009. In 2003, $50 million of the notes were converted to avariable rate through an interest rate swap agreement. Interest payments for the debt are payable semi-annually inarrears on each June 15 and December 15. The notes contain certain covenants typical of this type of debtinstrument.
Our lease obligations are primarily for certain sales and manufacturing facilities in various domestic andinternational locations. Purchase obligations represent committed purchase orders and other contractualcommitments for goods or services. The purchase obligation amounts were determined through information inour procurement systems and payment schedules for significant contracts. Included in the amounts are committedpayments in relation to the long-term service agreement with Accenture under which, NCR’s transactionprocessing activities and functions are performed.
We have short- and long-term liabilities in relation to the Fox River environmental matter that may requirefuture cash payments. We also have product warranties that may affect future cash flows. These items are notincluded in the table of obligations shown above, but are described in detail in Note 11 of the Notes toConsolidated Financial Statements, “Commitments and Contingencies,” included in Item 8 of Part II of thisReport.
We have a $178 million liability related to our uncertain tax positions under Financial Accounting StandardsBoard (FASB) Interpretation No. 48 (FIN 48), Accounting for Uncertainty in Income Taxes, an Interpretation ofFASB Statement No. 109. Due to the nature of the underlying liabilities and the extended time often needed toresolve income tax uncertainties, we cannot make reliable estimates of the amount or timing of cash paymentsthat may be required to settle these liabilities. For additional information, refer to Note 7, “Income Taxes,” of theNotes to Consolidated Financial Statements included in Item 8 of Part II of this Report.
Our U.S. and international employee benefit plans, which are described in Note 9 of the Notes toConsolidated Financial Statements, “Employee Benefit Plans,” included in Item 8 of Part II of this Report, couldrequire significant future cash payments. The funded status of NCR’s U.S. pension plans is an underfundedposition of $1,019 million as of December 31, 2008 compared to an overfunded position of $224 million as ofDecember 31, 2007. The decline in our funded status is primarily attributable to the impact of the negativemarket environment in 2008 and its impact on the fair value of plan assets. The funded status of our internationalretirement plans also declined from an overfunded position of $94 million as of December 31, 2007 to anunderfunded position of $178 million as of December 31, 2008. Negative asset returns and currency translation,offset somewhat by Company contributions, were the main drivers of this change. The Company did not makeany contributions to its U.S. qualified pension plan in 2008, and we do not expect to be required to make anycontributions in 2009. During 2006, a new law was enacted in the U.S. that changed the funding requirements forour U.S. pension plan in future years. This legislation altered the manner in which liabilities and asset values aredetermined for the purpose of calculating required pension contributions and the timing and manner in whichrequired contributions to underfunded pension plans would be made. Additional legislation was passed inDecember of 2008 which modifies/clarifies some aspects of the previously mentioned legislation and additional
29
Fo
rm10-K
legislative activity relating to these rules continues. Therefore, it is difficult to make projections relative to futurefunding requirements beyond 2009. Contributions to international and executive pension plans are expected toincrease from $83 million in 2008 to approximately $120 million in 2009. We estimate that if no additionallegislation is passed, interest rates remain constant, and 2009 asset returns are between +10% and -10%, ourglobal pension contribution requirements will increase from the 2009 expected amount of approximately $120million to a range of $200 to $250 million in 2010.
On August 6, 2007, the Company amended and renewed its $500 million, five-year unsecured revolvingcredit facility to update certain terms and conditions. This replacement credit facility contains certainrepresentations and warranties; conditions; affirmative, negative and financial covenants; and events of defaultcustomary for such facilities. Interest rates charged on borrowings outstanding under the credit facility are basedon prevailing market rates. No amount was outstanding under the facility as of December 31, 2008.
Off-Balance Sheet Arrangements We do not participate in transactions that generate relationships withunconsolidated entities or financial partnerships, such as entities often referred to as structured finance or specialpurpose entities (SPE), which would have been established for the purpose of facilitating off-balance sheetarrangements or other contractually narrow or limited purposes. As of December 31, 2008, we are not involvedin any material, unconsolidated SPE transactions.
See Note 11, “Commitments and Contingencies,” in the Notes to Consolidated Financial Statements inItem 8 of Part II of this Report for additional information on guarantees associated with NCR’s businessactivities.
30

CRITICAL ACCOUNTING POLICIES AND ESTIMATES
Our consolidated financial statements are prepared in accordance with GAAP. In connection with thepreparation of these financial statements, we are required to make assumptions, estimates and judgments thataffect the reported amounts of assets, liabilities, revenues, expenses and the related disclosure of contingentliabilities. These assumptions, estimates and judgments are based on historical experience and assumptions thatare believed to be reasonable at the time. However, because future events and their effects cannot be determinedwith certainty, the determination of estimates requires the exercise of judgment. Our critical accounting policiesare those that require assumptions to be made about matters that are highly uncertain. Different estimates couldhave a material impact on our financial results. Judgments and uncertainties affecting the application of thesepolicies and estimates may result in materially different amounts being reported under different conditions orcircumstances. Our management continually reviews these estimates and assumptions to ensure that our financialstatements are presented fairly and are materially correct.
In many cases, the accounting treatment of a particular transaction is specifically dictated by GAAP anddoes not require significant management judgment in its application. There are also areas in which management’sjudgment in selecting among available alternatives would not produce a materially different result. Thesignificant accounting policies and estimates that we believe are the most critical to aid in fully understandingand evaluating our reported financial results are discussed in the paragraphs below. Our senior management hasreviewed these critical accounting policies and related disclosures with our independent registered publicaccounting firm and the Audit Committee of our Board of Directors (see Note 1, “Description of Business andSignificant Accounting Policies,” of the Notes to Consolidated Financial Statements in Item 8 of Part II of thisReport, which contains additional information regarding our accounting policies and other disclosures requiredby GAAP).
Revenue Recognition Product revenue includes sales of hardware equipment and software licenses forATMs and financial terminals, self-service kiosks, POS, check and document imaging and consumables. Servicerevenue includes revenue from services and maintenance, installation, implementation, professional consulting,and complete systems management for all NCR product offerings noted above as well as for third-party products.NCR records revenue when it is realized, or realizable, and earned. NCR considers these criteria met when:(a) persuasive evidence of an arrangement exists; (b) the products or services have been delivered to thecustomer; (c) the sales price is fixed or determinable and free of contingencies or significant uncertainties; and(d) collectibility is reasonably assured. For product sales, revenue is recognized when the customer has assumedrisk of loss of the goods sold and all performance obligations are complete. For service sales, revenue isrecognized either as the services are provided or, if applicable, after customer acceptance of the services.
NCR’s solution offerings typically include hardware, software, professional consulting services andmaintenance support services, and as a result, the Company frequently enters into sales arrangements withcustomers that contain multiple elements or deliverables. For arrangements involving multiple deliverables, whendeliverables include software and non-software products and services, NCR applies the provisions of EmergingIssues Task Force Issue No. 00-21 (EITF 00-21), Revenue Arrangements with Multiple Deliverables, to separatethe deliverables and allocate the total arrangement consideration. Accordingly, NCR evaluates each deliverableto determine whether it represents a separate unit of accounting based on the following criteria: (a) the delivereditem has value to the customer on a stand-alone basis; (b) there is objective and reliable evidence of the fair valueof the undelivered items; and (c) if the contract includes a general right of return relative to the delivered item,delivery or performance of the undelivered items is considered probable and substantially in control of NCR.Each unit of accounting is then accounted for under the applicable revenue recognition guidance.
In situations where NCR’s solutions contain software that is more than incidental to the hardware andservices, revenue related to software and software-related elements is recognized in accordance with Statementof Position 97-2 (SOP 97-2), Software Revenue Recognition. Revenue for non-software-related elements, forwhich software is not essential to the functionality, is recognized in accordance with Staff Accounting BulletinNo. 104 (SAB 104), Revenue Recognition. In situations when there is appropriate evidence of fair value for allundelivered elements, but not for delivered elements, the residual method is used to allocate the arrangement’sconsideration. Under the residual method, the fair value of undelivered elements is deferred and the remaining
31
Fo
rm10-K

portion of the arrangement fee is allocated to the delivered elements and recognized as revenue. Revenue formaintenance support services is recognized on a straight-line basis over the term of the service contract. Incertain instances, customer acceptance is required prior to the passage of title and risk of loss of the deliveredproducts. In such cases, no revenue is recognized until the customer acceptance is obtained. Delivery andacceptance generally occur in the same reporting period.
Revenue recognition for complex contractual arrangements, especially those with multiple elements,requires a significant level of judgment and is based upon a review of specific contracts, past experience, the fairvalue of undelivered elements when sold separately, creditworthiness of customers, international laws and otherfactors. Changes in judgments about these factors could impact the timing and amount of revenue recognizedbetween periods.
Allowance for Doubtful Accounts We evaluate the collectibility of our accounts receivable based on anumber of factors. We establish provisions for doubtful accounts using percentages of our accounts receivablebalances as an overall proxy to reflect historical average credit losses and specific provisions for known issues.The percentages are applied to aged accounts receivable balances. Aged accounts are determined based on thenumber of days the receivable is outstanding, measured from the date of the invoice, or from the date of revenuerecognition. As the age of the receivable increases, the provision percentage also increases. This policy is appliedconsistently among all of our operating segments.
Based on the factors below, we periodically review customer account activity in order to assess theadequacy of the allowances provided for potential losses. Factors include economic conditions and judgmentsregarding collectibility of account balances, each customer’s payment history and creditworthiness.
The allowance for doubtful accounts was $15 million as of December 31, 2008, $19 million as ofDecember 31, 2007, and $18 million as of December 31, 2006. These allowances represent, as a percent of grossreceivables, 1.6% in 2008, 1.6% in 2007, and 1.7% in 2006.
Given our experience, the reserves for potential losses are considered adequate, but if one or more of ourlarger customers were to default on its obligations, we could be exposed to potentially significant losses in excessof the provisions established. We continually evaluate our reserves for doubtful accounts and continuedeconomic deterioration could lead to the need to increase our reserves.
Inventory Valuation Inventories are stated at the lower of cost or market, using the average cost method.Each quarter, we reassess raw materials, work-in-process, parts and finished equipment inventory costs toidentify purchase or usage variances from standards, and valuation adjustments are made. Additionally, toproperly provide for potential exposure due to slow-moving, excess, obsolete or unusable inventory, a reserveagainst inventory is established. This reserve is established based on forecasted usage, orders, technologicalobsolescence and inventory aging. These factors are impacted by market conditions, technology changes andchanges in strategic direction, and require estimates and management judgment that may include elements thatare uncertain. On a quarterly basis, we review the current market value of inventory and adjust for any inventoryexposure due to age or excess of cost over market value.
We have inventory in more than 40 countries around the world. We purchase inventory from third partysuppliers and manufacture inventory at our plants. This inventory is transferred to our distribution and salesorganizations at cost plus mark-up. This mark-up is referred to as inter-company profit. Each quarter, we reviewour inventory levels and analyze our inter-company profit to determine the correct amount of inter-companyprofit to eliminate. Key assumptions are made to estimate product gross margins, the product mix of existinginventory balances and current period shipments. Over time, we refine these estimates as facts and circumstanceschange. If our estimates require refinement, our results could be impacted.
Our excess and obsolete reserves were $111 million as of December 31, 2008, $147 million as ofDecember 31, 2007, and $206 million as of December 31, 2006. These reserves represent, as a percent of grossinventory, 13.8% in 2008, 17.0% in 2007, and 24.3% in 2006. The decrease in the excess and obsolete reserve in2008 and 2007 was due to the scrapping of fully reserved spare parts inventory as well as improved inventory
32
management and utilization. Although we strive to achieve a balance between market demands and risk ofinventory obsolescence or excess quantities caused by these factors, it is possible that, should conditions change,additional reserves may be needed. Any changes in reserves will impact operating income during a given period.The policies described are consistently applied among all of our operating segments.
Warranty Reserves One of our key objectives is to provide superior quality products and services. To thatend, we provide a standard manufacturer’s warranty extending up to 12 months, allowing our customers to seekrepair of products under warranty at no additional cost. A corresponding estimated liability for potential warrantycosts is also recorded at the time of the sale. We sometimes offer extended warranties in the form of productmaintenance services to our customers for purchase. We defer the fair value of these revenues and recognizerevenue over the life of the extended warranty period. Refer to Note 1 “Description of Business and SignificantAccounting Policies” in the Notes to Consolidated Financial Statements in Item 8 of Part II of this Report forfurther information regarding our accounting for extended warranties.
Future warranty obligation costs are based upon historical factors such as labor rates, average repair time,travel time, number of service calls per machine and cost of replacement parts. When a sale is consummated, thetotal customer revenue is recognized and the associated warranty liability is recorded based upon the estimatedcost to provide the service over the warranty period.
Total warranty costs were $65 million in 2008, $41 million in 2007, and $36 million in 2006. Warrantycosts as a percent of total product revenues were 2.3% in 2008, 1.5% in 2007, and 1.4% in 2006. Warranty costsincreased in 2008 as compared to 2007 due to higher product revenue and an increase in the standard warrantyperiod for select products in certain geographies. Historically, the principal factor used to estimate our warrantycosts has been service calls per machine. Significant changes in this factor could result in actual warranty costsdiffering from accrued estimates. Although no near-term changes in our estimated warranty reserves arecurrently anticipated, in the unlikely event of a significant increase in warranty claims by one or more of ourlarger customers, costs to fulfill warranty obligations would be higher than provisioned, thereby impactingresults.
Pension, Postretirement and Postemployment Benefits We account for defined benefit pension plans inaccordance with SFAS 87, which requires that amounts recognized in financial statements be determined on anactuarial basis. Our postretirement plans are accounted for in accordance with Statement of Financial AccountingStandards No. 106 (SFAS 106), Employer’s Accounting for Postretirement Benefits Other Than Pensions, andour postemployment plans are accounted for in accordance with SFAS 112. Beginning on December 31, 2006,we also apply SFAS 158, which amends each of these three standards, primarily related to balance sheetpresentation and disclosure requirements. We have significant pension, postretirement and postemploymentbenefit costs, which are developed from actuarial valuations. Actuarial assumptions attempt to anticipate futureevents and are used in calculating the expense and liability relating to these plans. These factors includeassumptions we make about interest rates, expected investment return on plan assets, rate of increase inhealthcare costs, total and involuntary turnover rates, and rates of future compensation increases. In addition, ouractuarial consultants also use subjective factors such as withdrawal rates and mortality rates to develop ourvaluations. We generally review and update these assumptions on an annual basis at the beginning of each fiscalyear. We are required to consider current market conditions, including changes in interest rates, in making theseassumptions. The actuarial assumptions that we use may differ materially from actual results due to changingmarket and economic conditions, higher or lower withdrawal rates, or longer or shorter life spans of participants.These differences may result in a significant impact to the amount of pension, postretirement or postemploymentbenefits expense we have recorded or may record. Postemployment expense impacts all of our segments, whilepostretirement expense impacts only the Americas segment, as these benefits are only offered to Americasemployees. Pension expense is reported at the corporate level and is excluded from our segment results as it isnot included in the evaluation of segment performance. See Note 13, “Segment Information and Concentrations”in the Notes to Consolidated Financial Statements in Item 8 of Part II of this Report for a reconciliation of oursegment results to total income from operations.
33
Fo
rm10-K
The key assumptions used in developing our 2008 expense were discount rates of 6.25% for our U.S.pension plans and 6.0% for our postretirement plan. We used an expected return on assets assumption of 7.75%for our U.S. plans in 2008. The U.S. plans represent 66% and 100% of total pension and postretirement planobligations as of December 31, 2008, respectively. Holding all other assumptions constant, a 0.25% decrease inthe discount rate used for the U.S. plans would have increased 2008 expense by approximately $2.9 million ($2.9million in pension expense and an immaterial change in postretirement expense). Due to the effect of theamortization method described in more detail in Note 9, “Employee Benefit Plans,” of the Notes to ConsolidatedFinancial Statements included in Item 8 of Part II of this Report, a 0.25% increase in the discount rate used forthe U.S. plans would have decreased expense by $2.6 million ($2.6 million in pension expense and an immaterialchange in postretirement expense). A 0.25% change in the expected rate of return on plan assets assumption forthe U.S. pension plan would have increased or decreased 2008 pension expense by approximately $8.0 million.Our expected return on plan assets has historically been and will likely continue to be material to net income.While it is required that we review our actuarial assumptions each year at the measurement date, we generally donot change them between measurement dates. We use a measurement date of December 31 for all of our plans.
We intend to use a discount rate of 6.25% and an expected rate of return on assets assumption of 7.75% indetermining the 2009 pension and postretirement expense for the U.S. plans. The most significant assumptionused in developing our 2009 postemployment plan expense was the assumed rate of involuntary turnover of 5%.The involuntary turnover rate is based on historical trends and projections of involuntary turnover in the future. A0.25% change in the rate of involuntary turnover would have increased or decreased 2008 expense byapproximately $3.6 million. The sensitivity of the assumptions described above is specific to each individual planand not to our pension, postretirement and postemployment plans in the aggregate.
Environmental and Legal Contingencies Each quarter, we review the status of each claim and legalproceeding and assess our potential financial exposure. If the potential loss from any claim or legal proceeding isconsidered probable and the amount can be reasonably estimated, we accrue a liability for the estimated loss, inaccordance with Statement of Financial Accounting Standards No. 5 (SFAS 5), Accounting for Contingencies. Tothe extent that the amount of a probable loss is estimable only by reference to a range of equally likely outcomes,and no amount within the range appears to be a better estimate than any other amount, we accrue for the low endof the range. Because of uncertainties related to these matters, the use of estimates, assumptions and judgments,and external factors beyond our control, accruals are based on the best information available at the time. Asadditional information becomes available, we reassess the potential liability related to our pending claims andlitigation and may revise our estimates. Such revisions in the estimates of the potential liabilities could have amaterial impact on our results of operations and financial position. Except for the sharing agreement withAppleton Papers Inc. (API) described in Note 11 of Notes to Consolidated Financial Statements, “Commitmentsand Contingencies,” in Item 8 of Part II of this Report with respect to the Fox River matter, when insurancecarriers or third parties have agreed to pay any amounts related to costs, and we believe that it is probable that wecan collect such amounts, those amounts are reflected as receivables in our consolidated balance sheet.
The most significant legal contingency impacting our Company relates to the Fox River matter, which isfurther described in detail in Note 11. NCR has been identified as a potentially responsible party (PRP) at the FoxRiver site in Wisconsin because of polychlorinated biphenyl (PCB) discharges from two carbonless papermanufacturing facilities previously owned by NCR, located along the Fox River.
As described below and in Note 11, while substantial progress has been made in the engineering design ofthe Fox River clean-up, the extent of our potential liability continues to be subject to significant uncertainties.These uncertainties include the total clean-up costs for each of the segments of the river; the total naturalresource damages for the site; the extent to which clean-up and other costs will be allocated to and paid by otherPRPs; the solvency of other PRPs; and the extent of NCR’s eventual liability.
Our reserve for the Fox River matter as of December 31, 2008 was approximately $88 million (after takinginto consideration amounts expected to be recovered under an indemnity agreement, as further discussed in Note11). The considerations we took into account in estimating our reserve are set forth in Note 11. The Companyregularly re-evaluates the assumptions used in determining the appropriate reserve for the Fox River matter asadditional information becomes available and, when warranted, makes appropriate adjustments.
34

In determining our reserve, we attempt to estimate a range of reasonably possible outcomes for relevantfactors, although each range is itself highly uncertain. We use our best estimate within the range if that ispossible. Where there is a range of equally likely outcomes, and there is no amount within that range that appearsto be a better estimate than any other amount, we use the low end of the range. Our eventual liability forremediation, which we expect will be paid out over a period of at least 11 years (and likely as long as 20 years,and a still longer period for long-term monitoring), will depend on a number of factors, the most significant ofwhich include:
• The total clean-up costs for the site (we use the best estimate within a range of reasonably possibleoutcomes—$837 million—which consists of the current estimate of the lower river clean-up and long-term monitoring costs developed by the engineering firms working on the design, the projected costs ofthe upper river clean-up, plus a 15% contingency for possible cost overruns and a 5% contingency forfuture Government oversight costs);
• The total natural resource damages for the site (we use a best estimate of $76 million, which is basedon current information available to us);
• The share NCR and API will jointly bear of the total clean-up costs (we use the low end of the range,which is based primarily on the proximity of the areas to be remediated to the locations at which PCBsfrom the NCR/API plants were discharged into the Fox River) and of natural resource damages (we usea best estimate);
• The share NCR will bear of the joint NCR/API payments for clean-up costs and natural resourcedamages (based upon an agreement between NCR and API, and an arbitration award, we utilized a45% share for NCR of the first $75 million—a threshold that was reached in the second quarter of2008—and a 40% share for amounts in excess of $75 million); and
• Our transaction costs to defend NCR in this matter, including participation in litigation to establishproper allocation shares (we have estimated the costs we are likely to incur through 2019, the end ofthe time period the Governments have projected it will take to design and implement the remedy forthe Fox River).
AT&T Inc. (AT&T) and Alcatel-Lucent are each responsible for indemnifying NCR for a portion ofamounts NCR incurs for the Fox River over a certain threshold. NCR’s estimate of what AT&T and Alcatel-Lucent will pay under the indemnity is recorded as a long-term receivable of approximately $45 million as ofDecember 31, 2008, and is deducted in determining the net reserve discussed above.
While it remains difficult to predict, there could be significant changes in the future to some of the above-described assumptions that could have a material effect on the amount of our reserve. Also, there are otherestimates for some of these factors that are significantly higher than the estimates described above, and withregard to the third factor—the NCR/API share of total Fox River costs—there is such uncertainty that we cannotquantify the high end of the range of such estimates, although we do not believe it is near 100%. It is the opinionof the Company that the effect of the Fox River matter will have a moderate, but manageable, impact on ourliquidity and capital resources, assuming that such amounts discussed above are required to be paid over the timeframe currently contemplated. However, if such an amount were required to be paid in a shorter time period, itcould have a material impact on our liquidity and capital resources.
Income Taxes We account for income taxes in accordance with Statement of Financial AccountingStandards No. 109 (SFAS 109), Accounting for Income Taxes, which recognizes deferred tax assets and liabilitiesbased on the differences between the financial statement carrying amounts and the tax basis of assets andliabilities. The deferred tax assets and liabilities are determined based on the enacted tax rates expected to applyin the periods in which the deferred tax assets or liabilities are anticipated to be settled or realized.
We regularly review our deferred tax assets for recoverability and establish a valuation allowance if it ismore likely than not that some portion or all of a deferred tax asset will not be realized. The determination as towhether a deferred tax asset will be realized is made on a jurisdictional basis and is based on the evaluation ofpositive and negative evidence. This evidence includes historical taxable income, projected future taxable
35
Fo
rm10-K
income, the expected timing of the reversal of existing temporary differences and the implementation of taxplanning strategies. Projected future taxable income is based on our expected results and assumptions as to thejurisdiction in which the income will be earned. The expected timing of the reversals of existing temporarydifferences is based on current tax law and our tax methods of accounting.
If we are unable to generate sufficient future taxable income, or if there is a material change in the actualeffective tax rates or the time period within which the underlying temporary differences become taxable ordeductible, or if the tax laws change unfavorably, then we could be required to increase our valuation allowanceagainst our deferred tax assets, resulting in an increase in our effective tax rate.
We had valuation allowances of $478 million as of December 31, 2008 and $441 million as ofDecember 31, 2007, related to certain deferred income tax assets, primarily tax loss carryforwards, injurisdictions where there is uncertainty as to the ultimate realization of a benefit from those tax assets. Futurechanges in local country profitability could result in discrete changes affecting the need for valuation allowances.
On January 1, 2007, the Company began evaluating its estimates and judgments related to uncertain taxpositions in accordance with FIN 48. Under FIN 48, the Company recognizes the tax benefit from an uncertaintax position only if it is more likely than not that the tax position will be sustained on examination by the taxingauthorities, based on the technical merits of the position. The tax benefits recognized in the financial statementsfrom such a position are measured based on the largest benefit that has a greater than fifty percent likelihood ofbeing realized upon settlement.
Stock-based Compensation We account for employee stock-based compensation costs in accordance withSFAS 123R, which requires us to measure compensation cost for stock awards at fair value and recognizecompensation expense over the service period for which awards are expected to vest. We utilize the Black-Scholes option pricing model to estimate the fair value of stock-based compensation at the date of grant, whichrequires the input of highly subjective assumptions, including expected volatility and expected holding period.Further, as required under SFAS 123R, we estimate forfeitures for options granted, which are not expected tovest. The estimation of stock awards that will ultimately vest requires judgment, and to the extent that actualresults or updated estimates differ from our current estimates, such amounts will be recorded as a cumulativeadjustment in the period in which estimates are revised. We consider many factors when estimating expectedforfeitures, including types of awards and historical experience. Actual results and future changes in estimatesmay differ from our current estimates.
In addition, we have performance-based awards that vest only if specific performance conditions aresatisfied, typically at the end of the three-year performance period. The number of shares that will be earned canvary based on actual performance. No shares will vest if the objectives are not met, and in the event theobjectives are exceeded, additional shares will vest up to a maximum amount. The cost of these awards isexpensed over the performance period based upon management’s estimates of achievement against theperformance criteria. Because the actual number of shares to be awarded is not known until the end of theperformance period, the actual compensation expense related to these awards could differ from our currentexpectations.
RECENTLY ISSUED ACCOUNTING PRONOUNCEMENTS
A discussion of recently issued accounting pronouncements is described in Note 1, “Description of Businessand Significant Accounting Policies,” of the Notes to Consolidated Financial Statements in Item 8 of Part II ofthis Report, and we incorporate such discussion in this MD&A by reference and make it a part hereof.
36
Item 7A. QUANTITATIVE AND QUALITATIVE DISCLOSURES ABOUT MARKET RISK
We are exposed to market risk, including changes in foreign currency exchange rates and interest rates. Weuse a variety of measures to monitor and manage these risks, including derivative financial instruments. Since asubstantial portion of our operations and revenue occurs outside the United States, and in currencies other thanthe U.S. Dollar, our results can be significantly impacted by changes in foreign currency exchange rates. Tomanage our exposures and mitigate the impact of currency fluctuations on the operations of our foreignsubsidiaries, we hedge our main transactional exposures through the use of foreign exchange forward contracts.This is primarily done through the hedging of foreign currency denominated inter-company inventory purchasesby the marketing units and of foreign currency denominated inventory sales by the manufacturing units. All ofthese transactions are firmly committed or forecasted. These foreign exchange contracts are designated as highlyeffective cash flow hedges. The gains or losses are deferred in other comprehensive income and recognized in thedetermination of income when the underlying hedged transaction impacts earnings. As we hedge inventorypurchases, the ultimate gain or loss from the derivative contract is recorded in cost of products when theinventory is sold to an unrelated third party.
We have exposure to approximately 50 functional currencies. Due to our global operations, weaknesses insome of these currencies are sometimes offset by strengths in others. The U.S. Dollar was slightly weaker in2008 as compared to 2007 based on comparable weighted averages for our functional currencies. This had afavorable impact of 2% on 2008 revenue versus 2007 revenue. This excludes the effects of our hedging activitiesand, therefore, does not reflect the actual impact of fluctuations in exchange rates on our operating income.
Our strategy is to hedge, on behalf of each subsidiary, a portion of our non-functional currency denominatedcash flows for a period of up to 15 months. As a result, some of the impact of currency fluctuations onnon-functional currency denominated transactions (and hence on subsidiary operating income, as stated in thefunctional currency) is mitigated in the near term. The amount we hedge and the length of time hedge contractsare entered into may vary significantly. In the longer term (longer than the hedging period of up to 15 months),the subsidiaries are still subject to the impacts of foreign currency fluctuations. In addition, the subsidiary resultsare still subject to any impact of translating the functional currency results to U.S. Dollars. When hedging certainforeign currency transactions of a long-term investment nature (net investments in foreign operations), the gainsand losses are recorded in the currency translation adjustment component of stockholders’ equity. Gains andlosses on other foreign exchange contracts are recognized in other income or expense as exchange rates change.
For purposes of potential risk analysis, we use sensitivity analysis to quantify potential impacts that marketrate changes may have on the fair values of our hedge portfolio related to firmly committed or forecastedtransactions. The sensitivity analysis represents the hypothetical changes in value of the hedge position and doesnot reflect the related gain or loss on the forecasted underlying transaction. A 10% appreciation or depreciation inthe value of the U.S. Dollar against foreign currencies from the prevailing market rates would result in acorresponding increase or decrease of $18 million as of December 31, 2008 in the fair value of the hedgeportfolio.
Our cash and cash equivalents are not subject to significant interest rate risk due to the short maturities ofthese instruments. As of December 31, 2008, the carrying value of our cash and cash equivalents approximatedfair value. The interest rate risk associated with our borrowing and investing activities as of December 31, 2008was not material in relation to our consolidated financial position, results of operations or cash flows.
We utilize non-exchange traded financial instruments, such as foreign exchange forward contracts that wepurchase exclusively from highly rated financial institutions. We record these contracts on our balance sheet atfair market value based upon market price quotations from the financial institutions. We do not enter intonon-exchange traded contracts that require the use of fair value estimation techniques, but if we did, they couldhave a material impact on our financial results. Also, we do not enter into hedges for speculative purposes.
We are potentially subject to concentrations of credit risk on accounts receivable and financial instruments,such as hedging instruments and cash and cash equivalents. Credit risk includes the risk of nonperformance bycounterparties. The maximum potential loss may exceed the amount recognized on the balance sheet. Exposure
37
Fo
rm10-K

to credit risk is managed through credit approvals, credit limits, selecting major international financialinstitutions (as counterparties to hedging transactions) and monitoring procedures. Our business often involveslarge transactions with customers for which we do not require collateral. If one or more of those customers wereto default in its obligations under applicable contractual arrangements, we could be exposed to potentiallysignificant losses. Moreover, a prolonged downturn in the global economy could have an adverse impact on theability of our customers to pay their obligations on a timely basis. We believe that the reserves for potentiallosses are adequate. As of December 31, 2008, we did not have any major concentration of credit risk related tofinancial instruments.
38
Item 8. FINANCIAL STATEMENTS AND SUPPLEMENTARY DATA
Management’s Responsibility for Financial Statements
We are responsible for the preparation, integrity and objectivity of our consolidated financial statements andother financial information presented in our annual report. The accompanying consolidated financial statementswere prepared in accordance with accounting principles generally accepted in the United States of America andinclude certain amounts based on currently available information and our judgment of current conditions andcircumstances.
PricewaterhouseCoopers LLP, our independent registered public accounting firm, is engaged to performaudits of our consolidated financial statements. These audits are performed in accordance with the standards ofthe Public Company Accounting Oversight Board (United States). Our independent registered public accountingfirm was given unrestricted access to all financial records and related data, including minutes of all meetings ofstockholders, the Board of Directors, and committees of the Board.
The Audit Committee of the Board of Directors, consisting entirely of independent directors who are notemployees of NCR, monitors our accounting, reporting, and internal control structure. Our independentregistered public accounting firm, internal auditors, and management has complete and free access to the AuditCommittee, which periodically meets directly with each group to ensure that their respective duties are beingproperly discharged.
/s/ WILLIAM NUTI /s/ ANTHONY MASSETTI
William Nuti Anthony MassettiChairman of the Board,
Chief Executive Officer and PresidentSenior Vice President and
Chief Financial Officer
39
Fo
rm10-K
Report of Independent Registered Public Accounting Firm
To the Board of Directors and Stockholders of NCR Corporation:
In our opinion, the consolidated financial statements listed in the index appearing under Item 15(a)(1)present fairly, in all material respects, the financial position of NCR Corporation and its subsidiaries atDecember 31, 2008 and 2007, and the results of their operations and their cash flows for each of the three yearsin the period ended December 31, 2008 in conformity with accounting principles generally accepted in theUnited States of America. In addition, in our opinion, the financial statement schedule listed in the indexappearing under Item 15(a)(2) presents fairly, in all material respects, the information set forth therein when readin conjunction with the related consolidated financial statements. Also in our opinion, the Company maintained,in all material respects, effective internal control over financial reporting as of December 31, 2008, based oncriteria established in Internal Control—Integrated Framework issued by the Committee of SponsoringOrganizations of the Treadway Commission (COSO). The Company’s management is responsible for thesefinancial statements and financial statement schedule, for maintaining effective internal control over financialreporting and for its assessment of the effectiveness of internal control over financial reporting, included inManagement’s Report on Internal Control over Financial Reporting appearing under Item 9A. Our responsibilityis to express opinions on these financial statements, on the financial statement schedule, and on the Company’sinternal control over financial reporting based on our integrated audits. We conducted our audits in accordancewith the standards of the Public Company Accounting Oversight Board (United States). Those standards requirethat we plan and perform the audits to obtain reasonable assurance about whether the financial statements arefree of material misstatement and whether effective internal control over financial reporting was maintained in allmaterial respects. Our audits of the financial statements included examining, on a test basis, evidence supportingthe amounts and disclosures in the financial statements, assessing the accounting principles used and significantestimates made by management, and evaluating the overall financial statement presentation. Our audit of internalcontrol over financial reporting included obtaining an understanding of internal control over financial reporting,assessing the risk that a material weakness exists, and testing and evaluating the design and operatingeffectiveness of internal control based on the assessed risk. Our audits also included performing such otherprocedures as we considered necessary in the circumstances. We believe that our audits provide a reasonablebasis for our opinions.
As discussed in Note 9 to the consolidated financial statements, effective December 31, 2006, the Companychanged the manner in which it accounts for defined benefit pension, postretirement, and postemployment plans.Further, as discussed in Note 7 to the consolidated financial statements, effective January 1, 2007, the Companychanged the manner in which it accounts for uncertain tax positions.
A company’s internal control over financial reporting is a process designed to provide reasonable assuranceregarding the reliability of financial reporting and the preparation of financial statements for external purposes inaccordance with generally accepted accounting principles. A company’s internal control over financial reportingincludes those policies and procedures that (i) pertain to the maintenance of records that, in reasonable detail,accurately and fairly reflect the transactions and dispositions of the assets of the company; (ii) provide reasonableassurance that transactions are recorded as necessary to permit preparation of financial statements in accordancewith generally accepted accounting principles, and that receipts and expenditures of the company are being madeonly in accordance with authorizations of management and directors of the company; and (iii) provide reasonableassurance regarding prevention or timely detection of unauthorized acquisition, use, or disposition of thecompany’s assets that could have a material effect on the financial statements.
Because of its inherent limitations, internal control over financial reporting may not prevent or detectmisstatements. Also, projections of any evaluation of effectiveness to future periods are subject to the risk thatcontrols may become inadequate because of changes in conditions, or that the degree of compliance with thepolicies or procedures may deteriorate.
/s/ PricewaterhouseCoopers LLPDayton, OhioFebruary 24, 2009
40

Consolidated Statements of Operations
In millions, except per share amounts
For the years ended December 31 2008 2007 2006
RevenueProduct revenue . . . . . . . . . . . . . . . . . . . . . . . . . . . . . . . . . . . . . . . . . . . . . . . . . . . . . . . $2,861 $2,693 $2,428Service revenue . . . . . . . . . . . . . . . . . . . . . . . . . . . . . . . . . . . . . . . . . . . . . . . . . . . . . . . 2,454 2,277 2,154
Total revenue . . . . . . . . . . . . . . . . . . . . . . . . . . . . . . . . . . . . . . . . . . . . . . . . . . . . . . . . 5,315 4,970 4,582
Operating ExpensesCost of products . . . . . . . . . . . . . . . . . . . . . . . . . . . . . . . . . . . . . . . . . . . . . . . . . . . . . . . 2,113 2,035 1,803Cost of services . . . . . . . . . . . . . . . . . . . . . . . . . . . . . . . . . . . . . . . . . . . . . . . . . . . . . . . 2,019 1,895 1,852Selling, general and administrative expenses . . . . . . . . . . . . . . . . . . . . . . . . . . . . . . . . . 713 684 654Research and development expenses . . . . . . . . . . . . . . . . . . . . . . . . . . . . . . . . . . . . . . . 148 137 119
Total operating expenses . . . . . . . . . . . . . . . . . . . . . . . . . . . . . . . . . . . . . . . . . . . . . . 4,993 4,751 4,428
Income from operations . . . . . . . . . . . . . . . . . . . . . . . . . . . . . . . . . . . . . . . . . . . . . . . 322 219 154Interest expense . . . . . . . . . . . . . . . . . . . . . . . . . . . . . . . . . . . . . . . . . . . . . . . . . . . . . . . 22 24 24Other expense (income), net . . . . . . . . . . . . . . . . . . . . . . . . . . . . . . . . . . . . . . . . . . . . . . 11 (37) (29)
Income from continuing operations before income taxes . . . . . . . . . . . . . . . . . . . . 289 232 159Income tax expense . . . . . . . . . . . . . . . . . . . . . . . . . . . . . . . . . . . . . . . . . . . . . . . . . . . . 58 61 8
Income from continuing operations . . . . . . . . . . . . . . . . . . . . . . . . . . . . . . . . . . . . . . 231 171 151(Loss) income from discontinued operations, net of tax . . . . . . . . . . . . . . . . . . . . . (3) 103 231
Net income . . . . . . . . . . . . . . . . . . . . . . . . . . . . . . . . . . . . . . . . . . . . . . . . . . . . . . . . . . $ 228 $ 274 $ 382
Income per common share from continuing operationsBasic . . . . . . . . . . . . . . . . . . . . . . . . . . . . . . . . . . . . . . . . . . . . . . . . . . . . . . . . . . . . $ 1.40 $ 0.95 $ 0.84
Diluted . . . . . . . . . . . . . . . . . . . . . . . . . . . . . . . . . . . . . . . . . . . . . . . . . . . . . . . . . . $ 1.38 $ 0.94 $ 0.83
Net income per common shareBasic . . . . . . . . . . . . . . . . . . . . . . . . . . . . . . . . . . . . . . . . . . . . . . . . . . . . . . . . . . . . $ 1.38 $ 1.52 $ 2.12
Diluted . . . . . . . . . . . . . . . . . . . . . . . . . . . . . . . . . . . . . . . . . . . . . . . . . . . . . . . . . . $ 1.36 $ 1.50 $ 2.09
Weighted average common shares outstandingBasic . . . . . . . . . . . . . . . . . . . . . . . . . . . . . . . . . . . . . . . . . . . . . . . . . . . . . . . . . . . . 165.3 180.1 180.0Diluted . . . . . . . . . . . . . . . . . . . . . . . . . . . . . . . . . . . . . . . . . . . . . . . . . . . . . . . . . . 167.9 182.7 182.9
The accompanying notes are an integral part of the Consolidated Financial Statements.
41
Fo
rm10-K
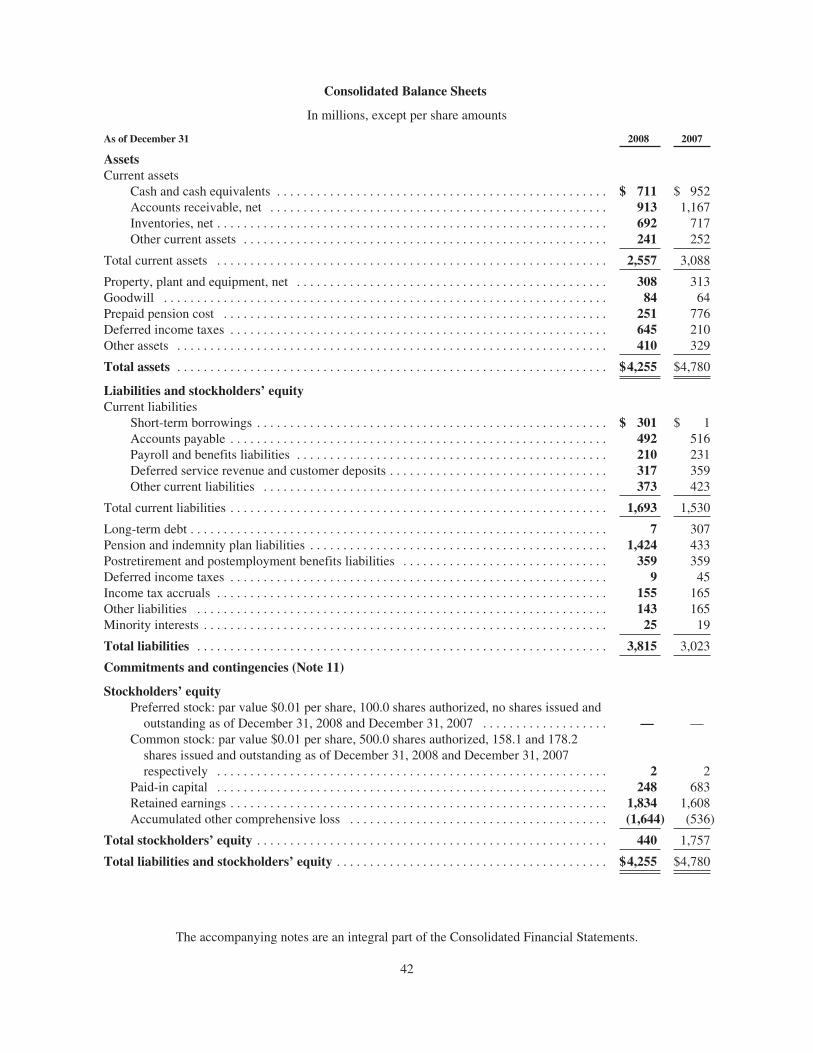
Consolidated Balance Sheets
In millions, except per share amounts
As of December 31 2008 2007
AssetsCurrent assets
Cash and cash equivalents . . . . . . . . . . . . . . . . . . . . . . . . . . . . . . . . . . . . . . . . . . . . . . . . . . $ 711 $ 952Accounts receivable, net . . . . . . . . . . . . . . . . . . . . . . . . . . . . . . . . . . . . . . . . . . . . . . . . . . . 913 1,167Inventories, net . . . . . . . . . . . . . . . . . . . . . . . . . . . . . . . . . . . . . . . . . . . . . . . . . . . . . . . . . . . 692 717Other current assets . . . . . . . . . . . . . . . . . . . . . . . . . . . . . . . . . . . . . . . . . . . . . . . . . . . . . . . 241 252
Total current assets . . . . . . . . . . . . . . . . . . . . . . . . . . . . . . . . . . . . . . . . . . . . . . . . . . . . . . . . . . . 2,557 3,088
Property, plant and equipment, net . . . . . . . . . . . . . . . . . . . . . . . . . . . . . . . . . . . . . . . . . . . . . . . 308 313Goodwill . . . . . . . . . . . . . . . . . . . . . . . . . . . . . . . . . . . . . . . . . . . . . . . . . . . . . . . . . . . . . . . . . . . 84 64Prepaid pension cost . . . . . . . . . . . . . . . . . . . . . . . . . . . . . . . . . . . . . . . . . . . . . . . . . . . . . . . . . . 251 776Deferred income taxes . . . . . . . . . . . . . . . . . . . . . . . . . . . . . . . . . . . . . . . . . . . . . . . . . . . . . . . . . 645 210Other assets . . . . . . . . . . . . . . . . . . . . . . . . . . . . . . . . . . . . . . . . . . . . . . . . . . . . . . . . . . . . . . . . . 410 329
Total assets . . . . . . . . . . . . . . . . . . . . . . . . . . . . . . . . . . . . . . . . . . . . . . . . . . . . . . . . . . . . . . . . . $4,255 $4,780
Liabilities and stockholders’ equityCurrent liabilities
Short-term borrowings . . . . . . . . . . . . . . . . . . . . . . . . . . . . . . . . . . . . . . . . . . . . . . . . . . . . . $ 301 $ 1Accounts payable . . . . . . . . . . . . . . . . . . . . . . . . . . . . . . . . . . . . . . . . . . . . . . . . . . . . . . . . . 492 516Payroll and benefits liabilities . . . . . . . . . . . . . . . . . . . . . . . . . . . . . . . . . . . . . . . . . . . . . . . 210 231Deferred service revenue and customer deposits . . . . . . . . . . . . . . . . . . . . . . . . . . . . . . . . . 317 359Other current liabilities . . . . . . . . . . . . . . . . . . . . . . . . . . . . . . . . . . . . . . . . . . . . . . . . . . . . 373 423
Total current liabilities . . . . . . . . . . . . . . . . . . . . . . . . . . . . . . . . . . . . . . . . . . . . . . . . . . . . . . . . . 1,693 1,530
Long-term debt . . . . . . . . . . . . . . . . . . . . . . . . . . . . . . . . . . . . . . . . . . . . . . . . . . . . . . . . . . . . . . . 7 307Pension and indemnity plan liabilities . . . . . . . . . . . . . . . . . . . . . . . . . . . . . . . . . . . . . . . . . . . . . 1,424 433Postretirement and postemployment benefits liabilities . . . . . . . . . . . . . . . . . . . . . . . . . . . . . . . 359 359Deferred income taxes . . . . . . . . . . . . . . . . . . . . . . . . . . . . . . . . . . . . . . . . . . . . . . . . . . . . . . . . . 9 45Income tax accruals . . . . . . . . . . . . . . . . . . . . . . . . . . . . . . . . . . . . . . . . . . . . . . . . . . . . . . . . . . . 155 165Other liabilities . . . . . . . . . . . . . . . . . . . . . . . . . . . . . . . . . . . . . . . . . . . . . . . . . . . . . . . . . . . . . . 143 165Minority interests . . . . . . . . . . . . . . . . . . . . . . . . . . . . . . . . . . . . . . . . . . . . . . . . . . . . . . . . . . . . . 25 19
Total liabilities . . . . . . . . . . . . . . . . . . . . . . . . . . . . . . . . . . . . . . . . . . . . . . . . . . . . . . . . . . . . . . 3,815 3,023
Commitments and contingencies (Note 11)
Stockholders’ equityPreferred stock: par value $0.01 per share, 100.0 shares authorized, no shares issued and
outstanding as of December 31, 2008 and December 31, 2007 . . . . . . . . . . . . . . . . . . . — —Common stock: par value $0.01 per share, 500.0 shares authorized, 158.1 and 178.2
shares issued and outstanding as of December 31, 2008 and December 31, 2007respectively . . . . . . . . . . . . . . . . . . . . . . . . . . . . . . . . . . . . . . . . . . . . . . . . . . . . . . . . . . . 2 2
Paid-in capital . . . . . . . . . . . . . . . . . . . . . . . . . . . . . . . . . . . . . . . . . . . . . . . . . . . . . . . . . . . 248 683Retained earnings . . . . . . . . . . . . . . . . . . . . . . . . . . . . . . . . . . . . . . . . . . . . . . . . . . . . . . . . . 1,834 1,608Accumulated other comprehensive loss . . . . . . . . . . . . . . . . . . . . . . . . . . . . . . . . . . . . . . . (1,644) (536)
Total stockholders’ equity . . . . . . . . . . . . . . . . . . . . . . . . . . . . . . . . . . . . . . . . . . . . . . . . . . . . . 440 1,757
Total liabilities and stockholders’ equity . . . . . . . . . . . . . . . . . . . . . . . . . . . . . . . . . . . . . . . . . $4,255 $4,780
The accompanying notes are an integral part of the Consolidated Financial Statements.
42
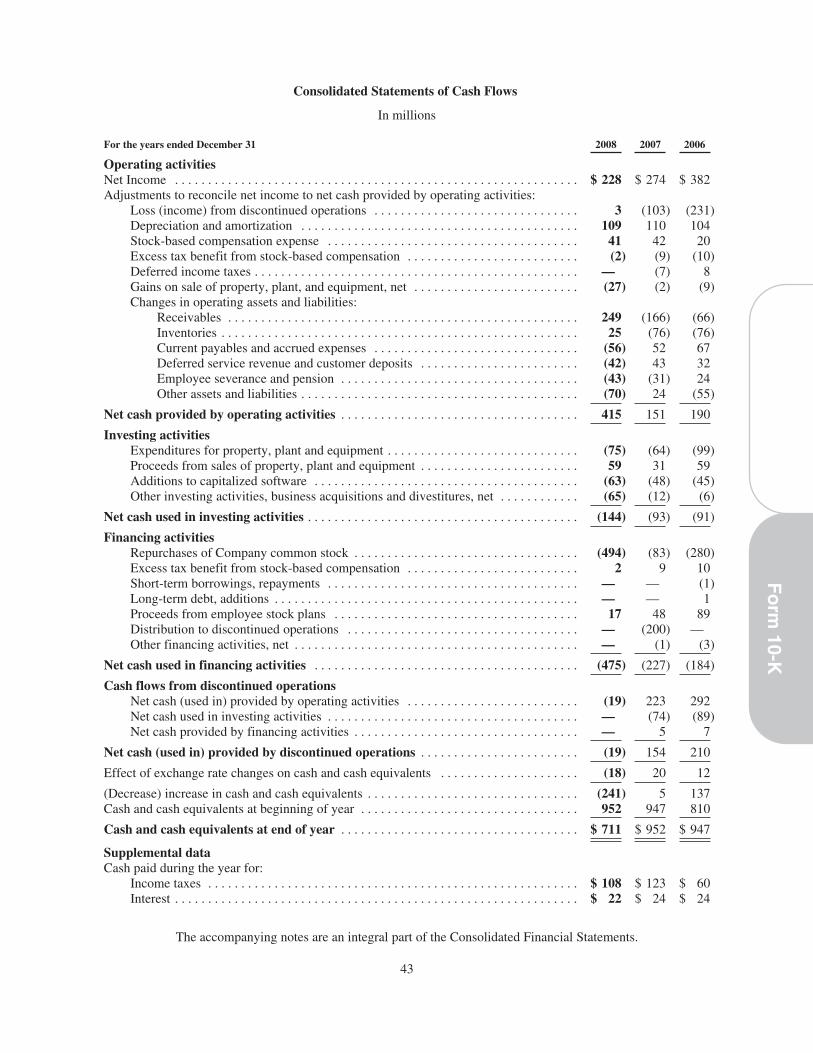
Consolidated Statements of Cash Flows
In millions
For the years ended December 31 2008 2007 2006
Operating activitiesNet Income . . . . . . . . . . . . . . . . . . . . . . . . . . . . . . . . . . . . . . . . . . . . . . . . . . . . . . . . . . . . . $ 228 $ 274 $ 382Adjustments to reconcile net income to net cash provided by operating activities:
Loss (income) from discontinued operations . . . . . . . . . . . . . . . . . . . . . . . . . . . . . . . 3 (103) (231)Depreciation and amortization . . . . . . . . . . . . . . . . . . . . . . . . . . . . . . . . . . . . . . . . . . 109 110 104Stock-based compensation expense . . . . . . . . . . . . . . . . . . . . . . . . . . . . . . . . . . . . . . 41 42 20Excess tax benefit from stock-based compensation . . . . . . . . . . . . . . . . . . . . . . . . . . (2) (9) (10)Deferred income taxes . . . . . . . . . . . . . . . . . . . . . . . . . . . . . . . . . . . . . . . . . . . . . . . . . — (7) 8Gains on sale of property, plant, and equipment, net . . . . . . . . . . . . . . . . . . . . . . . . . (27) (2) (9)Changes in operating assets and liabilities:
Receivables . . . . . . . . . . . . . . . . . . . . . . . . . . . . . . . . . . . . . . . . . . . . . . . . . . . . . 249 (166) (66)Inventories . . . . . . . . . . . . . . . . . . . . . . . . . . . . . . . . . . . . . . . . . . . . . . . . . . . . . . 25 (76) (76)Current payables and accrued expenses . . . . . . . . . . . . . . . . . . . . . . . . . . . . . . . (56) 52 67Deferred service revenue and customer deposits . . . . . . . . . . . . . . . . . . . . . . . . (42) 43 32Employee severance and pension . . . . . . . . . . . . . . . . . . . . . . . . . . . . . . . . . . . . (43) (31) 24Other assets and liabilities . . . . . . . . . . . . . . . . . . . . . . . . . . . . . . . . . . . . . . . . . . (70) 24 (55)
Net cash provided by operating activities . . . . . . . . . . . . . . . . . . . . . . . . . . . . . . . . . . . . 415 151 190
Investing activitiesExpenditures for property, plant and equipment . . . . . . . . . . . . . . . . . . . . . . . . . . . . . (75) (64) (99)Proceeds from sales of property, plant and equipment . . . . . . . . . . . . . . . . . . . . . . . . 59 31 59Additions to capitalized software . . . . . . . . . . . . . . . . . . . . . . . . . . . . . . . . . . . . . . . . (63) (48) (45)Other investing activities, business acquisitions and divestitures, net . . . . . . . . . . . . (65) (12) (6)
Net cash used in investing activities . . . . . . . . . . . . . . . . . . . . . . . . . . . . . . . . . . . . . . . . . (144) (93) (91)
Financing activitiesRepurchases of Company common stock . . . . . . . . . . . . . . . . . . . . . . . . . . . . . . . . . . (494) (83) (280)Excess tax benefit from stock-based compensation . . . . . . . . . . . . . . . . . . . . . . . . . . 2 9 10Short-term borrowings, repayments . . . . . . . . . . . . . . . . . . . . . . . . . . . . . . . . . . . . . . — — (1)Long-term debt, additions . . . . . . . . . . . . . . . . . . . . . . . . . . . . . . . . . . . . . . . . . . . . . . — — 1Proceeds from employee stock plans . . . . . . . . . . . . . . . . . . . . . . . . . . . . . . . . . . . . . 17 48 89Distribution to discontinued operations . . . . . . . . . . . . . . . . . . . . . . . . . . . . . . . . . . . — (200) —Other financing activities, net . . . . . . . . . . . . . . . . . . . . . . . . . . . . . . . . . . . . . . . . . . . — (1) (3)
Net cash used in financing activities . . . . . . . . . . . . . . . . . . . . . . . . . . . . . . . . . . . . . . . . (475) (227) (184)
Cash flows from discontinued operationsNet cash (used in) provided by operating activities . . . . . . . . . . . . . . . . . . . . . . . . . . (19) 223 292Net cash used in investing activities . . . . . . . . . . . . . . . . . . . . . . . . . . . . . . . . . . . . . . — (74) (89)Net cash provided by financing activities . . . . . . . . . . . . . . . . . . . . . . . . . . . . . . . . . . — 5 7
Net cash (used in) provided by discontinued operations . . . . . . . . . . . . . . . . . . . . . . . . (19) 154 210
Effect of exchange rate changes on cash and cash equivalents . . . . . . . . . . . . . . . . . . . . . (18) 20 12
(Decrease) increase in cash and cash equivalents . . . . . . . . . . . . . . . . . . . . . . . . . . . . . . . . (241) 5 137Cash and cash equivalents at beginning of year . . . . . . . . . . . . . . . . . . . . . . . . . . . . . . . . . 952 947 810
Cash and cash equivalents at end of year . . . . . . . . . . . . . . . . . . . . . . . . . . . . . . . . . . . . $ 711 $ 952 $ 947
Supplemental dataCash paid during the year for:
Income taxes . . . . . . . . . . . . . . . . . . . . . . . . . . . . . . . . . . . . . . . . . . . . . . . . . . . . . . . . $ 108 $ 123 $ 60Interest . . . . . . . . . . . . . . . . . . . . . . . . . . . . . . . . . . . . . . . . . . . . . . . . . . . . . . . . . . . . . $ 22 $ 24 $ 24
The accompanying notes are an integral part of the Consolidated Financial Statements.
43
Fo
rm10-K

Consolidated Statements of Changes in Stockholders’ Equity
In millions
Common StockPaid-inCapital
RetainedEarnings
AccumulatedOther
Comprehensive(Loss) Income TotalShares Amount
December 31, 2005 . . . . . . . . . . . . . . . . . . . . . . . . . . . . . . 182 $ 2 $ 794 1,518 $ (279) $2,035Employee stock purchase and stock compensation plans . . 5 — 141 — — 141Repurchase of Company common stock . . . . . . . . . . . . . . . (8) — (280) — — (280)Adoption of FASB Statement No. 158 (Note 9) . . . . . . . . . — — — — (710) (710)
Subtotal . . . . . . . . . . . . . . . . . . . . . . . . . . . . . . . . . . . . . . . . 179 2 655 1,518 (989) 1,186
Net income . . . . . . . . . . . . . . . . . . . . . . . . . . . . . . . . . . . . . . — — — 382 — 382Other comprehensive income (loss), net of tax:
Currency translation adjustments . . . . . . . . . . . . . . . . . — — — — 39 39Unrealized losses on securities . . . . . . . . . . . . . . . . . . — — — — (2) (2)Changes in additional minimum pension liability, net
of tax of $133 . . . . . . . . . . . . . . . . . . . . . . . . . . . . . . — — — — 279 279Unrealized losses on derivatives . . . . . . . . . . . . . . . . . — — — — (3) (3)
Comprehensive income . . . . . . . . . . . . . . . . . . . . . . . . . . . . — — — 382 313 695
December 31, 2006 . . . . . . . . . . . . . . . . . . . . . . . . . . . . . . . 179 $ 2 $ 655 $1,900 $ (676) $1,881Employee stock purchase and stock compensation plans . . 2 — 115 — — 115Repurchase of Company common stock . . . . . . . . . . . . . . . (3) — (83) — — (83)Adoption of FIN 48 . . . . . . . . . . . . . . . . . . . . . . . . . . . . . . . — — — (5) — (5)
Subtotal . . . . . . . . . . . . . . . . . . . . . . . . . . . . . . . . . . . . . . . . 178 2 687 1,895 (676) 1,908
Net income . . . . . . . . . . . . . . . . . . . . . . . . . . . . . . . . . . . . . . — — — 274 — 274Other comprehensive income (loss), net of tax:
Currency translation adjustments . . . . . . . . . . . . . . . . . — — — — 15 15Unrealized losses on securities, net of tax
benefit of $1 . . . . . . . . . . . . . . . . . . . . . . . . . . . . . . . — — — — (4) (4)Benefit plans, net (Note 9) . . . . . . . . . . . . . . . . . . . . . . — — — — 120 120Unrealized losses on derivatives, net of tax
benefit of $1 . . . . . . . . . . . . . . . . . . . . . . . . . . . . . . . — — — — (3) (3)
Comprehensive income . . . . . . . . . . . . . . . . . . . . . . . . . . . . — — — 274 128 402Spin-off of Teradata (Note 12) . . . . . . . . . . . . . . . . . . . . . . — — (4) (561) 12 (553)
December 31, 2007 . . . . . . . . . . . . . . . . . . . . . . . . . . . . . . . 178 $ 2 $ 683 $1,608 $ (536) $1,757Employee stock purchase and stock compensation plans . . 2 — 59 — — 59Repurchase of Company common stock . . . . . . . . . . . . . . . (22) — (494) — — (494)
Subtotal . . . . . . . . . . . . . . . . . . . . . . . . . . . . . . . . . . . . . . . . 158 2 248 1,608 (536) 1,322
Net income . . . . . . . . . . . . . . . . . . . . . . . . . . . . . . . . . . . . . . — — — 228 — 228Other comprehensive loss, net of tax:
Currency translation adjustments . . . . . . . . . . . . . . . . . — — — — (201) (201)Unrealized losses on securities, net of tax benefit of
$1 . . . . . . . . . . . . . . . . . . . . . . . . . . . . . . . . . . . . . . . — — — — (7) (7)Benefit plans, net (Note 9) . . . . . . . . . . . . . . . . . . . . . . — — — — (893) (893)Unrealized losses on derivatives . . . . . . . . . . . . . . . . . — — — — (7) (7)
Comprehensive income (loss) . . . . . . . . . . . . . . . . . . . . . . . — — — 228 (1,108) (880)Spin-off of Teradata (Note 12) . . . . . . . . . . . . . . . . . . . . . . — — — (2) — (2)
December 31, 2008 . . . . . . . . . . . . . . . . . . . . . . . . . . . . . . 158 $ 2 $ 248 $1,834 $(1,644) $ 440
The accompanying notes are an integral part of the Consolidated Financial Statements.
44
NOTES TO CONSOLIDATED FINANCIAL STATEMENTS
Note 1 Description of Business and Significant Accounting Policies
Description of Business NCR Corporation (NCR or the Company, also referred to as “we,” “us” or “our”)and its subsidiaries provide technology and services that are designed specifically to enable NCR’s customers toconnect, interact and transact with their customers.
NCR provides specific solutions for a range of industries including financial services, retail and hospitality,travel and gaming, healthcare and public sector, entertainment and software and technology services. NCR’ssolutions are built on a foundation of long-established industry knowledge and consulting expertise, value-addedsoftware and hardware technology, global customer support services, and a complete line of businessconsumables and specialty media products.
Classification of operations following Teradata Spin-off On September 30, 2007, NCR completed thespin-off of its Teradata Data Warehousing business through the distribution of a tax-free stock dividend to itsstockholders. NCR distributed one share of common stock of Teradata Corporation (Teradata) for each share ofNCR common stock to NCR stockholders of record as of the close of business on September 14, 2007. Upon thedistribution of Teradata, NCR stockholders received 100% (approximately 181 million shares) of the commonstock of Teradata, which is now an independent public company trading under the symbol “TDC” on the NewYork Stock Exchange.
In accordance with Statement of Financial Accounting Standards (SFAS) No. 144 (SFAS 144), Accountingfor the Impairment or Disposal of Long-Lived Assets, the results of operations, assets, liabilities and cash flowsof Teradata have been presented as a discontinued operation for all periods presented in this Form 10-K. SeeNote 12, “Discontinued Operations” for a further discussion of the spin-off of Teradata. Unless otherwise stated,these Notes to Consolidated Financial Statements exclude information related to the Teradata Data Warehousingbusiness.
In connection with the spin-off of Teradata, the Company incurred approximately $71 million of costs in2007. These costs were primarily for legal, accounting, other professional and consulting fees. Approximately$55 million was directly related and incurred to affect the spin-off and has been included in income fromdiscontinued operations in the Consolidated Statement of Operations. The remaining spin-related costs of $16million were included in the results of continuing operations, primarily in selling, general and administrativeexpenses for the year ended December 31, 2007. The spin-related costs included in continuing operations areprimarily due to the modifications of stock options and restricted stock awards to NCR employees in connectionwith the spin-off.
Out of Period Adjustments In the second quarter of 2007, the Company recorded an adjustment toincrease income tax expense by $17 million relating to immaterial errors originating in prior years. Theadjustment was composed of an increase to income tax expense of $25 million due to an understatement ofincome tax expense in the years 2001 through 2006 relating to the accounting for income taxes on intercompanyprofit. This adjustment was offset, in part, by an adjustment to reduce income tax expense by $8 million as aresult of an overstatement of income tax expense (and the related liability) in 2006 due to an error in preparingthat year’s income tax provision. Of the total $17 million adjustment, the amount recorded in the results fromcontinuing operations was $10 million and the remaining $7 million was recorded in the results fromdiscontinued operations. The Company determined that the impact of these corrections in all prior interim andannual periods and to 2007 results was immaterial to the results of operations.
Basis of Consolidation The consolidated financial statements include the accounts of NCR and itsmajority-owned subsidiaries. Long-term investments in affiliated companies in which NCR owns between 20%and 50%, and therefore, exercises significant influence, but which it does not control, are accounted for using theequity method. Investments in which NCR does not exercise significant influence (generally, when NCR has aninvestment of less than 20% and no significant influence, such as representation on the investee’s board ofdirectors) are accounted for using the cost method. All significant inter-company transactions and accounts havebeen eliminated. In addition, the Company is required to determine whether it is the primary beneficiary of
45
Fo
rm10-K
economic income or losses that may be generated by variable interest entities in which the Company has such aninterest. In circumstances where the Company has determined it is the primary beneficiary, consolidation of thatentity is required.
Use of Estimates The preparation of financial statements in conformity with accounting principlesgenerally accepted in the United States (otherwise referred to as GAAP) requires management to make estimatesand judgments that affect the reported amounts of assets and liabilities, the disclosure of contingent assets andliabilities at the date of the financial statements, and revenues and expenses during the period reported. Actualresults could differ from those estimates.
Revenue Recognition NCR’s revenue recognition policy is consistent with the requirements of Statementof Position 97-2 (SOP 97-2), Software Revenue Recognition, Staff Accounting Bulletin No. 104 (SAB 104),Revenue Recognition, Emerging Issues Task Force Issue No. 00-21 (Issue 00-21), Revenue Arrangements withMultiple Deliverables, and other applicable revenue recognition guidance and interpretations. The Companyrecords revenue, net of taxes, when it is realized, or realizable, and earned. The Company considers these criteriamet when persuasive evidence of an arrangement exists, the products or services have been provided to thecustomer, the sales price is fixed or determinable, and collectibility is reasonably assured. For product sales,revenue is recognized when the customer has assumed risk of loss of the goods sold and all performanceobligations are complete. For service sales, revenue is recognized as the services are provided or ratably over theservice period.
NCR frequently enters into multiple-element arrangements with its customers including hardware, software,professional consulting services and maintenance support services. For arrangements involving multipledeliverables, where deliverables include software and non-software products and services, NCR applies theprovisions of Issue 00-21 to separate the deliverables and allocate the total arrangement consideration. Each unitof accounting is then accounted for under the applicable revenue recognition guidance.
In situations where NCR’s solutions contain software that is more than incidental to the hardware andservices, revenue related to the software and software-related elements is recognized in accordance with SOP97-2. Fair value of software and software-related elements is supported by vendor-specific objective evidence(VSOE). VSOE of fair value is established by the price charged when each element is sold separately. Insituations when there is appropriate evidence of fair value for all undelivered elements, but not for deliveredelements, the residual method is used to allocate the arrangement’s consideration. Under the residual method, thefair value of undelivered elements is deferred and the remaining portion of the arrangement fee is allocated to thedelivered elements and recognized as revenue.
NCR’s customers may request that delivery and passage of title and risk of loss occur on a bill and holdbasis. For these transactions, the Company recognizes revenue in accordance with SAB 104. For each of thethree years ended December 31, 2008, the amount from bill and hold transactions approximated 1% or less oftotal revenue.
Shipping and Handling Costs related to shipping and handling are included in cost of products in theConsolidated Statements of Operations.
Cash and Cash Equivalents All short-term, highly liquid investments having original maturities of threemonths or less are considered to be cash equivalents.
Allowance for Doubtful Accounts NCR establishes provisions for doubtful accounts using percentages ofaccounts receivable balances to reflect historical average credit losses and specific provisions for known issues.
Inventories Inventories are stated at the lower of cost or market, using the average cost method. Costincludes materials, labor and manufacturing overhead related to the purchase and production of inventories.Service parts are included in inventories and include reworkable and non-reworkable service parts. The Companyregularly reviews inventory quantities on hand, future purchase commitments with suppliers and the estimatedutility of inventory. If the review indicates a reduction in utility below carrying value, inventory is reduced to a
46
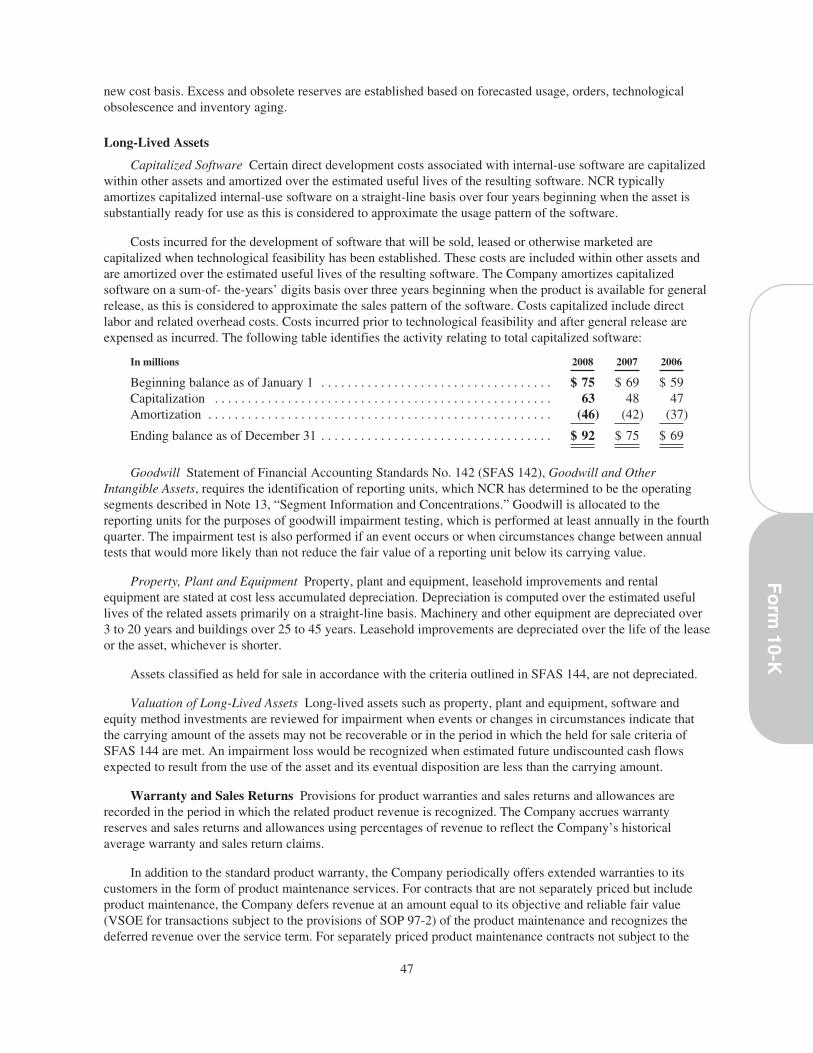
new cost basis. Excess and obsolete reserves are established based on forecasted usage, orders, technologicalobsolescence and inventory aging.
Long-Lived Assets
Capitalized Software Certain direct development costs associated with internal-use software are capitalizedwithin other assets and amortized over the estimated useful lives of the resulting software. NCR typicallyamortizes capitalized internal-use software on a straight-line basis over four years beginning when the asset issubstantially ready for use as this is considered to approximate the usage pattern of the software.
Costs incurred for the development of software that will be sold, leased or otherwise marketed arecapitalized when technological feasibility has been established. These costs are included within other assets andare amortized over the estimated useful lives of the resulting software. The Company amortizes capitalizedsoftware on a sum-of- the-years’ digits basis over three years beginning when the product is available for generalrelease, as this is considered to approximate the sales pattern of the software. Costs capitalized include directlabor and related overhead costs. Costs incurred prior to technological feasibility and after general release areexpensed as incurred. The following table identifies the activity relating to total capitalized software:
In millions 2008 2007 2006
Beginning balance as of January 1 . . . . . . . . . . . . . . . . . . . . . . . . . . . . . . . . . . . $ 75 $ 69 $ 59Capitalization . . . . . . . . . . . . . . . . . . . . . . . . . . . . . . . . . . . . . . . . . . . . . . . . . . . 63 48 47Amortization . . . . . . . . . . . . . . . . . . . . . . . . . . . . . . . . . . . . . . . . . . . . . . . . . . . . (46) (42) (37)
Ending balance as of December 31 . . . . . . . . . . . . . . . . . . . . . . . . . . . . . . . . . . . $ 92 $ 75 $ 69
Goodwill Statement of Financial Accounting Standards No. 142 (SFAS 142), Goodwill and OtherIntangible Assets, requires the identification of reporting units, which NCR has determined to be the operatingsegments described in Note 13, “Segment Information and Concentrations.” Goodwill is allocated to thereporting units for the purposes of goodwill impairment testing, which is performed at least annually in the fourthquarter. The impairment test is also performed if an event occurs or when circumstances change between annualtests that would more likely than not reduce the fair value of a reporting unit below its carrying value.
Property, Plant and Equipment Property, plant and equipment, leasehold improvements and rentalequipment are stated at cost less accumulated depreciation. Depreciation is computed over the estimated usefullives of the related assets primarily on a straight-line basis. Machinery and other equipment are depreciated over3 to 20 years and buildings over 25 to 45 years. Leasehold improvements are depreciated over the life of the leaseor the asset, whichever is shorter.
Assets classified as held for sale in accordance with the criteria outlined in SFAS 144, are not depreciated.
Valuation of Long-Lived Assets Long-lived assets such as property, plant and equipment, software andequity method investments are reviewed for impairment when events or changes in circumstances indicate thatthe carrying amount of the assets may not be recoverable or in the period in which the held for sale criteria ofSFAS 144 are met. An impairment loss would be recognized when estimated future undiscounted cash flowsexpected to result from the use of the asset and its eventual disposition are less than the carrying amount.
Warranty and Sales Returns Provisions for product warranties and sales returns and allowances arerecorded in the period in which the related product revenue is recognized. The Company accrues warrantyreserves and sales returns and allowances using percentages of revenue to reflect the Company’s historicalaverage warranty and sales return claims.
In addition to the standard product warranty, the Company periodically offers extended warranties to itscustomers in the form of product maintenance services. For contracts that are not separately priced but includeproduct maintenance, the Company defers revenue at an amount equal to its objective and reliable fair value(VSOE for transactions subject to the provisions of SOP 97-2) of the product maintenance and recognizes thedeferred revenue over the service term. For separately priced product maintenance contracts not subject to the
47
Fo
rm10-K
provisions of SOP 97-2, NCR applies the provisions of FASB Technical Bulletin No. 90-1, Accounting forSeparately Priced Extended Warranty and Product Maintenance Contracts (FTB 90-1). In conformity with FTB90-1, NCR defers the stated amount of the separately priced contract and recognizes the deferred revenue ratablyover the service term.
Research and Development Costs Research and development costs are expensed as incurred inaccordance with Statement of Financial Accounting Standards No. 2, Accounting for Research and DevelopmentCosts. Research and development costs primarily include payroll and benefit-related costs, contractor fees,facilities costs, infrastructure costs, and administrative expenses directly related to research and developmentsupport.
Leases The Company accounts for material escalation clauses, free or reduced rents and landlord incentiveson a straight-line basis over the lease term, including any reasonably assured lease renewals. For leaseholdimprovements that are funded by the landlord, the Company records the incentive as deferred rent. The deferredrent is then amortized as reductions to lease expense over the lease term.
Pension, Postretirement and Postemployment Benefits NCR has significant pension, postretirement andpostemployment benefit costs, which are developed from actuarial valuations. Actuarial assumptions areestablished to anticipate future events and are used in calculating the expense and liabilities relating to theseplans. These factors include assumptions the Company makes about interest rates, expected investment return onplan assets, rate of increase in healthcare costs, total and involuntary turnover rates, and rates of futurecompensation increases. In addition, NCR also uses subjective factors, such as withdrawal rates and mortalityrates to develop the Company’s valuations. NCR generally reviews and updates these assumptions on an annualbasis. NCR is required to consider current market conditions, including changes in interest rates, in making theseassumptions. The actuarial assumptions that NCR uses may differ materially from actual results due to changingmarket and economic conditions, higher or lower withdrawal rates, or longer or shorter life spans of participants.These differences may result in a significant impact to the amount of pension, postretirement or postemploymentbenefits expense, and the related assets and liabilities, the Company has recorded or may record.
Foreign Currency For many NCR international operations, the local currency is designated as thefunctional currency. Accordingly, assets and liabilities are translated into U.S. Dollars at year-end exchangerates, and revenues and expenses are translated at average exchange rates prevailing during the year. Currencytranslation adjustments from local functional currency countries resulting from fluctuations in exchange rates arerecorded in other comprehensive income. Where the U.S. Dollar is the functional currency, translationadjustments are recorded in other income and expense.
Derivative Instruments In the normal course of business, NCR enters into various financial instruments,including derivative financial instruments. The Company accounts for derivative instruments in accordance withStatement of Financial Accounting Standards No. 133 (SFAS 133), Accounting for Derivatives and HedgingActivities, as amended. The standard requires the recognition of all derivative instruments as either assets orliabilities in the consolidated balance sheets at fair value and recognition of the resulting gains or losses asadjustments to earnings or other comprehensive income. The Company formally documents all relationshipsbetween hedging instruments and hedged items, as well as the risk management objective and strategy forundertaking various hedge transactions. Hedging activities are transacted only with highly rated institutions,reducing exposure to credit risk in the event of nonperformance. Additionally, the Company completesassessments related to the risk of counterparty nonperformance on a regular basis.
The accounting for changes in fair value of a derivative instrument depends on whether it has beendesignated and qualifies as part of a hedging relationship, and further, on the type of hedging relationship. Forthose derivative instruments that are designated and qualify as hedging instruments, the Company has designatedthe hedging instrument, based on the exposure being hedged, as a fair value hedge, a cash flow hedge or a hedgeof a net investment in a foreign operation. For derivative instruments designated as fair value hedges, theeffective portion of the hedge is recorded as an offset to the change in the fair value of the hedged item, and theineffective portion of the hedge, if any, is recorded in the income statement. For derivative instrumentsdesignated as cash flow hedges and determined to be highly effective, the gains or losses are deferred in other
48
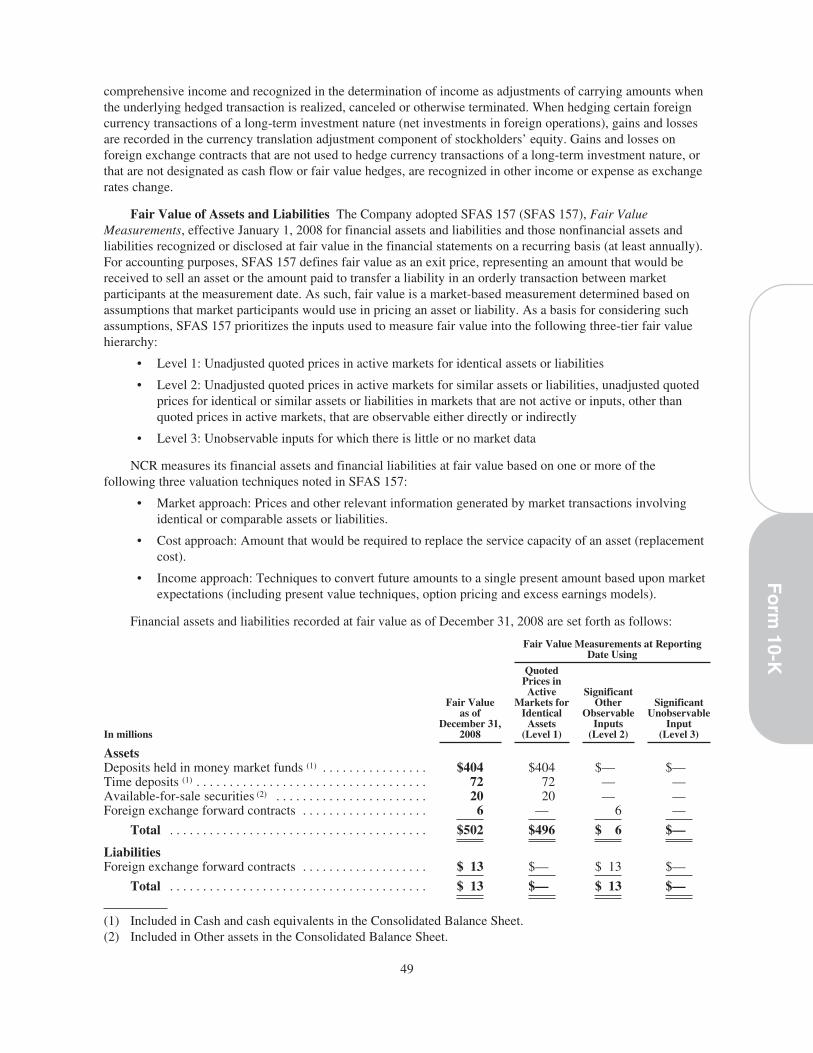
comprehensive income and recognized in the determination of income as adjustments of carrying amounts whenthe underlying hedged transaction is realized, canceled or otherwise terminated. When hedging certain foreigncurrency transactions of a long-term investment nature (net investments in foreign operations), gains and lossesare recorded in the currency translation adjustment component of stockholders’ equity. Gains and losses onforeign exchange contracts that are not used to hedge currency transactions of a long-term investment nature, orthat are not designated as cash flow or fair value hedges, are recognized in other income or expense as exchangerates change.
Fair Value of Assets and Liabilities The Company adopted SFAS 157 (SFAS 157), Fair ValueMeasurements, effective January 1, 2008 for financial assets and liabilities and those nonfinancial assets andliabilities recognized or disclosed at fair value in the financial statements on a recurring basis (at least annually).For accounting purposes, SFAS 157 defines fair value as an exit price, representing an amount that would bereceived to sell an asset or the amount paid to transfer a liability in an orderly transaction between marketparticipants at the measurement date. As such, fair value is a market-based measurement determined based onassumptions that market participants would use in pricing an asset or liability. As a basis for considering suchassumptions, SFAS 157 prioritizes the inputs used to measure fair value into the following three-tier fair valuehierarchy:
• Level 1: Unadjusted quoted prices in active markets for identical assets or liabilities
• Level 2: Unadjusted quoted prices in active markets for similar assets or liabilities, unadjusted quotedprices for identical or similar assets or liabilities in markets that are not active or inputs, other thanquoted prices in active markets, that are observable either directly or indirectly
• Level 3: Unobservable inputs for which there is little or no market data
NCR measures its financial assets and financial liabilities at fair value based on one or more of thefollowing three valuation techniques noted in SFAS 157:
• Market approach: Prices and other relevant information generated by market transactions involvingidentical or comparable assets or liabilities.
• Cost approach: Amount that would be required to replace the service capacity of an asset (replacementcost).
• Income approach: Techniques to convert future amounts to a single present amount based upon marketexpectations (including present value techniques, option pricing and excess earnings models).
Financial assets and liabilities recorded at fair value as of December 31, 2008 are set forth as follows:
Fair Valueas of
December 31,2008
Fair Value Measurements at ReportingDate Using
In millions
QuotedPrices inActive
Markets forIdentical
Assets(Level 1)
SignificantOther
ObservableInputs
(Level 2)
SignificantUnobservable
Input(Level 3)
AssetsDeposits held in money market funds (1) . . . . . . . . . . . . . . . . $404 $404 $— $—Time deposits (1) . . . . . . . . . . . . . . . . . . . . . . . . . . . . . . . . . . . 72 72 — —Available-for-sale securities (2) . . . . . . . . . . . . . . . . . . . . . . . 20 20 — —Foreign exchange forward contracts . . . . . . . . . . . . . . . . . . . 6 — 6 —
Total . . . . . . . . . . . . . . . . . . . . . . . . . . . . . . . . . . . . . . . $502 $496 $ 6 $—
LiabilitiesForeign exchange forward contracts . . . . . . . . . . . . . . . . . . . $ 13 $— $ 13 $—
Total . . . . . . . . . . . . . . . . . . . . . . . . . . . . . . . . . . . . . . . $ 13 $— $ 13 $—
(1) Included in Cash and cash equivalents in the Consolidated Balance Sheet.(2) Included in Other assets in the Consolidated Balance Sheet.
49
Fo
rm10-K
Deposits Held in Money Market Funds A portion of the Company’s excess cash is held in money marketfunds which generate interest income based on prevailing market rates. Money market fund holdings aremeasured at fair value using quoted market prices and are classified within Level 1 of the valuation hierarchy.
Time Deposits A portion of the Company’s excess cash is invested as time deposits with financialinstitutions and banks that generate interest based on prevailing rates. These time deposits have maturities asshort as one day, but no more than three months. Time deposits are classified within Level 1 of the valuationhierarchy as the fair value represents the actual amount of cash on deposit.
Available-For-Sale Securities The Company has investments in mutual funds and equity securities in Japanthat are valued using the market approach with quotations from the NASDAQ stock exchange and two stockexchanges in Japan, respectively. Available-for-sale securities are classified within Level 1 of the valuationhierarchy.
The fair value of the Company’s investments in marketable securities in aggregate was $20 million as ofDecember 31, 2008 and $34 million as of December 31, 2007. The cost basis of the Company’s investments inmarketable securities was $19 million as of December 31, 2008 and $22 million as of December 31, 2007.Unrealized gains and losses on marketable securities classified as available-for-sale are recorded in AccumulatedOther Comprehensive Loss, net of tax. We regularly review our investments to determine whether a decline infair value, if any, below the cost basis is other than temporary. If the decline in the fair value is determined to beother than temporary, the cost basis of the security is written down to fair value and the amount of the write-down is included in the Consolidated Statement of Operations. As of December 31, 2008 and 2007, there were noindividual investments deemed to have an unrealized loss that was other than temporary.
Foreign Exchange Forward Contracts As a result of our global operating activities, we are exposed to risksfrom changes in foreign currency exchange rates, which may adversely affect our financial condition. To manageour exposures and mitigate the impact of currency fluctuations on our financial results, we hedge our primarytransactional exposures through the use of foreign exchange forward contracts. The foreign exchange forwardcontracts are valued using the market approach based on observable market transactions of forward rates and areclassified within Level 2 of the valuation hierarchy.
Interest Rate Swap NCR entered into an interest rate swap agreement (swap) in 2003 as part of its riskmanagement strategy. The swap utilized effectively modifies a portion of the exposure to interest rate risk byconverting a portion of the Company’s fixed-rate debt to a variable rate. The fair value of the swap is determinedusing the income approach, calculated based on LIBOR yield curves at the reporting date and is considered aLevel 2 measure. As of December 31, 2008, the fair value of the swap was an asset of less than $1 million andtherefore, it is not presented in the table above.
Environmental and Legal Contingencies In the normal course of business, NCR is subject to variousregulations, proceedings, lawsuits, claims and other matters, including actions under laws and regulations relatedto the environment and health and safety, among others. NCR believes that the amounts provided in itsconsolidated financial statements, as prescribed by GAAP, are adequate in light of the probable and estimableliabilities. However, there can be no assurances that the actual amounts required to satisfy alleged liabilities fromvarious lawsuits, claims, legal proceedings and other matters, including the Fox River environmental matterdiscussed in Note 11, “Commitments and Contingencies” and to comply with applicable laws and regulations,will not exceed the amounts reflected in NCR’s consolidated financial statements or will not have a materialadverse effect on the consolidated results of operations, financial condition or cash flows. Any costs that may beincurred in excess of those amounts provided as of December 31, 2008 cannot currently be reasonablydetermined or are not currently considered probable.
Legal costs related to loss contingencies are typically expensed as incurred, except for certain costsassociated with NCR’s environmental remediation obligations. Costs and fees associated with litigating theextent and type of required remedial actions and the allocation of remediation costs among potentiallyresponsible parties are typically included in the measurement of the environmental remediation liabilities.
50
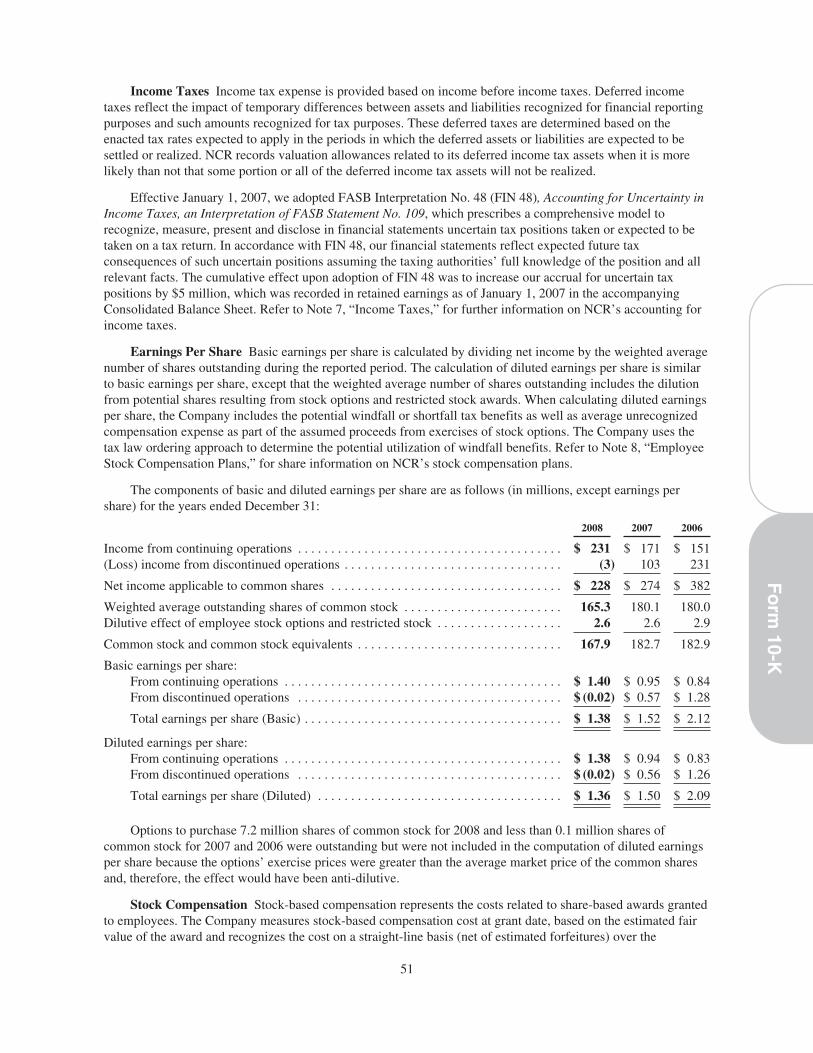
Income Taxes Income tax expense is provided based on income before income taxes. Deferred incometaxes reflect the impact of temporary differences between assets and liabilities recognized for financial reportingpurposes and such amounts recognized for tax purposes. These deferred taxes are determined based on theenacted tax rates expected to apply in the periods in which the deferred assets or liabilities are expected to besettled or realized. NCR records valuation allowances related to its deferred income tax assets when it is morelikely than not that some portion or all of the deferred income tax assets will not be realized.
Effective January 1, 2007, we adopted FASB Interpretation No. 48 (FIN 48), Accounting for Uncertainty inIncome Taxes, an Interpretation of FASB Statement No. 109, which prescribes a comprehensive model torecognize, measure, present and disclose in financial statements uncertain tax positions taken or expected to betaken on a tax return. In accordance with FIN 48, our financial statements reflect expected future taxconsequences of such uncertain positions assuming the taxing authorities’ full knowledge of the position and allrelevant facts. The cumulative effect upon adoption of FIN 48 was to increase our accrual for uncertain taxpositions by $5 million, which was recorded in retained earnings as of January 1, 2007 in the accompanyingConsolidated Balance Sheet. Refer to Note 7, “Income Taxes,” for further information on NCR’s accounting forincome taxes.
Earnings Per Share Basic earnings per share is calculated by dividing net income by the weighted averagenumber of shares outstanding during the reported period. The calculation of diluted earnings per share is similarto basic earnings per share, except that the weighted average number of shares outstanding includes the dilutionfrom potential shares resulting from stock options and restricted stock awards. When calculating diluted earningsper share, the Company includes the potential windfall or shortfall tax benefits as well as average unrecognizedcompensation expense as part of the assumed proceeds from exercises of stock options. The Company uses thetax law ordering approach to determine the potential utilization of windfall benefits. Refer to Note 8, “EmployeeStock Compensation Plans,” for share information on NCR’s stock compensation plans.
The components of basic and diluted earnings per share are as follows (in millions, except earnings pershare) for the years ended December 31:
2008 2007 2006
Income from continuing operations . . . . . . . . . . . . . . . . . . . . . . . . . . . . . . . . . . . . . . . . $ 231 $ 171 $ 151(Loss) income from discontinued operations . . . . . . . . . . . . . . . . . . . . . . . . . . . . . . . . . (3) 103 231
Net income applicable to common shares . . . . . . . . . . . . . . . . . . . . . . . . . . . . . . . . . . . $ 228 $ 274 $ 382
Weighted average outstanding shares of common stock . . . . . . . . . . . . . . . . . . . . . . . . 165.3 180.1 180.0Dilutive effect of employee stock options and restricted stock . . . . . . . . . . . . . . . . . . . 2.6 2.6 2.9
Common stock and common stock equivalents . . . . . . . . . . . . . . . . . . . . . . . . . . . . . . . 167.9 182.7 182.9
Basic earnings per share:From continuing operations . . . . . . . . . . . . . . . . . . . . . . . . . . . . . . . . . . . . . . . . . . $ 1.40 $ 0.95 $ 0.84From discontinued operations . . . . . . . . . . . . . . . . . . . . . . . . . . . . . . . . . . . . . . . . $ (0.02) $ 0.57 $ 1.28
Total earnings per share (Basic) . . . . . . . . . . . . . . . . . . . . . . . . . . . . . . . . . . . . . . . $ 1.38 $ 1.52 $ 2.12
Diluted earnings per share:From continuing operations . . . . . . . . . . . . . . . . . . . . . . . . . . . . . . . . . . . . . . . . . . $ 1.38 $ 0.94 $ 0.83From discontinued operations . . . . . . . . . . . . . . . . . . . . . . . . . . . . . . . . . . . . . . . . $ (0.02) $ 0.56 $ 1.26
Total earnings per share (Diluted) . . . . . . . . . . . . . . . . . . . . . . . . . . . . . . . . . . . . . $ 1.36 $ 1.50 $ 2.09
Options to purchase 7.2 million shares of common stock for 2008 and less than 0.1 million shares ofcommon stock for 2007 and 2006 were outstanding but were not included in the computation of diluted earningsper share because the options’ exercise prices were greater than the average market price of the common sharesand, therefore, the effect would have been anti-dilutive.
Stock Compensation Stock-based compensation represents the costs related to share-based awards grantedto employees. The Company measures stock-based compensation cost at grant date, based on the estimated fairvalue of the award and recognizes the cost on a straight-line basis (net of estimated forfeitures) over the
51
Fo
rm10-K
employee requisite service period. Refer to Note 8, “Employee Stock Compensation Plans,” for more informationon NCR’s stock-based compensation plans.
Recently Issued Accounting Pronouncements
Statement of Financial Accounting Standards No. 157 On February 12, 2008, the FASB issued FASBStaff Position No. FAS 157-2 (FSP 157-2), which delayed the effective date of SFAS 157 for nonfinancial assetsand nonfinancial liabilities, except for items that are recognized or disclosed at fair value in the financialstatements on a recurring basis (at least annually). Where the measurement objective specifically requires the useof fair value, the Company adopted the provisions of SFAS 157 related to financial assets and liabilities as wellas those nonfinancial assets and liabilities with recurring fair value measurements, on January 1, 2008. OnOctober 10, 2008, the FASB issued FASB Staff Position No. FAS 157-3 (FSP 157-3), which was effective onissuance and clarified the application of SFAS 157 in determining the fair value of financial assets when themarkets for those assets are inactive. See Note 1, “Fair Value of Assets and Liabilities,” for further discussion ofthe adoption and our application of SFAS 157. The Company is currently assessing the impact of SFAS 157related to those nonfinancial assets and liabilities for which the effective date has been delayed until fiscal yearsbeginning after November 15, 2008.
Statement of Financial Accounting Standards No. 159 In February 2007, the FASB issued SFASNo. 159 (SFAS 159), The Fair Value Option for Financial Assets and Financial Liabilities. This statementpermits entities to choose to measure many financial instruments and certain other items at fair value forrecognition or disclosure purposes. SFAS 159 was effective for fiscal years beginning after November 15, 2007.The Company did not elect to measure financial instruments and other items at fair value and therefore, theadoption of SFAS 159 did not have an impact on the Consolidated Financial Statements.
Statement of Financial Accounting Standards No. 141 (revised 2007) In December 2007, the FASBissued SFAS No. 141 (revised 2007) (SFAS 141R), Business Combinations. SFAS 141R provides revisedguidance on how acquirers recognize and measure the consideration transferred, intangible assets acquired,liabilities assumed, noncontrolling interests, and goodwill acquired in a business combination. SFAS 141R alsoexpands required disclosures surrounding the nature and financial effects of business combinations. SFAS 141Rapplies prospectively to business combinations for which the acquisition date is on or after the beginning of thefirst annual reporting period beginning on or after December 15, 2008. The impact of the adoption of SFAS 141Rwill depend on the nature and significance of business combinations the Company enters into subsequent toadoption.
Statement of Financial Accounting Standards No. 160 In December 2007, the FASB issued SFASNo. 160 (SFAS 160), Noncontrolling Interests in Consolidated Financial Statements, an Amendment to ARBNo. 51. SFAS 160 applies to all entities that have an outstanding noncontrolling interest in one or moresubsidiaries or that deconsolidate a subsidiary. SFAS 160 is effective for fiscal years, and interim periods withinthose fiscal years, beginning on or after December 15, 2008. Presentation and disclosure requirements of SFAS160 must be applied retrospectively for all periods presented and include reflecting noncontrolling interests,formerly referred to as minority interests, within the equity section of our Consolidated Balance Sheet. Also,consolidated net income or loss and comprehensive income or loss will be recast to include the net income orloss and comprehensive income or loss attributable to the noncontrolling interest. The adoption of SFAS 160 willnot have a material impact on the Company’s financial position, results of operations, or liquidity.
Statement of Financial Accounting Standards No. 161 In March 2008, the FASB issued SFAS No. 161(SFAS 161), Disclosures about Derivative Instruments and Hedging Activities. The new standard is intended tohelp investors better understand how derivative instruments and hedging activities affect an entity’s financialposition, financial performance and cash flows through enhanced disclosure requirements. SFAS 161 is effectivefor financial statements issued for fiscal years and interim periods beginning after November 15, 2008. Theadoption of SFAS 161 will not have an impact on the Company’s financial position, results of operations orliquidity; however, our disclosures after adoption will be enhanced to comply with the new standard.
52
Statement of Financial Accounting Standards No. 162 In May 2008, the FASB issued SFAS No. 162(SFAS 162), Hierarchy of Generally Accepted Accounting Principles. SFAS 162 identifies the sources ofaccounting principles and the framework for selecting the principles used in the preparation of financialstatements. SFAS 162 is effective 60 days following the SEC’s approval of the Public Company AccountingOversight Board amendments to AU Section 411, The Meaning of Present Fairly in Conformity with GenerallyAccepted Accounting Principles. The adoption of SFAS 162 will not have an impact on our consolidatedfinancial position, results of operations or liquidity, as this new standard codifies existing GAAP rather thanchanging GAAP.
FASB Staff Position No. FAS 142-3 In April 2008, the FASB issued FASB Staff Position 142-3 (FSP142-3), Determination of the Useful Life of Intangible Assets. FSP 142-3 amends the factors that should beconsidered in developing renewal or extension assumptions used to determine the useful life of a recognizedintangible asset under SFAS 142. FSP 142-3 is effective for fiscal years beginning after December 15, 2008. Theadoption of FSP 142-3 is not expected to have a material impact on the Company’s financial position, results ofoperations or liquidity.
Emerging Issues Task Force Issue 08-6 In November 2008, the EITF issued their final consensus forEITF Issue 08-6 (EITF 08-6), Equity Method Investment Accounting Considerations. EITF 08-6 providesguidance regarding certain matters related to the accounting for equity method investments, including the methodof determining the initial carrying value of such investments, the method for measuring and recognizing other-than-temporary impairments, and the accounting for share issuance by investees. EITF 08-6 applies prospectivelyto transactions that occur on or after the beginning of the first annual reporting period, including interim periods,on or after December 15, 2008 and coincides with the effective date of SFAS 141R. NCR currently holds severalequity method investments and may or may not make future investments that would qualify for equity methodtreatment. The impact of the adoption of EITF 08-6 will depend on the nature and significance of futuretransactions with current and potential equity method investees, their performance, and any share issuances theycomplete.
Emerging Issues Task Force Issue 08-7 In November 2008, the EITF issued their final consensus forEITF Issue 08-7 (EITF 08-7), Accounting for Defensive Intangible Assets. EITF 08-7 will require entities to fairvalue and determine the useful life of acquired intangible assets under SFAS 141R when the entity has nointention of actively using, or intends to discontinue the use of, the intangible asset, but holds it to prevent othersfrom obtaining access to it. EITF 08-7 applies prospectively to transactions that occur on or after the beginningof the first annual reporting period, including interim periods, on or after December 15, 2008 and coincides withthe effective date of SFAS 141R. The impact of the adoption of EITF 08-7 will depend on the nature andsignificance of such intangible assets acquired by the Company subsequent to the adoption.
FASB Staff Position No. 140-4 and FIN 46(R)-8 In December 2008, the FASB issued FSP 140-4 and FIN46(R)-8, Disclosures by Public Entities (Enterprises) about Transfers of Financial Assets and Interests inVariable Interest Entities that requires additional disclosures by public companies about their involvement withvariable interest entities (VIEs) and their continuing involvement with transferred financial assets. The FSP setsout required disclosure principles and specific new disclosure requirements. The disclosure principles areintended to encourage preparers to provide information that is useful to financial statement users and not limitdisclosures to those specifically required by the FSP. The FSP is effective for annual and interim periodsbeginning after December 15, 2008. The adoption of the FSP will not have a material impact on the disclosuresincluded in our financial statements as the Company does not enter into material transactions involving VIEs ormaterial transfers of financial assets.
FASB Staff Position No. 132(R)-1 In December 2008, the FASB issued FSP 132(R)-1, Employers’Disclosures about Postretirement Benefit Plan Assets that requires additional disclosures by public companiesregarding plan assets of defined benefit pension or other postretirement benefit plans. The FSP requiresadditional disclosures regarding the investment allocation decision making process, the fair value of each majorcategory of plan assets, and the inputs and valuation techniques used to measure the fair value of plan assets. TheFSP is effective for fiscal years ending after December 31, 2009 and early application is permitted. The
53
Fo
rm10-K
provisions of the FSP will not be required for earlier periods presented for comparative purposes. The adoptionof the FSP will not have an impact on the Company’s financial position, results of operations or liquidity;however, our disclosures after adoption will be enhanced to comply with the new standard.
Note 2 Supplemental Financial Information (in millions)
For the years ended December 31 2008 2007 2006
Other (income) expense, netInterest income . . . . . . . . . . . . . . . . . . . . . . . . . . . . . . . . . . . . . . . . . . . . . . . . . . . . . . . . . $ (23) $ (55) $ (35)Fox River provision (Note 11) . . . . . . . . . . . . . . . . . . . . . . . . . . . . . . . . . . . . . . . . . . . . . 28 14 —Impairment of equity investment (Note 4) . . . . . . . . . . . . . . . . . . . . . . . . . . . . . . . . . . . — — 2Other, net . . . . . . . . . . . . . . . . . . . . . . . . . . . . . . . . . . . . . . . . . . . . . . . . . . . . . . . . . . . . . 6 4 4
Total other expense (income), net . . . . . . . . . . . . . . . . . . . . . . . . . . . . . . . . . . . . . . . . . . $ 11 $ (37) $ (29)
At December 31 2008 2007
Accounts receivableTrade . . . . . . . . . . . . . . . . . . . . . . . . . . . . . . . . . . . . . . . . . . . . . . . . . . . . . . . . . . . . . . . . $ 889 $1,122Other . . . . . . . . . . . . . . . . . . . . . . . . . . . . . . . . . . . . . . . . . . . . . . . . . . . . . . . . . . . . . . . . 39 64
Accounts receivable, gross . . . . . . . . . . . . . . . . . . . . . . . . . . . . . . . . . . . . . . . . . . . . . . . . 928 1,186Less: allowance for doubtful accounts . . . . . . . . . . . . . . . . . . . . . . . . . . . . . . . . . . . . . . . (15) (19)
Total accounts receivable, net . . . . . . . . . . . . . . . . . . . . . . . . . . . . . . . . . . . . . . . . . . . . . $ 913 $1,167
InventoriesWork in process and raw materials, net . . . . . . . . . . . . . . . . . . . . . . . . . . . . . . . . . . . . . . $ 137 $ 138Finished goods, net . . . . . . . . . . . . . . . . . . . . . . . . . . . . . . . . . . . . . . . . . . . . . . . . . . . . . 171 194Service parts, net . . . . . . . . . . . . . . . . . . . . . . . . . . . . . . . . . . . . . . . . . . . . . . . . . . . . . . . 384 385
Total inventories, net . . . . . . . . . . . . . . . . . . . . . . . . . . . . . . . . . . . . . . . . . . . . . . . . . . . . $ 692 $ 717
Other current assetsCurrent deferred tax assets . . . . . . . . . . . . . . . . . . . . . . . . . . . . . . . . . . . . . . . . . . . . . . . . $ 68 $ 63Other . . . . . . . . . . . . . . . . . . . . . . . . . . . . . . . . . . . . . . . . . . . . . . . . . . . . . . . . . . . . . . . . 173 189
Total other current assets . . . . . . . . . . . . . . . . . . . . . . . . . . . . . . . . . . . . . . . . . . . . . . . . . $ 241 $ 252
Property, plant and equipmentLand and improvements . . . . . . . . . . . . . . . . . . . . . . . . . . . . . . . . . . . . . . . . . . . . . . . . . . $ 38 $ 42Buildings and improvements . . . . . . . . . . . . . . . . . . . . . . . . . . . . . . . . . . . . . . . . . . . . . . 310 334Machinery and other equipment . . . . . . . . . . . . . . . . . . . . . . . . . . . . . . . . . . . . . . . . . . . 677 685
Property, plant and equipment, gross . . . . . . . . . . . . . . . . . . . . . . . . . . . . . . . . . . . . . . . . 1,025 1,061Less: accumulated depreciation . . . . . . . . . . . . . . . . . . . . . . . . . . . . . . . . . . . . . . . . . . . . (717) (748)
Total property, plant and equipment, net . . . . . . . . . . . . . . . . . . . . . . . . . . . . . . . . . . . . . $ 308 $ 313
Accumulated other comprehensive loss, net of taxCurrency translation adjustments . . . . . . . . . . . . . . . . . . . . . . . . . . . . . . . . . . . . . . . . . . . $ (112) $ 89Unrealized gain on securities . . . . . . . . . . . . . . . . . . . . . . . . . . . . . . . . . . . . . . . . . . . . . . 2 9Unrealized loss on derivatives . . . . . . . . . . . . . . . . . . . . . . . . . . . . . . . . . . . . . . . . . . . . . (8) (1)Actuarial losses and prior service costs on employee benefit plans . . . . . . . . . . . . . . . . (1,526) (633)
Total accumulated other comprehensive loss from continuing operations . . . . . . . . . . . $(1,644) $ (536)
54

Note 3 Restructuring and Real Estate Transactions
Organizational Realignment On January 1, 2008, NCR began management of its business on a geographicbasis, changing from a previous model of global business units organized by product and service offering. As aresult, in the second quarter of 2008, NCR commenced a global realignment initiative to reduce redundancies andprocess inefficiencies to become more customer-focused and market-driven. This initiative is addressing legacyprocess inefficiencies and unbalanced resource allocation by focusing on organizational design, processre-engineering and business process outsourcing. The initiative has resulted in reductions in employment andproductivity improvements, while freeing up funds to invest in growth programs.
As a result of this initiative, the Company recorded a total of $57 million in employee severance and othertermination costs in 2008. Of these costs, $5 million was recorded as cost of products, $31 million was recordedas cost of services, $16 million was recorded as selling, general and administrative expense and the remaining$5 million was recorded as research and development expense. Of the $57 million total expense recognized in2008, $40 million was recorded as a discrete cost in accordance with Statement of Financial AccountingStandards No. 112 (SFAS 112), Employer’s Accounting for Postemployment Benefits, when the severanceliabilities were determined to be probable and reasonably estimable. The remaining $17 million was recorded inaccordance with Statement of Financial Accounting Standards No. 146 (SFAS 146), Accounting for CostsAssociated with Exit or Disposal Activities.
The realignment activities and the associated costs recognized during 2008 for approximately 900 employeeterminations relate to each of our reportable segments of Americas; Europe, Middle East and Africa (EMEA);and Asia Pacific and Japan (APJ).
The Company made $30 million in severance payments during 2008. As of December 31, 2008, there is aremaining accrued liability balance of $26 million, including immaterial effects from foreign currencytranslation. This liability balance is recorded in the Consolidated Balance Sheet in other current liabilities as theCompany expects that payment of the remaining obligation will occur in 2009. The actions taken to date areexpected to generate annualized savings of approximately $40 million. We realized approximately half of thatamount during 2008 and expect to achieve the full, annualized savings beginning in 2009. The Companycontinues to identify additional opportunities focusing on organizational design; process re-engineering andbusiness process outsourcing and therefore, expects additional realignment activities through 2010 as a result ofthis initiative. The costs related to these activities are not reasonably estimable at this time as we are in theprocess of defining the scope of the activities and quantifying the impact thereof.
Manufacturing Realignment In the first quarter of 2007, the Company initiated a manufacturingrealignment initiative primarily related to its ATM products, which included outsourcing certain manufacturingactivities in the Americas region and shifting other manufacturing activities from high cost to low costgeographies in the EMEA region as well as the APJ region. This realignment resulted in approximately 1,100employee terminations and, as expected, improved productivity and freed capital to invest in revenue-generatingprograms such as sales, engineering and market development. As a result of this realignment, in 2007, theCompany recorded realignment costs of $40 million, in cost of products, related to employee severance and othertermination benefits ($32 million recorded as a discrete cost in accordance with SFAS 112, with the remainderrecorded in accordance with SFAS 146). As of January 1, 2008, $11 million of the reserve remained for thisinitiative, of which, approximately $10 million was utilized through the year ended December 31, 2008. Theremaining balance of $1 million as of December 31, 2008 is expected to be paid in 2009. In addition, theCompany incurred costs of $8 million associated with training, travel and professional services during the yearended December 31, 2007, which were directly related to this realignment initiative and were expensed asincurred.
Japan Realignment In the third quarter of 2007, NCR commenced a realignment program in Japan, whichwas primarily focused on its customer services. The realignment program, which resulted in approximately 130employee terminations, included actions to improve operating efficiency and strengthen the Company’scompetitive position in Japan. As a result of this realignment program, in 2007, the Company recorded
55
Fo
rm10-K
$28 million as a discrete cost for employee severance in accordance with SFAS 112 ($19 million in cost ofservices and $9 million in selling, general and administrative expense). As a result of the payments made as ofDecember 31, 2007, $7 million of the reserve for this initiative remained, including immaterial effects fromforeign currency translation, which was fully utilized during the year ended December 31, 2008. Beginning in thefourth quarter of 2007, the Company started realizing cost savings related to this initiative and achieved targetedcost savings of $10 to $12 million on an annualized basis.
The results by segment, as disclosed in Note 13, “Segment Information and Concentrations,” exclude theimpact of these costs, which is consistent with the manner by which management assesses the performance andevaluates the results of each segment. The following table summarizes the costs recorded for these realignmentactivities and the remaining liabilities as of December 31, 2008 and 2007, which is included in the ConsolidatedBalance Sheets in other current liabilities:
In millions
2008OrganizationalRealignment
2007Manufacturing
Realignment2007 Japan
Realignment Total
Employee Severance and Other BenefitsBalance as of January 1, 2007 . . . . . . . . . . . . . . . . . . . . . . . . . . $— $— $— $—Costs recognized during the year ended December 31, 2007 . . — 46 27 73Foreign currency translation adjustments during 2007 . . . . . . . — — 1 1Payments made during the year ended December 31, 2007 . . . — (29) (22) (51)Changes in estimate during year ended December 31, 2007 . . . — (6) 1 (5)
Ending balance as of December 31, 2007 . . . . . . . . . . . . . . . . . $— $ 11 $ 7 $ 18
Costs recognized during the year ended December 31, 2008 . . 57 — — 57Foreign currency translation adjustments during 2008 . . . . . . . (1) — — (1)Payments made during the year ended December 31, 2008 . . . (30) (10) (7) (47)
Ending balance as of December 31, 2008 . . . . . . . . . . . . . . . . . $ 26 $ 1 $— $ 27
2006 Realignment Program In 2006, to further improve profitability in the Americas segment, NCRoffered an early retirement program to qualified customer service engineers in the United States. As a result ofparticipant election, the Company recorded a non-cash increase in pension expense during the first quarter of2006 of $9 million.
Real Estate Transactions During the year ended December 31, 2008, the Company recognized $30 millionin gains from the sale of real estate in the Consolidated Statement of Operations. The net proceeds of $52 millionfrom these sales were recorded in investing activities and the net gains are recorded in operating activities in theConsolidated Statement of Cash Flows. Of the total gains recognized, $16 million related to the sale of amanufacturing facility in Canada during the first quarter, while $7 million related to the sale of a separateCanadian property in the second quarter of 2008. Both gains were recorded as a reduction to selling, general, andadministrative expenses in the Consolidated Statement of Operations.
In 2006, the Company recognized $9 million in net gains from the disposal of real estate. The net bookvalue of these properties sold was $40 million. The net proceeds of $49 million from these sales were recorded ininvesting activities and the net gains are recorded in operating activities in the Consolidated Statement of CashFlows.
During the fourth quarter of 2002, in connection with announced restructuring efforts, NCR’s managementapproved a real estate consolidation and restructuring plan designed to accelerate the Company’s re-engineeringstrategies. A pre-tax restructuring cost of $16 million was recorded in the fourth quarter of 2002 under EITFIssue No. 94-3 (EITF 94-3), Liability Recognition for Certain Employee Termination Benefits and Other Costs toExit an Activity, to provide for contractual lease termination costs. The remaining lease obligations will expireover various dates through 2015. The Company reviews this reserve on a quarterly basis to determine whetherthe reserve is adequate based on current market conditions. The balance of this liability at December 31, 2007
56
was $7 million. During 2008, the reserve decreased by $3 million primarily due to ongoing lease paymentsresulting in a remaining reserve balance of $4 million as of December 31, 2008.
Note 4 Business Combinations, Divestitures and Equity Investments
During 2008, NCR completed several strategic investments and acquisitions and acquired the remaining 3%minority interest in one of our subsidiaries, for a total cost of approximately $65 million. In 2007, the Companycompleted one acquisition and minority investments in two companies, for a total cost of approximately $11million. The Company completed two acquisitions and purchased the remaining 5% minority interest in one ofour subsidiaries during 2006 for a total cost of approximately $19 million. A description of each acquisition andinvestment, all of which were paid primarily in cash, is as follows:
2008 Acquisitions and Equity Investments
• Acquisition of Ambient Partners, LLC on April 18, 2008, to extend NCR’s self-service portfolio intothe digital media merchandising market.
• 10% minority investment and exclusive licensing agreement with e-Play, LLC on June 17, 2008 to addbare-disc technology to NCR’s existing global self-service technology portfolio, expanding consumerself-service options for delivery of digital entertainment. The Company recorded this transaction as acost method investment and the terms of the agreement provide the potential for additional investmentsthat can be made through June 30, 2010, limited to a total investment of 19.5%.
• 19.6% minority investment and exclusive supply and services agreements with TNR HoldingsCorporation (TNR), an operator of movie rental kiosks, on July 28, 2008. NCR also provided financingto TNR in the form of a $4 million senior secured note over a five year term. The Company recordedthis transaction as an equity method investment and the terms of the agreement provide the potentialfor additional investments that can be made through July 30, 2018.
• Acquisition of NCI Ltd. (NCI), a United Kingdom-based company on August 19, 2008. NCI is aleading provider of teller connectivity software used by financial institutions.
• 8% minority investment in MOD Systems, Inc., a leading provider of digital media delivery systems onOctober 17, 2008. MOD Systems’ technology is designed to offer consumers one of the fastest, mostconvenient ways to access high-quality digital entertainment. The Company recorded this transactionas a cost method investment.
2007 Acquisitions and Equity Investments
• Acquisition of Touch Automation, LLC on December 31, 2007 to extend NCR’s self-service portfoliointo the digital media merchandising market.
• 5% minority investment in mFoundry, Inc. on October 25, 2007 to complement NCR’s mobilitytechnology solution.
• 5% minority investment in ViVOtech, Inc. on June 29, 2007 to use their set of technologies to developsolutions that allow consumers to make contactless payments with Radio Frequency (RF)-enabledcredit or debit cards and Near Field Communication (NFC)-related mobile phones.
2006 Acquisitions
• Acquisition of the ATM business assets of Tidel Technologies, Inc. on January 5, 2006 to enhance theCompany’s entry-level distribution and product strength in the convenience and retail ATM market.
• Acquisition of the business assets of IDVelocity, LLC on April 7, 2006 to extend the Company’s radiofrequency identification (RFID) systems solution portfolio.
57
Fo
rm10-K
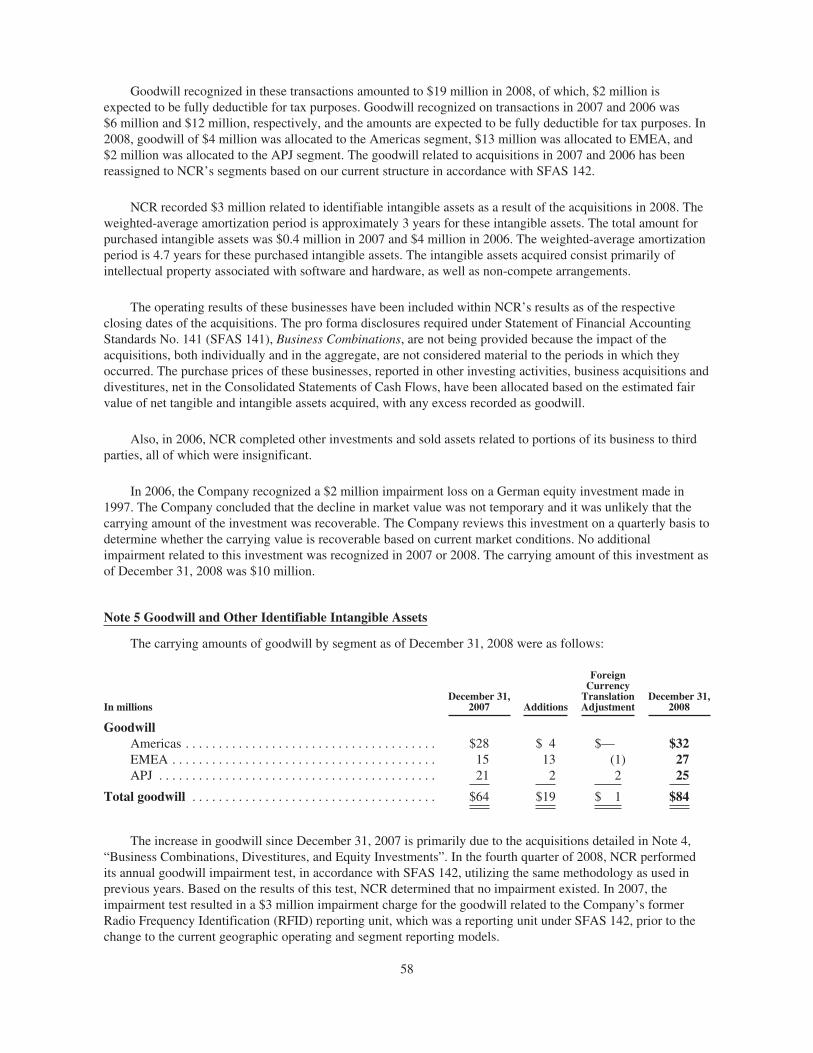
Goodwill recognized in these transactions amounted to $19 million in 2008, of which, $2 million isexpected to be fully deductible for tax purposes. Goodwill recognized on transactions in 2007 and 2006 was$6 million and $12 million, respectively, and the amounts are expected to be fully deductible for tax purposes. In2008, goodwill of $4 million was allocated to the Americas segment, $13 million was allocated to EMEA, and$2 million was allocated to the APJ segment. The goodwill related to acquisitions in 2007 and 2006 has beenreassigned to NCR’s segments based on our current structure in accordance with SFAS 142.
NCR recorded $3 million related to identifiable intangible assets as a result of the acquisitions in 2008. Theweighted-average amortization period is approximately 3 years for these intangible assets. The total amount forpurchased intangible assets was $0.4 million in 2007 and $4 million in 2006. The weighted-average amortizationperiod is 4.7 years for these purchased intangible assets. The intangible assets acquired consist primarily ofintellectual property associated with software and hardware, as well as non-compete arrangements.
The operating results of these businesses have been included within NCR’s results as of the respectiveclosing dates of the acquisitions. The pro forma disclosures required under Statement of Financial AccountingStandards No. 141 (SFAS 141), Business Combinations, are not being provided because the impact of theacquisitions, both individually and in the aggregate, are not considered material to the periods in which theyoccurred. The purchase prices of these businesses, reported in other investing activities, business acquisitions anddivestitures, net in the Consolidated Statements of Cash Flows, have been allocated based on the estimated fairvalue of net tangible and intangible assets acquired, with any excess recorded as goodwill.
Also, in 2006, NCR completed other investments and sold assets related to portions of its business to thirdparties, all of which were insignificant.
In 2006, the Company recognized a $2 million impairment loss on a German equity investment made in1997. The Company concluded that the decline in market value was not temporary and it was unlikely that thecarrying amount of the investment was recoverable. The Company reviews this investment on a quarterly basis todetermine whether the carrying value is recoverable based on current market conditions. No additionalimpairment related to this investment was recognized in 2007 or 2008. The carrying amount of this investment asof December 31, 2008 was $10 million.
Note 5 Goodwill and Other Identifiable Intangible Assets
The carrying amounts of goodwill by segment as of December 31, 2008 were as follows:
In millionsDecember 31,
2007 Additions
ForeignCurrency
TranslationAdjustment
December 31,2008
GoodwillAmericas . . . . . . . . . . . . . . . . . . . . . . . . . . . . . . . . . . . . . . $28 $ 4 $— $32EMEA . . . . . . . . . . . . . . . . . . . . . . . . . . . . . . . . . . . . . . . . 15 13 (1) 27APJ . . . . . . . . . . . . . . . . . . . . . . . . . . . . . . . . . . . . . . . . . . 21 2 2 25
Total goodwill . . . . . . . . . . . . . . . . . . . . . . . . . . . . . . . . . . . . . $64 $19 $ 1 $84
The increase in goodwill since December 31, 2007 is primarily due to the acquisitions detailed in Note 4,“Business Combinations, Divestitures, and Equity Investments”. In the fourth quarter of 2008, NCR performedits annual goodwill impairment test, in accordance with SFAS 142, utilizing the same methodology as used inprevious years. Based on the results of this test, NCR determined that no impairment existed. In 2007, theimpairment test resulted in a $3 million impairment charge for the goodwill related to the Company’s formerRadio Frequency Identification (RFID) reporting unit, which was a reporting unit under SFAS 142, prior to thechange to the current geographic operating and segment reporting models.
58
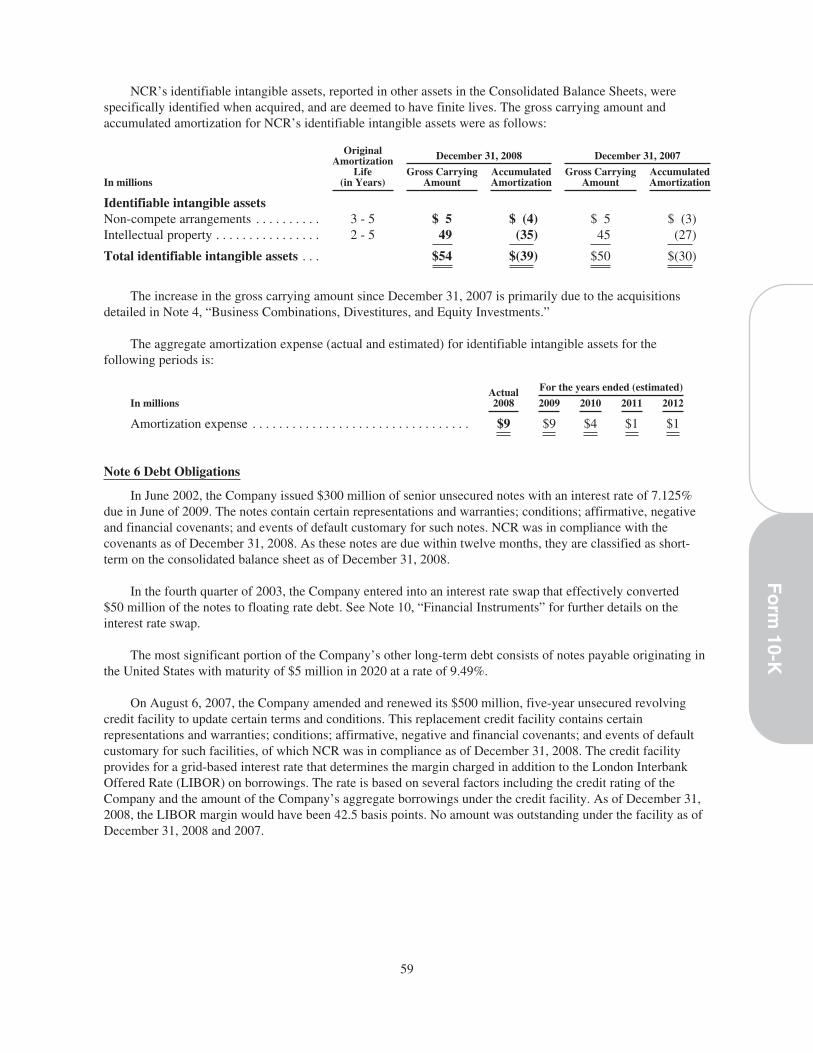
NCR’s identifiable intangible assets, reported in other assets in the Consolidated Balance Sheets, werespecifically identified when acquired, and are deemed to have finite lives. The gross carrying amount andaccumulated amortization for NCR’s identifiable intangible assets were as follows:
OriginalAmortization
Life(in Years)
December 31, 2008 December 31, 2007
In millionsGross Carrying
AmountAccumulatedAmortization
Gross CarryingAmount
AccumulatedAmortization
Identifiable intangible assetsNon-compete arrangements . . . . . . . . . . 3 - 5 $ 5 $ (4) $ 5 $ (3)Intellectual property . . . . . . . . . . . . . . . . 2 - 5 49 (35) 45 (27)
Total identifiable intangible assets . . . $54 $(39) $50 $(30)
The increase in the gross carrying amount since December 31, 2007 is primarily due to the acquisitionsdetailed in Note 4, “Business Combinations, Divestitures, and Equity Investments.”
The aggregate amortization expense (actual and estimated) for identifiable intangible assets for thefollowing periods is:
Actual2008
For the years ended (estimated)
In millions 2009 2010 2011 2012
Amortization expense . . . . . . . . . . . . . . . . . . . . . . . . . . . . . . . . . $9 $9 $4 $1 $1
Note 6 Debt Obligations
In June 2002, the Company issued $300 million of senior unsecured notes with an interest rate of 7.125%due in June of 2009. The notes contain certain representations and warranties; conditions; affirmative, negativeand financial covenants; and events of default customary for such notes. NCR was in compliance with thecovenants as of December 31, 2008. As these notes are due within twelve months, they are classified as short-term on the consolidated balance sheet as of December 31, 2008.
In the fourth quarter of 2003, the Company entered into an interest rate swap that effectively converted$50 million of the notes to floating rate debt. See Note 10, “Financial Instruments” for further details on theinterest rate swap.
The most significant portion of the Company’s other long-term debt consists of notes payable originating inthe United States with maturity of $5 million in 2020 at a rate of 9.49%.
On August 6, 2007, the Company amended and renewed its $500 million, five-year unsecured revolvingcredit facility to update certain terms and conditions. This replacement credit facility contains certainrepresentations and warranties; conditions; affirmative, negative and financial covenants; and events of defaultcustomary for such facilities, of which NCR was in compliance as of December 31, 2008. The credit facilityprovides for a grid-based interest rate that determines the margin charged in addition to the London InterbankOffered Rate (LIBOR) on borrowings. The rate is based on several factors including the credit rating of theCompany and the amount of the Company’s aggregate borrowings under the credit facility. As of December 31,2008, the LIBOR margin would have been 42.5 basis points. No amount was outstanding under the facility as ofDecember 31, 2008 and 2007.
59
Fo
rm10-K
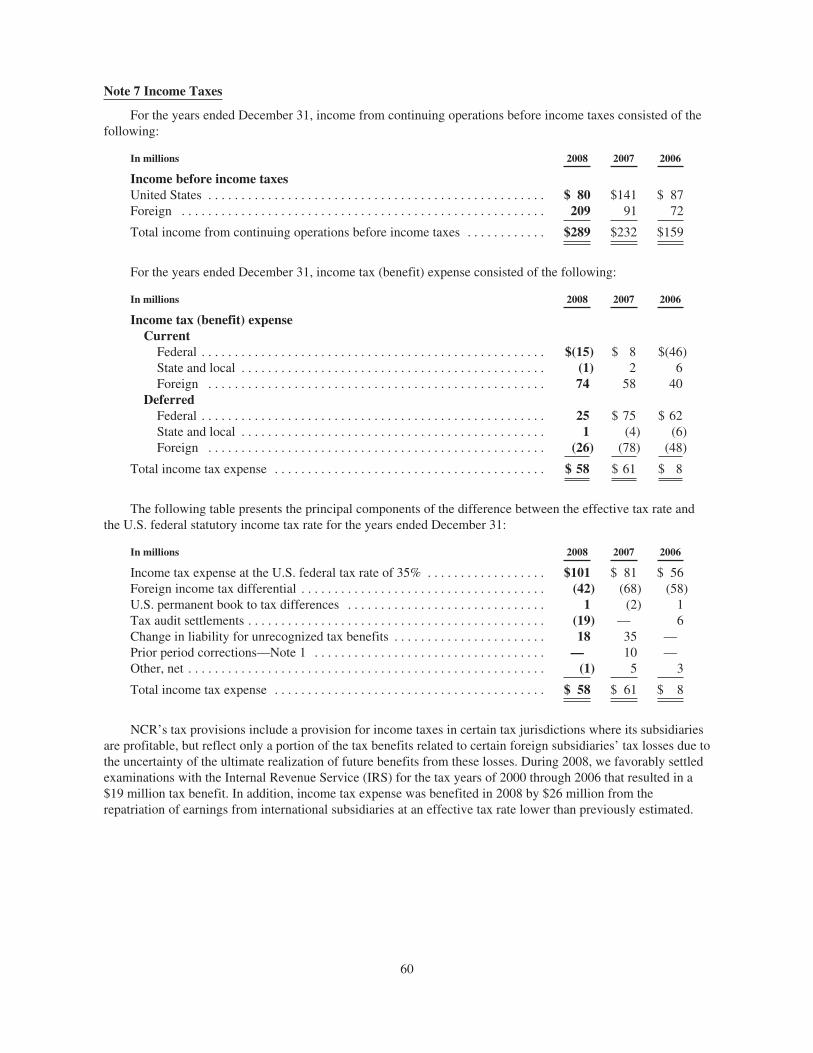
Note 7 Income Taxes
For the years ended December 31, income from continuing operations before income taxes consisted of thefollowing:
In millions 2008 2007 2006
Income before income taxesUnited States . . . . . . . . . . . . . . . . . . . . . . . . . . . . . . . . . . . . . . . . . . . . . . . . . . . $ 80 $141 $ 87Foreign . . . . . . . . . . . . . . . . . . . . . . . . . . . . . . . . . . . . . . . . . . . . . . . . . . . . . . . 209 91 72
Total income from continuing operations before income taxes . . . . . . . . . . . . $289 $232 $159
For the years ended December 31, income tax (benefit) expense consisted of the following:
In millions 2008 2007 2006
Income tax (benefit) expenseCurrent
Federal . . . . . . . . . . . . . . . . . . . . . . . . . . . . . . . . . . . . . . . . . . . . . . . . . . . . $(15) $ 8 $(46)State and local . . . . . . . . . . . . . . . . . . . . . . . . . . . . . . . . . . . . . . . . . . . . . . (1) 2 6Foreign . . . . . . . . . . . . . . . . . . . . . . . . . . . . . . . . . . . . . . . . . . . . . . . . . . . 74 58 40
DeferredFederal . . . . . . . . . . . . . . . . . . . . . . . . . . . . . . . . . . . . . . . . . . . . . . . . . . . . 25 $ 75 $ 62State and local . . . . . . . . . . . . . . . . . . . . . . . . . . . . . . . . . . . . . . . . . . . . . . 1 (4) (6)Foreign . . . . . . . . . . . . . . . . . . . . . . . . . . . . . . . . . . . . . . . . . . . . . . . . . . . (26) (78) (48)
Total income tax expense . . . . . . . . . . . . . . . . . . . . . . . . . . . . . . . . . . . . . . . . . $ 58 $ 61 $ 8
The following table presents the principal components of the difference between the effective tax rate andthe U.S. federal statutory income tax rate for the years ended December 31:
In millions 2008 2007 2006
Income tax expense at the U.S. federal tax rate of 35% . . . . . . . . . . . . . . . . . . $101 $ 81 $ 56Foreign income tax differential . . . . . . . . . . . . . . . . . . . . . . . . . . . . . . . . . . . . . (42) (68) (58)U.S. permanent book to tax differences . . . . . . . . . . . . . . . . . . . . . . . . . . . . . . 1 (2) 1Tax audit settlements . . . . . . . . . . . . . . . . . . . . . . . . . . . . . . . . . . . . . . . . . . . . . (19) — 6Change in liability for unrecognized tax benefits . . . . . . . . . . . . . . . . . . . . . . . 18 35 —Prior period corrections—Note 1 . . . . . . . . . . . . . . . . . . . . . . . . . . . . . . . . . . . — 10 —Other, net . . . . . . . . . . . . . . . . . . . . . . . . . . . . . . . . . . . . . . . . . . . . . . . . . . . . . . (1) 5 3
Total income tax expense . . . . . . . . . . . . . . . . . . . . . . . . . . . . . . . . . . . . . . . . . $ 58 $ 61 $ 8
NCR’s tax provisions include a provision for income taxes in certain tax jurisdictions where its subsidiariesare profitable, but reflect only a portion of the tax benefits related to certain foreign subsidiaries’ tax losses due tothe uncertainty of the ultimate realization of future benefits from these losses. During 2008, we favorably settledexaminations with the Internal Revenue Service (IRS) for the tax years of 2000 through 2006 that resulted in a$19 million tax benefit. In addition, income tax expense was benefited in 2008 by $26 million from therepatriation of earnings from international subsidiaries at an effective tax rate lower than previously estimated.
60
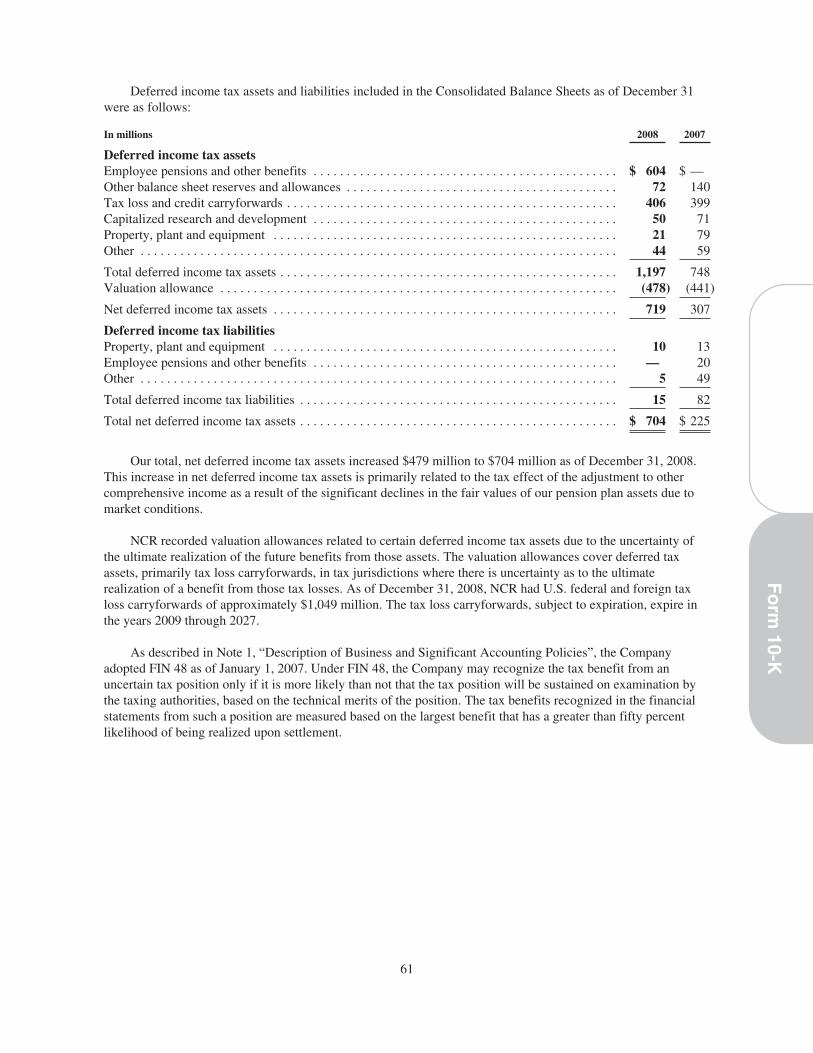
Deferred income tax assets and liabilities included in the Consolidated Balance Sheets as of December 31were as follows:
In millions 2008 2007
Deferred income tax assetsEmployee pensions and other benefits . . . . . . . . . . . . . . . . . . . . . . . . . . . . . . . . . . . . . . . . . . . . . . $ 604 $ —Other balance sheet reserves and allowances . . . . . . . . . . . . . . . . . . . . . . . . . . . . . . . . . . . . . . . . . 72 140Tax loss and credit carryforwards . . . . . . . . . . . . . . . . . . . . . . . . . . . . . . . . . . . . . . . . . . . . . . . . . . 406 399Capitalized research and development . . . . . . . . . . . . . . . . . . . . . . . . . . . . . . . . . . . . . . . . . . . . . . 50 71Property, plant and equipment . . . . . . . . . . . . . . . . . . . . . . . . . . . . . . . . . . . . . . . . . . . . . . . . . . . . 21 79Other . . . . . . . . . . . . . . . . . . . . . . . . . . . . . . . . . . . . . . . . . . . . . . . . . . . . . . . . . . . . . . . . . . . . . . . . 44 59
Total deferred income tax assets . . . . . . . . . . . . . . . . . . . . . . . . . . . . . . . . . . . . . . . . . . . . . . . . . . . 1,197 748Valuation allowance . . . . . . . . . . . . . . . . . . . . . . . . . . . . . . . . . . . . . . . . . . . . . . . . . . . . . . . . . . . . (478) (441)
Net deferred income tax assets . . . . . . . . . . . . . . . . . . . . . . . . . . . . . . . . . . . . . . . . . . . . . . . . . . . . 719 307
Deferred income tax liabilitiesProperty, plant and equipment . . . . . . . . . . . . . . . . . . . . . . . . . . . . . . . . . . . . . . . . . . . . . . . . . . . . 10 13Employee pensions and other benefits . . . . . . . . . . . . . . . . . . . . . . . . . . . . . . . . . . . . . . . . . . . . . . — 20Other . . . . . . . . . . . . . . . . . . . . . . . . . . . . . . . . . . . . . . . . . . . . . . . . . . . . . . . . . . . . . . . . . . . . . . . . 5 49
Total deferred income tax liabilities . . . . . . . . . . . . . . . . . . . . . . . . . . . . . . . . . . . . . . . . . . . . . . . . 15 82
Total net deferred income tax assets . . . . . . . . . . . . . . . . . . . . . . . . . . . . . . . . . . . . . . . . . . . . . . . . $ 704 $ 225
Our total, net deferred income tax assets increased $479 million to $704 million as of December 31, 2008.This increase in net deferred income tax assets is primarily related to the tax effect of the adjustment to othercomprehensive income as a result of the significant declines in the fair values of our pension plan assets due tomarket conditions.
NCR recorded valuation allowances related to certain deferred income tax assets due to the uncertainty ofthe ultimate realization of the future benefits from those assets. The valuation allowances cover deferred taxassets, primarily tax loss carryforwards, in tax jurisdictions where there is uncertainty as to the ultimaterealization of a benefit from those tax losses. As of December 31, 2008, NCR had U.S. federal and foreign taxloss carryforwards of approximately $1,049 million. The tax loss carryforwards, subject to expiration, expire inthe years 2009 through 2027.
As described in Note 1, “Description of Business and Significant Accounting Policies”, the Companyadopted FIN 48 as of January 1, 2007. Under FIN 48, the Company may recognize the tax benefit from anuncertain tax position only if it is more likely than not that the tax position will be sustained on examination bythe taxing authorities, based on the technical merits of the position. The tax benefits recognized in the financialstatements from such a position are measured based on the largest benefit that has a greater than fifty percentlikelihood of being realized upon settlement.
61
Fo
rm10-K
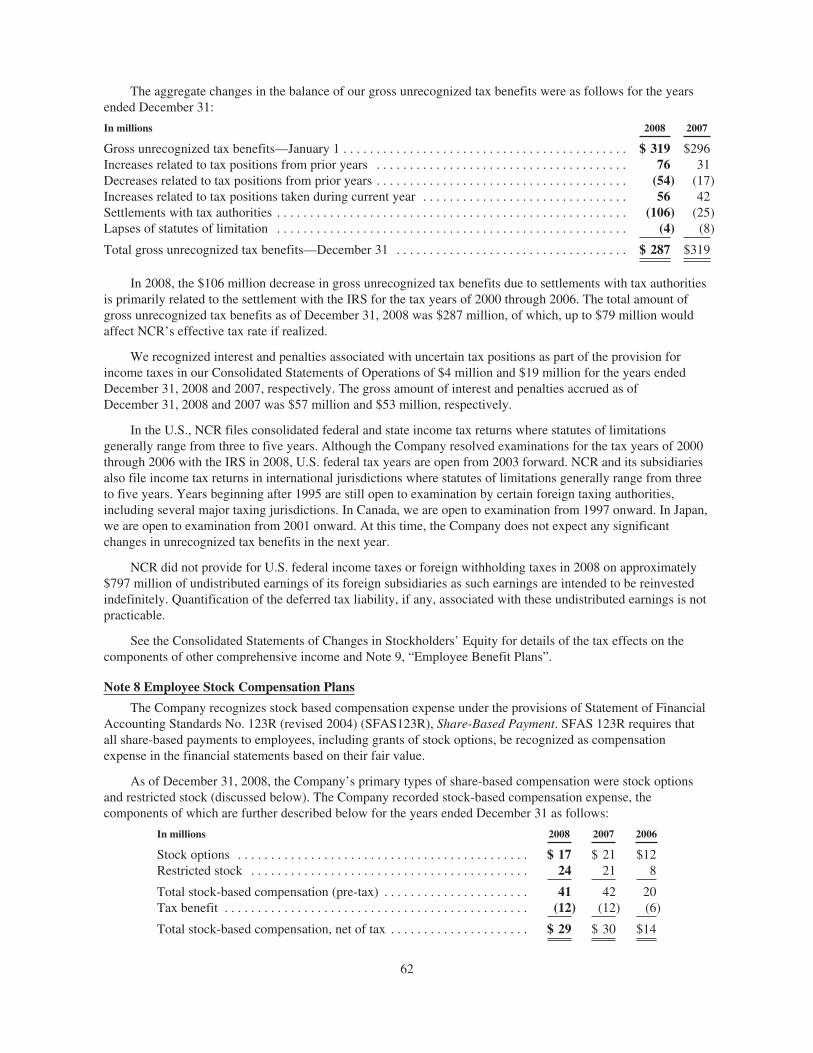
The aggregate changes in the balance of our gross unrecognized tax benefits were as follows for the yearsended December 31:
In millions 2008 2007
Gross unrecognized tax benefits—January 1 . . . . . . . . . . . . . . . . . . . . . . . . . . . . . . . . . . . . . . . . . . . $ 319 $296Increases related to tax positions from prior years . . . . . . . . . . . . . . . . . . . . . . . . . . . . . . . . . . . . . . 76 31Decreases related to tax positions from prior years . . . . . . . . . . . . . . . . . . . . . . . . . . . . . . . . . . . . . . (54) (17)Increases related to tax positions taken during current year . . . . . . . . . . . . . . . . . . . . . . . . . . . . . . . 56 42Settlements with tax authorities . . . . . . . . . . . . . . . . . . . . . . . . . . . . . . . . . . . . . . . . . . . . . . . . . . . . . (106) (25)Lapses of statutes of limitation . . . . . . . . . . . . . . . . . . . . . . . . . . . . . . . . . . . . . . . . . . . . . . . . . . . . . (4) (8)
Total gross unrecognized tax benefits—December 31 . . . . . . . . . . . . . . . . . . . . . . . . . . . . . . . . . . . $ 287 $319
In 2008, the $106 million decrease in gross unrecognized tax benefits due to settlements with tax authoritiesis primarily related to the settlement with the IRS for the tax years of 2000 through 2006. The total amount ofgross unrecognized tax benefits as of December 31, 2008 was $287 million, of which, up to $79 million wouldaffect NCR’s effective tax rate if realized.
We recognized interest and penalties associated with uncertain tax positions as part of the provision forincome taxes in our Consolidated Statements of Operations of $4 million and $19 million for the years endedDecember 31, 2008 and 2007, respectively. The gross amount of interest and penalties accrued as ofDecember 31, 2008 and 2007 was $57 million and $53 million, respectively.
In the U.S., NCR files consolidated federal and state income tax returns where statutes of limitationsgenerally range from three to five years. Although the Company resolved examinations for the tax years of 2000through 2006 with the IRS in 2008, U.S. federal tax years are open from 2003 forward. NCR and its subsidiariesalso file income tax returns in international jurisdictions where statutes of limitations generally range from threeto five years. Years beginning after 1995 are still open to examination by certain foreign taxing authorities,including several major taxing jurisdictions. In Canada, we are open to examination from 1997 onward. In Japan,we are open to examination from 2001 onward. At this time, the Company does not expect any significantchanges in unrecognized tax benefits in the next year.
NCR did not provide for U.S. federal income taxes or foreign withholding taxes in 2008 on approximately$797 million of undistributed earnings of its foreign subsidiaries as such earnings are intended to be reinvestedindefinitely. Quantification of the deferred tax liability, if any, associated with these undistributed earnings is notpracticable.
See the Consolidated Statements of Changes in Stockholders’ Equity for details of the tax effects on thecomponents of other comprehensive income and Note 9, “Employee Benefit Plans”.
Note 8 Employee Stock Compensation Plans
The Company recognizes stock based compensation expense under the provisions of Statement of FinancialAccounting Standards No. 123R (revised 2004) (SFAS123R), Share-Based Payment. SFAS 123R requires thatall share-based payments to employees, including grants of stock options, be recognized as compensationexpense in the financial statements based on their fair value.
As of December 31, 2008, the Company’s primary types of share-based compensation were stock optionsand restricted stock (discussed below). The Company recorded stock-based compensation expense, thecomponents of which are further described below for the years ended December 31 as follows:
In millions 2008 2007 2006
Stock options . . . . . . . . . . . . . . . . . . . . . . . . . . . . . . . . . . . . . . . . . . . . $ 17 $ 21 $12Restricted stock . . . . . . . . . . . . . . . . . . . . . . . . . . . . . . . . . . . . . . . . . . 24 21 8
Total stock-based compensation (pre-tax) . . . . . . . . . . . . . . . . . . . . . . 41 42 20Tax benefit . . . . . . . . . . . . . . . . . . . . . . . . . . . . . . . . . . . . . . . . . . . . . . (12) (12) (6)
Total stock-based compensation, net of tax . . . . . . . . . . . . . . . . . . . . . $ 29 $ 30 $14
62
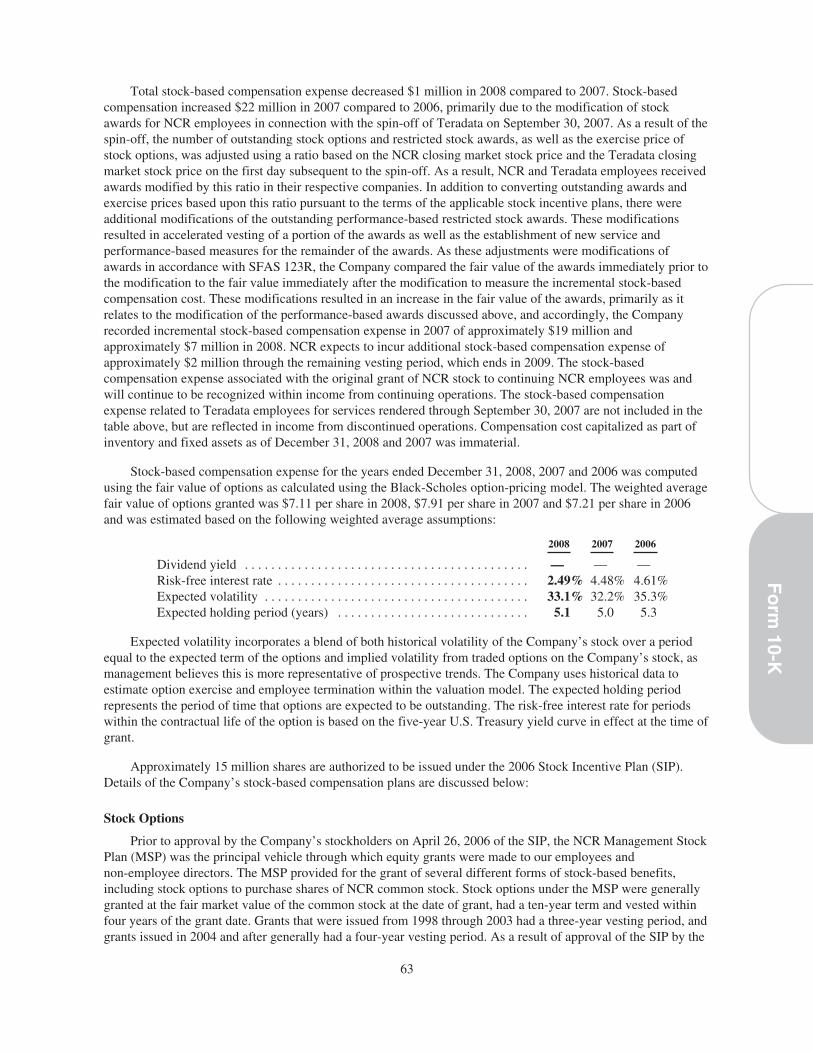
Total stock-based compensation expense decreased $1 million in 2008 compared to 2007. Stock-basedcompensation increased $22 million in 2007 compared to 2006, primarily due to the modification of stockawards for NCR employees in connection with the spin-off of Teradata on September 30, 2007. As a result of thespin-off, the number of outstanding stock options and restricted stock awards, as well as the exercise price ofstock options, was adjusted using a ratio based on the NCR closing market stock price and the Teradata closingmarket stock price on the first day subsequent to the spin-off. As a result, NCR and Teradata employees receivedawards modified by this ratio in their respective companies. In addition to converting outstanding awards andexercise prices based upon this ratio pursuant to the terms of the applicable stock incentive plans, there wereadditional modifications of the outstanding performance-based restricted stock awards. These modificationsresulted in accelerated vesting of a portion of the awards as well as the establishment of new service andperformance-based measures for the remainder of the awards. As these adjustments were modifications ofawards in accordance with SFAS 123R, the Company compared the fair value of the awards immediately prior tothe modification to the fair value immediately after the modification to measure the incremental stock-basedcompensation cost. These modifications resulted in an increase in the fair value of the awards, primarily as itrelates to the modification of the performance-based awards discussed above, and accordingly, the Companyrecorded incremental stock-based compensation expense in 2007 of approximately $19 million andapproximately $7 million in 2008. NCR expects to incur additional stock-based compensation expense ofapproximately $2 million through the remaining vesting period, which ends in 2009. The stock-basedcompensation expense associated with the original grant of NCR stock to continuing NCR employees was andwill continue to be recognized within income from continuing operations. The stock-based compensationexpense related to Teradata employees for services rendered through September 30, 2007 are not included in thetable above, but are reflected in income from discontinued operations. Compensation cost capitalized as part ofinventory and fixed assets as of December 31, 2008 and 2007 was immaterial.
Stock-based compensation expense for the years ended December 31, 2008, 2007 and 2006 was computedusing the fair value of options as calculated using the Black-Scholes option-pricing model. The weighted averagefair value of options granted was $7.11 per share in 2008, $7.91 per share in 2007 and $7.21 per share in 2006and was estimated based on the following weighted average assumptions:
2008 2007 2006
Dividend yield . . . . . . . . . . . . . . . . . . . . . . . . . . . . . . . . . . . . . . . . . . . — — —Risk-free interest rate . . . . . . . . . . . . . . . . . . . . . . . . . . . . . . . . . . . . . . 2.49% 4.48% 4.61%Expected volatility . . . . . . . . . . . . . . . . . . . . . . . . . . . . . . . . . . . . . . . . 33.1% 32.2% 35.3%Expected holding period (years) . . . . . . . . . . . . . . . . . . . . . . . . . . . . . 5.1 5.0 5.3
Expected volatility incorporates a blend of both historical volatility of the Company’s stock over a periodequal to the expected term of the options and implied volatility from traded options on the Company’s stock, asmanagement believes this is more representative of prospective trends. The Company uses historical data toestimate option exercise and employee termination within the valuation model. The expected holding periodrepresents the period of time that options are expected to be outstanding. The risk-free interest rate for periodswithin the contractual life of the option is based on the five-year U.S. Treasury yield curve in effect at the time ofgrant.
Approximately 15 million shares are authorized to be issued under the 2006 Stock Incentive Plan (SIP).Details of the Company’s stock-based compensation plans are discussed below:
Stock Options
Prior to approval by the Company’s stockholders on April 26, 2006 of the SIP, the NCR Management StockPlan (MSP) was the principal vehicle through which equity grants were made to our employees andnon-employee directors. The MSP provided for the grant of several different forms of stock-based benefits,including stock options to purchase shares of NCR common stock. Stock options under the MSP were generallygranted at the fair market value of the common stock at the date of grant, had a ten-year term and vested withinfour years of the grant date. Grants that were issued from 1998 through 2003 had a three-year vesting period, andgrants issued in 2004 and after generally had a four-year vesting period. As a result of approval of the SIP by the
63
Fo
rm10-K

Company’s stockholders, NCR discontinued the MSP, except that awards previously granted and outstandingunder the MSP remain outstanding. The SIP is now the principal vehicle through which equity grants are made toour employees and non-employee directors. New shares of the Company’s common stock are issued as a result ofstock option exercises.
The SIP provides for the grant of several different forms of stock-based compensation, including stockoptions to purchase shares of NCR common stock. The Compensation and Human Resource Committee of theBoard of Directors has discretion to determine the material terms and conditions of option awards under the SIP,provided that (i) the exercise price must be no less than the fair market value of NCR common stock (defined asthe closing price) on the date of grant, (ii) the term must be no longer than ten years, and (iii) in no event shall thenormal vesting schedule provide for vesting in less than one year. Other terms and conditions of an award ofstock options will be determined by the Compensation and Human Resource Committee of the Board ofDirectors as set forth in the agreement relating to that award. The Compensation and Human ResourceCommittee has authority to administer the SIP, except that the Committee on Directors and Governance willadminister the SIP with respect to non-employee members of the Board of Directors.
The following table summarizes the Company’s stock option activity for the year ended December 31,2008:
Shares in thousands
SharesUnderOption
Weighted-AverageExercisePrice per
Share
Weighted-Average
RemainingContractual
Term(in years)
AggregateIntrinsic
Value(in millions)
Outstanding as of January 1, 2008 . . . . . . . . . . . . . . . . . . . . . . . . . . 9,460 $14.70Granted . . . . . . . . . . . . . . . . . . . . . . . . . . . . . . . . . . . . . . . . . . . . . . . 2,588 $21.14Exercised . . . . . . . . . . . . . . . . . . . . . . . . . . . . . . . . . . . . . . . . . . . . . . (996) $11.37Forfeited or expired . . . . . . . . . . . . . . . . . . . . . . . . . . . . . . . . . . . . . . (375) $20.30
Outstanding as of December 31, 2008 . . . . . . . . . . . . . . . . . . . . . . . 10,677 $16.37 6.66 $15
Fully vested and expected to vest as of December 31, 2008 . . . . . . 10,225 $16.38 6.66 $15
Exercisable as of December 31, 2008 . . . . . . . . . . . . . . . . . . . . . . . . 5,657 $13.01 4.99 $15
The total intrinsic value of all options exercised was $12 million in 2008, $47 million in 2007 and $85million in 2006. Cash received from option exercises under all share-based payment arrangements was $11million in 2008, $37 million in 2007 and $89 million in 2006. The tax benefit realized from these exercises was$3 million in 2008, $14 million in 2007 and $26 million in 2006. As of December 31, 2008, there was $29million of total unrecognized compensation cost related to unvested stock option grants. That cost is expected tobe recognized over a weighted-average period of 2.5 years.
Restricted Stock and Restricted Stock Units
The MSP provided for the issuance of restricted stock to certain employees as a form of long-termcompensation, retention, promotion or other special circumstances. The Company’s restricted stock grants underthe MSP were categorized as having service-based or performance-based vesting. The service-based sharestypically vest over a three-year or a four-year period, beginning on the date of grant. These grants are not subjectto future performance measures. The cost of these awards, determined to be the fair market value of the shares atthe date of grant, is expensed ratably over the period the restrictions lapse. For substantially all restricted stockgrants, at the date of grant, the recipient has all rights of a stockholder, subject to certain restrictions ontransferability and a risk of forfeiture. Performance-based grants are subject to future performancemeasurements, which include NCR’s achievement of specific return on capital and cumulative net operatingprofit (as defined in the MSP) levels at the end of a three-year performance period. All performance-based shares
64
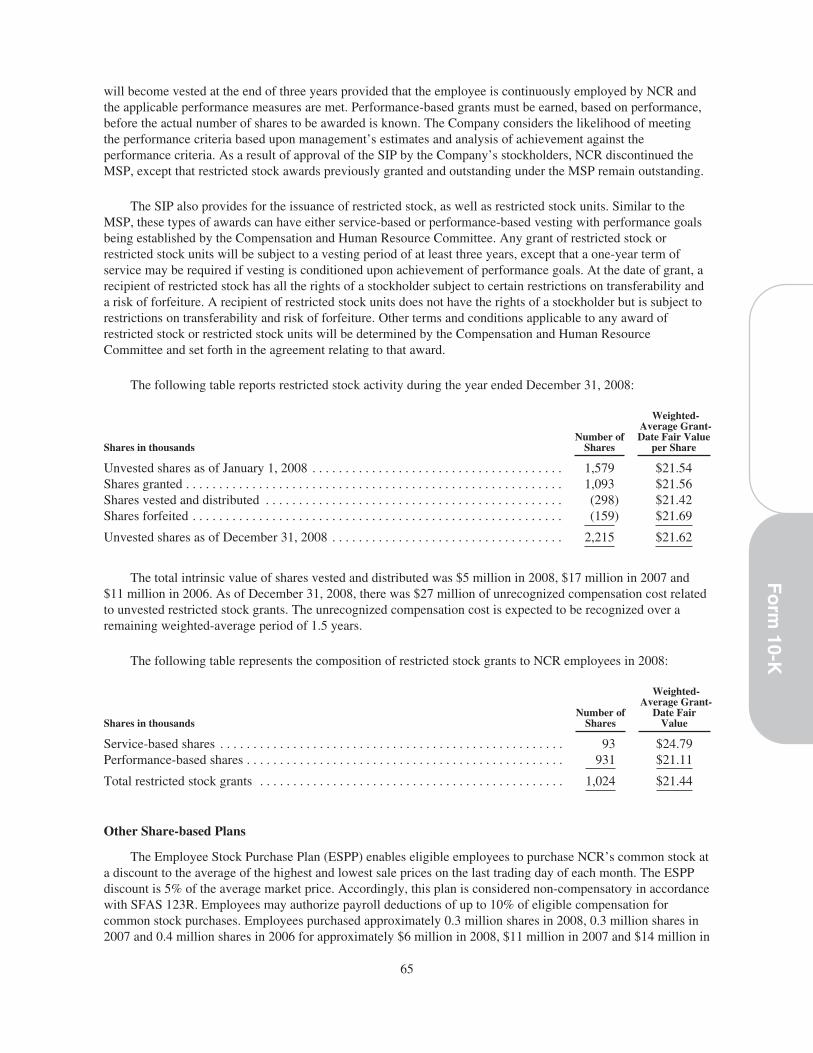
will become vested at the end of three years provided that the employee is continuously employed by NCR andthe applicable performance measures are met. Performance-based grants must be earned, based on performance,before the actual number of shares to be awarded is known. The Company considers the likelihood of meetingthe performance criteria based upon management’s estimates and analysis of achievement against theperformance criteria. As a result of approval of the SIP by the Company’s stockholders, NCR discontinued theMSP, except that restricted stock awards previously granted and outstanding under the MSP remain outstanding.
The SIP also provides for the issuance of restricted stock, as well as restricted stock units. Similar to theMSP, these types of awards can have either service-based or performance-based vesting with performance goalsbeing established by the Compensation and Human Resource Committee. Any grant of restricted stock orrestricted stock units will be subject to a vesting period of at least three years, except that a one-year term ofservice may be required if vesting is conditioned upon achievement of performance goals. At the date of grant, arecipient of restricted stock has all the rights of a stockholder subject to certain restrictions on transferability anda risk of forfeiture. A recipient of restricted stock units does not have the rights of a stockholder but is subject torestrictions on transferability and risk of forfeiture. Other terms and conditions applicable to any award ofrestricted stock or restricted stock units will be determined by the Compensation and Human ResourceCommittee and set forth in the agreement relating to that award.
The following table reports restricted stock activity during the year ended December 31, 2008:
Shares in thousandsNumber of
Shares
Weighted-Average Grant-Date Fair Value
per Share
Unvested shares as of January 1, 2008 . . . . . . . . . . . . . . . . . . . . . . . . . . . . . . . . . . . . . . 1,579 $21.54Shares granted . . . . . . . . . . . . . . . . . . . . . . . . . . . . . . . . . . . . . . . . . . . . . . . . . . . . . . . . . 1,093 $21.56Shares vested and distributed . . . . . . . . . . . . . . . . . . . . . . . . . . . . . . . . . . . . . . . . . . . . . (298) $21.42Shares forfeited . . . . . . . . . . . . . . . . . . . . . . . . . . . . . . . . . . . . . . . . . . . . . . . . . . . . . . . . (159) $21.69
Unvested shares as of December 31, 2008 . . . . . . . . . . . . . . . . . . . . . . . . . . . . . . . . . . . 2,215 $21.62
The total intrinsic value of shares vested and distributed was $5 million in 2008, $17 million in 2007 and$11 million in 2006. As of December 31, 2008, there was $27 million of unrecognized compensation cost relatedto unvested restricted stock grants. The unrecognized compensation cost is expected to be recognized over aremaining weighted-average period of 1.5 years.
The following table represents the composition of restricted stock grants to NCR employees in 2008:
Shares in thousandsNumber of
Shares
Weighted-Average Grant-
Date FairValue
Service-based shares . . . . . . . . . . . . . . . . . . . . . . . . . . . . . . . . . . . . . . . . . . . . . . . . . . . . 93 $24.79Performance-based shares . . . . . . . . . . . . . . . . . . . . . . . . . . . . . . . . . . . . . . . . . . . . . . . . 931 $21.11
Total restricted stock grants . . . . . . . . . . . . . . . . . . . . . . . . . . . . . . . . . . . . . . . . . . . . . . 1,024 $21.44
Other Share-based Plans
The Employee Stock Purchase Plan (ESPP) enables eligible employees to purchase NCR’s common stock ata discount to the average of the highest and lowest sale prices on the last trading day of each month. The ESPPdiscount is 5% of the average market price. Accordingly, this plan is considered non-compensatory in accordancewith SFAS 123R. Employees may authorize payroll deductions of up to 10% of eligible compensation forcommon stock purchases. Employees purchased approximately 0.3 million shares in 2008, 0.3 million shares in2007 and 0.4 million shares in 2006 for approximately $6 million in 2008, $11 million in 2007 and $14 million in
65
Fo
rm10-K
2006. On April 26, 2006, NCR’s stockholders approved a new ESPP, which became effective on January 1,2007. A total of 4 million shares were originally authorized to be issued under the new ESPP and approximately3 million authorized shares were remaining as of December 31, 2008.
Note 9 Employee Benefit Plans
Pension, Postretirement and Postemployment Plans NCR sponsors defined benefit plans for many ofits U.S. and international employees. For salaried employees, the defined benefit plans are based primarily uponcompensation and years of service. For certain hourly employees in the U.S., the benefits are based on a fixeddollar amount per years of service. During 2004, NCR made changes to its U.S. defined benefit pension plans inorder to limit participation in the plans to U.S.-based employees who were at least 40 years old and hired byAugust 31, 2004. The plans were closed to new participants as of September 1, 2004. During 2006, NCR madeadditional changes to its U.S. pension plans that ceased the accrual of additional benefits after December 31,2006. Certain international plans are also closed to new participants. NCR’s funding policy is to contributeannually not less than the minimum required by applicable laws and regulations. Assets of NCR’s defined benefitplans are primarily invested in publicly traded common stocks, corporate and government debt securities, realestate investments, and cash or cash equivalents.
As of December 31, 2006, NCR adopted Statement of Financial Accounting Standards No. 158 (SFAS 158),Employers Accounting for Defined Benefit Pension and Other Retirement Plans, which required, among otherthings, the recognition of the funded status of each applicable plan on the Consolidated Balance Sheet. Eachoverfunded plan was recognized as an asset and each underfunded plan was recognized as a liability. The initialimpact of implementing SFAS 158 as well as future changes to the funded status is recognized as a component ofaccumulated other comprehensive loss in stockholders’ equity.
Prior to September 1998, substantially all U.S. employees who reached retirement age while working forNCR were eligible to participate in a postretirement benefit plan. The plan provides medical care and lifeinsurance benefits to retirees and their eligible dependents. In September 1998, the plan was amended wherebyU.S. participants who had not reached a certain age and years of service with NCR were no longer eligible forsuch benefits. Non-U.S. employees are typically covered under government-sponsored programs, and NCRgenerally does not provide postretirement benefits other than pensions to non-U.S. retirees. NCR generally fundsthese benefits on a pay-as-you-go basis.
NCR offers various postemployment benefits to involuntarily terminated and certain inactive employeesafter employment but before retirement. These benefits are paid in accordance with NCR’s establishedpostemployment benefit practices and policies. Postemployment benefits may include disability benefits,supplemental unemployment benefits, severance, workers’ compensation benefits, and continuation of healthcarebenefits and life insurance coverage. NCR provides appropriate accruals for these postemployment benefits.These postemployment benefits are funded on a pay-as-you-go basis.
Amounts to be Recognized
The amounts in accumulated other comprehensive loss that are expected to be recognized as components ofnet periodic benefit cost (income) during 2009 are as follows:
In millionsU.S.
Pension BenefitsInternational
Pension BenefitsTotal
Pension BenefitsPostretirement
BenefitsPostemployment
Benefits
Prior service cost (income) . . . . $— $ 1 $ 1 $(13) $ (1)Actuarial loss . . . . . . . . . . . . . . $100 $37 $137 $ 4 $12
66
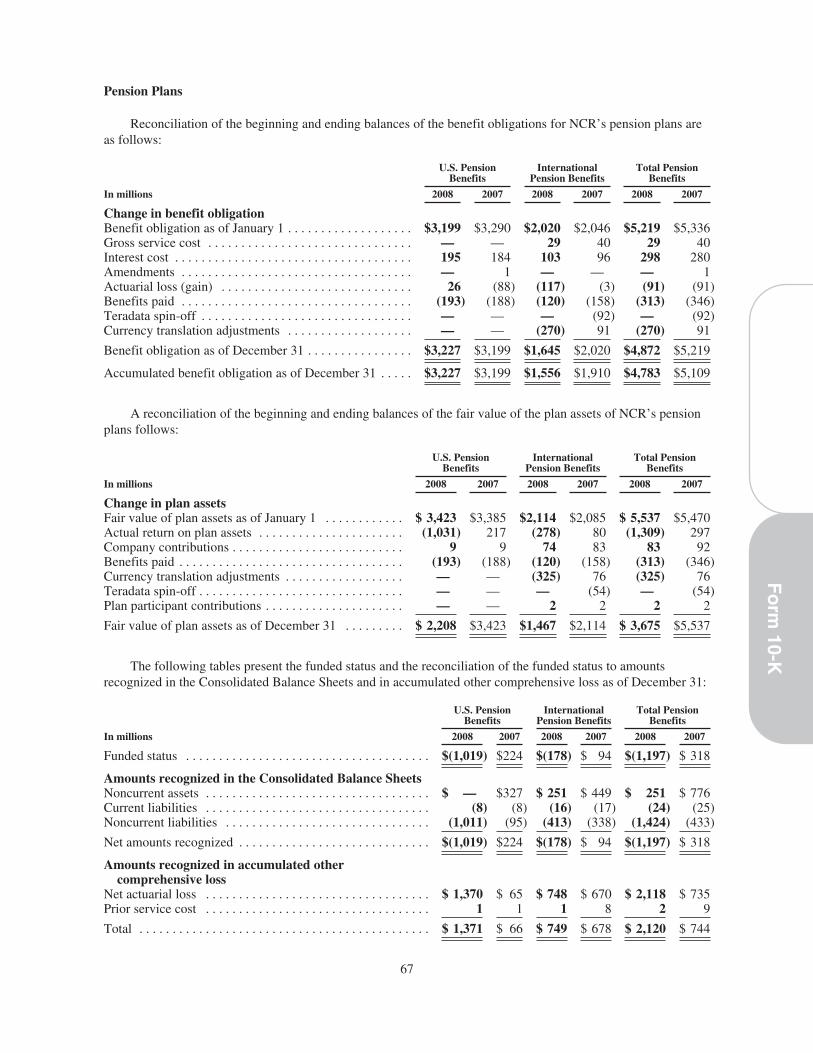
Pension Plans
Reconciliation of the beginning and ending balances of the benefit obligations for NCR’s pension plans areas follows:
U.S. PensionBenefits
InternationalPension Benefits
Total PensionBenefits
In millions 2008 2007 2008 2007 2008 2007
Change in benefit obligationBenefit obligation as of January 1 . . . . . . . . . . . . . . . . . . . $3,199 $3,290 $2,020 $2,046 $5,219 $5,336Gross service cost . . . . . . . . . . . . . . . . . . . . . . . . . . . . . . . — — 29 40 29 40Interest cost . . . . . . . . . . . . . . . . . . . . . . . . . . . . . . . . . . . . 195 184 103 96 298 280Amendments . . . . . . . . . . . . . . . . . . . . . . . . . . . . . . . . . . . — 1 — — — 1Actuarial loss (gain) . . . . . . . . . . . . . . . . . . . . . . . . . . . . . 26 (88) (117) (3) (91) (91)Benefits paid . . . . . . . . . . . . . . . . . . . . . . . . . . . . . . . . . . . (193) (188) (120) (158) (313) (346)Teradata spin-off . . . . . . . . . . . . . . . . . . . . . . . . . . . . . . . . — — — (92) — (92)Currency translation adjustments . . . . . . . . . . . . . . . . . . . — — (270) 91 (270) 91
Benefit obligation as of December 31 . . . . . . . . . . . . . . . . $3,227 $3,199 $1,645 $2,020 $4,872 $5,219
Accumulated benefit obligation as of December 31 . . . . . $3,227 $3,199 $1,556 $1,910 $4,783 $5,109
A reconciliation of the beginning and ending balances of the fair value of the plan assets of NCR’s pensionplans follows:
U.S. PensionBenefits
InternationalPension Benefits
Total PensionBenefits
In millions 2008 2007 2008 2007 2008 2007
Change in plan assetsFair value of plan assets as of January 1 . . . . . . . . . . . . $ 3,423 $3,385 $2,114 $2,085 $ 5,537 $5,470Actual return on plan assets . . . . . . . . . . . . . . . . . . . . . . (1,031) 217 (278) 80 (1,309) 297Company contributions . . . . . . . . . . . . . . . . . . . . . . . . . . 9 9 74 83 83 92Benefits paid . . . . . . . . . . . . . . . . . . . . . . . . . . . . . . . . . . (193) (188) (120) (158) (313) (346)Currency translation adjustments . . . . . . . . . . . . . . . . . . — — (325) 76 (325) 76Teradata spin-off . . . . . . . . . . . . . . . . . . . . . . . . . . . . . . . — — — (54) — (54)Plan participant contributions . . . . . . . . . . . . . . . . . . . . . — — 2 2 2 2
Fair value of plan assets as of December 31 . . . . . . . . . $ 2,208 $3,423 $1,467 $2,114 $ 3,675 $5,537
The following tables present the funded status and the reconciliation of the funded status to amountsrecognized in the Consolidated Balance Sheets and in accumulated other comprehensive loss as of December 31:
U.S. PensionBenefits
InternationalPension Benefits
Total PensionBenefits
In millions 2008 2007 2008 2007 2008 2007
Funded status . . . . . . . . . . . . . . . . . . . . . . . . . . . . . . . . . . . . . $(1,019) $224 $(178) $ 94 $(1,197) $ 318
Amounts recognized in the Consolidated Balance SheetsNoncurrent assets . . . . . . . . . . . . . . . . . . . . . . . . . . . . . . . . . . $ — $327 $ 251 $ 449 $ 251 $ 776Current liabilities . . . . . . . . . . . . . . . . . . . . . . . . . . . . . . . . . . (8) (8) (16) (17) (24) (25)Noncurrent liabilities . . . . . . . . . . . . . . . . . . . . . . . . . . . . . . . (1,011) (95) (413) (338) (1,424) (433)
Net amounts recognized . . . . . . . . . . . . . . . . . . . . . . . . . . . . . $(1,019) $224 $(178) $ 94 $(1,197) $ 318
Amounts recognized in accumulated othercomprehensive loss
Net actuarial loss . . . . . . . . . . . . . . . . . . . . . . . . . . . . . . . . . . $ 1,370 $ 65 $ 748 $ 670 $ 2,118 $ 735Prior service cost . . . . . . . . . . . . . . . . . . . . . . . . . . . . . . . . . . 1 1 1 8 2 9
Total . . . . . . . . . . . . . . . . . . . . . . . . . . . . . . . . . . . . . . . . . . . . $ 1,371 $ 66 $ 749 $ 678 $ 2,120 $ 744
67
Fo
rm10-K
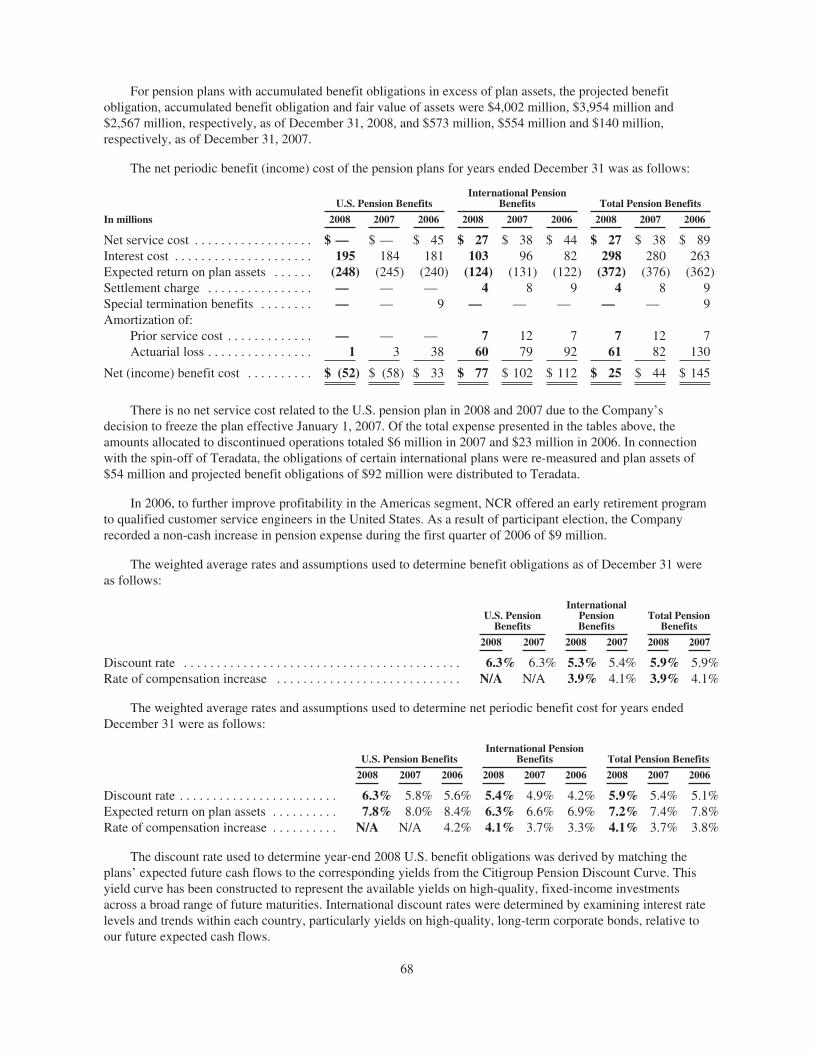
For pension plans with accumulated benefit obligations in excess of plan assets, the projected benefitobligation, accumulated benefit obligation and fair value of assets were $4,002 million, $3,954 million and$2,567 million, respectively, as of December 31, 2008, and $573 million, $554 million and $140 million,respectively, as of December 31, 2007.
The net periodic benefit (income) cost of the pension plans for years ended December 31 was as follows:
U.S. Pension BenefitsInternational Pension
Benefits Total Pension Benefits
In millions 2008 2007 2006 2008 2007 2006 2008 2007 2006
Net service cost . . . . . . . . . . . . . . . . . . $ — $ — $ 45 $ 27 $ 38 $ 44 $ 27 $ 38 $ 89Interest cost . . . . . . . . . . . . . . . . . . . . . 195 184 181 103 96 82 298 280 263Expected return on plan assets . . . . . . (248) (245) (240) (124) (131) (122) (372) (376) (362)Settlement charge . . . . . . . . . . . . . . . . — — — 4 8 9 4 8 9Special termination benefits . . . . . . . . — — 9 — — — — — 9Amortization of:
Prior service cost . . . . . . . . . . . . . — — — 7 12 7 7 12 7Actuarial loss . . . . . . . . . . . . . . . . 1 3 38 60 79 92 61 82 130
Net (income) benefit cost . . . . . . . . . . $ (52) $ (58) $ 33 $ 77 $ 102 $ 112 $ 25 $ 44 $ 145
There is no net service cost related to the U.S. pension plan in 2008 and 2007 due to the Company’sdecision to freeze the plan effective January 1, 2007. Of the total expense presented in the tables above, theamounts allocated to discontinued operations totaled $6 million in 2007 and $23 million in 2006. In connectionwith the spin-off of Teradata, the obligations of certain international plans were re-measured and plan assets of$54 million and projected benefit obligations of $92 million were distributed to Teradata.
In 2006, to further improve profitability in the Americas segment, NCR offered an early retirement programto qualified customer service engineers in the United States. As a result of participant election, the Companyrecorded a non-cash increase in pension expense during the first quarter of 2006 of $9 million.
The weighted average rates and assumptions used to determine benefit obligations as of December 31 wereas follows:
U.S. PensionBenefits
InternationalPensionBenefits
Total PensionBenefits
2008 2007 2008 2007 2008 2007
Discount rate . . . . . . . . . . . . . . . . . . . . . . . . . . . . . . . . . . . . . . . . . . 6.3% 6.3% 5.3% 5.4% 5.9% 5.9%Rate of compensation increase . . . . . . . . . . . . . . . . . . . . . . . . . . . . N/A N/A 3.9% 4.1% 3.9% 4.1%
The weighted average rates and assumptions used to determine net periodic benefit cost for years endedDecember 31 were as follows:
U.S. Pension BenefitsInternational Pension
Benefits Total Pension Benefits
2008 2007 2006 2008 2007 2006 2008 2007 2006
Discount rate . . . . . . . . . . . . . . . . . . . . . . . . 6.3% 5.8% 5.6% 5.4% 4.9% 4.2% 5.9% 5.4% 5.1%Expected return on plan assets . . . . . . . . . . 7.8% 8.0% 8.4% 6.3% 6.6% 6.9% 7.2% 7.4% 7.8%Rate of compensation increase . . . . . . . . . . N/A N/A 4.2% 4.1% 3.7% 3.3% 4.1% 3.7% 3.8%
The discount rate used to determine year-end 2008 U.S. benefit obligations was derived by matching theplans’ expected future cash flows to the corresponding yields from the Citigroup Pension Discount Curve. Thisyield curve has been constructed to represent the available yields on high-quality, fixed-income investmentsacross a broad range of future maturities. International discount rates were determined by examining interest ratelevels and trends within each country, particularly yields on high-quality, long-term corporate bonds, relative toour future expected cash flows.
68

NCR employs a building block approach as its primary approach in determining the long-term expected rateof return assumption for plan assets. Historical market returns are studied and long-term relationships betweenequities and fixed income are preserved consistent with the widely accepted capital market principle that assetswith higher volatilities generate higher returns over the long run. Current market factors, such as inflation andinterest rates are evaluated before long-term capital market assumptions are determined. The expected long-termportfolio return is established for each plan via a building block approach with proper rebalancing consideration.The result is then adjusted to reflect additional expected return from active management net of plan expenses.Historical plan returns, the expectations of other capital market participants, and peer data are all used to reviewand assess the results for reasonableness and appropriateness.
The expected return on plan assets component of pension expense for our U.S. pension plan was determinedusing the expected rate of return and a calculated value of assets, referred to as the “market-related value.” Themarket-related value for this plan was $2,427 million and $3,295 million as of December 31, 2008 and 2007,respectively, which is greater than the fair value of plan assets by $221 million and less than the fair value of planassets by $126 million, respectively. Differences between the assumed and actual returns are amortized to themarket-related value on a straight-line basis over a five-year period. Differences in excess of 10% of the marketvalue are recognized immediately. Similar approaches are employed in determining expense for NCR’sinternational plans.
Gains and losses have resulted from changes in actuarial assumptions and from differences betweenassumed and actual experience, including, among other items, changes in discount rates and differences betweenactual and assumed asset returns. These gains and losses (except those differences being amortized to the market-related value) are only amortized to the extent that they exceed 10% of the higher of the market-related value orthe projected benefit obligation of each respective plan. As a result, for the U.S. pension plan, unrecognized netlosses of $313 million are not expected to be amortized during fiscal 2009. The remaining unrecognized netlosses in excess of the corridor are $820 million and are being amortized over the expected remaining serviceperiods of active plan participants (approximately 8.3 years during fiscal 2009). Similar approaches are employedin amortizing gains and losses for NCR’s other U.S. and international plans.
Plan Assets The weighted average asset allocations as of December 31, 2008 and 2007 by asset categoryare as follows:
U.S. Pension Fund International Pension Funds
Actual Allocation ofPlan Assets as of
December 31 TargetAsset
Allocation
Actual Allocation ofPlan Assets as of
December 31 TargetAsset
Allocation2008 2007 2008 2007
Equity securities . . . . . . . . . . . . . . . . . . . . . . . . . . . . 55% 66% 50-59% 44% 60% 43-56%Debt securities . . . . . . . . . . . . . . . . . . . . . . . . . . . . . 40% 29% 37-43% 45% 35% 34-46%Real estate . . . . . . . . . . . . . . . . . . . . . . . . . . . . . . . . . 5% 5% 4-6% 6% 5% 4-7%Other . . . . . . . . . . . . . . . . . . . . . . . . . . . . . . . . . . . . . 0% 0% 0-1% 5% 0% 4-7%
Total . . . . . . . . . . . . . . . . . . . . . . . . . . . . . . . . . . . . . 100% 100% 100% 100%
Investment Strategy NCR employs a total return investment approach, whereby a mix of equities, fixed-income and real estate investments are used to maximize the long-term return of plan assets subject to a prudentlevel of risk. The risk tolerance is established for each plan through a careful consideration of plan liabilities,plan funded status and corporate financial condition. The investment portfolios contain a diversified blend ofequity and fixed-income investments. Furthermore, equity investments are diversified across U.S. and non-U.S.stocks, small and large capitalization stocks, and growth and value stocks. Fixed-income assets are alsodiversified across U.S. and non-U.S. issuers, type of fixed-income security (i.e., government bond, corporatebonds, mortgage-backed securities) and credit quality. Where applicable, real estate investments are madethrough real estate securities, partnership interests or direct investment and are diversified by property type andlocation. Other assets, such as cash or private equity are used judiciously to improve portfolio diversification andenhance risk-adjusted portfolio returns. Derivatives may be used to adjust market exposures in an efficient andtimely manner. Due to the timing of security purchases and sales, cash held by fund managers is classified in the
69
Fo
rm10-K

same asset category as the related investment. Rebalancing algorithms are applied to keep the asset mix of theplans from deviating excessively from their targets. Investment risk is measured and monitored on an ongoingbasis through regular performance reporting, investment manager reviews, actuarial liability measurements andperiodic investment strategy reviews.
Postretirement Plans
Reconciliation of the beginning and ending balances of the benefit obligation for NCR’s U.S. postretirementplan is as follows:
Postretirement Benefits
In millions 2008 2007
Change in benefit obligationBenefit obligation as of January 1 . . . . . . . . . . . . . . . . . . . . . . . . . . . . . . . . . . . . . . . . . . . . . . $134 $152Gross service cost . . . . . . . . . . . . . . . . . . . . . . . . . . . . . . . . . . . . . . . . . . . . . . . . . . . . . . . . . . — —Interest cost . . . . . . . . . . . . . . . . . . . . . . . . . . . . . . . . . . . . . . . . . . . . . . . . . . . . . . . . . . . . . . . 7 7Actuarial gain . . . . . . . . . . . . . . . . . . . . . . . . . . . . . . . . . . . . . . . . . . . . . . . . . . . . . . . . . . . . . (8) (10)Plan participant contributions . . . . . . . . . . . . . . . . . . . . . . . . . . . . . . . . . . . . . . . . . . . . . . . . . 8 11Benefits paid . . . . . . . . . . . . . . . . . . . . . . . . . . . . . . . . . . . . . . . . . . . . . . . . . . . . . . . . . . . . . . (25) (26)
Benefit obligation as of December 31 . . . . . . . . . . . . . . . . . . . . . . . . . . . . . . . . . . . . . . . . . . . $116 $134
There was no transfer of postretirement liability to Teradata as a result of the spin-off.
The following table presents the funded status and the reconciliation of the funded status to amountsrecognized in the Consolidated Balance Sheets and in accumulated other comprehensive loss as of December 31:
Postretirement Benefits
In millions 2008 2007
Benefit obligation . . . . . . . . . . . . . . . . . . . . . . . . . . . . . . . . . . . . . . . . . . . . . . . . . . . . . . . . . . $(116) $(134)
Amounts recognized in the Consolidated Balance SheetsCurrent liabilities . . . . . . . . . . . . . . . . . . . . . . . . . . . . . . . . . . . . . . . . . . . . . . . . . . . . . . . . . . . $ (17) $ (18)Noncurrent liabilities . . . . . . . . . . . . . . . . . . . . . . . . . . . . . . . . . . . . . . . . . . . . . . . . . . . . . . . . (99) (116)
Net amounts recognized . . . . . . . . . . . . . . . . . . . . . . . . . . . . . . . . . . . . . . . . . . . . . . . . . . . . . $(116) $(134)
Amounts recognized in accumulated other comprehensive lossNet actuarial loss . . . . . . . . . . . . . . . . . . . . . . . . . . . . . . . . . . . . . . . . . . . . . . . . . . . . . . . . . . . $ 48 $ 60Prior service credit . . . . . . . . . . . . . . . . . . . . . . . . . . . . . . . . . . . . . . . . . . . . . . . . . . . . . . . . . (101) (114)
Total . . . . . . . . . . . . . . . . . . . . . . . . . . . . . . . . . . . . . . . . . . . . . . . . . . . . . . . . . . . . . . . . . . . . $ (53) $ (54)
The net periodic benefit (income) cost of the postretirement plan for the years ended December 31 was:
Postretirement Benefits
In millions 2008 2007 2006
Interest cost . . . . . . . . . . . . . . . . . . . . . . . . . . . . . . . . . . . . . . . . . . . . . . . . . . . . . . $ 7 $ 7 $ 8Net service cost . . . . . . . . . . . . . . . . . . . . . . . . . . . . . . . . . . . . . . . . . . . . . . . . . . . — — —Amortization of:
Prior service cost . . . . . . . . . . . . . . . . . . . . . . . . . . . . . . . . . . . . . . . . . . . . . . (13) (13) (15)Actuarial loss . . . . . . . . . . . . . . . . . . . . . . . . . . . . . . . . . . . . . . . . . . . . . . . . . 4 5 7
Net benefit income . . . . . . . . . . . . . . . . . . . . . . . . . . . . . . . . . . . . . . . . . . . . . . . . $ (2) $ (1) $—
70
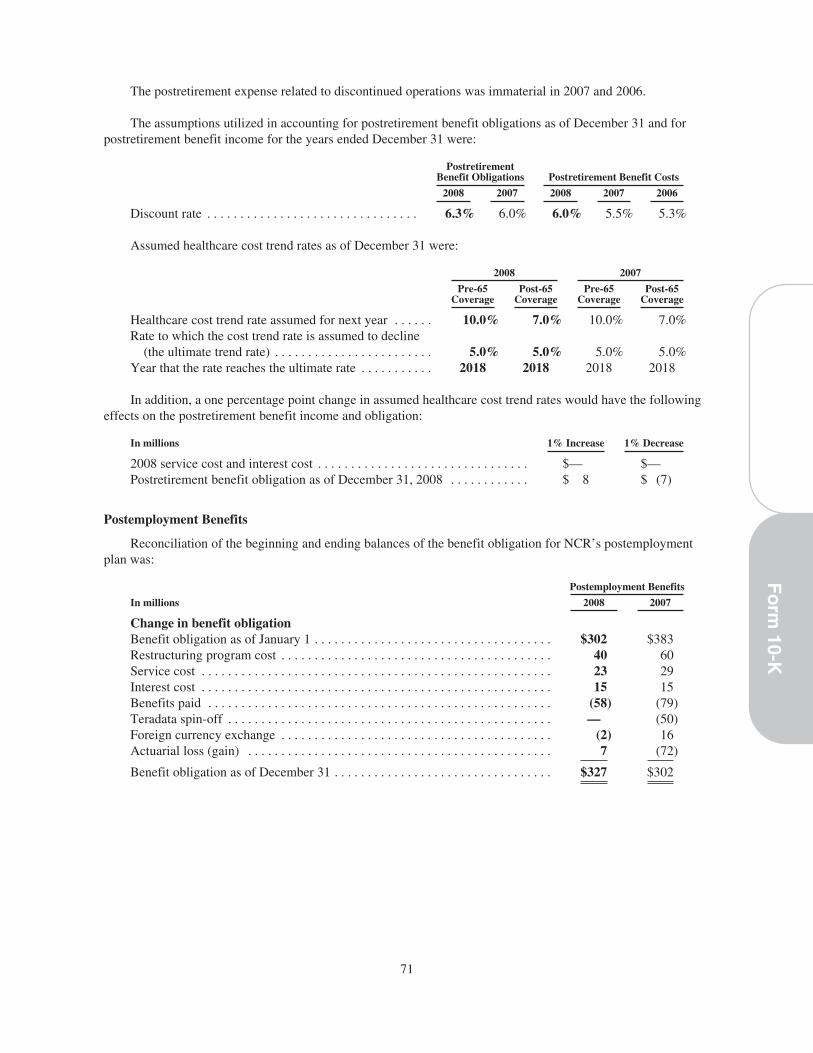
The postretirement expense related to discontinued operations was immaterial in 2007 and 2006.
The assumptions utilized in accounting for postretirement benefit obligations as of December 31 and forpostretirement benefit income for the years ended December 31 were:
PostretirementBenefit Obligations Postretirement Benefit Costs
2008 2007 2008 2007 2006
Discount rate . . . . . . . . . . . . . . . . . . . . . . . . . . . . . . . . 6.3% 6.0% 6.0% 5.5% 5.3%
Assumed healthcare cost trend rates as of December 31 were:
2008 2007
Pre-65Coverage
Post-65Coverage
Pre-65Coverage
Post-65Coverage
Healthcare cost trend rate assumed for next year . . . . . . 10.0% 7.0% 10.0% 7.0%Rate to which the cost trend rate is assumed to decline
(the ultimate trend rate) . . . . . . . . . . . . . . . . . . . . . . . . 5.0% 5.0% 5.0% 5.0%Year that the rate reaches the ultimate rate . . . . . . . . . . . 2018 2018 2018 2018
In addition, a one percentage point change in assumed healthcare cost trend rates would have the followingeffects on the postretirement benefit income and obligation:
In millions 1% Increase 1% Decrease
2008 service cost and interest cost . . . . . . . . . . . . . . . . . . . . . . . . . . . . . . . . $— $—Postretirement benefit obligation as of December 31, 2008 . . . . . . . . . . . . $ 8 $ (7)
Postemployment Benefits
Reconciliation of the beginning and ending balances of the benefit obligation for NCR’s postemploymentplan was:
Postemployment Benefits
In millions 2008 2007
Change in benefit obligationBenefit obligation as of January 1 . . . . . . . . . . . . . . . . . . . . . . . . . . . . . . . . . . . . $302 $383Restructuring program cost . . . . . . . . . . . . . . . . . . . . . . . . . . . . . . . . . . . . . . . . . 40 60Service cost . . . . . . . . . . . . . . . . . . . . . . . . . . . . . . . . . . . . . . . . . . . . . . . . . . . . . 23 29Interest cost . . . . . . . . . . . . . . . . . . . . . . . . . . . . . . . . . . . . . . . . . . . . . . . . . . . . . 15 15Benefits paid . . . . . . . . . . . . . . . . . . . . . . . . . . . . . . . . . . . . . . . . . . . . . . . . . . . . (58) (79)Teradata spin-off . . . . . . . . . . . . . . . . . . . . . . . . . . . . . . . . . . . . . . . . . . . . . . . . . — (50)Foreign currency exchange . . . . . . . . . . . . . . . . . . . . . . . . . . . . . . . . . . . . . . . . . (2) 16Actuarial loss (gain) . . . . . . . . . . . . . . . . . . . . . . . . . . . . . . . . . . . . . . . . . . . . . . 7 (72)
Benefit obligation as of December 31 . . . . . . . . . . . . . . . . . . . . . . . . . . . . . . . . . $327 $302
71
Fo
rm10-K

The following tables present the funded status and the reconciliation of the funded status to amountsrecognized in the Consolidated Balance Sheets and in accumulated other comprehensive loss at December 31:
PostemploymentBenefits
In millions 2008 2007
Benefit obligation . . . . . . . . . . . . . . . . . . . . . . . . . . . . . . . . . . . . . . . . . . . . . . . . . . . . . . . . . . . . . . . $(327) $(302)
Amounts recognized in the Consolidated Balance SheetsCurrent liabilities . . . . . . . . . . . . . . . . . . . . . . . . . . . . . . . . . . . . . . . . . . . . . . . . . . . . . . . . . . . . . . . $ (67) $ (59)Noncurrent liabilities . . . . . . . . . . . . . . . . . . . . . . . . . . . . . . . . . . . . . . . . . . . . . . . . . . . . . . . . . . . . (260) (243)
Net amounts recognized . . . . . . . . . . . . . . . . . . . . . . . . . . . . . . . . . . . . . . . . . . . . . . . . . . . . . . . . . . $(327) $(302)
Amounts recognized in accumulated other comprehensive lossNet actuarial loss . . . . . . . . . . . . . . . . . . . . . . . . . . . . . . . . . . . . . . . . . . . . . . . . . . . . . . . . . . . . . . . $ 125 $ 133Prior service credit . . . . . . . . . . . . . . . . . . . . . . . . . . . . . . . . . . . . . . . . . . . . . . . . . . . . . . . . . . . . . . (3) (3)
Total . . . . . . . . . . . . . . . . . . . . . . . . . . . . . . . . . . . . . . . . . . . . . . . . . . . . . . . . . . . . . . . . . . . . . . . . . $ 122 $ 130
The net periodic benefit cost of the postemployment plan for years ended December 31 was:
PostemploymentBenefits
In millions 2008 2007 2006
Service cost . . . . . . . . . . . . . . . . . . . . . . . . . . . . . . . . . . . . . . . . . . . . . . . . . . . . . $23 $ 29 $ 30Interest cost . . . . . . . . . . . . . . . . . . . . . . . . . . . . . . . . . . . . . . . . . . . . . . . . . . . . . 15 15 17Amortization of actuarial loss . . . . . . . . . . . . . . . . . . . . . . . . . . . . . . . . . . . . . . . 13 22 32
Net benefit cost . . . . . . . . . . . . . . . . . . . . . . . . . . . . . . . . . . . . . . . . . . . . . . . . . . $51 $ 66 $ 79Restructuring severance cost . . . . . . . . . . . . . . . . . . . . . . . . . . . . . . . . . . . . . . . 40 60 —
Net benefit cost . . . . . . . . . . . . . . . . . . . . . . . . . . . . . . . . . . . . . . . . . . . . . . . . . . $91 $126 $ 79
Of the total expense presented in the table above, the amounts allocated to discontinued operations totaled$12 million in 2007 and $16 million in 2006. In connection with the spin-off of Teradata, we re-measured ourpostemployment benefit obligations and $50 million was distributed to Teradata.
The weighted average assumptions utilized in accounting for postemployment benefit obligations as ofDecember 31 and for postemployment benefit costs for the years ended December 31 were:
PostemploymentBenefit Obligations
PostemploymentBenefit Costs
2008 2007 2008 2007 2006
Discount rate . . . . . . . . . . . . . . . . . . . . . . . . . . . . . . . . . . . . . . . . . . . . . . . . . 4.6% 5.3% 5.3% 4.9% 4.3%Salary increase rate . . . . . . . . . . . . . . . . . . . . . . . . . . . . . . . . . . . . . . . . . . . . 3.6% 4.1% 4.1% 3.7% 3.4%Involuntary turnover rate . . . . . . . . . . . . . . . . . . . . . . . . . . . . . . . . . . . . . . . . 5.0% 5.0% 5.0% 5.0% 5.0%
The below table presents each relevant component of other comprehensive income related to NCR’s benefitplans as of December 31, 2008, including the tax effects of each component:
In millionsBefore-Tax
AmountTax Benefit(Expense)
Net-of-TaxAmount
Prior service cost during year . . . . . . . . . . . . . . . . . . . . . . . . . . . . . . . . . . . . . . $ — $— $ —Amortization of prior service cost . . . . . . . . . . . . . . . . . . . . . . . . . . . . . . . . . . (7) 5 (2)Net loss arising during year . . . . . . . . . . . . . . . . . . . . . . . . . . . . . . . . . . . . . . . (1,593) 482 (1,111)Actuarial gain included in benefits expense . . . . . . . . . . . . . . . . . . . . . . . . . . . 86 (7) 79Currency translation . . . . . . . . . . . . . . . . . . . . . . . . . . . . . . . . . . . . . . . . . . . . . 144 (3) 141
Total benefit plans . . . . . . . . . . . . . . . . . . . . . . . . . . . . . . . . . . . . . . . . . . . . . . . $(1,370) $477 $ (893)
72
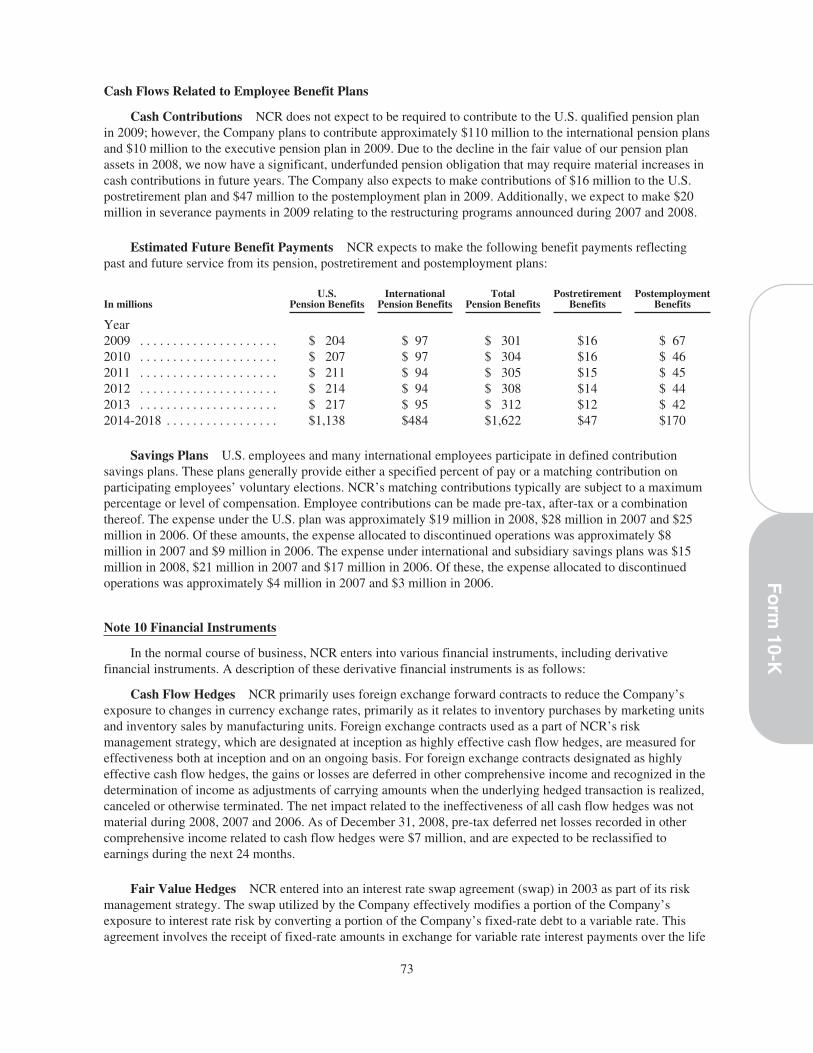
Cash Flows Related to Employee Benefit Plans
Cash Contributions NCR does not expect to be required to contribute to the U.S. qualified pension planin 2009; however, the Company plans to contribute approximately $110 million to the international pension plansand $10 million to the executive pension plan in 2009. Due to the decline in the fair value of our pension planassets in 2008, we now have a significant, underfunded pension obligation that may require material increases incash contributions in future years. The Company also expects to make contributions of $16 million to the U.S.postretirement plan and $47 million to the postemployment plan in 2009. Additionally, we expect to make $20million in severance payments in 2009 relating to the restructuring programs announced during 2007 and 2008.
Estimated Future Benefit Payments NCR expects to make the following benefit payments reflectingpast and future service from its pension, postretirement and postemployment plans:
In millionsU.S.
Pension BenefitsInternational
Pension BenefitsTotal
Pension BenefitsPostretirement
BenefitsPostemployment
Benefits
Year2009 . . . . . . . . . . . . . . . . . . . . . $ 204 $ 97 $ 301 $16 $ 672010 . . . . . . . . . . . . . . . . . . . . . $ 207 $ 97 $ 304 $16 $ 462011 . . . . . . . . . . . . . . . . . . . . . $ 211 $ 94 $ 305 $15 $ 452012 . . . . . . . . . . . . . . . . . . . . . $ 214 $ 94 $ 308 $14 $ 442013 . . . . . . . . . . . . . . . . . . . . . $ 217 $ 95 $ 312 $12 $ 422014-2018 . . . . . . . . . . . . . . . . . $1,138 $484 $1,622 $47 $170
Savings Plans U.S. employees and many international employees participate in defined contributionsavings plans. These plans generally provide either a specified percent of pay or a matching contribution onparticipating employees’ voluntary elections. NCR’s matching contributions typically are subject to a maximumpercentage or level of compensation. Employee contributions can be made pre-tax, after-tax or a combinationthereof. The expense under the U.S. plan was approximately $19 million in 2008, $28 million in 2007 and $25million in 2006. Of these amounts, the expense allocated to discontinued operations was approximately $8million in 2007 and $9 million in 2006. The expense under international and subsidiary savings plans was $15million in 2008, $21 million in 2007 and $17 million in 2006. Of these, the expense allocated to discontinuedoperations was approximately $4 million in 2007 and $3 million in 2006.
Note 10 Financial Instruments
In the normal course of business, NCR enters into various financial instruments, including derivativefinancial instruments. A description of these derivative financial instruments is as follows:
Cash Flow Hedges NCR primarily uses foreign exchange forward contracts to reduce the Company’sexposure to changes in currency exchange rates, primarily as it relates to inventory purchases by marketing unitsand inventory sales by manufacturing units. Foreign exchange contracts used as a part of NCR’s riskmanagement strategy, which are designated at inception as highly effective cash flow hedges, are measured foreffectiveness both at inception and on an ongoing basis. For foreign exchange contracts designated as highlyeffective cash flow hedges, the gains or losses are deferred in other comprehensive income and recognized in thedetermination of income as adjustments of carrying amounts when the underlying hedged transaction is realized,canceled or otherwise terminated. The net impact related to the ineffectiveness of all cash flow hedges was notmaterial during 2008, 2007 and 2006. As of December 31, 2008, pre-tax deferred net losses recorded in othercomprehensive income related to cash flow hedges were $7 million, and are expected to be reclassified toearnings during the next 24 months.
Fair Value Hedges NCR entered into an interest rate swap agreement (swap) in 2003 as part of its riskmanagement strategy. The swap utilized by the Company effectively modifies a portion of the Company’sexposure to interest rate risk by converting a portion of the Company’s fixed-rate debt to a variable rate. Thisagreement involves the receipt of fixed-rate amounts in exchange for variable rate interest payments over the life
73
Fo
rm10-K
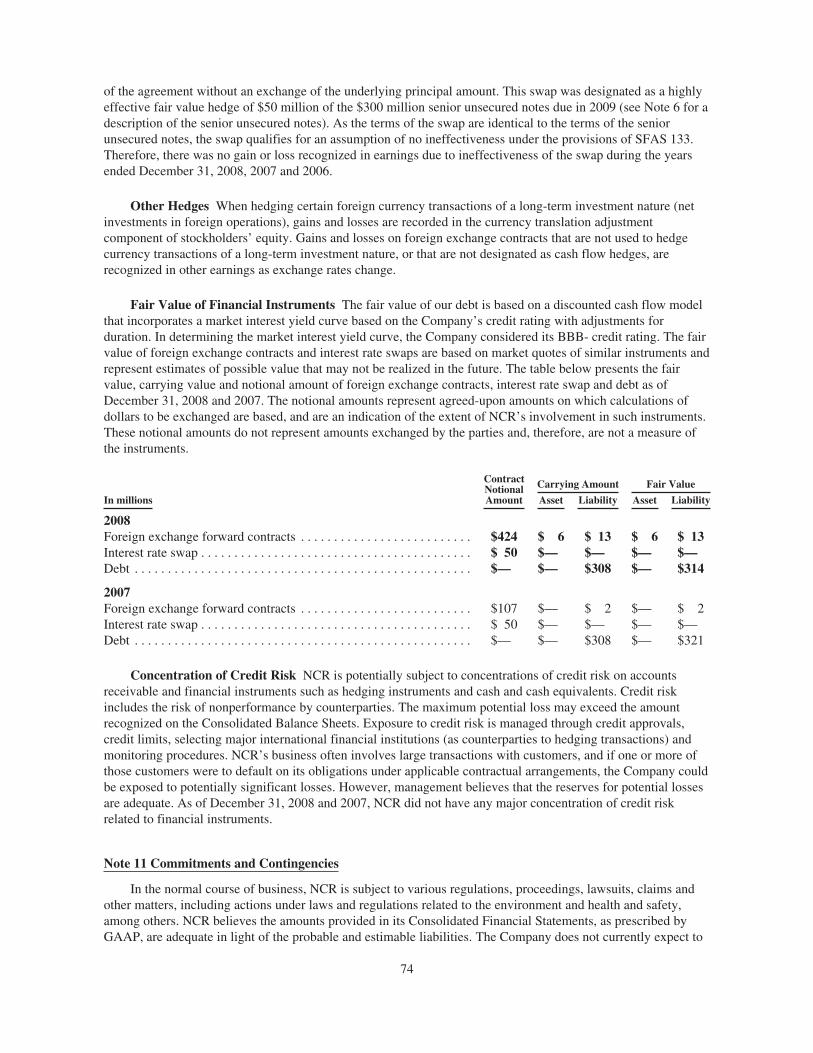
of the agreement without an exchange of the underlying principal amount. This swap was designated as a highlyeffective fair value hedge of $50 million of the $300 million senior unsecured notes due in 2009 (see Note 6 for adescription of the senior unsecured notes). As the terms of the swap are identical to the terms of the seniorunsecured notes, the swap qualifies for an assumption of no ineffectiveness under the provisions of SFAS 133.Therefore, there was no gain or loss recognized in earnings due to ineffectiveness of the swap during the yearsended December 31, 2008, 2007 and 2006.
Other Hedges When hedging certain foreign currency transactions of a long-term investment nature (netinvestments in foreign operations), gains and losses are recorded in the currency translation adjustmentcomponent of stockholders’ equity. Gains and losses on foreign exchange contracts that are not used to hedgecurrency transactions of a long-term investment nature, or that are not designated as cash flow hedges, arerecognized in other earnings as exchange rates change.
Fair Value of Financial Instruments The fair value of our debt is based on a discounted cash flow modelthat incorporates a market interest yield curve based on the Company’s credit rating with adjustments forduration. In determining the market interest yield curve, the Company considered its BBB- credit rating. The fairvalue of foreign exchange contracts and interest rate swaps are based on market quotes of similar instruments andrepresent estimates of possible value that may not be realized in the future. The table below presents the fairvalue, carrying value and notional amount of foreign exchange contracts, interest rate swap and debt as ofDecember 31, 2008 and 2007. The notional amounts represent agreed-upon amounts on which calculations ofdollars to be exchanged are based, and are an indication of the extent of NCR’s involvement in such instruments.These notional amounts do not represent amounts exchanged by the parties and, therefore, are not a measure ofthe instruments.
ContractNotionalAmount
Carrying Amount Fair Value
In millions Asset Liability Asset Liability
2008Foreign exchange forward contracts . . . . . . . . . . . . . . . . . . . . . . . . . . $424 $ 6 $ 13 $ 6 $ 13Interest rate swap . . . . . . . . . . . . . . . . . . . . . . . . . . . . . . . . . . . . . . . . . $ 50 $— $— $— $—Debt . . . . . . . . . . . . . . . . . . . . . . . . . . . . . . . . . . . . . . . . . . . . . . . . . . . $— $— $308 $— $314
2007Foreign exchange forward contracts . . . . . . . . . . . . . . . . . . . . . . . . . . $107 $— $ 2 $— $ 2Interest rate swap . . . . . . . . . . . . . . . . . . . . . . . . . . . . . . . . . . . . . . . . . $ 50 $— $— $— $—Debt . . . . . . . . . . . . . . . . . . . . . . . . . . . . . . . . . . . . . . . . . . . . . . . . . . . $— $— $308 $— $321
Concentration of Credit Risk NCR is potentially subject to concentrations of credit risk on accountsreceivable and financial instruments such as hedging instruments and cash and cash equivalents. Credit riskincludes the risk of nonperformance by counterparties. The maximum potential loss may exceed the amountrecognized on the Consolidated Balance Sheets. Exposure to credit risk is managed through credit approvals,credit limits, selecting major international financial institutions (as counterparties to hedging transactions) andmonitoring procedures. NCR’s business often involves large transactions with customers, and if one or more ofthose customers were to default on its obligations under applicable contractual arrangements, the Company couldbe exposed to potentially significant losses. However, management believes that the reserves for potential lossesare adequate. As of December 31, 2008 and 2007, NCR did not have any major concentration of credit riskrelated to financial instruments.
Note 11 Commitments and Contingencies
In the normal course of business, NCR is subject to various regulations, proceedings, lawsuits, claims andother matters, including actions under laws and regulations related to the environment and health and safety,among others. NCR believes the amounts provided in its Consolidated Financial Statements, as prescribed byGAAP, are adequate in light of the probable and estimable liabilities. The Company does not currently expect to
74
incur material capital expenditures related to compliance with such laws and regulations. However, there can beno assurances that the actual amounts required to satisfy alleged liabilities from various lawsuits, claims, legalproceedings and other matters, including the Fox River environmental matter and other matters discussed below,and to comply with applicable laws and regulations, will not exceed the amounts reflected in NCR’sConsolidated Financial Statements or will not have a material adverse effect on its consolidated results ofoperations, capital expenditures, competitive position, financial condition or cash flows. Any costs that may beincurred in excess of those amounts provided as of December 31, 2008 cannot currently be reasonablydetermined.
The United States Department of Justice is conducting an investigation regarding the propriety of theCompany’s former Teradata Data Warehousing business’s arrangements and understandings with others inconnection with certain federal contracts. In connection with the spin-off of Teradata on September 30, 2007, theresponsibility for this matter, together with the related reserve, was distributed to Teradata Corporation. Whilethe Company may be subject to ostensible exposure inasmuch as it was the contracting party in the matter atissue, Teradata Corporation is generally obligated to indemnify the Company for any losses arising out of thismatter.
A separate portion of the government’s investigation relates to the adequacy of pricing disclosures made tothe government in connection with negotiation of the Company’s General Services Administration FederalSupply Schedule and to whether certain subsequent price reductions were properly passed on to the government.Both Teradata Corporation and the Company are participating in this aspect of the investigation, with respect tocertain products and services of each, and each will assume financial responsibility for its own exposures, if any,without indemnification from the other. At this time, the Company is unable to determine whether it has probableliability with respect to this aspect of the investigation.
In March 2008 NCR was served with a complaint filed in federal court in California by an employee in itsNCR Services organization alleging violations of the Fair Labor Standards Act (FLSA) and California state law.The complaint alleges that the plaintiff and other employees in the Customer Engineer (CE) job classification areengaged in “off-the-clock” work for which they are not compensated, as well as working through unpaid mealand rest breaks in violation of law. As of February 1, 2009, an additional 20 named plaintiffs had joined the case.In addition, on October 7, 2008, NCR and its services subsidiary, First Level Technology LLC (First Level) wereserved with a similar FLSA and state law complaint filed in federal court in Chicago, Illinois. There are presently6 plaintiffs (current and former CEs) in the Chicago action. On February 23, 2009, NCR and the plaintiff classrepresentative in the California action, entered into a settlement agreement, subject to court approval, coveringthe NCR and First Level CEs. NCR recorded an accrual of $12 million as of December 31, 2008 to recognize ourliability under the settlement as well as other expenses related to the lawsuits, including the payment ofadministrative costs, certain employee taxes, and other expenses.
Environmental Matters NCR’s facilities and operations are subject to a wide range of environmentalprotection laws, and NCR has investigatory and remedial activities underway at a number of facilities that itcurrently owns or operates, or formerly owned or operated, to comply, or to determine compliance, with suchlaws. Also, NCR has been identified, either by a government agency or by a private party seeking contribution tosite clean-up costs, as a potentially responsible party (PRP) at a number of sites pursuant to various state andfederal laws, including the Federal Water Pollution Control Act, the Comprehensive Environmental Response,Compensation and Liability Act (CERCLA) and comparable state statutes. Other than the matter detailed below,we currently do not anticipate material expenses and liabilities from these other environmental matters.
NCR is one of eight entities that have been formally notified by governmental and other entities (such aslocal Native American tribes) that they are PRPs for environmental claims under CERCLA and other statutesarising out of the presence of polychlorinated biphenyls (PCBs) in sediments in the lower Fox River and in theBay of Green Bay in Wisconsin. NCR was identified as a PRP because of alleged PCB discharges from twocarbonless copy paper manufacturing facilities it previously owned, which were located along the Fox River.Some parties contend that NCR is also responsible for PCB discharges from paper mills owned by othercompanies because carbonless paper manufactured by NCR was allegedly purchased by those mills as a rawmaterial for their paper making processes. NCR sold the facilities in 1978 to Appleton Papers Inc. (API), whichhas also been identified as a PRP. The other Fox River PRPs that received notices are P.H. Glatfelter Company,
75
Fo
rm10-K
Georgia-Pacific Consumer Products LP (GP, successor to Fort James Operating Company), WTM I Co.(formerly Wisconsin Tissue Mills, now owned by Chesapeake Corporation), CBC Corporation (formerlyRiverside Paper Corporation), U.S. Paper Mills Corp. (owned by Sonoco Products Company), and MenashaCorporation.
In July 2003, the United States Environmental Protection Agency (USEPA) and Wisconsin Department ofNatural Resources (WDNR) issued their final clean-up plan (known as a Record of Decision, or ROD) for thelargest portion of the Fox River. The ROD addressed the lower part of the Fox River and portions of Green Bay,where USEPA and WDNR (the Governments) estimate the bulk of the sediments that need to be remediated arelocated. In two portions of the lower part of the Fox River covered by the ROD—Operable Units (OUs) 3 and4—the Governments selected large-scale dredging as the clean-up approach and estimated that cost atapproximately $284 million. The Governments also identified “capping” the river bed with appropriate materialsas a “contingent remedy” to be evaluated during the remedial design process. For Green Bay, or OU 5, theGovernments selected monitored natural attenuation as the clean-up approach at an estimated cost ofapproximately $40 million. Earlier, in January 2003, the Governments had issued their ROD for the upperportions of the Fox River projecting the cost of that work to be approximately $65 million for OU 1 and $10million for OU 2. Combining the cost estimates from both RODs issued in 2003, the Governments expected theselected remedies for all five OUs to cost approximately $400 million, exclusive of contingencies.
By letter dated September 30, 2003, the Governments notified NCR and the seven other PRPs of theirpotential liability for remediation of the lower portions of the Fox River and requested that one or more of thePRPs enter into an agreement with the Governments to perform the engineering design work for the clean-up ofOUs 2 through 5. In response, in 2004, NCR and GP entered into an Administrative Order on Consent (AOC)with the Governments to perform this design work, and this work was nearly complete as of December 31, 2008.
In April 2006, NCR and U.S. Paper Mills entered into a consent decree with the Governments to undertake aremedial action involving an area of elevated PCBs downriver of the De Pere Dam (Phase 1 work). The consentdecree was approved in November 2006 by the federal court in Wisconsin, and most of the work was performedduring 2007. The remaining work will be combined with the rest of the OU 2 through 5 remedial actiondiscussed below, although the consent decree will be kept open formally until all work in the Phase 1 area iscomplete. The estimated remaining costs of this project are included in the estimates discussed below.
In November 2006, the Governments issued, for public comment, a proposal to amend the RODs for thelower river. The proposal called for a combination of dredging and capping to remediate the PCB-containingsediments, as opposed to using dredging throughout the lower river. In June 2007, the Governments issued theiramendment to the 2003 RODs (Amended ROD), adopting the proposal to use a combination of dredging andcapping to remediate the sediments in OUs 2 through 5 (the Amended ROD did not address OU 1). TheAmended ROD stated that the cost of this work was expected to be $390 million.
By letter received February 14, 2007, the Governments again notified NCR and the seven other PRPs oftheir potential liability for remediation and requested that the parties enter into negotiations with theGovernments over a consent decree for implementing the remedy for the lower river. Such negotiations ensued,but to date no consent decree has resulted.
In October 2007, certain of the PRPs issued a request for proposals (RFP), seeking bids from contractors forthe type of contractual arrangement for the lower river clean-up work consistent with the then ongoing settlementdiscussions. Initial responses to the RFP were received in mid-December 2007, and subsequent modifiedresponses, reflecting alternative contracting approaches, were received in the first quarter of 2008. Furthernegotiations with one of the contractors have been ongoing since the second quarter of 2008 and may culminatein the execution of a contract in early 2009. In tandem with the negotiations, certain PRPs and the Governmentshave identified various potential “value engineering” projects intended to reduce the costs of the remediation (thecost savings of the value engineering projects are intended to be shared with the contractor in a percentage yet tobe defined, so as to provide incentives for the contractor to pursue the initiatives).
76

On November 13, 2007, the Governments issued a unilateral administrative order (Order) under Section 106of CERCLA to all eight of the PRPs. The Order requires the PRPs to implement the remedial work in the lowerriver in accordance with the requirements of the Amended ROD. Under the Order, full-scale remediation is tobegin in 2009, with in-water activities anticipated to commence in May of 2009. NCR, API and the other PRPsare working with the Governments to implement certain provisions of the Order.
NCR and API share their portion of the cost of the Fox River clean-up and natural resource damages basedupon an agreement and an arbitration award: a 45% share for NCR of the first $75 million of such costs—athreshold that was reached in the second quarter of 2008—and a 40% share for amounts in excess of $75 million.
On January 7, 2008, NCR and API filed a lawsuit in federal court, which is currently pending in Green Bay,Wisconsin, seeking a judicial ruling determining each PRP’s allocable responsibility for the cost of performingthe remedial work at the Fox River. The suit was initially filed against the George A. Whiting Paper Company,and several defendants were added to the suit in the following months, including all of the original recipients ofthe November 13, 2007 Order (the “allocation litigation”). As of December 31, 2008, there were a total of 28defendants in that case and a companion consolidated case, and a number of counterclaims seeking contributionunder CERCLA have been filed and are pending against NCR and API. On September 23, 2008, the court issueda Case Management Decision and Scheduling Order setting a “Phase I trial” for December 1, 2009, limited to thequestions of (i) when each party knew or should have known that recycling NCR-brand carbonless copy paperwould result in the discharge of PCBs to a waterbody, thereby risking environmental damage; and (ii) what, ifany, actions each party took upon acquiring such knowledge to avoid the risk of further PCB contamination. Thecourt’s order also limits initial discovery proceedings to the same questions. Upon completion of this “Phase I”of the case, the court will enter a new Case Management and Scheduling Order that will govern furtherproceedings in the case.
The extent of NCR’s potential liability remains subject to many uncertainties. NCR’s eventual remediationliability—which is expected to be paid out over a period extending through at least approximately 2019, followedby long-term monitoring for several decades—will depend on a number of factors. In general, the mostsignificant factors include: (1) the total clean-up costs for each of the segments of the river; (2) the total naturalresource damages for the site; (3) the shares NCR and API will jointly bear of future clean-up costs and naturalresource damages as former and current owners of paper manufacturing facilities located along the Fox River;(4) the share NCR will bear of the joint NCR/API payments for such clean-up costs and natural resourcedamages; and (5) NCR’s transaction and litigation costs to defend itself in this matter, including participation inallocation litigation. In establishing the reserve, NCR attempts to estimate a range of reasonably possibleoutcomes for each of these factors, although each range is itself highly uncertain. NCR uses its best estimatewithin the range, if that is possible. Where there is a range of equally possible outcomes, and there is no amountwithin that range that is considered to be a better estimate than any other amount, NCR uses the low end of therange. These factors are discussed below:
For the first factor described above, NCR has revised the amount that it estimates as the total of the clean-upcosts for each of the segments of the river. NCR previously used a best estimate of $613 million, which wasbased on the Governments’ Amended ROD (which set out a cost of approximately $400 million for OUs 2-5, towhich the Company previously added certain other components). The Company now utilizes an updated bestestimate of $837 million, approximately $596 million of which pertains to construction and remediation activitiesfor OUs 2-5.
The Company’s decision to update the estimate is based on, among other things, the subsequent proposaldevelopment, cost calculations and contractor negotiations that remain ongoing, the refinement of “valueengineering” projects, and the Company’s ongoing assessment of clean-up requirements as the projectprogresses. In addition, in the quarter ending December 31, 2008, to substantiate the Company’s assessment thatthe revised cost estimate was appropriate, the Company engaged the services of an environmental andconstruction consulting firm specializing in this type of work to review the then-current plans and proposed costsfor the remediation project and the proposed contract arrangement. The Company’s determination to update theestimate of clean-up costs is based in part on its review of that firm’s views. In light of these factors, the
77
Fo
rm10-K

Company no longer considers the prior amount based on the Governments’ 2007 Amended ROD to constitute abest estimate of total costs. Although a formal remediation contract has not yet been entered into, the Companynow considers the costs being developed in those contract negotiations, coupled with certain additional projectsthe Company believes will be required to achieve compliance with the Order, to constitute a new best estimate ofthe total clean-up costs.
The updated estimated total cost amount of $837 million, as did the previous estimate, includes estimates forthe OU 1 through OU 5 work, the Phase 1 work and the remedial design work. It adds to these estimates a 15%contingency for possible cost overruns and unexpected expenses; a 5% contingency for the Governments’ futureoversight costs; an amount for the Governments’ past oversight costs, updated to reflect a January 2009communication from the Governments; an estimate for long-term monitoring extending over several decades;and an estimate for value engineering savings. There can be no assurances that this estimated total cost amountwill not be significantly higher as remediation work progresses. A range of reasonably possible outcomes withrespect to total cost is difficult to state, but if the portion of the contingency applicable to cost overruns andunexpected expenses were to be doubled from 15% to 30%, the total cost would increase to approximately $931million.
Second, for total natural resource damages (NRD), NCR uses a best estimate of $76 million. Previously,NCR used a best estimate of $131 million. This reduction was based on information NCR obtained in 2007. NCRbelieves the range of reasonably possible outcomes for NRD, if it were to be litigated, is between zero and $176million.
Third, for the NCR/API shares of future clean-up costs, NCR determined that there are ranges of equallypossible outcomes for the different segments of the river, and that no estimates within these ranges are better thanthe other estimates. Accordingly, NCR uses the low ends of the ranges, which are based primarily on theproximity of the areas to be remediated to the locations at which PCBs from the NCR/API plants weredischarged to the river. There are other estimates that are significantly higher; however, NCR believes there issuch uncertainty surrounding these estimates that it cannot quantify the high end of the range, although NCRdoes not believe the joint NCR/API percentage of direct discharges is near 100%. NCR’s analysis of this factorassumes that other PRPs will remain financially viable and will be able to pay their ultimate allocable shares ofany liability for the clean-up costs. As for the NCR/API share of NRD, which is discussed above, NCR uses abest estimate.
Fourth, for the NCR share of the joint NCR/API payments, as discussed above, NCR’s percentage share isset by an agreement between NCR and API and a subsequent arbitration award. NCR’s analysis of this factorassumes that API is able to pay its percentage share of the NCR/API joint share.
Finally, NCR estimated the transaction costs it is likely to incur to defend this matter through 2019, the timeperiod NCR’s engineering consultants believe it will take to implement the remedy for the river. This estimate isbased on an analysis of NCR’s costs since this matter first arose in 1995 and estimates of what NCR’s defenseand transaction costs will be in the future. NCR expects that the bulk of these transaction costs have been andwill be incurred in the 2008—2012 time period. The costs incurred and expected to be incurred during that periodinclude, in particular, completion of the design work, equipment purchases, commencement and continuation ofclean-up activities in the river, and prosecution of the allocation litigation discussed above.
In light of several factors—among them, the remedial design work conducted by NCR and GP, the ongoingsettlement discussions (including the prospects not only of group settlements but also of individual settlementsfor certain corporate or municipal entities), the efforts to implement the Order for clean-up of the lower river, thepending allocation litigation referenced above, efforts by NCR and API to identify other parties with potentialresponsibility for the clean-up, ongoing negotiations with contractors about the cost of implementing the workrequired under the Order, and the subsequent value engineering efforts designed to make the clean-up moreefficient and less costly—calculation of the Company’s Fox River reserve has become subject to added layers ofcomplexities, and it is possible there could be additional changes to some elements of the reserve over upcoming
78
periods, although we are unable to predict or estimate such changes at this time. In addition, the currenteconomic recession may have impacts on the Fox River clean-up, in particular with respect to the ability of PRPsto meet their obligations with respect to the clean-up or to remain as viable concerns; one of the original eightPRPs, WTM I Company, filed for bankruptcy on December 29, 2008, but the impact, if any, of that filing on thatcompany’s potential contributions to the clean-up cannot be determined at this time. Further, there can be noassurance that the clean-up and related expenditures will not have a material effect on NCR’s capitalexpenditures, earnings, financial condition, cash flows, or competitive position.
As of December 31, 2008, the reserve for the Fox River matter was approximately $88 million, compared to$85 million as of December 31, 2007. This reflects a $43 million increase in NCR’s estimated liability due to theupdate for estimated total costs previously discussed, offset by a $15 million increase in the indemnificationreceivable from AT&T and Alcatel-Lucent, and payments of $25 million for clean-up activities and legal fees in2008. The cost of these activities is included in determining our portion of the total clean-up costs, as previouslydescribed. NCR regularly re-evaluates the assumptions used in determining the appropriate reserve for the FoxRiver matter as additional information becomes available and, when warranted, makes appropriate adjustments.
AT&T and Alcatel-Lucent are responsible for indemnifying NCR for a portion of the amounts paid by NCRfor the Fox River matter over a certain threshold. NCR’s estimate of what AT&T and Alcatel-Lucent will payunder the indemnity is recorded as a long-term receivable of approximately $45 million as of December 31,2008, and is deducted in determining the net reserve discussed above. This receivable, which was approximately$30 million as of December 31, 2007, has increased primarily due to the increased estimate of total clean-upcosts related to the Fox River matter. The receivable balance can fluctuate not only with respect to total clean-upand other costs, but also with respect to insurance recoveries and certain tax impacts as measured by acontractual formula using prior-year effective tax rates. Such insurance recoveries and tax impacts are nettedagainst the receivable in proportions specified under the indemnity agreement (i.e., they typically decrease itsamount). Insurance recoveries, whether by judgment or settlement, are the subjects of ongoing litigation and thusdifficult to predict. The tax impact within the indemnity calculation is subject to substantial volatility regardingthe Company’s effective tax rate from year to year, rendering the future tax impacts highly uncertain. Whenactual payments, net of insurance recoveries and tax impacts, reach the indemnity threshold, the Companyexpects to commence collection of the related portions of the receivable. The Company is not able to predictprecisely when it expects its actual payments to achieve the indemnity threshold; however, we do not expect thatto occur prior to late 2009 at the earliest, or sometime in 2010, 2011 or later, depending primarily on whetherNCR receives further insurance recoveries.
In connection with the Fox River matter, NCR previously reached settlement agreements with certain of itsprincipal insurance carriers in a combined total of approximately $30 million, including approximately $1million in the fourth quarter of 2008. Of this amount, $9 million is subject to competing claims by another party,and NCR and the other party have agreed that these funds will be used for Fox River costs and will be shared onan agreed upon basis (subject to reallocation at a later date). NCR’s agreed upon share of the $9 million isestimated to be $4 million. The Company is also engaged in litigation against several other insurance carriers inconnection with the Fox River matter; that case is scheduled to go to trial in a Wisconsin state court on April 27,2009.
It is difficult to estimate the future financial impact of environmental laws, including potential liabilities.NCR records environmental provisions when it is probable that a liability has been incurred and the amount orrange of the liability is reasonably estimable. Provisions for estimated losses from environmental restoration andremediation are, depending on the site, based primarily on internal and third-party environmental studies (exceptfor the Fox River site, where the estimated costs and natural resource damages are estimated as described above),estimates as to the number and participation level of any other PRPs, the extent of the contamination, and thenature of required clean-up and restoration actions. Reserves are adjusted as further information develops orcircumstances change. Management expects that the amounts reserved from time to time will be paid out over theperiod of investigation, negotiation, remediation and restoration for the applicable sites. The amounts providedfor environmental matters in NCR’s Consolidated Financial Statements are the estimated gross undiscountedamounts of such liabilities, without deductions for insurance or third-party indemnity claims, except as qualified
79
Fo
rm10-K
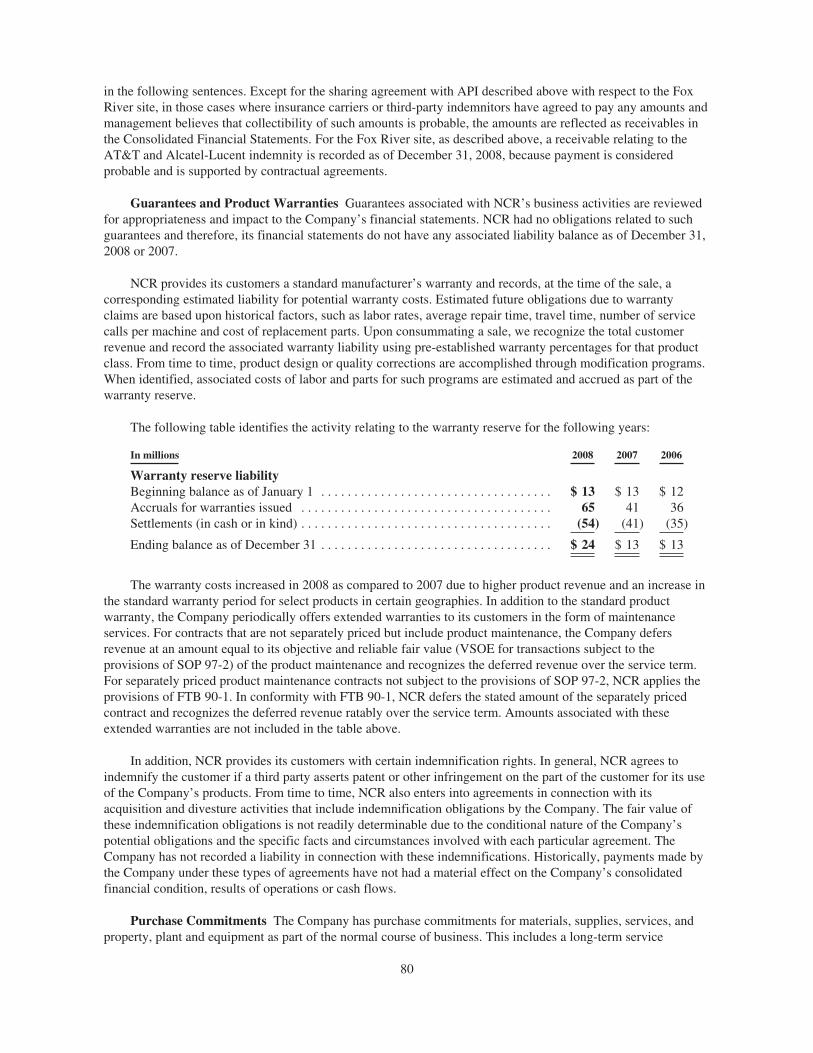
in the following sentences. Except for the sharing agreement with API described above with respect to the FoxRiver site, in those cases where insurance carriers or third-party indemnitors have agreed to pay any amounts andmanagement believes that collectibility of such amounts is probable, the amounts are reflected as receivables inthe Consolidated Financial Statements. For the Fox River site, as described above, a receivable relating to theAT&T and Alcatel-Lucent indemnity is recorded as of December 31, 2008, because payment is consideredprobable and is supported by contractual agreements.
Guarantees and Product Warranties Guarantees associated with NCR’s business activities are reviewedfor appropriateness and impact to the Company’s financial statements. NCR had no obligations related to suchguarantees and therefore, its financial statements do not have any associated liability balance as of December 31,2008 or 2007.
NCR provides its customers a standard manufacturer’s warranty and records, at the time of the sale, acorresponding estimated liability for potential warranty costs. Estimated future obligations due to warrantyclaims are based upon historical factors, such as labor rates, average repair time, travel time, number of servicecalls per machine and cost of replacement parts. Upon consummating a sale, we recognize the total customerrevenue and record the associated warranty liability using pre-established warranty percentages for that productclass. From time to time, product design or quality corrections are accomplished through modification programs.When identified, associated costs of labor and parts for such programs are estimated and accrued as part of thewarranty reserve.
The following table identifies the activity relating to the warranty reserve for the following years:
In millions 2008 2007 2006
Warranty reserve liabilityBeginning balance as of January 1 . . . . . . . . . . . . . . . . . . . . . . . . . . . . . . . . . . . $ 13 $ 13 $ 12Accruals for warranties issued . . . . . . . . . . . . . . . . . . . . . . . . . . . . . . . . . . . . . . 65 41 36Settlements (in cash or in kind) . . . . . . . . . . . . . . . . . . . . . . . . . . . . . . . . . . . . . . (54) (41) (35)
Ending balance as of December 31 . . . . . . . . . . . . . . . . . . . . . . . . . . . . . . . . . . . $ 24 $ 13 $ 13
The warranty costs increased in 2008 as compared to 2007 due to higher product revenue and an increase inthe standard warranty period for select products in certain geographies. In addition to the standard productwarranty, the Company periodically offers extended warranties to its customers in the form of maintenanceservices. For contracts that are not separately priced but include product maintenance, the Company defersrevenue at an amount equal to its objective and reliable fair value (VSOE for transactions subject to theprovisions of SOP 97-2) of the product maintenance and recognizes the deferred revenue over the service term.For separately priced product maintenance contracts not subject to the provisions of SOP 97-2, NCR applies theprovisions of FTB 90-1. In conformity with FTB 90-1, NCR defers the stated amount of the separately pricedcontract and recognizes the deferred revenue ratably over the service term. Amounts associated with theseextended warranties are not included in the table above.
In addition, NCR provides its customers with certain indemnification rights. In general, NCR agrees toindemnify the customer if a third party asserts patent or other infringement on the part of the customer for its useof the Company’s products. From time to time, NCR also enters into agreements in connection with itsacquisition and divesture activities that include indemnification obligations by the Company. The fair value ofthese indemnification obligations is not readily determinable due to the conditional nature of the Company’spotential obligations and the specific facts and circumstances involved with each particular agreement. TheCompany has not recorded a liability in connection with these indemnifications. Historically, payments made bythe Company under these types of agreements have not had a material effect on the Company’s consolidatedfinancial condition, results of operations or cash flows.
Purchase Commitments The Company has purchase commitments for materials, supplies, services, andproperty, plant and equipment as part of the normal course of business. This includes a long-term service
80
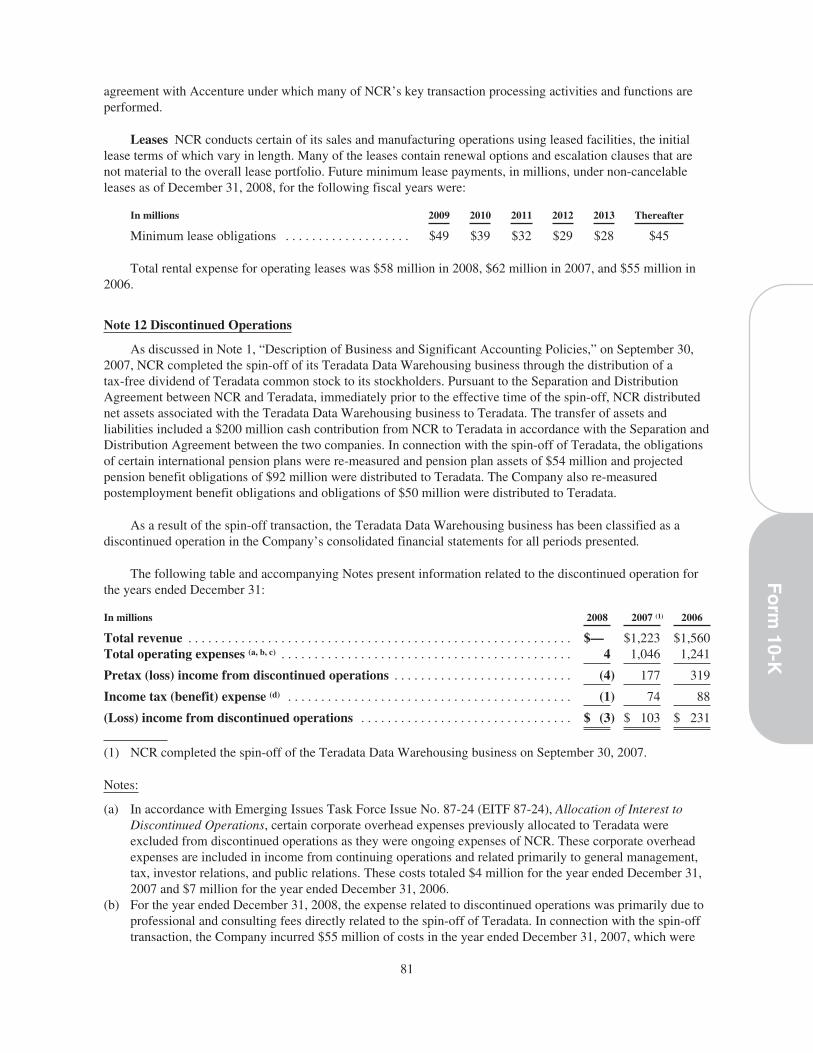
agreement with Accenture under which many of NCR’s key transaction processing activities and functions areperformed.
Leases NCR conducts certain of its sales and manufacturing operations using leased facilities, the initiallease terms of which vary in length. Many of the leases contain renewal options and escalation clauses that arenot material to the overall lease portfolio. Future minimum lease payments, in millions, under non-cancelableleases as of December 31, 2008, for the following fiscal years were:
In millions 2009 2010 2011 2012 2013 Thereafter
Minimum lease obligations . . . . . . . . . . . . . . . . . . . $49 $39 $32 $29 $28 $45
Total rental expense for operating leases was $58 million in 2008, $62 million in 2007, and $55 million in2006.
Note 12 Discontinued Operations
As discussed in Note 1, “Description of Business and Significant Accounting Policies,” on September 30,2007, NCR completed the spin-off of its Teradata Data Warehousing business through the distribution of atax-free dividend of Teradata common stock to its stockholders. Pursuant to the Separation and DistributionAgreement between NCR and Teradata, immediately prior to the effective time of the spin-off, NCR distributednet assets associated with the Teradata Data Warehousing business to Teradata. The transfer of assets andliabilities included a $200 million cash contribution from NCR to Teradata in accordance with the Separation andDistribution Agreement between the two companies. In connection with the spin-off of Teradata, the obligationsof certain international pension plans were re-measured and pension plan assets of $54 million and projectedpension benefit obligations of $92 million were distributed to Teradata. The Company also re-measuredpostemployment benefit obligations and obligations of $50 million were distributed to Teradata.
As a result of the spin-off transaction, the Teradata Data Warehousing business has been classified as adiscontinued operation in the Company’s consolidated financial statements for all periods presented.
The following table and accompanying Notes present information related to the discontinued operation forthe years ended December 31:
In millions 2008 2007 (1) 2006
Total revenue . . . . . . . . . . . . . . . . . . . . . . . . . . . . . . . . . . . . . . . . . . . . . . . . . . . . . . . . . . $— $1,223 $1,560Total operating expenses (a, b, c) . . . . . . . . . . . . . . . . . . . . . . . . . . . . . . . . . . . . . . . . . . . . 4 1,046 1,241
Pretax (loss) income from discontinued operations . . . . . . . . . . . . . . . . . . . . . . . . . . . (4) 177 319
Income tax (benefit) expense (d) . . . . . . . . . . . . . . . . . . . . . . . . . . . . . . . . . . . . . . . . . . . (1) 74 88
(Loss) income from discontinued operations . . . . . . . . . . . . . . . . . . . . . . . . . . . . . . . . $ (3) $ 103 $ 231
(1) NCR completed the spin-off of the Teradata Data Warehousing business on September 30, 2007.
Notes:
(a) In accordance with Emerging Issues Task Force Issue No. 87-24 (EITF 87-24), Allocation of Interest toDiscontinued Operations, certain corporate overhead expenses previously allocated to Teradata wereexcluded from discontinued operations as they were ongoing expenses of NCR. These corporate overheadexpenses are included in income from continuing operations and related primarily to general management,tax, investor relations, and public relations. These costs totaled $4 million for the year ended December 31,2007 and $7 million for the year ended December 31, 2006.
(b) For the year ended December 31, 2008, the expense related to discontinued operations was primarily due toprofessional and consulting fees directly related to the spin-off of Teradata. In connection with the spin-offtransaction, the Company incurred $55 million of costs in the year ended December 31, 2007, which were
81
Fo
rm10-K
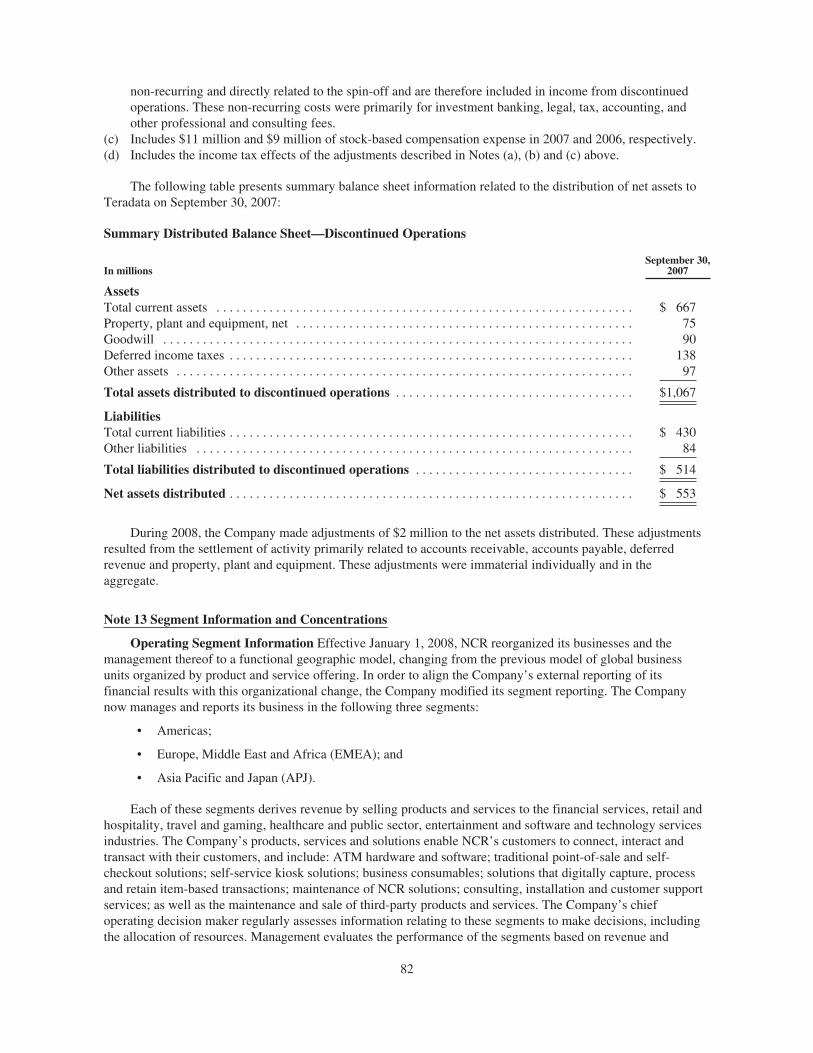
non-recurring and directly related to the spin-off and are therefore included in income from discontinuedoperations. These non-recurring costs were primarily for investment banking, legal, tax, accounting, andother professional and consulting fees.
(c) Includes $11 million and $9 million of stock-based compensation expense in 2007 and 2006, respectively.(d) Includes the income tax effects of the adjustments described in Notes (a), (b) and (c) above.
The following table presents summary balance sheet information related to the distribution of net assets toTeradata on September 30, 2007:
Summary Distributed Balance Sheet—Discontinued Operations
In millionsSeptember 30,
2007
AssetsTotal current assets . . . . . . . . . . . . . . . . . . . . . . . . . . . . . . . . . . . . . . . . . . . . . . . . . . . . . . . . . . . . . . . $ 667Property, plant and equipment, net . . . . . . . . . . . . . . . . . . . . . . . . . . . . . . . . . . . . . . . . . . . . . . . . . . . 75Goodwill . . . . . . . . . . . . . . . . . . . . . . . . . . . . . . . . . . . . . . . . . . . . . . . . . . . . . . . . . . . . . . . . . . . . . . . 90Deferred income taxes . . . . . . . . . . . . . . . . . . . . . . . . . . . . . . . . . . . . . . . . . . . . . . . . . . . . . . . . . . . . . 138Other assets . . . . . . . . . . . . . . . . . . . . . . . . . . . . . . . . . . . . . . . . . . . . . . . . . . . . . . . . . . . . . . . . . . . . . 97
Total assets distributed to discontinued operations . . . . . . . . . . . . . . . . . . . . . . . . . . . . . . . . . . . . $1,067
LiabilitiesTotal current liabilities . . . . . . . . . . . . . . . . . . . . . . . . . . . . . . . . . . . . . . . . . . . . . . . . . . . . . . . . . . . . . $ 430Other liabilities . . . . . . . . . . . . . . . . . . . . . . . . . . . . . . . . . . . . . . . . . . . . . . . . . . . . . . . . . . . . . . . . . . 84
Total liabilities distributed to discontinued operations . . . . . . . . . . . . . . . . . . . . . . . . . . . . . . . . . $ 514
Net assets distributed . . . . . . . . . . . . . . . . . . . . . . . . . . . . . . . . . . . . . . . . . . . . . . . . . . . . . . . . . . . . . $ 553
During 2008, the Company made adjustments of $2 million to the net assets distributed. These adjustmentsresulted from the settlement of activity primarily related to accounts receivable, accounts payable, deferredrevenue and property, plant and equipment. These adjustments were immaterial individually and in theaggregate.
Note 13 Segment Information and Concentrations
Operating Segment Information Effective January 1, 2008, NCR reorganized its businesses and themanagement thereof to a functional geographic model, changing from the previous model of global businessunits organized by product and service offering. In order to align the Company’s external reporting of itsfinancial results with this organizational change, the Company modified its segment reporting. The Companynow manages and reports its business in the following three segments:
• Americas;
• Europe, Middle East and Africa (EMEA); and
• Asia Pacific and Japan (APJ).
Each of these segments derives revenue by selling products and services to the financial services, retail andhospitality, travel and gaming, healthcare and public sector, entertainment and software and technology servicesindustries. The Company’s products, services and solutions enable NCR’s customers to connect, interact andtransact with their customers, and include: ATM hardware and software; traditional point-of-sale and self-checkout solutions; self-service kiosk solutions; business consumables; solutions that digitally capture, processand retain item-based transactions; maintenance of NCR solutions; consulting, installation and customer supportservices; as well as the maintenance and sale of third-party products and services. The Company’s chiefoperating decision maker regularly assesses information relating to these segments to make decisions, includingthe allocation of resources. Management evaluates the performance of the segments based on revenue and
82
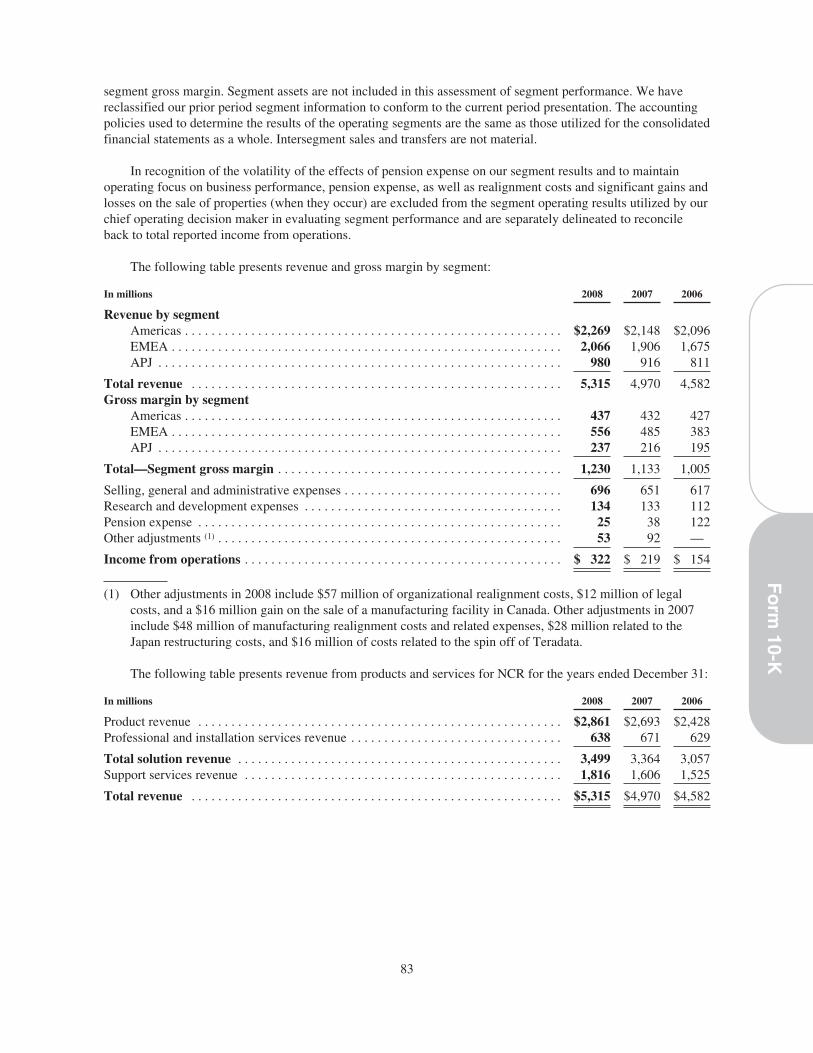
segment gross margin. Segment assets are not included in this assessment of segment performance. We havereclassified our prior period segment information to conform to the current period presentation. The accountingpolicies used to determine the results of the operating segments are the same as those utilized for the consolidatedfinancial statements as a whole. Intersegment sales and transfers are not material.
In recognition of the volatility of the effects of pension expense on our segment results and to maintainoperating focus on business performance, pension expense, as well as realignment costs and significant gains andlosses on the sale of properties (when they occur) are excluded from the segment operating results utilized by ourchief operating decision maker in evaluating segment performance and are separately delineated to reconcileback to total reported income from operations.
The following table presents revenue and gross margin by segment:
In millions 2008 2007 2006
Revenue by segmentAmericas . . . . . . . . . . . . . . . . . . . . . . . . . . . . . . . . . . . . . . . . . . . . . . . . . . . . . . . . . $2,269 $2,148 $2,096EMEA . . . . . . . . . . . . . . . . . . . . . . . . . . . . . . . . . . . . . . . . . . . . . . . . . . . . . . . . . . . 2,066 1,906 1,675APJ . . . . . . . . . . . . . . . . . . . . . . . . . . . . . . . . . . . . . . . . . . . . . . . . . . . . . . . . . . . . . 980 916 811
Total revenue . . . . . . . . . . . . . . . . . . . . . . . . . . . . . . . . . . . . . . . . . . . . . . . . . . . . . . . . 5,315 4,970 4,582Gross margin by segment
Americas . . . . . . . . . . . . . . . . . . . . . . . . . . . . . . . . . . . . . . . . . . . . . . . . . . . . . . . . . 437 432 427EMEA . . . . . . . . . . . . . . . . . . . . . . . . . . . . . . . . . . . . . . . . . . . . . . . . . . . . . . . . . . . 556 485 383APJ . . . . . . . . . . . . . . . . . . . . . . . . . . . . . . . . . . . . . . . . . . . . . . . . . . . . . . . . . . . . . 237 216 195
Total—Segment gross margin . . . . . . . . . . . . . . . . . . . . . . . . . . . . . . . . . . . . . . . . . . . 1,230 1,133 1,005
Selling, general and administrative expenses . . . . . . . . . . . . . . . . . . . . . . . . . . . . . . . . . 696 651 617Research and development expenses . . . . . . . . . . . . . . . . . . . . . . . . . . . . . . . . . . . . . . . 134 133 112Pension expense . . . . . . . . . . . . . . . . . . . . . . . . . . . . . . . . . . . . . . . . . . . . . . . . . . . . . . . 25 38 122Other adjustments (1) . . . . . . . . . . . . . . . . . . . . . . . . . . . . . . . . . . . . . . . . . . . . . . . . . . . . 53 92 —
Income from operations . . . . . . . . . . . . . . . . . . . . . . . . . . . . . . . . . . . . . . . . . . . . . . . . $ 322 $ 219 $ 154
(1) Other adjustments in 2008 include $57 million of organizational realignment costs, $12 million of legalcosts, and a $16 million gain on the sale of a manufacturing facility in Canada. Other adjustments in 2007include $48 million of manufacturing realignment costs and related expenses, $28 million related to theJapan restructuring costs, and $16 million of costs related to the spin off of Teradata.
The following table presents revenue from products and services for NCR for the years ended December 31:
In millions 2008 2007 2006
Product revenue . . . . . . . . . . . . . . . . . . . . . . . . . . . . . . . . . . . . . . . . . . . . . . . . . . . . . . . $2,861 $2,693 $2,428Professional and installation services revenue . . . . . . . . . . . . . . . . . . . . . . . . . . . . . . . . 638 671 629
Total solution revenue . . . . . . . . . . . . . . . . . . . . . . . . . . . . . . . . . . . . . . . . . . . . . . . . . 3,499 3,364 3,057Support services revenue . . . . . . . . . . . . . . . . . . . . . . . . . . . . . . . . . . . . . . . . . . . . . . . . 1,816 1,606 1,525
Total revenue . . . . . . . . . . . . . . . . . . . . . . . . . . . . . . . . . . . . . . . . . . . . . . . . . . . . . . . . $5,315 $4,970 $4,582
83
Fo
rm10-K
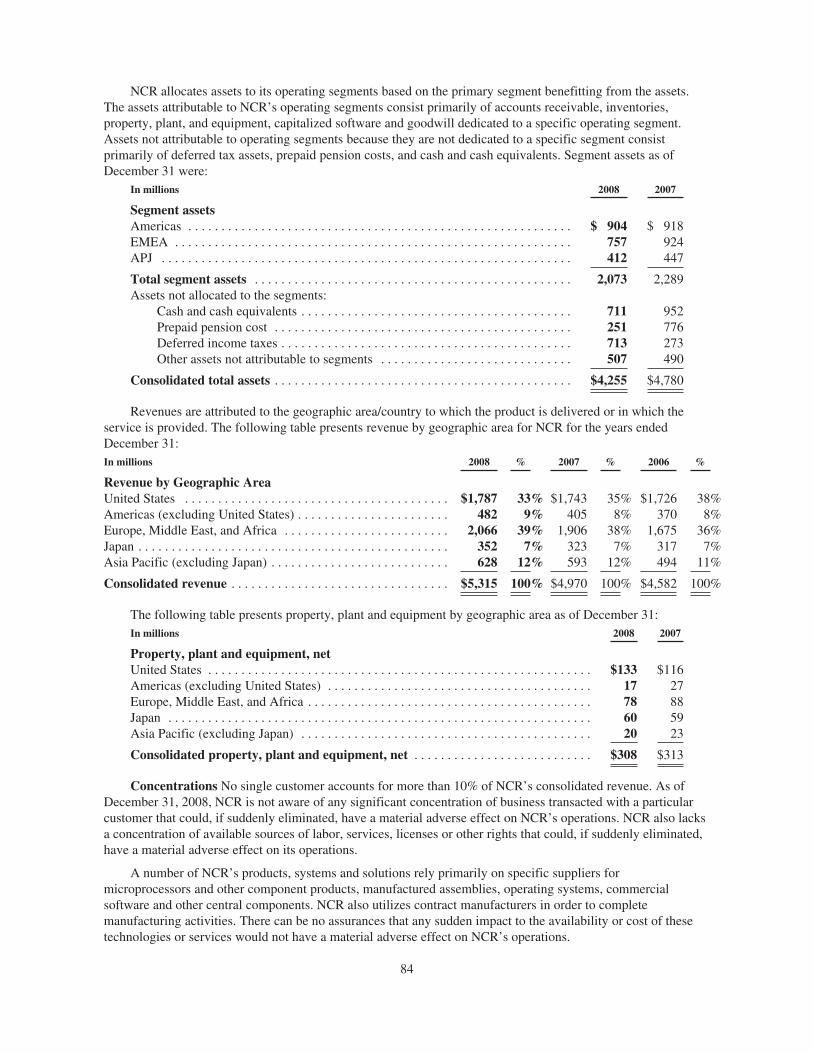
NCR allocates assets to its operating segments based on the primary segment benefitting from the assets.The assets attributable to NCR’s operating segments consist primarily of accounts receivable, inventories,property, plant, and equipment, capitalized software and goodwill dedicated to a specific operating segment.Assets not attributable to operating segments because they are not dedicated to a specific segment consistprimarily of deferred tax assets, prepaid pension costs, and cash and cash equivalents. Segment assets as ofDecember 31 were:
In millions 2008 2007
Segment assetsAmericas . . . . . . . . . . . . . . . . . . . . . . . . . . . . . . . . . . . . . . . . . . . . . . . . . . . . . . . . . . $ 904 $ 918EMEA . . . . . . . . . . . . . . . . . . . . . . . . . . . . . . . . . . . . . . . . . . . . . . . . . . . . . . . . . . . . 757 924APJ . . . . . . . . . . . . . . . . . . . . . . . . . . . . . . . . . . . . . . . . . . . . . . . . . . . . . . . . . . . . . . 412 447
Total segment assets . . . . . . . . . . . . . . . . . . . . . . . . . . . . . . . . . . . . . . . . . . . . . . . . 2,073 2,289Assets not allocated to the segments:
Cash and cash equivalents . . . . . . . . . . . . . . . . . . . . . . . . . . . . . . . . . . . . . . . . . 711 952Prepaid pension cost . . . . . . . . . . . . . . . . . . . . . . . . . . . . . . . . . . . . . . . . . . . . . 251 776Deferred income taxes . . . . . . . . . . . . . . . . . . . . . . . . . . . . . . . . . . . . . . . . . . . . 713 273Other assets not attributable to segments . . . . . . . . . . . . . . . . . . . . . . . . . . . . . 507 490
Consolidated total assets . . . . . . . . . . . . . . . . . . . . . . . . . . . . . . . . . . . . . . . . . . . . . $4,255 $4,780
Revenues are attributed to the geographic area/country to which the product is delivered or in which theservice is provided. The following table presents revenue by geographic area for NCR for the years endedDecember 31:In millions 2008 % 2007 % 2006 %
Revenue by Geographic AreaUnited States . . . . . . . . . . . . . . . . . . . . . . . . . . . . . . . . . . . . . . . . $1,787 33% $1,743 35% $1,726 38%Americas (excluding United States) . . . . . . . . . . . . . . . . . . . . . . . 482 9% 405 8% 370 8%Europe, Middle East, and Africa . . . . . . . . . . . . . . . . . . . . . . . . . 2,066 39% 1,906 38% 1,675 36%Japan . . . . . . . . . . . . . . . . . . . . . . . . . . . . . . . . . . . . . . . . . . . . . . . 352 7% 323 7% 317 7%Asia Pacific (excluding Japan) . . . . . . . . . . . . . . . . . . . . . . . . . . . 628 12% 593 12% 494 11%
Consolidated revenue . . . . . . . . . . . . . . . . . . . . . . . . . . . . . . . . . $5,315 100% $4,970 100% $4,582 100%
The following table presents property, plant and equipment by geographic area as of December 31:In millions 2008 2007
Property, plant and equipment, netUnited States . . . . . . . . . . . . . . . . . . . . . . . . . . . . . . . . . . . . . . . . . . . . . . . . . . . . . . . . . . $133 $116Americas (excluding United States) . . . . . . . . . . . . . . . . . . . . . . . . . . . . . . . . . . . . . . . . 17 27Europe, Middle East, and Africa . . . . . . . . . . . . . . . . . . . . . . . . . . . . . . . . . . . . . . . . . . . 78 88Japan . . . . . . . . . . . . . . . . . . . . . . . . . . . . . . . . . . . . . . . . . . . . . . . . . . . . . . . . . . . . . . . . 60 59Asia Pacific (excluding Japan) . . . . . . . . . . . . . . . . . . . . . . . . . . . . . . . . . . . . . . . . . . . . 20 23
Consolidated property, plant and equipment, net . . . . . . . . . . . . . . . . . . . . . . . . . . . $308 $313
Concentrations No single customer accounts for more than 10% of NCR’s consolidated revenue. As ofDecember 31, 2008, NCR is not aware of any significant concentration of business transacted with a particularcustomer that could, if suddenly eliminated, have a material adverse effect on NCR’s operations. NCR also lacksa concentration of available sources of labor, services, licenses or other rights that could, if suddenly eliminated,have a material adverse effect on its operations.
A number of NCR’s products, systems and solutions rely primarily on specific suppliers formicroprocessors and other component products, manufactured assemblies, operating systems, commercialsoftware and other central components. NCR also utilizes contract manufacturers in order to completemanufacturing activities. There can be no assurances that any sudden impact to the availability or cost of thesetechnologies or services would not have a material adverse effect on NCR’s operations.
84
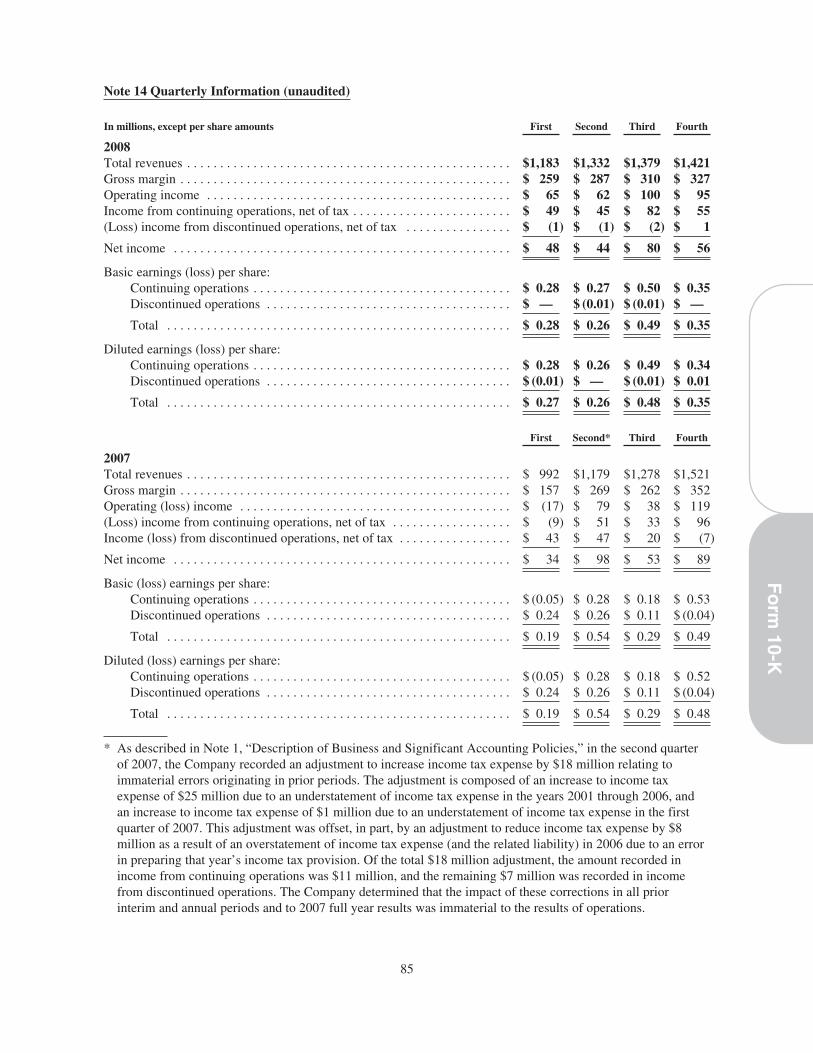
Note 14 Quarterly Information (unaudited)
In millions, except per share amounts First Second Third Fourth
2008Total revenues . . . . . . . . . . . . . . . . . . . . . . . . . . . . . . . . . . . . . . . . . . . . . . . . . $1,183 $1,332 $1,379 $1,421Gross margin . . . . . . . . . . . . . . . . . . . . . . . . . . . . . . . . . . . . . . . . . . . . . . . . . . $ 259 $ 287 $ 310 $ 327Operating income . . . . . . . . . . . . . . . . . . . . . . . . . . . . . . . . . . . . . . . . . . . . . . $ 65 $ 62 $ 100 $ 95Income from continuing operations, net of tax . . . . . . . . . . . . . . . . . . . . . . . . $ 49 $ 45 $ 82 $ 55(Loss) income from discontinued operations, net of tax . . . . . . . . . . . . . . . . $ (1) $ (1) $ (2) $ 1
Net income . . . . . . . . . . . . . . . . . . . . . . . . . . . . . . . . . . . . . . . . . . . . . . . . . . . $ 48 $ 44 $ 80 $ 56
Basic earnings (loss) per share:Continuing operations . . . . . . . . . . . . . . . . . . . . . . . . . . . . . . . . . . . . . . . $ 0.28 $ 0.27 $ 0.50 $ 0.35Discontinued operations . . . . . . . . . . . . . . . . . . . . . . . . . . . . . . . . . . . . . $ — $ (0.01) $ (0.01) $ —
Total . . . . . . . . . . . . . . . . . . . . . . . . . . . . . . . . . . . . . . . . . . . . . . . . . . . . $ 0.28 $ 0.26 $ 0.49 $ 0.35
Diluted earnings (loss) per share:Continuing operations . . . . . . . . . . . . . . . . . . . . . . . . . . . . . . . . . . . . . . . $ 0.28 $ 0.26 $ 0.49 $ 0.34Discontinued operations . . . . . . . . . . . . . . . . . . . . . . . . . . . . . . . . . . . . . $ (0.01) $ — $ (0.01) $ 0.01
Total . . . . . . . . . . . . . . . . . . . . . . . . . . . . . . . . . . . . . . . . . . . . . . . . . . . . $ 0.27 $ 0.26 $ 0.48 $ 0.35
First Second* Third Fourth
2007Total revenues . . . . . . . . . . . . . . . . . . . . . . . . . . . . . . . . . . . . . . . . . . . . . . . . . $ 992 $1,179 $1,278 $1,521Gross margin . . . . . . . . . . . . . . . . . . . . . . . . . . . . . . . . . . . . . . . . . . . . . . . . . . $ 157 $ 269 $ 262 $ 352Operating (loss) income . . . . . . . . . . . . . . . . . . . . . . . . . . . . . . . . . . . . . . . . . $ (17) $ 79 $ 38 $ 119(Loss) income from continuing operations, net of tax . . . . . . . . . . . . . . . . . . $ (9) $ 51 $ 33 $ 96Income (loss) from discontinued operations, net of tax . . . . . . . . . . . . . . . . . $ 43 $ 47 $ 20 $ (7)
Net income . . . . . . . . . . . . . . . . . . . . . . . . . . . . . . . . . . . . . . . . . . . . . . . . . . . $ 34 $ 98 $ 53 $ 89
Basic (loss) earnings per share:Continuing operations . . . . . . . . . . . . . . . . . . . . . . . . . . . . . . . . . . . . . . . $ (0.05) $ 0.28 $ 0.18 $ 0.53Discontinued operations . . . . . . . . . . . . . . . . . . . . . . . . . . . . . . . . . . . . . $ 0.24 $ 0.26 $ 0.11 $ (0.04)
Total . . . . . . . . . . . . . . . . . . . . . . . . . . . . . . . . . . . . . . . . . . . . . . . . . . . . $ 0.19 $ 0.54 $ 0.29 $ 0.49
Diluted (loss) earnings per share:Continuing operations . . . . . . . . . . . . . . . . . . . . . . . . . . . . . . . . . . . . . . . $ (0.05) $ 0.28 $ 0.18 $ 0.52Discontinued operations . . . . . . . . . . . . . . . . . . . . . . . . . . . . . . . . . . . . . $ 0.24 $ 0.26 $ 0.11 $ (0.04)
Total . . . . . . . . . . . . . . . . . . . . . . . . . . . . . . . . . . . . . . . . . . . . . . . . . . . . $ 0.19 $ 0.54 $ 0.29 $ 0.48
* As described in Note 1, “Description of Business and Significant Accounting Policies,” in the second quarterof 2007, the Company recorded an adjustment to increase income tax expense by $18 million relating toimmaterial errors originating in prior periods. The adjustment is composed of an increase to income taxexpense of $25 million due to an understatement of income tax expense in the years 2001 through 2006, andan increase to income tax expense of $1 million due to an understatement of income tax expense in the firstquarter of 2007. This adjustment was offset, in part, by an adjustment to reduce income tax expense by $8million as a result of an overstatement of income tax expense (and the related liability) in 2006 due to an errorin preparing that year’s income tax provision. Of the total $18 million adjustment, the amount recorded inincome from continuing operations was $11 million, and the remaining $7 million was recorded in incomefrom discontinued operations. The Company determined that the impact of these corrections in all priorinterim and annual periods and to 2007 full year results was immaterial to the results of operations.
85
Fo
rm10-K

Net income per share in each quarter is computed using the weighted-average number of shares outstandingduring that quarter while net income per share for the full year is computed using the weighted-average numberof shares outstanding during the year. Thus, the sum of the four quarters’ net income per share does not equal thefull-year net income per share.
86
Item 9. CHANGES IN AND DISAGREEMENTS WITH ACCOUNTANTS ON ACCOUNTING ANDFINANCIAL DISCLOSURE
None.
Item 9A. CONTROLS AND PROCEDURES
Evaluation of Disclosure Controls and Procedures
NCR has established disclosure controls and procedures (as defined in Rules 13a-15(e) and 15d-15(e) of theSecurities Exchange Act of 1934 (the Exchange Act)) to ensure that information required to be disclosed by NCRin the reports that it files or submits under the Exchange Act is recorded, processed, summarized and reported,within the time periods specified in the SEC’s rules and forms. Disclosure controls and procedures include,without limitation, controls and procedures designed to ensure that information required to be disclosed by NCRin the reports that it files or submits under the Exchange Act is accumulated and communicated to NCR’smanagement, including its Chief Executive and Chief Financial Officers, as appropriate to allow timely decisionsregarding required disclosure. Based on their evaluation as of the end of the period covered by this report,conducted under their supervision and with the participation of management, the Company’s Chief Executive andChief Financial Officers have concluded that NCR’s disclosure controls and procedures are effective to meetsuch objective and that NCR’s disclosure controls and procedures adequately alert them on a timely basis tomaterial information relating to the Company (including its consolidated subsidiaries) required to be included inNCR’s Exchange Act filings.
Changes in Internal Control over Financial Reporting
There have been no changes in our internal control over financial reporting that occurred during the lastfiscal quarter that have materially affected, or are reasonably likely to materially affect, our internal control overfinancial reporting.
Management’s Report on Internal Control over Financial Reporting
Management is responsible for establishing and maintaining effective internal control over financialreporting as defined in Rules 13a-15(f) and 15d-15(f) under the Exchange Act. The Company’s internal controlover financial reporting is a process designed to provide reasonable assurance regarding the reliability offinancial reporting and the preparation of financial statements for external purposes in accordance with generallyaccepted accounting principles. A company’s internal control over financial reporting includes those policies andprocedures that (i) pertain to the maintenance of records that, in reasonable detail, accurately and fairly reflect thetransactions and dispositions of the assets of the company; (ii) provide reasonable assurance that transactions arerecorded as necessary to permit preparation of financial statements in accordance with generally acceptedaccounting principles, and that receipts and expenditures of the company are being made only in accordance withauthorizations of management and directors of the Company; and (iii) provide reasonable assurance regardingprevention or timely detection of unauthorized acquisition, use, or disposition of the company’s assets that couldhave a material effect on the financial statements.
Because of its inherent limitations due to, for example, the potential for human error or circumvention ofcontrols, internal control over financial reporting may not prevent or detect misstatements. Also, projections ofany evaluation of effectiveness to future periods are subject to the risk that controls may become inadequatebecause of changes in conditions, or that the degree of compliance with the policies or procedures maydeteriorate.
The Company’s management assessed the effectiveness of the Company’s internal control over financialreporting as of December 31, 2008. In making this assessment, we used the criteria set forth by the Committee ofSponsoring Organizations of the Treadway Commission (COSO) in Internal Control–Integrated Framework.Based on our assessment, we determined that, as of December 31, 2008, the Company’s internal control overfinancial reporting was effective based on those criteria.
87
Fo
rm10-K
PricewaterhouseCoopers LLP, our independent registered public accounting firm, has audited theeffectiveness of the Company’s internal control over financial reporting as of December 31, 2008 as stated intheir report which appears in this Form 10-K.
/s/ WILLIAM NUTI /s/ ANTHONY MASSETTI
William Nuti Anthony MassettiChairman of the Board,
Chief Executive Officer and PresidentSenior Vice President and
Chief Financial Officer
Item 9B. OTHER INFORMATION
None.
88
PART III
Item 10. DIRECTORS, EXECUTIVE OFFICERS AND CORPORATE GOVERNANCE
Information required by this Item 10 with respect to directors of NCR is included in NCR’s Definitive ProxyStatement for its 2009 Annual Meeting of Stockholders to be filed with the Securities and Exchange Commissionwithin 120 days after the end of our fiscal 2008 year, and is incorporated herein by reference.
The Executive Officers of NCR (as of February 25, 2009) are as follows:
Name Age Position and Offices Held
William Nuti . . . . . . . . . . . . . . . 45 Chairman of the Board, Chief Executive Officer and PresidentJohn Bruno . . . . . . . . . . . . . . . . 44 Executive Vice President, Industry Solutions GroupDaniel Bogan . . . . . . . . . . . . . . 53 Senior Vice President and General Manager, NCR ConsumablesPeter Leav . . . . . . . . . . . . . . . . . 38 Senior Vice President, Worldwide SalesPeter Dorsman . . . . . . . . . . . . . . 53 Senior Vice President, Global Operations, and Chief Operations OfficerAndrea Ledford . . . . . . . . . . . . . 43 Senior Vice President, Human ResourcesPeter Lieb . . . . . . . . . . . . . . . . . 53 Senior Vice President, General Counsel and SecretaryAnthony Massetti . . . . . . . . . . . 49 Senior Vice President and Chief Financial OfficerChristine Wallace . . . . . . . . . . . 56 Senior Vice President, NCR Services
NCR’s Executive Officers
William Nuti is NCR’s Chairman of the Board, Chief Executive Officer and President. Mr. Nuti joined NCRon August 7, 2005 as its Chief Executive Officer and President, in addition to being named as a director of theCompany. Mr. Nuti became Chairman of the Board on October 1, 2007. Before joining NCR in August 2005,Mr. Nuti served as President and Chief Executive Officer of Symbol Technologies, Inc. (“SymbolTechnologies”), an information technology company, from December 2003 to August 2005. Prior to that, he wasChief Operating Officer of Symbol Technologies from July 2002 to December 2003. Mr. Nuti joined SymbolTechnologies in 2002 following 10 years at Cisco Systems, Inc. (“Cisco”) where he held positions of increasingresponsibility, advancing to the dual role of Senior Vice President of the company’s Worldwide Service ProviderOperations and U.S. Theater Operations. Prior to his Cisco experience, Mr. Nuti held sales and managementpositions at IBM, Netrix Corporation and Network Equipment Technologies. Mr. Nuti is also a director of SprintNextel Corporation. Mr. Nuti became a director of NCR on August 7, 2005.
John Bruno became Executive Vice President on November 29, 2008. Prior to joining NCR, Mr. Bruno wasa Managing Director at The Goldman Sachs Group, Inc. from August 2007 to November 2008. Prior to thisposition, he was Senior Vice President—General Manager, RFID Division, at Symbol Technologies from June2005 through February 22, 2006. Mr. Bruno was Symbol Technologies’ Senior Vice President, CorporateDevelopment, from May 2004 to June 2005, and was Symbol Technologies’ Senior Vice President, BusinessDevelopment, and Chief Information Officer, from November 2002 to May 2004. Prior to joining SymbolTechnologies’, Mr. Bruno served as Vice President, Technology Marketing, and Vice President, InformationTechnology, from June 2000 to November 2002 at Cisco.
Daniel Bogan became Senior Vice President and General Manager, Systemedia Division, now known asNCR Consumables, on January 1, 2008. Prior to assuming this position, he was Senior Vice President, RetailSolutions Division, from January 1, 2007 to December 31, 2007, and he had been Interim Senior Vice President,Retail Solutions Division, since April 26, 2006. Prior to this position, Mr. Bogan was Vice President, AmericasSales and Service, Retail Solutions Division, from September 2002 to April 26, 2006. Mr. Bogan joined NCR in1977.
Peter Leav became Senior Vice President, Worldwide Sales, on January 29, 2009. Prior to joining NCR, hewas Corporate Vice President and General Manager for Motorola, Inc., a provider of mobility products andsolutions across broadband and wireless networks, from November 2008 to January 2009, and Vice President andGeneral Manager for Motorola from December 2007 to November 2008. Prior to this position, Mr. Leav wasVice President of Sales for Motorola from December 2006 to December 2007. Prior to this position, Mr. Leavwas Director of Sales for Symbol Technologies from November 2004 to December 2006. Prior to this position,Mr. Leav was Regional Sales Manager at Cisco Systems, Inc., from July 2000 to November 2004.
89
Fo
rm10-K
Peter Dorsman became Senior Vice President, Global Operations, and Chief Operations Officer, onJanuary 1, 2008. Prior to assuming this position, he was Vice President and General Manager of NCR’sSystemedia Division from April 17, 2006 to December 31, 2007. Prior to joining NCR, Mr. Dorsman wasExecutive Vice President and Chief Operating Officer of Standard Register Co., a document services provider,from February 2000 to June 2004. Mr. Dorsman is a director of Applied Industrial Technologies Inc.
Andrea Ledford became Senior Vice President, Human Resources, on June 25, 2007. Ms. Ledford served asInterim Senior Vice President, Human Resources, from February 26, 2007 to June 24, 2007. Prior to assumingthis position, she was Vice President, Human Resources, Asia/Pacific, and Europe, Middle East and Africa, fromFebruary 2006 to February 2007. Before joining NCR in February 2006, Ms. Ledford was EMEA Leader,Human Resources, at Symbol Technologies, Inc., from 2002 to February 2006 and held a variety of leadershiproles at Cisco Systems, Inc. in EMEA, Asia/Pacific and Latin America.
Peter Lieb became NCR’s Senior Vice President, General Counsel and Secretary on May 29, 2006. Prior tojoining NCR, from October 2003 to February 2006, Mr. Lieb was Senior Vice President, General Counsel andSecretary at Symbol Technologies, Inc. From October 1997 to October 2003, he served in various senior legalpositions at International Paper Company, a global forest products, paper and packaging company, includingVice President and Deputy General Counsel.
Anthony Massetti joined NCR on January 28, 2008, as Senior Vice President and Chief Financial Officer.Prior to joining NCR, Mr. Massetti was Senior Vice President and Chief Financial Officer of QLogic Corp.(“QLogic”), a provider of networking storage and high-performance computing, from June 2005 to January 25,2008, and was Vice President and Chief Financial Officer from May 2004 to June 2005. From July 2002 to May2004, he was Vice President, Finance, at QLogic.
Christine Wallace became NCR’s Senior Vice President, Worldwide Customer Services Division, nowknown as NCR Services, in March 2006. Prior to her current position, Ms. Wallace was NCR’s Senior VicePresident, Human Resources from January 2004 until she assumed her current position. From 2001 until January2004, she was Vice President, Global Customer Services, Teradata Division. Ms. Wallace joined NCR in 1978.
Information regarding Section 16(a) beneficial ownership reporting compliance of the Company’s executiveofficers and directors is included in the material captioned “Section 16(a) Beneficial Ownership ReportingCompliance” in NCR’s Definitive Proxy Statement for its 2009 Annual Meeting of Stockholders to be filed withthe Securities and Exchange Commission within 120 days after the end of our fiscal 2008 year, and isincorporated herein by reference.
The information regarding the Company’s Audit Committee is included in the material captioned“Committees of the Board,” in NCR’s Definitive Proxy Statement for its 2009 Annual Meeting of Stockholdersto be filed with the Securities and Exchange Commission within 120 days after the end of our fiscal 2008 year,and is incorporated herein by reference. Information regarding NCR’s determination of an “audit committeefinancial expert” is included in the material captioned “Committees of the Board” in NCR’s Definitive ProxyStatement for its 2009 Annual Meeting of Stockholders to be filed with the Securities and Exchange Commissionwithin 120 days after the end of our fiscal 2008 year, and is incorporated herein by reference.
The Company has not materially changed the procedures by which stockholders may recommend nomineesto the Company’s Board of Directors.
The Company has a Code of Conduct that sets the standard for ethics and compliance for all of itsemployees. NCR’s Code of Conduct is filed as Exhibit 14 of this Form 10-K. The Company intends to discloseany amendments to or waivers of the Code of Conduct on behalf of the Executive Officers on the Company’sinvestor relations website at http://investor.ncr.com under the heading “Corporate Governance,” and on NCR’scorporate governance website at www.ncr.com/corpgovernance/corpgov_code_conduct.htm, promptly followingthe date of such amendment or waiver.
90

Item 11. EXECUTIVE COMPENSATION
The information regarding the Company’s compensation of its named executive officers is included in thematerial captioned “Executive Compensation” included in NCR’s Definitive Proxy Statement for its 2009Annual Meeting of Stockholders to be filed with the Securities and Exchange Commission within 120 days afterthe end of our fiscal 2008 year, and is incorporated herein by reference. The information regarding compensationcommittee interlocks and insider participation is included in the material captioned “Compensation and HumanResource Committee” included in NCR’s Definitive Proxy Statement for its 2009 Annual Meeting ofStockholders to be filed with the Securities and Exchange Commission within 120 days after the end of our fiscal2008 year and is incorporated herein by reference. The information regarding the compensation committee reportis included in the material captioned “Board Compensation and Human Resource Committee Report onExecutive Compensation” of NCR’s Definitive Proxy Statement for its 2009 Annual Meeting of Stockholders tobe filed with the Securities and Exchange Commission within 120 days after the end of our fiscal 2008 year, andis incorporated herein by reference.
Item 12. SECURITY OWNERSHIP OF CERTAIN BENEFICIAL OWNERS AND MANAGEMENTAND RELATED STOCKHOLDER MATTERS
Information regarding security ownership of certain beneficial owners and management is included in thematerial captioned “Stock Ownership” in NCR’s Definitive Proxy Statement for its 2009 Annual Meeting ofStockholders to be filed with the Securities and Exchange Commission within 120 days after the end of our fiscal2008 year, and is incorporated herein by reference.
Information regarding equity compensation plans is included in the material captioned “EquityCompensation Plan Information” in NCR’s Definitive Proxy Statement for its 2009 Annual Meeting ofStockholders to be filed with the Securities and Exchange Commission within 120 days after the end of our fiscal2008 year, and is incorporated herein by reference.
Item 13. CERTAIN RELATIONSHIPS AND RELATED TRANSACTIONS, AND DIRECTORINDEPENDENCE
The information described under the caption “Related Person Transactions” in NCR’s Definitive ProxyStatement for its 2009 Annual Meeting of Stockholders to be filed with the Securities and Exchange Commissionwithin 120 days after the end of our fiscal 2008 year, is incorporated herein by reference. The informationregarding director independence is included in the material captioned “Corporate Governance” in NCR’sDefinitive Proxy Statement for its 2009 Annual Meeting of Stockholders to be filed with the Securities andExchange Commission within 120 days after the end of our fiscal 2008 year, and is incorporated herein byreference.
Item 14. PRINCIPAL ACCOUNTANT FEES AND SERVICES
Information regarding fees paid to the Company’s independent registered public accounting firm is includedin the material captioned “Fees Paid to Independent Registered Public Accounting Firm” in NCR’s DefinitiveProxy Statement for its 2009 Annual Meeting of Stockholders to be filed with the Securities and ExchangeCommission within 120 days after the end of our fiscal 2008 year, and is incorporated herein by reference.
91
Fo
rm10-K
PART IV
Item 15. EXHIBITS, FINANCIAL STATEMENT SCHEDULES
(a) Index
1. Financial Statements: The consolidated financial statements of the Company and the Report ofIndependent Registered Public Accounting Firm as set forth in Part II, Item 8 of this Form 10-K report:
Page ofForm 10-K
Report of Independent Registered Public Accounting Firm . . . . . . . . . . . . . . . . . . . . . . . . . . . . . . . . . . 40Consolidated Statements of Operations for the years ended December 31, 2008, 2007 and 2006 . . . . . 41Consolidated Balance Sheets at December 31, 2008 and 2007 . . . . . . . . . . . . . . . . . . . . . . . . . . . . . . . . 42Consolidated Statements of Cash Flow for the years ended December 31, 2008, 2007 and 2006 . . . . . 43Consolidated Statements of Changes in Stockholders’ Equity for the years ended December 31, 2008,
2007 and 2006 . . . . . . . . . . . . . . . . . . . . . . . . . . . . . . . . . . . . . . . . . . . . . . . . . . . . . . . . . . . . . . . . . . . 44Notes to Consolidated Financial Statements . . . . . . . . . . . . . . . . . . . . . . . . . . . . . . . . . . . . . . . . . . . . . . 45
2. Financial Statement Schedule: Financial Statement Schedule II – Valuation and Qualifying Accounts isincluded in this Form 10-K report on page 98. All other schedules are not required under the related instructionsor are not applicable.
3. Exhibits: See Index of Exhibits below for a listing of all exhibits to this Form 10-K report.
(b) Exhibits identified in parentheses below, on file with the SEC, are incorporated herein by reference asexhibits hereto.
Exhibit No. Description
2.1 Separation and Distribution Agreement, dated as of August 27, 2007 between NCR Corporationand Teradata Corporation (Exhibit 2.1 to the Form 10 of Teradata Corporation (the “TeradataForm 10”)).
3.1 Articles of Amendment and Restatement of NCR Corporation, as amended May 14, 1999(Exhibit 3.1 to the NCR Corporation Form 10-Q for the period ended June 30, 1999).
3.2 Bylaws of NCR Corporation, as amended and restated on January 28, 2009 (Exhibit 3(ii) to theNCR Corporation Current Report on Form 8-K filed February 2, 2009).
4.1 Common Stock Certificate of NCR Corporation (Exhibit 4.1 to the NCR Corporation AnnualReport on Form 10-K for the year ended December 31, 1999 (the “1999 NCR Annual Report”)).
4.3 NCR Corporation hereby agrees to furnish the Securities and Exchange Commission, upon itsrequest, a copy of any instrument which defines the rights of holders of long-term debt of NCRCorporation and all of its subsidiaries for which consolidated or unconsolidated financialstatements are required to be filed, and which does not exceed 10% of the total assets of NCRCorporation and its subsidiaries on a consolidated basis.
4.4 Indenture, dated as of June 1, 2002, between NCR Corporation and The Bank of New York(Exhibit 3.2 to the NCR Corporation Quarterly Report on Form 10-Q for the period endedJune 30, 2002 (the “June 30, 2002 Quarterly Report”)).
4.5 Registration Rights Agreement, dated June 6, 2002, by and between NCR Corporation andSalomon Smith Barney Inc., Banc One Capital Markets, Inc., BNY Capital Markets, Inc., FleetSecurities, Inc., J.P. Morgan Securities Inc. and McDonald Investments Inc., relating to$300,000,000 principal amount of 7.125% senior Notes due 2009 (Exhibit 4.5 to the June 30,2002 Quarterly Report).
4.6(a-c) Terms of 7.125% Senior Notes due 2009, including the form of notes (Exhibit 4.6(a-c) to theJune 30, 2002 Quarterly Report).
92
Exhibit No. Description
10.1 Separation and Distribution Agreement, dated as of February 1, 1996 and amended and restatedas of March 29, 1996 (Exhibit 10.1 to the Lucent Technologies Inc. Registration Statement onForm S-1 (No. 333-00703) (the “Lucent Registration Statement”)).
10.2 Employee Benefits Agreement, dated as of November 20, 1996, by and between AT&T Corp.and NCR Corporation (Exhibit 10.2 to the 1996 NCR Annual Report).
10.3 Patent License Agreement, effective as of March 29, 1996, by and among AT&T Corp., NCRCorporation, and Lucent Technologies Inc. (Exhibit 10.7 to the Lucent Registration Statement).
10.4 Amended and Restated Technology License Agreement, effective as of March 29, 1996, by andamong AT&T Corp., NCR Corporation, and Lucent Technologies Inc. (Exhibit 10.8 to theLucent Registration Statement).
10.5 Tax Sharing Agreement, dated as of February 1, 1996, and amended and restated as of March 29,1996, by and among AT&T Corp., NCR Corporation, and Lucent Technologies Inc.(Exhibit 10.6 to the Lucent Registration Statement).
10.6 Purchase and Manufacturing Services Agreement effective as of January 19, 2007, between NCRCorporation and Solectron Corporation (now Flextronics International Ltd.) (incorporated byreference to Exhibit 10.6 to the Form 10-K/A for the fiscal year ended December 31, 2006, filedJune 4, 2008). Certain portions of this exhibit were granted confidential treatment by theSecurities and Exchange Commission on October 2, 2008.
10.7 Tax Sharing Agreement, dated as of September 21, 2007, between NCR Corporation andTeradata Corporation (Exhibit 10.1 to the Current Report on Form 8-K of NCR Corporationdated September 21, 2007 (the “September 21, 2007 Form 8-K”)).
10.8 Form of Interim Services and Systems Replication Agreement between NCR Corporation andTeradata Corporation (Exhibit 10.2 to the Teradata Form 10).
10.9 Employee Benefits Agreement, dated as of September 21, 2007, between NCR Corporation andTeradata Corporation (Exhibit 10.2 to the September 21, 2007 Form 8-K).
10.10 Form of Exclusive Patent License Agreement between NCR Corporation and Teradata US, Inc.(Exhibit 10.4 to the Teradata Form 10).
10.11 Form of Patent License Agreement between NCR Corporation and Teradata US, Inc.(Exhibit 10.5 to the Teradata Form 10).
10.12 Form of Technology Agreement between NCR Corporation and Teradata US, Inc.(Exhibit 10.6 to the Teradata Form 10).
10.13 Form of Master Agreement between NCR Corporation and Teradata Corporation for EnterpriseData Warehousing Sales and Support (Exhibit 10.16 to the Teradata Form 10).
10.14 Form of Network Support Agreement between NCR Corporation and Teradata Corporation(Exhibit 10.17 to the Teradata Form 10).
10.15 Form of Service Provider Agreement between NCR Corporation and Teradata Corporation(Exhibit 10.18 to the Teradata Form 10).
10.16 Form of Master Reseller Agreement for Middle East and Africa between NCR Corporation andTeradata Corporation (Exhibit 10.19 to the Teradata Form 10).
10.17 NCR Management Stock Plan (Exhibit 10.8 to the 1996 NCR Annual Report).
10.17.1 First Amendment to the NCR Management Stock Plan dated April 30, 2003 (Exhibit 10.4 to theNCR Corporation Quarterly Report on Form 10-Q for the quarter ended March 31, 2003).
10.17.2 Amendment to NCR Management Stock Plan effective as of December 31, 2008.
93
Fo
rm10-K

Exhibit No. Description
10.17.3 Form of Stock Option Agreement under the NCR Management Stock Plan (Exhibit 10.6.3 to theNCR Corporation Annual Report on Form 10-K for the year ended December 31, 2005 (the“2005 Annual Report”)).
10.17.4 Form of Restricted Stock Agreement under the NCR Management Stock Plan (Exhibit 10.6.4 tothe 2005 Annual Report).
10.18 NCR Corporation 2006 Stock Incentive Plan (Exhibit B to the Company’s Proxy Statement filedon March 10, 2006).
10.18.1 First Amendment to NCR Corporation 2006 Stock Incentive Plan dated October 9, 2006 (Exhibit10.5 to NCR Corporation’s Quarterly Report on Form 10-Q for the quarter ended September 30,2006).
10.18.2 NCR Corporation 2006 Stock Incentive Plan amended July 27, 2007 (Exhibit 10.2 to NCRCorporation’s Quarterly Report on Form 10-Q for the quarter ended June 30, 2007).
10.18.3 NCR Corporation 2006 Stock Incentive Plan, as amended and restated effective as of December31, 2008.
10.18.4 Form of 2008 Stock Option Agreement under the NCR Corporation 2006 Stock Incentive Plan(Exhibit 10.5 to the Current Report on Form 8-K filed February 19, 2008).
10.18.5 Form of 2008 Restricted Stock Agreement under the NCR Corporation 2006 Stock IncentivePlan (Exhibit 10.1 to the Current Report on Form 8-K filed February 19, 2008).
10.18.6 Form of 2008 Performance Based Restricted Stock Agreement under the NCR Corporation 2006Stock Incentive Plan (Exhibit 10.3 to the Current Report on Form 8-K filed February 19, 2008).
10.18.7 Form of 2008 Performance Based Restricted Stock Unit Agreement under the NCR Corporation2006 Stock Incentive Plan (Exhibit 10.4 to the Current Report on Form 8-K filed February 19,2008).
10.18.8 Form of 2008 Restricted Stock Unit Agreement under the NCR Corporation 2006 StockIncentive Plan (Exhibit 10.2 to the Current Report on Form 8-K filed February 19, 2008).
10.18.9 Form of 2009 Restricted Stock Agreement under 2006 Stock Incentive Plan (Exhibit 10.1 to theCurrent Report on Form 8-K filed December 16, 2008).
10.18.10 Form of 2009 Restricted Stock Unit Agreement under 2006 Stock Incentive Plan (Exhibit 10.2 tothe Current Report on Form 8-K filed December 16, 2008).
10.18.11 Form of 2009 Performance Based Restricted Stock Agreement under 2006 Stock Incentive Plan(Exhibit 10.3 to the Current Report on Form 8-K filed December 16, 2008).
10.18.12 Form of 2009 Performance Based Restricted Stock Unit Agreement under 2006 Stock IncentivePlan (Exhibit 10.4 to the Current Report on Form 8-K filed December 16, 2008).
10.18.13 Form of 2009 Stock Option Agreement under 2006 Stock Incentive Plan (Exhibit 10.5 to theCurrent Report on Form 8-K filed December 16, 2008).
10.19 NCR Management Incentive Program for Executive Officers (Exhibit 10.19 to the 1996 AnnualReport).
10.20 NCR Management Incentive Plan (Exhibit A to the Company’s Proxy Statement filed on March10, 2006).
10.21 NCR Director Compensation Program effective April 22, 2008 (incorporated by reference toExhibit 10.7 to NCR Corporation’s Quarterly Report on Form 10-Q for the quarter endedMarch 31, 2008 (the “First Quarter 2008 Form 10-Q”)
10.21.1 2008 Director Option Grant Statement under the NCR Director Compensation Program(incorporated by reference to Exhibit 10.8 to the First Quarter 2008 Form 10-Q).
94
Exhibit No. Description
10.21.2 2008 Director Restricted Stock Unit Grant Statement under the NCR Director CompensationProgram (incorporated by reference to Exhibit 10.9 to the First Quarter 2008 Form 10-Q).
10.22 The Retirement Plan for Officers of NCR (Exhibit 10.11 to the NCR Corporation RegistrationStatement on Form 10 (No. 001-00395), dated November 25, 1996 (the “NCR RegistrationStatement”)).
10.22.1 Second Amendment to the Retirement Plan for Officers of NCR Corporation effective January 1,2001 (Exhibit 10.1 to the NCR Corporation Quarterly Report on Form 10-Q for the quarter endedSeptember 30, 2001).
10.22.2 Third Amendment to the Retirement Plan for Officers of NCR Corporation effective June 1, 2002(Exhibit 10.8.3 to the NCR Corporation Annual Report on Form 10-K for the year endedDecember 31, 2002 (the “2002 Annual Report”)).
10.22.3 Fourth Amendment to the Retirement Plan for Officers of NCR effective January 1, 2006(Exhibit 10.7.4 to the 2005 Annual Report).
10.22.4 Fifth Amendment to the Retirement Plan for Officers of NCR effective December 31, 2006(Exhibit 10.13.4 to the NCR Corporation Annual Report on Form 10-K for the year endedDecember 31, 2006).
10.22.5 The Retirement Plan for Officers of NCR, Amended and Restated effective December 31, 2008.
10.23 NCR Officer Plan effective June 1, 2002 (Exhibit 10.9 to the 2002 Annual Report).
10.23.1 First Amendment to the NCR Officer Plan, executed December 17, 2004 (Exhibit 10.1 to theCurrent Report on Form 8-K dated December 17, 2004).
10.23.2 Second Amendment to the NCR Officer Plan effective January 1, 2006 (Exhibit 10.8.2 to the2005 Annual Report).
10.23.3 Third Amendment to the NCR Officer Plan effective December 31, 2006 (Exhibit 10.14.3 to theNCR Corporation Annual Report on Form 10-K for the year ended December 31, 2006).
10.23.4 Fourth Amendment to the NCR Officer Plan effective January 1, 2008 (Exhibit 10.23.4 to theNCR Corporation Annual Report on Form 10-K for the year ended December 31, 2007).
10.23.5 NCR Officer Plan, Amended and Restated effective December 31, 2008.
10.24 NCR Change in Control Severance Plan, dated December 13, 2005 and effective January 1, 2006(Exhibit 10.1 to the Current Report on Form 8-K filed December 19, 2005).
10.24.1 First Amendment to the NCR Change in Control Severance Plan (Exhibit 10.15.1 to the NCRCorporation Annual Report on Form 10-K for the year ended December 31, 2006).
10.24.2 Amended and Restated NCR Change in Control Severance Plan effective December 31, 2008.
10.25 NCR Supplemental Pension Plan for AT&T Transfers, restated effective January 1, 1997(Exhibit 10.1 to the NCR Corporation Quarterly Report on Form 10-Q for the quarter endedMarch 31, 1998 (the “March 31, 1998 Quarterly Report”)).
10.25.1 First Amendment to the NCR Supplemental Pension Plan for AT&T Transfers effectiveJanuary 1, 2006 (Exhibit 10.12.1 to the 2005 Annual Report).
10.25.2 Second Amendment to the NCR Supplemental Pension Plan for AT&T Transfers effectiveDecember 31, 2006 (Exhibit 10.16.2 to the NCR Corporation Annual Report on Form 10-K forthe year ended December 31, 2006).
10.25.3 NCR Supplemental Pension Plan for AT&T Transfers, Amended and Restated effectiveDecember 31, 2008.
95
Fo
rm10-K
Exhibit No. Description
10.26 NCR Mid-Career Hire Supplemental Pension Plan, restated effective January 1, 1997(Exhibit 10.2 to the March 31, 1998 Quarterly Report).
10.26.1 Amendment to the Mid-Career Hire Supplemental Pension Plan effective June 1, 2002(Exhibit 10.15.2 to the 2002 Annual Report).
10.26.2 Second Amendment to the NCR Mid-Career Hire Supplemental Pension Plan effectiveJanuary 1, 2006 (Exhibit 10.13.3 to the 2005 Annual Report).
10.26.3 Third Amendment to the NCR Mid-Career Hire Supplemental Pension Plan effectiveDecember 31, 2006 (Exhibit 10.17.3 to the NCR Corporation Annual Report on Form 10-K forthe year ended December 31, 2006).
10.26.4 NCR Mid-Career Hire Supplemental Pension Plan, Amended and Restated effectiveDecember 31, 2008.
10.27 NCR Nonqualified Excess Plan, restated effective January 1, 1996 (Exhibit 10.3 to the March 31,1998 Quarterly Report).
10.27.1 First Amendment to the NCR Nonqualified Excess Plan, executed December 17, 2004(Exhibit 10.2 to the Current Report on Form 8-K dated December 17, 2004).
10.27.2 Second Amendment to the NCR Nonqualified Excess Plan effective January 1, 2006(Exhibit 10.14.2 to the 2005 Annual Report).
10.27.3 Third Amendment to the NCR Nonqualified Excess Plan effective December 31, 2006(Exhibit 10.18.3 to the NCR Corporation Annual Report on Form 10-K for the year endedDecember 31, 2006).
10.27.4 Fourth Amendment to the NCR Nonqualified Excess Plan (Exhibit 10.11 to the NCRCorporation Quarterly Report on Form 10-Q for the quarter ended March 31, 2007).
10.27.5 Fifth Amendment to the NCR Nonqualified Excess Plan (Exhibit 10.1 to the NCR CorporationQuarterly Report on Form 10-Q for the quarter ended June 30, 2007).
10.27.6 Amended and Restated NCR Nonqualified Excess Plan, effective December 31, 2008.
10.28 NCR Change-In-Control Severance Plan for Key At-Risk Employees adopted effectiveJanuary 1, 2003 (Exhibit 10.17 to the 2002 Annual Report).
10.29 Purchase Agreement, dated June 6, 2002, by and between NCR Corporation and Salomon SmithBarney Inc., Banc One Capital Markets, Inc., BNY Capital Markets, Inc., Fleet Securities, Inc.,J.P. Morgan Securities Inc. and McDonald Investments Inc., relating to $300,000,000 principalamount of 7.125% Senior Notes due 2009 (Exhibit 10.1 to the June 30, 2002 Quarterly Report).
10.30 Employment Agreement with William Nuti, dated July 29, 2005 (Exhibit 10.1 to the NCRCorporation Current Report on Form 8-K filed August 2, 2005).
10.30.1 Letter agreement dated July 26, 2006 with William Nuti (Exhibit 10.4 to the NCR CorporationCurrent Report on Form 8-K filed July 27, 2006).
10.30.2 Second Amendment effective as of December 12, 2008 to Letter Agreement with William Nutidated July 29, 2005, as amended July 26, 2006.
10.31 Letter Agreement with Malcolm Collins dated February 5, 2006 (Exhibit 10.1 to the NCRCorporation Current Report on Form 8-K filed February 9, 2006).
10.31.1 Compromise Agreement between NCR Limited and Malcolm Collins dated January 27, 2009.
10.32 Letter Agreement with Peter Lieb effective May 29, 2006 (Exhibit 10.2 to the NCR CorporationCurrent Report on Form 8-K filed June 1, 2006).
96
Exhibit No. Description
10.32.1 First Amendment effective as of December 12, 2008 to Letter Agreement dated May 24, 2006between NCR Corporation and Peter Lieb.
10.33 Letter Agreement dated November 19, 2007 between NCR Corporation and Anthony J. Massetti(Exhibit 10.1 to the NCR Corporation Current Report on Form 8-K dated November 20, 2007).
10.33.1 First Amendment dated December 18, 2008 to Letter Agreement dated November 19, 2007between NCR Corporation and Anthony Massetti.
14 Code of conduct for associates for NCR Corporation (Exhibit 14 to the NCR CorporationAnnual Report on Form 10-K for the year ended December 31, 2007).
21 Subsidiaries of NCR Corporation.
23.1 Consent of Independent Registered Public Accounting Firm.
31.1 Certification pursuant to 18 U.S.C. Section 1350 as adopted pursuant to Section 302 of theSarbanes-Oxley Act of 2002 dated February 23, 2009.
31.2 Certification pursuant to 18 U.S.C. Section 1350 as adopted pursuant to Section 302 of theSarbanes-Oxley Act of 2002 dated February 23, 2009.
32 Certification pursuant to 18 U.S.C. Section 1350 as adopted pursuant to Section 906 of theSarbanes-Oxley Act of 2002 dated February 23, 2009.
99.1 Tax Opinion of Wachtell, Lipton, Rosen & Katz in connection with the Spin off of Teradata,dated August 27, 2007 (Exhibit 99.2 to the Current Report on Form 8-K of NCR Corporationdated September 30, 2007).
99.2 Presentation of the Company dated December 4, 2008 (Exhibit 99.1 the NCR CorporationCurrent Report on Form 8-K dated December 4, 2008).
97
Fo
rm10-K

NCR Corporation
SCHEDULE II—VALUATION AND QUALIFYING ACCOUNTS(In millions)
Column A Column B Column C Column D Column E
Description
Balance atBeginning of
Period
Additions
Deductions
Balance atEnd ofPeriod
Charged toCosts &
Expenses
Charged toOther
Accounts
Year Ended December 31, 2008Allowance for doubtful accounts . . . . . . . . . . $ 19 $ 3 $— $ 7 $ 15Deferred tax asset valuation allowance . . . . . . $441 $ 37 $— $— $478Inventory excess and obsolete reserves . . . . . . $147 $115 $— $151 $111Reserves related to business restructuring . . . $ 25 $ 57 $ (2) $ 49 $ 31
Year Ended December 31, 2007Allowance for doubtful accounts . . . . . . . . . . $ 18(a) $ 5 $— $ 4 $ 19Deferred tax asset valuation allowance . . . . . . $686(a) $— $— $245 $441Inventory excess and obsolete reserves . . . . . . $206(a) $127 $— $186 $147Reserves related to business restructuring . . . $ 6(a) $ 70 $ 1 $ 52 $ 25
Year Ended December 31, 2006Allowance for doubtful accounts . . . . . . . . . . $ 25 $ 4 $— $ 6 $ 23Deferred tax asset valuation allowance . . . . . . $634 $ 54 $— $— $688Inventory excess and obsolete reserves . . . . . . $257 $104 $— $137 $224Reserves related to business restructuring . . . $ 8 $ 1 $— $ 3 $ 6
(a) The beginning balance as of January 1, 2007 excludes the amounts allocated to the Teradata DataWarehousing business as it was spun-off on September 30, 2007.
98
SIGNATURES
Pursuant to the requirements of Section 13 or 15 (d) of the Securities Exchange Act of 1934, the registranthas duly caused this report to be signed on its behalf by the undersigned, thereunto duly authorized.
NCR CORPORATIONDate: February 25, 2009
By: /s/ ANTHONY MASSETTI
Anthony MassettiSenior Vice President and Chief Financial Officer
Pursuant to the requirements of the Securities Exchange Act of 1934, this report has been signed below bythe following persons on behalf of the registrant and in the capacities and on the date indicated.
Signature Title
/s/ WILLIAM NUTI
William Nuti
Chairman of the Board of Directors,Chief Executive Officer and President
/s/ ANTHONY MASSETTI
Anthony Massetti
Senior Vice President and Chief Financial Officer(Principal Financial and Accounting Officer)
/s/ LINDA FAYNE LEVINSON
Linda Fayne Levinson
Director
/s/ EDWARD P. BOYKIN
Edward P. Boykin
Director
/s/ GARY DAICHENDT
Gary Daichendt
Director
/s/ MARK P. FRISSORA
Mark P. Frissora
Director
/s/ C.K. PRAHALAD
C.K. Prahalad
Director
/s/ RICHARD L. CLEMMER
Richard L. Clemmer
Director
/s/ ROBERT P. DERODES
Robert P. DeRodes
Director
/s/ QUINCY ALLEN
Quincy Allen
Director
Date: February 25, 2009
99
Fo
rm10-K

[THIS PAGE INTENTIONALLY LEFT BLANK]
NCR Corporation (NYSE: NCR) is a global
technology company leading how the
world connects, interacts and transacts
with business. NCR’s assisted- and self-service
solutions and comprehensive support
services address the needs of retail, fi nancial,
travel, healthcare, hospitality, entertainment,
gaming and public sector organizations in
more than 100 countries. NCR (www.ncr.com)
is headquartered in Dayton, Ohio.
04 05 06 07 08
Income from
Continuing Operations
$28m
$120
m
$154
m
$219
m
$322
m
04 05 06 07 08
Revenue from
Continuing Operations
$4,6
35m
$4,5
61m
$4,5
82m
$4,9
70m
$5,3
15m Corporate Information
ANNUAL MEETING OF STOCKHOLDERS
Stockholders are invited to attend NCR’s Annual Meeting of Stockholders at 9:00 a.m. on April 22, 2009, to be held at:
The Millenium Hilton55 Church StreetNew York, New York 10007
STOCKHOLDER ACCOUNT INQUIRIES
Inquiries concerning stockholder accounts or NCR’s Direct Stock Purchase/Sell Program should be directed to:
NCR Corporationc/o BNY Mellon Shareowner ServicesP.O. Box 358015 Pittsburgh, PA 15252-8015
or
500 Ross Street, Floor 6Pittsburgh, PA 15262Ph. 800-NCR-2303 (800-627-2303)Ph. 201-680-6578 (Outside the U.S.)website address: www.bnymellon.com/shareowner/isd
NCR ANNUAL REPORT ON FORM 10-K
The Company’s annual report fi led with the U.S. Securities and Exchange Commission (SEC) on Form 10-K for current and prior years can be accessed via the “Investor” page of NCR’s website at www.ncr.com.
COMPANY INFORMATION
Information requests for NCR’s SEC fi lings, annual report on Form 10-K, quarterly reports and other fi nancial information can be obtained without charge by writing or calling:
NCR Investor Relations1700 S. Patterson Blvd. Dayton, OH 45479Ph. [email protected]://investor.ncr.com
Stockholders can help NCR reduce printing and mailing costs by viewing NCR’s annual reports and proxy statements online as instructed on the Notice of Internet Availability of Proxy Materials (the “Notice”) that we will send to you. If you would like a paper copy you may request one at no cost to you as instructed in the Notice.
CEO AND CFO CERTIFICATIONS
In 2008, the Company’s CEO provided the New York Stock Exchange (NYSE) with the annual CEO certifi cation regarding NCR’s compliance with the NYSE’s corporate governance listing standards. In addition, the Company’s CEO and CFO fi led with the SEC all required certifi cations regarding the quality of NCR’s public disclosures in its fi scal 2008 periodic reports.
NCR’s EXECUTIVE OFFICERS
William R. NutiChairman of the Board, Chief Executive Offi cer (CEO), and President
Anthony J. MassettiSenior Vice President and Chief Financial Offi cer (CFO)
Daniel T. BoganSenior Vice President and General Manager, NCR Consumables
John BrunoExecutive Vice President, Industry Solutions Group
Peter A. DorsmanSenior Vice President, Global Operations, and Chief Operations Offi cer
Peter LeavSenior Vice President, Worldwide Sales
Andrea L. LedfordSenior Vice President, Human Resources
Peter M. LiebSenior Vice President, General Counsel and Secretary
Christine W. WallaceSenior Vice President, NCR Services
NCR’s BOARD OF DIRECTORS
William R. Nuti Chairman of the Board, NCR Corporation
Quincy L. Allen President, Global Business and Strategic Marketing Group, Xerox Corporation
Edward P. BoykinFormer President and Chief Operating Offi cer, Computer Sciences Corporation
Richard L. ClemmerPresident and Chief Executive Offi cer, NXP B.V.
Gary J. DaichendtFormer President and Chief Operating Offi cer, Nortel Networks Corporation
Robert P. DeRodesChief Technology Offi cer, First Data Corporation
Mark P. FrissoraChairman and CEO, The Hertz Corporation
Linda Fayne LevinsonChair of the Board, Connexus Corporation
C.K. PrahaladProfessor of Business Administration, The University of MichiganDesign: Mizrahi, Inc. (www.mizrahionline.com)
Printing: RR Donnelley (www.rrdonnelley.com)
0794_covC4.indd 20794_covC4.indd 2 3/4/09 1:55:32 PM3/4/09 1:55:32 PM
NC
R C
orp
ora
tion
Pro
xy Statemen
t for th
e 20
09
An
nu
al Meetin
g o
f Stockh
old
ers and
20
08
An
nu
al Rep
ort
Experience a new world of interaction
NCR Corporation
1700 S. Patterson Blvd.Dayton, OH 45479www.ncr.com
SP10048 Proxy Statement for the 2009 Annual Meeting of Stockholders and 2008 Annual ReportCert no. SCS-COC-00648
0794_covC4.indd 10794_covC4.indd 1 3/4/09 1:55:09 PM3/4/09 1:55:09 PM