nb distressed debt investment fund · pdf filenb distressed debt investment fund limited july...
TRANSCRIPT

NB Distressed Debt Investment Fund Limited July 2010
For Professional Client Use Only

www.nbddif.com
Table of ContentsAgenda
I. Introduction
II. Market Opportunity
III. Our Investment Process
IV. NB Distressed Debt Investment Fund Limited – Product Features
_____________________________________________________________________________________
Appendix
A. Disclaimer

Introduction
www.nbddif.com
Age 49 22 years investment experience Previous firms include Newberry Capital, Ritchie
Capital, Strategic Value Partners, Moore Strategic Value Partners and Bank of America
Portfolio Managers
Michael Holmberg
Age 40 18 years investment experience Previous firms include DDJ Capital, Putnam
Investments, UBS and JP Morgan Chase
Patrick Flynn
Introduction
1

www.nbddif.com
Introduction
Fund targeting total returns (income and capital) of 20% per annum1
Focus on senior debt backed by hard assets to attempt to limit downside risk
Fixed Life Fund with three year investment period
Traded on London Stock Exchange2 and Channel Islands Stock Exchange
Daily NAV publication
Highly experienced portfolio management team
Large research teams to capture opportunities across multiple sectors
Increased supply and rising default rates have created what the Directors and Investment Managers believe is a compelling investment opportunity
Introduction
___________________________1. Gross of fees and expenses.2. Specialist Fund Market.
2

www.nbddif.com
Neuberger Berman – Overview
Headquartered in New York with European headquarters in London
Established in 1939
Approximately $173 billion in assets under management
1,600 employees worldwide
Leaders in Fixed Income management with over $70 billion in assets under management
Strong breadth and depth of research platform
A privately held, independent, employee-controlled asset management firmIntroduction
___________________________As at December 31, 2009.
3

www.nbddif.com
Distressed Strategies Overview
Control / Private Equity
Deep management bench required
Loan servicing capacity required for large loan portfolio acquisitions
Attractive universe of opportunities
Junior DebtSub / Mezz / Equity
Aggressive debt strategy Typically create equity through
restructuring Potential for lower recoveries in
this credit cycle due to high leverage levels of LBO deals will limit opportunities
Higher risk of cram-down
Senior / Senior Secured Debt
Conservative debt strategy Ability to foreclose on assets
and drive restructuring process More likely to receive equity in
this credit cycle Attractive universe of
opportunities
Capital Structure Arbitrage
Market neutral (long/short) Focused on relative mispricings
between securities within a given capital structure
Event driven strategy Attractive universe of
opportunities
Typical fund life 10 years 7.5 years Up to 6 years Rolling Redemptions
Typical Characteristics/
current opportunity
Distressed public and private companies
Large loan pools Bankrupt companies, affiliates
and assets Control debt positions
Junior tranches of corporate and middle-market LBO debt
Control debt positions
Senior and senior secured debt with strong collateral value and structural protection
Control and non-control debt positions
Long bank debt / short bonds Long bonds / short equity Derivatives Non-control positions
Typicalinvestments
Typicalinvestment
holding period4-8 years 6 months - 4 years 6 months - 3 years Up to 2 years
Less Conservative More ConservativeRisk Spectrum
Introduction
4

Market Opportunity

www.nbddif.com
The Distressed Debt Opportunity
Strong distressed debt investment performance has historically followed periods when a large number of companies have failed to meet their debt obligations.– U.S. bond default were at the highest level in 25 years during 20091
We expect default rates for leveraged loans to accelerate again from 2011, as a large quantity of these loans start to mature. We believe that the expected reduced demand for loans should lead to a rise in defaults.– 85% of leveraged loans originated during the 2005 – 2007 period will mature through 20142
– This may present a second wave of investment opportunities from 2011 to 2014
Many large corporate borrowers have been able to address looming maturities through methods unavailable to middle market issuers in 2009 and 2010– Middle market default rates continue to accelerate as large corporate defaults decline3
– The Investment Managers expect that many middle market issuers will be left vulnerable to default
The Investment Managers believe there are compelling reasons why the investment opportunity for distressed debt will continue for the next three to four years
Market Opportunity
___________________________1. Moody’s Investor Service report – January 29, 2010.2. Credit Suisse - March 2, 2010.3. Please see graph on page 7.
5

www.nbddif.com
$0
$20
$40
$60
$80
$100
$120
$140
$160
$180
$200
1998 1999 2000 2001 2002 2003 2004 2005 2006 2007 2008 2009
Def
ault
Vol
ume
($bn
)
High Yield Bonds Leveraged Loans
High Yield and Leveraged Loan Default Volumes1,2
Accelerating supply provides a compelling investment opportunity
Accelerating Defaults
___________________________Source: JP Morgan and S&P LCD.1. Includes North American actual defaults and grace period defaults.2. As of December 31, 2009.
Market Opportunity
$8.6
$25.2
$35.4
$64.1$63.5
$27.9
$10.1
$28.8
$8.5 $4.4
$49.1
$184.0
6

www.nbddif.com
Middle Market Default Rates Continue to Accelerate
___________________________Source: S&P LCD. 1. S&P LCD default rates, as of March 31, 2010. 2. Represents the percentage of defaulted loans by volume over the prior twelve month period.
Default Rates for Large Corporate and Middle Market Loans1,2
Market Opportunity
Middle market default rates continue to accelerate as large corporate defaults decline
0
2
4
6
8
10
12
14
2007 2008 2009 2010
Default Rate (% )
Large Corporate Middle Market
S&P / LCD Current Rate of Default
• Middle Market – 12.37%
• Large Corporate – 5.59%
7

www.nbddif.com
Institutional Leveraged Loan Maturities
Wall of Maturities
___________________________Source: Credit Suisse.
We believe the typical loan restructuring begins 12 months prior to maturity
Over 85% of leveraged loans in the below table will mature through 2014Market Opportunity
$58.0
$29.0
$3.00
$282.0
$190.0
$88.0
$40.0
$0
$50
$100
$150
$200
$250
$300
2011 2012 2013 2014 2015 2016 2017
Vol
ume
($bn
)
8

www.nbddif.com
Rising Defaults Drive Distressed Debt Returns
___________________________Source: Moody’s, Hedge Fund Research and Neuberger Berman.1. Annual returns of distressed investment funds calculated by HFRI Event-Driven Distressed/Restructuring Index. Past results are not indicative of future performance. Distressed performance index returns are
for the 12 month period of the year indicated, except that 2008 and 2009 return data show the average annual return for that two-year period. Actual annual returns for 2008 and 2009 were -25.2% and 28.34%, respectively.
Distressed Returns and Two-Year Lagged Default Rates1
Default rates and distressed debt returns are historically correlated, with returns typically following two years after rising defaults
We believe the sharp rise in defaults from 2008 onwards implies strong distressed debt performance for at least the next two years
Market Opportunity
0%
2%
4%
6%
8%
10%
12%
14%
1989
1990
1991
1992
1993
1994
1995
1996
1997
1998
1999
2000
2001
2002
2003
2004
2005
2006
2007
2008
2009
2010
2011
Def
ault
Rat
e
-10%
0%
10%
20%
30%
40% Trailing 12 M
onth Returns
Default Rates: Lagged Two Years (Left Axis) Distressed Returns (Right Axis)
Default rateslagged two years
9

Our Investment Process

www.nbddif.com
How Do We Capture This Investment Opportunity?
Buy debt of good companies with bad balance sheets
Companies typically backed by tangible assets such as aircraft and power stations
Buying senior and senior secured debt backed by hard assets to limit downside risk
Avoid asset-light companies such as high tech and service companies
Portfolio to contain 40 to 50 holdings with a North American focus diversified by sector and industry
Neuberger Berman’s proprietary research platform is central to our identifying debt issues of private companies
We believe attractive risk-adjusted returns can be generated in senior and senior secured debt of distressed companies using the following selection criteria:
Our Investment Process
10

www.nbddif.com
Our Investment Team
___________________________As of March 19, 2010.
Our Investment Process
Unlike previous cycles when defaults were typically more concentrated by industry, opportunities are evident across numerous sectors favouring managers with large research teams and significant industry knowledge
Co-Portfolio ManagersPatrick H. Flynn
Michael J. Holmberg
Research AnalystsJeffrey J. Habicht
Brendan P. McDermott Ravi K. Soni
Trading
Patricia A. Maxwell
Global Investment Strategy Team HY and Loan Portfolio Management Risk Management
6 Analysts
Consumer Sector Team
5 Analysts
Cyclical Sector Team
3 Analysts
Telecom Sector Team
4 Analysts
Energy / Utilities Sector Team
3 Analysts
European Team
11

www.nbddif.com
Sourcing
How We InvestDisciplined credit and valuation methodology backed by strong risk controls
Due Diligence
Investing
Management & Resolution
Exit
Identify macro trends within targeted industries and asset classes Focus on select industry and market dislocations Leverage research database and work with distressed advisors, consultants and distressed asset sellers
Analyse financial statements, corporate structure, capital structure and liquidity Perform valuation analysis Analyse the process risk and qualitative factors, and perform probability weighted scenario analysis
Determine target investment size and risk profile within portfolio Utilise broker relationships to seek effective execution on purchases and sales
Monitor each security and its deviation from investment assumptions and related market events Opportunistically work with intercreditor groups, advisors and management to maximise position
value through a recapitalisation or restructuring both in and out of formal bankruptcy proceedings Manage portfolio market risk, volatility and concentration
Direct sale of investments in the secondary market Refinancing, recapitalisation or equity offering of the underlying company or asset Merger, sale or liquidation of company / asset
Our Investment Process
12

www.nbddif.com
Our Proprietary Database
The database includes comprehensive proprietary information and commentary on over 2,000 credits
Provides extensive private and public financial and capital structure information on issuers
In-depth analysis of each issuer’s strengths and weaknesses, risks and mitigants and liquidation values
Research reports for each issuer have up-to-date commentary from our dedicated research analysts
We believe our proprietary database gives us a competitive advantage over our peersOur Investment Process
Overview
Year Developed 2002
Companies Over 2,000
Industries 25
Countries 10
Contributing Analysts 24
___________________________As of March 19, 2010.
13

www.nbddif.com
Company Overview Day 1 FinancialsTear Sheet Sources & UsesTrading Activity
Day 1 Capitalisation Credit RatingsCurrent Financials Credit FacilitiesCurrent Capitalisation
Documentation Diary (Research reports)Risks
Inside the DatabaseThere are 13 sections of data for each deal in the credit database
Our Investment Process
14

www.nbddif.com
What Will The Portfolio Look Like? We expect the portfolio to be fully invested within nine months
Our Investment Process
3mths
Cash60%
Energy/Power10%
Airlines10%
Media/Telecom5%
Real Estate5%
O ther5%
Financials5%
6mths
Cash30%
Energy/Power15%
Airlines15%
Media/Telecom10%
Real Estate10%
Financials7%
O ther13%
9mthsCash
5%
Energy/Power20%
Airlines20%
Media/Telecom15%
Real Estate10%
Financials10%
O ther20%
Portfolio Targets
Expected average issuer size: 2.5%
Maximum per issuer: 5.0%
Maximum single industry net market value exposure: 20%
Minimum North American exposure: 90%
Maximum non-North American exposure: 10%
___________________________“Other” includes the Automotive, Chemicals, Gaming, Metals & Mining, and Paper & Packaging industries.Investment splits are indicative only. Actual investment splits may differ.
15

www.nbddif.com
Investment Examples
Scenario 1 – Selling Debt In Secondary Market
Scenario 2 – Working Through Bankruptcy
We hold for 6-12 months and the value of the loan increases without the borrower restructuring or filing for bankruptcy– Forced sellers leave the market, removing technical pressures that were causing loans to trade at depressed values– The borrower’s financial condition improves as the industry cycle turns or corrective actions are taken by the management team
We sell the loan in the secondary market using a broker/dealer– Purchase Price (Day 1): 60% of par– Coupon: Libor + 4.00%
– Holding Period: 24 months– Selling Price: 85% of par
– 1.0% annual amortisation– Return: 23% (annualised)
Buy debt at 60% of par (which values company at 3.0x EBITDA)
– Due to a missed interest/amortisation payment or a covenant violation we foreclose on the assets securing our debt and force the borrower into bankruptcy
Work with management, attorneys and financial advisors to develop a plan of reorganisation (typical bankruptcy process lasts for 18-24 months)
– Receive a recovery (split 60/40 between cash and reorganised equity) through plan of reorganisation
– Sell reorganised equity in the secondary market (at a price that values the company at 5.0x EBITDA)
Ultimate annualised return on investment is approximately 37%
Forced selling often creates opportunities to acquire assets at a discount to face value. After acquiring a loan at a discount, we expect to typically exit via one of two scenarios:
___________________________For Illustrative Purposes Only.
Our Investment Process
16

www.nbddif.com
Term Sheet
Portfolio Investments Bank debt, high yield bonds, private notes and equity, including reorganised equities, with a primary focus on senior and senior secured debt
Target Fund Size In excess of $150 million via a global raise from investors in the US, Latin America, Europe, UK and Asia
Fund Capacity $1 billion
Target Timing Publication of Prospectus: mid-April Close book build / IPO: 4 June 2010
Market Specialist Fund Market of the London Stock Exchange and Channel Islands Stock Exchange
Fund Denomination US Dollars ($) Issue Price $1.00; opening NAV per share $0.98
Frequency of NAV Daily
Subscription Shares 1 for 5 bonus subscription share issue to all IPO investors with an exercise price equal to issue price ‘Bullet’ exercise 18 months after IPO Subscription shares are freely tradeable on Day 1 of issue
Discount Control Fixed life fund Continuation vote after 18 months 20% tender offer after 18 months (matched with exercise of subscription offer)
Placing Minimum $100,000
Offer Minimum $50,000
Cash Deployment Capital deployed quickly with at least one third expected to be invested in the first 3 months and aim to be fully invested by 9 months
Intended Cash Deployment & Realisation Strategy
Year 1: Cash fully deployed in 3 to 9 months Year 2-3: Cash, principal payment and sale proceeds reinvested Year 4-6: Profits distributed to investors
Leverage None
Target Return 20% (gross of fees and expenses)
Management Fee 1.5% of NAV
Hurdle Rate 6% on issue price, compounded each December 31
Profits Interest 20% of all profits, paid only after investors have received cash distributions equal to the issue price and have achieved a realised (cash-paid) IRR equal to the Hurdle Rate, with an 100% catch up to the Investment Manager until the Investment Manager has received 20% of all profits distributed
20% Investment Manager / 80% Investor split thereafter
Dividend Policy Income received from investments will be distributed to shareholders by way of two half yearly dividends
Other ISA and SIPP eligible (U.K. Investors only)
Our Investment ProcessInvestment Manager Neuberger Berman Euorpe Limited Sub-Investment Manager Neuberger Berman Fixed Income LLC
Financial Adviser Oriel Securities Limited Joint Bookrunners Oriel Securities Limited and RBS Hoare Govett Limited
17

NB Distressed Debt Investment Fund Limited – Product Features

www.nbddif.com
NAV Discount Control
Fixed life fund– Three-year investment period – Capital deployed quickly – Aim to be fully invested in 9 months– Profits to be distributed from year four onwards
Transparency– Quarterly disclosure of holdings by industry
Daily NAV– Portfolio marked daily by an independent agency using third-party prices
Governance– Continuation vote after approximately 18 months– Company has ability to purchase 14.99% of ordinary shares in issue
Subscription Shares– IPO investors to receive one bonus issue of subscription shares for every 5 shares purchased – Entitles holder to exercise after 18 months at issue price
We believe that the structure and fixed life nature of the fund means it is less likely that the NAV could trade at a discount
NB Distressed Debt Investment Fund Limited – Product Features
18

www.nbddif.com
Corporate Governance
Guernsey-incorporated investment company
Board of 5 directors (incl. 3 independent directors)
Holders of certain shares have voting rights in relation to key decisions
Remaining voting rights held by holder of A shares, an independent charitable trustee
Admitted to trading on the London Stock Exchange’s Specialist Fund Market and the Channel Islands Stock Exchange
Subject to Disclosure & Transparency Rules in the UK
Continuation vote after approximately 18 months
Share buy-back up to 14.99% of the ordinary shares
Corporate governance structure designed to protect investor interestsNB Distressed Debt Investment Fund Limited – Product Features
19

Track Record

www.nbddif.com
Track Record Performance Notes Details of what the Investment Manager believes to be Michael Holmberg’s performance track record at each institution are set out below. The notes to the tables below contain important information about the sources and calculation of Mr. Holmberg’s performance track record.
The performance information has been calculated by the Investment Manager based on what the Investment Manager believes to be unaudited internal management reports relating to trades decided upon by Mr. Holmberg while at Bank of America/Continental Bank, Ritchie Capital Management and Newberry Capital Management. When considering the performance information, potential investors should note that, in each case, the respective firms provided research and administrative support to Mr. Holmberg’s investment activities. Potential investors should also note that, in the case of Bank of America/Continental Bank and Ritchie Capital Management, Mr. Holmberg was responsible for only part of a larger diversified portfolio and the relevant performance information set out relates only to the part of the respective portfolios for which he was entirely responsible. Although the Investment Manager believes that the information set out fairly represents Mr. Holmberg’s investment performance over the relevant periods, potential investors should note that this information has not been reviewed or audited nor, in the case of Bank of America/Continental Bank and Ritchie Capital Management, have the internal management reports from which this information is derived been checked against the relevant internal accounting records of or confirmed as accurate, genuine or complete by the respective firms, although the Investment Manager believes this to be the case. Potential investors should further note that the rates of return presented have been calculated differently by each of the respective firms, as described in more detail in the notes to the tables.
The rates of return presented (which are gross of advisory fees and operating expenses such as employee compensation and administrative overhead) have been calculated using the actual capital deployed by Mr. Holmberg over the relevant periods. There were no cash components in Mr. Holmberg’s previous portfolios (as cash from internal sources was used only when needed to make an investment and returned internally when an investment was exited), which may understate assets under management, increase rates of return (both positive and negative) and increase performance volatility as compared to portfolios which do maintain a cash reserve. The Company will maintain a cash reserve for working capital purposes. Annual returns for Ritchie Capital Management and Newberry Capital Management have been calculated as the compounded monthly returns over the period, whereas the Bank of America returns have been calculated on a weighted average basis.
Mr. Holmberg’s track record is not indicative of the returns the Company will, or is likely to, generate going forward, and potential investors should be aware that investment in the Company is speculative, involves a high degree of risk, and could result in the loss of all or substantially all of their investment. Mr. Holmberg’s past performance is no guide to or guarantee of future returns.
Track Record
20

www.nbddif.com
Year Q1 Q2 Q3 Q4 Gross Annual
1994 27.6% -1.4% 10.0% 3.6% 24.9%
1995 4.4% 6.0% 8.2% 7.3% 28.5%
1996 6.3% 4.1% 3.0% 3.4% 14.9%
1997 5.3% 5.4% 6.6% 5.0% 22.3%
1998 4.5% 3.5% -2.2% -4.0% 0.7%
1999 2.1% 3.4% 0.2% 2.1% 8.5%
Quarters
Bank of America/Continental Bank1,2,3,4
Track Record
The returns presented below are unaudited gross returns – no advisory fees deducted
___________________________1. Quarterly and annual returns equal gross income plus realised and unrealised gains and minus realised and unrealised losses in the period divided by average cash invested over the period, measured by
settlement date accounting (which is an accounting method used to record transactions on the date when a trade, purchase or sale is settled and funded).2. The above returns were calculated using reports containing certain details of the trades decided upon by Mr. Holmberg which the Investment Manager believes were generated for internal reviews and
business planning, supplemented by deal summary reports showing the cash invested and profit for each trade, none of which have been reviewed or audited or checked against the relevant internal accounting records of or confirmed as accurate, genuine or complete by Bank of America.
3. Unrealised gains and losses in the above table have been derived from portfolio valuations which were based on the lower of cost or market value in 1994 and on mark-to-market value from 1995 to 1999. Continental Bank/Bank of America switched the portfolio valuation accounting methodology to mark-to-market accounting on 31 January 1995.
4. Continental Bank was acquired by BankAmerica in September of 1994, BankAmerica merged with NationsBank in September of 1998 and became Bank of America.
Over the 6 year period that Mr. Holmberg was a proprietary trading portfolio manager at Bank of America/Continental Bank he achieved an average annual return (gross of advisory fees and operating expenses) of 16.6 per cent. His quarterly and annual gross returns are set out below.
21
www.nbddif.com
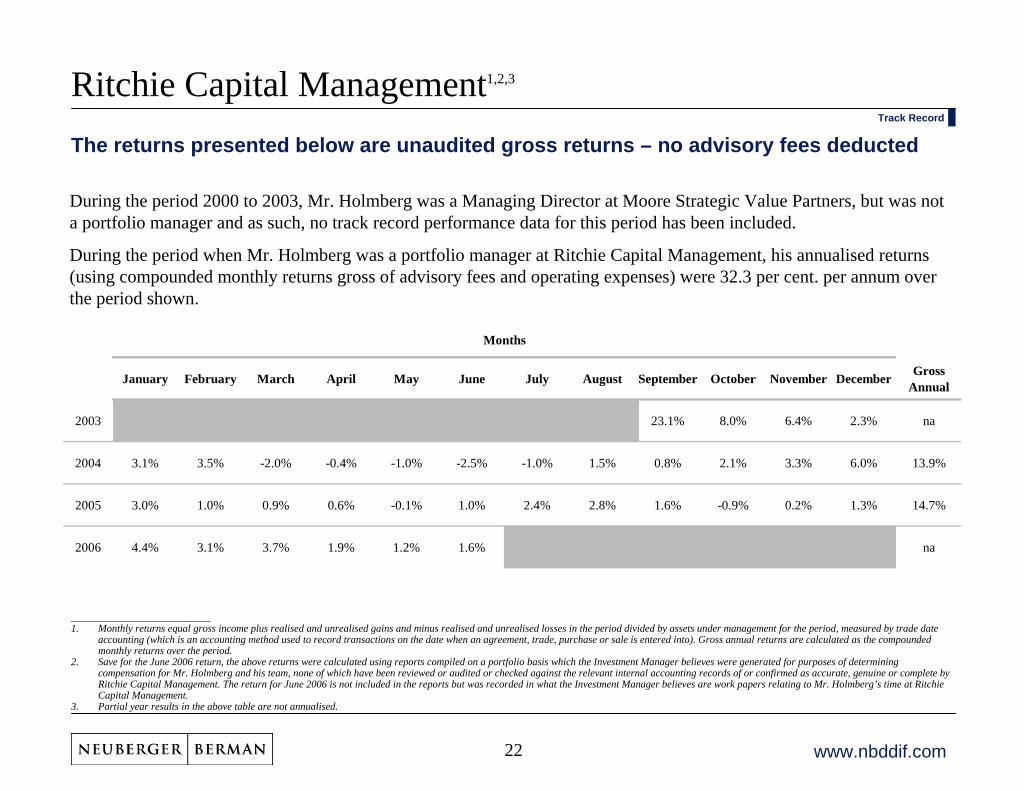
January February March April May June July August September October November December Gross Annual
2003 23.1% 8.0% 6.4% 2.3% na
2004 3.1% 3.5% -2.0% -0.4% -1.0% -2.5% -1.0% 1.5% 0.8% 2.1% 3.3% 6.0% 13.9%
2005 3.0% 1.0% 0.9% 0.6% -0.1% 1.0% 2.4% 2.8% 1.6% -0.9% 0.2% 1.3% 14.7%
2006 4.4% 3.1% 3.7% 1.9% 1.2% 1.6% na
Months
Ritchie Capital Management1,2,3
The returns presented below are unaudited gross returns – no advisory fees deducted
___________________________1. Monthly returns equal gross income plus realised and unrealised gains and minus realised and unrealised losses in the period divided by assets under management for the period, measured by trade date
accounting (which is an accounting method used to record transactions on the date when an agreement, trade, purchase or sale is entered into). Gross annual returns are calculated as the compounded monthly returns over the period.
2. Save for the June 2006 return, the above returns were calculated using reports compiled on a portfolio basis which the Investment Manager believes were generated for purposes of determining compensation for Mr. Holmberg and his team, none of which have been reviewed or audited or checked against the relevant internal accounting records of or confirmed as accurate, genuine or complete by Ritchie Capital Management. The return for June 2006 is not included in the reports but was recorded in what the Investment Manager believes are work papers relating to Mr. Holmberg’s time at Ritchie Capital Management.
3. Partial year results in the above table are not annualised.
During the period 2000 to 2003, Mr. Holmberg was a Managing Director at Moore Strategic Value Partners, but was not a portfolio manager and as such, no track record performance data for this period has been included.
During the period when Mr. Holmberg was a portfolio manager at Ritchie Capital Management, his annualised returns (using compounded monthly returns gross of advisory fees and operating expenses) were 32.3 per cent. per annum over the period shown.
Track Record
22

www.nbddif.com
January February March April May June July August September October November December Gross Annual
2006 0.1% 2.8% na
2007 3.3% 0.8% -0.7% 1.1% 3.3% -1.2% -4.2% -3.7% -0.7% 2.3% -1.0% -0.9% -1.9%
2008 -5.5% 1.4% -0.7% 0.8% 0.1% 0.6% 0.3% -3.5% -13.4% na
Months
Newberry Capital Management1,2,3
The returns presented below are unaudited gross returns – no advisory fees deducted
___________________________1. Monthly returns equal gross income plus realised and unrealised gains and minus realised and unrealised losses in the period divided by the average investment over the period, measured by trade date
accounting. In this context, “average investment” is the market value of the investment at the start of the period adjusted by Newbcrry for time weighted capital inflows and outflows during the period (i.e., a purchase or sale earlier in the period would have a greater impact on average investment than a purchase or sale later in the period). Gross annual returns are calculated as the compounded monthly returns over the period.
2. The above returns were calculated using internal month-end performance and position reports generated using third-party portfolio management software, supplemented in certain instances by third-party pricing information to support market value determinations (subject to judgements made by Newberry), none of which have been reviewed or audited.
3. Partial year results in the above table are not annualised.
Mr. Holmberg founded Newberry Capital Management in 2006. Following a period of significant instability in the global financial and credit markets, which has led to the opportunity which the Directors and Investment Managers believe currently exists in the distressed debt market, the fund managed by Newberry Capital Management was wound down in the fourth quarter of 2008. Mr. Holmberg’s annualised returns (using compounded monthly returns gross of advisory fees and operating expenses) were -10.0 per cent. per annum over the period shown.
Track Record
23

Appendix

www.nbddif.com
Distressed Operations
Regular reporting on performance, issues, opportunities and market colour
Reporting
Work with advisors to identify potential tax consequences and the appropriate booking vehicles related to the structuring and resolution of distressed investments
Tax
Distressed debt trades often close between T+60 to T+90 and trade with documents requiring attorney review
Loan closings can also be subject to the approval of loan agents and government agencies
Legal
Use Wall Street Office and Portia to manage portfolios and provide detailed reporting, monitoring and control functions
Portfolio Management System
Proprietary systems to manage risk consistent with client objectives and constraints
Oversight provided by Neuberger Berman risk management committee
Risk Management
Fully integrated operations designed to provide for accurate accounting, reporting and processing of all loans and securities
Well-respected and established relationships with major trading counterparties, legal and accounting firms
Thorough understanding of the requirements, market conventions and potential pitfalls in documenting transactions and trading / managing distressed assets
Documented third-party valuations are used to mark the portfolio
Neuberger Berman pricing team confirms external valuations, not the investment team
Pricing
24

www.nbddif.com
Neuberger Berman Fixed Income FranchiseOver $70 billion in fixed income assets under management1
___________________________1. As of December 31, 2009. Represents assets under management of Neuberger Berman Fixed Income LLC, NB Alternative Fund Management LLC and Neuberger Berman LLC. 2. As of December 31, 2009. Investment professionals are defined as money managers, research analysts/associates, and traders of Neuberger Berman LLC and Neuberger Berman Fixed Income LLC.
A large team of 132 fixed income investment professionals– Portfolio Managers have an average of 19 years of industry experience2
Significant assets under management1
– Total fixed income assets of over $70 billion– Over $11 billion in high yield bonds and loans
One of the best high yield teams in the business already covering distressed companies– Deep research resources are essential in identifying distressed opportunities– Experienced Portfolio Management team– Idea generation driven by one of the largest high yield and loan credit teams in the business
25

www.nbddif.com
Distressed Debt, High Yield and Loan Team
___________________________As of March 19, 2010.
Name Focus Investment Experience Most Advanced DegreeAnn H. Benjamin High Yield 29 years MPM, Carnegie Mellon UniversityThomas P. O’Reilly, CFA High Yield 21 years MBA, Loyola UniversityRuss Covode High Yield 22 years MBA, University of ChicagoTimothy S. Van Kirk Bank Loans 23 years MBA, Northwestern UniversityJoseph P. Lynch Bank Loans 16 years MBA, DePaul UniversityStephen J. Casey, CFA Bank Loans 12 years MS, Illinois Institute of TechnologyMichael Holmberg Distressed 22 years MBA, University of ChicagoPatrick H. Flynn, CFA Distressed/Co-Director of Research 18 years MBA, University of Chicago
Vivek Bommi, CFA Co-Director of Research 12 years MBA, Columbia UniversityAdam D. Abbas Telecom 7 years BS, Northwestern UniversityKristi R. Broderick Consumer 14 years MBA, Cornell UniversityRavi Chintapalli, CFA Portfolio Analyst 6 years BS, University of IllinoisFrank Daily Consumer 10 years BA, University of Notre DameKristoffer Darby European Credits 11 years BA, University of WolverhamptonJoseph Daul Consumer 3 years BS, University of IllinoisDavid DeCoste, CFA Cyclicals 10 years MBA, University of ChicagoColin Donlan Portfolio Analyst 15 years MBA, DePaul UniversityScott J. Duba, CFA Telecom 6 years BA, University of Notre DameRobert Gephardt Energy 5 years BS, Indiana UniversityClayton Glover Cyclicals 3 years BA, Indiana UniversityMitchell Glynn European Credits 3 years BA, Loughborough UniversityJeffrey J. Habicht Distressed 6 years BBA, University of WisconsinMichael K. Hepp Consumer 5 years BS, Marquette UniversitySinan Kermen, CFA Telecom 8 years MBA, University of ChicagoChristopher J. Kocinski Consumer 5 years BA, University of ChicagoBrendan P. McDermott Distressed 8 years BA, College of the Holy CrossBrandon Mulroe Consumer 3 years BS, Indiana UniversityAlex Rodriguez, CFA Cyclicals 9 years MBA, University of ChicagoMartin Rotheram European Credits 22 years --Steven Ruh Cyclicals 5 years BA, University of ChicagoRavi K. Soni Distressed 6 years BBA, University of Notre DameReena Tilva Cyclicals 6 years MBA, Northwestern UniversityPatrick M. Walsh Energy 10 years MBA, University of Illinois
John Abendroth, CFA Bonds/Loans 19 years MBA, DePaul UniversityWilliam Eastwood, CFA Bonds/Loans 15 years MBA, University of HartfordPatricia A. Maxwell Distressed 16 years MBA, Northwestern UniversityJoseph A. Schurer Bonds/Loans 9 years BA, Michigan State UniversityJohn Sun, CFA Risk Management & Analysis 16 years PhD, Columbia University
Research Analysts
Traders and Risk Management
Portfolio Management Team
26

www.nbddif.com
Michael Holmberg – Investment History
Bank of America / Continental Bank
(1988 – 1999)
Strategic Value Partners / Moore Strategic Value
Partners (2000 – 2003)
Ritchie Capital Management (2003 – 2006)
Portfolio Manager from 1994 – 1999
Founding member of the Bank’s proprietary distressed investment desk
Focused on distressed real estate opportunities
Began career in Continental Bank’s1
lending and capital markets groups
Managing Director
Managed investments in distressed debt in both Tokyo and New York City
Focused on Japanese distressed debt in JV between Moore Capital and Strategic Value Partners
Focused on US distressed debt in the aircraft / airline, homebuilding and building products industries
Portfolio Manager
Founded Ritchie Capital’s Distressed Debt & Special Credit Opportunities Group
Served on numerous official and ad hoc creditors’ committees
Focused on investing in distressed debt opportunities
Team spun out of Ritchie Capital to form Newberry Capital Management
Portfolio Manager
Founding partner of Newberry Capital
Focused on investing in distressed debt opportunities
Entire Newberry Capital team joined Neuberger Berman in May 2009
Investment History
Newberry Capital Management /
Neuberger Berman (2006 – Present)
___________________________1. Continental Bank was acquired by BankAmerica in September of 1994. BankAmerica merged with NationsBank in September of 1998 and became Bank of America.
27

Disclaimer
www.nbddif.com
DisclaimerDisclaimer
This document and the presentation are not for release, publication or distribution (directly or indirectly) in or into the United States, Canada, Australia or Japan or to any "US person" as defined in Regulation S under the United States Securities Act of 1933, as amended (the "Securities Act") or into any other jurisdiction where applicable laws prohibit its release, distribution or publication. It does not constitute an offer of securities for sale anywhere in the world, including in or into the United States, Canada, Australia or Japan. No recipient may distribute, or make available, this document or the presentation (directly or indirectly) to any other person. Recipients of this document and the presentation in jurisdictions outside the UK should inform themselves about and observe any applicable legal requirements in their jurisdictions. In particular, the distribution of this document and the presentation may in certain jurisdictions be restricted by law. Accordingly, recipients represent that they are able to receive this document and relating presentation without contravention of any applicable legal or regulatory restrictions in the jurisdiction in which they reside or conduct business.
This document and the presentation have been prepared by Neuberger Berman Europe Limited ("NBEL") and are the sole responsibility of NBEL. No liability whatsoever (whether in negligence or otherwise) arising directly or indirectly from the use of this document is accepted and no representation, warranty or undertaking, express or implied, is or will be made by NBEL or Oriel Securities Limited ("Oriel Securities") or RBS Hoare Govett Limited (“RBS Hoare Govett”) or any of their respective directors, officers, employees, advisers, representatives or other agents ("Agents") for any information or any of the opinions contained herein or for any errors, omissions or misstatements. None of Neuberger Berman LLC, Neuberger Berman Fixed Income LLC ("NBFI"), Oriel Securities, RBS Hoare Govett nor any of their respective Agents makes or has been authorised to make any representation or warranties (express or implied) in relation to NB Distressed Debt Investment Fund Limited ("NBDDIF") or as to the truth, accuracy or completeness of this document or the presentation, or any other written or oral statement provided. In particular, no representation or warranty is given as to the achievement or reasonableness of, and no reliance should be placed on any projections, targets, estimates or forecasts contained in this document or the presentation and nothing in this document or the presentation is or should be relied on as a promise or representation as to the future. The name "Neuberger Berman" is used interchangeably throughout these materials for a number of entities associated with the Neuberger Berman Group and NBDDIF and when used in this notice includes all such entities.
This document is an advertisement and does not constitute a prospectus or offering memorandum or an offer in respect of any securities and is not intended to provide the basis for any decision in respect of NBDDIF or other evaluation of any securities of NBDDIF or any other entity and should not be considered as a recommendation that any investor should subscribe for or purchase any such securities. Neither the issue of this document or the presentation nor any part of their contents constitutes an offer to sell or invitation to purchase any securities of NBDDIF or any other entity or any persons holding securities of NBDDIF and no information set out in this document or the presentation or referred to in other written or oral information is intended to form the basis of any contract of sale, investment decision or any decision to purchase any securities in it. An investment decision must be made solely on the basis of a prospectus to be published by NBDDIF. When made available, copies of the prospectus may be obtained, subject to applicable law, at no cost from the registered office of NBDDIF and will be made available for viewing at the document viewing facility of the Financial Services Authority.
The information contained in this document is given at the date of its publication (unless otherwise marked) and is subject to updating, revision and amendment when the definitive admission document is published. In particular, the proposals referred to herein are tentative and are subject to verification, material updating, revision and amendment. No reliance may be placed for any purpose whatsoever on the information of opinions contained in this document or on its completeness, accuracy or fairness. The contents of this document have not been verified by Oriel Securities or RBS Hoare Govett and the document has not been approved by any competent regulatory or supervisory authority.
This document, any presentation made in conjunction with this document and any accompanying materials (the "Information Materials") are preliminary and made available for information purposes only. The Information Materials, which are not a prospectus or listing particulars or an admission document, do not contain any representations, do not constitute or form part of any offer or invitation to sell or transfer, or to underwrite, subscribe for or acquire, any shares or other securities, and do not constitute or form any part of any solicitation of any such offer or invitation, nor shall they are or any part of them or the fact of their distribution form the basis of or be relied upon in connection with any contract therefore, and do not constitute a recommendation regarding the securities of NBDDIF.
The Information Materials contain inside information. By accepting this document and attending the presentation you agree not to use all or any of the information contained in the Information Materials (except to the extent it has lawfully been made public) to deal, advise or otherwise require or encourage another person to deal in the securities of the Company or engage in any other behaviour which amounts to the criminal offence of insider dealing under the Criminal Justice Act 1993 or the civil offence of market abuse under the Financial Services and Markets Act 2000.
Neuberger Berman gives no undertaking to provide the recipient with access to any additional information, or to update this document, the presentation or any additional information, or to correct any inaccuracies in it which may become apparent and the distribution of this document and the presentation shall not be deemed to be any form of commitment on the part of Neuberger Berman to proceed with any transaction.
The promotion of NBDDIF and the distribution of this document and the presentation in the United Kingdom is restricted by law. Accordingly, this communication is directed only at (i) persons outside the United Kingdom to whom it is lawful to communicate to, or (ii) persons having professional experience in matters relating to investments who fall within the definition of "investment professionals" in Article 19(5) of the Financial Services and Markets Act 2000 (Financial Promotion) Order 2005 (as amended), or (iii) high net worth companies, unincorporated associations and partnerships and trustees of high value trusts as described in Article 49(2) of the Financial Services and Markets Act 2000 (Financial Promotion) Order 2005 (as amended) provided that in the case of persons falling into categories (ii) or (iii), the communication is only directed at persons who are also "qualified investors" as defined in section 86 of the Financial Services and Markets Act 2000 (each a "Relevant Person"). Any investment or investment activity to which this communication relates is available only to and will be engaged in only with such Relevant Persons. Persons within the United Kingdom who receive this communication (other than persons falling within (ii) and (iii) above) should not rely on or act upon this communication. You represent and agree that you are a Relevant Person.
THE CONTENTS OF THIS DOCUMENT AND THE PRESENTATION ARE STRICTLY CONFIDENTIAL AND MAY NOT BE COPIED, DISTRIBUTED, PUBLISHED OR REPRODUCED IN WHOLE OR IN PART, OR DISCLOSED OR DISTRIBUTED BY RECIPIENTS TO ANY OTHER PERSON. ANY RECIPIENT OF THIS DOCUMENT AGREES TO KEEP PERMANENTLY CONFIDENTIAL ALL INFORMATION HEREIN NOT ALREADY IN THE PUBLIC DOMAIN.
28

www.nbddif.com
Disclaimer ContDisclaimer
NBDDIF will not be registered under the U.S. Investment Company Act of 1940, as amended (the "Investment Company Act") and investors will not be entitled to the benefits of that Act. The securities described in this document have not been and will not be registered under the Securities Act, or the laws of any state of the United States. Consequently, such securities may not be offered, sold or otherwise transferred within the United States or to or for the account or benefit of U.S. persons (as such term is defined in Regulation S under the Securities Act) except pursuant to an exemption from, or in a transaction not subject to, the registration requirements of the Securities Act, applicable state laws and under circumstances which will not require NBDDIF to register under the Investment Company Act. No public offering of the securities is being made in the United States.
Prospective investors should take note that any securities may not be acquired by investors using assets of any retirement plan or pension plan that is subject to Part 4 of Subtitle B of Title I of the United States Employee Retirement Income Security Act of 1974, as amended ("ERISA") or section 4975 of the United States Internal Revenue Code of 1986, as amended (the "Code"), entities whose underlying assets are considered to include "plan assets" of any such retirement plan or pension plan, or any governmental plan, church plan, non-U.S. plan or other investor subject to any state, local, non-U.S. or other laws or regulations similar to Title I or ERISA or Section 4975 of the Code or that would have the effect of the regulations issued by the United States Department of Labor set forth at 29 CFR Section 2510.3-101, as modified by section 3(42) of ERISA.
The merits or suitability of any securities must be independently determined by the recipient on the basis of its own investigation and evaluation of Neuberger Berman. Any such determination should involve, among other things, an assessment of the legal, tax, accounting, regulatory, financial, credit and other related aspects of the securities. Recipients of this document and the presentation are recommended to seek their own independent legal, tax, financial and other advice and should rely solely on their own judgment, review and analysis in evaluating Neuberger Berman, its business and its affairs. Potential investors and their representatives are invited to ask questions of, and receive answers from, NBEL and NBFI concerning the contemplated investment to the extent the same can be acquired without unreasonable effort or expense, in order to verify the accuracy of the information herein.
This document and the presentation may contain certain forward-looking statements. Forward-looking statements relate to expectations, beliefs, projections, future plans and strategies, anticipated events or trends and similar expressions concerning matters that are not historical facts. In some cases, forward-looking statements can be indentified by terms such as "anticipate", believe", "could", "estimate", "expect", "intend", "may", "plan", "potential", "should", "will", and "would", or the negative of those terms or other comparable terminology. The forward-looking statements are based on Neuberger Berman's beliefs, assumptions, and expectations of future performance and market developments, taking into account all information currently available. These beliefs, assumptions, and expectations can change as a result of many possible events or factors, not all of which are known or are within Neuberger Berman’s control. If a change occurs, the NBDDIF’s business, financial condition, liquidity, and results of operations may vary materially from those expressed in forward-looking statements. Some of the factors that could cause actual results to vary from those expressed in forward-looking statements, include, but are not limited to: the factors described in this document and the presentation; the rate at which NBDDIF deploys its capital in investments and achieves expected rates of return; NBDDIF, NBEL and NBFI's ability to execute NBDDIF's investment strategy, including through the identification of a sufficient number of appropriate investments; the continuation of NBEL and NBFI as investment manager and sub-investment manager, respectively, of NBDDIF's investments, the continued affiliation with Neuberger Berman of its key investment professionals; NBDDIF’s financial condition and liquidity; changes in the values of or returns on investments that the Company makes; changes in financial markets, interest rates or industry, general economic or political conditions; and the general volatility of the capital markets and the market price of NBDDIF’s shares.
By their nature, forward-looking statements involve known and unknown risks and uncertainties because they relate to events, and depend on circumstances that may or may not occur in the future. Forward- looking statements are not guarantees of future performance. Any forward-looking statements are only made as at the date of this document and the presentation, and Neuberger Berman neither intends nor assumes any obligation to update forward-looking statements set forth in this document whether as a result of new information, future events, or otherwise, except as required by law or other applicable regulation. In light of these risks, uncertainties, and assumptions, the events described by any such forward-looking statements might not occur. Neuberger Berman qualifies any and all of their forward-looking statements by these cautionary factors. Please keep this cautionary note in mind while reading this document.
Oriel Securities and RBS Hoare Govett, each of which is authorised and regulated in the United Kingdom by the Financial Services Authority, are acting for NBDDIF and no-one else in connection with the potential offering of securities by NBDDIF and will not be responsible to anyone other than NBDDIF for providing the protections afforded to customers of Oriel Securities and RBS Hoare Govett or for providing advice in relation to the offer of securities by NBDDIF.
By attending the presentation to which this document relates you will be deemed to have represented, warranted and undertaken for the benefit of Neuberger Berman, Oriel Securities and RBS Hoare Govett and others that (a) you are outside of the United States and are an "investment professional" (as defined above), (b) you have read and agree to comply with the contents of this notice, you will keep the information in this document and delivered during any accompanying document and all information about Neuberger Berman confidential, and will not reproduce or distribute, in whole or in part, (directly or indirectly) any such information, until such information has been made publicly available and take all reasonable steps to preserve such confidentiality, and (c) you are permitted, in accordance with applicable laws, to receive such information.
This document is issued by Neuberger Berman Europe Limited, which is authorised and regulated by the United Kingdom Financial Services Authority and whose registered address is at Lansdowne House, 57 Berkeley Square, London, W1J 6ER. Neuberger Berman LLC is a registered Investment Adviser and Broker Dealer and member of the New York Stock Exchange, the Financial Industry Regulation Authority and the Securities Investor Protection Corporation. Neuberger Berman Fixed Income LLC is a US registered Investment Adviser. Neuberger Berman is a registered trademark. All rights reserved. © 2010 Neuberger Berman.
29