nature's academy science literacy project standards-based ... · the science literacy project...
TRANSCRIPT
The Science Literacy Project Standards-Based Curriculum
2015-2016

The Science Literacy Project Standards-Based Curriculum
1
More than a field trip
Nature’s Academy does more than just provide a daylong field trip experience. In fact, we are
Partners in Education committed to providing yearlong support to Manatee County educators.
We are passionate about helping local students develop scientific literacy. So, we have provided
tools that go beyond your field trip that supplement the curriculum you already have in place.
How to use this resource
Part One of this packet details all of the standards addressed by your Nature’s Academy trip
and corresponding curriculum. We have included this list to help you think about the many
different ways you can integrate your Nature’s Academy trip into your yearlong classroom
lessons.
Part Two of this packet provides information about all of the activities your students will
participate in on their Nature’s Academy field trip. Background information, activity objectives,
vocabulary, and featured organisms are provided to help you prepare students prior to the day
of their trip. Consider introducing some of these topics to students beforehand, or develop a
lesson plan that helps students engage in the trip by brainstorming what they know or don’t
know about some sample topics.
Part Three of this packet is a series of comprehensive lesson plans that utilize the Nature’s
Academy Citizen Science Database to bring real-world data to your classroom, all of which align
with Manatee County science standards. While students are on their field trip, they take data
that is added to our database. Now, it is time to help them discover the value of this type of
data! Lessons are arranged by quarter, so no matter what time of year you come on your field
trip, there is a relevant lesson that connects it to your current curriculum.
Provide Feedback
We want to hear from you! Love one of our lessons? Think that we could make some changes
to make resources easier to implement? Contact our Education Coordinator and curriculum
specialist Abigail Oakes at [email protected]
The Science Literacy Project Standards-Based Curriculum
2
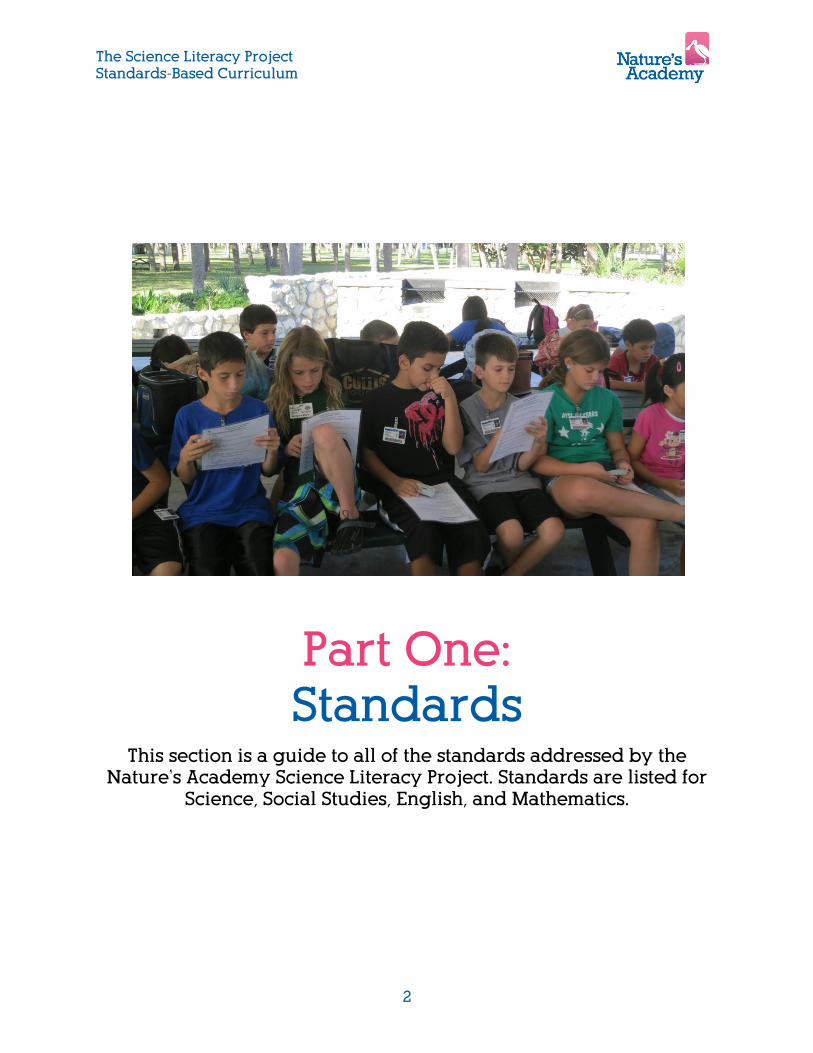
Part One: Standards
This section is a guide to all of the standards addressed by the Nature’s Academy Science Literacy Project. Standards are listed for
Science, Social Studies, English, and Mathematics.
The Science Literacy Project Standards-Based Curriculum
3
Science Essential Benchmarks
Body of Knowledge: SC.5.N: Nature of Science
Big Idea/Supporting Idea: SC.5.N.1: The Practice of Science
SC.5.N.1.1
Define a problem, use appropriate reference materials to support scientific understanding, plan
and carry out scientific investigations of various types such as: systematic observations,
experiments requiring the identification of variables, collecting and organizing data, interpreting
data in charts, tables, and graphics, analyze information, make predictions, and defend
conclusions.
SC.5.N.1.2
Explain the difference between an experiment and other types of scientific investigation.
SC.5.N.1.3
Recognize and explain the need for repeated experimental trials.
SC.5.N.1.6
Recognize and explain the difference between personal opinion/interpretation and verified
observation.
Big Idea/Supporting Idea: SC.5.N.2: The Characteristics of Scientific Knowledge
SC.5.N.2.1
Recognize and explain that science is grounded in empirical observations that are testable;
explanation must always be linked with evidence.
SC.5.N.2.2
Recognize and explain that when scientific investigations are carried out, the evidence
produced by those investigations should be replicable by others.
Body of Knowledge: SC.5.E: Earth and Space Science
Big Idea/Supporting Idea: SC.5.E.7: Earth Systems and Patterns
SC.5.E.7.2
Recognize that the ocean is an integral part of the water cycle and is connected to all of Earth's
water reservoirs via evaporation and precipitation processes.
SC.5.E.7.3
Recognize how air temperature, barometric pressure, humidity, wind speed and direction, and
precipitation determine the weather in a particular place and time.
SC.5.E.7.4
Distinguish among the various forms of precipitation (rain, snow, sleet, and hail), making
connections to the weather in a particular place and time.
SC.5.E.7.5
Recognize that some of the weather-related differences, such as temperature and humidity, are
found among different environments, such as swamps, deserts, and mountains.

The Science Literacy Project Standards-Based Curriculum
4
SC.5.E.7.6
Describe characteristics (temperature and precipitation) of different climate zones as they relate
to latitude, elevation, and proximity to bodies of water.
Body of Knowledge: SC.5.P: Physical Science
Big Idea/Supporting Idea: SC.5.P.9: Changes in Matter
SC.5.P.9.1
Investigate and describe that many physical and chemical changes are affected by temperature.
Big Idea/Supporting Idea: SC.5.9.10: Forms of Energy
SC.5.P.10.1
Investigate and describe some basic forms of energy, including light, heat, sound, electrical,
chemical, and mechanical.
SC.5.P.10.2
Investigate and explain that energy has the ability to cause motion or create change.
Body of Knowledge: SC.5.L: Life Science
Big Idea/Supporting Idea: SC.5.L.14: Organization and Development of Living Organisms
SC.5.L.14.2
Compare and contrast the function of organs and other physical structures of plants and
animals, including humans, for example: some animals have skeletons for support -- some with
internal skeletons others with exoskeletons -- while some plants have stems for support.
Big Idea/Supporting Idea: SC.5.L.15: Diversity and Evolution of Living Organisms
SC.5.L.15.1
Describe how, when the environment changes, differences between individuals allow some
plants and animals to survive and reproduce while others die or move to new locations.
Big Idea/Supporting Idea: SC.5.L.17: Interdependence
SC.5.L.17.1
Compare and contrast adaptations displayed by animals and plants that enable them to survive
in different environments such as life cycles variations, animal behaviors and physical
characteristics.
The Science Literacy Project Standards-Based Curriculum
5
Social Studies Essential Benchmarks
Strand SS.5.A: American History
Standard 3: SS.5.A.3: Exploration and Settlement of North America
SS.5.A.3.2
Investigate (nationality, sponsoring country, motives, dates and routes of travel,
accomplishments) the European explorers.
SS.5.A.3.3
Describe interactions among Native Americans, Africans, English, French, Dutch, and Spanish
for control of North America.
ELA (English Language Arts) Common Core Standards:
Strand: Standards for Speaking and Listening
Cluster 2: Presentation of Knowledge and Ideas
LAFS.5.SL.2.4
Report on a topic or text or present an opinion, sequencing ideas logically and using appropriate
facts and relevant, descriptive details to support main ideas or themes; speak clearly at an
understandable pace.
LAFS.5.SL.2.5
Include multimedia components (e.g., graphics, sound) and visual displays in presentations
when appropriate to enhance the development of main ideas or themes.
Strand: Writing Standards
Cluster 2: Production and Distribution of Writing
LAFS.5.W.2.4
Produce clear and coherent writing in which the development and organization are appropriate
to task, purpose, and audience
LAFS.5.W.2.5
With guidance and support from peers and adults, develop and strengthen writing as needed by
planning, revising, editing, rewriting, or trying a new approach.
Cluster 4: Range of Writing
LAFS.5.W.4.10
Write routinely over extended time frames (time for research, reflection, and revision) and
shorter time frames (a single sitting or a day or two) for a range of discipline-specific tasks,
purposes, and audiences.

The Science Literacy Project Standards-Based Curriculum
6
Strand: Language Arts
Cluster 1: Conventions of Standard English
LAFS.5.L.1.2
Demonstrate command of the conventions of standard English capitalization, punctuation, and
spelling when writing.
a. Use punctuation to separate items in a series.
b. Use a comma to separate an introductory element from the rest of the sentence.
c. Use a comma to set off the words yes and no (e.g., Yes, thank you), to set off a tag
question from the rest of the sentence (e.g., It’s true, isn’t it?), and to indicate direct
address (e.g., Is that you, Steve?).
d. Use underlining, quotation marks, or italics to indicate titles of works.
e. Spell grade-appropriate words correctly, consulting references as needed.
Cluster 3: Vocabulary Acquisition and Use
LAFS.5.L.3.4
Determine or clarify the meaning of unknown and multiple-meaning words and phrases based
on grade 5 reading and content, choosing flexibly from a range of strategies.
a. Use context (e.g., cause/effect relationships and comparisons in text) as a clue to the
meaning of a word or phrase.
b. Use common, grade-appropriate Greek and Latin affixes and roots as clues to the
meaning of a word (e.g., photograph, photosynthesis).
c. Consult reference materials (e.g., dictionaries, glossaries, thesauruses), both print and
digital, to find the pronunciation and determine or clarify the precise meaning of key
words and phrases.
The Science Literacy Project Standards-Based Curriculum
7
MA (Mathematics) Common Core Standards:
Domain: Geometry
Cluster 1: Graph points on the coordinate plane to solve real-world and mathematical problems
MAFS.5.G.1.1
Use a pair of perpendicular number lines, called axes, to define a coordinate system, with the
intersection of the lines (the origin) arranged to coincide with the 0 on each line and a given
point in the plane located by using an ordered pair of numbers, called its coordinates.
Understand that the first number indicates how far to travel from the origin in the direction of one
axis, and the second number indicates how far to travel in the direction of the second axis, with
the convention that the names of the two axes and the coordinates correspond (e.g., x-axis and
x-coordinate, y-axis and y-coordinate).
MAFS.5.G.1.2
Represent real world and mathematical problems by graphing points in the first quadrant of the
coordinate plane, and interpret coordinate values of points in the context of the situation.
MAFS.K12.MP.5.1
Use appropriate tools strategically - Mathematically proficient students consider the available
tools when solving a mathematical problem. These tools might include pencil and paper,
concrete models, a ruler, a protractor, a calculator, a spreadsheet, a computer algebra system,
a statistical package, or dynamic geometry software. Proficient students are sufficiently familiar
with tools appropriate for their grade or course to make sound decisions about when each of
these tools might be helpful, recognizing both the insight to be gained and their limitations. For
example, mathematically proficient high school students analyze graphs of functions and
solutions generated using a graphing calculator. They detect possible errors by strategically
using estimation and other mathematical knowledge. When making mathematical models, they
know that technology can enable them to visualize the results of varying assumptions, explore
consequences, and compare predictions with data. Mathematically proficient students at various
grade levels are able to identify relevant external mathematical resources, such as digital
content located on a website, and use them to pose or solve problems. They are able to use
technological tools to explore and deepen their understanding of concepts.
Domain: Mathematical Practice
Cluster 3: Construct viable arguments and critique the reasoning of others
MAFS.K12.MP.3.1
Construct viable arguments and critique the reasoning of others.
Mathematically proficient students understand and use stated assumptions, definitions, and
previously established results in constructing arguments. They make conjectures and build a
logical progression of statements to explore the truth of their conjectures. They are able to
analyze situations by breaking them into cases, and can recognize and use counterexamples.
They justify their conclusions, communicate them to others, and respond to the arguments of
The Science Literacy Project Standards-Based Curriculum
8
others. They reason inductively about data, making plausible arguments that take into account
the context from which the data arose. Mathematically proficient students are also able to
compare the effectiveness of two plausible arguments, distinguish correct logic or reasoning
from that which is flawed, and—if there is a flaw in an argument—explain what it is. Elementary
students can construct arguments using concrete referents such as objects, drawings,
diagrams, and actions. Such arguments can make sense and be correct, even though they are
not generalized or made formal until later grades. Later, students learn to determine domains to
which an argument applies. Students at all grades can listen or read the arguments of others,
decide whether they make sense, and ask useful questions to clarify or improve the arguments.
The Science Literacy Project Standards-Based Curriculum
9
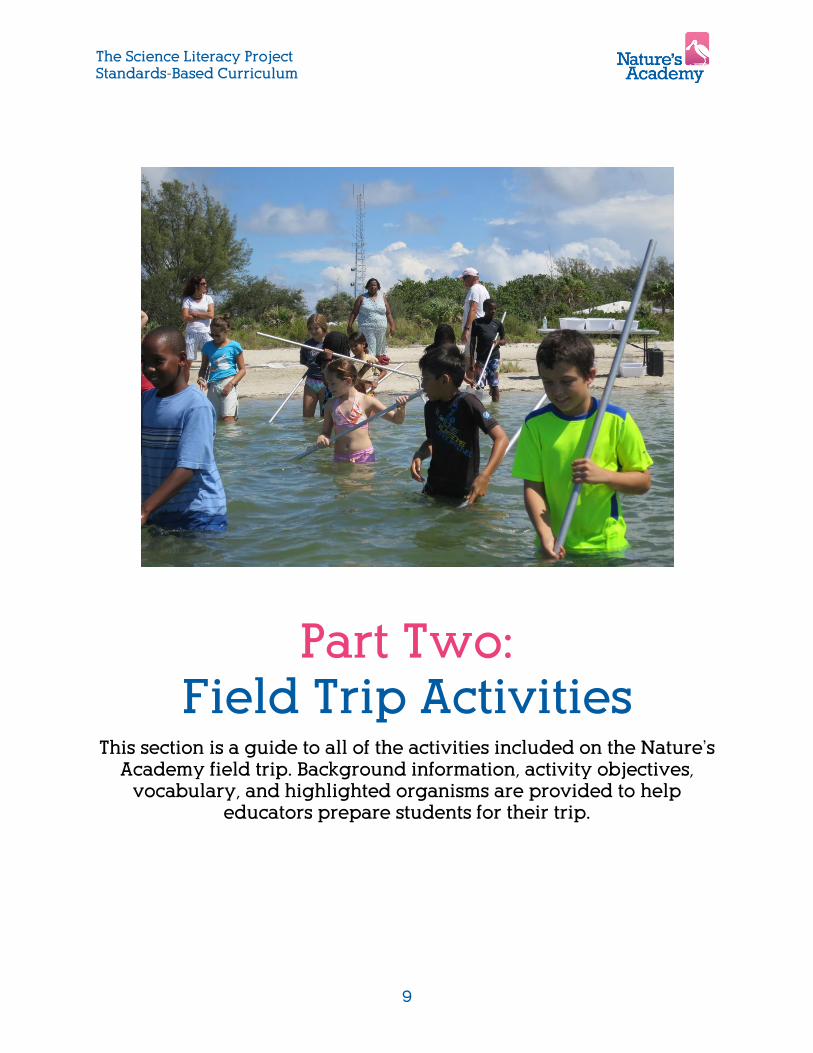
Part Two: Field Trip Activities
This section is a guide to all of the activities included on the Nature’s Academy field trip. Background information, activity objectives,
vocabulary, and highlighted organisms are provided to help educators prepare students for their trip.

The Science Literacy Project Standards-Based Curriculum
10
Field Trip Activities
As a peninsula, Florida has special access to many varieties of aquatic ecosystems, but it is
also home to an amazing diversity of terrestrial ecosystems. The state boasts over 50,000
square miles of rich natural areas. The biodiversity within these systems creates a plethora of
learning opportunities to students lucky enough to call Florida their home.
Due to the centrality of water within earth science, we begin our investigation into Floridian
ecosystems by focusing on the connections that the bodies of water in and around Florida,
including rivers, estuaries, and the ocean, create between the inhabitants of both aquatic and
terrestrial environments via the water cycle. By exploring an estuarine environment, students
are also introduced to the native and invasive living organisms that make these locations their
home, as well as asked to explore the problems associated with invasive organisms.
Through observing terrestrial organisms during a nature walk and through a biodiversity
investigation of seagrass inhabitants, students are encouraged to investigate the connections
between the adaptations of species they encounter and the limitations of their environment. To
further explore the benefit of scientific investigation and connections between living organisms,
we then allow the student’s to test the water quality within specific parameters.
Returning to the topic of the water cycle, it is possible for students to visualize how the health of
the water in one area is connected to the overall quality of water as it progresses through
various phases to travel to new locations.
The Science Literacy Project Standards-Based Curriculum
11
Mangrove Nature Walk
Background Information:
Functioning as an introduction to both Earth and life science, the mangrove nature walk allows
students to get up-close and personal with native and invasive plants and animals in Florida.
Using trees as a pivotal example, the imbalance that invasive species introduce to natural areas
is explored. Students also discuss the history of Native Americans and the European explorers.
Upon identifying the natural resources that were used by Florida’s early inhabitants, we explore
some of the resources once more through the lens of life science. Students are instructed to
observe the living organisms in the area, as well as specific adaptations they have taken on to
allow them to thrive in their natural habitats.
Mangrove systems are home to hordes of insects, a tremendous mixture of invertebrates, and
an astonishing 220 species of fish – even more than in salt marshes, thanks to the more
complex structure of the vegetation which provides more micro habitats and niches to
occupy. Besides supporting myriad residents, mangrove communities also serve as nursery
grounds for as host of fish and birds who emigrate to the outside world to live out most of their
lives. The importance of mangrove communities cannot be understated. Without mangrove
trees to nest in, the diverse arrays of birds that raise their young in the swamps would be gone.
Without the rich detrital soup made from mangrove roots and leaves, uncountable tiny recyclers
would die out, depriving hordes of shrimp, crabs, snails, and mullet of their nourishment, so that
they too would disappear. When storms swept the coast, the great peat beds on which the
mangroves grow would be eroded away. Mangrove swamps protect Florida’s shores from the
wrath of the weather and also provide protection for the marvelous array of species that call
those areas home.
Excerpts taken from “Priceless Florida,” by E. Whitney, D. Means, and A. Rudloe
Activity Objectives:
The student will:
Define the term ecology and discuss examples from local estuary habitats
Discuss the critical role of fire in maintaining the health of the forest and the importance
of prescribed burns
Identify Native Americans’ use of plants for shelter, food, medicine, and transportation
Discuss the arrival of European settlers and their impact on native cultures and the
environment
Explain the term barrier island and the importance of preserving native vegetation
Describe the characteristics of a typical estuarine environment and observe several of
the organisms that inhabit the area
List several reasons that estuaries are of great ecological and economical value (e.g.
nursery, reduce wave action, reduce erosion, filter sediment and pollution, and provide
food and shelter)
Name and identify the 3 types of mangroves trees
The Science Literacy Project Standards-Based Curriculum
12
Identify and understand that non-native, invasive species harm ecosystems
Describe current threats to mangrove forests (e.g. water quality pollution, exotic species,
and coastal development)
Discuss mangrove biology and their adaptations that allow them to survive in both salt
and fresh water
Vocabulary
Mangrove Tree Runoff Native Species*
Detritus Filtration Prescribed burn
Ecology Estuary Exotic Species
Nursery Mutualism Barrier Island
Adaptation Invasive species Erosion
Symbiosis Organism Adapt
Physical Characteristics Behavioral Characteristics Survival
Camouflage Habitat Migration
Predator/Prey Organism Stem
Leaf Roots Flowers
Reproduction Transport Bark
Protection Structure Function
Acid Rain Population
Organisms to be highlighted
Buttonwood Sea grape Southern red cedar
Poison ivy Australian pine Brazilian pepper
Great egret Snowy egret Great blue heron
Little blue heron Green heron Osprey
Brown pelican Double-crested cormorant Laughing gull
White ibis Oysters Mullet
Barnacles Sponges Manatee

The Science Literacy Project Standards-Based Curriculum
13
Seagrass, Dip Net, and Biodiversity Study
Background Information
In the biodiversity study, students are able to take part in an investigation as well as make their
own conjectures about the health of the seagrass beds due to the variety of life found. This
exercise is also used to identify different groups of animals and explore taxonomy differences.
The many positive impacts of healthy seagrass beds as well as possible consequences of their
removal are explored. As the variety of life found within the seagrass beds is an indirect
indicator of water health, students are asked to come up with ways to improve water quality. At
this point, the idea of the water cycle is approached once more to discuss the variety of states
water can exist in before it reaches the ocean.
Seagrass beds are a vital part of Florida’s coastal ecosystems. Their grassy realms allow
sunlight to penetrate the water far enough to reach the bottom, and where the seagrasses and
large algae can attach, grow, and spread. Numerous other organisms then find habitats among
the plants and form communities of great complexity. To a small invertebrate animal, a meadow
of seagrass is a wonderland of different kinds of foliage and a forest of blades on which to feed,
hide, mate, and travel from place to place. To carnivorous fish and shellfish, it is a jungle in
which to find abundant prey. To the sea turtles and manatees for which two of the grasses are
named, a seagrass meadow is a luxuriant pasture in which to feed to the heart’s content. And to
tiny travelers such as shrimp and small fish, seagrass meadows provide safe passage across
the ocean floor. These and many other species inhabit the seagrass beds at some point in their
development, in fact, over 90% of Gulf species begin their lives in a seagrass community. The
integral part that seagrass beds play in the life cycles of a vast array of species makes it
imperative to maintain the heath of these seagrass communities. As seagrasses are true
flowering plants, the clarity and chemical makeup of the water in which they are submerged has
a significant impact on their growth and heath, thereby making water quality an important
component of the entire living ecosystem. It is for this reason and many others that water quality
needs to be monitored and improved via changes in human waste management and in
environmental restoration policy.
Excerpts taken from “Priceless Florida,” by E. Whitney, D. Means, and A. Rudloe
Activity Objectives:
The student will:
Name the three main species of seagrasses, their ecological/economical importance,
major threats, and conservation efforts
List organisms they encounter (including birds) and potential safety hazards
Discuss general life history of collected organisms with a focus on taxonomy and
classification by describing characteristics and adaptations unique each phylum
Distinguish and identify major differences between vertebrates and invertebrates
Explain and understand that seagrass communities help to stabilize sediment, filter
sediment and pollutants from runoff, provide food and shelter for many invertebrates and
fish, and provide oxygen through photosynthesis

The Science Literacy Project Standards-Based Curriculum
14
Investigate the relationship between water quality and biodiversity
Understand that water can be found in different states of matter as it moves through the
water cycle
Investigate the concept of a watershed and discuss anthropogenic impacts to the
estuary
Vocabulary
Seagrass Vertebrates Arthropoda Invertebrates Exoskeleton Chordata
Photosynthesis* Mollusca Watershed
Echinodermata Annelida Water Cycle
Porifera Brackish Adaptation
Estuary Phylum Classification
Organism Adapt Survival
Physical characteristics Behavioral characteristics Camouflage
Habitat Migration Inherit
Predator/Prey Reproduction Skeleton
Function Population Generation
Organisms to be highlighted
Turtle grass Shoal grass Manatee grass
Sponges Florida fighting conch Lightening whelk
Tulip snail Lettered olive snail Pen shell
Quahog Coquina Barnacle
Grass shrimp Arrow shrimp Gulf shrimp
Arrow crab Spider crab Blue crab
Hermit crab Sea cucumber Variegated urchin
Lugworms Tunicates/sea squirts Pinfish
Filefish Pipefish Seahorse
Porgies Mojarra Mullet
The Science Literacy Project Standards-Based Curriculum
15
Water Quality Investigation
Background Information:
While biodiversity is an indirect indicator of estuary health, water quality is a direct indicator. In
this activity, students are asked to recall the observations they have made about the water they
have experienced throughout the day as well as different variables they happened to notice
about it, such as if it was “salty” or what color it was. These notions and more are explored
through water quality parameters and units are explained. Causes for specific changes in data
are explored as well as the potential impact of drastic changes. Students are once again asked
to address the water cycle and possible causes from the land that could lead to problems with
the water.
Temperature
To determine whether or not this temperature reading is optimum, you must learn more about
the aquatic organisms that are native to your region. All aquatic organisms (e.g. stream insects,
fish, plants, etc.) need a certain temperature range to survive and thrive. For example, Chinook
Salmon prefer temperatures from 5°C to 10°C, but tropical Altum Angelfish prefer temperatures
from 26°C to 29°C. If the temperature of a water body rises or falls significantly for a prolonged
period of time, aquatic organisms will become stressed and die.
Temperature also affects the amount of oxygen water can hold (cold water holds more oxygen
than warm water) and affects the rate of photosynthesis by aquatic plants. Warm water
discharged from factories, the removal of trees and vegetation that shade streams, and water
that runs off city streets can cause temperature changes that threaten the balance of aquatic
systems.
Salinity
Most of the salt in the oceans came from land. Over many, many years, rain, rivers, and streams
have washed over rocks containing the compound sodium chloride (NaCl), and carried it into the
sea. You may know sodium chloride by its common name: table salt! Some of the salt in the
oceans comes from undersea volcanoes and hydrothermal vents. When water evaporates from
the surface of the ocean, the salt is left behind.
Different bodies of water have different amounts of salt mixed in, or different salinities. Salinity is
expressed by the amount of salt found in 1,000 grams of water. Therefore, if we have 1 gram of
salt and 1,000 grams of water, the salinity is 1 part per thousand, or 1 ppt. The average ocean
salinity is 35 ppt. This number varies between about 32 and 37 ppt. Rainfall, evaporation, river
runoff, and ice formation causes the variations. For example, the Black Sea is so diluted by river
runoff, its average salinity is only 16 ppt. Freshwater salinity is usually less than 0.5 ppt. Water
between 0.5 ppt and 17 ppt is called brackish. Estuaries (where fresh river water meets salty
ocean water) are examples of brackish waters.
Most marine creatures keep the salinity inside their bodies at about the same concentration as
the water outside their bodies because water likes a balance. If an animal that usually lives in salt
The Science Literacy Project Standards-Based Curriculum
16
water were placed in fresh water, the fresh water would flow into the animal through its skin. If a
fresh water animal found itself in the salty ocean, the water inside of it would rush out. The
process by which water flows through a semi-permeable membrane (a material that lets only
some things pass through it) such as the animal's skin from an area of high concentration (lots of
water, little salt) to an area of low concentration (little water, lots of salt) is called osmosis.
This is also why humans (and nearly all mammals) cannot drink salt water. When you take in
those extra salts, your body will need to expel them as quickly as possible. Your kidneys will try
to flush the salts out of your body in urine, and in the process pump out more water than you are
taking in. Soon you'll be dehydrated and your cells and organs will not be able to function
properly.
Dissolved Oxygen (DO)
DO levels fluctuate seasonally and over a 24-hour period. They vary with water temperature,
altitude, and time of day. Cold water can hold more dissolved oxygen than warm water. For
example, water at 28°C will be 100% saturated with 8 ppm dissolved oxygen. However, water at
8°C can hold up to 12 ppm of oxygen before it is 100% saturated. Water also holds less oxygen
at higher altitudes. DO levels tend to be lower in the early morning because aquatic plants have
been “resting” all night without sunlight for photosynthesis (and oxygen generation).
When the temperature of a water body increases, it is likely that its DO levels will diminish (see
causes under “Temperature”). Additionally, high levels of bacteria and/or large amounts of rotting
matter can cause DO levels to decrease because bacteria require oxygen to decompose organic
waste. A typical range for DO in an estuary is 5 – 8 ppm.
Turbidity
In general, the clearer (or less turbid) the water, the better. If your water tested high for turbidity,
that implies that there are solid particles suspended in the water that are making it hazy. These
particles can be bad for water quality because they could clog fish gills, block light from aquatic
plants, and absorb heat.
Turbid water is caused by things like clay, silt, organic and inorganic matter, and microscopic
organisms. Turbid water might be the result of soil erosion, urban runoff, algae, and the stirring
up of bottom sediment (often caused by boats or too many bottom feeding fish). Turbidity is not
the same thing as color, since darkly colored water can still be clear and not turbid.
pH
Again, to truly determine whether your reading is acceptable, you should do a little research
about the needs of the species native to your region. In general, the majority of freshwater
organisms live in a pH range of 5.5 to 7.5 on a 14-point scale with 0 being the most acidic and 14
being the most alkaline. (For comparison, a lemon is 2 to 3 on the pH scale, while laundry
detergents tend to fall anywhere from 7.5-10.5). Most aquatic animals prefer a range of 6.5 to 8.0
and will stop reproducing at pH levels around 4. If levels drop to around 3 on the pH scale, adult
fish will die unless they are able to move away. pH can be affected by acid rain, wastewater
discharges, drainage from mines, and the type of rock naturally found in the area.

The Science Literacy Project Standards-Based Curriculum
17
Activity Objectives:
The student will:
Describe an estuary and the type of water found within one
List and describe water quality parameters and their respective units
Describe how water quality parameters affect one another and influence flora and fauna
Discuss how water quality affects biodiversity
Use probeware to collect water quality measurements
Compare/contrast water quality measurements with empirical observations
Discuss threats to water quality
List possible solutions to reducing water pollution
Compare/contrast these water quality readings with other water systems (i.e. fresh vs. brackish vs. salt)
Vocabulary
Estuary Salinity Nitrate
Acid Native species Stormwater runoff
Saltwater/Freshwater Temperature Turbidity
Base Exotic species Groundwater
Brackish Water Dissolved Oxygen pH
Invasive species Neutral Anthropogenic effects
Acid Rain Population Pollution

The Science Literacy Project Standards-Based Curriculum
18
Coastal Cleanup
Background Information:
Finally putting together the observations taken throughout the day concerning water quality and
different theories about what could affect those parameters, students are lead to make a
tangible change for good in the environment. After collecting trash from the beach and
surrounding areas, students are asked to assess the harm that such trash could cause to the
water as well as to animals in the area.
Manatee County is situated near both the Lower Tampa and Sarasota Bay estuaries. These
areas are both ecologically and economically important, while serving as nursery grounds for
fish, crabs, oysters and other animals relevant to the local seafood industry. Manatee County’s
economy is mainly tourism-driven, as our beaches and attractions brought in nearly 3 million
visitors in 2012 (www.mymanatee.org). Manatee County’s growing resident population also
benefits from the aesthetics and recreational value of Sarasota Bay, which is classified as an
Outstanding Florida Water Body (http://www.dep.state.fl.us).
However, the health of our local estuaries is greatly impacted by inland activities. Land-based
litter accounts for 80% of the marine debris found on beaches and offshore (EPA). Much of this
litter travels from roadways toward the shoreline through storm drains, streams and rivers.
Stormwater runoff also carries harmful pollutants into Lower Tampa/Sarasota Bay.
Activity Objectives:
The student will:
Participate in collection and removal of trash from coastal habitats
Measure and record data on the amount of trash collected by each group
Understand the value of our limited resources and the importance of protecting them
Recognize that trash contributes to water quality degradation and can have negative
impacts on the surrounding habitat, estuary, and watershed
Recognize that trash has negative impacts on wildlife, such as sea turtles and sea birds
Identify alternative solutions for waste disposal and better ways to promote stewardship
of thee bay, estuary and watershed within the community
Vocabulary
Ecology Runoff Water Cycle
Watershed Estuary Infiltration
Pollutant Habitat
The Science Literacy Project Standards-Based Curriculum
19
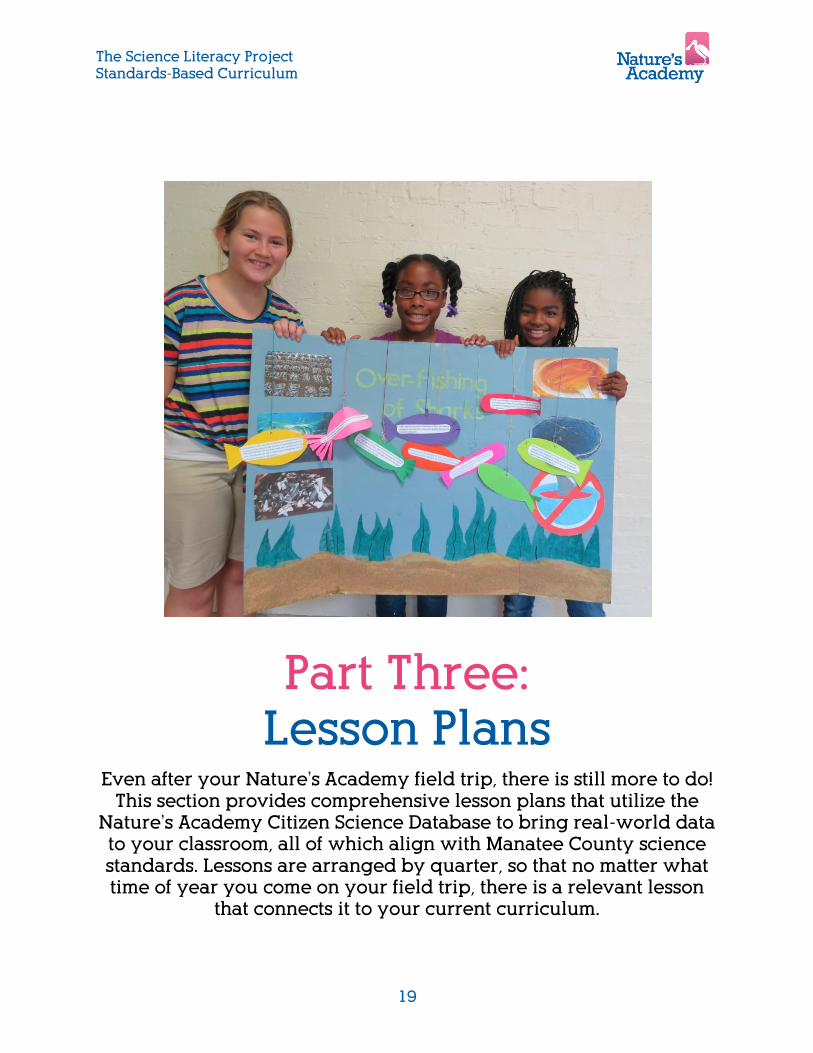
Part Three: Lesson Plans
Even after your Nature’s Academy field trip, there is still more to do! This section provides comprehensive lesson plans that utilize the
Nature’s Academy Citizen Science Database to bring real-world data to your classroom, all of which align with Manatee County science standards. Lessons are arranged by quarter, so that no matter what time of year you come on your field trip, there is a relevant lesson
that connects it to your current curriculum.
The Science Literacy Project Standards-Based Curriculum
20
Year-Round Classroom Activity Litter Lessons
Overview This activity allows students to use data from the Nature’s Academy Citizen Science Database to observe
how the amount of litter collected during a coastal cleanup varies with the time of year. Then, students
participate in their own litter cleanup and upload their data to the Citizen Science Database.
Time 30 minutes for discussion and graph construction
20 minutes for sharing and discussion
30 minutes for discussion and Extension Activity
30 minutes for evaluation
5E Integration Students have already had the opportunity to engage in their environment by attending a Nature’s
Academy field trip. Now, they have the opportunity to further explore, explain, elaborate on, and
evaluate their knowledge of the nature of science through the Nature’s Academy Citizen Science
Database.
Learning Outcomes
SC.5.N.1.1
Define a problem, use appropriate reference materials to support scientific understanding, plan and carry
out scientific investigations of various types such as: systematic observations, experiments requiring the
identification of variables, collecting and organizing data, interpreting data in charts, tables, and graphics,
analyze information, make predictions, and defend conclusions.
Materials
Computer or computer lab
Projector or document camera
Paper (butcher, poster, graph, or 8.5” x 11”)
Colored pencils, markers, or pens
Ruler or protractor
Extension Activity
Buckets
Rubber gloves
Spring scale
Litter cleanup location
Cleanup Data sheet
Preparation Teachers should access the data set from the Nature’s Academy Citizen Science Database prior to the
activity. Specific instructions on how to do this are included at the end of this lesson plan. The computer
used to download the data set must have Excel installed. Teachers can either print out the data set to
distribute to students or project it using a projector or document camera.

The Science Literacy Project Standards-Based Curriculum
21
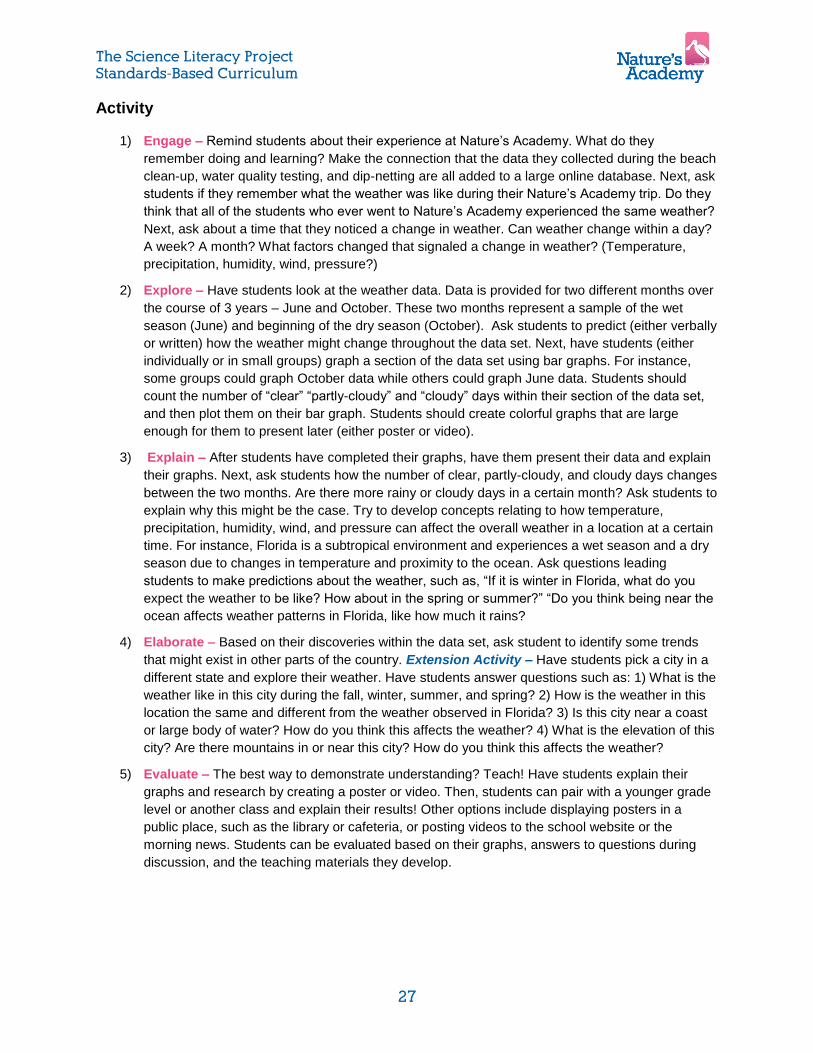
Activity
1) Engage – Remind students about their experience at Nature’s Academy. What do they
remember doing and learning? Remind students about participating in the coastal cleanup. Make
the connection that the data they collected during the beach clean-up, water quality testing, and
dip-netting are all added to a large online database. Next, ask students if they remember anything
about the cleanup. How much did they collect? What did they find? How do they think the litter
got there?
2) Explore – Have students look at the cleanup data. Is the same amount of litter picked up every
time? What do they predict the relationship between time of year and the amount of litter
collected might be? Next, have students (either individually or in small groups) graph the data set
using bar graphs. Students should use the data table provided in the data set to graph the
average litter collected in March, April, May, etc. Students should make graphs large and colorful
enough to be presented later (either on a poster board or a video). After they have finished
graphing, have students write down or discuss what they see happening to the amount of litter in
different months.
3) Explain – After students have completed their graphs, have them divide into groups and compare
their results. Next, ask students questions about the patterns they see in their graphs. How does
the amount of litter in May compare to the amount of litter in June? Ask students why they think
the amount of litter increases during certain months, like June or March. What factors do they
think could cause that? Help lead students to the idea that certain events during the school year
allow for more people to go to the beach (spring break is typically in March, especially for
colleges, and summer break begins in June). Help students think of the cleanups like a scientific
investigation. As the number of people who can go to the beach increases, the average amount
of trash collected also increases.
4) Elaborate – Now that students have used coastal cleanup data from the Nature’s Academy
database, it is time for them to collect and submit their own data! Extension Activity – Cleanups
don’t just happen at the beach. Your school is located in a watershed, which means that any
time it rains, the extra water (runoff) flows toward storm drains, streams, rivers, and eventually
the ocean. It isn’t just water that makes this journey – everything in its path (including litter) goes
with it. Students can help prevent marine debris by conducting their own cleanup on school
grounds! Nature’s Academy has provided your school with all necessary materials (buckets,
rubber gloves, and spring scale). Pick a location for your cleanup, and have students collect litter
using the supplied materials. At the end of the cleanup, empty the buckets onto a sidewalk or
other paved area and have students analyze what was collected. Record the data on the Nature’s
Academy Cleanup data sheet (included at the end of this lesson plan). Then, submit your data to
the Nature’s Academy Citizen Science Database and become a part of a national effort to monitor
litter and marine debris! (Data can be submitted by visiting http://goo.gl/forms/8UILV0MGmh)
5) Evaluate – The best way to demonstrate understanding? Teach! Have students explain their
graphs and the concept of litter and marine debris by creating a poster or video. Then, students
can pair with a younger grade level or another class and explain their results! Other options
include displaying posters in a public place, such as the library or cafeteria, or posting videos to
the school website or the morning news. Students can be evaluated based on their graphs,
answers to questions during discussion, and the teaching materials they develop.
The Science Literacy Project Standards-Based Curriculum
22
Resources
SC.5.N.1.1
CPALMS resource from the University of California describing “The Scientific Method” and how
science really works:
http://www.cpalms.org/Uploads/resources/54384/10/96/docs/how_science_works.pdf
Marine Debris
15-minute NOAA video about marine debris – what it is, where it comes from, why it is important,
and how you can help! https://youtu.be/uCQMZfnM-a4
Accessing the Data Set
1. Go to our SLP teacher’s resource page at http://www.naturesacademy.org/science-literacy-
project/teacher-resources/.
2. Scroll down and click on “Litter Lesson Data Set.”
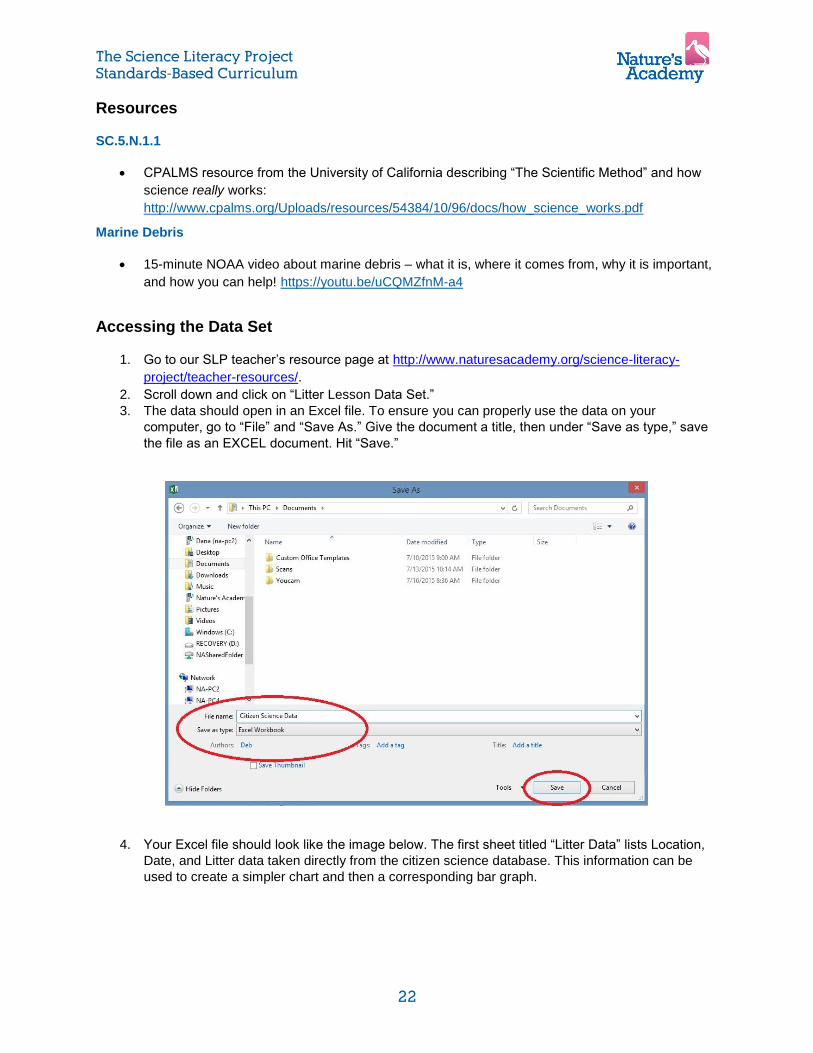
3. The data should open in an Excel file. To ensure you can properly use the data on your
computer, go to “File” and “Save As.” Give the document a title, then under “Save as type,” save
the file as an EXCEL document. Hit “Save.”
4. Your Excel file should look like the image below. The first sheet titled “Litter Data” lists Location,
Date, and Litter data taken directly from the citizen science database. This information can be
used to create a simpler chart and then a corresponding bar graph.

The Science Literacy Project Standards-Based Curriculum
23
5. The second sheet in this document, called “Example Chart,” lists the data in a form that is easier
to use for making bar graphs. This chart includes the average amount of litter collected each
month for the data provided. Students can create a similar chart from the original data or they can
use this chart to make their bar graphs.

The Science Literacy Project Standards-Based Curriculum
24
6. The third sheet, “Example Bar Graph,” provides an example bar graph created from this data.
7. The data shows that the most litter collected was during the months of March and June. One
possible explanation for this is that more people visit the park during these months because they
mark spring break and the beginning of summer. Discuss possible explanations for the data
trends with your students. How could you test these hypotheses?
The Science Literacy Project Standards-Based Curriculum
25
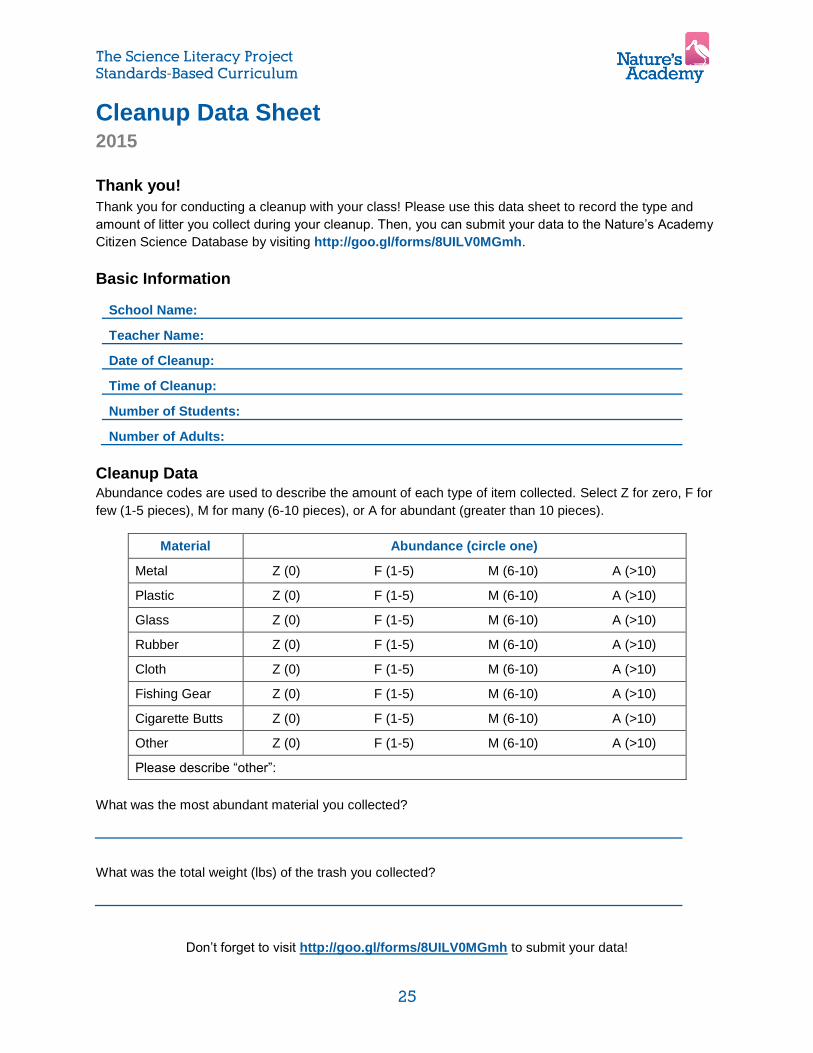
Cleanup Data Sheet 2015
Thank you!
Thank you for conducting a cleanup with your class! Please use this data sheet to record the type and
amount of litter you collect during your cleanup. Then, you can submit your data to the Nature’s Academy
Citizen Science Database by visiting http://goo.gl/forms/8UILV0MGmh.
Basic Information
School Name:
Teacher Name:
Date of Cleanup:
Time of Cleanup:
Number of Students:
Number of Adults:
Cleanup Data Abundance codes are used to describe the amount of each type of item collected. Select Z for zero, F for
few (1-5 pieces), M for many (6-10 pieces), or A for abundant (greater than 10 pieces).
Material Abundance (circle one)
Metal Z (0) F (1-5) M (6-10) A (>10)
Plastic Z (0) F (1-5) M (6-10) A (>10)
Glass Z (0) F (1-5) M (6-10) A (>10)
Rubber Z (0) F (1-5) M (6-10) A (>10)
Cloth Z (0) F (1-5) M (6-10) A (>10)
Fishing Gear Z (0) F (1-5) M (6-10) A (>10)
Cigarette Butts Z (0) F (1-5) M (6-10) A (>10)
Other Z (0) F (1-5) M (6-10) A (>10)
Please describe “other”:
What was the most abundant material you collected?
What was the total weight (lbs) of the trash you collected?
Don’t forget to visit http://goo.gl/forms/8UILV0MGmh to submit your data!

The Science Literacy Project Standards-Based Curriculum
26
Quarter 1 Classroom Activity Weather Trends
Overview This activity allows students to use data from the Nature’s Academy Citizen Science Database to observe
trends in weather over time, make weather predictions, and learn about what factors contribute to
weather.
Time
30 minutes for discussion and graph construction
20 minutes for sharing and discussion
30 minutes for Extension Activity research
30 minutes for evaluation
5E Integration Students have already had the opportunity to engage in their environment by attending a Nature’s
Academy field trip. Now, they have the opportunity to further explore, explain, elaborate on, and
evaluate their knowledge of weather through the Nature’s Academy Citizen Science Database.
Learning Outcomes
SC.5.E.7.2
Recognize that the ocean is an integral part of the water cycle and is connected to all of Earth's water
reservoirs via evaporation and precipitation processes.
SC.5.E.7.3
Recognize how air temperature, barometric pressure, humidity, wind speed and direction, and
precipitation determine the weather in a particular place and time.
SC.5.E.7.5
Recognize that some of the weather-related differences, such as temperature and humidity, are found
among different environments, such as swamps, deserts, and mountains.
SC.5.E.7.6
Describe characteristics (temperature and precipitation) of different climate zones as they relate to
latitude, elevation, and proximity to bodies of water.
Materials
Computer with Microsoft Excel
Projector or document camera
Paper (either butcher, poster, graph, or 8.5” x 11”)
Colored pencils, markers, or pens
Ruler or protractor
Preparation Teachers should access the data set from the Nature’s Academy Citizen Science Database prior to the
activity. Specific instructions on how to do this are included at the end of this lesson plan. The computer
used to download the data set must have Excel installed. Teachers can either print out the data set to
distribute to students or project it using a projector or document camera.
The Science Literacy Project Standards-Based Curriculum
27
Activity
1) Engage – Remind students about their experience at Nature’s Academy. What do they
remember doing and learning? Make the connection that the data they collected during the beach
clean-up, water quality testing, and dip-netting are all added to a large online database. Next, ask
students if they remember what the weather was like during their Nature’s Academy trip. Do they
think that all of the students who ever went to Nature’s Academy experienced the same weather?
Next, ask about a time that they noticed a change in weather. Can weather change within a day?
A week? A month? What factors changed that signaled a change in weather? (Temperature,
precipitation, humidity, wind, pressure?)
2) Explore – Have students look at the weather data. Data is provided for two different months over
the course of 3 years – June and October. These two months represent a sample of the wet
season (June) and beginning of the dry season (October). Ask students to predict (either verbally
or written) how the weather might change throughout the data set. Next, have students (either
individually or in small groups) graph a section of the data set using bar graphs. For instance,
some groups could graph October data while others could graph June data. Students should
count the number of “clear” “partly-cloudy” and “cloudy” days within their section of the data set,
and then plot them on their bar graph. Students should create colorful graphs that are large
enough for them to present later (either poster or video).
3) Explain – After students have completed their graphs, have them present their data and explain
their graphs. Next, ask students how the number of clear, partly-cloudy, and cloudy days changes
between the two months. Are there more rainy or cloudy days in a certain month? Ask students to
explain why this might be the case. Try to develop concepts relating to how temperature,
precipitation, humidity, wind, and pressure can affect the overall weather in a location at a certain
time. For instance, Florida is a subtropical environment and experiences a wet season and a dry
season due to changes in temperature and proximity to the ocean. Ask questions leading
students to make predictions about the weather, such as, “If it is winter in Florida, what do you
expect the weather to be like? How about in the spring or summer?” “Do you think being near the
ocean affects weather patterns in Florida, like how much it rains?
4) Elaborate – Based on their discoveries within the data set, ask student to identify some trends
that might exist in other parts of the country. Extension Activity – Have students pick a city in a
different state and explore their weather. Have students answer questions such as: 1) What is the
weather like in this city during the fall, winter, summer, and spring? 2) How is the weather in this
location the same and different from the weather observed in Florida? 3) Is this city near a coast
or large body of water? How do you think this affects the weather? 4) What is the elevation of this
city? Are there mountains in or near this city? How do you think this affects the weather?
5) Evaluate – The best way to demonstrate understanding? Teach! Have students explain their
graphs and research by creating a poster or video. Then, students can pair with a younger grade
level or another class and explain their results! Other options include displaying posters in a
public place, such as the library or cafeteria, or posting videos to the school website or the
morning news. Students can be evaluated based on their graphs, answers to questions during
discussion, and the teaching materials they develop.

The Science Literacy Project Standards-Based Curriculum
28
Resources
SC.5.E.7.2
NOAA Water and Climate - provides basic background information about the water cycle and how
water is related to climate. http://www.esrl.noaa.gov/research/themes/water/#what
A 9 minute NSF video about the water cycle. https://www.youtube.com/watch?v=al-do-HGuIk
SC.5.E.7.3
Edheads weather prediction game that allows students to explore the different components of
weather: http://www.edheads.org/activities/weather/index.shtml
CPALMS online tutorial detailing the 5 major factors contributing to weather:
http://www.cpalms.org/Public/PreviewResource/Preview/121033
SC.5.E.7.5
CPALMS online tutorial discussing weather-related differences in climates:
http://www.cpalms.org/Public/PreviewResource/Preview/115589
SC.5.E.7.6
CPALMS online tutorial describing the relationship between latitude and temperature:
http://www.cpalms.org/Public/PreviewResource/Preview/108186
NOAA interactive map describing climate characteristics in different climate zones:
http://oceanservice.noaa.gov/education/pd/oceans_weather_climate/media/climate_zones.swf
Accessing the Data Set
1. Go to our SLP teacher’s resource page at http://www.naturesacademy.org/science-literacy-
project/teacher-resources/.
2. Scroll down and click on “Quarter 1 Lesson Data Set.”
3. The data should open in an Excel file. To ensure you can properly use the data on your
computer, go to “File” and “Save As.” Give the document a title, then under “Save as type,” save
the file as an EXCEL document. Hit “Save.”
The Science Literacy Project Standards-Based Curriculum
29
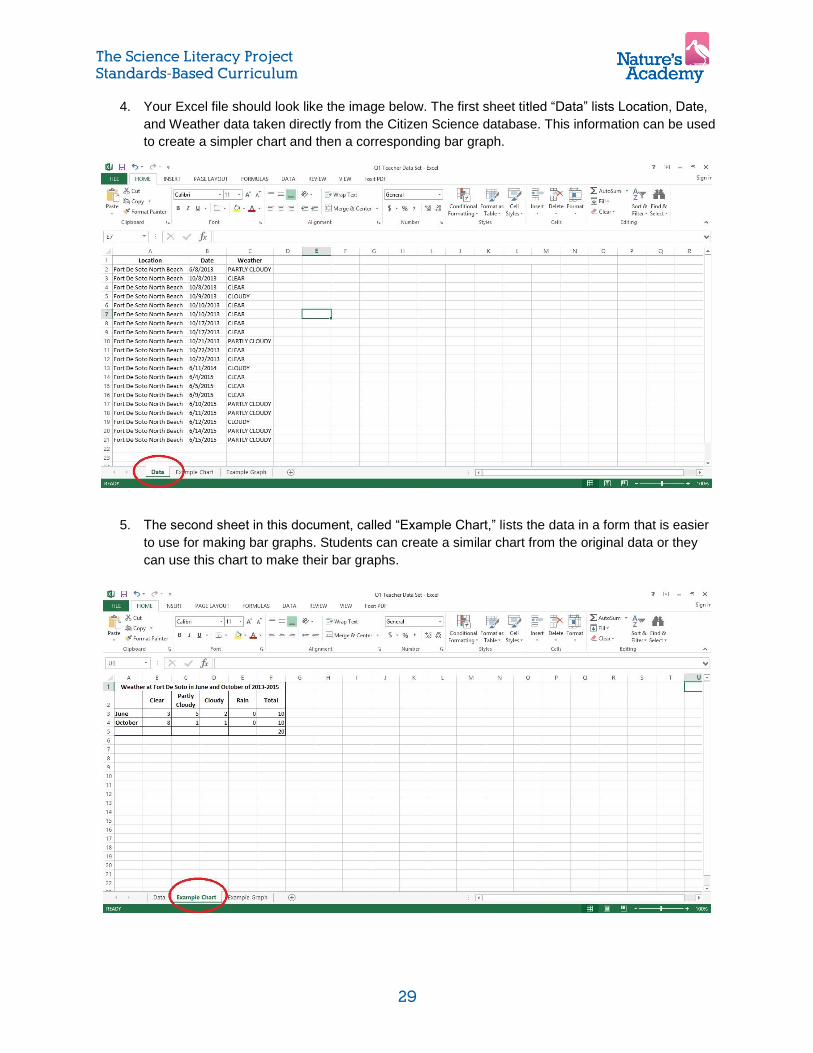
4. Your Excel file should look like the image below. The first sheet titled “Data” lists Location, Date,
and Weather data taken directly from the Citizen Science database. This information can be used
to create a simpler chart and then a corresponding bar graph.
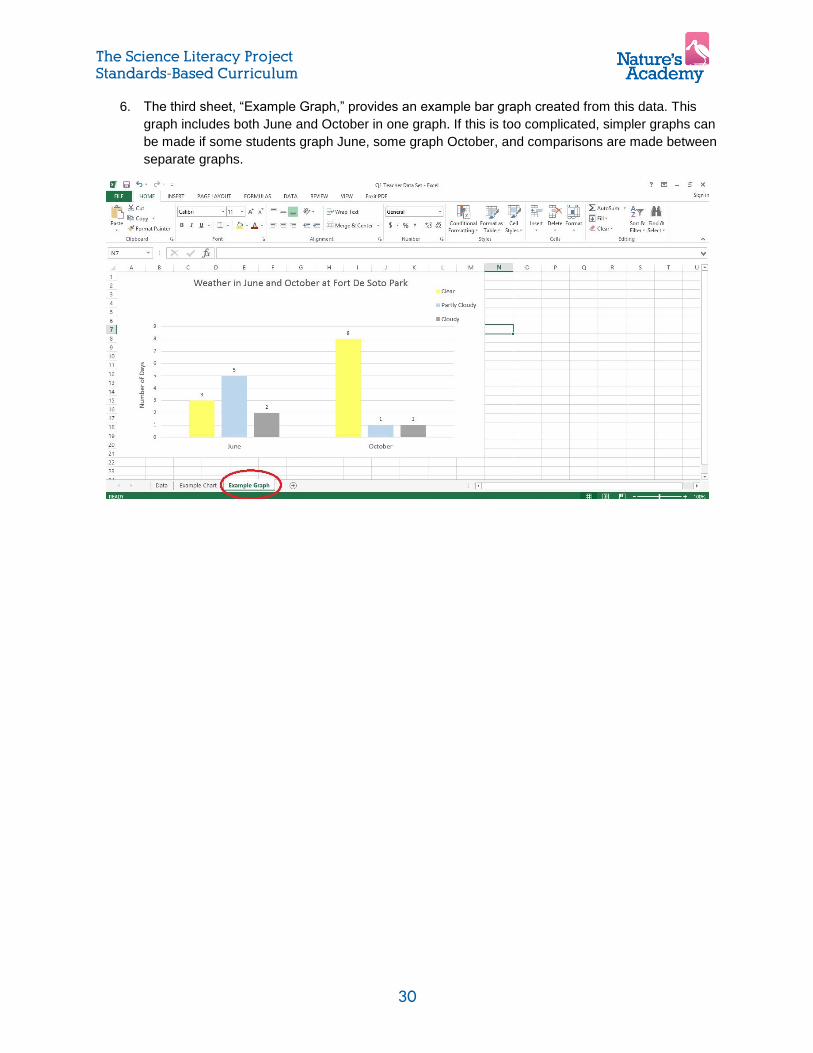
5. The second sheet in this document, called “Example Chart,” lists the data in a form that is easier
to use for making bar graphs. Students can create a similar chart from the original data or they
can use this chart to make their bar graphs.
The Science Literacy Project Standards-Based Curriculum
30
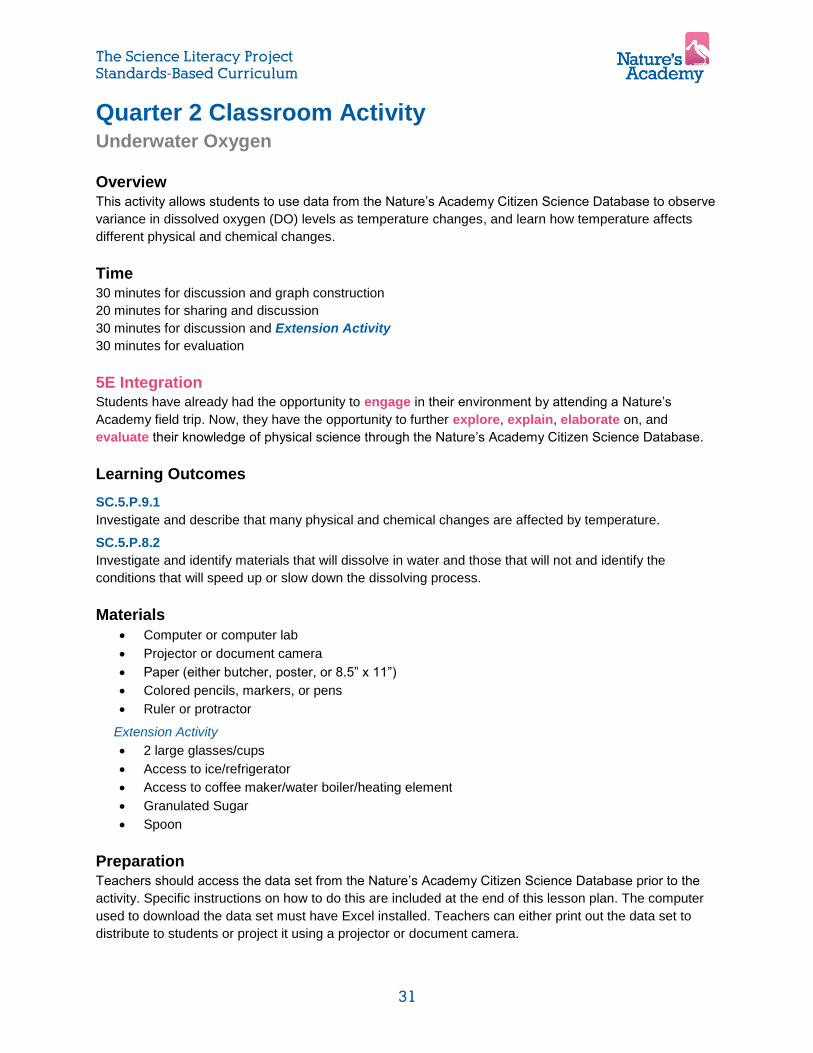
6. The third sheet, “Example Graph,” provides an example bar graph created from this data. This
graph includes both June and October in one graph. If this is too complicated, simpler graphs can
be made if some students graph June, some graph October, and comparisons are made between
separate graphs.
The Science Literacy Project Standards-Based Curriculum
31
Quarter 2 Classroom Activity Underwater Oxygen
Overview This activity allows students to use data from the Nature’s Academy Citizen Science Database to observe
variance in dissolved oxygen (DO) levels as temperature changes, and learn how temperature affects
different physical and chemical changes.
Time 30 minutes for discussion and graph construction
20 minutes for sharing and discussion
30 minutes for discussion and Extension Activity
30 minutes for evaluation
5E Integration Students have already had the opportunity to engage in their environment by attending a Nature’s
Academy field trip. Now, they have the opportunity to further explore, explain, elaborate on, and
evaluate their knowledge of physical science through the Nature’s Academy Citizen Science Database.
Learning Outcomes
SC.5.P.9.1
Investigate and describe that many physical and chemical changes are affected by temperature.
SC.5.P.8.2
Investigate and identify materials that will dissolve in water and those that will not and identify the
conditions that will speed up or slow down the dissolving process.
Materials
Computer or computer lab
Projector or document camera
Paper (either butcher, poster, or 8.5” x 11”)
Colored pencils, markers, or pens
Ruler or protractor
Extension Activity
2 large glasses/cups
Access to ice/refrigerator
Access to coffee maker/water boiler/heating element
Granulated Sugar
Spoon
Preparation Teachers should access the data set from the Nature’s Academy Citizen Science Database prior to the
activity. Specific instructions on how to do this are included at the end of this lesson plan. The computer
used to download the data set must have Excel installed. Teachers can either print out the data set to
distribute to students or project it using a projector or document camera.

The Science Literacy Project Standards-Based Curriculum
32
Activity
1) Engage – Remind students about their experience at Nature’s Academy. What do they
remember doing and learning? Make the connection that the data they collected during the beach
clean-up, water quality testing, and dip-netting are all added to a large online database. Next, ask
students if they remember using the water quality set to measure dissolved oxygen. Ask students
leading questions, such as “What do fish breathe?” “What is dissolved oxygen?” and “Do you
think the amount of oxygen in the water can change?” Next, ask students to brainstorm some
ways that oxygen gets into the water (waves/wind, photosynthesis of underwater plants).
2) Explore – Have students look at the dissolved oxygen and temperature data. Is it always the
same? What do they predict the relationship between temperature and dissolved oxygen might
be? Next, have students (either individually or in small groups) graph a section of the data set
using line graphs. The graphs should be large and colorful enough to be presented later (either
on a poster board or video). For instance, some students could create a graph for temperature
(Date vs Temperature) while another group could create a graph for dissolved oxygen (Date vs
Dissolved Oxygen). Students should draw a line to connect the dots between each date using a
protractor or ruler. Student should also record on a piece of paper whether their variable
increased or decreased between each data point (for example, if the temperature on Day 1 was
32 degrees C and 28 degrees C on Day 2, the student would write “decrease”, and so on).
3) Explain – After students have completed their graphs, have them pair up with another student or
small group that graphed the opposite variable that they did. Students should now be able to
compare dissolved oxygen levels and temperature for each day in the data set. Ask leading
questions, such as “When dissolved oxygen was the highest, what was the temperature?” and
“When dissolved oxygen was the lowest, what was the temperature?” Next, prompt students to
compare their increase/decrease data. What happened to temperature when dissolved oxygen
increased? What happened when it decreased? Ask students to identify a relationship between
dissolved oxygen and temperature (inverse). Next, help students identify that because there is an
inverse relationship between temperature and dissolved oxygen, dissolved oxygen is high when
the temperature is low.
4) Elaborate – Based on their discoveries within the data set, ask students to develop some
theories about why water is able to hold more oxygen when it is cold. Encourage students to think
about how close together or spread-out particles are in a solid, liquid, and gas. Ask leading
questions, such as “Are particles packed the tightest and moving the slowest in a solid, liquid, or
gas?” and “When are they the furthest apart and moving the fastest?” Lead students to the idea
that when water gets colder (closer to the solid state of ice) its particles become closer together
and move slower. This makes it harder for the spread-out particles of oxygen (a gas) to escape
from the water (therefore, there is more oxygen stuck in the water). Extension Activity – A
related concept to explore is the effect of temperature on the solubility of solids in liquids. Solids
will dissolve more readily in hot water than in cold. Students might be confused by this because it
seems to contradict what they just learned about dissolved gases. However, it is based on the
same concept! Solids dissolve more readily in hot water because as temperature increases,
water particles become faster-moving and more spread out, allowing solids to enter and dissolve.
The same property of water that keeps gases like oxygen trapped in keeps solids trapped out at
low temperatures. To demonstrate this, a short lab can be conducted. Prepare one large glass of
ice water and another large glass of hot water. Have students spoon one tablespoon of
granulated sugar into each glass and record their observations. Students should be able to
answer questions such as, “Which dissolved quicker – sugar in hot water, or sugar in cold water?”
The Science Literacy Project Standards-Based Curriculum
33
and “Why do you think the sugar dissolved quicker at different temperatures?”
5) Evaluate – The best way to demonstrate understanding? Teach! Have students explain their
graphs and labs by creating a poster or video. Then, students can pair with a younger grade level
or another class and explain their results! Other options include displaying posters in a public
place, such as the library or cafeteria, or posting videos to the school website or the morning
news. Students can be evaluated based on their graphs, answers to questions during discussion,
and the teaching materials they develop.
Resources
SC.5.P.9.1
MIT K12 video explaining what dissolved oxygen is, how it gets in the water, its relationship to
temperature, and why it is important: https://www.youtube.com/watch?v=oVW5LAzd7Ec
Chapter 5: Lesson 2 (Properties of Matter) in National Geographic textbook corresponds with
discussion about states of matter.
Chapter 5: Lesson 6 (Physical and Chemical Changes) in National Geographic textbook
corresponds with discussion about states of matter and temperature.
SC.5.P.8.2
Chapter 5 Lesson 8: Investigate Dissolving in National Geographic textbook provides an
extended lab activity that explores solubility and the effect of temperature.
Accessing the Data Set
1. Go to our SLP teacher’s resource page at http://www.naturesacademy.org/science-literacy-
project/teacher-resources/.
2. Scroll down and click on “Quarter 2 Lesson Data Set.”
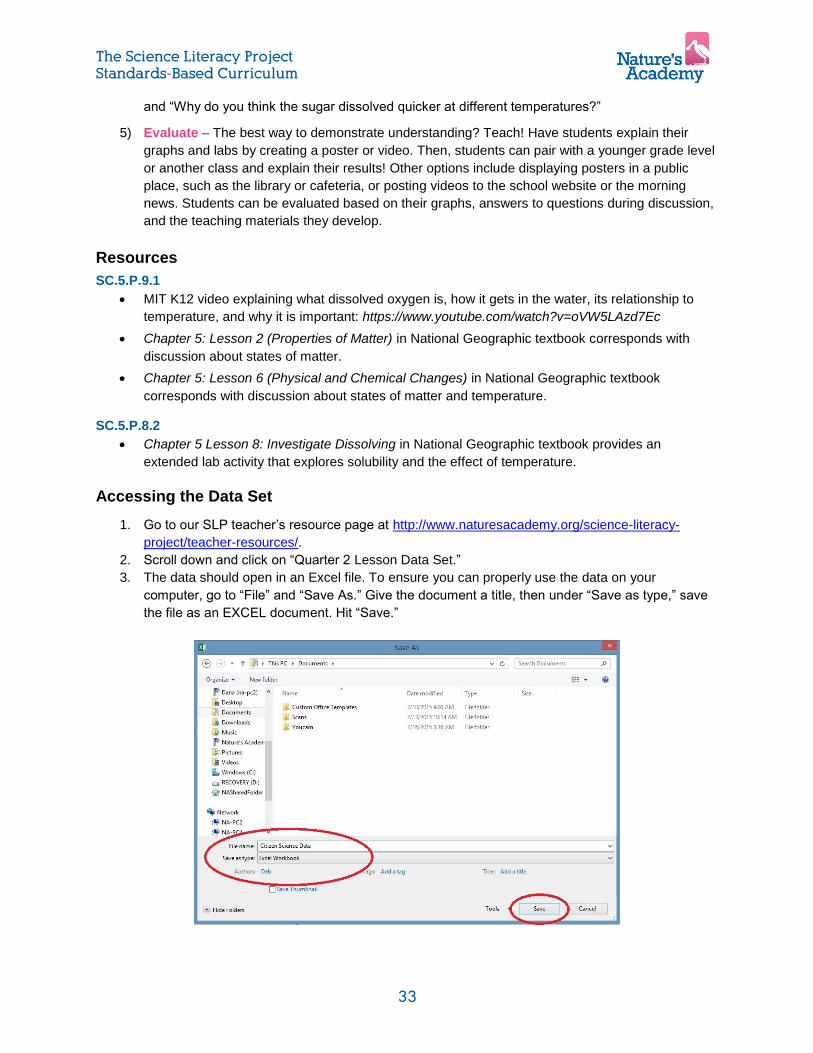
3. The data should open in an Excel file. To ensure you can properly use the data on your
computer, go to “File” and “Save As.” Give the document a title, then under “Save as type,” save
the file as an EXCEL document. Hit “Save.”
The Science Literacy Project Standards-Based Curriculum
34
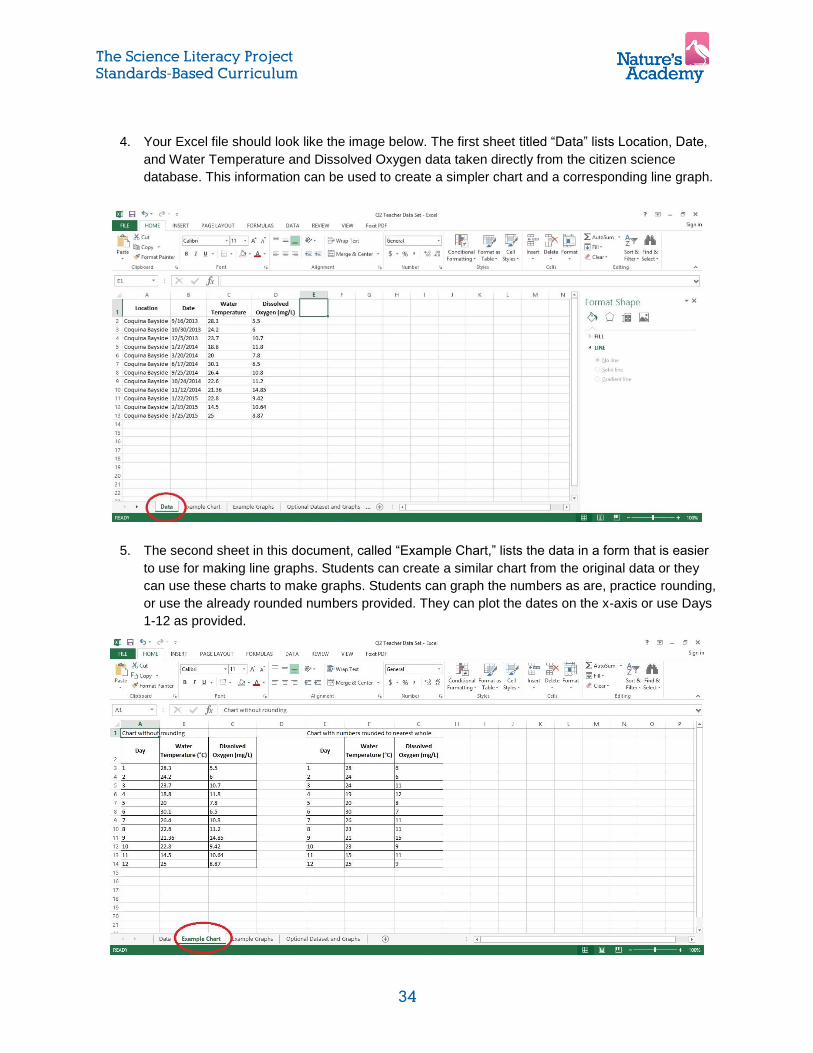
4. Your Excel file should look like the image below. The first sheet titled “Data” lists Location, Date,
and Water Temperature and Dissolved Oxygen data taken directly from the citizen science
database. This information can be used to create a simpler chart and a corresponding line graph.
5. The second sheet in this document, called “Example Chart,” lists the data in a form that is easier
to use for making line graphs. Students can create a similar chart from the original data or they
can use these charts to make graphs. Students can graph the numbers as are, practice rounding,
or use the already rounded numbers provided. They can plot the dates on the x-axis or use Days
1-12 as provided.

The Science Literacy Project Standards-Based Curriculum
35
6. The third sheet, “Example Graphs,” provides example line graphs created from this data.
Students can make two different graphs, one with water temperature and one with dissolved
oxygen, or they can graph both lines on the same graph. Either way, they should observe and
explain that the lines move in different directions from point to point and discuss why that is.
7. The fourth sheet, “Optional Datasets and Graphs,” provides some additional datasets and graphs
if teachers would like to continue practicing line graphs and exploring the relationship between
dissolved oxygen and water temperature. There are two sets of data, one for Coquina Bayside
and one for Fort De Soto North Beach. The associated line graphs show the water temperature
on the x-axis and concentration of dissolved oxygen on the y-axis. A trendline (“line of best fit”)
was added to the scatterplot to better show that as water temperature increases, dissolved
oxygen decreases.
The Science Literacy Project Standards-Based Curriculum
36
Quarter 3 Classroom Activity What’s Wind?
Overview This activity allows students to use data from the Nature’s Academy Citizen Science Database to observe
how wind speed varies with time of day and explore why air moves as wind.
Time 30 minutes for discussion and graph construction
20 minutes for sharing and discussion
30 minutes for discussion and Extension Activity
30 minutes for evaluation
5E Integration Students have already had the opportunity to engage in their environment by attending a Nature’s
Academy field trip. Now, they have the opportunity to further explore, explain, elaborate on, and
evaluate their knowledge of physical science through the Nature’s Academy Citizen Science Database.
Learning Outcomes
SC.5.P.10.1
Investigate and describe some basic forms of energy, including: light, heat, sound, electrical, chemical,
and mechanical.
SC.5.P.10.2
Investigate and explain that energy has the ability to cause motion or create change.
Materials
Computer or computer lab
Projector or document camera
Paper (either butcher, poster, graph, or 8.5” x 11”)
Colored pencils, markers, or pens
Ruler or protractor
Extension Activity
1 large, clear container (small fish tank, clear jar, etc.)
Access to ice cube tray and freezer
Access to coffee maker/water boiler/heating element
Small jar/vial
Food coloring
Preparation Teachers should access the data set from the Nature’s Academy Citizen Science Database prior to the
activity. Specific instructions on how to do this are included at the end of this lesson plan. The computer
used to download the data set must have Excel installed. Teachers can either print out the data set to
distribute to students or project it using a projector or document camera.

The Science Literacy Project Standards-Based Curriculum
37
Activity
1) Engage – Remind students about their experience at Nature’s Academy. What do they
remember doing and learning? Make the connection that the data they collected during the beach
clean-up, water quality testing, and dip-netting are all added to a large online database. Next, ask
students if they remember how windy it was when they were at the beach. What do they think
wind is? Where does it come from? Why do we feel it? Is the wind the same all the time, or can it
change within an hour or day?
2) Explore – Have students look at the wind speed vs time data. Is it always the same? What do
they predict the relationship between time and wind speed might be? Next, have students (either
individually or in small groups) graph the data set using bar graphs. Students should use the data
table provided in the data set to graph the average wind speed from 9 -10 AM, 10 – 11 AM, etc.
Students should make graphs large and colorful enough to be presented later (either on a poster
board or a video). After they have finished graphing, have students write down or discuss what
they see happening to the wind as the time moves from morning to afternoon.
3) Explain – After students have completed their graphs, have them divide into groups and compare
their results. Next, ask students questions about the trends they see in their graphs. How does
the average wind speed from 9 – 10 AM compare to the average wind speed from 12 – 1 PM?
Ask students why they think the wind increases throughout the morning. What factors do they
think could cause that? Help lead students to the idea that energy can cause motion and create
change. Wind is simply the particles in the air moving. What source of energy could cause that?
Help students realize that the sun releases energy as light and heat. There isn’t a lot of energy
yet in the morning, when the sun first appears. However, as the day progresses, the sun releases
more and more energy. This causes the air to heat up (become more energized), and allows for
the possibility of wind!
4) Elaborate – Now that students have discovered that wind is caused by the energy released by
the sun, we can answer another important question: Why does the wind blow in different
directions and at different speeds? Extension Activity – At the Earth’s surface, the wind doesn’t
come from straight up (where the sun is) but from the North, South, East, or West. Why would
this be? Wind is caused by the uneven heating of the Earth’s surface. In other words, different
parts of the Earth heat up faster or slower than one another when the sun shines on them. This is
especially true near the water. Water and land heat up and cool down at different rates, which
warms and cools the air above them at different rates. This difference in temperature is what
creates wind. The temperature of the air changes its density (hot air is less dense, cold air is
more dense). Hot air rises because it is less dense, while cold air sinks. This creates movement
of the air, also known as wind! To illustrate this, a simple demonstration using hot and cold water
(simulating air) can be conducted. A video of this demonstration is available at this link:
https://youtu.be/bN7E6FCuMbY
5) Evaluate – The best way to demonstrate understanding? Teach! Have students explain their
graphs and lab by creating a poster or video. Then, students can pair with a younger grade level
or another class and explain their results! Other options include displaying posters in a public
place, such as the library or cafeteria, or posting videos to the school website or the morning
news. Students can be evaluated based on their graphs, answers to questions during discussion,
and the teaching materials they develop.

The Science Literacy Project Standards-Based Curriculum
38
Resources
SC.5.P.10.1
Chapter 4: Lesson 3 (Weather) pgs 154-155 in National Geographic textbook describes wind and
references the movement of air from areas of high pressure to low pressure.
A tutorial describing that heat is a form of energy:
http://www.cpalms.org/Public/PreviewResource/Preview/119033
SC.5.P.10.2
Bill Nye the Science Guy video about how heat energy influences the movement of air: https://youtu.be/uBqohRu2RRk
A moving wind map showing wind across the United States: http://hint.fm/wind/
Accessing the Data Set 1. Go to our SLP teacher’s resource page at http://www.naturesacademy.org/science-literacy-
project/teacher-resources/.
2. Scroll down and click on “Quarter 3 Lesson Data Set.”
3. The data should open in an Excel file. To ensure you can properly use the data on your
computer, go to “File” and “Save As.” Give the document a title, then under “Save as type,” save
the file as an EXCEL document. Hit “Save.”
The Science Literacy Project Standards-Based Curriculum
39
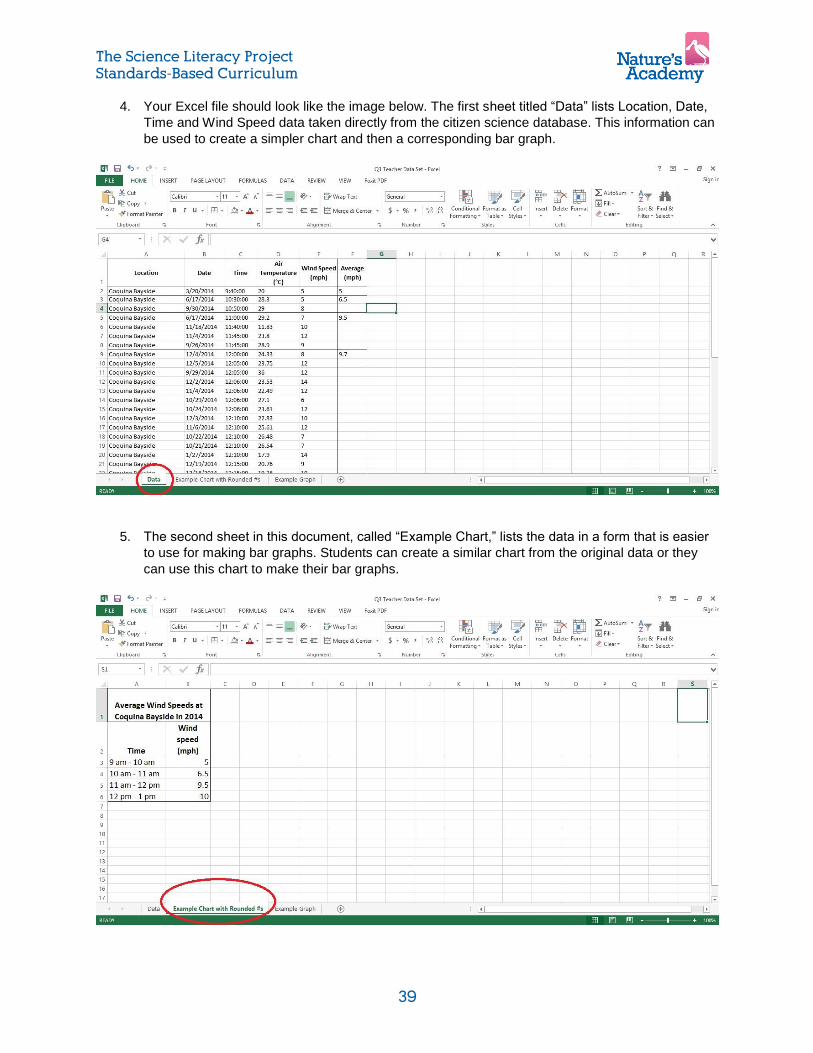
4. Your Excel file should look like the image below. The first sheet titled “Data” lists Location, Date,
Time and Wind Speed data taken directly from the citizen science database. This information can
be used to create a simpler chart and then a corresponding bar graph.
5. The second sheet in this document, called “Example Chart,” lists the data in a form that is easier
to use for making bar graphs. Students can create a similar chart from the original data or they
can use this chart to make their bar graphs.

The Science Literacy Project Standards-Based Curriculum
40
6. The third sheet, “Example Graph,” provides an example bar graph created from this data.
Students will create a bar graph similar to this one and discuss the trend.
The Science Literacy Project Standards-Based Curriculum
41
Quarter 4 Classroom Activity Name That Species
Overview This activity allows students to use data from the Nature’s Academy Citizen Science Database to observe
and describe different marine species observed along a local coast.
Time 30 minutes for discussion and graph construction
20 minutes for sharing and discussion
30 minutes for discussion and Extension Activity
30 minutes for evaluation
5E Integration Students have already had the opportunity to engage in their environment by attending a Nature’s
Academy field trip. Now, they have the opportunity to further explore, explain, elaborate on, and
evaluate their knowledge of life science through the Nature’s Academy Citizen Science Database.
Learning Outcomes
SC.5.L.14.2
Compare and contrast the function of organs and other physical structures of plants and animals,
including humans, for example: some animals have skeletons for support – some with internal skeletons
others with exoskeletons – while some plants have stems for support.
Materials
Computer or computer lab
Projector or document camera
Paper (either butcher, poster, graph, or 8.5” x 11”)
Colored pencils, markers, or pens
Ruler or protractor
Extension Activity
Access to computer lab or library
Notebook
Colored pencils, markers, or pens
Ruler or protractor
Preparation
Teachers should access the data set from the Nature’s Academy Citizen Science Database prior to the
activity. Specific instructions on how to do this are included at the end of this lesson plan. The computer
used to download the data set must have Excel installed. Teachers can either print out the data set to
distribute to students or project it using a projector or document camera.

The Science Literacy Project Standards-Based Curriculum
42
Activity
1) Engage – Remind students about their experience at Nature’s Academy. What do they
remember doing and learning? Make the connection that the data they collected during the beach
clean-up, water quality testing, and dip-netting are all added to a large online database. Next, ask
students if they remember dip-netting at the beach. What do they remember catching? Is there a
specific animal that they remember catching a lot of? Next, ask students whether they think every
student who goes on a Nature’s Academy field trip catches the same animals. Do they think
some animals are always more common than others, or do they think it changes every day?
2) Explore – Have students look at the most abundant species data (be sure to discuss the
meaning of “abundant”). Explain that this data shows which animals were the most common on
the different days students went on a Nature’s Academy field trip. Is the most common animal
always the same? What do they predict will be the most common animal overall? Next, have
students (either individually or in small groups) graph the data set using bar graphs. Students
should use the data table provided in the data set to graph the number of days each species was
said to be the “most abundant”. Students should make graphs large and colorful enough to be
presented later (either on a poster board or a video). After they have finished graphing, have
students write down or discuss any patterns they see in the data.
3) Explain – After students have completed their graphs, discuss what patterns they see. Are some
species a lot more common than others? Can the most abundant species change from day to
day? Have students brainstorm about why the most common species might change every day.
Lead them to the idea that factors such as what time of year it is, how many students were dip-
netting, and where students were dip-netting can all change which species they caught the most
of. Help students realize that some animals migrate throughout the year, which can change when
they are common in a certain area.
4) Elaborate – Now that students have discovered that the most common species in an area can
change, they can explore more about each animal! Extension Activity – Have students (either
individually or in small groups) pick one of the species to research (you may consider assigning a
species to each student/small group to ensure equal distribution). Have students gather
information about the animal’s appearance, internal structure (skeleton, senses, reproductive,
digestive system, etc.), and preferred habitat. Have students write down this information in a
notebook or word document. Next, have students/small groups who chose different animals pair
up and compare the species they researched. What is similar about their animals? What is
different? How do each of their animals compare to humans?
5) Evaluate – The best way to demonstrate understanding? Teach! Have students present their
graphs and species research by creating a poster or video. Then, students can pair with a
younger grade level or another class and explain their results! Other options include displaying
posters in a public place, such as the library or cafeteria, or posting videos to the school website
or the morning news. Students can be evaluated based on their graphs, answers to questions
during discussion, and the teaching materials they develop.
Resources
SC.5.L.14.2
National Geographic resource for students to conduct research about animals: http://kids.nationalgeographic.com/animals/
The Science Literacy Project Standards-Based Curriculum
43
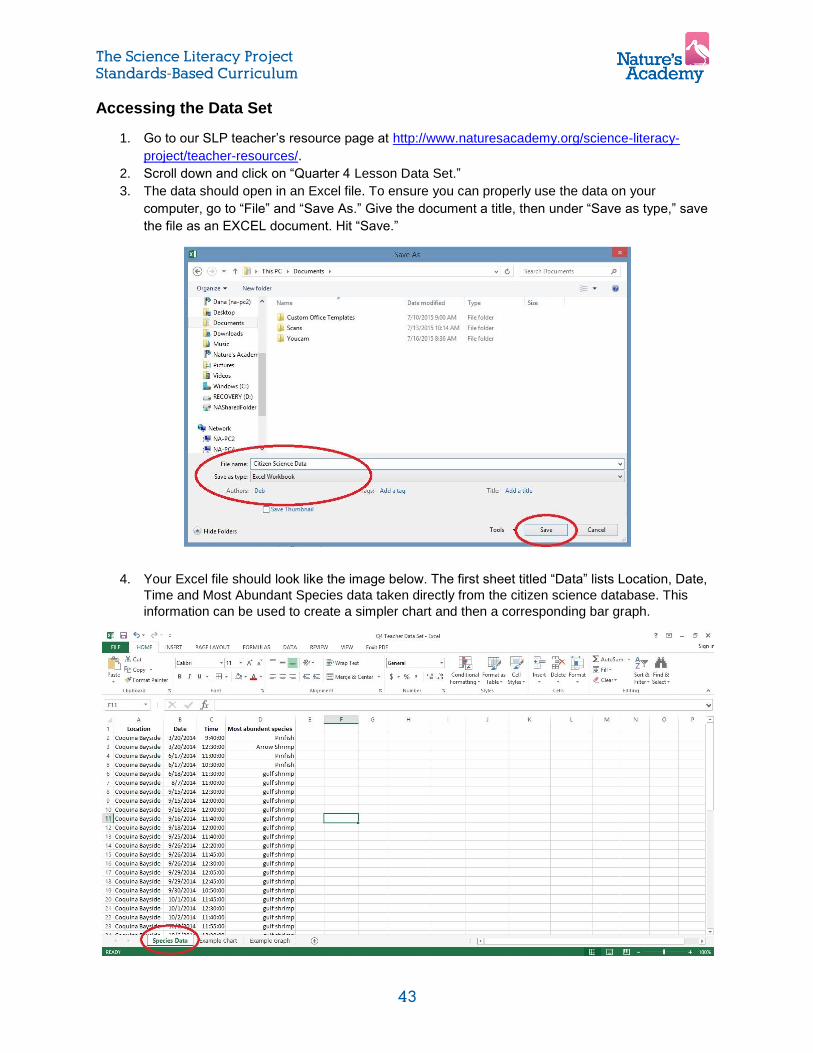
Accessing the Data Set
1. Go to our SLP teacher’s resource page at http://www.naturesacademy.org/science-literacy-
project/teacher-resources/.
2. Scroll down and click on “Quarter 4 Lesson Data Set.”
3. The data should open in an Excel file. To ensure you can properly use the data on your
computer, go to “File” and “Save As.” Give the document a title, then under “Save as type,” save
the file as an EXCEL document. Hit “Save.”
4. Your Excel file should look like the image below. The first sheet titled “Data” lists Location, Date,
Time and Most Abundant Species data taken directly from the citizen science database. This
information can be used to create a simpler chart and then a corresponding bar graph.
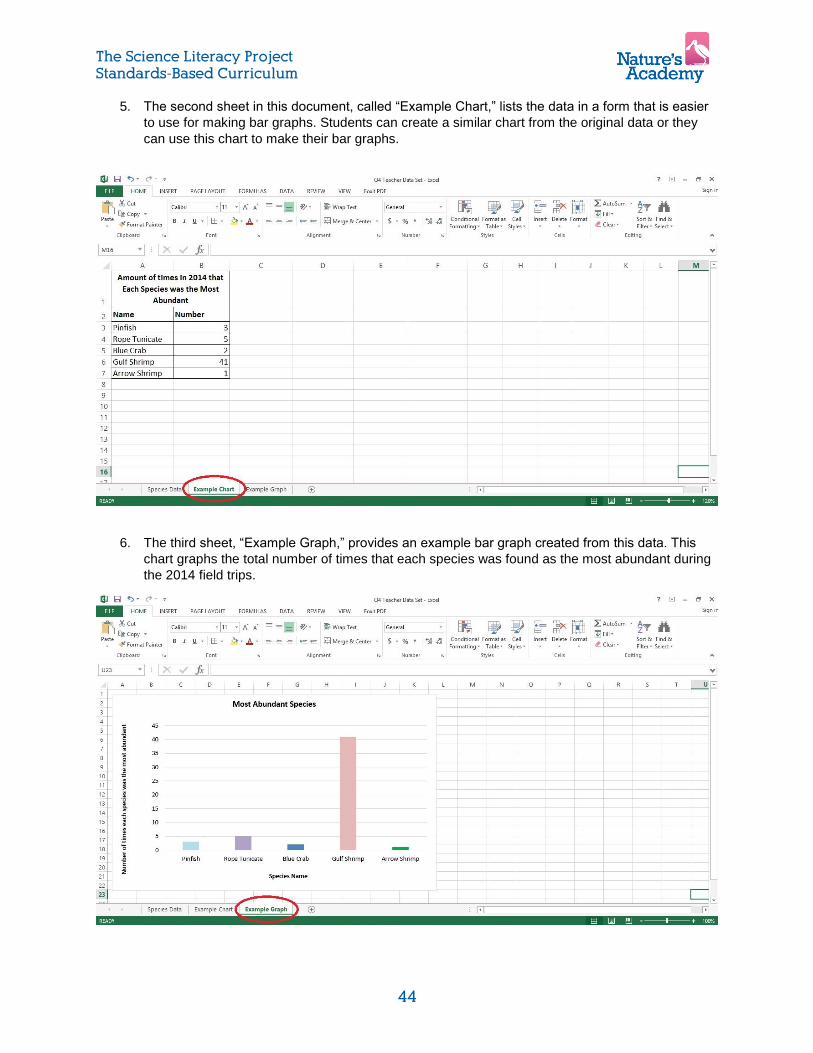
The Science Literacy Project Standards-Based Curriculum
44
5. The second sheet in this document, called “Example Chart,” lists the data in a form that is easier
to use for making bar graphs. Students can create a similar chart from the original data or they
can use this chart to make their bar graphs.
6. The third sheet, “Example Graph,” provides an example bar graph created from this data. This
chart graphs the total number of times that each species was found as the most abundant during
the 2014 field trips.
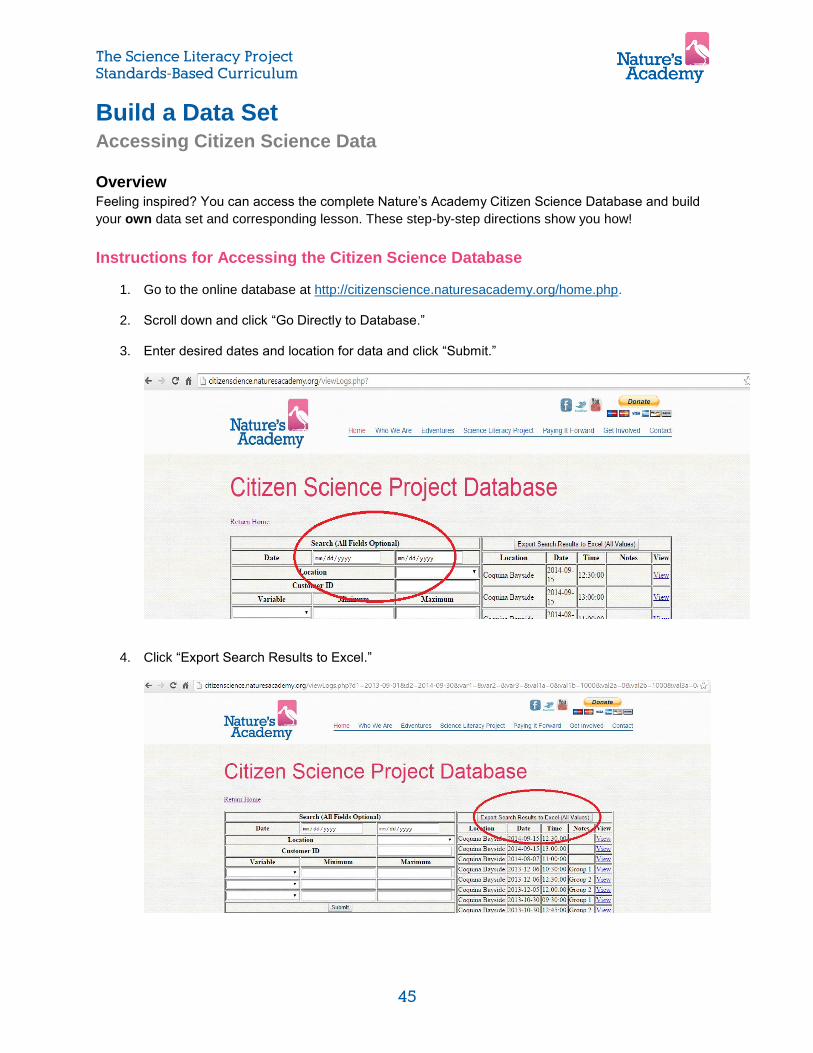
The Science Literacy Project Standards-Based Curriculum
45
Build a Data Set Accessing Citizen Science Data
Overview Feeling inspired? You can access the complete Nature’s Academy Citizen Science Database and build
your own data set and corresponding lesson. These step-by-step directions show you how!
Instructions for Accessing the Citizen Science Database
1. Go to the online database at http://citizenscience.naturesacademy.org/home.php.
2. Scroll down and click “Go Directly to Database.”
3. Enter desired dates and location for data and click “Submit.”
4. Click “Export Search Results to Excel.”

The Science Literacy Project Standards-Based Curriculum
46
5. The downloaded document should open in Excel. Open it and go to “File” and “Save As.” Give the document a title, then under “Save as type,” save the file as an EXCEL WORKBOOK. Click “Save.”
Now you can use this data to create different graphs and charts and to explore a number of relationships between parameters like temperature, weather, dissolved oxygen, etc.
6. Choose data parameters from the Excel spreadsheet. In this example we will use Water Temperature and Date to see how the temperature changes over time. We will be looking at the water temperature between March and October 2014 at Coquina Bayside.
7. First, we will sort the Location column to make it easier to find the Coquina Bayside data. Highlight the location column. Click “Sort and Filter” then “A to Z.” If you are asked to expand the selection, click “yes”.
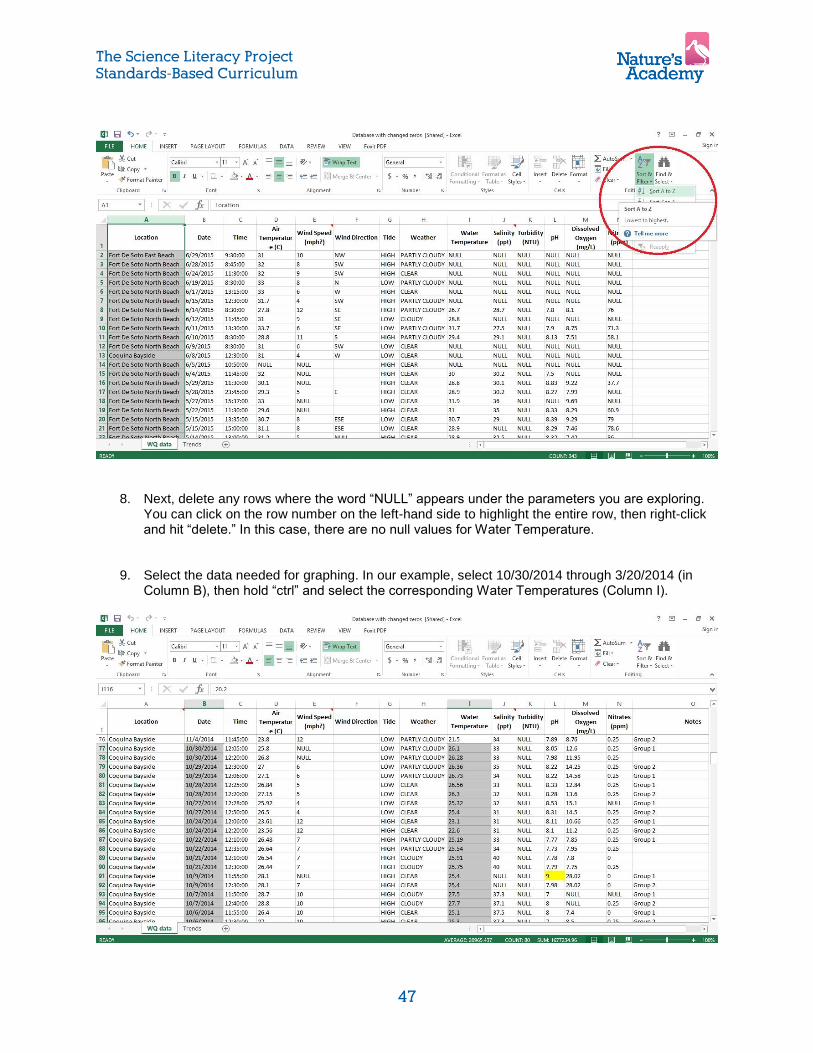
The Science Literacy Project Standards-Based Curriculum
47
8. Next, delete any rows where the word “NULL” appears under the parameters you are exploring. You can click on the row number on the left-hand side to highlight the entire row, then right-click and hit “delete.” In this case, there are no null values for Water Temperature.
9. Select the data needed for graphing. In our example, select 10/30/2014 through 3/20/2014 (in Column B), then hold “ctrl” and select the corresponding Water Temperatures (Column I).

The Science Literacy Project Standards-Based Curriculum
48
10. On the top menu bar, click “Insert” – “Chart” – “Scatter” – and select “XY Scatter.”
A graph should appear on the spreadsheet. Now it is time to format the graph.
11. Click “Quick Layout” and choose the first option to give your graph a title and to give your axes labels. Label your axes. You can also change the scale on the axes by right-clicking on the axis and going to “Format Axis…”
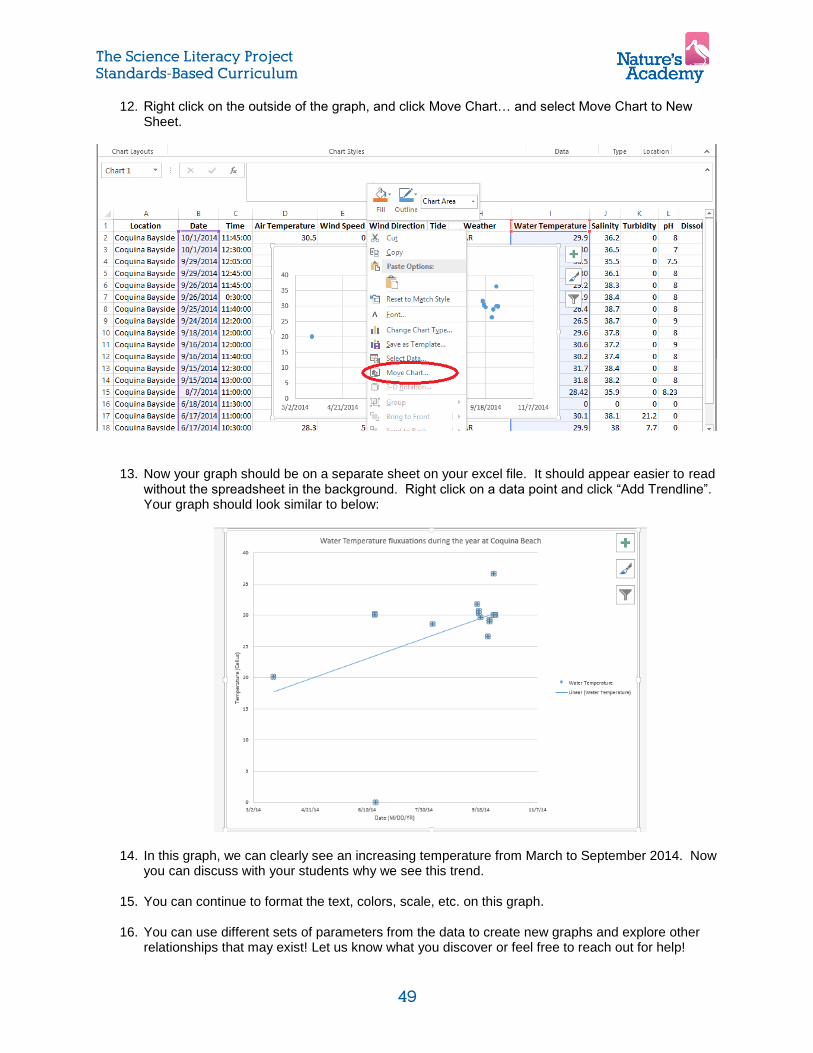
The Science Literacy Project Standards-Based Curriculum
49
12. Right click on the outside of the graph, and click Move Chart… and select Move Chart to New Sheet.
13. Now your graph should be on a separate sheet on your excel file. It should appear easier to read without the spreadsheet in the background. Right click on a data point and click “Add Trendline”. Your graph should look similar to below:
14. In this graph, we can clearly see an increasing temperature from March to September 2014. Now you can discuss with your students why we see this trend.
15. You can continue to format the text, colors, scale, etc. on this graph.
16. You can use different sets of parameters from the data to create new graphs and explore other relationships that may exist! Let us know what you discover or feel free to reach out for help!