nature of orchestral noise - university of queensland159034/uq159034_oa.pdf · professional...
TRANSCRIPT

Redistrib
Nature of orchestral noiseIan O’Briena�
The Queensland Orchestra; School of Music, The University of Queensland, St Lucia Brisbane QLD 4072,Australia
Wayne WilsonSchool of Health and Rehabilitation Sciences, The University of Queensland, St Lucia Brisbane QLD 4072,Australia
Andrew BradleySchool of Information Technology and Electrical Engineering, The University of Queensland,St Lucia Brisbane QLD 4072, Australia
�Received 10 January 2008; revised 12 May 2008; accepted 14 May 2008�
Professional orchestral musicians are at risk of exposure to excessive noise when at work. This isan industry-wide problem that threatens not only the hearing of orchestral musicians but also theway orchestras operate. The research described in this paper recorded noise levels within aprofessional orchestra over three years in order to provide greater insight to the orchestral noiseenvironment; to guide future research into orchestral noise management and hearing conservationstrategies; and to provide a basis for the future education of musicians and their managers. Everyrehearsal, performance, and recording from May 2004 to May 2007 was monitored, with thewoodwind, brass, and percussion sections monitored in greatest detail. The study recorded dBALEQand dBC peak data, which are presented in graphical form with accompanying summarized datatables. The findings indicate that the principal trumpet, first and third horns, and principal tromboneare at greatest risk of exposure to excessive sustained noise levels and that the percussion andtimpani are at greatest risk of exposure to excessive peak noise levels. However, the findings alsostrongly support the notion that the true nature of orchestral noise is a great deal more complex thanthis simple statement would imply. © 2008 Acoustical Society of America.�DOI: 10.1121/1.2940589�
PACS number�s�: 43.50.Rq, 43.50.Yw, 43.75.Cd �KA� Pages: 926–939
I. INTRODUCTIONThe livelihood of orchestral musicians is often depen-
dent upon creating a great deal of sound. By repeated expo-sure to this sound, orchestral musicians risk suffering noiseinduced hearing loss �NIHL� that not only threatens theirlivelihood, but also their quality of life �Sataloff and Sataloff,2006�. Adding to these concerns, large orchestras producenoise levels that breach workplace health and safety laws,bringing into question the viability of the industry itself.
Noise is generally defined as unwanted or unpleasantsound. Clearly, the sound levels that orchestras createthrough musical performance are not unwanted; in fact theyare necessary in order to continue the art form. The problemarises when the otological health of the musicians is jeopar-dized when performing this music. As the word ‘noise’ alonedoes not adequately describe the phenomenon, this paperwill refer to high-level orchestral sound as orchestral noise.The report defines the nature of orchestral noise in detail.
II. RELEVANT LITERATURE
A. Review of past studies
There have been many studies into orchestral noise inprofessional orchestras. These can be broken down into three
a�
Electronic mail: [email protected]926 J. Acoust. Soc. Am. 124 �2�, August 2008 0001-4966/2008/1
ution subject to ASA license or copyright; see http://acousticalsociety.org/c
basic categories: level studies, loss studies, and linking stud-ies.
“Level” studies have sought to describe the nature oforchestral noise, usually measuring noise levels in one ormore orchestras and allocating potential risk to musiciansbased on how these levels relate to existing data regardingNIHL. “Loss” studies have sought to draw conclusions aboutthe risks of NIHL to professional musicians by studying theotological health of the musicians themselves. “Linking”studies have sought to demonstrate a link between orchestralnoise and NIHL in orchestral musicians by measuring soundlevels in one �or a number� of specific orchestras and thenassessing the otological health of the musicians in these or-chestras.
As the current study is more concerned with the natureof orchestral noise than with attempting to establish a corre-lation between exposure to music and NIHL, the followingliterature review will focus upon previous level studies anddescriptions of the orchestral noise environment presented inprevious linking studies. Table I summarizes these studiesand their findings. It must be noted that comparing previ-ously obtained orchestral noise data is difficult, as these datahave often been recorded from only a small sample of anygiven orchestra’s activities. Previous studies have also used a
range of sound level measures, the most common being© 2008 Acoustical Society of America24�2�/926/14/$23.00
ontent/terms. Download to IP: 130.102.158.22 On: Thu, 29 Oct 2015 03:29:59

Redistrib
TABLE I. Scope of studies to date.
Study Venue type Repertoire type
Number orduration of
measurementsNumber ofdata points
Microphonepositionsspecified?
Orchestraset-up
specified? Findings
Axelsson andLindgren
1981
Orchestra pitand concert
hall
Symphonic�small to large�,opera and ballet
89 14 No No Highest levels in brass and woodwind. Differencesbetween positions were between 4 and 6 dB. Widevariation level over very short periods. Differencein dynamic range between venues:85.5–92.5 dBALEQ for the pit and77.9–94.4 dBALEQ in the concert hall.
Westmoreand Eversden
1981
Concert hall,rehearsal halland orchestra
pit
Symphonic�small to large�,opera and ballet
14.4 h 3 No No Description of microphone position is vague.Because of this the survey yields little useableinformation on the nature of orchestral noiseapart from broad statements about the level ofvarious pieces and the level of transient peaks�in excess of 120 dBA�.
Jansson andKarlsson
1983
Concert hall,rehearsal halland orchestra
pit
Symphonic�small to large�,opera and ballet
42 11? Yes No Repertoire separated into heavy, medium, andlight and positions into exposed and normal.Found noise levels exceeded 85 dBALEQ8 h inexposed positions after 10 h of orchestral workand after 25 h in normal positions during heavyrepertoire.
Woolford1984
Concert Hall,rehearsal hall,orchestra pit
Symphonic�small to large�,opera and ballet
41 8 Yes Yes Exposure dependent upon repertoire and venue.Highest peaks in percussion and those in closeproximity. Highest average levels amongst thebrass �up to 93.4 dBALEQ� and horns �to91.5 dBALEQ�. Levels in the orchestra pit duringthe Tchaikovsky ballet Swan Lake found to be95.9 dBALEQ in front of trombones.
Schacke1987
�reviewed inWoolford et al.,
1988�
Orchestra pit Opera 30 30 No No Found exposure dependent upon position,instrument played, and, less importantly,composer. 87–96 dBALEQ and peaks up to122 dBA in the brass; 88–97 dBALEQ and peaksup to 117 dBA in the woodwind; 86–93 dBALEQand peaks up to 110 dBA in the violins andviolas; and 81–87 dBA in the cellos and basses
van Hees1991
Concert hall,rehearsal hall
Symphonic 38 19 Yes Yes Found sound exposure to be dependent uponrepertoire �separating repertoire into traditionaland modern�, venue and orchestral zone,concluded that instrument type was lesssignificant in determining exposure levels.Extrapolated annual exposure from data.
Camp andHorstman
1992
Orchestra pit Opera 41 17 Yes No Found the horn, trombone, tuba, and trumpetsections to be consistently exposed to levels abovethe other musicians. Levels reported in noise dose�according to 90 dBALEQ8 h� with varyingexposure times. Peaks in trumpets up to 111 dBA,percussion not reported.
Sabesky andKorczynski
1995
Concert hall,rehearsal
hall,orchestra pit
Symphonic�small to
large�, ballet
50 10? Yes Yes Found highest exposure in the brass andwoodwind and provide maps of the three differentorchestral setups. Found mean readings of87–92 dBALEQ. Exact positions of microphonesnot given. Concluded venue and repertoireaccount for only slight variations in exposure.
Mikl 1995 Orchestra pit,concert hall,rehearsal hall
Opera andballet
84 6 Yes Yes Concluded noise exposure to musicians wasdependent upon position �higher towards the rearof the orchestra�; venue �worse in the orchestrapit�; and repertoire. No specific data were given.Recordings limited to a representative samplefrom each performance.
Laitinen et al.2003
Orchestra pitand
individualrehearsals
Opera andballet
87 10 Yes Yes Recorded highest noise exposure in percussion�95 dBA�, brass �92–94 dBA� and flute/piccolo�95 dBA� players. Found exposure was repertoiredependent.
J. Acoust. Soc. Am., Vol. 124, No. 2, August 2008 O’Brien et al.: Nature of orchestral noise 927
ution subject to ASA license or copyright; see http://acousticalsociety.org/content/terms. Download to IP: 130.102.158.22 On: Thu, 29 Oct 2015 03:29:59

Redistrib
LEQ, or the equivalent steady sound level that would pro-duce the same energy as the variable sound level over themeasurement period.
Overall, the studies reviewed show that orchestral noiseis highly variable and that generally the brass, percussion,and some woodwind are at greatest risk of exposure to po-tentially damaging noise levels. However, these studies arelimited by a number of factors.
The studies by Westmore and Eversden �1981�, Janssonand Karlsson �1983�, Woolford �1984�, Royster et al. �1991�,Mikl �1995�, and Laitinen et al. �2003� suffered from a lackof data points �see column 5 in Table I�. Attempting to accu-rately extrapolate noise exposure for individual positions us-ing limited sample points is likely to provide misleading re-sults, particularly in an orchestral environment where someof the highest noise levels are produced by instruments, suchas trumpets and trombones, that have extremely directionalcharacteristics �Chasin, 1996�.
The studies by Axelsson and Lindgren �1981�, West-more and Eversdon �1981�, Jansson and Karlsson �1983�,Schacke �1987�, Woolford et al., 1988, Royster et al. �1991�,and Camp and Horstman �1992� suffered from vague or in-adequate reportage of either microphone position, orchestralsetup, or both. This insufficiently describes the nature of thevarying noise levels across the orchestra and prevents theresults from being generalized to other orchestras.
All the studies reported previously also failed to providean adequate number of samples to clearly represent thehighly variable and complex noise environment of an orches-tra.
B. Complexity of orchestral noise
The previous literature on orchestral noise cannot begeneralized to the wider orchestral community as it does notadequately address the complexity of orchestras and orches-tral noise. This complexity would appear to be due to twokey factors: position and variability.
1. Position
“Position” refers to the physical position occupied by amusician and their instrument in the orchestra. Orchestralmusicians have very specific jobs, such as second clarinet,
TABLE I.
Study Venue type Repertoire type
Number orduration of
measurementsNumberdata poin
Lee et al.2005
Orchestra pit Opera 73 13
Currentstudy
Orchestra pit,reheasal hall,concert hall
Symphonic�small to
large�, operaand ballet
1608 27
third trumpet, or first horn. Regardless of the wider orches-
928 J. Acoust. Soc. Am., Vol. 124, No. 2, August 2008
ution subject to ASA license or copyright; see http://acousticalsociety.org/c
tral setup, where an individual musician sits relative to theircolleagues is largely dictated by the job they hold and isrelatively constant through a musician’s career. This has asignificant impact on the nature of the sound to which theyare exposed. It is partly for this reason that generalizingabout noise exposure by instrument family �such as wood-winds� or even by instrument section �such as clarinets�oversimplifies the nature of the noise exposure experiencedby individual musicians.
Further, some positions are called on to play louder andin a higher register than most others more often. When thetrumpet section plays, for example, the dominant line is usu-ally played by the first trumpet, with the second and/or thirdtrumpets playing more of a supporting role. In terms ofpitch—in the vast majority of cases—the first trumpet willplay at least a tone and a half above the second trumpet. Thisis similar amongst all of the instrumental sections in an or-chestra. If it is accepted that the sound of an individual’s owninstrument significantly contributes to their sound exposurelevels �a musician must hear their own instrument above allothers in order to play, after all� then the implications of thisarrangement are quite far reaching.
If it can be shown that musicians in some positions inthe orchestra are consistently exposed to higher orchestralnoise levels than their colleagues, then these data could beused to inform further research into solutions and potentialmanagement strategies to deal with this issue. Detailed mapsof noise levels within a symphony orchestra may also pro-vide greater insight into both the nature and source of exces-sive noise levels and allow for a thorough risk assessment forindividual musicians by position.
In order to assess the positions within the orchestra thatare consistently exposed to greater noise levels, each positionin the orchestra must be studied separately—over a long pe-riod of time and in a variety of venues—whilst playing avariety of repertoire.
2. Variability
Variability refers to the range in type and level of musicplayed by an orchestral musician over the course of theirday-to-day work. This variability can be enormous due tochanges in repertoire, venue, rehearsal format, orchestral
ntinued.�
icrophonepositionsspecified?
Orchestraset-up
specified? Findings
Yes Yes Found exposure repertoire dependent. MeandBALEQ exposure for a moderately loud operawas 93.7 amongst the trumpets, 91.7 for thehorns, 90.3 in the trombones, and 90.3 and 91.7in the piccolo/flutes. Each finding wasless for smaller repertoire.
Yes Yes See Table II.
�Co
ofts
M
setup, individual variations, and personnel.
O’Brien et al.: Nature of orchestral noise
ontent/terms. Download to IP: 130.102.158.22 On: Thu, 29 Oct 2015 03:29:59

Redistrib
a. Repertoire Orchestral noise levels are clearly depen-dent upon the repertoire being played. For example, RichardStrauss wrote symphonies for large orchestras of over 100instruments often playing fortissimo �at full volume�,whereas Josef Haydn wrote symphonies for smaller orches-tras of less than 30 instruments that rarely play beyond forte�loud�. An orchestra of 100 musicians playing at full volumeis clearly going to generate substantially more orchestralnoise than an orchestra of less than 30 musicians playing at amoderate volume. Aside from these extremes, the variabilityin noise levels from piece to piece is usually quite pro-nounced.
b. Venue Orchestras generally work in a variety of ven-ues according to the type of program they are undertaking. Astandard orchestra will usually have a rehearsal studio �oftena large, acoustically treated hall�, where the majority of re-hearsals take place and occasional concerts or recordings oc-cur. Standard performance venues are usually concert halls,orchestra pits when accompanying opera and ballet, townhalls, occasionally stadiums, and a range of other minor ven-ues.
Each venue differs acoustically and musicians willadopt different playing styles in order to project a properlybalanced orchestral sound into the space in question, both attheir own initiative and at the conductor’s request. With theexception of the orchestra pit, stages are generally open andreflective surfaces �apart from the floor� and are generallywell clear of the musicians. In orchestra pits, the ensemble isessentially enclosed at the sides, front, rear, and sometimespartially from above when the stage overhangs the pit.
Aside from the acoustic differences, different ven-ues are used for specific activities. The rehearsal studio isused mostly for stop/start rehearsals, whereas at performancevenues orchestras tend to play straight through pieces with-out stopping. Further, orchestras perform specific repertoireat the different venues—for instance, symphonies are gener-ally played at concert halls but are rarely performed in or-chestra pits.
c. Rehearsal format. When in rehearsal, orchestras willplay en masse a great deal of the time, but will also fre-quently stop and work through parts of a piece with only afew musicians playing. Orchestras may also spend a greatdeal of time on one particular passage and play throughother, simpler passages only once or twice. Depending on thelength of the piece, it may not be played in its entirety untilthe dress rehearsal at the performance venue where adjust-ments will be made by the musicians under the guidance ofthe conductor to account for changes in acoustics.
d. Orchestral setup. An orchestra will set up in par-ticular ways depending on repertoire, venue, orchestra size,the conductor’s request, and anticipated noise exposure. Anorchestra will also have several standard venue-dependentsetups, the most markedly different being in an orchestral pit.
e. Individual variations and personnel. Players willplay the same material at slightly differing volumes depend-ing on many factors. Often fatigue will play a role, as willthe volume of those around the individual musician. A con-ductor may also request greater or lesser volume as theyshape the musical work. In addition, some players will playthe same part significantly louder than their colleagues. Of-ten this is merely due to stylistic interpretations on the part ofthe musicians; sometimes it is due to differences in the in-strument and sometimes due to techniques employed in play-
ing the instrument.J. Acoust. Soc. Am., Vol. 124, No. 2, August 2008
ution subject to ASA license or copyright; see http://acousticalsociety.org/c
The limited nature of previous studies has meantthat these variables are only partly incorporated in the pre-sented results. In order for a study to have any statisticalreliability in the face of these variables it is necessary to takesamples over a very long period and to at least group thesamples according to exact orchestral position and venue.Information about the nature of orchestral noise for indi-vidual positions may then be extracted taking into accountorchestral activities over the sample period, and includingvariations in repertoire, orchestral setup, and rehearsal for-mat.
III. PROBLEM STATEMENT
We believe the nature of orchestral noise is more com-plex than has previously been reported. Previous investiga-tions have suffered either from a lack of data points, inad-equate reportage of microphone positions/orchestral setup, orinsufficient allowances for the variability in the orchestralplaying environment. Due to large shifts in orchestral activ-ity in a standard orchestra on a day-to-day basis, attemptingto accurately extrapolate noise exposure for individual posi-tions using limited sample points is likely to provide mis-leading results. In addition there is as yet no study that hascomprehensively mapped the variations in noise level frommusician to musician across the orchestra, particularly in theacknowledged higher-risk areas of the brass and woodwind.The lack of insight into the true nature of orchestral noise isan impediment to devising appropriate solutions to this wide-ranging problem.
IV. AIM
This study has three aims:
�1� To investigate the nature of orchestral noise in greaterdetail than has previously been accomplished.
�2� To act as a reference guide to future research into solu-tions and management strategies for the complex prob-lem of excessive noise exposure in symphony and pitorchestras.
�3� To provide an easily understandable basis for both plan-ning and education of musicians and their managers intothe nature of the noise in their work environment and therisks �both legal and physiological� they may face.
This project is not intended to demonstrate a link be-tween orchestral noise and NIHL. It takes as its basis for riskrecommendations for safe noise exposure as dictated by cur-rent Australian occupational health and safety legislationwhich states an accumulated daily noise exposure in excessof 85 dBALEQ 8 hr and transient peak levels exceeding140 dBC are likely to be hazardous. Under this legislation anemployer is bound to take action if noise levels go beyondthese benchmarks �AS/NZS, 2005a�.
V. METHOD
Although week-to-week there is limited repeatability inan orchestral musician’s activities, year-to-year these activi-ties are quite similar. This is because orchestras tend to plan
their activities annually with the aim of maintaining variousO’Brien et al.: Nature of orchestral noise 929
ontent/terms. Download to IP: 130.102.158.22 On: Thu, 29 Oct 2015 03:29:59

Redistrib
playing series and any pit services. In order to represent thisaccurately the current study has taken a long-term approach.The data collection described covers the period from May2004 to May 2007 at The Queensland Orchestra.
A. Orchestra
This study obtained all of its recordings from TheQueensland Orchestra �TQO�. TQO is the only full-time pro-fessional orchestra in Brisbane, Australia and, as such, it hasa varied role. It performs, on average, 95 times per year,which includes the orchestra’s subscription series, pops con-certs, small ensemble concerts, pit services to the local andnational ballet and opera companies, collaborations withtouring artists, and festival events. The orchestra employs 86musicians and is Australia’s third largest orchestra. It has anational and international reputation as a high quality en-semble.
B. Venues
When rehearsing, TQO is usually based at its rehearsalstudios �Studio 420� where it also occasionally performs aconcert, recording, or radio broadcast. When performing,TQO spends roughly one-third of each year working in theorchestra pit of the Lyric Theatre for resident and touringopera and ballet companies, roughly one-third of a year inQueensland Performing Arts Centre’s �QPAC’s� concert halland the remaining one-third of each year is spent in assortedother venues such as Brisbane’s City Hall, QPAC’s Play-house orchestra pit and the Queensland ConservatoriumConcert Hall. Throughout the year each program is rehearsedin the orchestra’s rehearsal studio before taking it to the rel-evant venue.
1. Studio 420
This rehearsal venue is a large, acoustically treated,purpose-built orchestral rehearsal hall with a floor space of28 m by 20 m and a height of 14 m. The floor is woodenparquetry and the walls and ceiling are constructed withlarge preformed diffusive plaster blocks. The orchestra canset up in Studio 420 in various ways, but most often theconfiguration is identical to the set up it uses in QPAC’sConcert Hall, including riser heights, screens, and distancesbetween instrument sections. When rehearsing opera or bal-let, however, the orchestra will assume the configuration ituses in the orchestra pit. In addition to rehearsals, the orches-tra uses the studio as a venue for formal concerts, children’sconcerts, and recordings. In terms of repertoire, the studiosees the greatest variability of all the venues—opera, ballet,symphonies, pops programs, small ensemble work, and soon.
2. QPAC Concert Hall
The stage of QPAC’s Concert Hall measures 15 m deepand 18 m wide. The floor is made from polished woodenfloorboards and the surrounding walls are a mix of concreteand wood. The stage is open to the 1800 seat auditorium tothe front and has tiered choir stalls to the rear. The Concert
Hall is where the orchestra performs the vast majority of its930 J. Acoust. Soc. Am., Vol. 124, No. 2, August 2008
ution subject to ASA license or copyright; see http://acousticalsociety.org/c
main stage concerts. These can be a standard symphony or-chestra program, light classical concerts, educational pro-grams, festivals, special events, pops, and Christmas pro-grams. The orchestra uses the venue for performance and forrehearsal.
3. QPAC Lyric Theatre orchestra pit
The orchestra pit at QPAC’s Lyric Theatre is 18 m at itswidest point, 5 m from front to back and 2 m below the levelof the stage, with the stage overhanging the pit by 2 m. Therear of the pit is treated with diffusive panels and the floorand surrounding walls are made from painted plywood. Itwas built, along with the rest of the venue, in the early 1980swhen noise concerns were only just beginning to be studiedin any depth. There is, however, enough room for some en-gineered controls, such as screens and a small riser �a raisedplatform upon which the musicians sit� for the back row ofwoodwinds.
4. Other venues
The City Hall �Brisbane� is an open wooden flooredstage in a large auditorium and the Queensland Conservato-rium Concert Hall is similar. Both have very open stagessimilar to the concert hall. QPAC’s Playhouse pit is similar tothe Lyric Theatre pit, but smaller. Samples from these venuesare included in the overall database but were not extractedspecifically due to their less frequent use by the orchestra.
C. Recording sessions
Noise monitoring was planned on a project-by-projectbasis between May 2004 and May 2007. During this period,many of TQO’s orchestral projects consisted of four rehears-als, a dress rehearsal, and a performance. In the case of anopera or ballet there were slightly more rehearsals and asmany as 10 or 15 performances. As the orchestra spent agreat deal more of its time in rehearsal than performance, itwas decided at the outset that both performances and re-hearsals should contribute to the data. Occasionally the or-chestra split to play more than one project at one time. Incases like these, preference was given to the project judgedto be more likely to exceed legally allowable noise exposure.
D. Equipment
Three Cassella USA CEL-460 data-logging dosimeterswere used for this project. Each unit was programed torecord noise dose, dBALEQ, and dBC peak values. Noisedose was calculated using an exchange rate of 3 dB and acriterion of 85 dBALEQ 8 h according to the Australian/New Zealand Standard �AS/NZS, 2005b�.
For all dosimetry runs the units were left on for theduration of the orchestral call—including breaks andintervals—in order to give a more accurate indication of thenoise exposure of the musicians. The units were programedto automatically begin recording at the start of the rehearsal/performance �call� and to switch off at the end of the call toreduce possible artifact by handling noise. If the call finishedearly, the units were manually switched off in situ. Immedi-
ately prior to and at the conclusion of each and every run theO’Brien et al.: Nature of orchestral noise
ontent/terms. Download to IP: 130.102.158.22 On: Thu, 29 Oct 2015 03:29:59

Redistrib
units were individually calibrated using a matching CEL-282acoustic coupler to account for temperature and humidityfluctuations. The units were professionally recalibrated, ser-viced, and checked for faults annually according to themanufacturer’s specifications.
E. Positioning of dosimeters
The three dosimeters were placed in different positionsduring different recording sessions until sufficiently detailedrecordings were obtained for all chosen positions in all ven-ues. At the start of each orchestral project a series of dosim-eter positions was devised, taking into account any possiblevariations, such as orchestral setup and repertoire to be re-hearsed or performed. Instrument groups that indicated con-sistently high levels of exposure were monitored in moredetail than those with consistently low levels, but a broadcross section of recording positions was the aim for eachorchestral project.
Each dosimeter was positioned on a microphone standfor the duration of the call. The microphone of each dosim-eter was placed on a boom at the ear level of the musicianbeing monitored, with the microphone itself positionedgreater than 20 and less than 60 cm from his or her mostexposed ear. If a wraparound head screen �made from absor-bent high density foam� was in place, the microphone waspositioned within the screen. In the case of percussionists, astand-mounted unit was not practical as the musicians con-stantly moved from instrument to instrument.
Due to this, percussionists wore the units on their beltwith the microphone mounted high on the shoulder of whatthe musician judged to be his or her most exposed ear. Whensurveying these data, it is important to remember that thismay have caused levels amongst the percussion to appearslightly elevated due to the reflection of sound back from thehead and neck. It may also have increased the likelihood ofartifacts and for this reason percussion readings were errorchecked in greater depth than other stand-mounted readings.
F. Data gathering/record keeping
The following data were gathered from each recordingsession: venue, orchestral project, repertoire, precise positionof dosimeter �including left or right ear�, duration, theequivalent steady sound level present for the duration of thecall �expressed as dBALEQ�, the C-weighted peak, and thenoise dose expressed as a percentage.
The dosimeters were programed to plot a new data pointon a profile graph sampling every 30 s. This plot was used inanalysis to eliminate artifacts, such as accidental bumping ofthe microphone by a musician or operations staff. Artifactswere easily identified by comparing peak level graphs fromthe three units to determine whether a “spike” could be seenon all units at the same point in time. If not, the next highestpeak was recorded.
At the end of each dosimetry run, data from the unitswere entered onto a paper record and information from theunits was downloaded to computer every three or four days.The data were also entered into a database for later analysis
and to check for anomalies. Orchestral layout maps wereJ. Acoust. Soc. Am., Vol. 124, No. 2, August 2008
ution subject to ASA license or copyright; see http://acousticalsociety.org/c
stored with the data to indicate the position of the readingsrelative to the rest of the orchestra. At the time of the finalanalysis, the database held in excess of 1600 separate noise-monitoring sessions.
FIG. 1. Key to instruments in sound maps.
(a)
(b)
FIG. 2. �a� Mean LEQ—all venues, 2004–2007 and �b� median dBC peak—
all venues, 2004–2007.O’Brien et al.: Nature of orchestral noise 931
ontent/terms. Download to IP: 130.102.158.22 On: Thu, 29 Oct 2015 03:29:59

Redistrib
For the purposes of this study a mean average of therecorded A-weighted equivalent sound levels �LEQ� and amedian of the C-weighted peaks were used in describing theorchestral environment. The use of the A-weighting to de-scribe the equivalent sound level was chosen as workplacehealth and safety legislation refers to allowable levels inA-weighted decibels �AS/NZS, 2005a� and the majority ofrecent studies into orchestral noise use the “A” weighting,making comparisons more meaningful. The use of the “C”weighting in reporting the peak level was also due to currentAustralian reporting requirements �AS/NZS, 2005a�.
LEQ or level equivalent is an expression of the steadysound level that would produce the same energy as the fluc-tuating level actually occurring �AS/NZS, 2005a�. As orches-tral musicians work irregular hours �call times are oftenshortened and actual hours worked over the course of a weekvary markedly from player to player� using time-dependentexpressions, such as noise dose or dBALEQ8 hr, is less use-ful than providing a simple dBALEQ, which is more indica-tive of actual levels experienced. Actual exposure and pro-jected exposure can easily be extrapolated for specificpositions using the base dBALEQ figure and adjusting forthe amount of hours an individual musician has worked orwill be working over any given period.
G. Sound maps
Sound maps were generated upon completion of the data
TABLE II. Summarized data for all readings, 2004–
PositiondBALEQ
meandBArange
Violin 1 84.4 77.4–9Violin 2 84.7 78.7–9
Viola 85.3 76.1–9Cello 84.5 76.2–8Bass 84.3 78.1–9Harp 85.2 77.3–9
Flute 1 87.8 78.1–9Flute 2/Piccolo 88.2 80.2–9
Oboe 1 87.1 80.5–9Oboe 2/Cor Anglais 87 81.3–9
Clarinet 1 88.5 80.4–9Clarinet 2/bass clarinet 86.6 79.8–9
Bassoon 1 87.7 79.9–9Bassoon 2/contra bassoon 87.5 79.7–9
Trumpet 1 89.8 82.1–9Trumpet 2 88.9 80.2–9Trumpet 3 87.9 79.7–9
Horn 1 89.5 81.4–9Horn 2 88.8 81.6–9Horn 3 89.3 82.7–9Horn 4 88.7 82.9–9
Trombone 1 89.1 82.4–9Trombone 2 88.8 78.3–9
Bass trombone 87 80.9–9Tuba 86.9 78.5–9
Percussion 88.8 81.5–9Timpani 87.7 80.5–9
gathering. The dBALEQ and dBC peak levels for each in-
932 J. Acoust. Soc. Am., Vol. 124, No. 2, August 2008
ution subject to ASA license or copyright; see http://acousticalsociety.org/c
strumental position in all venues and in each of the three keyvenues was extracted from the database, averaged �mean av-erage dBALEQ and median average dBC peak� and ranked.Each instrument was individually rendered and the mostcommon orchestral setup for each venue was graphically rep-resented. Instrument positions were then shaded according tothe range of exposure indicated by the averaged results.
H. Ethics
Unconditional ethical clearance to conduct this studywas granted by the Director of Human Resources at TheQueensland Orchestra and the University of Queensland’sBehavioural and Social Sciences Ethical Review Committee�reference number 2008000031�.
VI. RESULTS
Data are presented both overall and by key venues, withdetails of venue, setup, repertoire common to venue �includ-ing style of rehearsal/performance� and acoustics. Includedfor the sake of illustrating the impact of repertoire uponnoise exposure is a graph of a single performance at QPAC’sconcert hall.
The sound maps are based upon data summarized fromthe complete database. The shading of the maps indicatesincreasing levels of exposure according to the attached leg-end. When viewing these maps it must be remembered that
.
dBCpeak median
dBCpeak range
Numberof samples
119.6 107.1–131.2 24119 111.1–134.4 62
121.8 103.7–131.6 78121.1 108.9–135.9 49122.7 114.4–135 75118.6 113.4–127.4 24121.2 106.5–132.8 84121 116.7–131.3 63
119.8 110.8–130.4 48120.7 112.3–127.6 42122.8 112.1–135.5 111120.7 113.6–129.8 42122.9 98.7–138.2 77124.2 116.1–139.2 57125.3 108.5–137.7 128126.1 115.3–138.3 60124.1 118–131.3 16122.8 107.3–133.1 119122.1 116.5–131.1 46122.8 117.4–133 71122.5 118.8–133.8 26127.7 117.1–136.1 89129.5 118.9–137.1 31126.9 113.4–135.7 34127.9 113.6–137.4 23135.5 120–146.9 66132.9 122.5–144 63
Total samples: 1608
2007
0.60.74.99.31.70.53.14.41.52.33.91.73.24.45.15.33.65.25
5.93.54.15.43.62.16.16.3
this is an averaged level, some calls may have exceeded this
O’Brien et al.: Nature of orchestral noise
ontent/terms. Download to IP: 130.102.158.22 On: Thu, 29 Oct 2015 03:29:59
Redistrib
and some may have been much less, according to the keyvariables of repertoire and venue. Range information is givenin the relevant tables.
There are only a limited number of occasions wherenoise peaks were recorded above the legislated allowablelevel of 140 dBC �all in the percussion and timpani�, but anillustration of peak levels is essential in determining the na-ture of orchestral noise in a particular section of the orches-tra. For instance, a low dBALEQ combined with a high dBCpeak would indicate the presence of a quieter instrument inclose proximity to an instrument with high transient peakssuch as a double bass situated in front of the percussion. Thiscan critically affect a musician’s comfort levels and theirattitudes to the sounds they are hearing. Due to existing evi-dence of the subjective nature of hearing loss, particularly inrelation to music �Chasin, 1996� the comfort of musicians isof great importance in fully assessing the potential impact ofnoise exposure.
Each of the maps represents the instruments of the or-chestra according to Fig. 1.
A. All venues
Figures 2�a� and 2�b� and Table II are the sound mapsand summary data for all readings taken at all venues be-tween May 2004 and May 2007 inclusive. This includes agreat array of venues, repertoire, and orchestral setups but isrepresented in the orchestra’s most common setup.
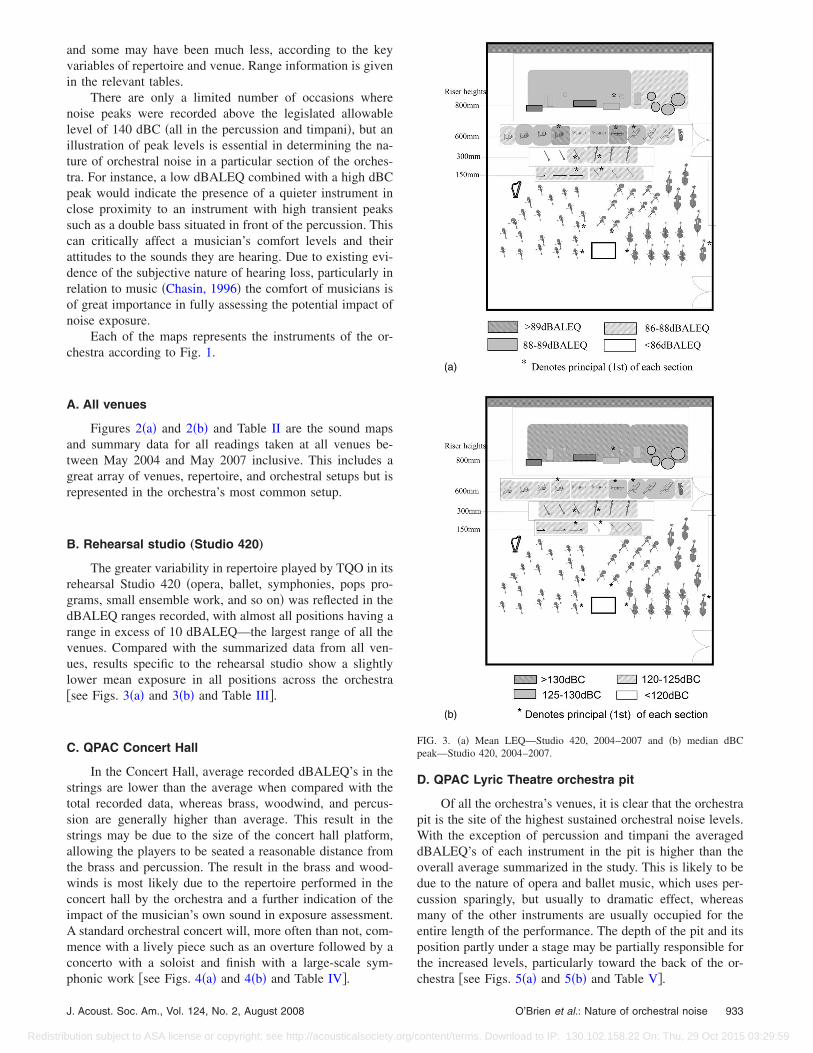
B. Rehearsal studio „Studio 420…
The greater variability in repertoire played by TQO in itsrehearsal Studio 420 �opera, ballet, symphonies, pops pro-grams, small ensemble work, and so on� was reflected in thedBALEQ ranges recorded, with almost all positions having arange in excess of 10 dBALEQ—the largest range of all thevenues. Compared with the summarized data from all ven-ues, results specific to the rehearsal studio show a slightlylower mean exposure in all positions across the orchestra�see Figs. 3�a� and 3�b� and Table III�.
C. QPAC Concert Hall
In the Concert Hall, average recorded dBALEQ’s in thestrings are lower than the average when compared with thetotal recorded data, whereas brass, woodwind, and percus-sion are generally higher than average. This result in thestrings may be due to the size of the concert hall platform,allowing the players to be seated a reasonable distance fromthe brass and percussion. The result in the brass and wood-winds is most likely due to the repertoire performed in theconcert hall by the orchestra and a further indication of theimpact of the musician’s own sound in exposure assessment.A standard orchestral concert will, more often than not, com-mence with a lively piece such as an overture followed by aconcerto with a soloist and finish with a large-scale sym-
phonic work �see Figs. 4�a� and 4�b� and Table IV�.J. Acoust. Soc. Am., Vol. 124, No. 2, August 2008
ution subject to ASA license or copyright; see http://acousticalsociety.org/c
D. QPAC Lyric Theatre orchestra pit
Of all the orchestra’s venues, it is clear that the orchestrapit is the site of the highest sustained orchestral noise levels.With the exception of percussion and timpani the averageddBALEQ’s of each instrument in the pit is higher than theoverall average summarized in the study. This is likely to bedue to the nature of opera and ballet music, which uses per-cussion sparingly, but usually to dramatic effect, whereasmany of the other instruments are usually occupied for theentire length of the performance. The depth of the pit and itsposition partly under a stage may be partially responsible forthe increased levels, particularly toward the back of the or-
(a)
(b)
FIG. 3. �a� Mean LEQ—Studio 420, 2004–2007 and �b� median dBCpeak—Studio 420, 2004–2007.
chestra �see Figs. 5�a� and 5�b� and Table V�.
O’Brien et al.: Nature of orchestral noise 933
ontent/terms. Download to IP: 130.102.158.22 On: Thu, 29 Oct 2015 03:29:59

Redistrib
E. Impact of repertoire
To illustrate the impact of repertoire on an individualposition’s noise exposure, Fig. 6 illustrates a reading takenfrom the first trumpet �right ear� position in a standard or-chestral program at QPAC’s Concert Hall featuring contrast-ing repertoire.
The program in this instance began with Weber’s Over-ture to Oberon �9 min� followed by Prokofiev’s Violin Con-certo No. 2 �26 min�, followed by a �20-min� interval andthen Tchaikovsky’s Symphony No. 4 �44 min�. For the dura-tion of the first piece—which is lightly scored but featuringtrumpet flourishes and fanfares—the level equivalent �LEQ�is 94.1 dBA; for the violin concerto—which is also lightlyscored but a quieter, less dramatic piece—the LEQ is81.9 dBA; and for the symphony—a heavily scored, dra-matic piece with some quiet passages and one quietmovement—the LEQ is 95.7 dBA. This left the first trumpetposition with an overall exposure of 93.8 dBALEQ for aperformance just short of 2 h inclusive of breaks. Note thesustained nature of the noise levels, particularly around21.45, during the final movement of the symphony where thebrass are called upon to play long, loud lines.
F. Transient nature of percussion/timpani
Percussion and timpani orchestral noise was character-
TABLE III. Studio 420 summarized data.
PositiondBALEQaverage
dBALErange
Violin 1 81.2 77.4–8Violin 2 83.8 78.7–8
Viola 85 77.6–9Cello 84 78.6–8Bass 83.4 78.4–8Harp 84.3 82.5–8
Flute 1 87.3 78.1–9Flute 2/piccolo 87.1 80.2–9
Oboe 1 87 80.9–9Oboe 2/cor 86.6 81.3–9Clarinet 1 87.8 80.4–9
Clarinet 2/bass Cl 85.7 79.8–8Bassoon 1 87.4 80.1–9
Bassoon 2/contra bassoon 86.9 79.7–9Trumpet 1 89.4 83.1–9Trumpet 2 88.6 81.1–9Trumpet 3 87.2 79.7–9
Horn 1 89.1 81.4–9Horn 2 88.2 81.6–9Horn 3 88.9 82.7–9Horn 4 87 84.5–8
Trombone 1 88.7 82.4–9Trombone 2 87.7 78.3–9
Bass trombone 86.3 80.9–9Tuba 84.6 78.5–9
Percussion 88 82.3–9Timpani 86.2 81.2–9
ized by extremely high-level transient peaks and medium to
934 J. Acoust. Soc. Am., Vol. 124, No. 2, August 2008
ution subject to ASA license or copyright; see http://acousticalsociety.org/c
high LEQ’s. Figure 7 is a typical timpani reading for a stan-dard symphonic program at QPAC’s concert hall.
This program was an overture, followed by a Rachmani-noff Piano Concerto and Dvorak’s Symphony No. 9. The dra-matic nature of the overture �to Smetana’s opera The Bar-tered Bride� is seen by the dotted peak line, which hits132.8 dBC and is the loudest point for the program. Whencompared to the trumpet readings from Fig. 6 the differentnature of orchestral noise exposure for percussionists be-comes apparent.
G. Assessment of risk according to noise exposure
In order to further quantify the risk faced by orchestralmusicians, the findings may be extrapolated to risk levelsaccording to Australian workplace health and safety regula-tions. According to this legislation, one single noise dose�100% DND� is defined as 85 dBALEQ over 8 h using a3 dB exchange �AS/NZS, 2005a�. Once a mean averagedBALEQ has been determined—giving an indication of ex-pected noise exposure per orchestral call for any givenposition—expected average dose may then be estimated.Common to most orchestras, The Queensland Orchestraworks in “calls” of either 2.5 h �usually a rehearsal� or 3 hduration �usually a performance�. Table VI gives an indica-tion of how average LEQs as depicted in Figs. 2�a�, 3�a�,
dBCpeak median
dBCpeak range
Numberof samples
115.9 107.1–121.2 4118.3 111.1–126.6 19119.2 103.7–126.4 27119 113–123.1 15
119.8 115.1–129.6 21117.6 115.7–127 9120.6 106.5–129.5 47120.4 116.7–127.1 23119.8 112.7–128.6 32120.3 112.3–127.6 19122.6 112.1–129.8 60120.4 113.6–129.8 22121.6 112.5–132.3 40123.5 116.1–129.1 24125.6 119.9–136.6 66124 116.2–138.3 26
123.2 118–128 10122.4 107.3–132.9 67122.5 116.5–128.9 23122.7 117.4–133 37120.6 118.8–121.2 6126.5 117.1–135.3 51126.4 118.9–134.2 12126.4 119.4–133.7 15124.9 113.6–128.7 10135.1 125.5–144.1 31132.9 123.8–141.3 26
Total samples: 742
Q
5.58.31.27.36.77.62.12.90.70.93.29.32.84.44.94.51.64.54.15.98.93.61.73
0.43.11
4�a�, and 5�a� may translate to levels of risk for individual
O’Brien et al.: Nature of orchestral noise
ontent/terms. Download to IP: 130.102.158.22 On: Thu, 29 Oct 2015 03:29:59

Redistrib
positions. Each of these figures may be viewed using TableVI in order to ascertain an estimate of expected noise dose.
VII. DISCUSSION
This study had three stated aims. To achieve the firstaim—to investigate the nature of orchestral noise in greaterdetail than has previously been accomplished—data fromnoise readings of three years of orchestral activities havebeen collated and presented both graphically and as sum-mary tables according to key venues and overall. It is clearfrom these data that different positions in the orchestra—even those adjacent and playing the same instrument—areexposed to different levels of risk. Although this has beenfound to some extent in previous studies, no study had yetuncovered the true detail of these variations.
In order to interpret these data presented and to achievethe second and third stated aims of the study—to furtherguide future research and to provide a basis for planning andeducation of musicians and their managers—the discussion
(a)
(b)
FIG. 4. �a� Mean LEQ—QPAC Concert Hall, 2004–2007 and �b� mediandBC peak—QPAC Concert Hall, 2004–2007.
will proceed according to instrument type.
J. Acoust. Soc. Am., Vol. 124, No. 2, August 2008
ution subject to ASA license or copyright; see http://acousticalsociety.org/c
A. Strings and Harp
String players on the rear desks �i.e., at the back of thevarious sections� were generally the positions reported on inthis study due to their proximity to high sound emitting in-struments. In cramped quarters �such as the orchestra pit� therear desks of the violins were usually positioned directly ad-jacent to the piccolo, flutes, and the horns in the case of theviolins, and in front of the brass and percussion in the case ofthe cellos, violas, and double basses. In the orchestra pit,noise spikes from the percussion and brass account for thehigh peak levels amongst the basses and cellos. Although therecorded LEQs of the strings are generally the lowest of theorchestra, string players state that it is the presence of highpeaks from other instruments that causes them the most dis-comfort.
The harp faces similar issues to the rear desks of theviolins. The harp was exposed to higher than average levelsin the pit—with peaks up to 123.3 dBC and one dBALEQ of89.5. This was probably due to the proximity of both thehorn section and the piccolo.
Apart from these hazards however, the strings and harpwere consistently exposed to lower noise levels when com-pared to the rest of the orchestra. This does not mean thatthey were never exposed to potentially hazardous noise lev-els, as can be seen from the upper end of the ranges, but theywere not as regularly at risk as their colleagues in the wood-wind, percussion, and brass. The highest level recorded inthe strings was a dBALEQ of 94.9 at the rear of the violasection in QPAC’s Playhouse orchestra pit, where the violaswere in very close proximity to the trumpet section. Thismeasurement was repeated with close to identical results.
Violinists and violists hold their instruments very closeto their left ear. Due to this, the dosimetry microphone wasunable to accurately measure the true exposure to this ear forthese players. It is likely that there may be a greater risk tothese players from their own instruments than the results ofthis study indicate. This increased unilateral exposure to vio-linists and violists is supported by Axelsson and Lindgren�1981�, but is beyond the scope of this investigation.
B. Woodwinds
More often than not the woodwinds sit in two rows. Inthe pit setup the woodwinds were against the rear wall of thepit, but in other venues the brass and percussion were gen-erally directly to their rear. In the back row, the first clarinetand first bassoon typically registered higher exposure thantheir seconds �a pattern common throughout the winds andbrass�. As already discussed, this difference can probably beattributed to the higher register of the parts played by the firstplayers.
Levels in the pit for the clarinets were higher than atother venues, despite the pit being the only main venuewhere no brass or percussion were directly behind them.Bassoons on the other hand, seated next to the clarinets, re-ceived their lowest averages in the pit. This emphasizes theextent to which a musician’s own instrument contributes to
their noise exposure.O’Brien et al.: Nature of orchestral noise 935
ontent/terms. Download to IP: 130.102.158.22 On: Thu, 29 Oct 2015 03:29:59

Redistrib
In the front row of the woodwinds, flute 2/piccolo read-ings highlight the importance of register in noise exposure.In this case, the piccolo—which is used a great deal in the pit
TABLE IV. QPAC Concert Hall summarized data.
PositiondBALEQ
meandBALE
range
Violin 1 85.3 84.2–8Violin 2 84.1 80.6–8
Viola 84.2 76.1–9Cello 83.6 76.2–8Bass 84.2 78.1–8Harp 86 82.7–9
Flute 1 88.1 81.6–9Flute 2/piccolo 87.6 82.6–9
Oboe 1 87.4 80.5–9Oboe 2/cor 87.8 83.1–9Clarinet 1 89.3 86.8–9
Clarinet 2/bass clarinet 88.1 83.9–9Bassoon 1 88.5 79.9–9
Bassoon 2/contra bassoon 88.2 82.8–9Trumpet 1 90.2 86.2–9Trumpet 2 87.7 80.2–9Trumpet 3 89.9 88.2–9
Horn 1 89.9 85–93Horn 2 89.1 83.5–9Horn 3 89.5 86.6–9Horn 4 88.9 82.9–9
Trombone 1 89.5 84.2–9Trombone 2 89.4 86.6–9
Bass trombone 87.4 81.5–9Tuba 87.7 83.9–9
Percussion 89.7 81.5–9Timpani 88.6 80.5–9
(a)
(b)
FIG. 5. �a� Mean LEQ—QPAC Lyric Theatre pit, 2004–2007 and �b� me-
dian dBC peak—QPAC Lyric Theatre pit, 2004–2007.936 J. Acoust. Soc. Am., Vol. 124, No. 2, August 2008
ution subject to ASA license or copyright; see http://acousticalsociety.org/c
and plays in a register well above the first flute—pushes thesecond player’s exposure level beyond that of the first player.All flute and piccolo readings indicate that their right ear wasthe most vulnerable, being the side on which their instrumentis held. The oboes have the lowest levels of the woodwindsection, and experienced their highest levels when playingstandard symphonic programs in the Concert Hall.
C. Brass
Despite the obvious hazard of the percussion directly tothe rear, brass levels were consistently high because of thevolume and nature of the sound their instruments generate.The impact of the percussion on the brass is generally seenas higher noise peaks rather than increasing their LEQ, dueto the sporadic use of percussion in much orchestral music.This can be clearly illustrated by brass readings in a programsuch as Brahms’s Symphony No. 3, which has no percussionexcept timpani, yet still brass readings were 90.2 dBALEQfor first horn and 90.6 dBALEQ for first trumpet. The brasstypically create sustained medium to high dBALEQ levels,driving up their noise exposure significantly.
With the exception of the first trumpet, the horns �morespecifically, the first horn� were the group most consistentlyexposed to very high LEQs. The design of the horn �the bellof the instrument faces the right and the rear� invites obviousproblems for any horn player’s right ear and to a lesser ex-
dBCpeak median
dBCpeak range
Numberof samples
124.9 124.7–125.1 4119.4 115.1–134.4 23120.4 106.9–127.5 22122.2 108.9–127 7120.7 114.4–128.8 23118.9 114.6–127.4 7121.7 113.9–130.1 21121.7 117.7–127.1 14120.1 110.1–130.4 8119.7 116.3–127.4 8123.5 119.7–130.8 28123.4 119–126.8 11123.9 98.7–134.4 22124.9 120.5–127.9 17
128.75 119.5–137.5 28126.2 115.3–134.6 13126.5 122.7–133.3 4126.7 121.6–133.1 27123.9 117.7–131.1 11124.1 119.9–128.6 17125.6 122.7–133.8 12128.5 122.5–134.2 23129.5 125.2–132.5 9125.9 118.1–133.6 6129.8 123.3–132.9 5138.9 121.3–146.9 14133.1 128.4–137.7 17
Total samples: 401
Q
6.29.32.69.39.60.21.41.21.32.13.90.53.21.642
3.6.35
3.13.54.13.93.61.56.16.3
tent for the left ear of the next player in line �players sit at
O’Brien et al.: Nature of orchestral noise
ontent/terms. Download to IP: 130.102.158.22 On: Thu, 29 Oct 2015 03:29:59

Redistrib
least a metre apart�. In a horn section the first and third arethe “high” players in terms of register, whereas the secondand fourth are the “low” players. This is reflected in theresults of the study with uniformly higher exposure levels forthe first and third horns over the second and fourth players.The first and second received their highest average levels inthe concert hall, whereas the third and fourth received theirhighest levels in the lyric theatre pit. This may be due to thethird and fourth often having to play with their bells facing
TABLE V. QPAC Lyric Theatre pit summarized data
PositiondBALEQ
meandBALE
range
Violin 1 85.1 80.1–9Violin 2 86.7 83.9–9
Viola 85.3 82.3–8Cello 85.2 82.2–8Bass 84.3 80–88Harp 88.8 87.9–8
Flute 1 89 84.9–9Flute 2/piccolo 89.4 87.1–9
Oboe 1 86.2 83.7–8Oboe 2/cor 87.2 84.1–9Clarinet 1 88.7 84.7–9
Clarinet 2/bass clarinet 89 88.1–8Bassoon 1 87.9 85.2–9
Bassoon 2/contra bassoon 86.3 85–88Trumpet 1 90 83.6–9Trumpet 2 89.9 83.3–9Trumpet 3 87.2 82.1–9
Horn 1 89.8 85.4–9Horn 2 89.6 85.5–9Horn 3 90.7 88.2–9Horn 4 89.3 87.3–9
Trombone 1 89 85.5–9Trombone 2 89.6 85.1–9
Bass trombone 87 82.6–9Tuba 90.1 89.2–9
Percussion 88.5 86.4–9Timpani 86.7 82–96
FIG. 6. Exposure to first trumpet during a concert at QPAC Concert Hall.
J. Acoust. Soc. Am., Vol. 124, No. 2, August 2008
ution subject to ASA license or copyright; see http://acousticalsociety.org/c
the sidewall in the pit. Peak levels amongst the horns weregenerally higher when the percussion was to their rear, suchas in the Concert Hall or Studio 420, but peak levels in thepit—where the percussion are on the opposite side �see Fig.5�—also registered around 123 dBC for the first and third,and around 121 dBC for the second and fourth. Each of thefour horns was consistently exposed to higher LEQs at their
dBCpeak median
dBCpeak range
Numberof samples
118.5 113.4–131.2 11119.9 114.5–130.4 10122.5 114.5–130.5 13122.4 116.6–135.9 16126 118.5–135 23
121.3 118–123.3 3121.4 117–127.7 10121.4 118–125.8 13117.9 114.8–120.6 4121.5 118.9–126.9 10122.1 116.1–126.3 10120.8 119.3–124.2 3120.1 107.2–130 6122.3 118.4–131.7 6127 120.8–135.8 16
127.7 119.6–136.3 14125.1 124.6–125.6 2123.1 120.4–126.9 11121.2 119.1–123 10122.7 119.8–126.9 8121.2 119.8–123.8 7131.6 125.6–134.6 8132.1 126.4–137.1 9130.1 125–135.7 9130.6 129–134 4131.8 124.8–144 8132.1 125.5–144 9
Total samples: 253
.
Q
0.60.77.89.1.59.53.13.58.70.21.99.80.4.54.85.32.33.52.63.31.91.25.42.21.71.2.1
FIG. 7. Exposure to timpani during a concert at QPAC Concert Hall.
O’Brien et al.: Nature of orchestral noise 937
ontent/terms. Download to IP: 130.102.158.22 On: Thu, 29 Oct 2015 03:29:59

Redistrib
right ear, even with a very loud player to their left. This wasclearly due to the proximity of their own instrument’s belland is yet another example of the degree to which noiseexposure amongst orchestral musicians is dependent on theirown instrument.
It is a logical assumption that the players directly infront of the trumpets are exposed to a much higher level thanthe trumpet players themselves; however, this was routinelynot the case at The Queensland Orchestra. There are possiblytwo reasons for this finding. First, players in front of thetrumpets were usually either on a lower rostrum and/or hadwraparound head screens in place. In the orchestra pit anangled screen was often in place to reflect the trumpet’ssound up and out. Second, the music stand directly in frontof the trumpet—made from steel with the music itself restingon it—may be responsible for reflecting much of the trumpetplayers’ sound back to them. Of the three trumpet positions,the first trumpet consistently recorded higher noise levels inall venues. Once again this may be attributed to the fact thatthe first trumpet plays in a higher register than the rest of thebrass section and higher than both the second and third trum-pets. The result leaves the first trumpet as the player with thehighest expected dBALEQ of any musician in the orchestra.
Sustained levels in the trombones and tuba tend to beless than the trumpets, which may be as a result of the lowerregister in which they play. The first trombone is routinelyexposed to higher noise levels than the second trombone, thethird �bass� trombone and the tuba with the exception of theLyric Theatre pit, where the second trombone generally re-corded higher levels. This is probably due to the position ofthe players—with the second trombone literally surroundedby high-level instruments �trombones to either side, timpanidirectly behind and trumpets in front�, whereas the first trom-bone has a clear area directly to his left.
The trumpets, trombones, and tuba were often exposedto high peak levels due to the proximity of the percussion,but never exceeded the actionable level of 140 dBC. In asymphonic program, peaks in the brass typically registeredbetween 130 and 133 dBC. This is still exceptionally loudand would contribute significantly to a player’s discomfort.
D. Percussion/timpani
Percussion and timpani orchestral noise was character-ized by extremely high-level transient peaks and medium tohigh LEQs �see Fig. 6�. Comparing the dBC peak readings tothe dBA peak readings of the same event tells us a great deal
TABLE VI. Estimated risk level by exposure.
Risk levelMean average
�dBLEQ�
Average DND
3 h call 2.5 h call
High �89 �100% �80%Medium high 88–89 80–100% 60–80%Medium low 86–88 50–80% 40–60%
Low �86 �50% �40%
about the nature of these percussive spikes routinely seen in
938 J. Acoust. Soc. Am., Vol. 124, No. 2, August 2008
ution subject to ASA license or copyright; see http://acousticalsociety.org/c
the percussion and timpani. It is common for there to be avery large gap between these two figures. For instance, apercussion peak during Shostakovich’s Symphony No. 11registered at 143.8 dBC, yet the dBA peak reading for thisevent was 113.1 dBA. This peak was caused by a snare drumin conjunction with a bass drum and was confirmed by ana-lyzing the time of the peak and determining whether a lesserevent registered on both of the other units at an identicaltime. The dBC peak/dBA peak difference implies a greatdeal of acoustic energy at high and/or low frequencies asopposed to the part of the frequency spectrum where thedBA filter is most sensitive. This occurrence was typical inpercussion and timpani readings and also applied to those inclose proximity to these instruments, particularly the basssection when in the orchestra pit.
VIII. CONCLUSION
This study has demonstrated that three key variables—position, venue and repertoire—impact significantly upon thenoise exposure of individual musicians. It is clear from thefindings that musicians in close proximity do not necessarilyshare the same risk profile and should approach hearing con-servation in subtly different ways. It is also clear from thefindings that repertoire is a key determinate in noise expo-sure and that musicians, in particular, positions, can expecttheir noise exposure to vary dependent upon the venue inwhich they are performing or rehearsing. The interaction be-tween the three variables—such as specific repertoire onlyoccurring in specific venues—gives important pointers inpredicting any given musicians’ exposure for an orchestralcall, and will clearly differ from orchestra to orchestra.
Overall, the findings indicate the principal trumpet, firstand third horn and principal trombone are at greatest risk ofexposure to excessive sustained noise levels, and that thepercussion and timpani are at greatest risk of excessive peaknoise levels. However, the findings also strongly support thenotion that the true nature of orchestral noise is a great dealmore complex than this.
Although this study is by no means exhaustive and datagathering is ongoing, no study to date has undertaken such athorough noise survey of any orchestra, nor has any studysystematically attempted to account for the many variablesinherent in the noise exposure of orchestral musicians. Webelieve the findings form a solid basis for future investiga-tions into the conservation of musicians’ hearing and into theimprovement of working conditions for orchestral musiciansgenerally.
ACKNOWLEDGMENTS
The authors wish to thank The Queensland Orchestra forits assistance and participation in this study. In particular, thehard work of Judy Wood, Sarah Evans, Darryl Keys, and theOperations Team, and the patience and goodwill of each ofthe musicians has been integral in making this study pos-sible.
Australian Standards/New Zealand Standards �AS/NZS�. �2005a�.
“Australian/New Zealand Standard: Occupational noise management,” AS/O’Brien et al.: Nature of orchestral noise
ontent/terms. Download to IP: 130.102.158.22 On: Thu, 29 Oct 2015 03:29:59

Redistrib
NZS:1269, Standards Australia, Sydney, Australia/Standards New Zealand,Wellington, New Zealand.
Australian Standards/New Zealand Standards �AS/NZS�. �2005b�. “Occupa-tional noise management part 1: Measurement and assessment of noiseimmission and exposure,” AS/NZS:1269.1, Standards Australia, Sydney,Australia/Standards New Zealand, Wellington, New Zealand, p. 37.
Axelsson, A., and Lindgren, F. �1981�. “Hearing in classical musicians,”Acta Oto-Laryngol., Suppl. 377, 3–74.
Camp, J. E., and Horstman, S. W. �1992�. “Musician sound exposure duringperformance of Wagner’s ring cycle,” Med. Prob. Perf. Art. 7, 37–39.
Chasin, M. �1996�. Musicians and the Prevention of Hearing Loss �SanDiego, Singular Publishing Group, Inc., San Diego, CA�.
Jansson, E., and Karlsson, K. �1983�. “Sound levels recorded within thesymphony orchestra and risk criteria for hearing loss,” Scand. Audiol. 12,215–221.
Laitinen, H. M., Toppila, E. M., Olkinoura, P. S., and Kuisma, K. �2003�.“Sound exposure among the Finnish national opera personnel,” Appl. Oc-cup. Environ. Hyg. 18, 177–182.
Lee, J., Behar, A., Kunov, K., and Wong, W. �2005�. “Musicians’ noiseexposure in the orchestra pit,” Appl. Acoust. 66, 919–931.
Mikl, K. �1995�. “Orchestral music: An assessment of risk,” Acoust. Aust.
J. Acoust. Soc. Am., Vol. 124, No. 2, August 2008
ution subject to ASA license or copyright; see http://acousticalsociety.org/c
23, 51–55.Royster, J. D., Royster, L. H., and Killion, M. C. �1991�. “Sound exposure
and hearing thresholds of symphony orchestra musicians,” J. Acoust. Soc.Am. 89, 2793–2803.
Sabesky, I. J., and Korczynski, R. E. �1995�. “Noise exposure of symphonyorchestra musicians,” Appl. Occup. Environ. Hyg. 10, 131–135.
Sataloff, R. T., and Sataloff, J. �2006�. Occupational Hearing Loss �CRCPress: Taylor and Francis Group, Boca Raton, FL�.
Schacke, G. �1987�. “Sound pressure levels within an opera orchestra and itsmeaning for hearing,” Abstract of paper delivered to the 22nd Interna-tional Congress on Occupational Health, 7th Sept. – 2 Oct., 1987, Sydney,Australia.
van Hees, O. S. �1991�. Gehoorafwijkingen bij Musici �Coronel Laborato-rium, Universitiet van Amsterdam, Amsterdam� p. 257.
Westmore, G. A., and Eversden, I. D. �1981�. “Noise induced hearing lossand orchestral musicians,” Arch. Otolaryngol. 107, 761–764.
Woolford, D. H. �1984�. “Sound pressure levels in symphony orchestras,”Audio Engineering Society 1984 Australian Regional Convention, Mel-bourne, Australia.
Woolford, D. H., Carterette, E. C., and Morgan, D. E. �1988�. “Hearing
impairment among orchestral musicians,” Music Percept. 5, 261–284.O’Brien et al.: Nature of orchestral noise 939
ontent/terms. Download to IP: 130.102.158.22 On: Thu, 29 Oct 2015 03:29:59