natural selection onerysimum mediohispanicumflower shape: insights into the evolution of zygomorphy
TRANSCRIPT
The University of Chicago
Natural Selection on Erysimum mediohispanicum Flower Shape: Insights into the Evolution ofZygomorphy.Author(s): José M. Gómez, Francisco Perfectti, and Juan Pedro M. CamachoSource: The American Naturalist, Vol. 168, No. 4 (October 2006), pp. 531-545Published by: The University of Chicago Press for The American Society of NaturalistsStable URL: http://www.jstor.org/stable/10.1086/507048 .
Accessed: 26/08/2013 21:24
Your use of the JSTOR archive indicates your acceptance of the Terms & Conditions of Use, available at .http://www.jstor.org/page/info/about/policies/terms.jsp
.JSTOR is a not-for-profit service that helps scholars, researchers, and students discover, use, and build upon a wide range ofcontent in a trusted digital archive. We use information technology and tools to increase productivity and facilitate new formsof scholarship. For more information about JSTOR, please contact [email protected].
.
The University of Chicago Press, The American Society of Naturalists, The University of Chicago arecollaborating with JSTOR to digitize, preserve and extend access to The American Naturalist.
http://www.jstor.org
This content downloaded from 144.32.128.51 on Mon, 26 Aug 2013 21:24:14 PMAll use subject to JSTOR Terms and Conditions
vol. 168, no. 4 the american naturalist october 2006 �
Natural Selection on Erysimum mediohispanicum Flower Shape:
Insights into the Evolution of Zygomorphy
Jose M. Gomez,1,* Francisco Perfectti,2 and Juan Pedro M. Camacho2
1. Departamento de Ecologıa, Facultad de Ciencias, Universidadde Granada, E-18071 Granada, Spain;2. Departamento de Genetica, Universidad de Granada, E-18071Granada, Spain
Submitted October 31, 2005; Accepted May 25, 2006;Electronically published August 29, 2006
Online enhancements: appendixes.
abstract: Paleontological and phylogenetic studies have shown thatfloral zygomorphy (bilateral symmetry) has evolved independentlyin several plant groups from actinomorphic (radially symmetric)ancestors as a consequence of strong selection exerted by specializedpollinators. Most studies focused on unraveling the developmentalgenetics of flower symmetry, but little is known about the adaptivesignificance of intraspecific flower shape variation under natural con-ditions. We provide the first evidence for natural selection favoringzygomorphy in a wild population of Erysimum mediohispanicum(Brassicaceae), a plant showing extensive continuous variation inflower shape, ranging from actinomorphic to zygomorphic flowers.By using geometric morphometric tools to describe flower shape, wedemonstrate that plants bearing zygomorphic flowers received morepollinator visits and had the highest fitness, measured not only bythe number of seeds produced per plant but also by the number ofseeds surviving to the juvenile stage. This study provides strong evi-dence for the existence of significant fitness differences associatedwith floral shape variation in E. mediohispanicum, thus illuminatinga pathway for the evolution of zygomorphy in natural populations.
Keywords: Erysimum mediohispanicum, floral shape evolution, geo-metric morphometrics, natural selection, pollination, structuralequation modeling.
The evolution of flower shape is attracting attention frombiologists working in disparate disciplines, such as devel-opmental genetics and evolutionary development, evolu-tionary ecology, pollination biology, paleobiology, and
* Corresponding author; e-mail: [email protected].
Am. Nat. 2006. Vol. 168, pp. 531–545. � 2006 by The University of Chicago.0003-0147/2006/16804-41395$15.00. All rights reserved.
phylogeny (Coen et al. 1995; Donoghue et al. 1998; Cubaset al. 1999; Endress 1999; Ree and Donoghue 1999; Galenand Cuba 2001). Paleontological and phylogenetic studieshave shown that the ancestral angiosperm flowers wereactinomorphic (radially symmetric). Zygomorphy, or bi-lateral symmetry, in flowers arose independently severaltimes from actinomorphic ancestors (Reeves and Olmstead1998; Ree and Donoghue 1999; Dilcher 2000; Olson 2003;Rudall and Bateman 2003). Floral zygomorphy is consid-ered a key innovation promoting speciation and diversi-fication in angiosperms because it is associated with thelargest plant families (Sargent 2004). Zygomorphy isthought to have evolved as a consequence of strong se-lection exerted by specialized pollinators (Neal et al. 1998;Endress 2001) because it increases both flower attractive-ness to pollinators (Møller 1995; Rodrıguez et al. 2004)and pollen transfer efficiency (Endress 1999).
Much empirical information on the developmental ge-netics of floral shape has accumulated in recent years (e.g.,Cronk et al. 2002). While the genetic basis of zygomorphyis known for some model species, such as Antirrhinummajus or Linaria vulgaris (Luo et al. 1995; Cubas et al.1999), it remains essential, in order to understand the roleof natural selection in the evolution of flower symmetry,to link the genetic basis of flower shape to ecological andevolutionary contexts (Theißen 2000; Hileman et al. 2003).Few empirical studies have assessed the adaptive signifi-cance of flower shape (but see Herrera 1993; Bradshaw etal. 1998; Schemske and Bradshaw 1999; Galen and Cuba2001), even though the quantitative study of natural se-lection has been greatly improved during the last two de-cades as a result of the development of robust statisticaltechniques. An important reason for this dearth of studiesis the difficulty in quantifying intraspecific variation inflower shape and symmetry in plants. Selection on flowershape has been studied both by considering it qualitatively(i.e., radial vs. bilateral symmetry) and by describing it asa variable composed of linear measurements. To overcomethis difficulty, we apply geometric morphometric tools(Bookstein 1991; Zelditch et al. 2004) to measure Erysi-mum mediohispanicum (Brassicaceae), a species showing
This content downloaded from 144.32.128.51 on Mon, 26 Aug 2013 21:24:14 PMAll use subject to JSTOR Terms and Conditions
532 The American Naturalist
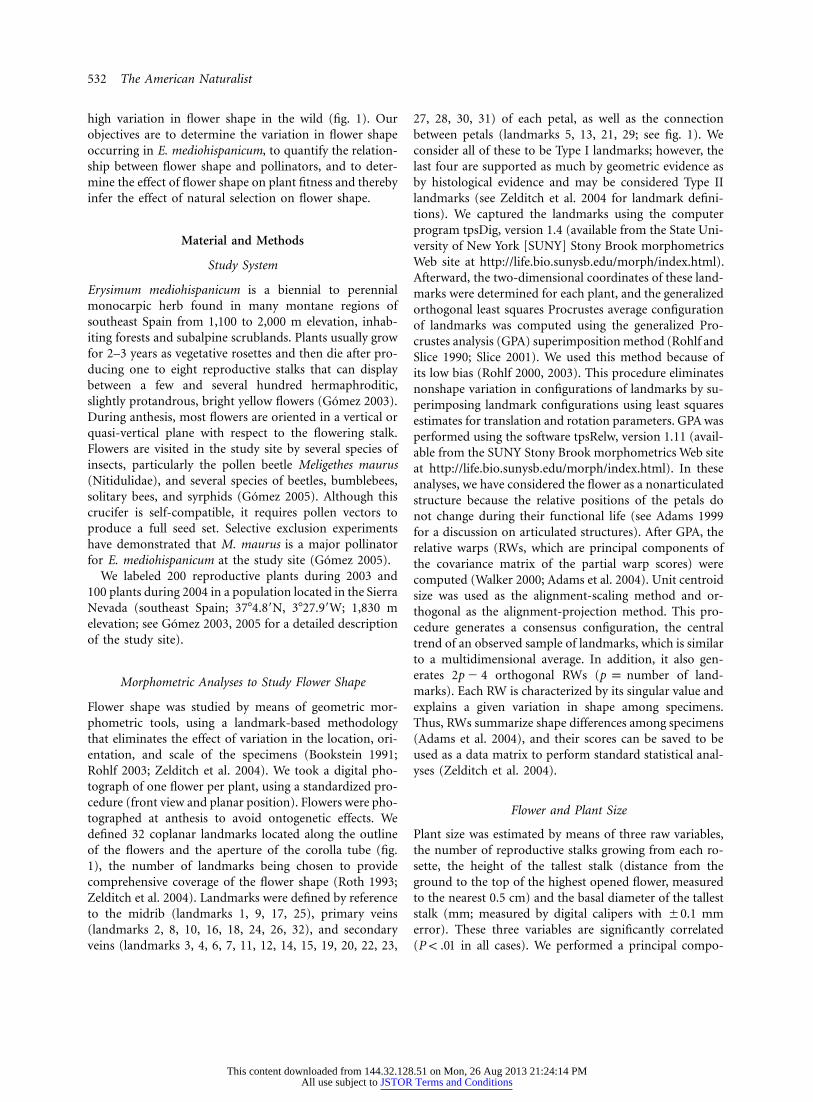
high variation in flower shape in the wild (fig. 1). Ourobjectives are to determine the variation in flower shapeoccurring in E. mediohispanicum, to quantify the relation-ship between flower shape and pollinators, and to deter-mine the effect of flower shape on plant fitness and therebyinfer the effect of natural selection on flower shape.
Material and Methods
Study System
Erysimum mediohispanicum is a biennial to perennialmonocarpic herb found in many montane regions ofsoutheast Spain from 1,100 to 2,000 m elevation, inhab-iting forests and subalpine scrublands. Plants usually growfor 2–3 years as vegetative rosettes and then die after pro-ducing one to eight reproductive stalks that can displaybetween a few and several hundred hermaphroditic,slightly protandrous, bright yellow flowers (Gomez 2003).During anthesis, most flowers are oriented in a vertical orquasi-vertical plane with respect to the flowering stalk.Flowers are visited in the study site by several species ofinsects, particularly the pollen beetle Meligethes maurus(Nitidulidae), and several species of beetles, bumblebees,solitary bees, and syrphids (Gomez 2005). Although thiscrucifer is self-compatible, it requires pollen vectors toproduce a full seed set. Selective exclusion experimentshave demonstrated that M. maurus is a major pollinatorfor E. mediohispanicum at the study site (Gomez 2005).
We labeled 200 reproductive plants during 2003 and100 plants during 2004 in a population located in the SierraNevada (southeast Spain; 37�4.8�N, 3�27.9�W; 1,830 melevation; see Gomez 2003, 2005 for a detailed descriptionof the study site).
Morphometric Analyses to Study Flower Shape
Flower shape was studied by means of geometric mor-phometric tools, using a landmark-based methodologythat eliminates the effect of variation in the location, ori-entation, and scale of the specimens (Bookstein 1991;Rohlf 2003; Zelditch et al. 2004). We took a digital pho-tograph of one flower per plant, using a standardized pro-cedure (front view and planar position). Flowers were pho-tographed at anthesis to avoid ontogenetic effects. Wedefined 32 coplanar landmarks located along the outlineof the flowers and the aperture of the corolla tube (fig.1), the number of landmarks being chosen to providecomprehensive coverage of the flower shape (Roth 1993;Zelditch et al. 2004). Landmarks were defined by referenceto the midrib (landmarks 1, 9, 17, 25), primary veins(landmarks 2, 8, 10, 16, 18, 24, 26, 32), and secondaryveins (landmarks 3, 4, 6, 7, 11, 12, 14, 15, 19, 20, 22, 23,
27, 28, 30, 31) of each petal, as well as the connectionbetween petals (landmarks 5, 13, 21, 29; see fig. 1). Weconsider all of these to be Type I landmarks; however, thelast four are supported as much by geometric evidence asby histological evidence and may be considered Type IIlandmarks (see Zelditch et al. 2004 for landmark defini-tions). We captured the landmarks using the computerprogram tpsDig, version 1.4 (available from the State Uni-versity of New York [SUNY] Stony Brook morphometricsWeb site at http://life.bio.sunysb.edu/morph/index.html).Afterward, the two-dimensional coordinates of these land-marks were determined for each plant, and the generalizedorthogonal least squares Procrustes average configurationof landmarks was computed using the generalized Pro-crustes analysis (GPA) superimposition method (Rohlf andSlice 1990; Slice 2001). We used this method because ofits low bias (Rohlf 2000, 2003). This procedure eliminatesnonshape variation in configurations of landmarks by su-perimposing landmark configurations using least squaresestimates for translation and rotation parameters. GPA wasperformed using the software tpsRelw, version 1.11 (avail-able from the SUNY Stony Brook morphometrics Web siteat http://life.bio.sunysb.edu/morph/index.html). In theseanalyses, we have considered the flower as a nonarticulatedstructure because the relative positions of the petals donot change during their functional life (see Adams 1999for a discussion on articulated structures). After GPA, therelative warps (RWs, which are principal components ofthe covariance matrix of the partial warp scores) werecomputed (Walker 2000; Adams et al. 2004). Unit centroidsize was used as the alignment-scaling method and or-thogonal as the alignment-projection method. This pro-cedure generates a consensus configuration, the centraltrend of an observed sample of landmarks, which is similarto a multidimensional average. In addition, it also gen-erates orthogonal RWs ( of land-2p � 4 p p numbermarks). Each RW is characterized by its singular value andexplains a given variation in shape among specimens.Thus, RWs summarize shape differences among specimens(Adams et al. 2004), and their scores can be saved to beused as a data matrix to perform standard statistical anal-yses (Zelditch et al. 2004).
Flower and Plant Size
Plant size was estimated by means of three raw variables,the number of reproductive stalks growing from each ro-sette, the height of the tallest stalk (distance from theground to the top of the highest opened flower, measuredto the nearest 0.5 cm) and the basal diameter of the talleststalk (mm; measured by digital calipers with �0.1 mmerror). These three variables are significantly correlated( in all cases). We performed a principal compo-P ! .01
This content downloaded from 144.32.128.51 on Mon, 26 Aug 2013 21:24:14 PMAll use subject to JSTOR Terms and Conditions
Figure 1: Diverse floral forms of Erysimum mediohispanicum occurring in the population studied. The uppermost left panel shows the location ofthe 32 landmarks used in the geometric morphometric analysis.
This content downloaded from 144.32.128.51 on Mon, 26 Aug 2013 21:24:14 PMAll use subject to JSTOR Terms and Conditions
534 The American Naturalist
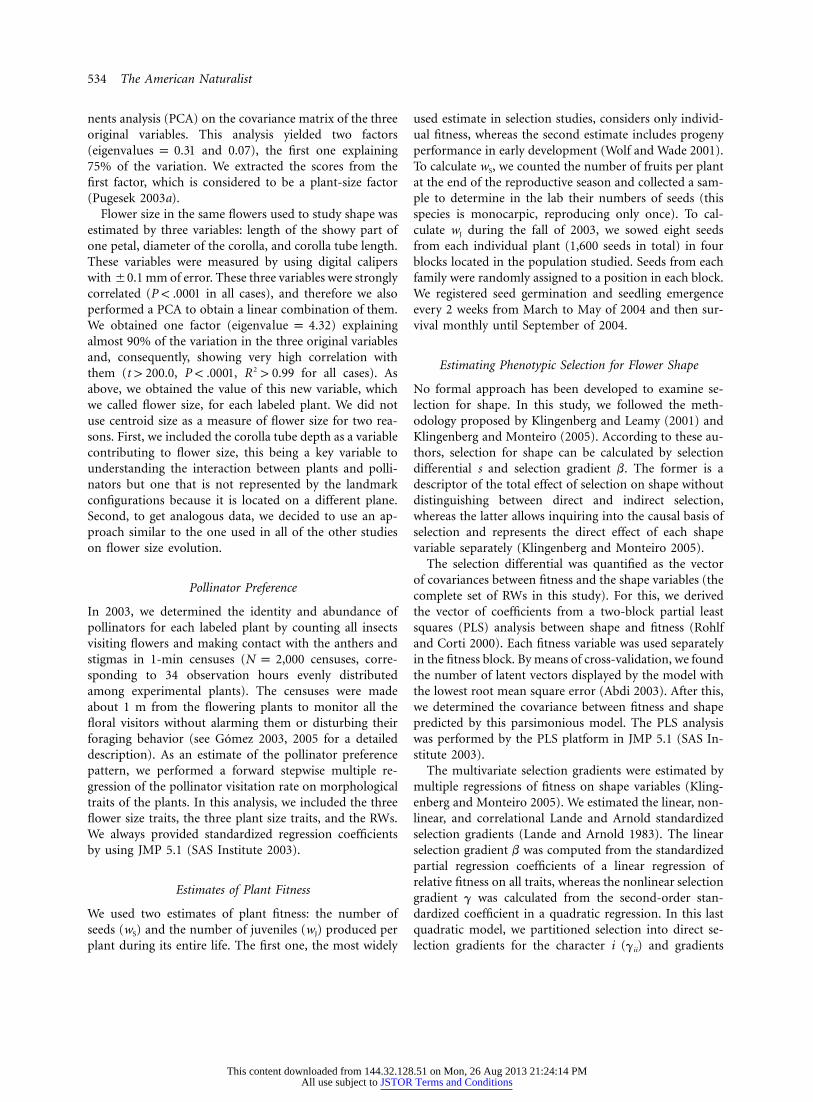
nents analysis (PCA) on the covariance matrix of the threeoriginal variables. This analysis yielded two factors( and 0.07), the first one explainingeigenvalues p 0.3175% of the variation. We extracted the scores from thefirst factor, which is considered to be a plant-size factor(Pugesek 2003a).
Flower size in the same flowers used to study shape wasestimated by three variables: length of the showy part ofone petal, diameter of the corolla, and corolla tube length.These variables were measured by using digital caliperswith �0.1 mm of error. These three variables were stronglycorrelated ( in all cases), and therefore we alsoP ! .0001performed a PCA to obtain a linear combination of them.We obtained one factor ( ) explainingeigenvalue p 4.32almost 90% of the variation in the three original variablesand, consequently, showing very high correlation withthem ( , , for all cases). As2t 1 200.0 P ! .0001 R 1 0.99above, we obtained the value of this new variable, whichwe called flower size, for each labeled plant. We did notuse centroid size as a measure of flower size for two rea-sons. First, we included the corolla tube depth as a variablecontributing to flower size, this being a key variable tounderstanding the interaction between plants and polli-nators but one that is not represented by the landmarkconfigurations because it is located on a different plane.Second, to get analogous data, we decided to use an ap-proach similar to the one used in all of the other studieson flower size evolution.
Pollinator Preference
In 2003, we determined the identity and abundance ofpollinators for each labeled plant by counting all insectsvisiting flowers and making contact with the anthers andstigmas in 1-min censuses ( censuses, corre-N p 2,000sponding to 34 observation hours evenly distributedamong experimental plants). The censuses were madeabout 1 m from the flowering plants to monitor all thefloral visitors without alarming them or disturbing theirforaging behavior (see Gomez 2003, 2005 for a detaileddescription). As an estimate of the pollinator preferencepattern, we performed a forward stepwise multiple re-gression of the pollinator visitation rate on morphologicaltraits of the plants. In this analysis, we included the threeflower size traits, the three plant size traits, and the RWs.We always provided standardized regression coefficientsby using JMP 5.1 (SAS Institute 2003).
Estimates of Plant Fitness
We used two estimates of plant fitness: the number ofseeds (wS) and the number of juveniles (wJ) produced perplant during its entire life. The first one, the most widely
used estimate in selection studies, considers only individ-ual fitness, whereas the second estimate includes progenyperformance in early development (Wolf and Wade 2001).To calculate wS, we counted the number of fruits per plantat the end of the reproductive season and collected a sam-ple to determine in the lab their numbers of seeds (thisspecies is monocarpic, reproducing only once). To cal-culate wJ during the fall of 2003, we sowed eight seedsfrom each individual plant (1,600 seeds in total) in fourblocks located in the population studied. Seeds from eachfamily were randomly assigned to a position in each block.We registered seed germination and seedling emergenceevery 2 weeks from March to May of 2004 and then sur-vival monthly until September of 2004.
Estimating Phenotypic Selection for Flower Shape
No formal approach has been developed to examine se-lection for shape. In this study, we followed the meth-odology proposed by Klingenberg and Leamy (2001) andKlingenberg and Monteiro (2005). According to these au-thors, selection for shape can be calculated by selectiondifferential s and selection gradient b. The former is adescriptor of the total effect of selection on shape withoutdistinguishing between direct and indirect selection,whereas the latter allows inquiring into the causal basis ofselection and represents the direct effect of each shapevariable separately (Klingenberg and Monteiro 2005).
The selection differential was quantified as the vectorof covariances between fitness and the shape variables (thecomplete set of RWs in this study). For this, we derivedthe vector of coefficients from a two-block partial leastsquares (PLS) analysis between shape and fitness (Rohlfand Corti 2000). Each fitness variable was used separatelyin the fitness block. By means of cross-validation, we foundthe number of latent vectors displayed by the model withthe lowest root mean square error (Abdi 2003). After this,we determined the covariance between fitness and shapepredicted by this parsimonious model. The PLS analysiswas performed by the PLS platform in JMP 5.1 (SAS In-stitute 2003).
The multivariate selection gradients were estimated bymultiple regressions of fitness on shape variables (Kling-enberg and Monteiro 2005). We estimated the linear, non-linear, and correlational Lande and Arnold standardizedselection gradients (Lande and Arnold 1983). The linearselection gradient b was computed from the standardizedpartial regression coefficients of a linear regression ofrelative fitness on all traits, whereas the nonlinear selectiongradient g was calculated from the second-order stan-dardized coefficient in a quadratic regression. In this lastquadratic model, we partitioned selection into direct se-lection gradients for the character i (gii) and gradients
This content downloaded from 144.32.128.51 on Mon, 26 Aug 2013 21:24:14 PMAll use subject to JSTOR Terms and Conditions
Natural Selection and the Evolution of Zygomorphy 535
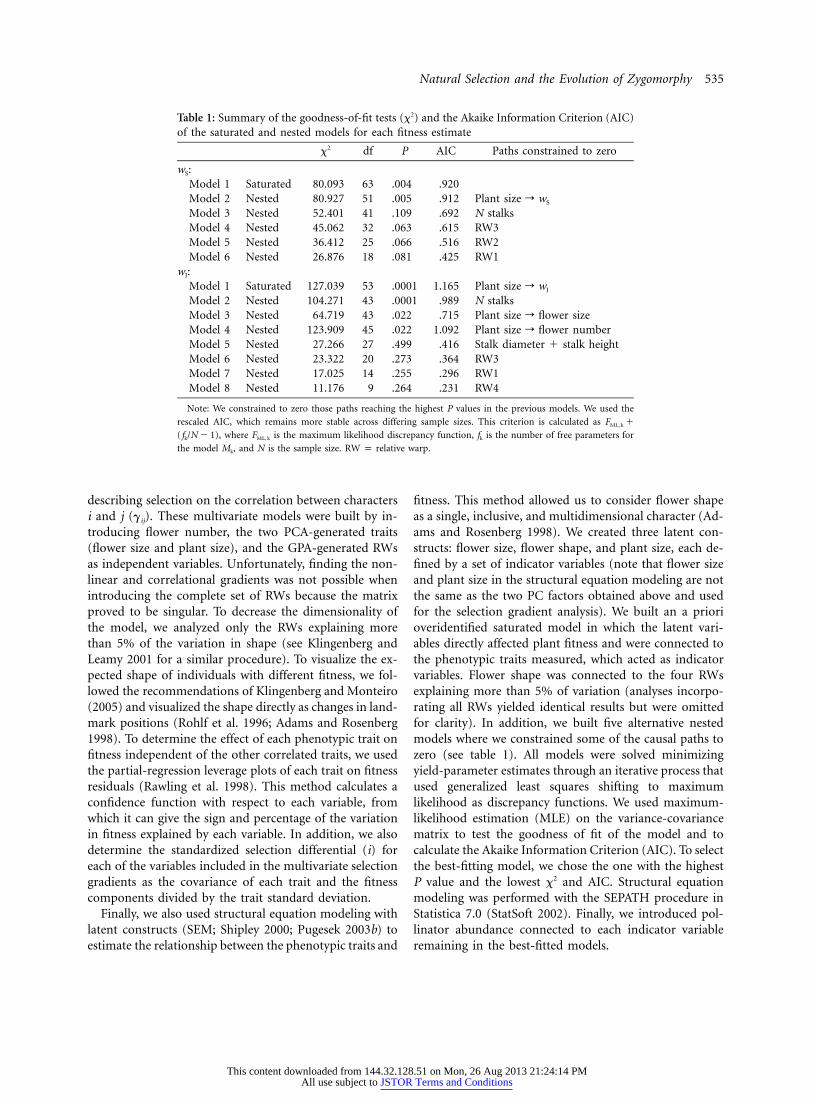
Table 1: Summary of the goodness-of-fit tests (x2) and the Akaike Information Criterion (AIC)of the saturated and nested models for each fitness estimate
x2 df P AIC Paths constrained to zero
wS:Model 1 Saturated 80.093 63 .004 .920Model 2 Nested 80.927 51 .005 .912 Plant size r wS
Model 3 Nested 52.401 41 .109 .692 N stalksModel 4 Nested 45.062 32 .063 .615 RW3Model 5 Nested 36.412 25 .066 .516 RW2Model 6 Nested 26.876 18 .081 .425 RW1
wJ:Model 1 Saturated 127.039 53 .0001 1.165 Plant size r wJ
Model 2 Nested 104.271 43 .0001 .989 N stalksModel 3 Nested 64.719 43 .022 .715 Plant size r flower sizeModel 4 Nested 123.909 45 .022 1.092 Plant size r flower numberModel 5 Nested 27.266 27 .499 .416 Stalk diameter � stalk heightModel 6 Nested 23.322 20 .273 .364 RW3Model 7 Nested 17.025 14 .255 .296 RW1Model 8 Nested 11.176 9 .264 .231 RW4
Note: We constrained to zero those paths reaching the highest P values in the previous models. We used the
rescaled AIC, which remains more stable across differing sample sizes. This criterion is calculated as F �ML, k
, where is the maximum likelihood discrepancy function, fk is the number of free parameters for( f /N � 1) Fk ML, k
the model Mk, and N is the sample size. warp.RW p relative
describing selection on the correlation between charactersi and j (gij). These multivariate models were built by in-troducing flower number, the two PCA-generated traits(flower size and plant size), and the GPA-generated RWsas independent variables. Unfortunately, finding the non-linear and correlational gradients was not possible whenintroducing the complete set of RWs because the matrixproved to be singular. To decrease the dimensionality ofthe model, we analyzed only the RWs explaining morethan 5% of the variation in shape (see Klingenberg andLeamy 2001 for a similar procedure). To visualize the ex-pected shape of individuals with different fitness, we fol-lowed the recommendations of Klingenberg and Monteiro(2005) and visualized the shape directly as changes in land-mark positions (Rohlf et al. 1996; Adams and Rosenberg1998). To determine the effect of each phenotypic trait onfitness independent of the other correlated traits, we usedthe partial-regression leverage plots of each trait on fitnessresiduals (Rawling et al. 1998). This method calculates aconfidence function with respect to each variable, fromwhich it can give the sign and percentage of the variationin fitness explained by each variable. In addition, we alsodetermine the standardized selection differential (i) foreach of the variables included in the multivariate selectiongradients as the covariance of each trait and the fitnesscomponents divided by the trait standard deviation.
Finally, we also used structural equation modeling withlatent constructs (SEM; Shipley 2000; Pugesek 2003b) toestimate the relationship between the phenotypic traits and
fitness. This method allowed us to consider flower shapeas a single, inclusive, and multidimensional character (Ad-ams and Rosenberg 1998). We created three latent con-structs: flower size, flower shape, and plant size, each de-fined by a set of indicator variables (note that flower sizeand plant size in the structural equation modeling are notthe same as the two PC factors obtained above and usedfor the selection gradient analysis). We built an a priorioveridentified saturated model in which the latent vari-ables directly affected plant fitness and were connected tothe phenotypic traits measured, which acted as indicatorvariables. Flower shape was connected to the four RWsexplaining more than 5% of variation (analyses incorpo-rating all RWs yielded identical results but were omittedfor clarity). In addition, we built five alternative nestedmodels where we constrained some of the causal paths tozero (see table 1). All models were solved minimizingyield-parameter estimates through an iterative process thatused generalized least squares shifting to maximumlikelihood as discrepancy functions. We used maximum-likelihood estimation (MLE) on the variance-covariancematrix to test the goodness of fit of the model and tocalculate the Akaike Information Criterion (AIC). To selectthe best-fitting model, we chose the one with the highestP value and the lowest x2 and AIC. Structural equationmodeling was performed with the SEPATH procedure inStatistica 7.0 (StatSoft 2002). Finally, we introduced pol-linator abundance connected to each indicator variableremaining in the best-fitted models.
This content downloaded from 144.32.128.51 on Mon, 26 Aug 2013 21:24:14 PMAll use subject to JSTOR Terms and Conditions
536
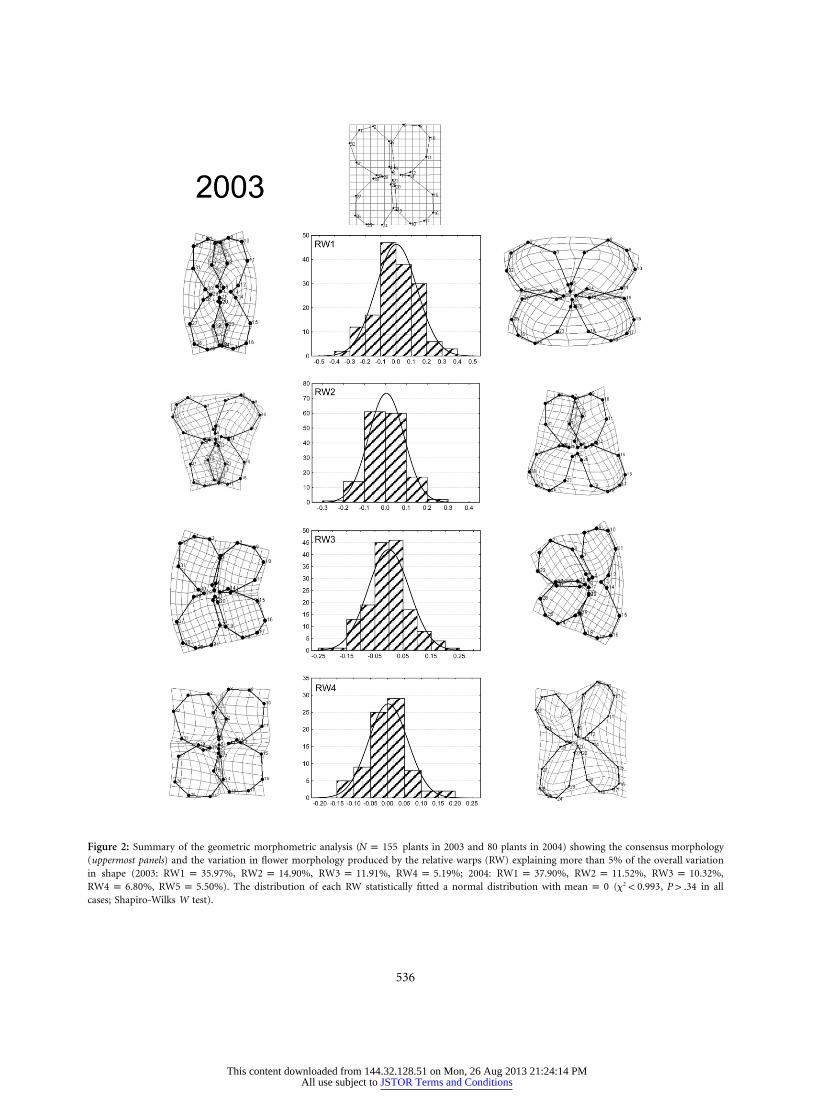
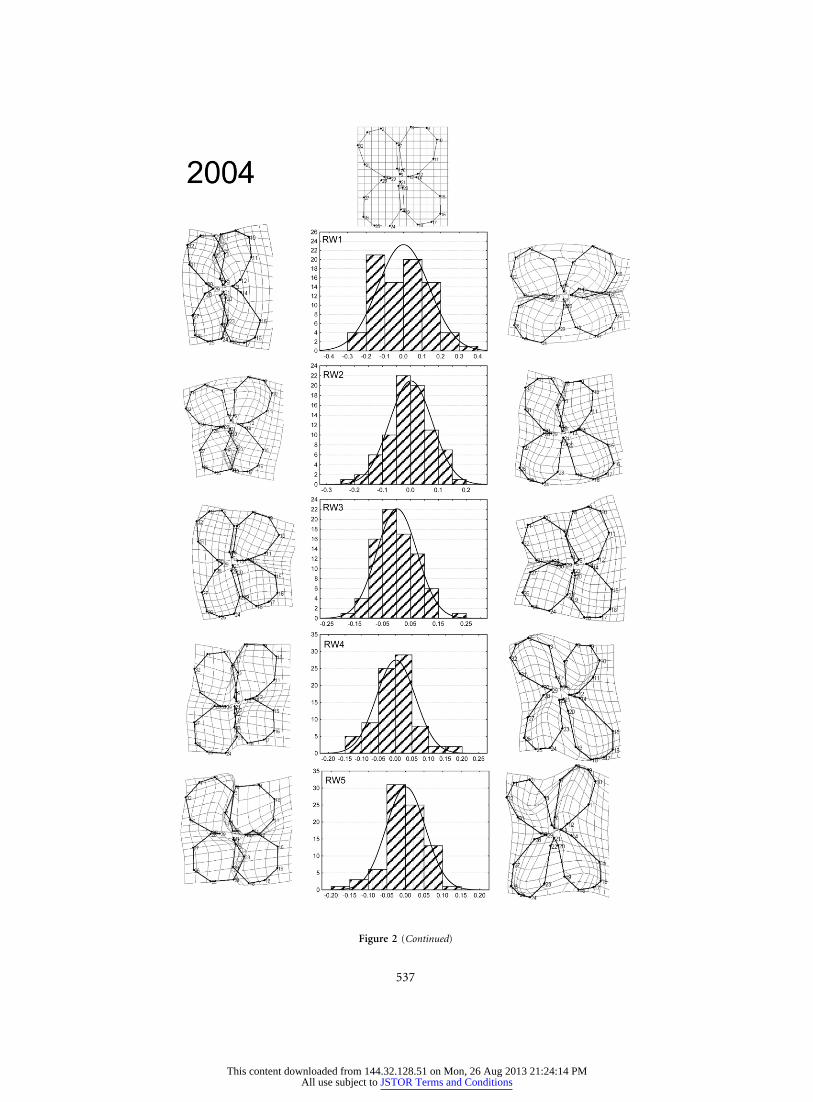
Figure 2: Summary of the geometric morphometric analysis ( plants in 2003 and 80 plants in 2004) showing the consensus morphologyN p 155(uppermost panels) and the variation in flower morphology produced by the relative warps (RW) explaining more than 5% of the overall variationin shape (2003: , , , ; 2004: , , ,RW1 p 35.97% RW2 p 14.90% RW3 p 11.91% RW4 p 5.19% RW1 p 37.90% RW2 p 11.52% RW3 p 10.32%
, ). The distribution of each RW statistically fitted a normal distribution with ( , in all2RW4 p 6.80% RW5 p 5.50% mean p 0 x ! 0.993 P 1 .34cases; Shapiro-Wilks W test).
This content downloaded from 144.32.128.51 on Mon, 26 Aug 2013 21:24:14 PMAll use subject to JSTOR Terms and Conditions
537
Figure 2 (Continued)
This content downloaded from 144.32.128.51 on Mon, 26 Aug 2013 21:24:14 PMAll use subject to JSTOR Terms and Conditions
538 The American Naturalist
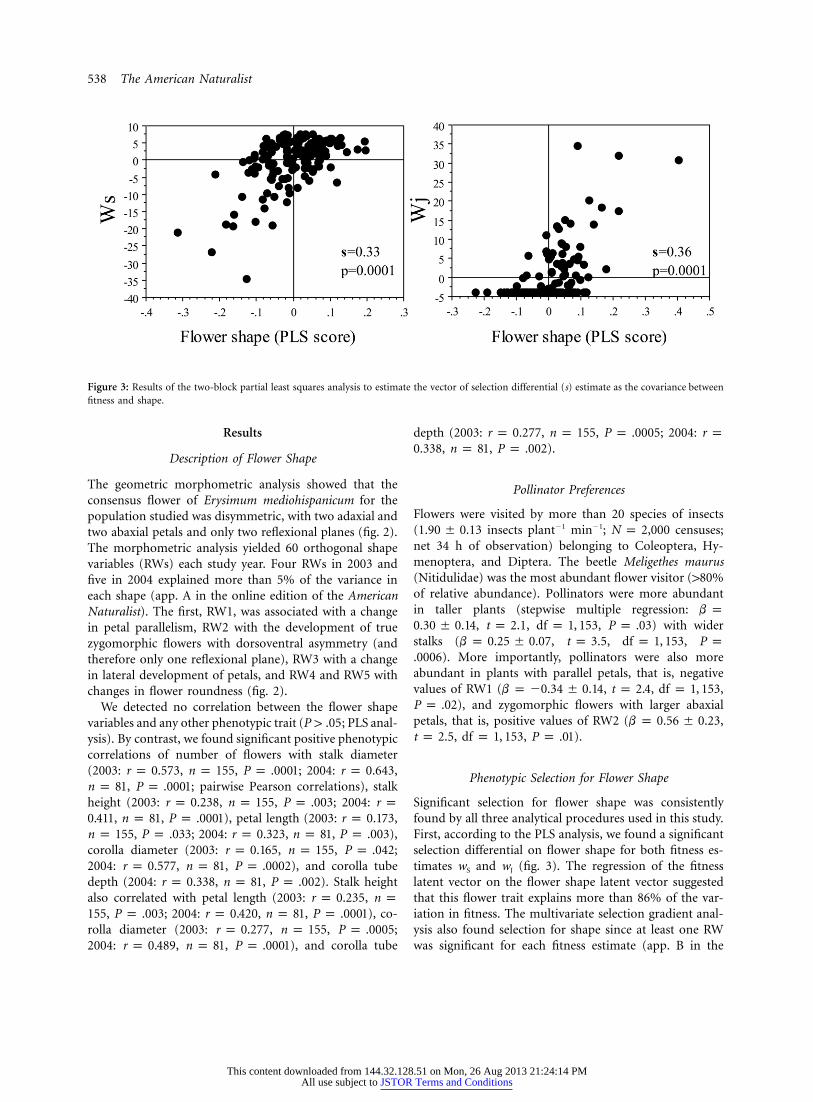
Figure 3: Results of the two-block partial least squares analysis to estimate the vector of selection differential (s) estimate as the covariance betweenfitness and shape.
Results
Description of Flower Shape
The geometric morphometric analysis showed that theconsensus flower of Erysimum mediohispanicum for thepopulation studied was disymmetric, with two adaxial andtwo abaxial petals and only two reflexional planes (fig. 2).The morphometric analysis yielded 60 orthogonal shapevariables (RWs) each study year. Four RWs in 2003 andfive in 2004 explained more than 5% of the variance ineach shape (app. A in the online edition of the AmericanNaturalist). The first, RW1, was associated with a changein petal parallelism, RW2 with the development of truezygomorphic flowers with dorsoventral asymmetry (andtherefore only one reflexional plane), RW3 with a changein lateral development of petals, and RW4 and RW5 withchanges in flower roundness (fig. 2).
We detected no correlation between the flower shapevariables and any other phenotypic trait ( ; PLS anal-P 1 .05ysis). By contrast, we found significant positive phenotypiccorrelations of number of flowers with stalk diameter(2003: , , ; 2004: ,r p 0.573 n p 155 P p .0001 r p 0.643
, ; pairwise Pearson correlations), stalkn p 81 P p .0001height (2003: , , ; 2004:r p 0.238 n p 155 P p .003 r p
, , ), petal length (2003: ,0.411 n p 81 P p .0001 r p 0.173, ; 2004: , , ),n p 155 P p .033 r p 0.323 n p 81 P p .003
corolla diameter (2003: , , ;r p 0.165 n p 155 P p .0422004: , , ), and corolla tuber p 0.577 n p 81 P p .0002depth (2004: , , ). Stalk heightr p 0.338 n p 81 P p .002also correlated with petal length (2003: ,r p 0.235 n p
, ; 2004: , , ), co-155 P p .003 r p 0.420 n p 81 P p .0001rolla diameter (2003: , , ;r p 0.277 n p 155 P p .00052004: , , ), and corolla tuber p 0.489 n p 81 P p .0001
depth (2003: , , ; 2004:r p 0.277 n p 155 P p .0005 r p, , ).0.338 n p 81 P p .002
Pollinator Preferences
Flowers were visited by more than 20 species of insects( insects plant�1 min�1; censuses;1.90 � 0.13 N p 2,000net 34 h of observation) belonging to Coleoptera, Hy-menoptera, and Diptera. The beetle Meligethes maurus(Nitidulidae) was the most abundant flower visitor (180%of relative abundance). Pollinators were more abundantin taller plants (stepwise multiple regression: b p
, , , ) with wider0.30 � 0.14 t p 2.1 df p 1, 153 P p .03stalks ( , , ,b p 0.25 � 0.07 t p 3.5 df p 1, 153 P p
). More importantly, pollinators were also more.0006abundant in plants with parallel petals, that is, negativevalues of RW1 ( , , ,b p �0.34 � 0.14 t p 2.4 df p 1, 153
), and zygomorphic flowers with larger abaxialP p .02petals, that is, positive values of RW2 ( ,b p 0.56 � 0.23
, , ).t p 2.5 df p 1, 153 P p .01
Phenotypic Selection for Flower Shape
Significant selection for flower shape was consistentlyfound by all three analytical procedures used in this study.First, according to the PLS analysis, we found a significantselection differential on flower shape for both fitness es-timates wS and wJ (fig. 3). The regression of the fitnesslatent vector on the flower shape latent vector suggestedthat this flower trait explains more than 86% of the var-iation in fitness. The multivariate selection gradient anal-ysis also found selection for shape since at least one RWwas significant for each fitness estimate (app. B in the
This content downloaded from 144.32.128.51 on Mon, 26 Aug 2013 21:24:14 PMAll use subject to JSTOR Terms and Conditions
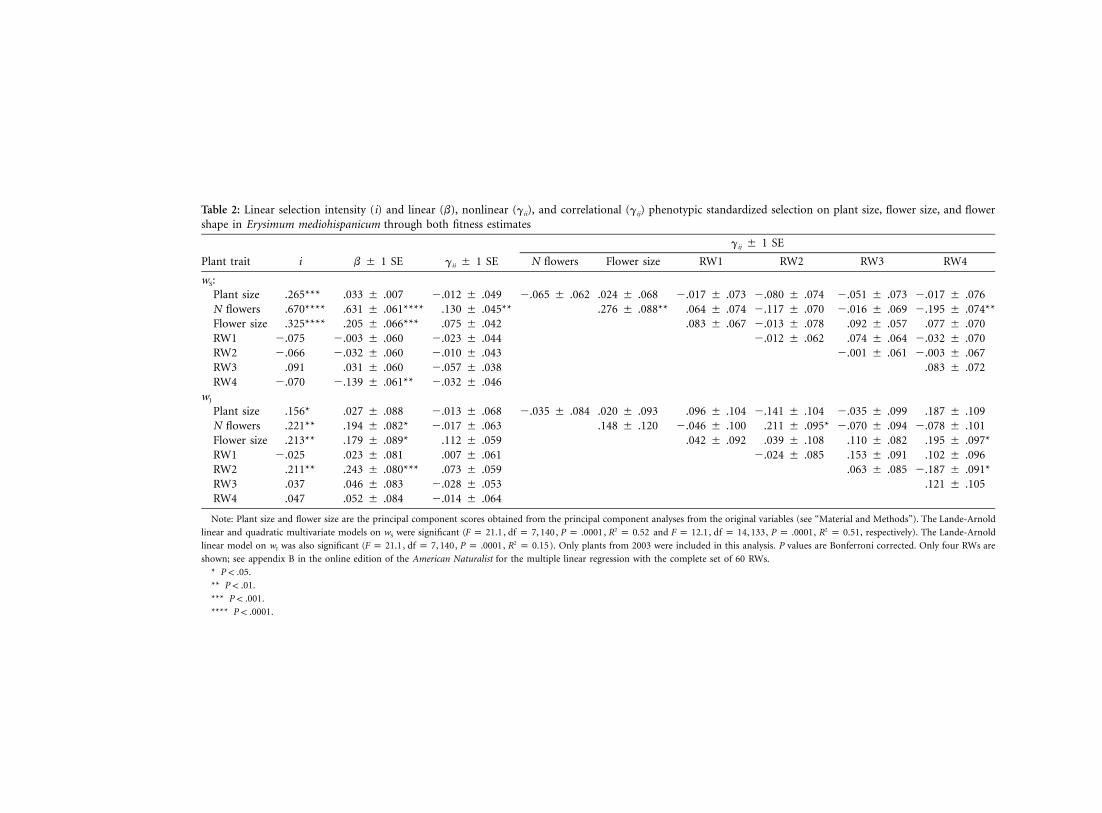
Table 2: Linear selection intensity (i) and linear (b), nonlinear (gii), and correlational (gij) phenotypic standardized selection on plant size, flower size, and flowershape in Erysimum mediohispanicum through both fitness estimates
Plant trait i b � 1 SE gii � 1 SE
gij � 1 SE
N flowers Flower size RW1 RW2 RW3 RW4
wS:Plant size .265*** .033 � .007 �.012 � .049 �.065 � .062 .024 � .068 �.017 � .073 �.080 � .074 �.051 � .073 �.017 � .076N flowers .670**** .631 � .061**** .130 � .045** .276 � .088** .064 � .074 �.117 � .070 �.016 � .069 �.195 � .074**Flower size .325**** .205 � .066*** .075 � .042 .083 � .067 �.013 � .078 .092 � .057 .077 � .070RW1 �.075 �.003 � .060 �.023 � .044 �.012 � .062 .074 � .064 �.032 � .070RW2 �.066 �.032 � .060 �.010 � .043 �.001 � .061 �.003 � .067RW3 .091 .031 � .060 �.057 � .038 .083 � .072RW4 �.070 �.139 � .061** �.032 � .046
wJ
Plant size .156* .027 � .088 �.013 � .068 �.035 � .084 .020 � .093 .096 � .104 �.141 � .104 �.035 � .099 .187 � .109N flowers .221** .194 � .082* �.017 � .063 .148 � .120 �.046 � .100 .211 � .095* �.070 � .094 �.078 � .101Flower size .213** .179 � .089* .112 � .059 .042 � .092 .039 � .108 .110 � .082 .195 � .097*RW1 �.025 .023 � .081 .007 � .061 �.024 � .085 .153 � .091 .102 � .096RW2 .211** .243 � .080*** .073 � .059 .063 � .085 �.187 � .091*RW3 .037 .046 � .083 �.028 � .053 .121 � .105RW4 .047 .052 � .084 �.014 � .064
Note: Plant size and flower size are the principal component scores obtained from the principal component analyses from the original variables (see “Material and Methods”). The Lande-Arnold
linear and quadratic multivariate models on wS were significant ( , , , and , , , , respectively). The Lande-Arnold2 2F p 21.1 df p 7, 140 P p .0001 R p 0.52 F p 12.1 df p 14, 133 P p .0001 R p 0.51
linear model on wJ was also significant ( , , , ). Only plants from 2003 were included in this analysis. P values are Bonferroni corrected. Only four RWs are2F p 21.1 df p 7, 140 P p .0001 R p 0.15
shown; see appendix B in the online edition of the American Naturalist for the multiple linear regression with the complete set of 60 RWs.
* .P ! .05
** .P ! .01
*** .P ! .001
**** .P ! .0001
This content downloaded from 144.32.128.51 on Mon, 26 Aug 2013 21:24:14 PMAll use subject to JSTOR Terms and Conditions
540 The American Naturalist
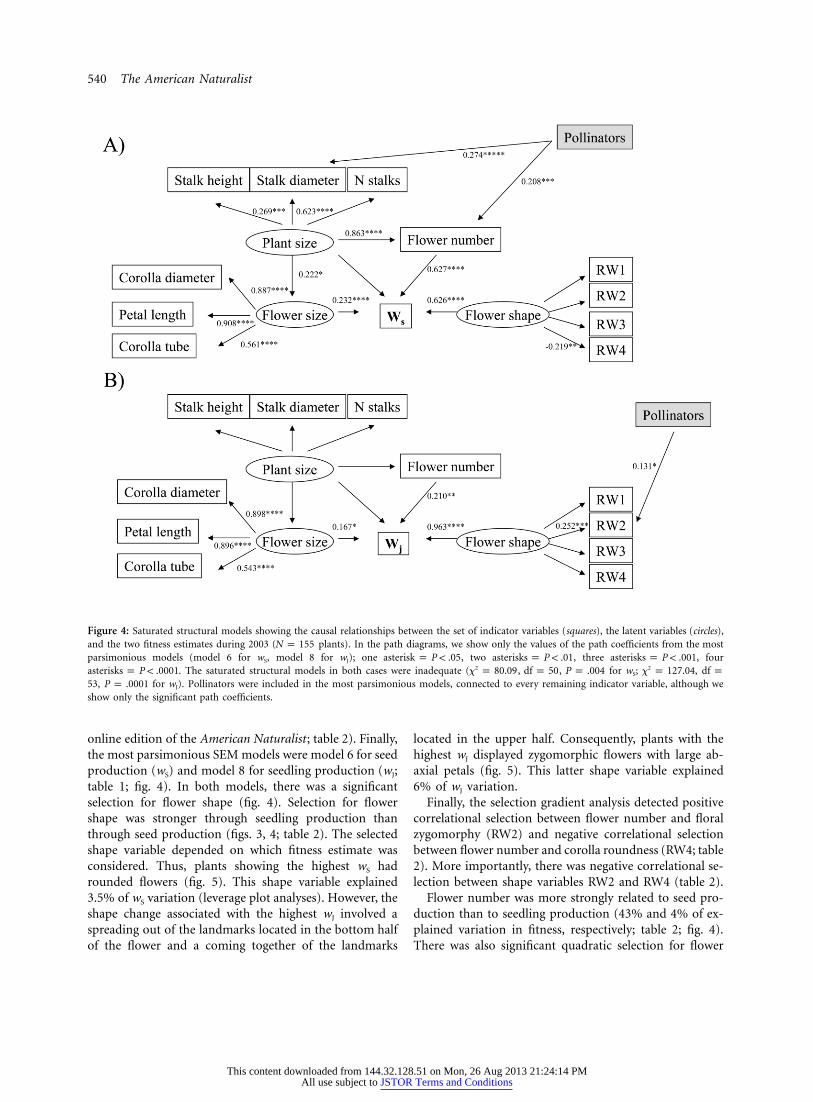
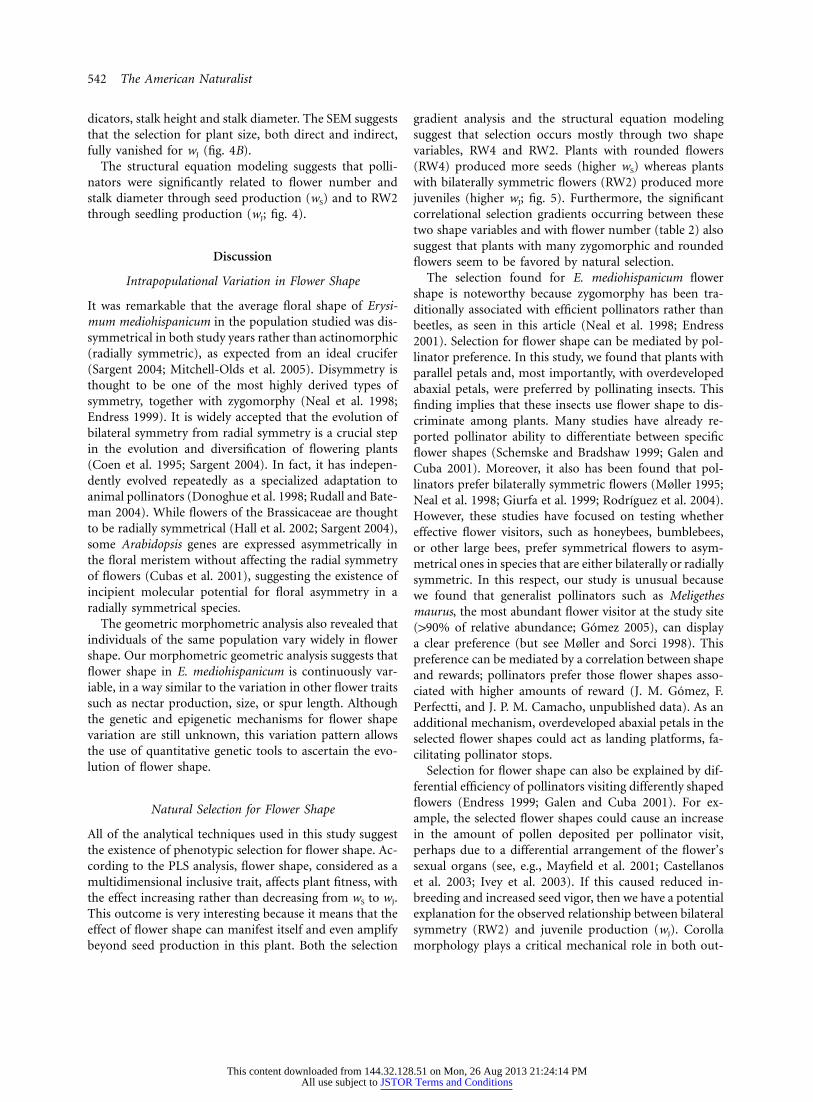
Figure 4: Saturated structural models showing the causal relationships between the set of indicator variables (squares), the latent variables (circles),and the two fitness estimates during 2003 ( plants). In the path diagrams, we show only the values of the path coefficients from the mostN p 155parsimonious models (model 6 for wS, model 8 for wJ); one , two , three , fourasterisk p P ! .05 asterisks p P ! .01 asterisks p P ! .001
. The saturated structural models in both cases were inadequate ( , , for wS; ,2 2asterisks p P ! .0001 x p 80.09 df p 50 P p .004 x p 127.04 df p, for wJ). Pollinators were included in the most parsimonious models, connected to every remaining indicator variable, although we53 P p .0001
show only the significant path coefficients.
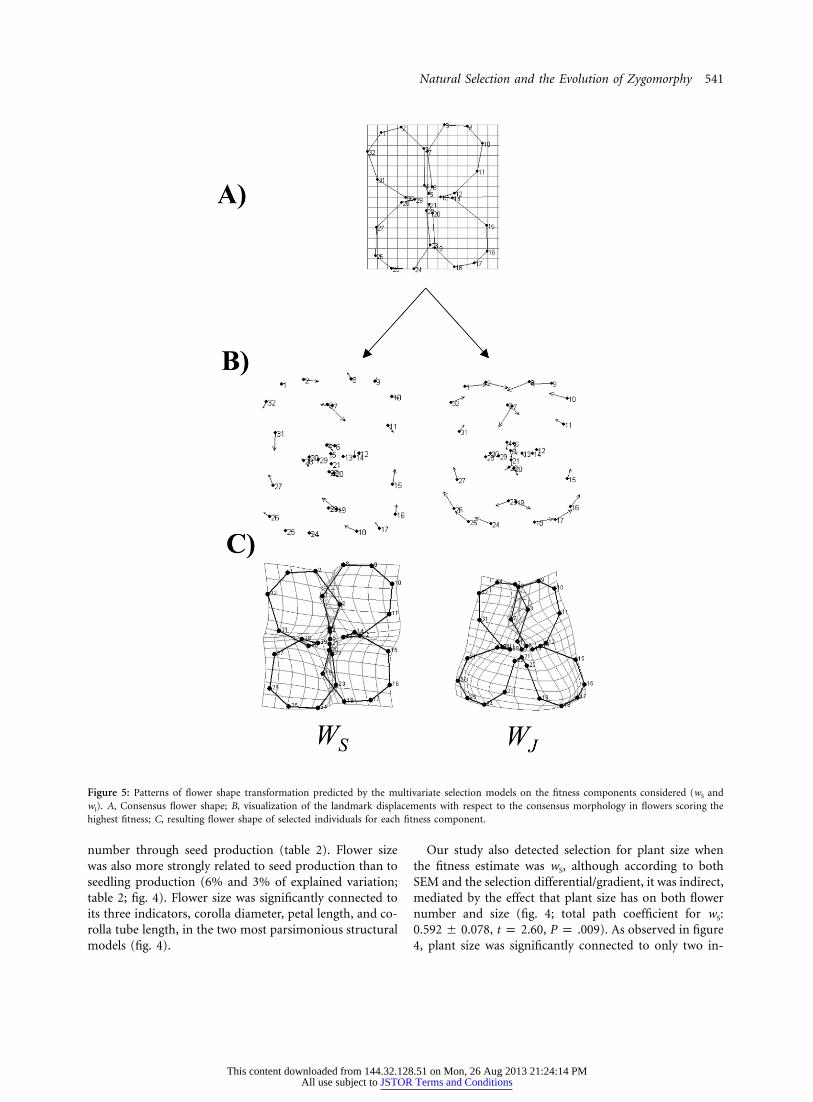
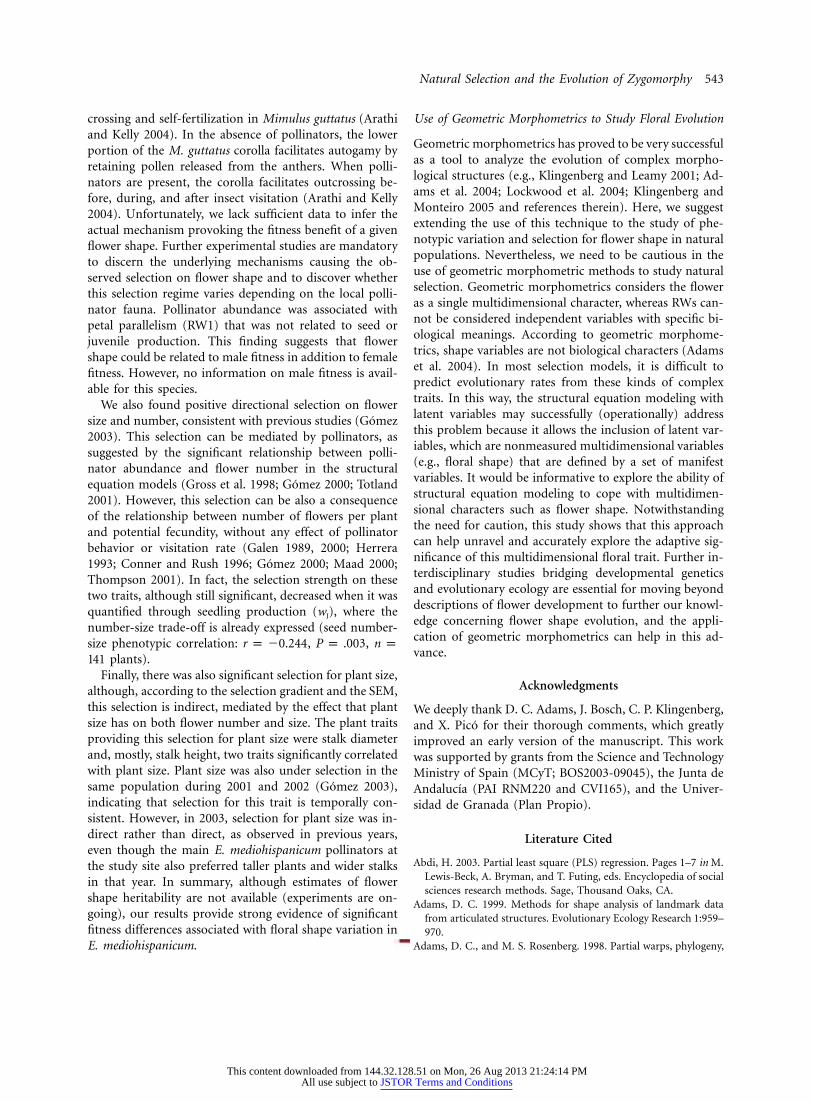
online edition of the American Naturalist ; table 2). Finally,the most parsimonious SEM models were model 6 for seedproduction (wS) and model 8 for seedling production (wJ;table 1; fig. 4). In both models, there was a significantselection for flower shape (fig. 4). Selection for flowershape was stronger through seedling production thanthrough seed production (figs. 3, 4; table 2). The selectedshape variable depended on which fitness estimate wasconsidered. Thus, plants showing the highest wS hadrounded flowers (fig. 5). This shape variable explained3.5% of wS variation (leverage plot analyses). However, theshape change associated with the highest wJ involved aspreading out of the landmarks located in the bottom halfof the flower and a coming together of the landmarks
located in the upper half. Consequently, plants with thehighest wJ displayed zygomorphic flowers with large ab-axial petals (fig. 5). This latter shape variable explained6% of wJ variation.
Finally, the selection gradient analysis detected positivecorrelational selection between flower number and floralzygomorphy (RW2) and negative correlational selectionbetween flower number and corolla roundness (RW4; table2). More importantly, there was negative correlational se-lection between shape variables RW2 and RW4 (table 2).
Flower number was more strongly related to seed pro-duction than to seedling production (43% and 4% of ex-plained variation in fitness, respectively; table 2; fig. 4).There was also significant quadratic selection for flower
This content downloaded from 144.32.128.51 on Mon, 26 Aug 2013 21:24:14 PMAll use subject to JSTOR Terms and Conditions
Natural Selection and the Evolution of Zygomorphy 541
Figure 5: Patterns of flower shape transformation predicted by the multivariate selection models on the fitness components considered (wS andwJ). A, Consensus flower shape; B, visualization of the landmark displacements with respect to the consensus morphology in flowers scoring thehighest fitness; C, resulting flower shape of selected individuals for each fitness component.
number through seed production (table 2). Flower sizewas also more strongly related to seed production than toseedling production (6% and 3% of explained variation;table 2; fig. 4). Flower size was significantly connected toits three indicators, corolla diameter, petal length, and co-rolla tube length, in the two most parsimonious structuralmodels (fig. 4).
Our study also detected selection for plant size whenthe fitness estimate was wS, although according to bothSEM and the selection differential/gradient, it was indirect,mediated by the effect that plant size has on both flowernumber and size (fig. 4; total path coefficient for wS:
, , ). As observed in figure0.592 � 0.078 t p 2.60 P p .0094, plant size was significantly connected to only two in-
This content downloaded from 144.32.128.51 on Mon, 26 Aug 2013 21:24:14 PMAll use subject to JSTOR Terms and Conditions
542 The American Naturalist
dicators, stalk height and stalk diameter. The SEM suggeststhat the selection for plant size, both direct and indirect,fully vanished for wJ (fig. 4B).
The structural equation modeling suggests that polli-nators were significantly related to flower number andstalk diameter through seed production (wS) and to RW2through seedling production (wJ; fig. 4).
Discussion
Intrapopulational Variation in Flower Shape
It was remarkable that the average floral shape of Erysi-mum mediohispanicum in the population studied was dis-symmetrical in both study years rather than actinomorphic(radially symmetric), as expected from an ideal crucifer(Sargent 2004; Mitchell-Olds et al. 2005). Disymmetry isthought to be one of the most highly derived types ofsymmetry, together with zygomorphy (Neal et al. 1998;Endress 1999). It is widely accepted that the evolution ofbilateral symmetry from radial symmetry is a crucial stepin the evolution and diversification of flowering plants(Coen et al. 1995; Sargent 2004). In fact, it has indepen-dently evolved repeatedly as a specialized adaptation toanimal pollinators (Donoghue et al. 1998; Rudall and Bate-man 2004). While flowers of the Brassicaceae are thoughtto be radially symmetrical (Hall et al. 2002; Sargent 2004),some Arabidopsis genes are expressed asymmetrically inthe floral meristem without affecting the radial symmetryof flowers (Cubas et al. 2001), suggesting the existence ofincipient molecular potential for floral asymmetry in aradially symmetrical species.
The geometric morphometric analysis also revealed thatindividuals of the same population vary widely in flowershape. Our morphometric geometric analysis suggests thatflower shape in E. mediohispanicum is continuously var-iable, in a way similar to the variation in other flower traitssuch as nectar production, size, or spur length. Althoughthe genetic and epigenetic mechanisms for flower shapevariation are still unknown, this variation pattern allowsthe use of quantitative genetic tools to ascertain the evo-lution of flower shape.
Natural Selection for Flower Shape
All of the analytical techniques used in this study suggestthe existence of phenotypic selection for flower shape. Ac-cording to the PLS analysis, flower shape, considered as amultidimensional inclusive trait, affects plant fitness, withthe effect increasing rather than decreasing from wS to wJ.This outcome is very interesting because it means that theeffect of flower shape can manifest itself and even amplifybeyond seed production in this plant. Both the selection
gradient analysis and the structural equation modelingsuggest that selection occurs mostly through two shapevariables, RW4 and RW2. Plants with rounded flowers(RW4) produced more seeds (higher wS) whereas plantswith bilaterally symmetric flowers (RW2) produced morejuveniles (higher wJ; fig. 5). Furthermore, the significantcorrelational selection gradients occurring between thesetwo shape variables and with flower number (table 2) alsosuggest that plants with many zygomorphic and roundedflowers seem to be favored by natural selection.
The selection found for E. mediohispanicum flowershape is noteworthy because zygomorphy has been tra-ditionally associated with efficient pollinators rather thanbeetles, as seen in this article (Neal et al. 1998; Endress2001). Selection for flower shape can be mediated by pol-linator preference. In this study, we found that plants withparallel petals and, most importantly, with overdevelopedabaxial petals, were preferred by pollinating insects. Thisfinding implies that these insects use flower shape to dis-criminate among plants. Many studies have already re-ported pollinator ability to differentiate between specificflower shapes (Schemske and Bradshaw 1999; Galen andCuba 2001). Moreover, it also has been found that pol-linators prefer bilaterally symmetric flowers (Møller 1995;Neal et al. 1998; Giurfa et al. 1999; Rodrıguez et al. 2004).However, these studies have focused on testing whethereffective flower visitors, such as honeybees, bumblebees,or other large bees, prefer symmetrical flowers to asym-metrical ones in species that are either bilaterally or radiallysymmetric. In this respect, our study is unusual becausewe found that generalist pollinators such as Meligethesmaurus, the most abundant flower visitor at the study site(190% of relative abundance; Gomez 2005), can displaya clear preference (but see Møller and Sorci 1998). Thispreference can be mediated by a correlation between shapeand rewards; pollinators prefer those flower shapes asso-ciated with higher amounts of reward (J. M. Gomez, F.Perfectti, and J. P. M. Camacho, unpublished data). As anadditional mechanism, overdeveloped abaxial petals in theselected flower shapes could act as landing platforms, fa-cilitating pollinator stops.
Selection for flower shape can also be explained by dif-ferential efficiency of pollinators visiting differently shapedflowers (Endress 1999; Galen and Cuba 2001). For ex-ample, the selected flower shapes could cause an increasein the amount of pollen deposited per pollinator visit,perhaps due to a differential arrangement of the flower’ssexual organs (see, e.g., Mayfield et al. 2001; Castellanoset al. 2003; Ivey et al. 2003). If this caused reduced in-breeding and increased seed vigor, then we have a potentialexplanation for the observed relationship between bilateralsymmetry (RW2) and juvenile production (wJ). Corollamorphology plays a critical mechanical role in both out-
This content downloaded from 144.32.128.51 on Mon, 26 Aug 2013 21:24:14 PMAll use subject to JSTOR Terms and Conditions
Natural Selection and the Evolution of Zygomorphy 543
crossing and self-fertilization in Mimulus guttatus (Arathiand Kelly 2004). In the absence of pollinators, the lowerportion of the M. guttatus corolla facilitates autogamy byretaining pollen released from the anthers. When polli-nators are present, the corolla facilitates outcrossing be-fore, during, and after insect visitation (Arathi and Kelly2004). Unfortunately, we lack sufficient data to infer theactual mechanism provoking the fitness benefit of a givenflower shape. Further experimental studies are mandatoryto discern the underlying mechanisms causing the ob-served selection on flower shape and to discover whetherthis selection regime varies depending on the local polli-nator fauna. Pollinator abundance was associated withpetal parallelism (RW1) that was not related to seed orjuvenile production. This finding suggests that flowershape could be related to male fitness in addition to femalefitness. However, no information on male fitness is avail-able for this species.
We also found positive directional selection on flowersize and number, consistent with previous studies (Gomez2003). This selection can be mediated by pollinators, assuggested by the significant relationship between polli-nator abundance and flower number in the structuralequation models (Gross et al. 1998; Gomez 2000; Totland2001). However, this selection can be also a consequenceof the relationship between number of flowers per plantand potential fecundity, without any effect of pollinatorbehavior or visitation rate (Galen 1989, 2000; Herrera1993; Conner and Rush 1996; Gomez 2000; Maad 2000;Thompson 2001). In fact, the selection strength on thesetwo traits, although still significant, decreased when it wasquantified through seedling production (wJ), where thenumber-size trade-off is already expressed (seed number-size phenotypic correlation: , ,r p �0.244 P p .003 n p
plants).141Finally, there was also significant selection for plant size,
although, according to the selection gradient and the SEM,this selection is indirect, mediated by the effect that plantsize has on both flower number and size. The plant traitsproviding this selection for plant size were stalk diameterand, mostly, stalk height, two traits significantly correlatedwith plant size. Plant size was also under selection in thesame population during 2001 and 2002 (Gomez 2003),indicating that selection for this trait is temporally con-sistent. However, in 2003, selection for plant size was in-direct rather than direct, as observed in previous years,even though the main E. mediohispanicum pollinators atthe study site also preferred taller plants and wider stalksin that year. In summary, although estimates of flowershape heritability are not available (experiments are on-going), our results provide strong evidence of significantfitness differences associated with floral shape variation inE. mediohispanicum.
Use of Geometric Morphometrics to Study Floral Evolution
Geometric morphometrics has proved to be very successfulas a tool to analyze the evolution of complex morpho-logical structures (e.g., Klingenberg and Leamy 2001; Ad-ams et al. 2004; Lockwood et al. 2004; Klingenberg andMonteiro 2005 and references therein). Here, we suggestextending the use of this technique to the study of phe-notypic variation and selection for flower shape in naturalpopulations. Nevertheless, we need to be cautious in theuse of geometric morphometric methods to study naturalselection. Geometric morphometrics considers the floweras a single multidimensional character, whereas RWs can-not be considered independent variables with specific bi-ological meanings. According to geometric morphome-trics, shape variables are not biological characters (Adamset al. 2004). In most selection models, it is difficult topredict evolutionary rates from these kinds of complextraits. In this way, the structural equation modeling withlatent variables may successfully (operationally) addressthis problem because it allows the inclusion of latent var-iables, which are nonmeasured multidimensional variables(e.g., floral shape) that are defined by a set of manifestvariables. It would be informative to explore the ability ofstructural equation modeling to cope with multidimen-sional characters such as flower shape. Notwithstandingthe need for caution, this study shows that this approachcan help unravel and accurately explore the adaptive sig-nificance of this multidimensional floral trait. Further in-terdisciplinary studies bridging developmental geneticsand evolutionary ecology are essential for moving beyonddescriptions of flower development to further our knowl-edge concerning flower shape evolution, and the appli-cation of geometric morphometrics can help in this ad-vance.
Acknowledgments
We deeply thank D. C. Adams, J. Bosch, C. P. Klingenberg,and X. Pico for their thorough comments, which greatlyimproved an early version of the manuscript. This workwas supported by grants from the Science and TechnologyMinistry of Spain (MCyT; BOS2003-09045), the Junta deAndalucıa (PAI RNM220 and CVI165), and the Univer-sidad de Granada (Plan Propio).
Literature Cited
Abdi, H. 2003. Partial least square (PLS) regression. Pages 1–7 in M.Lewis-Beck, A. Bryman, and T. Futing, eds. Encyclopedia of socialsciences research methods. Sage, Thousand Oaks, CA.
Adams, D. C. 1999. Methods for shape analysis of landmark datafrom articulated structures. Evolutionary Ecology Research 1:959–970.
Adams, D. C., and M. S. Rosenberg. 1998. Partial warps, phylogeny,
This content downloaded from 144.32.128.51 on Mon, 26 Aug 2013 21:24:14 PMAll use subject to JSTOR Terms and Conditions
544 The American Naturalist
and ontogeny: a comment on Fink and Zelditch (1995). SystematicBiology 47:168–173.
Adams, D. C., F. J. Rohlf, and D. E. Slice. 2004. Geometric mor-phometrics: ten years of progress following the “revolution.” Ital-ian Journal of Zoology 71:5–16.
Arathi, H. S., and J. K. Kelly. 2004. Corolla morphology facilitatesboth autogamy and bumblebee pollination in Mimulus guttatus.International Journal of Plant Sciences 165:1039–1045.
Bookstein, F. L. 1991. Morphometric tools for landmark data. Cam-bridge University Press, Cambridge.
Bradshaw, H. D., Jr., K. G. Otto, B. E. Frewen, J. K. McKay, and D.W. Schemske. 1998. Quantitative trait loci affecting differences infloral morphology between two species of monkeyflower (Mim-ulus). Genetics 149:367–382.
Castellanos, M. C., P. Wilson, and J. D. Thomson. 2003. Pollen trans-fer by hummingbirds and bumblebees, and the divergence of pol-lination modes in Penstemon. Evolution 57:2742–2752.
Coen, E. S., J. M. Nugent, D. Luo, D. Bradley, P. Cubas, M. Chadwick,L. Copsey, and R. Carpenter. 1995. Evolution of floral symmetry.Philosophical Transactions of the Royal Society B: Biological Sci-ences 350:35–38.
Conner, J. K., and S. Rush. 1996. Effects of flower size and numberon pollinator visitation to wild radish, Raphanus raphanistrum.Oecologia (Berlin) 105:509–516.
Cronk, Q. C. B., R. M. Bateman, and J. A. Hawkins. 2002. Devel-opmental genetics and plant evolution. Taylor & Francis, London.
Cubas, P., E. Coen, and J. M. Martınez Zapater. 2001. Ancient asym-metries in the evolution of flowers. Current Biology 11:1050–1052.
Cubas, P. E., C. Vincent, and E. Coen. 1999. An epigenetic mutationresponsible for natural variation in floral symmetry. Nature 401:157–161.
Dilcher, D. 2000. Toward a new synthesis: major evolutionary trendsin the angiosperm fossil record. Proceedings of the National Acad-emy of Sciences of the USA 97:7030–7036.
Donoghue, M. J., R. Ree, and D. A. Baum. 1998. Phylogeny and theevolution of flower symmetry in Asteridae. Trends in Plant Science3:311–317.
Endress, P. K. 1999. Symmetry in flowers: diversity and evolution.International Journal of Plant Science 160(suppl.):S3–S23.
———. 2001. Evolution of floral symmetry. Current Opinion inPlant Biology 4:86–91.
Galen, C. 1989. Measuring pollinator-mediated selection on mor-phometric floral traits: bumblebees and the alpine sky pilot, Pol-emonium viscosum. Evolution 43:882–890.
———. 2000. High and dry: drought stress, sex-allocation trade-offs, and selection on flower size in the alpine wildflower, Pole-monium viscosum (Polemoniaceae). American Naturalist 156:72–83.
Galen, C., and J. Cuba. 2001. Down the tube: pollinators, predators,and the evolution of flower shape in the alpine skypilot, Pol-emonium viscosum. Evolution 55:1963–1971.
Giurfa, M., A. Dafni, and P. R. Neal 1999. Floral symmetry and itsrole in plant-pollinator systems. International Journal of PlantScience 160(suppl.):S41–S50.
Gomez, J. M. 2000. Measurements of phenotypic selection and re-sponse to selection in Lobularia maritima: importance of directand indirect components of natural selection. Journal of Evolu-tionary Biology 13:689–699.
———. 2003. Herbivory reduces the strength of pollinator-mediatedselection in the Mediterranean herb Erysimum mediohispanicum:
consequences for plant specialization. American Naturalist 162:242–256.
———. 2005. Non-additivity effect of herbivores and pollinators onErysimum mediohispanicum (Cruciferae) fitness. Oecologia (Ber-lin) 143:412–418.
Gross, J., B. C. Husband, and S. C. Stewart. 1998. Phenotypic selec-tion in a natural population of Impatiens pallida Nutt. (Balsa-minaceae). Journal of Evolutionary Biology 11:589–609.
Hall, J. C., K. J. Sytsma, and H. H. Iltis. 2002. Phylogeny of Cap-paraceae and Brassicaceae based on chloroplast sequence data.American Journal of Botany 89:1826–1842.
Herrera, C. M. 1993. Selection on floral morphology and environ-mental determinants of fecundity in a hawk moth-pollinated vi-olet. Ecological Monographs 63:251–275.
Hileman, L. C., E. M. Kramer, and D. A. Baum. 2003. Differentialregulation of symmetry genes and the evolution of floral mor-phologies. Proceedings of the National Academy of Sciences of theUSA 100:12814–12819.
Ivey, C. T., P. Martınez, and R. Wyatt. 2003. Variation in pollinatoreffectiveness in swamp milkweed, Asclepias incarnata (Apocyna-ceae). American Journal of Botany 90:214–225.
Klingenberg, C. P., and L. J. Leamy. 2001. Quantitative genetics ofgeometric shape in the mouse mandible. Evolution 55:2342–2352.
Klingenberg, C. P., and L. R. Monteiro. 2005. Distances and directionsin multidimensional shape spaces: implications for morphometricapplications. Systematic Biology 54:678–688.
Lande, R., and S. J. Arnold. 1983. The measurement of selection oncorrelated characters. Evolution 37:1210–1226.
Lockwood, C. A., W. H. Kimbel, and J. M. Lynch. 2004. Morpho-metrics and hominoid phylogeny: support to a chimpanzee-human clade and differentiation among great ape subspecies. Pro-ceedings of the National Academy of Sciences of the USA 101:4356–4360.
Luo, D., R. Carpenter, C. Vincent, L. Copsey, and E. Coen 1995.Origin of floral asymmetry in Antirrhinum. Nature 383:794–799.
Maad, J. 2000. Phenotypic selection in hawkmoth-pollinated Pla-tanthera bifolia: targets and fitness surfaces. Evolution 54:112–123.
Mayfield, M. M., N. M. Waser, and M. V. Price. 2001. Exploring the“most effective pollinator principle” with complex flowers: bum-blebees and Ipomopsis aggregata. Annals of Botany 88:591–596.
Mitchell-Olds, T., I. A. Al-Shehbaz, M. A. Koch, and T. F. Sharbel.2005. Crucifer evolution in the post-genomic era. Pages 119–136in R. J. Henry, ed. Plant diversity and evolution, genotypic andphenotypic variation in higher plants. CAB International, London.
Møller, A. P. 1995. Bumblebee preference for symmetrical flowers.Proceedings of the National Academy of Sciences of the USA 92:2288–2292.
Møller, A. P., and G. Sorci. 1998. Insect preference for symmetricalartificial flowers. Oecologia (Berlin) 114:37–42.
Neal, P. R., A. Dafni, and M. Giurfa. 1998. Floral symmetry and itsrole in plant-pollinator systems: terminology, distribution, andhypotheses. Annual Review of Ecology and Systematics 29:345–373.
Olson, M. E. 2003. Ontogenetic origins of floral bilateral symmetryin Moringaceae (Brassicales). American Journal of Botany 90:49–71.
Pugesek, B. H. 2003a. Concepts of structural equation modeling inbiological research. Pages 42–59 in B. H. Pugesek, A. Tomer, andA. von Eye, eds. Structural equation modeling: applications in
This content downloaded from 144.32.128.51 on Mon, 26 Aug 2013 21:24:14 PMAll use subject to JSTOR Terms and Conditions
Natural Selection and the Evolution of Zygomorphy 545
ecological and evolutionary biology. Cambridge University Press,Cambridge.
———. 2003b. Modeling means in latent variable models of naturalselection. Pages 297–311 in B. H. Pugesek, A. Tomer, and A. vonEye, eds. Structural equation modeling: applications in ecologicaland evolutionary biology. Cambridge University Press, Cambridge.
Rawling, J. O., S. G. Pantula, and D. A. Dickey. 1998. Applied re-gression analysis, a research tool. Springer, New York.
Ree, R. H., and M. J. Donoghue. 1999. Inferring rates of change inflower symmetry in Asterid angiosperms. Systematic Biology 48:633–641.
Reeves, P. A., and R. G. Olmstead. 1998. Evolution of novel mor-phological and reproductive traits in a clade containing Antirrhi-num majus (Scrophulariaceae). American Journal of Botany 85:1047–1056.
Rodrıguez, I., A. Gumbert, N. Hempel de Ibarra, J. Kunze, and M.Giurfa. 2004. Symmetry is in the eye of the “beeholder”: innatepreference for bilateral symmetry in flower-naıve bumblebees. Na-turwissenschaften 91:374–377.
Rohlf, F. J. 2000. Statistical power comparisons among alternativemorphometric methods. American Journal of Physical Anthro-pology 111:463–478.
———. 2003. Bias and error in estimates of mean shape in geometricmorphometrics. Journal of Human Evolution 44:665–683.
Rohlf, F. J., and M. Corti. 2000. Use of two-block partial least-squaresto study covariation in shape. Systematic Biology 49:740–753.
Rohlf, F. J., and D. E. Slice. 1990. Extensions of the Procrustes methodfor the optimal superimposition of landmarks. Systematic Zoology39:40–59.
Rohlf, F. J., A. Loy, and M. Corti. 1996. Morphometric analysis ofOld World Talpidae (Mammalia, Insectivora) using partial-warpscores. Systematic Biology 45:344–362.
Roth, V. L. 1993. On three-dimensional morpho-metrics, and on the identification of landmark points. Pages 41–62 in L. F. Marcus, E. Bello, and A. Garcıa-Valdecasas, eds. Con-tributions to morphometrics. Museo de Ciencias Naturales,Madrid.
Rudall, P. J., and R. M. Bateman. 2003. Evolutionary change in flow-
ers and inflorescences: evidence from naturally occurring terata.Trends in Plant Science 8:76–82.
———. 2004. Evolution of zygomorphy in monocot flowers: iterativepatterns and developmental constraints. New Phytologist 162:25–44.
Sargent, R. S. 2004. Floral symmetry affects speciation rates in an-giosperms. Proceedings of the Royal Society B: Biological Sciences271:603–608.
SAS Institute. 2003. JMP 5.1. SAS Institute, Cary, NC.Schemske, D. W., and H. D. Bradshaw. 1999. Pollinator preference
and the evolution of floral traits in monkeyflowers (Mimulus).Proceedings of the National Academy of Sciences of the USA 96:11910–11915.
Shipley, B. 2000. Cause and correlation in biology. Cambridge Uni-versity Press, Cambridge.
Slice, D. 2001. Landmarks aligned by Procrustes analysis do not liein Kendall’s shape space. Systematic Biology 50:141–149.
StatSoft. 2002. STATISTICA for Windows (program manual).StatSoft, Tulsa, OK.
Theißen, G. 2000. Evolutionary developmental genetics of floral sym-metry: the revealing power of Linnaeus’ monstrous flower.BioEssays 22:209–213.
Thompson, J. D. 2001. How do visitation patterns vary among pol-linators in relation to floral display and floral design in a generalistpollination system? Oecologia (Berlin) 126:386–394.
Totland, O. 2001. Environment-dependent pollen limitation and se-lection on floral traits in an alpine species. Ecology 82:2233–2244.
Walker, J. A. 2000. The ability of geometric morphometric methodsto estimate a known covariance matrix. Systematic Biology 49:686–696.
Wolf, J. B., and M. J. Wade. 2001. On the assignment of fitness toparents and offspring: whose fitness is it and when does it matter?Journal of Evolutionary Biology 14:347–356.
Zelditch, M. L., D. L. Swiderski, H. D. Sheets, and W. L. Fink. 2004.Geometric morphometrics for biologists: a primer. Elsevier Aca-demic, San Diego, CA.
Associate Editor: Bradley R. AnholtEditor: Jonathan B. Losos
This content downloaded from 144.32.128.51 on Mon, 26 Aug 2013 21:24:14 PMAll use subject to JSTOR Terms and Conditions